Article

Analysis of Solar Energy Utilization Effect of Air-Based Photovoltaic/Thermal System

1
Department of Architectural Engineering, Kyonggi University, Suwon 16227, Korea
2
Graduate School of Agricultural and Life Sciences, The University of Tokyo, Tokyo 113-8657, Japan
*
Author to whom correspondence should be addressed.
Energies 2021, 14(24), 8586; https://doi.org/10.3390/en14248586
Submission received: 13 November 2021 / Revised: 30 November 2021 / Accepted: 14 December 2021 / Published: 20 December 2021
(This article belongs to the Special Issue Energy Performance, Management and Recovery in Buildings)

Abstract

:
Recently, the use of new and renewable energy sources to reduce carbon dioxide emissions and minimize global warming has attracted attention. Among the different renewable energy sources, solar energy is utilized for energy reduction in buildings because of its ease of use and excellent maintenance and repair. In this study, an air-based photovoltaic/thermal (PVT) system that improves solar energy utilization was developed, and its performance was experimentally compared with that of the existing photovoltaic (PV) system. The PVT system could increase the amount of generated power by decreasing the panel temperature raised by the air passing through the lower part of the panel. Moreover, it was possible to use the high-temperature air collected from the panel for heating or hot-water supply in the building. Based on the experimental results obtained for the PV and PVT panels subjected to the same weather conditions, the power generation efficiency of the PVT panel through which air was passed increased by approximately 10.1% compared to that of the PV panel. In addition, a heat collection efficiency of approximately 46.6% was generated by the temperature increase of the air passing through the PVT panel.

1. Introduction

Recently, interest in the use of new and renewable energy has increased, owing to global warming caused by the utilization of fossil fuels and the dangers of nuclear power generation. In addition, since the United Nations Framework Convention on Climate Change in 1992, efforts to curb the increase in global temperature are in progress. Accordingly, the Intergovernmental Panel on Climate Change proposed reducing carbon dioxide emissions by at least 45% by 2030 compared to 2010 emissions and achieving carbon neutrality by 2050 to limit the increase in the global average temperature to within 1.5 °C by 2100. Countries worldwide have voluntarily presented their greenhouse gas reduction goals since 2016 and developed long-term low greenhouse gas emission development strategies and national greenhouse gas reduction goals (agreed to submit a Nationally Determined Contribution). Many countries are setting their paths toward carbon neutrality by developing strategies suitable for each sector, such as the energy supply and industry, transportation, and building sectors. In particular, efforts are made to minimize greenhouse gas emissions by utilizing new and renewable energy such as solar collector [1], evacuated tube collector [2,3], double slope collector [4], air-based solar system [5,6], application [7,8] and so on. Among the different renewable sources of energy, solar energy is actively investigated because of its abundance, ease of installation, and simple maintenance. Martinopoulos et al. investigated the actual use of solar energy and its effects, and indicated the need for solar energy policy and activation at the national level [9]. In addition, many studies are being conducted to improve building energy performance through the utilization [10] and optimization [11] of a building-integrated photovoltaic system.
Despite the several advantages of solar power generation systems, such as diverse applicability, power generation is possible only during the daytime, and expensive batteries are required to store the remaining power. Consequently, the construction field distribution is delayed. Interest in and research on photovoltaic/thermal (PVT) systems capable of generating electricity using solar light and collecting heat using solar heat simultaneously are increasing [12]. The PVT system controls the decrease in power generation efficiency, owing to the temperature rise of the panel by enabling the flow of the liquid or gas to the back of the solar panel. In addition, it can be used for hot water supply or heating in a building by utilizing a liquid or gas with an increased temperature [13].
Zarei et al. used R600a and R290 refrigerants as replacements of R134a refrigerants to increase the photovoltaic (PV) efficiency and decrease global warming. The temperature of the water passing through the panel increased by approximately 9.14 °C, and the efficiency of the PVT system improved from 66.7% to 75.8% [14]. Nazri et al. evaluated an air-based PVT system and observed that the utilization effect of the maximum solar energy was possible up to 80.3%; moreover, the PVT system exhibited higher potential than the existing PV system [15]. In another study on an air-based PVT system, Ozakin et al. performed simulations and found that the panel surface temperature decreased by approximately 10–15 °C when air passed under the panel; in addition, the efficiency increased by approximately 15%, owing to an increase in wind speed [16]. Wajs et al. decreased the PV surface temperature by up to 6.3 °C by cooling the air between the PV panel and the roof, increasing the power generation and demonstrating the applicability of the target system [17]. Singh et al. reported that the solar heat could be increased by approximately 1.4 times because of the parallel configuration of the PVT system, and it was more effective than the serial configuration in economic terms [18]. In the study conducted by Abdullah et al., the panel surface temperature decreased by approximately 5–9 °C compared to the conventional PV in a liquid PVT system, increasing the power generation efficiency [19]. Vittorini et al. improved the power generation efficiency by approximately 33% compared to the existing PV by supplying 2 L cooling water per minute [20]. Sakellariou et al. developed a method for applying the PVT system and demonstrated the possibility of using it as thermal energy while increasing the power generation efficiency, owing to the liquid passage. In addition, the higher the inlet temperature of the PVT, the lower the power generation efficiency, and the amount of power generated significantly changed with the inclination of the PVT panel [21]. Brottier et al. analyzed the thermal performance of domestic hot-water facilities using 28 PVTs in Western Europe. The PVT system was more effective than the PV system for preheating domestic hot water, and there was less risk of overheating based on the highest temperature [22].
In addition, several studies on the application of the PVT system for minimizing energy consumption in buildings have been conducted. Hengel et al. reviewed a method for increasing the system efficiency by linking the PVT system and the heat pump, but further research on the appropriate point to achieve the break-even point was recommended for reasons such as high initial investment costs [23]. AlbaRamos et al. concluded that the system performance could be improved by combining a liquid PVT system and a heat pump, reducing the power consumed for cooling [24]. Calise et al. reviewed methods for maximizing the utilization of the PVT system through simulations. They reported that the summer utilization plan by solar heating and cooling and the relationship with the domestic hot water demand should be reviewed [25]. Fayaz et al. reviewed the use of a phase change material (PCM) in PVT systems and concluded that the cooling effect increased, owing to the application of the PCM; consequently, the power generation efficiency increased [26]. Reddy Penaka et al. reviewed measures to evaluate the economic feasibility of applying PVT based on country-specific climatic conditions, energy consumption and energy cost [27].
As described above, studies on the applicability of the PVT system and utilization methods have been conducted. However, the performance comparison through experiments on PV and PVT under the same conditions and the applicability of the air-based PVT system have not been investigated extensively. Therefore, in this study, the performances of PV and air-based PVT systems exposed to the same weather conditions were measured, and the results were compared to review the utilization plan of the air-based PVT system.

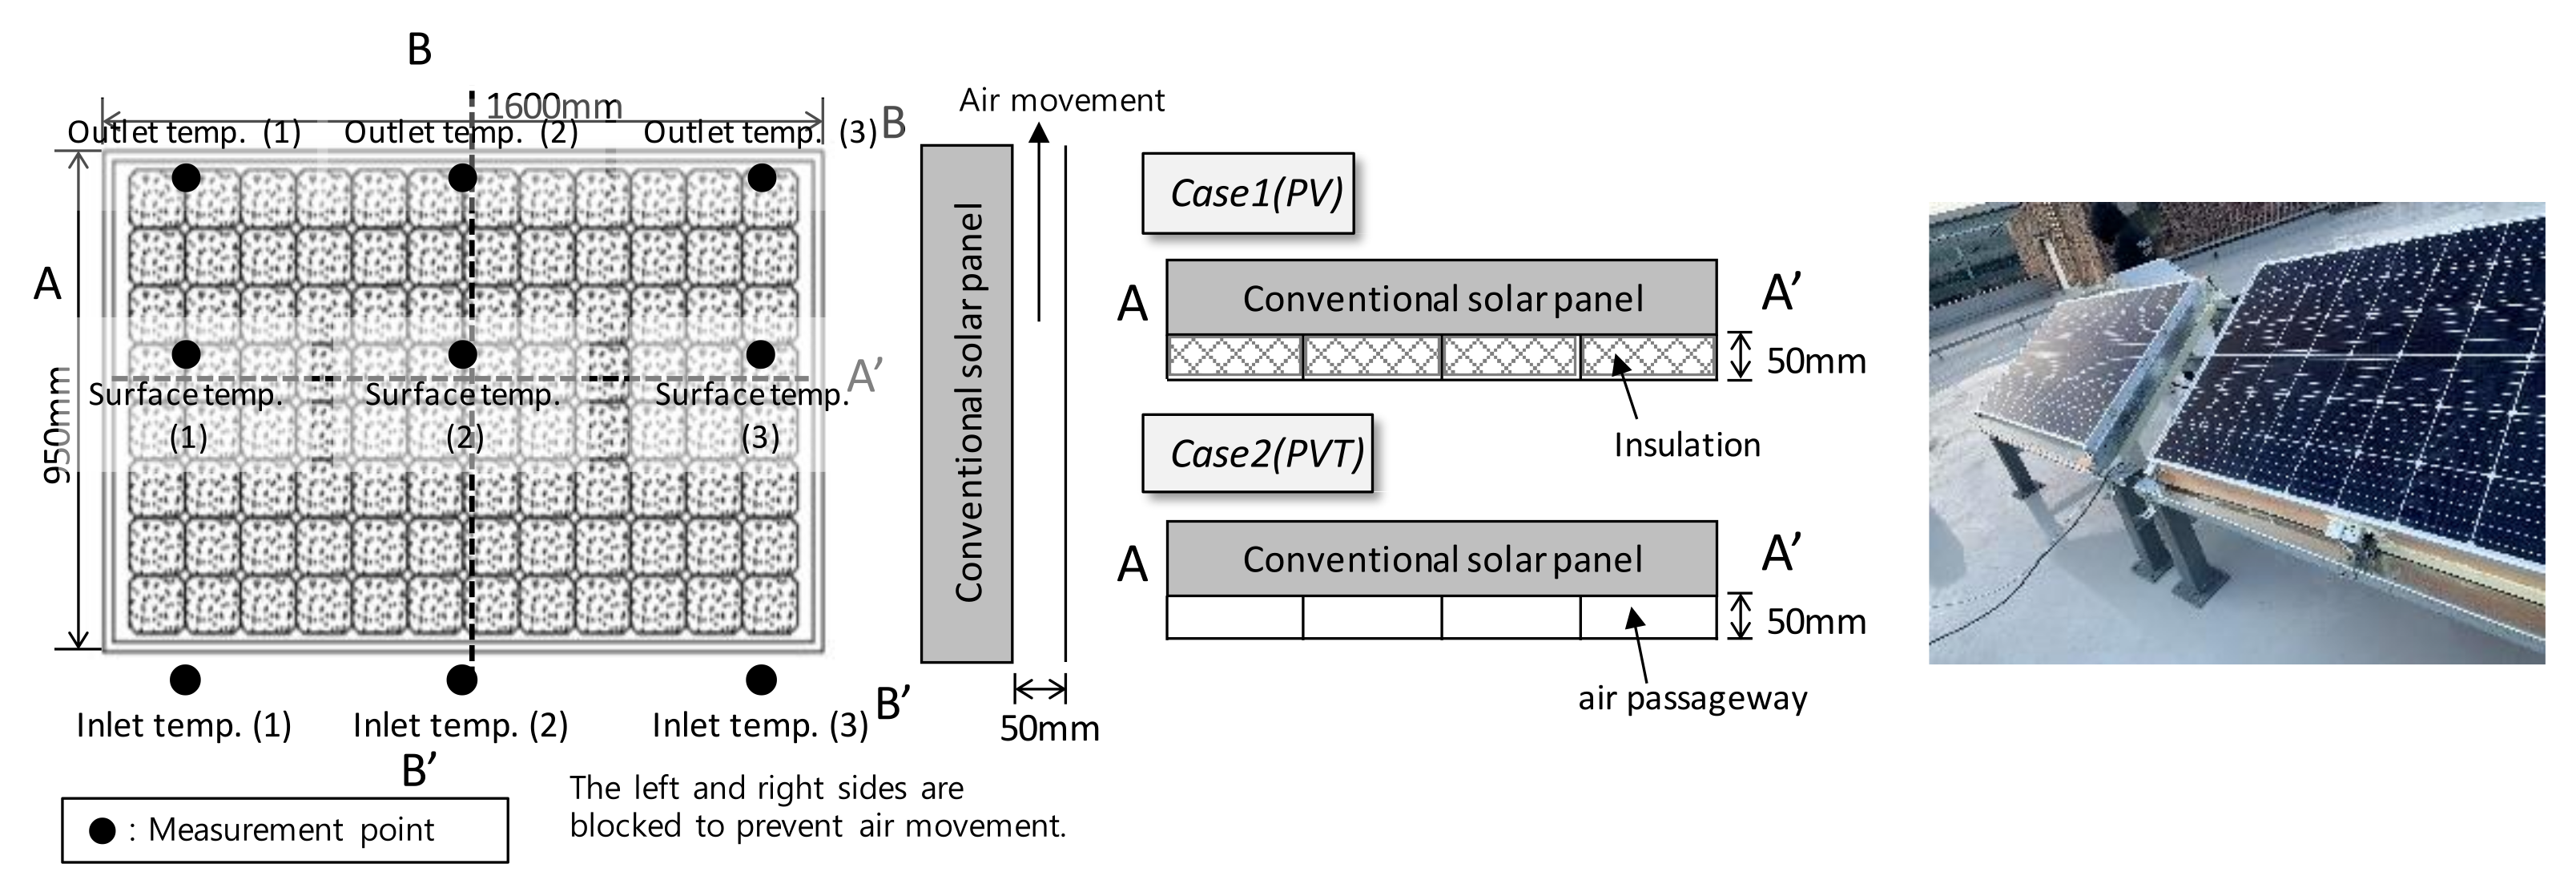
2. Materials and Methods

Measurements were performed on the rooftop of 7 lecture buildings in Kyonggi University (latitude: 37.30°, longitude: 127.04°) in Suwon-si, Gyeonggi-do, Korea. In the case of PV panels, since they are generally installed directly on the roof surface, it is assumed that the insulation of the roof surface is in direct contact with the panel, so that there is no air layer under the panel. In addition, in order to reproduce the fact that heat cannot be discharged to the lower part of the panel due to the insulation installed on the roof surface, an insulation panel was installed in the bottom part of the panel in the experiment. In the case of the PVT panel, the air was passed through the lower part of the existing PV panel (4 passages of 400 × 50 mm), and an increase in power was generated with decreasing temperature of the solar panel. The heat collection effect caused by the increased air temperature passing through the PV panel was evaluated. The changes in temperature and power generation under the same conditions were compared by installing the existing PV panel and the PVT panel (the subject of this study) side by side. The target panel faced southward and was installed at an angle of 30°. In addition, in order to measure the amount of insolation reaching the panel, a pyrometer was installed on the same 30° inclined surface as the panel. All the target panels had the same area of 1.52 m2 (1600 × 950 mm). A conceptual diagram of the panel used for the experiments is shown in Figure 1. The panel inlet temperature, upper and lower surface temperatures, and panel outlet temperature were measured to assess the temperature change of the upper and lower parts of the panel caused by air passing through the lower part of the panel. The solar irradiance, current, and voltage were measured to compare the generated power and power generation efficiency. The current-voltage (I-V) curves of the target PV panel, which present the possible combinations of current and voltage output of a photovoltaic panel, are shown in Figure 2. The maximum voltage during measurement was 35.8V. Therefore, as shown in Figure 2, the current value during power generation does not change significantly, and it is judged that a relatively stable result can be obtained in this experiment. The measurement instruments and items used in this study are listed in Table 1 and Table 2, respectively. The measurements were performed in 1 s intervals, and the average results for 10 min were determined, considering the fluctuations attributed to external conditions.

3. Measurement Results

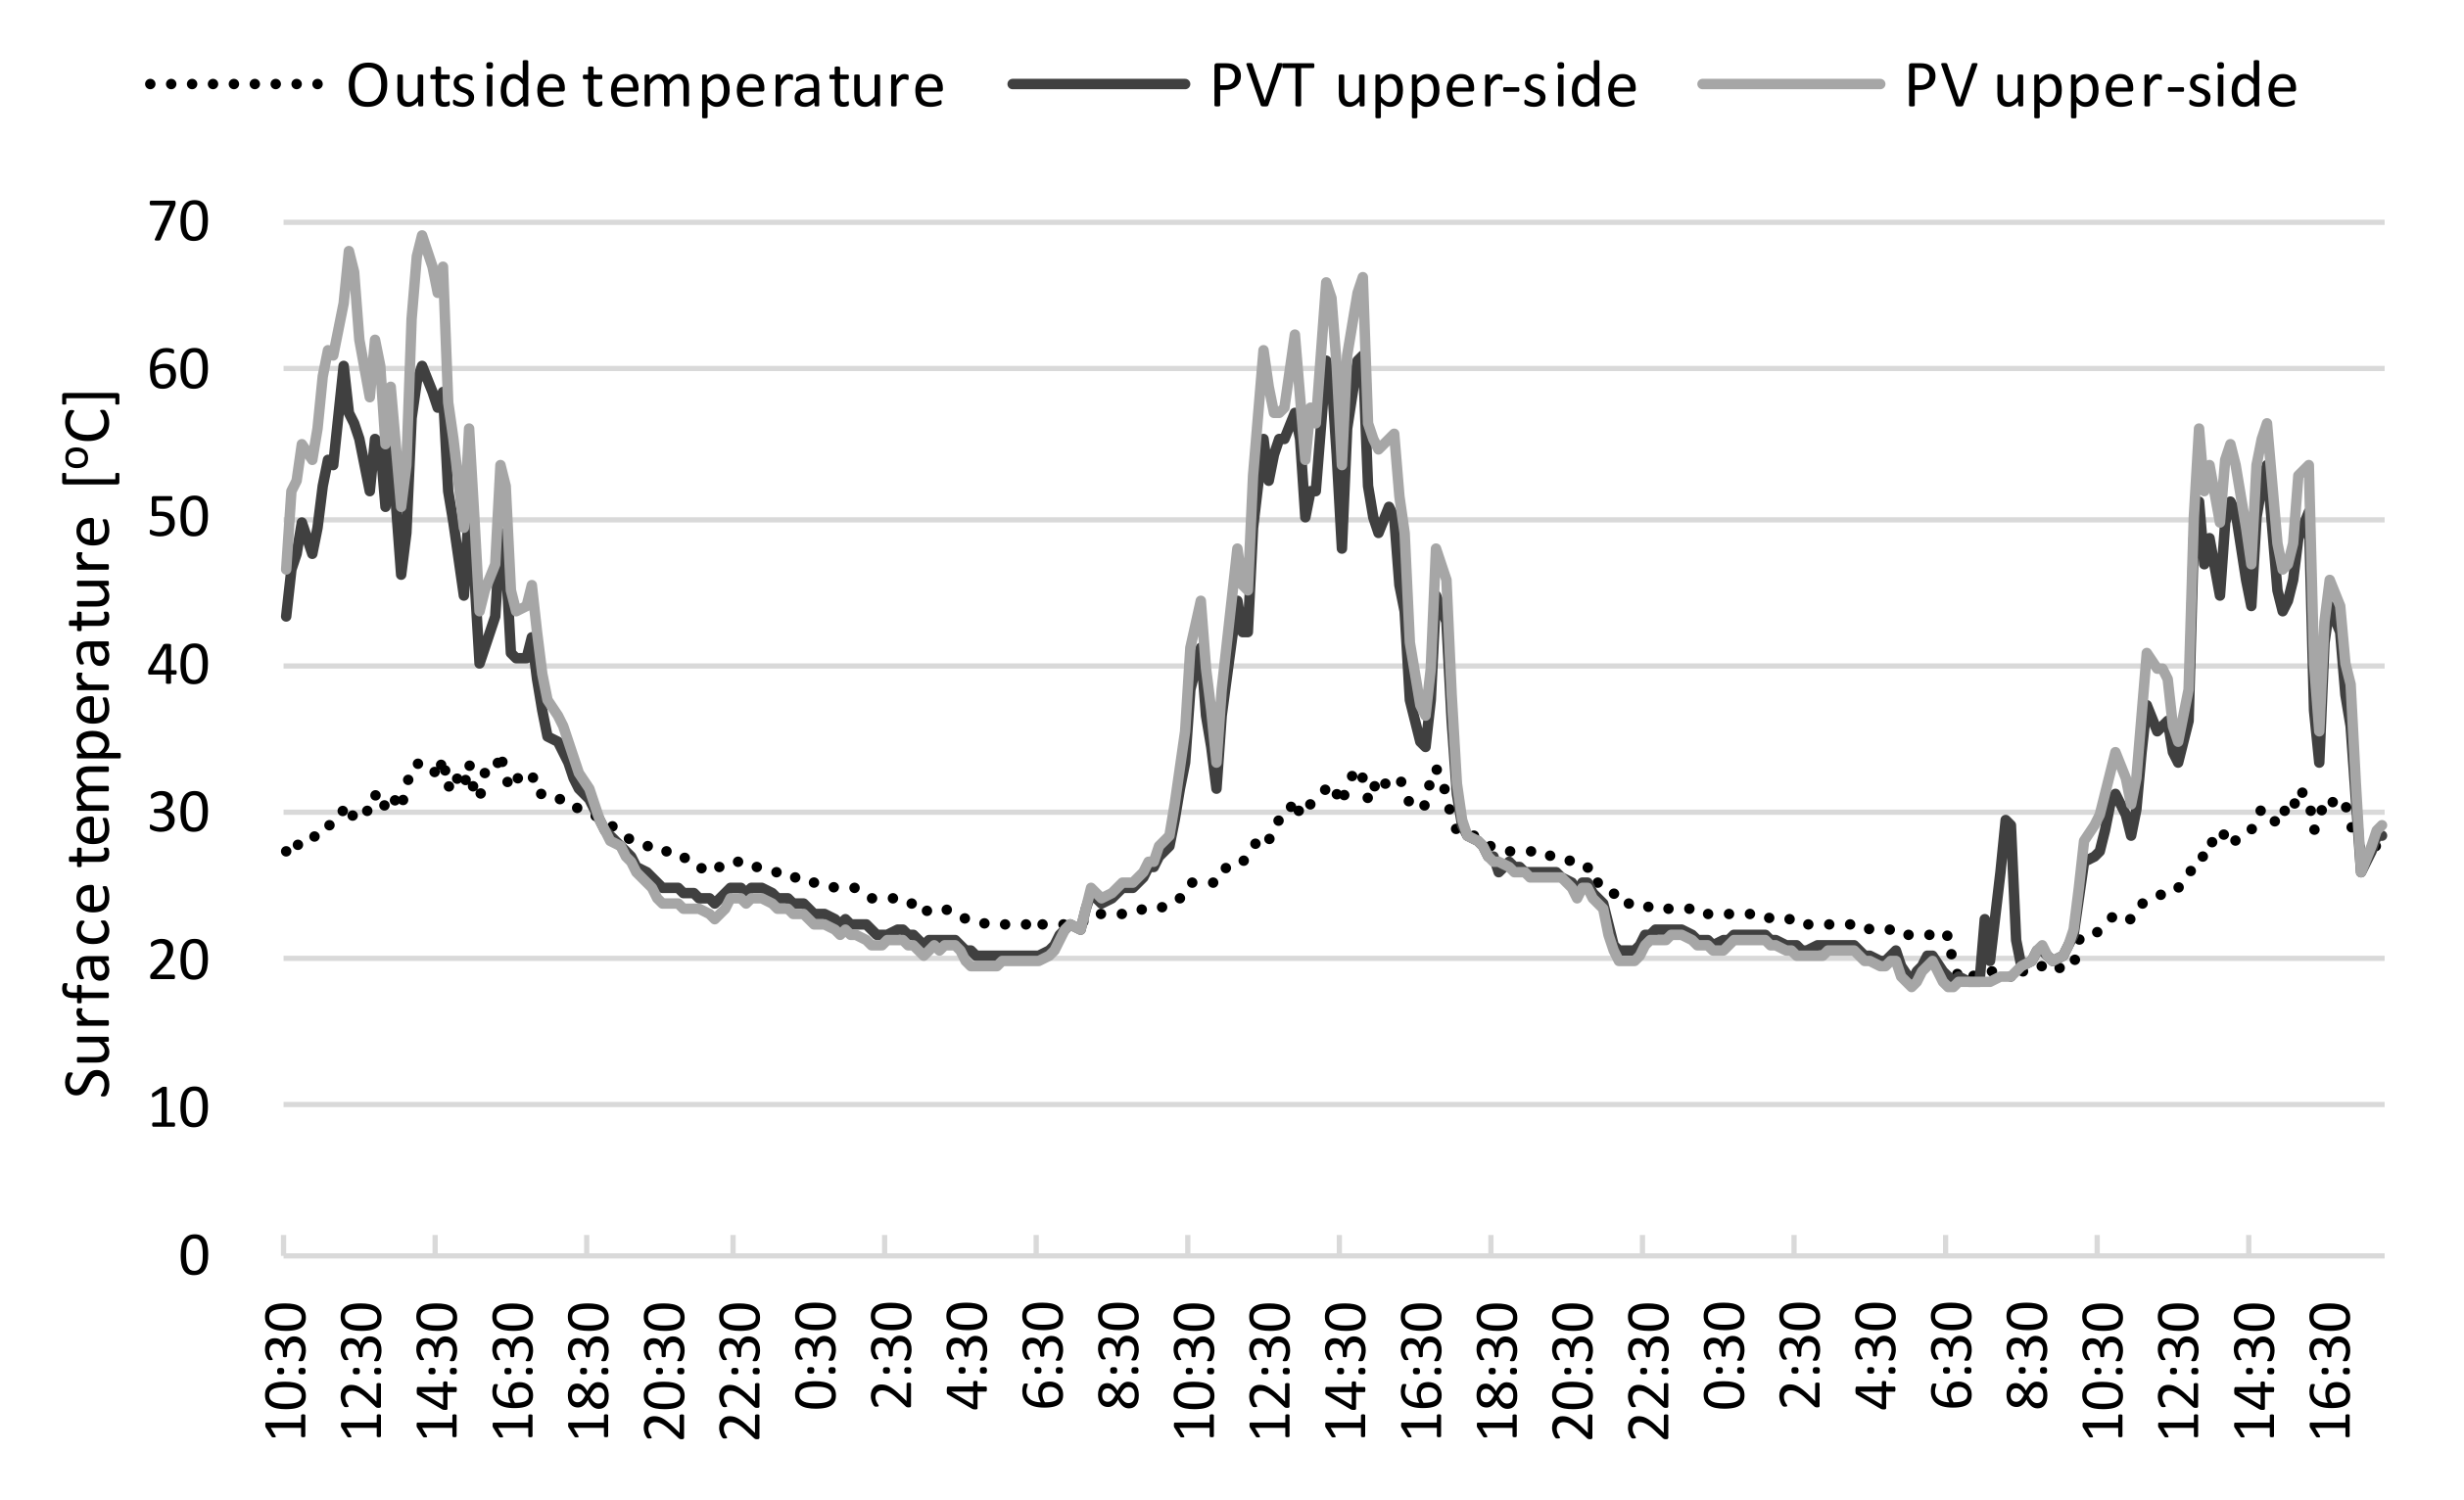
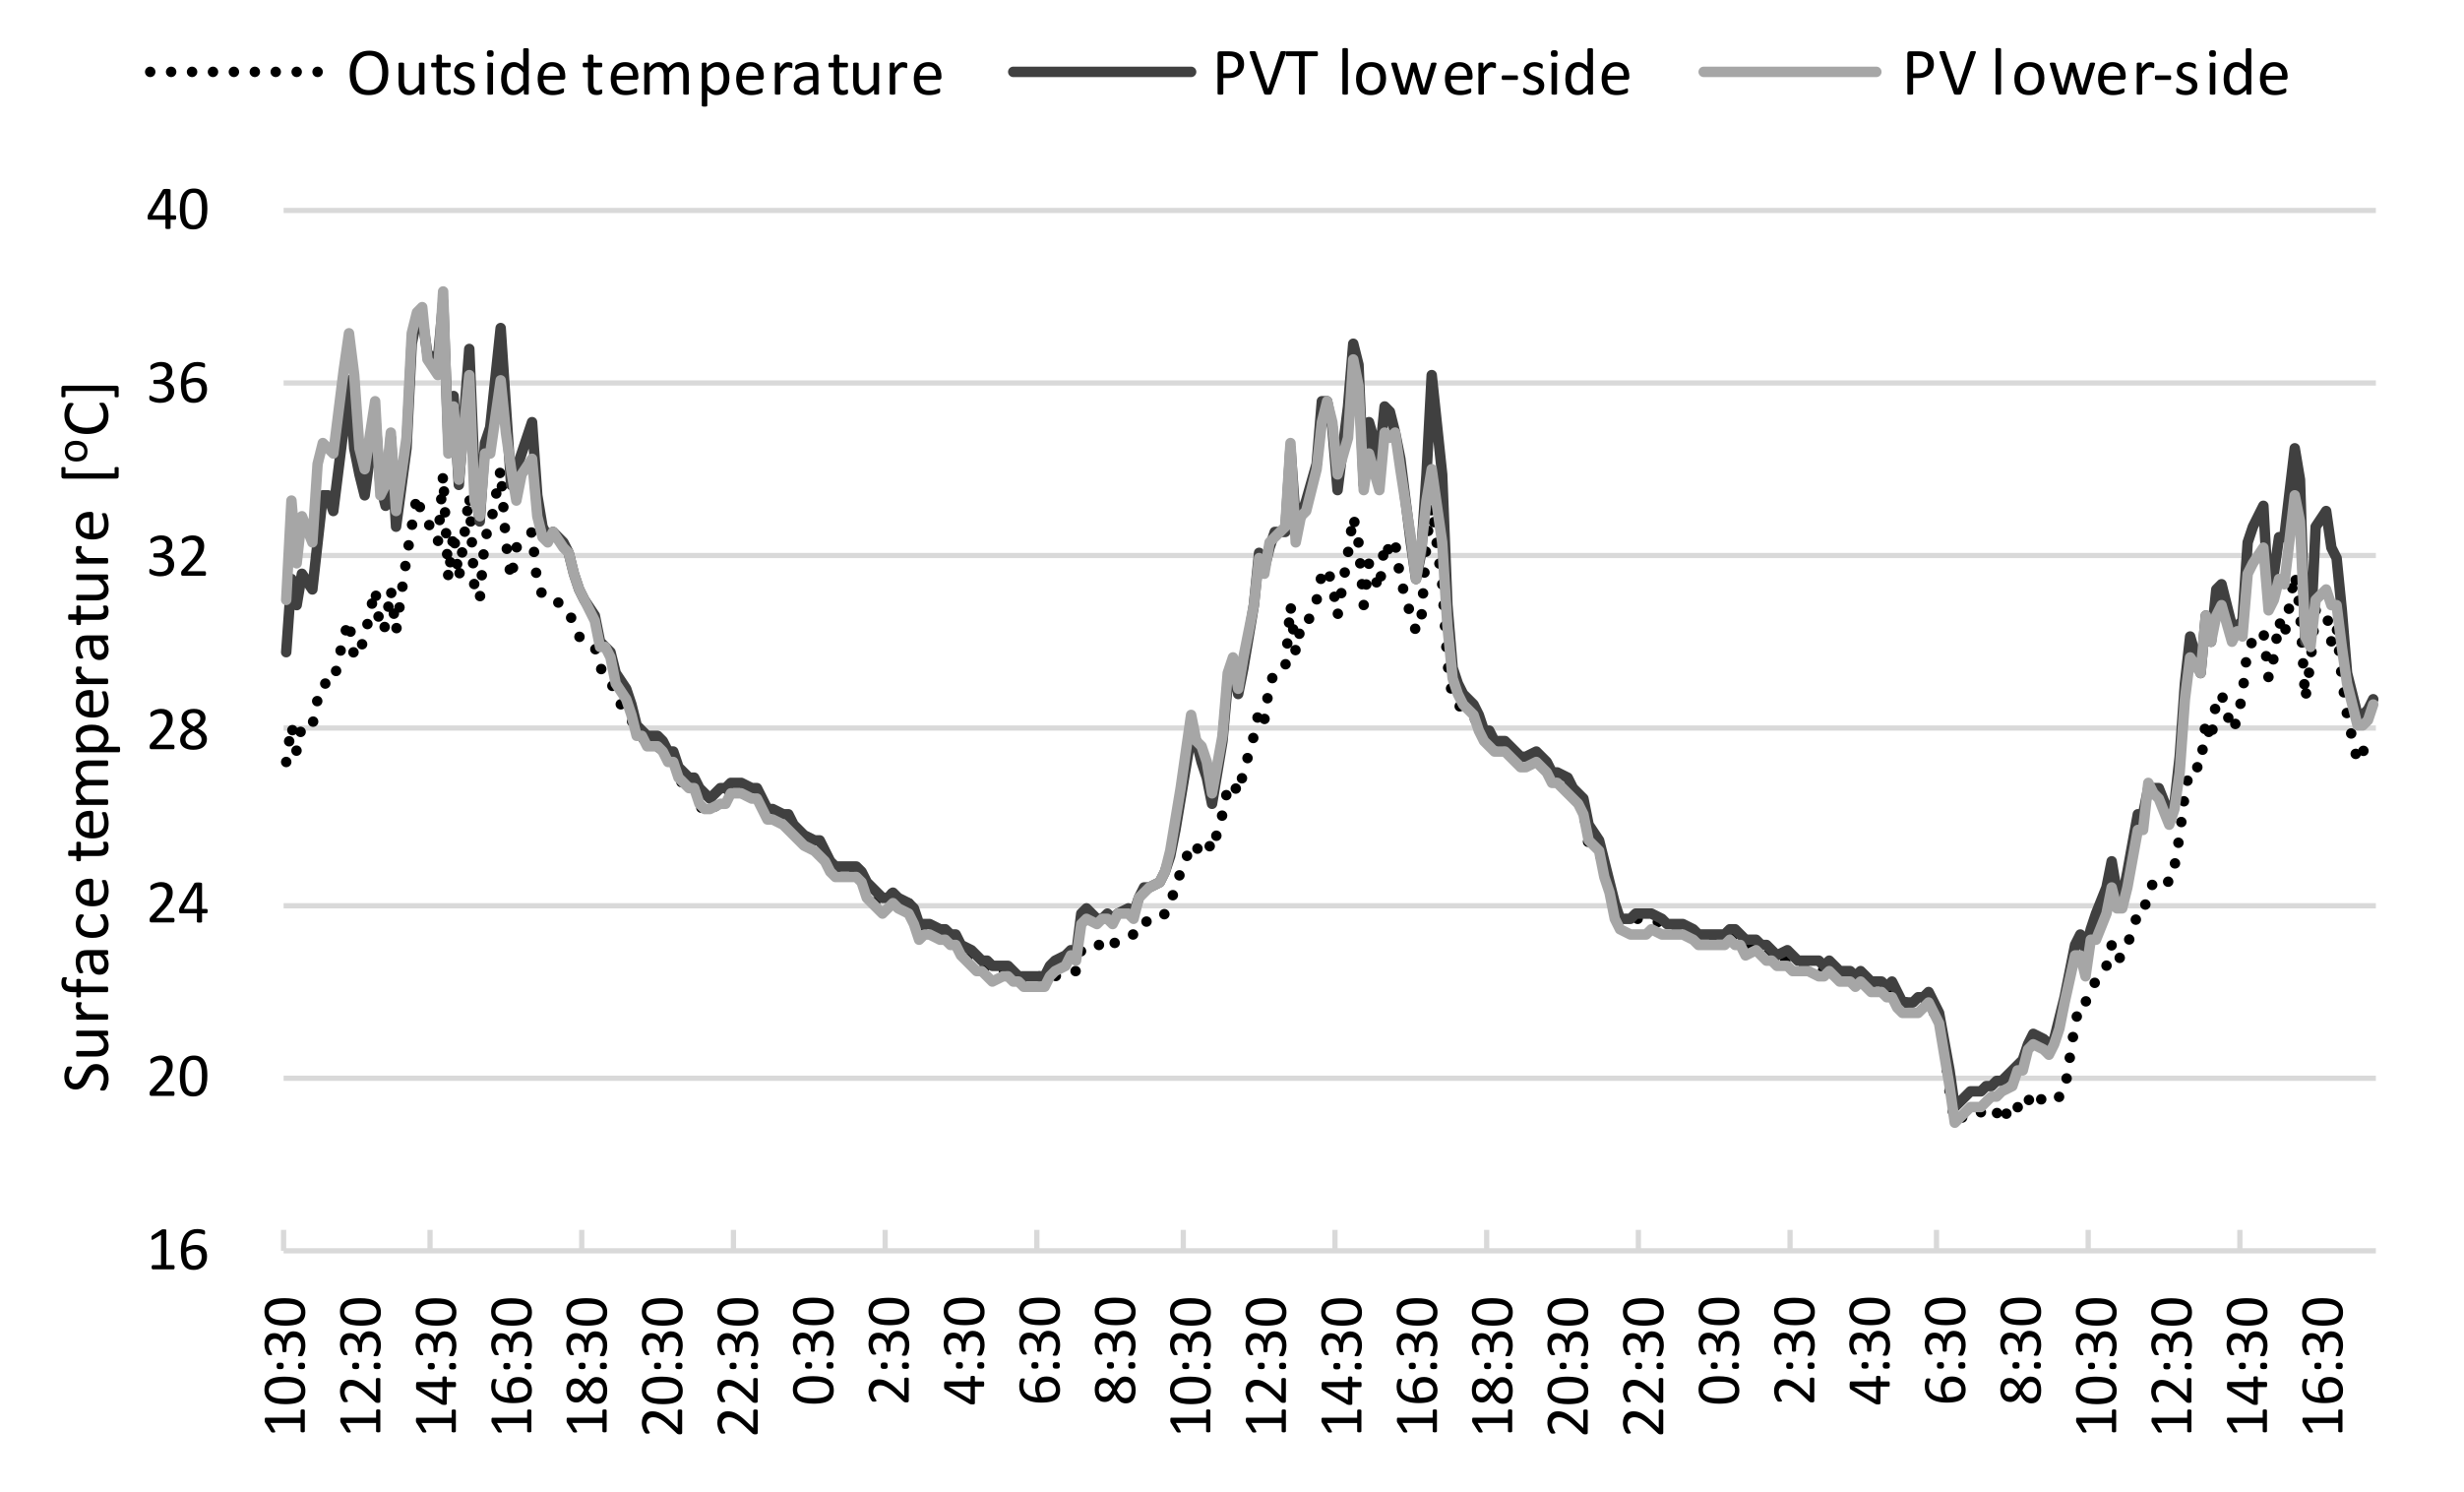
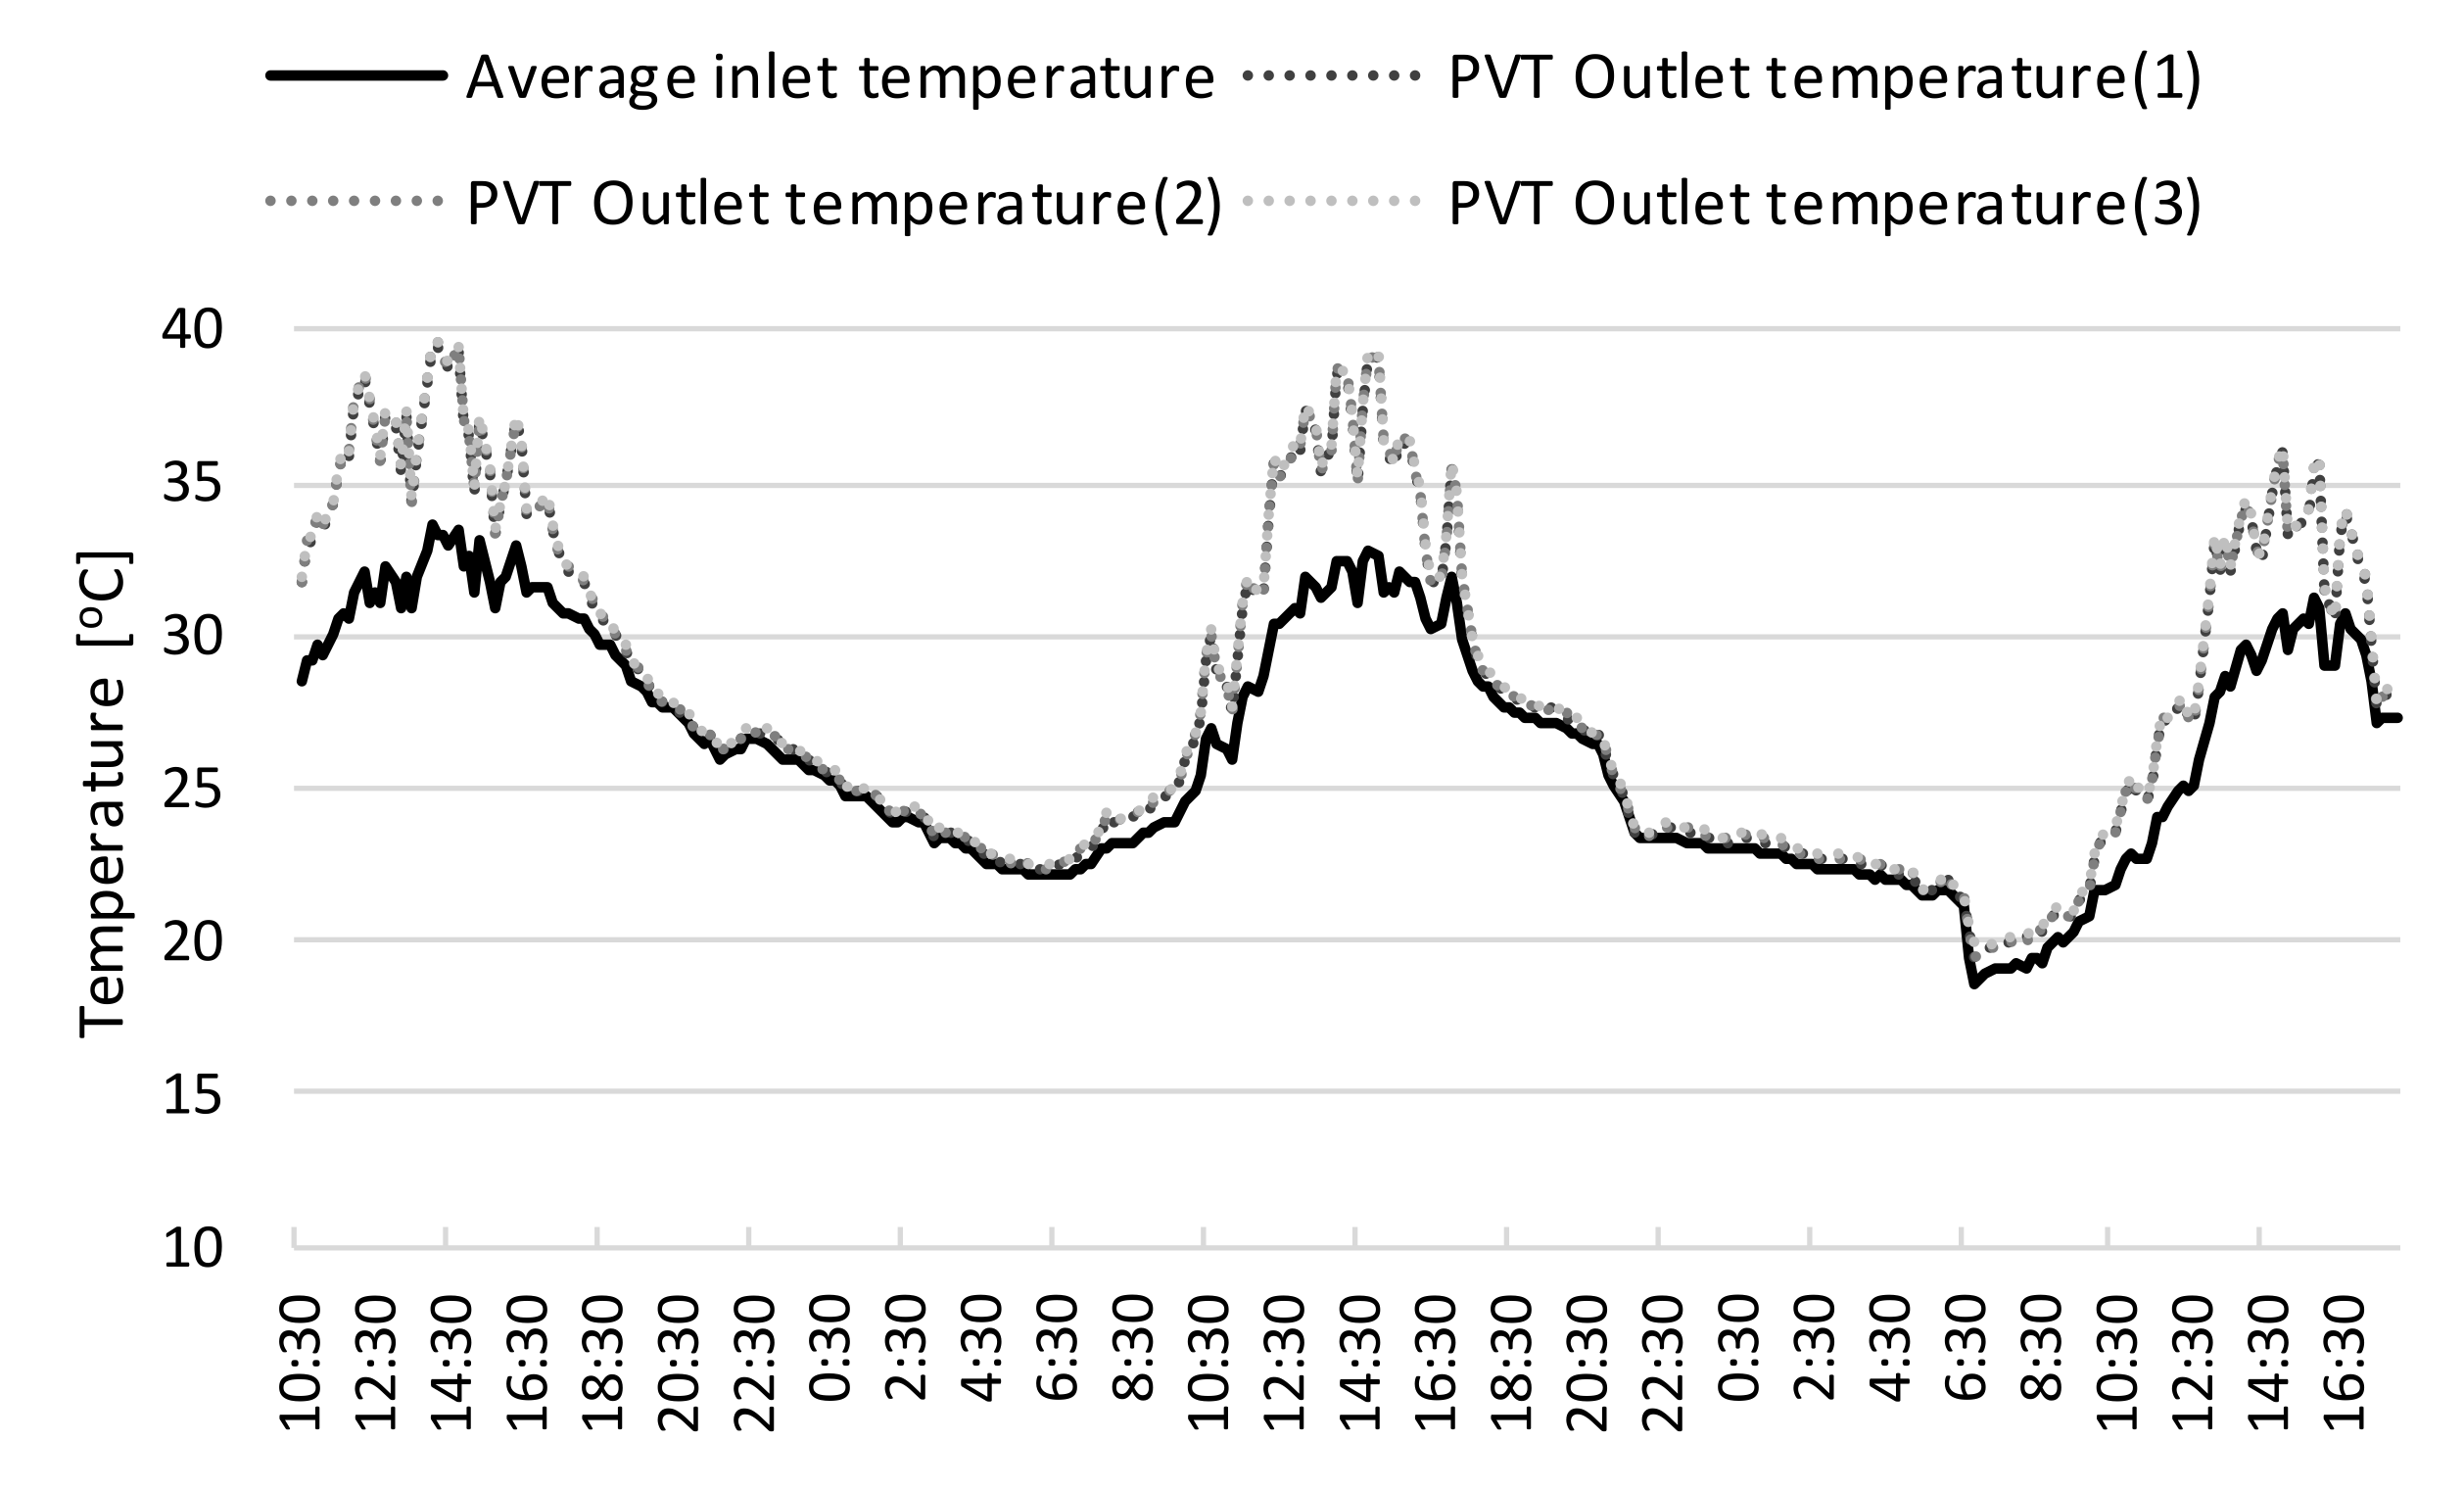
3.1. Comparison of Temperature Results

The tests were conducted for three days, 16–18 August 2021. The insolation of the panel slope for the three days were 4743, 5066, and 4020 Wh on the first, second, and third days, respectively, with an average of approximately 4610 Wh. The minimum and maximum outdoor temperatures were 18.8 and 35.5 °C, respectively. Figure 3 shows the insolation and outdoor temperature during the target period. The inlet temperature of the PVT panel was at most 2.2 °C higher than the outside temperature, and the average for the heat collection period was 0.7 °C higher. This difference was attributed to the radiant heat generated by the temperature rise of the panel, and no significant difference with the outside temperature was observed. Figure 4 shows the inlet temperature (three points) of the PVT panel. The measurement point of the inlet temperature was set to check whether the temperature difference between the center and both ends of the panel occurred due to the influence of airflow. The average temperature of the three points according to the inlet location showed the same temperature distribution as 26.5 °C at the point (1), 26.2 °C at the point (2), and 26.2 °C at the point (3). Therefore, it was found that the temperature difference due to the external influence and airflow according to the inlet location was not large. In this study, assuming that the horizontal temperature distribution and airflow inside the panel are constant, the panel performance is compared and reviewed by the simple average of the measurement point values. In addition, the inlet temperature is about 0.1 to 0.4 °C higher than the outside air temperature of 26.1 °C, so it is judged that the outside air directly flows into the panel.
For the PVT panel, which allowed air to pass through its lower part, the temperature at the top of the panel decreased by up to 10.7 °C compared to that of the conventional PV, and the average temperature decreased by approximately 3.0 °C within the period (Figure 5). For the lower part of the panel (Figure 6), the temperature variation was relatively insignificant, with a maximum temperature decrease of 1.8 °C and an average of 0.5 °C.
The temperature of the air passing through the PVT panel increased via heat exchange with the panel, whose temperature was increased by solar radiation. The air passing through the panel overheated by solar radiation had a maximum temperature increase of 6.7 °C and an average temperature increase of 3.3 °C (Figure 7). This increase in air temperature was highly correlated with insolation. As the amount of insolation increased, the exit temperature increased significantly (Figure 8). These results can be used for designing a PVT suitable for the target building.
Figure 9 shows the heat collecting effect caused by an increase in the air temperature passing through the target PVT panel. The air volume generated by the fan used in this experiment was 4.10 m3/min (diameter of 9 cm, average wind speed of 10.74 m/s). The amount of collected heat was calculated by the temperature difference between the inlet and outlet of the panel, the air volume, and the specific heat of the air. The maximum amount of collected heat was 645.3 W, and the average amount of collected heat was 261.1 W for the heat collection period. By passing air through the lower part of the PV panel, it is possible to not only increase the power generation amount attributed to decreased surface temperature but also collect significant thermal energy.

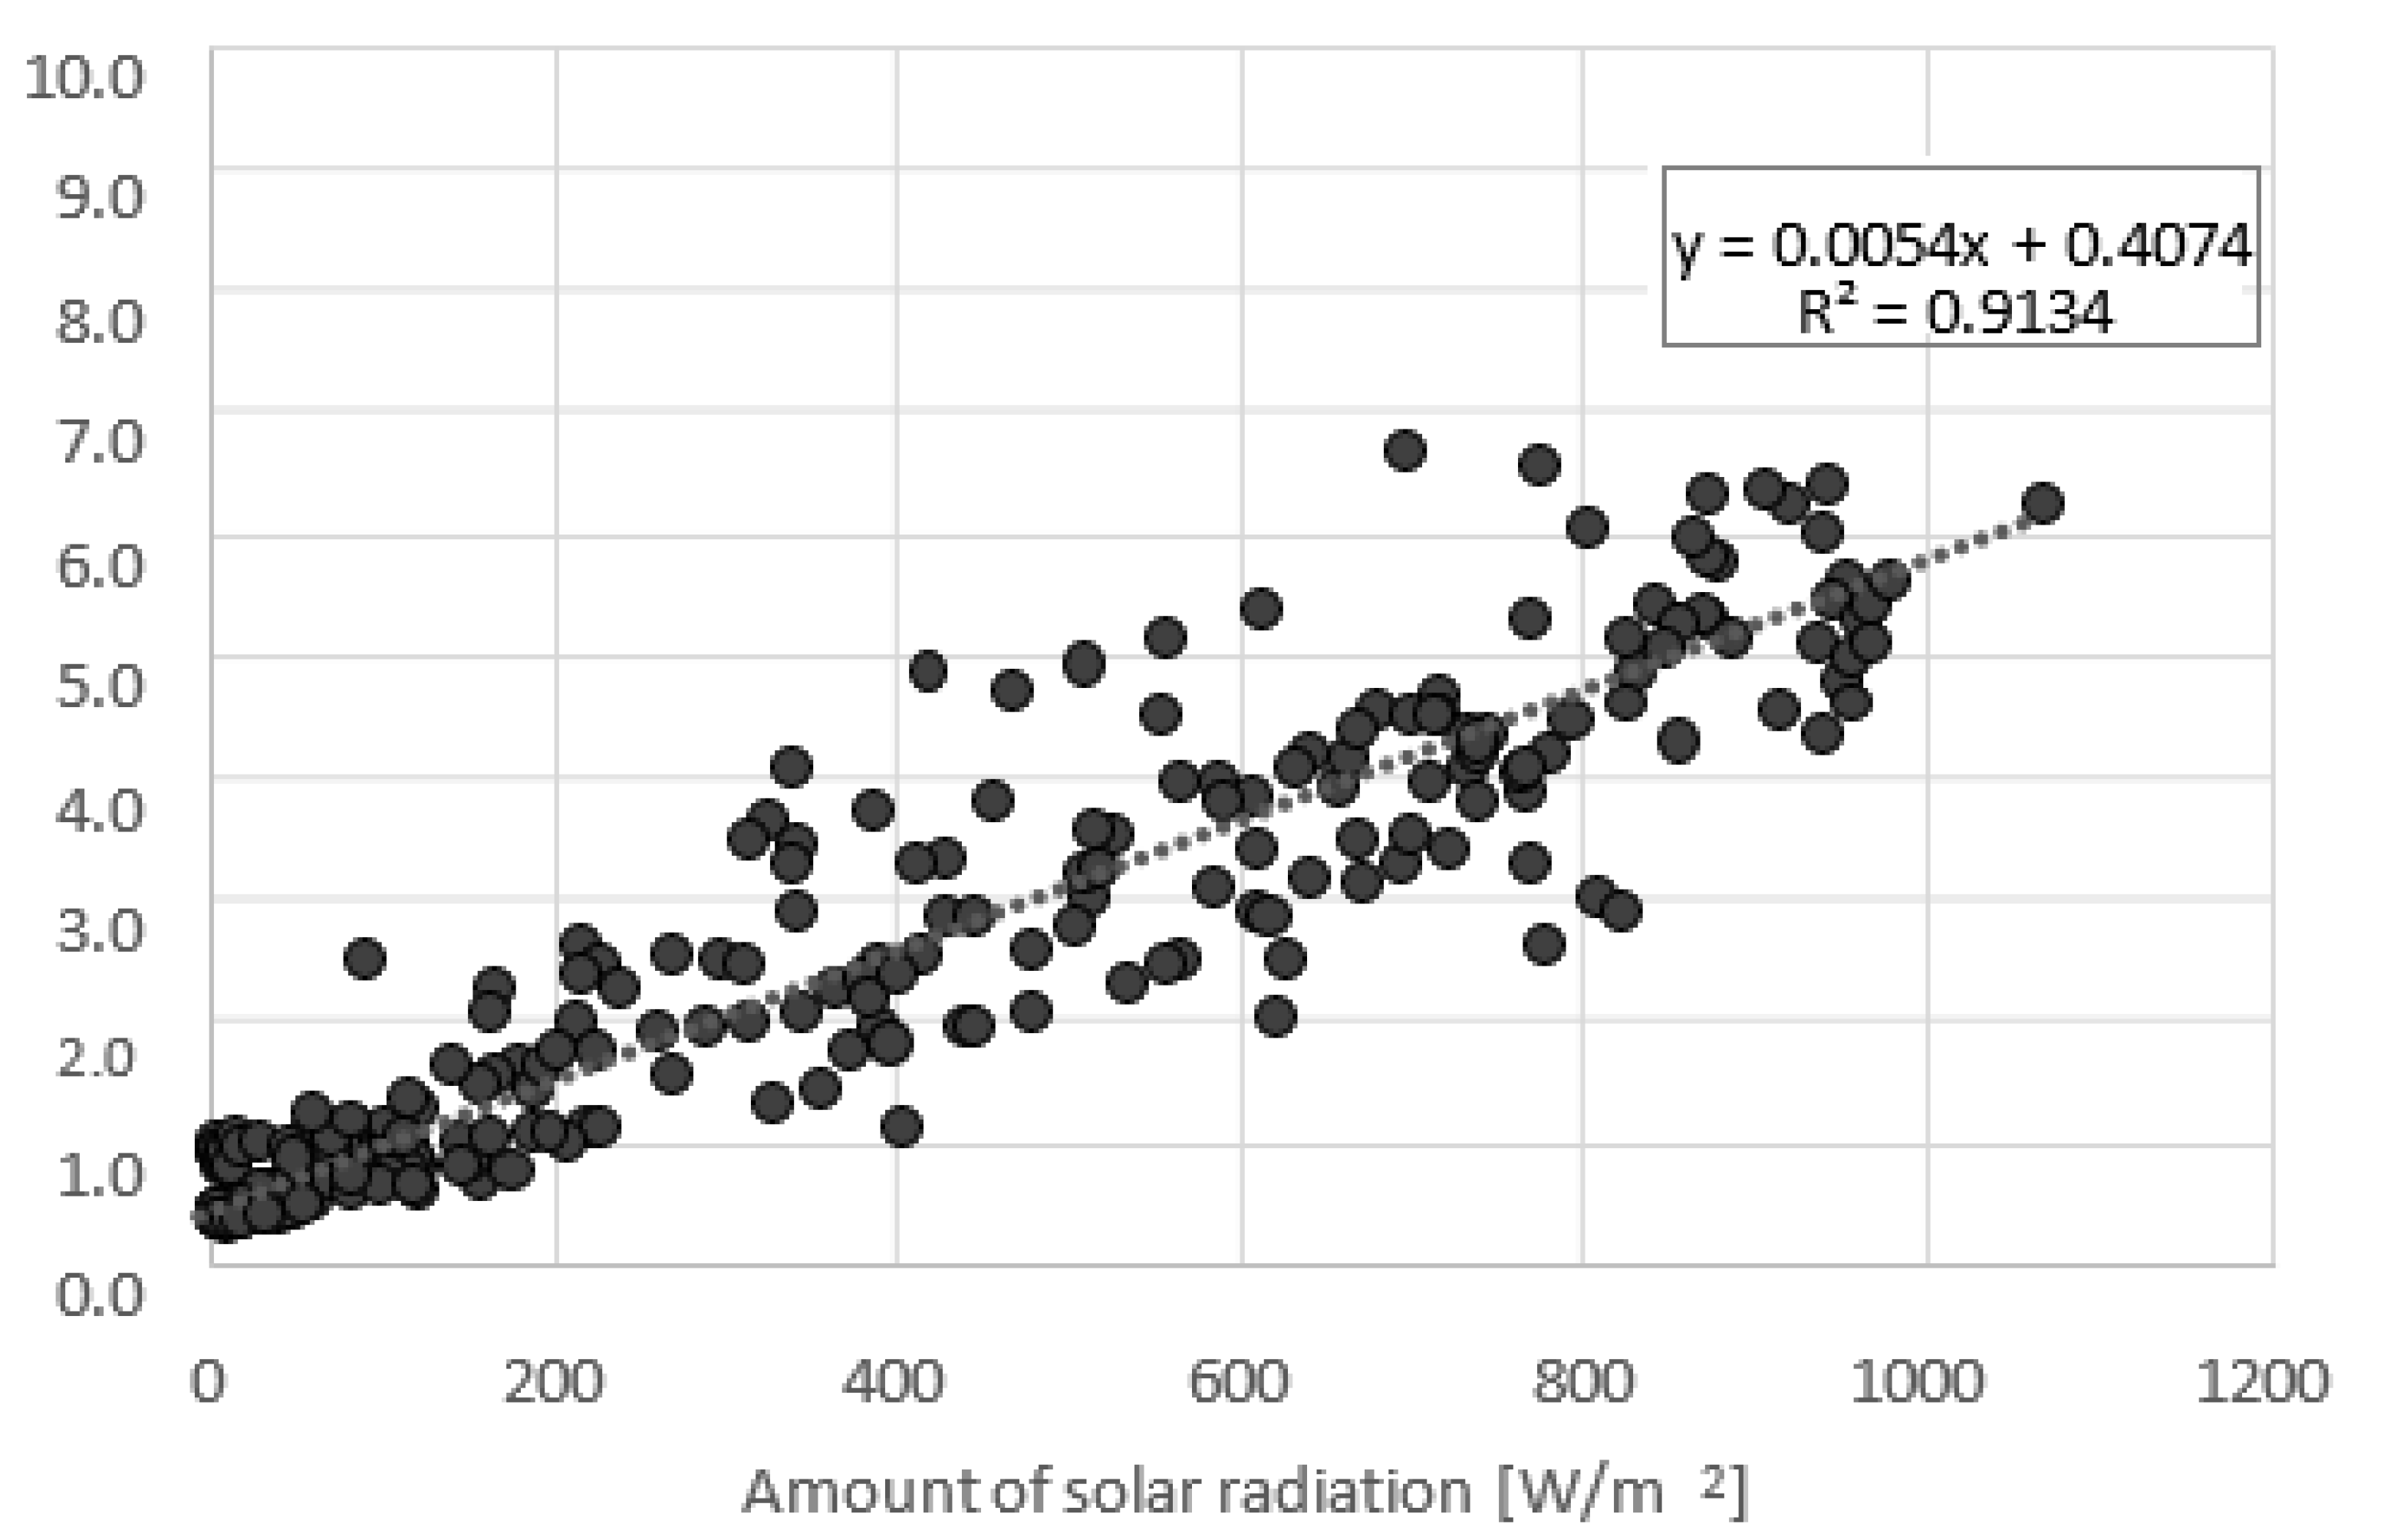
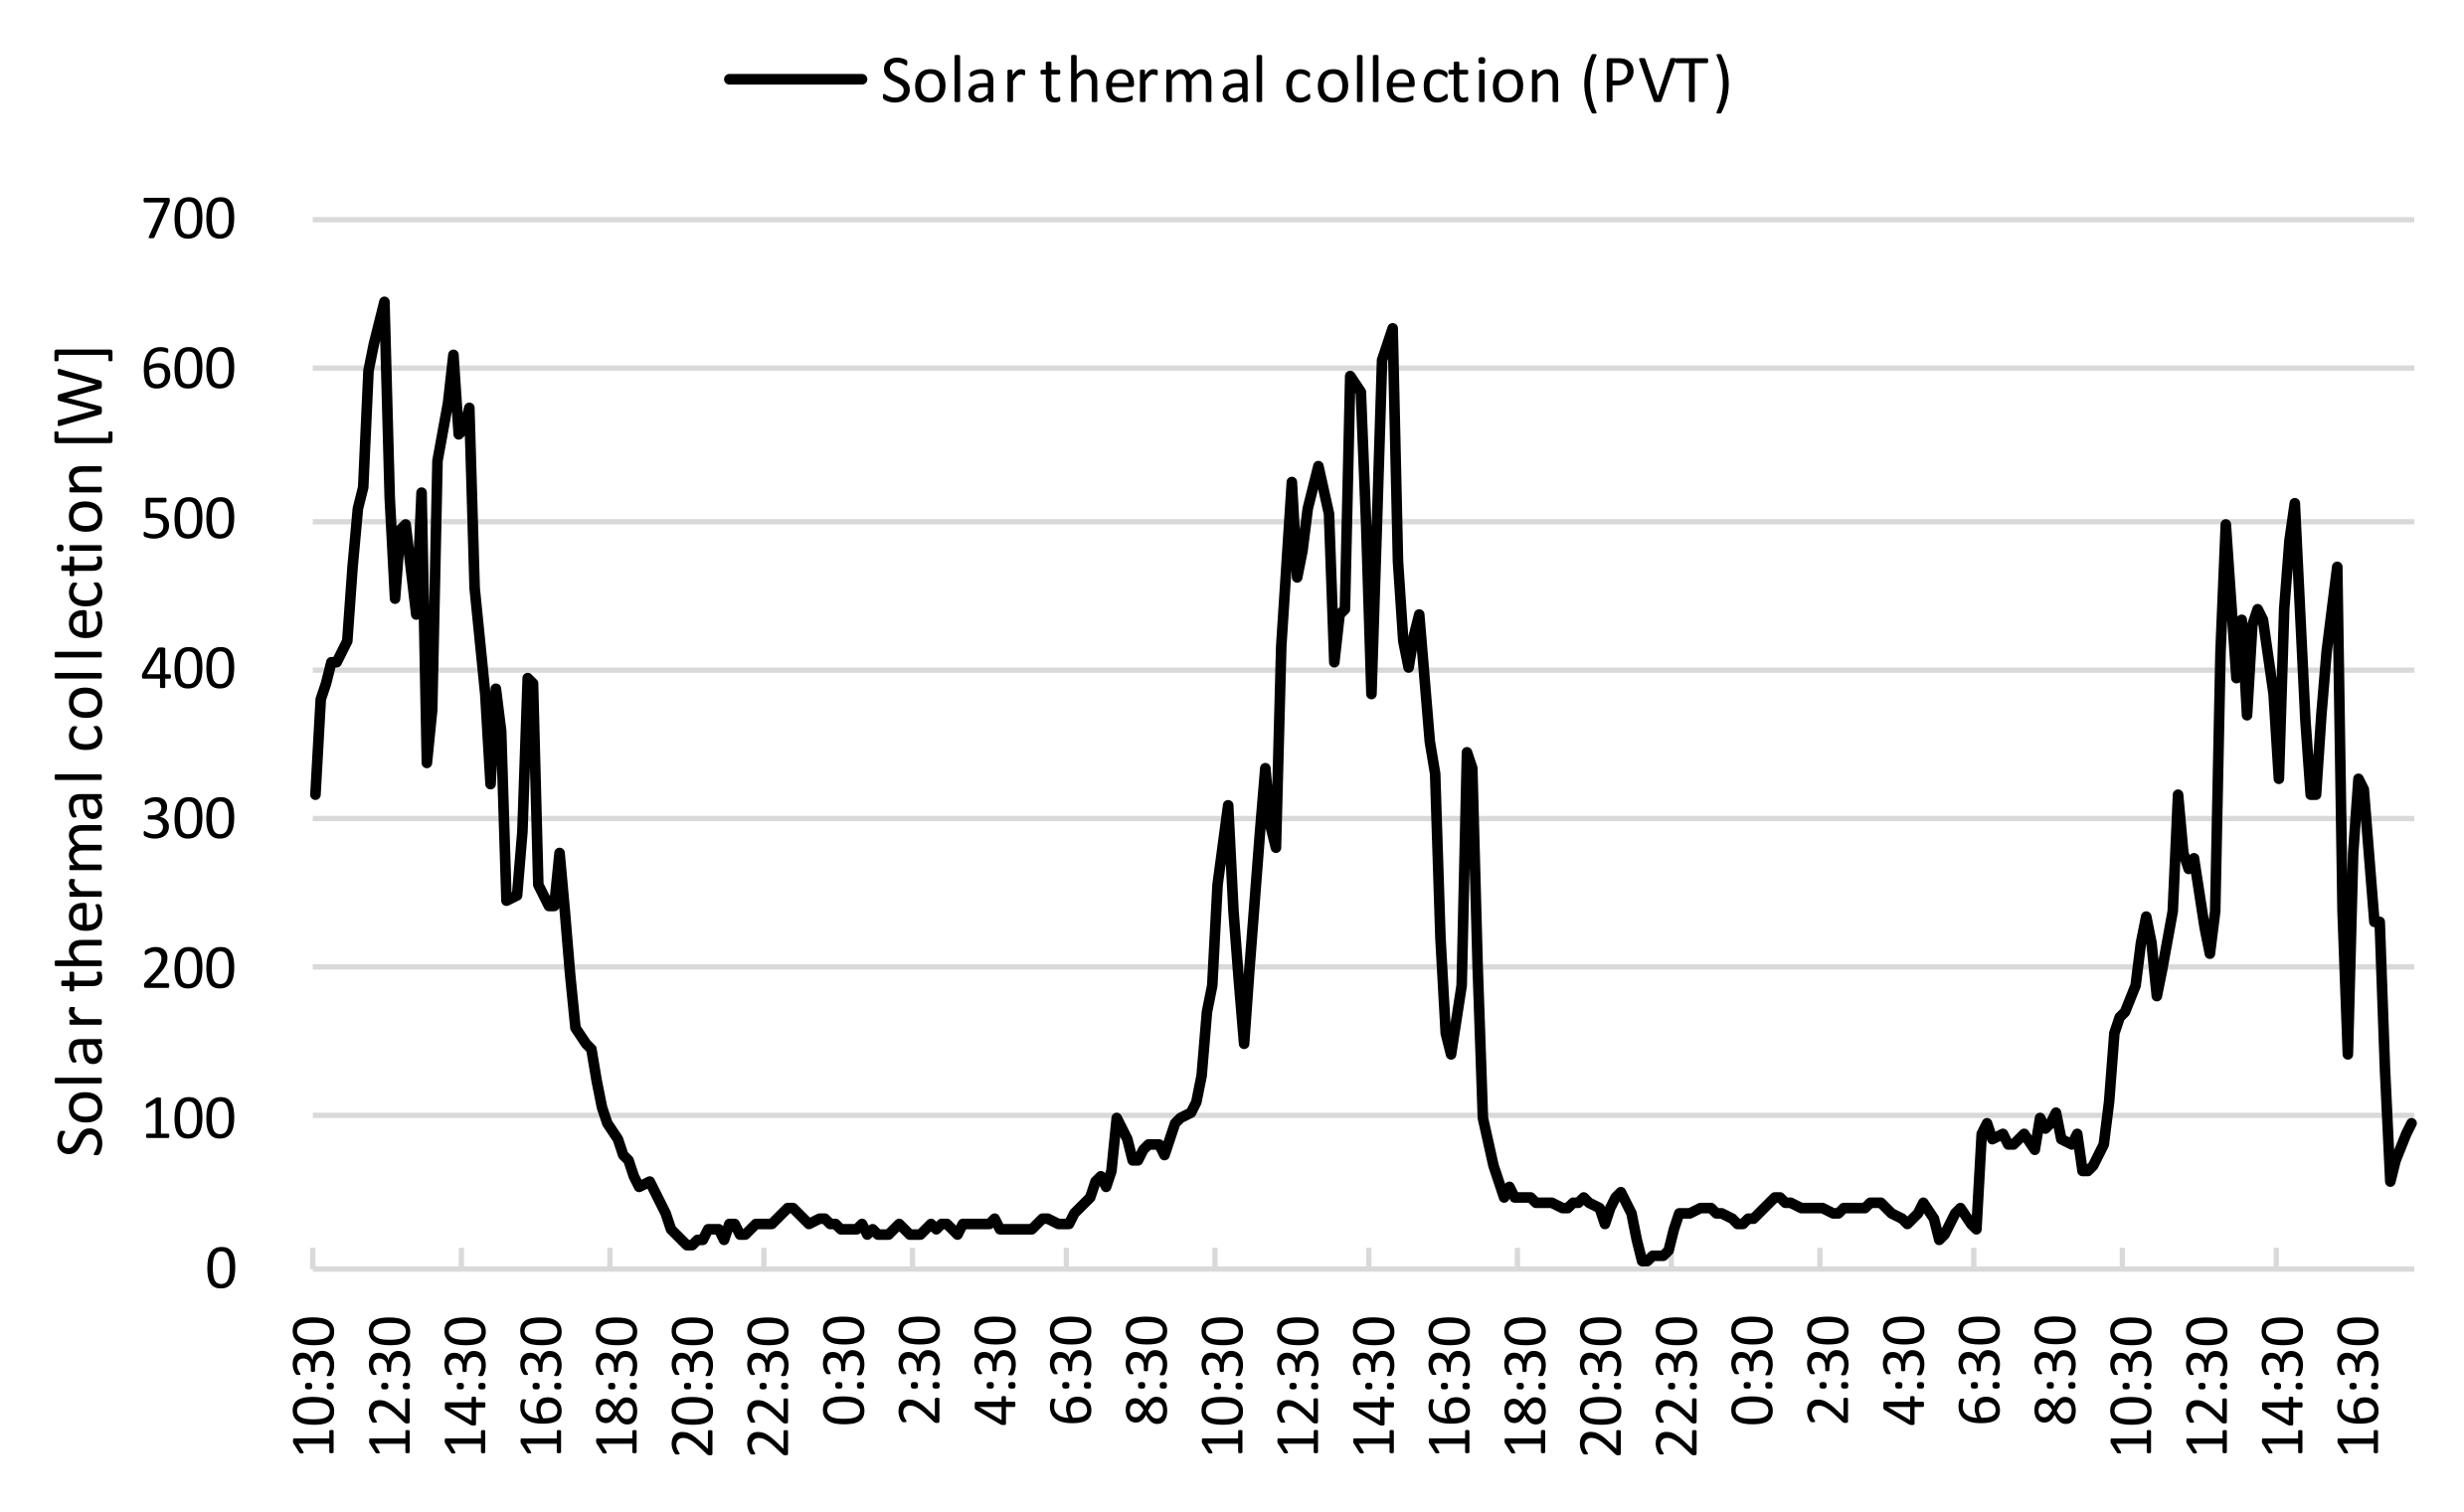
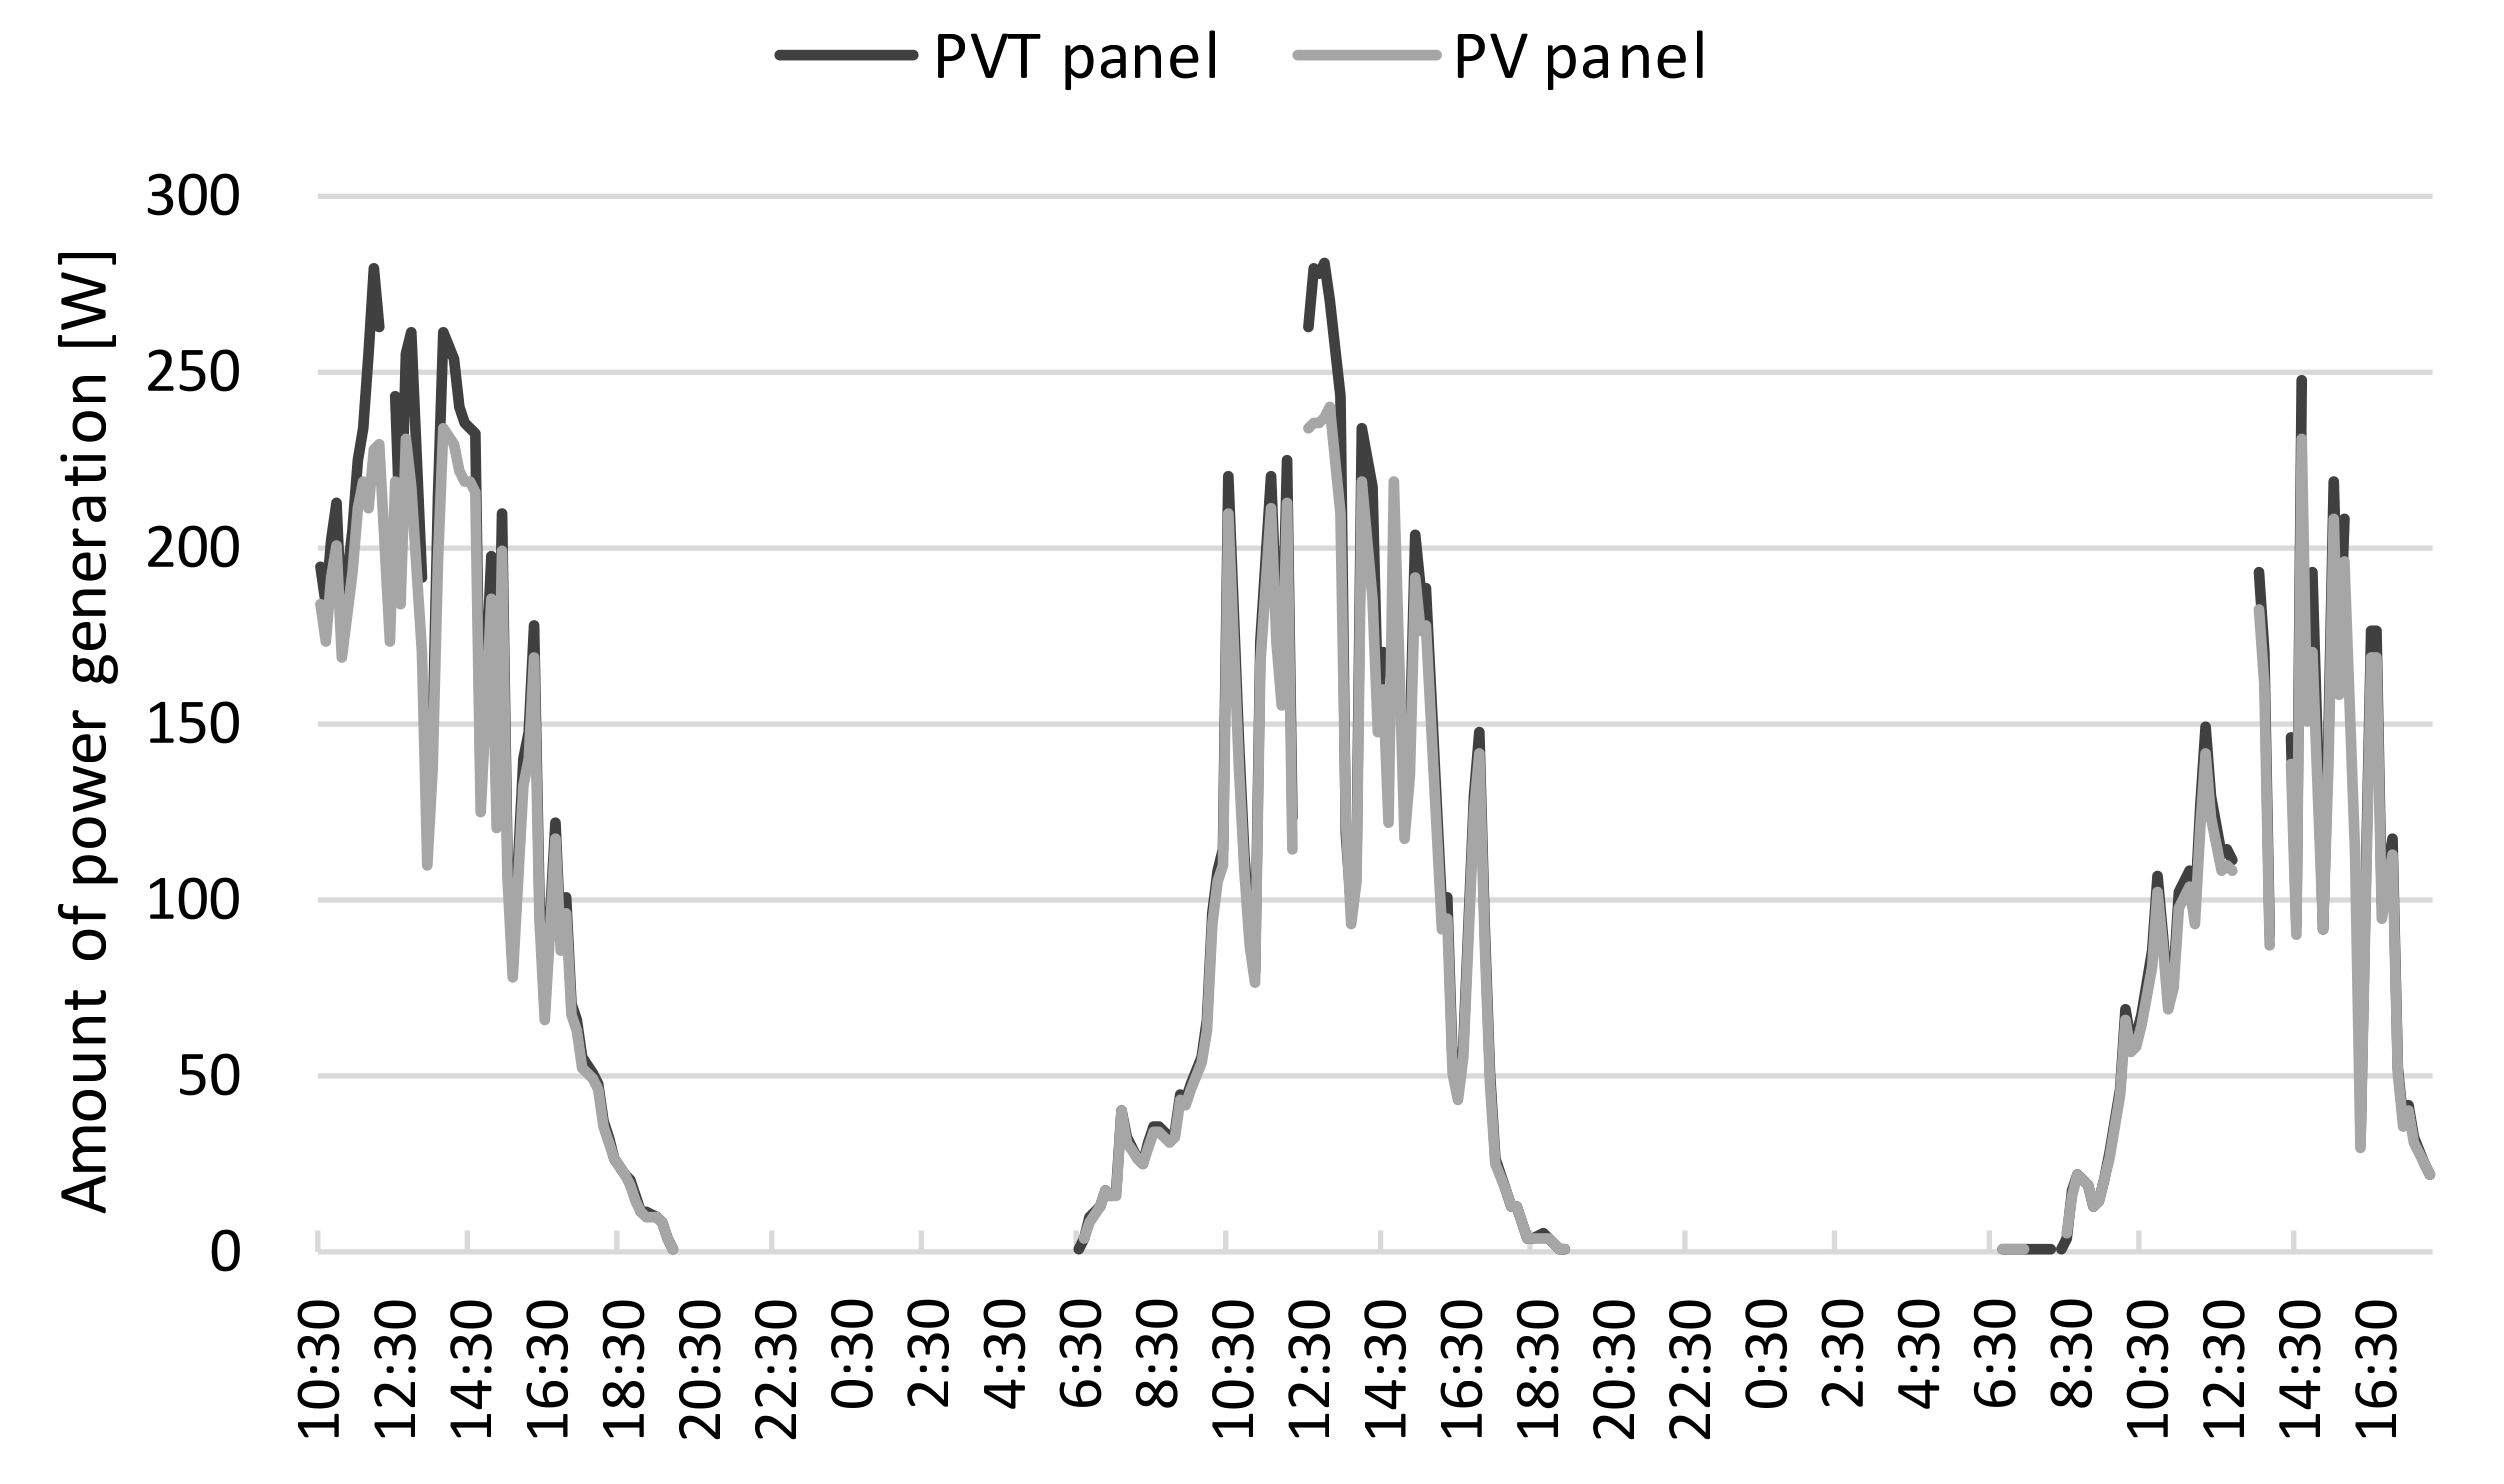
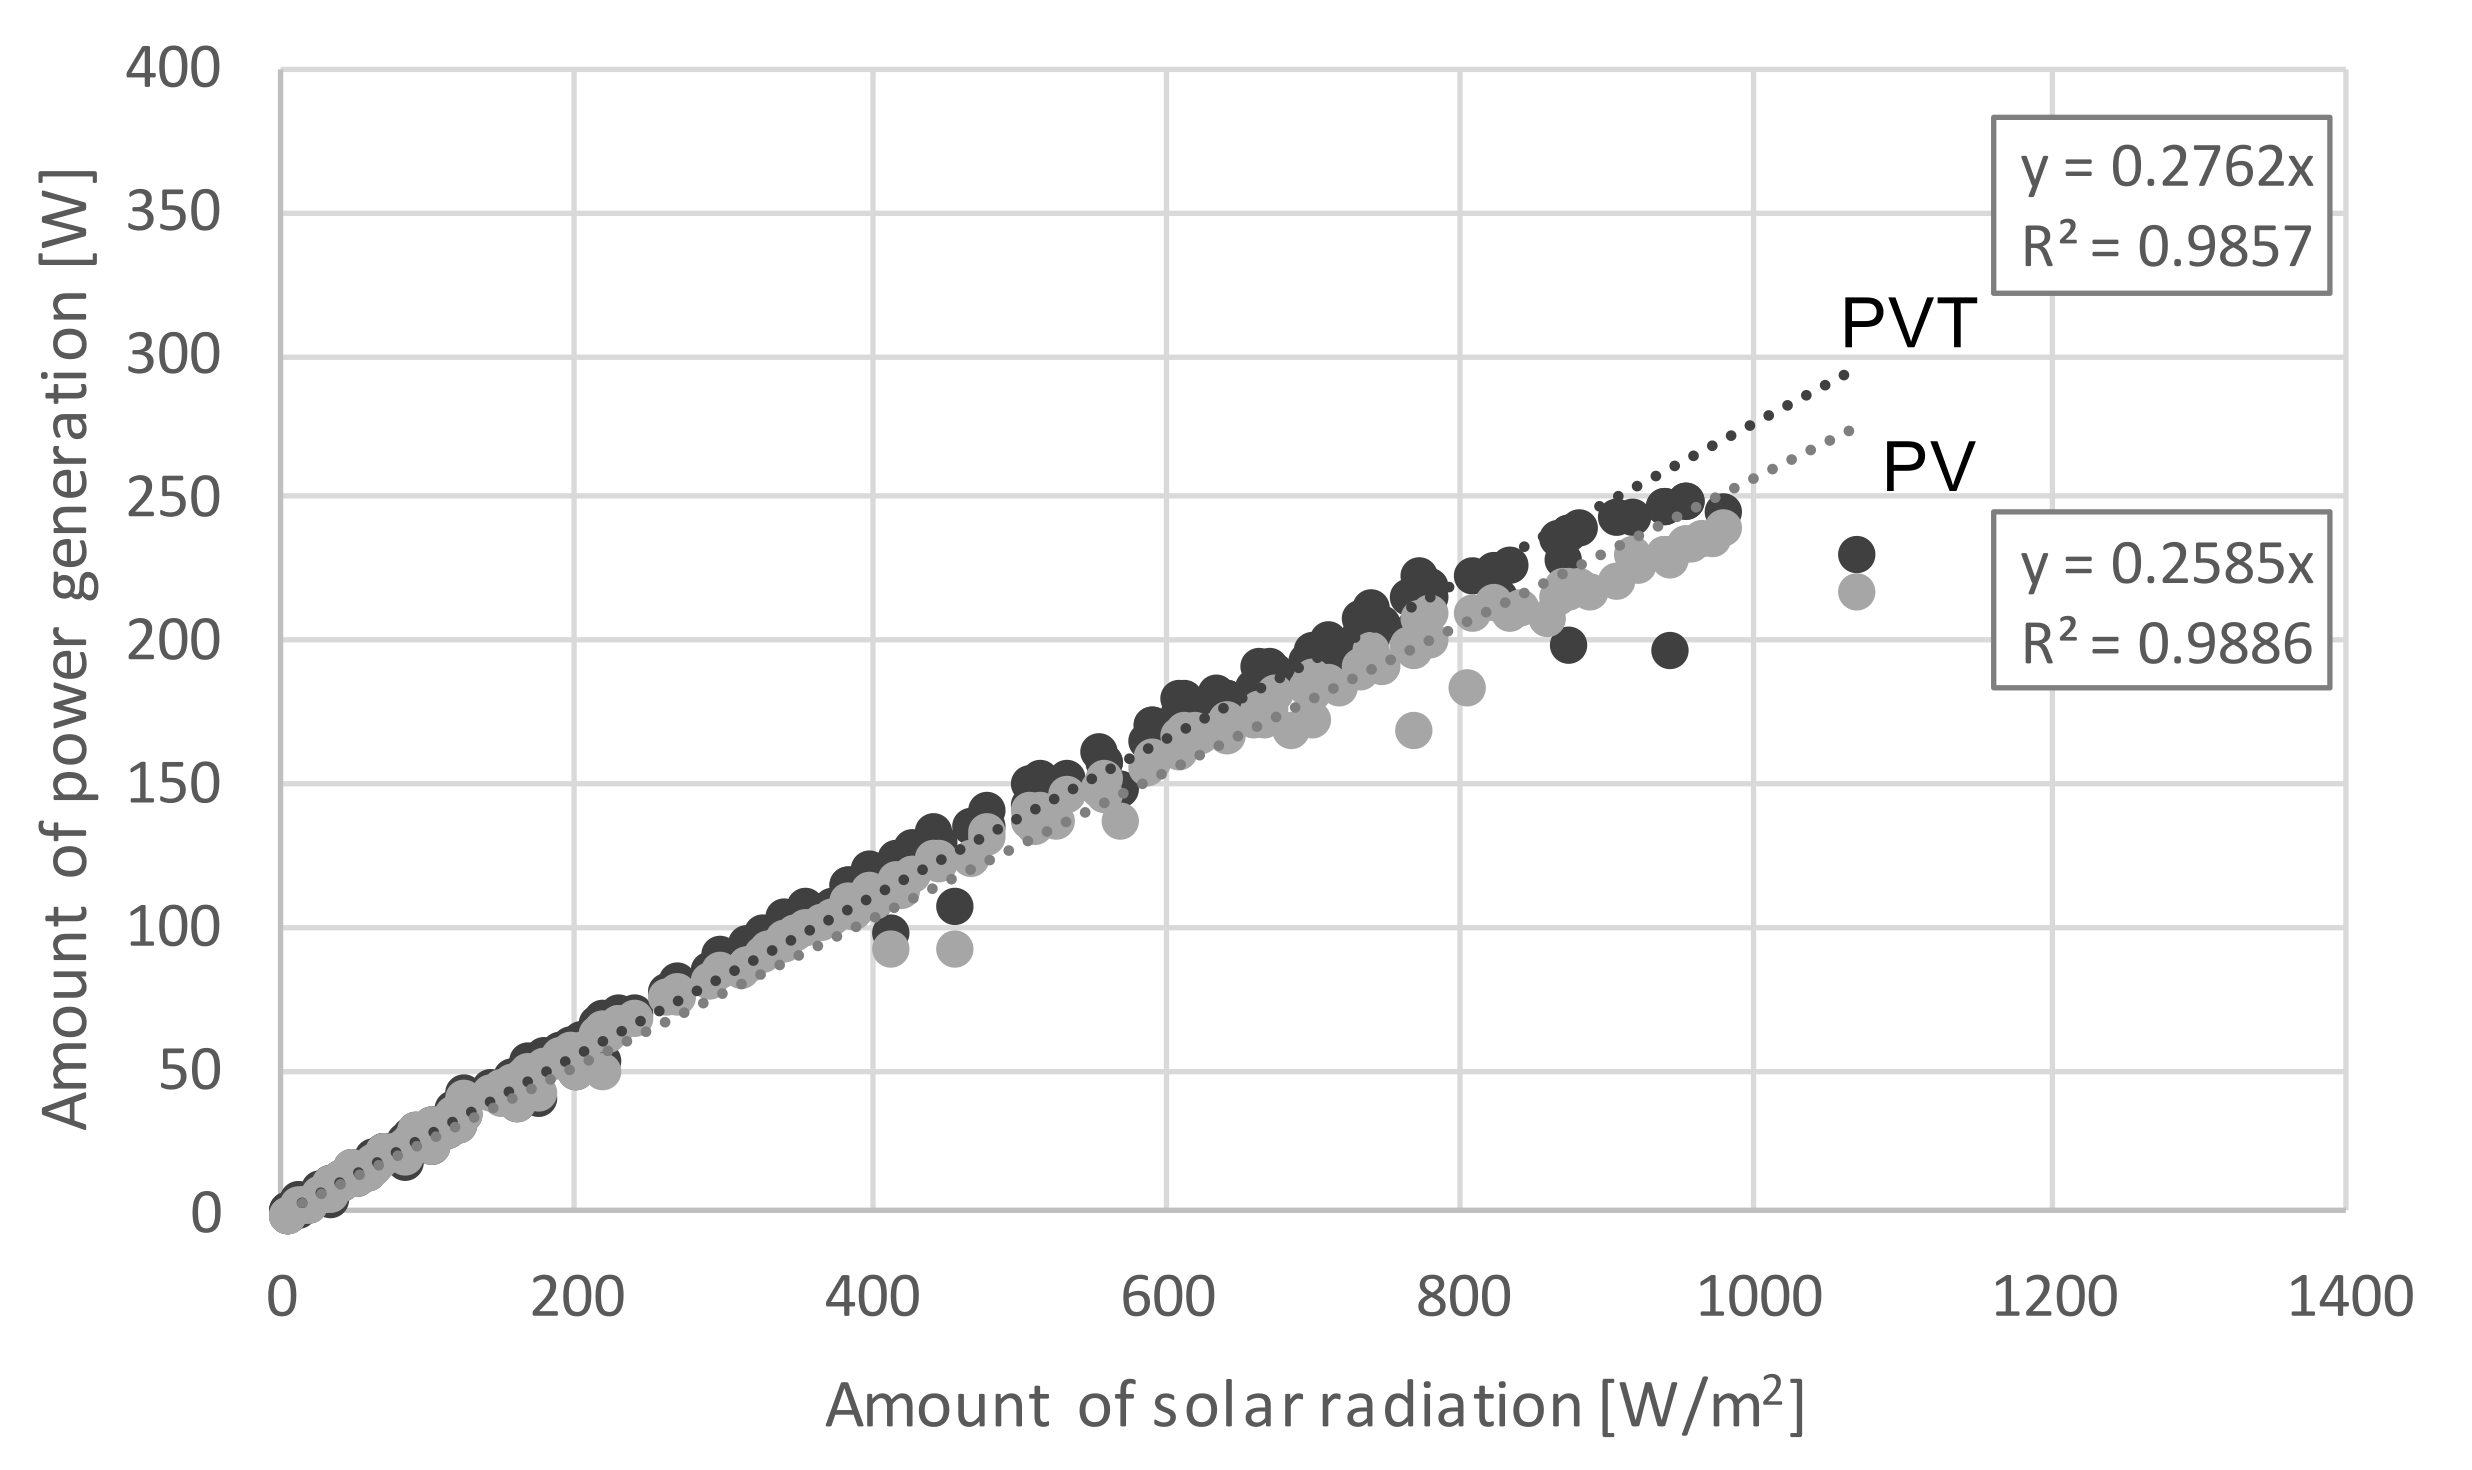
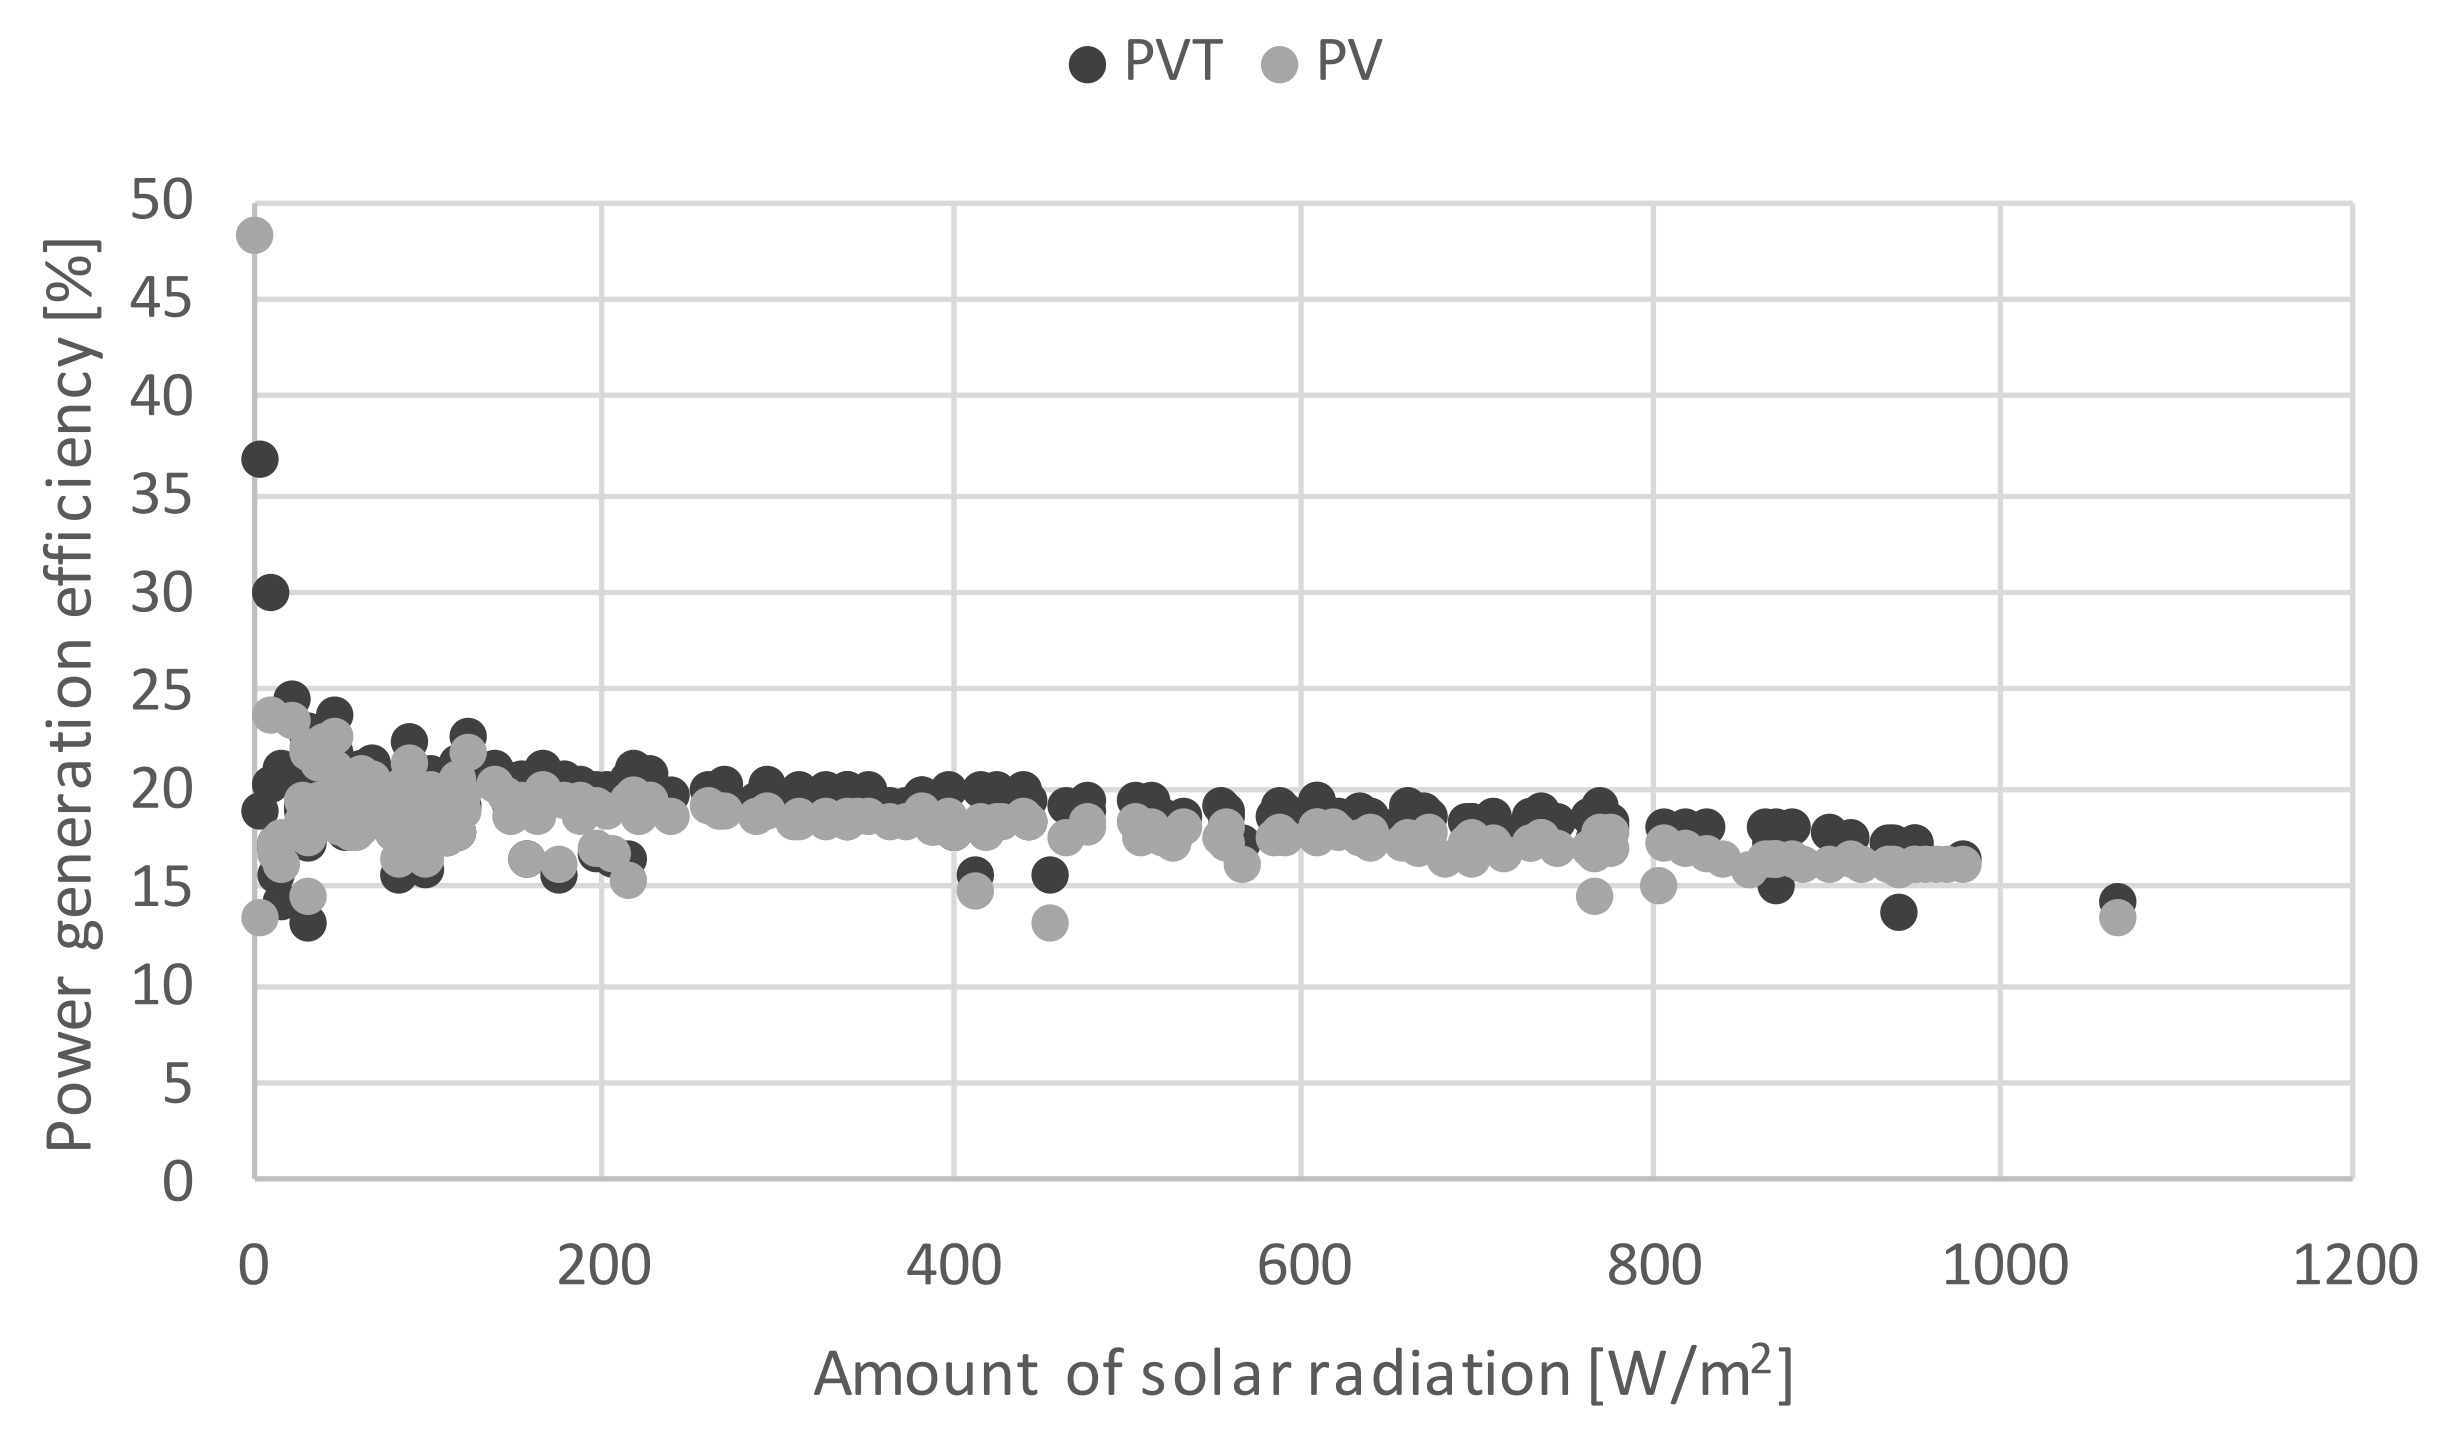
3.2. Comparison of Power Generation Change

The power generated by the PV and PVT panels were compared to examine the effect of increasing the power generation of the PVT panel, owing to the effect of the surface temperature drop in the air-based PVT system. The maximum power of the PVT panel that allowed air to pass through the panel increased by 21.9 W (Figure 10). However, it is difficult to analyze the variation in the amount of electricity generated by the change in insolation quantitatively. Therefore, in this study, the relationship between insolation and power generation was analyzed for each PV panel and PVT panel. For the correlation between solar radiation and power generation (Figure 11), the coefficient of PVT increased by approximately 6.8% compared to that of PV during the measurement period (PVT: 0.2462, PV: 0.2585). The increase in power generation due to PVT application during the measurement period is about 268.0 Wh. The power consumption of the fan used for air emission during power generation is 190.8 Wh. Although the increase in power generation due to the PVT application was somewhat higher than the power consumption of the fan, this is a result of the summer when the outdoor temperature is high, and it is thought that the increase in the amount of power generation will increase as the outdoor temperature in winter decreases. In addition, in order to increase the effect of applying the PVT system, it is necessary to additionally examine the appropriate capacity and control method of the exhaust fan.
The power generation efficiency values of the PV and PVT panels were calculated based on the measured insolation and power generation (Figure 12). The power generation efficiency values of the PVT and PV panels were 22.9% and 20.8%, respectively. This results in an approximately 10.1% increase in the power generation efficiency, owing to the airflow under the panel. In addition, the solar heat of the PVT was collected, owing to an increase in the air temperature, which was approximately 46.6%. Therefore, the solar energy utilization efficiency of the PVT was 69.5% (Figure 13), which was significantly higher than that of the PV (20.8%). The air heated by the PVT system can be directly introduced into the room in winter and used as heating. In addition, under a condition in which an indoor heating load does not occur, it can be used for hot water supply through heat exchange with water, and can be used for regeneration of desiccant for indoor dehumidification. Further research is needed on system construction and control methods for the proper use of heated air.

4. Conclusions

In this study, the application of solar energy, which is the most usable renewable energy source in buildings and easy to maintain, was reviewed. In particular, the power generation and heat collection performance of the PVT system, a combination of the existing solar power generation and solar heat collection systems, were determined through measurements.
The target system of this study was an air-based PVT system. The system decreased the surface temperature of the panel by passing the outside air through the lower part of the existing PV panel, increasing the solar power generation efficiency by approximately 10.1%. In addition, 46.6% of the thermal energy was obtained, owing to the increased temperature of the passing air. It is demonstrated that heated air can be utilized for heating and hot-water supply loads generated in buildings.
The experiments were conducted in summer when the outside air temperature was relatively high; hence, the effect of the panel temperature decrease attributed to air passage may be less significant in other seasons. Therefore, further research on the variations in the cooling effect and power generation efficiency of the panel with the outdoor temperature is required. In addition, it is necessary to review the method for controlling the required temperature by controlling the fan rotation speed to utilize the elevated air temperature in the building effectively. Furthermore, the utilization method and effect on the building should be investigated.

Author Contributions

Conceptualization, Y.C.; methodology, Y.C. and H.B.K.; validation, H.B.K.; writing—original draft preparation, Y.C. All authors have read and agreed to the published version of the manuscript.

Funding

This work was supported by the National Research Foundation of Korea (NRF) grant funded by the Korea government (MSIT) (No. 2020-0298).

Institutional Review Board Statement

Not applicable.

Informed Consent Statement

Not applicable.

Data Availability Statement

Not applicable.

Conflicts of Interest

The authors declare no conflict of interest.

References

  1. Hossain, M.S.; Saidur, R.; Fayaz, H.; Rahim, N.A.; Islam, M.R.; Ahamed, J.U.; Rahman, M.M. Review on Solar Water Heater Collector and Thermal Energy Performance of Circulating Pipe. Renew. Sustain. Energy Rev. 2011, 15, 3801–3812. [Google Scholar] [CrossRef]
  2. Porras-Prieto, C.J.; Mazarrón, F.R.; de los Mozos, V.; García, J.L. Influence of Required Tank Water Temperature on the Energy Performance and Water Withdrawal Potential of a Solar Water Heating System Equipped with a Heat Pipe Evacuated Tube Collector. Sol. Energy 2014, 110, 365–377. [Google Scholar] [CrossRef]
  3. Maraj, A.; Londo, A.; Gebremedhin, A.; Firat, C. Energy Performance Analysis of a Forced Circulation Solar Water Heating System Equipped with a Heat Pipe Evacuated Tube Collector under the Mediterranean Climate Conditions. Renew. Energy 2019, 140, 874–883. [Google Scholar] [CrossRef]
  4. Hassan, H. Comparing the Performance of Passive and Active Double and Single Slope Solar Stills Incorporated with Parabolic Trough Collector via Energy, Exergy and Productivity. Renew. Energy 2019, 148, 437–450. [Google Scholar] [CrossRef]
  5. Abuşka, M.; Şevik, S. Energy, Exergy, Economic and Environmental (4E) Analyses of Flat-Plate and V-Groove Solar Air Collectors Based on Aluminium and Copper. Sol. Energy 2017, 158, 259–277. [Google Scholar] [CrossRef]
  6. Choi, Y.; Takase, K.; Mae, M. System Performance of a Residential Building Using the Air-Based Solar Heating System. Sol. Energy 2018, 171, 47–63. [Google Scholar] [CrossRef]
  7. Beausoleil-Morrison, I.; Kemery, B.; Wills, A.D.; Meister, C. Design and Simulated Performance of a Solar-Thermal System Employing Seasonal Storage for Providing the Majority of Space Heating and Domestic Hot Water Heating Needs to a Single-Family House in a Cold Climate. Sol. Energy 2019, 191, 57–69. [Google Scholar] [CrossRef]
  8. Attar, I.; Farhat, A. Efficiency Evaluation of a Solar Water Heating System Applied to the Greenhouse Climate. Sol. Energy 2015, 119, 212–224. [Google Scholar] [CrossRef]
  9. Martinopoulos, G.; Tsalikis, G. Diffusion and Adoption of Solar Energy Conversion Systems e The Case of Greece. Energy 2020, 144, 800–807. [Google Scholar] [CrossRef]
  10. Martinopoulos, G.; Serasidou, A.; Antoniadou, P. Building Integrated Shading and Building Applied Photovoltaic System Assessment in the Energy Performance and Thermal Comfort of Office Buildings. Sustainability 2018, 10, 4670. [Google Scholar] [CrossRef] [Green Version]
  11. Ravyts, S.; Dalla Vecchia, M.; Van den Broeck, G.; Driesen, J. Review on Building-Integrated Photovoltaics Electrical System Requirements and Module-Integrated Converter Recommendations. Energies 2019, 12, 1532. [Google Scholar] [CrossRef] [Green Version]
  12. Lämmle, M.; Oliva, A.; Hermann, M.; Kramer, K.; Kramer, W. PVT Collector Technologies in Solar Thermal Systems: A Systematic Assessment of Electrical and Thermal Yields with the Novel Characteristic Temperature Approach. Sol. Energy 2017, 155, 867–879. [Google Scholar] [CrossRef]
  13. Yu, G.; Yang, H.; Yan, Z.; Kyeredey, M. A Review of Designs and Performance of Façade-Based Building Integrated Photovoltaic-Thermal ( BIPVT ) Systems. Appl. Therm. Eng. 2021, 182, 116081. [Google Scholar] [CrossRef]
  14. Zarei, A.; Liravi, M.; Babaie, M.; Ghodrat, M. A Novel, Eco-Friendly Combined Solar Cooling and Heating System, Powered by Hybrid Photovoltaic Thermal (PVT) Collector for Domestic Application. Energy Convers. Manag. 2020, 222, 113198. [Google Scholar] [CrossRef]
  15. Syakirah, N.; Fudholi, A.; Bakhtyar, B.; Hoy, C.; Ibrahim, A.; Ha, M.; Mat, S.; Sopian, K. Energy Economic Analysis of Photovoltaic—Thermal-Thermoelectric (PVT-TE) Air Collectors. Renew. Sustain. Energy Rev. 2018, 92, 187–197. [Google Scholar] [CrossRef]
  16. Numan, A.; Kaya, F. Effect on the Exergy of the PVT System of Fi Ns Added to an Air-Cooled Channel: A Study on Temperature and Air Velocity with ANSYS Fluent. Sol. Energy 2019, 184, 561–569. [Google Scholar] [CrossRef]
  17. Wajs, J.; Golabek, A.; Bochniak, R.; Mikielewicz, D. Air-Cooled Photovoltaic Roof Tile as an Example of the BIPVT System e An Experimental Study on the Energy and Exergy Performance. Energy 2020, 197, 117255. [Google Scholar] [CrossRef]
  18. Singh, G.; Kumar, S.; Tiwari, G.N. Design, Fabrication and Performance Evaluation of a Hybrid Photovoltaic Thermal ( PVT ) Double Slope Active Solar Still. DES 2011, 277, 399–406. [Google Scholar] [CrossRef]
  19. Lateef, A.; Misha, S.; Tamaldin, N.; Rosli, M.A.M.; Sachit, A. Case Studies in Thermal Engineering Theoretical Study and Indoor Experimental Validation of Performance of the New Photovoltaic Thermal Solar Collector ( PVT ) Based Water System. Case Stud. Therm. Eng. 2020, 18, 100595. [Google Scholar] [CrossRef]
  20. Vittorini, D.; Castellucci, N.; Cipollone, R. Heat Recovery Potential and Electrical Performances In- Fi Eld Investigation on a Hybrid PVT Module. Appl. Energy 2017, 205, 44–56. [Google Scholar] [CrossRef]
  21. Sakellariou, E.I.; Wright, A.J.; Axaopoulos, P.; Oyinlola, M.A. PVT Based Solar Assisted Ground Source Heat Pump System: Modelling Approach and Sensitivity Analyses. Sol. Energy 2019, 193, 37–50. [Google Scholar] [CrossRef]
  22. Brottier, L.; Bennacer, R. Thermal Performance Analysis of 28 PVT Solar Domestic Hot Water Installations in Western Europe. Renew. Energy 2020, 160, 196–210. [Google Scholar] [CrossRef]
  23. Hengel, F.; Heschl, C.; Inschlag, F.; Klanatsky, P. International Journal of Thermo Fl Uids System Ef Fi Ciency of Pvt Collector-Driven Heat Pumps. Int. J. Thermofluids 2020, 5–6, 100034. [Google Scholar] [CrossRef]
  24. Ramos, A.; Chatzopoulou, M.A.; Guarracino, I.; Freeman, J.; Markides, C.N. Hybrid Photovoltaic-Thermal Solar Systems for Combined Heating, Cooling and Power Provision in the Urban Environment. Energy Convers. Manag. 2017, 150, 838–850. [Google Scholar] [CrossRef]
  25. Calise, F.; Dentice, M.; Vanoli, L. Design and Dynamic Simulation of a Novel Solar Trigeneration System Based on Hybrid Photovoltaic/Thermal Collectors (PVT). Energy Convers. Manag. 2012, 60, 214–225. [Google Scholar] [CrossRef]
  26. Fayaz, H.; Rahim, N.A.; Hasanuzzaman, M.; Nasrin, R.; Rivai, A. Numerical and Experimental Investigation of the Effect of Operating Conditions on Performance of PVT and PVT-PCM. Renew. Energy 2019, 143, 827–841. [Google Scholar] [CrossRef]
  27. Penaka, S.R.; Saini, P.K.; Zhang, X. Digital Mapping of Techno-Economic Performance of a Water-Based Solar Photovoltaic/Thermal (PVT) System for Buildings over Large Geographical Cities. Buildings 2020, 10, 148. [Google Scholar] [CrossRef]
Figure 1. Schematic of experimental setup.
Energies 14 08586 g001
Figure 2. I-V curves of the target panel.
Energies 14 08586 g002
Figure 3. Solar radiation and outside temperature.
Energies 14 08586 g003
Figure 4. Inlet temperatures of the photovoltaic/thermal (PVT) panel.
Energies 14 08586 g004
Figure 5. Upper-surface temperatures of the panels.
Energies 14 08586 g005
Figure 6. Lower-surface temperatures of the panels.
Energies 14 08586 g006
Figure 7. Outlet temperatures of the PVT panel.
Energies 14 08586 g007
Figure 8. Relationship between insolation and outlet temperature rise.
Energies 14 08586 g008
Figure 9. Heat collection by the PVT panel.
Energies 14 08586 g009
Figure 10. Variations in power generation of photovoltaic (PV) and PVT panels.
Energies 14 08586 g010
Figure 11. Relationship between insolation and power generation.
Energies 14 08586 g011
Figure 12. Power generation efficiency of PVT and PV panels.
Energies 14 08586 g012
Figure 13. Solar energy utilization efficiency of PVT and PV panels.
Energies 14 08586 g013
Table 1. Equipment specification.
ItemsInstrumentSpecification
TemperatureThermal couple T-typeRange: −200–250 °C,
Accuracy: ±0.5 °C, Resolution: 0.1 °C
Solar radiationEKO MS-40 pyranometer
ISO 9060:2018 Class C (second class)
Range: 0–2000 W/m2, Accuracy: ±0.2%
Electric energySolar volt/Current unit10 A/50 mV shunt
Wind speedTesto 405i hot-wire anemometerRange: 0–30 m/s, Accuracy: ±0.1–0.3 m/s
Data loggerHioki Memory Hilogger LR8400Temperature resolution: 0.01 °C,
Voltage resolution: 500 nV
Table 2. Measurement items.
NumberItemNumberItem
1Outside temperature15PVT lower air temperature
2PVT air inlet temperature 116PV upper air temperature
3PVT air inlet temperature 217PV upper-surface temperature 1
4PVT air inlet temperature 318PV upper-surface temperature 2
5PVT upper-air temperature19PV upper-surface temperature 3
6PVT upper-surface temperature 120PV lower-surface temperature 1
7PVT upper-surface temperature 221PV lower-surface temperature 2
8PVT upper-surface temperature 322PV lower-surface temperature 3
9PVT lower-surface temperature 123PV lower-air temperature
10PVT lower-surface temperature 224Pyranometer
11PVT lower-surface temperature 325PVT current
12PVT air outlet temperature 126PVT voltage
13PVT air outlet temperature 227PV current
14PVT air outlet temperature 328PV voltage
Publisher’s Note: MDPI stays neutral with regard to jurisdictional claims in published maps and institutional affiliations.

