Article

Airtightness and Heat Energy Loss of Mid-Size Terraced Houses Built of Different Construction Materials

by
Valdas Paukštys
1,2,
Gintaris Cinelis
1,*,
Jūratė Mockienė
1 and
Mindaugas Daukšys
1
1
Faculty of Civil Engineering and Architecture, Kaunas University of Technology, Studentų st. 48, 51367 Kaunas, Lithuania
2
Institute of Architecture and Construction, Kaunas University of Technology, Tunelio st. 60, 44405 Kaunas, Lithuania
*
Author to whom correspondence should be addressed.
Energies 2021, 14(19), 6367; https://doi.org/10.3390/en14196367
Submission received: 3 August 2021 / Revised: 7 September 2021 / Accepted: 29 September 2021 / Published: 5 October 2021

Abstract

:
The European Union has adopted legislation aimed to increase the use of renewable energy and improve the effectiveness of conventional-form energy use. Additional structure insulation helps to decrease heat energy loss. Airtightness of the building envelope (building airtightness) is an additional factor that determines comfortable and energy-saving living environment. The conformity of heat energy loss with the object’s design energy class is one of the mandatory indicators used in the obligatory building energy performance certification procedure. Optionally, the objects to be certified are the entire buildings or separate units (flats). There is an issue of concern whether a flat assessed as a separate housing unit would meet the requirements of design energy class depending on the location of the unit in the building. The study is aimed to determine the change in heat loss of end units in terraced houses (townhouses) as a result of various factors, leading to uneven airtightness of the building envelope. The non-destructive assessment of building airtightness was implemented through the combined use of methods, namely Blower Door Test (around 200 measurements) and Infrared Thermography. The hollow clay unit masonry showed ca. 7–11% less airtightness than the sand–lime block masonry structure. The end units were up to 20% less airtight compared to the inside units.

1. Introduction

To fulfil the requirements of the European Energy Performance of Buildings Directive (EPBD) [1,2] related to the reduction of energy consumption by using high-quality materials and implementing efficient solutions for structural connections and joints, the national requirements for thermal properties in building envelope were formulated and building energy efficiency calculation methodology was developed. Many European countries have developed national methodologies for the assessment of building energy efficiency according to DIN 18599 [3] in Germany, DOCET in Italy, CALENER in Spain, etc. [4]. The above-mentioned methods vary depending on the type of buildings, climatic zone, minimal thermal requirements, and certification indexing [4].
The main evaluation criteria used in these methodologies are CO 2   emissions and primary energy or heat energy consumption in buildings. All the methodologies pursue the main aim to reduce energy consumption in buildings. To this end, not only are efficient engineering systems that improve the thermal properties of the building required, but also appropriate technological solutions to assure the high quality of work and good airtightness of the buildings. A properly insulated building together with efficient heating and ventilating systems can save up to 50% of heating energy and assure comfortable conditions in the premises [5,6].
The airtightness of and energy efficiency of the buildings can be determined by different methods [7]: theoretical investigation [8,9], empirical research [10,11], modelling of general building characteristics, or modelling of one component of the building [12]. The analysis of the related literature revealed that building energy performance calculations are precise only if building airtightness is defined by measurements. The measurements help to assess the construction workmanship and define the airtightness level, which is used to calculate the energy consumption of the building according to the 2010/31/EU Directive [2]. The most widely used method of airtightness measurement is the blowing door test method, prescribed by EN ISO 9972 2015 [13,14].
The main index of airtightness used in Lithuania is n50, which indicates the part of internal air volume having changed in one hour at the set pressure of 50 Pa. The measurements of this kind are performed in many countries aiming to assess the general airtightness level of buildings using various criteria like the building type, its height, geometric forms, envelope structure, the ratio of the envelope, the floor area, etc. [15,16,17,18].
There are several main ways of air infiltration. One of the reasons is improper structural connections in the building due to using low quality insulation materials or not using them at all. In this case, the outside air penetrates through structural joints. The other path of air leakage is the building construction material. In this case, the air can infiltrate through the voids and cracks of construction elements.
The level of building airtightness can be determined and air infiltration paths in the building envelope can be detected by means of non-destructive tests using an infrared camera and observing the cold air movement in the external structures [19], or measuring the air movement speed near the splits with the anemometer sensors and calculating the approximate area of the split [20], or even measuring the sound of penetrating air.
The research objectives were: (1) experimental assessment of the flat airtightness distribution in terraced houses made of different materials, (2) theoretical heat energy loss calculation and finding out the differences in the heat loss values between the flats in different places in the building plan, (3) assessment of the compliance of flats in different places in the building with the design energy performance class.

2. Literature Review
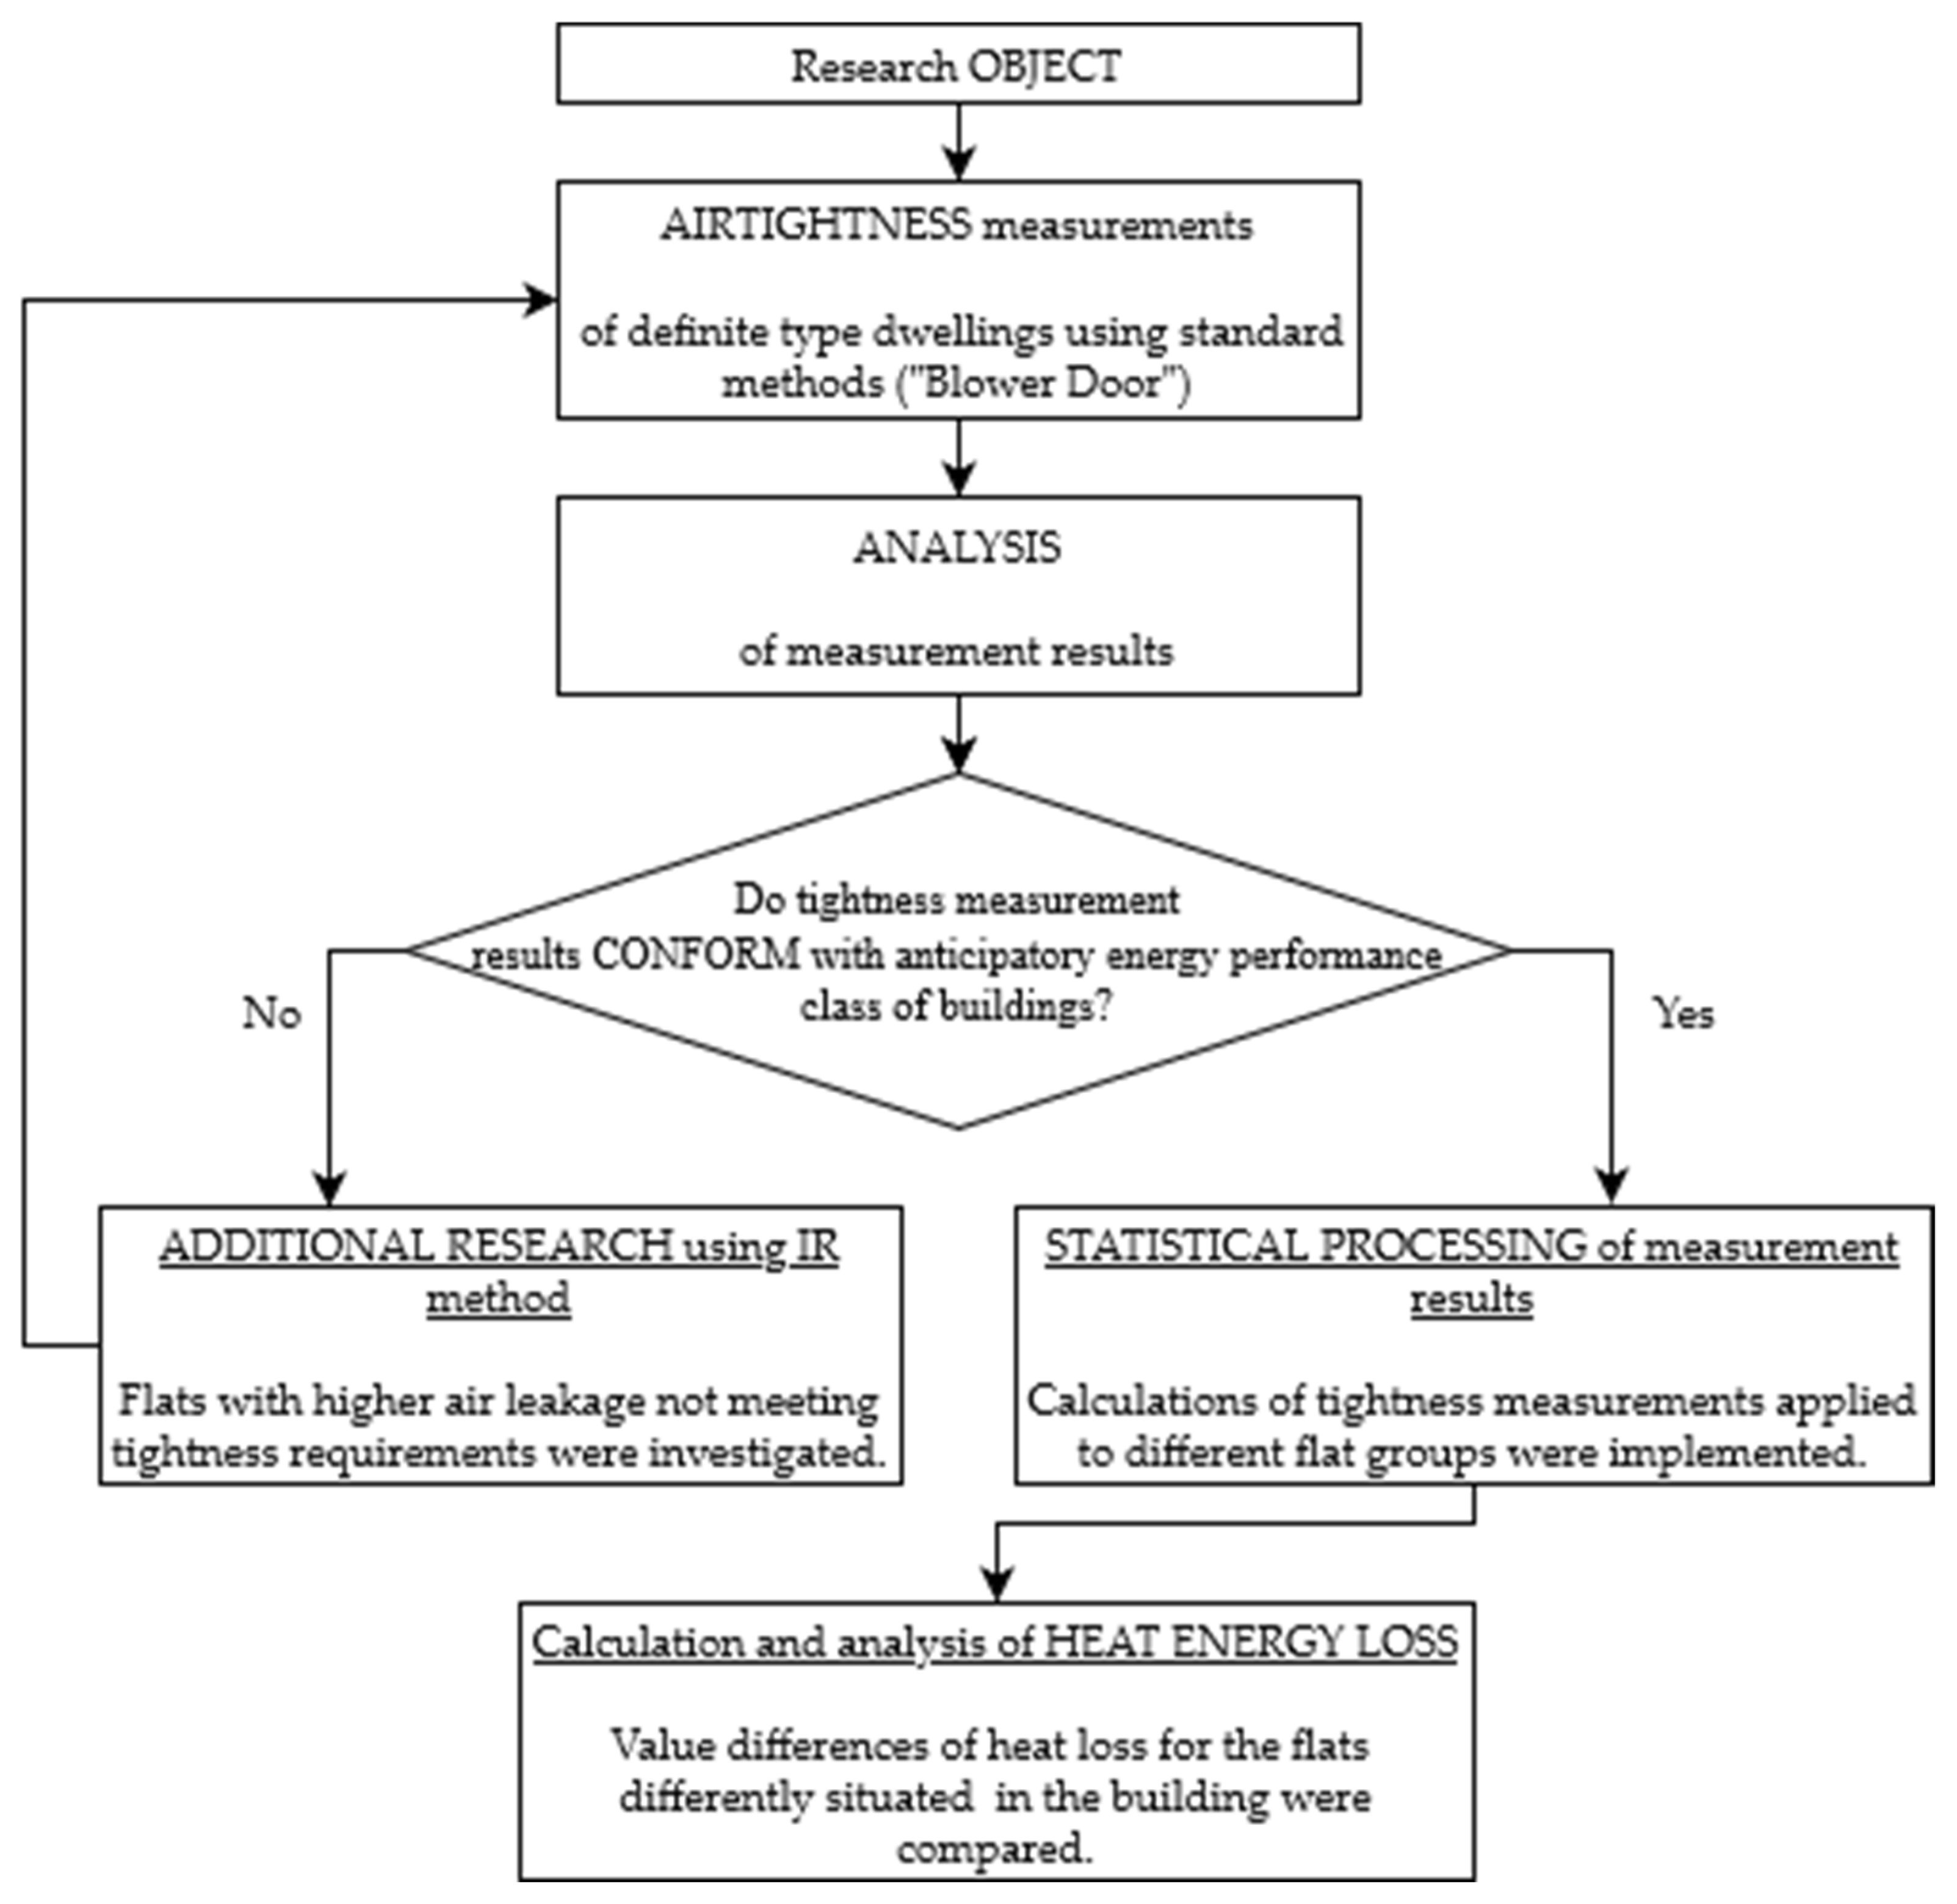
T. Kalamees [21] conducted laboratory tests of various structural timber framework connections and compared the obtained results with airtightness results of real-built houses. The researchers concluded that it was difficult to ensure the quality of airtightening works on site in the installation of both structural connections and engineering systems (water supply, electricity).
The authors of the paper [22] discussed the airtightness estimation procedure applicable in the design phase. The methodology being in its early phase included quantitative characterization of expected leaks, evaluation of building airtightness in-situ using fan pressurization, component testing for air permeability in laboratory conditions with the completion of air leakage values obtained from the published database, and correction/validation of airtightness values. The investigation of several building parts showed that ventilation ridge was responsible for the highest percentage (61%) of airflow (the air leakage values were as follows: 11.0 m3/(h·m2) for ventilation ridge, 0.66 m3/(h·m2) for window frame and connection of steel columns with the floor, and 1.15 m3/(h·m2) for panel joints).
Another article [23] discusses the air leakage problem, considering the national building energy-related regulations and the methodology of energy performance calculation. The authors investigated the construction type, the age, design details, and retrofitting of the building as airtightness factors and found better quality of newly-built dwellings, good design, high-quality workmanship, and proper quality control during the construction period contribute to energy efficiency of buildings the most. The inclusion of the airtightness factor during the energy performance assessment process could improve the energy consumption by up to 7%.
Another paper [24] presents and discusses the results of measuring the airtightness of 170 single-family houses and 56 apartments. The construction method, insulation materials, joint insulation materials, and the ceiling structure were studied in the research as the factors related to airtightness. Good airtightness of individual houses was reached in all house groups regardless of the choice of structure, number of stories, ventilation system, or technology of construction. This fact pointed out the importance of construction quality.
The research paper [25] includes a proposal for the development of a rough predictive model of the degree of envelope airtightness as a regional tool for energy efficiency assessment and tailored to southern European construction stock. The results were assessed as widely scattered due to the impact of the random component of manual construction. The paper presents the results of statistical analysis and describes the protocol used both for the identification and quantification of air leakage pathways and for construction quality management.
The authors of the paper [26] conducted a study on the relation between the airtightness of a building envelope, air infiltration, and energy use of a typical modern Finnish detached house with an IDA-ICE simulation model also considering the stack-induced infiltration. An adapted model for the rough estimation of the annual air infiltration was determined from the numerical simulation results. The dependency of both the infiltration rate and heat energy use is nearly linear on the building’s leakage rate, measured as n50. This research showed that infiltration induces about 15–30% of the energy used for space heating, together with the ventilation in the prototypical detached house.
The authors of the work [27] performed the univariate analysis and multiple linear regression of the Canadian airtightness database to reveal the important trends. Two airtightness model classes with 3 variables and 8 variables (building volume, climate, building age, building height, and insulation levels for basements, walls, roofs, and windows) using two airtightness metrics (ACH and NL) were developed. The models referred to the round half airtightness variation of the building. The study set a feasible lower boundary of perspective models for regression-based airtightness prediction.
Tests were carried out in five flats of the same building in order to characterize the air permeability and to improve the design of buildings [28]. Although the flats tested were of the same size, with the same components, and were erected using the same construction processes, their overall air permeability showed a wide variation. The authors assumed this was mainly due to the change of the width of the gaps around the roller shutter boxes and the gaps in the bottom opening joint of the doors. The quality of windows, entrance doors, and kitchen external doors also had an impact.
The results presented in [29] give some ideas for how to decrease the measurement uncertainty in the blowing door test and to better detect energy and environmental issues in the audits of buildings. The chimney and the windows, without sealing and natural ventilation systems, were discovered to be the critical causes in the building’s over-ventilation. The most critical uncertainty contributions were found to be the operative test conditions and metrological performances (e.g., internal–external temperature and the wind velocity difference) of the pressure measuring device.
The research [30] empirically investigated factors that should be considered while using pressure difference measurement values and airflow rate to derive more accurate airtightness values for large buildings. The distribution of vertical pressure across the whole building envelope can differ considerably when the building is pressurized. A method to measure airtightness was proposed where the pressure difference on each level of the building is measured and a medium value of pressure difference is defined.
Two problems related to design solutions of building airtightness were revealed in the work [31]: contemporary airtightness predictive models are too complex to be used for everyday design practice, and existing airtightness predictive models do not meet the needs of contractors and designers. More detailed issues in this context could be addressed: the lack of standardization, including factors classification, parameters definition, their impact quantification and significance assessment, metric analysis, the influence of supervision and workmanship, the classification of the air leakage paths, and research of significant air penetration areas/points.
The air permeability measurement results of 287 post-2006 new-built UK dwellings averaged 5.97 m3/(h·m2) at 50 Pa were studied in the paper [32]. Relationships between the airtightness and management context, building method, and dwelling type as the influencing factors were investigated. The superior airtightness was achieved in buildings with the self-build procurement route as a result of more innovative construction practice, prefabricated concrete panel systems, etc.; the houses built using site-based labour-intensive methods were the most air leaky. The predictive regression model was developed to predict the potential impacts of the air leakage-related factors of dwellings and improving energy efficiency.
Airtightness testing is described in [33] as a highly informative tool of the dwelling retrofit process. The authors refer to the statement that air infiltration through apertures in the building envelope can make up to one-third of the total heat loss. Particularly in this project, it was possible to reduce the measured air permeability (from 15.57 to 4.74 m3/(h·m2) @ 50 Pa) during the dwelling retrofit. This improvement was achieved through the use of usual draught-proofing means (a decrease in air permeability more than 30%), close attention to installation detail, workmanship, and sealing of the floor/wall joints at the skirting board connection (air permeability reduction of 3.6 m3/(h·m2) @ 50 Pa). Airtightness measures alone contributed to around 9% of the forecasted total reduction of heat energy demand. The effectiveness of fabric measures was very good (64% reduction considering the case of the uninsulated house), although the installation of double glazed units combined with the roof and wall insulation showed minimal improvement of airtightness (approximately 1.26 m3/(h·m2).
The paper [34] investigates the building’s airtightness in terms of location and exposure of the building. The authors state that energy-efficient buildings situated in windy areas and at exposed locations could constitute up to 10% of the total heat consumption. The altitude, strength, and speed of the wind have a significant impact on the building by determining the amount of airflow through gaps, cracks, and leaks in the envelope. The possible impact of main parameters of location on the ultimate airtightness of the building envelope was verified while investigating 150 low-energy houses constructed in 2004–2014. The altitude’s contribution to airtightness is 0.06%, whereas 99.94% of the airtightness is influenced by other factors.
A statistical method is presented in the work [14] investigating relevant factors related to the airtightness of the dwellings: climate zone, year of construction, and typology. The proposed methodology and its results were compared to the extracted database values. An open to expanding quota sampling scheme consisting of 411 representative cases was built to extrapolate the infiltration rates for Spanish buildings using typical constructive solutions. In the case study, leakage paths were located mainly around shutter boxes, window joints, and frames. The research of the infiltration impact on the ventilation and energy performance of the dwellings has been planned on this basis.
The authors of [35] developed a simplified method to evaluate energy savings from enhanced airtightness. This method was aimed to facilitate the use of energy savings estimates available to building designers and owners and expand the possibilities of the existing governmental online calculator. It expanded the ability to examine energy savings in commercial buildings for all cities in the USA. A simplified approach including energy savings predicting equations was developed to estimate annual and hourly heating energy savings. The equations predicting the percental energy savings for retrofitted buildings only require their expected air leakage rates before the retrofit and after it. Annual energy savings estimated using the online calculator and the proposed approach differed by 15% to 24%.
In the study [36], a model equation was obtained that uses statistical analysis based on empirical models to predict the apartment airtightness of reinforced concrete buildings with the data from 486 units. Two groups of variables were used in the airtightness prediction model equations along with correlation dependence analysis and multiple regression analysis. The model with the area variables was more accurate in predicting airtightness out of the two models. This approach has a limitation because the prediction results may differ depending on the characteristics and the data type collected by various countries. Nevertheless, the methodology presented in this work contributes to similar studies for finding influential variables with better applicability in the future.
The paper [37] investigates the problem of the seeming airtightness of partitions constructed in buildings. The study deals with the wind effect which is the washing reason of fibrous and porous materials of the envelopes. The authors explain how the disintegration of insulation material by forming empty areas determining local discontinuities of material in the envelope reduces thermal resistance. Appropriate areas were proved by the dynamic infrared detection method. The results show that thermal resistance of such envelopes is reduced to 87% with an absence of wind protection. The authors recommend considering the decomposition of this type while calculating the heat transfer coefficient.
In the study [12], an alternative approach was advanced to evaluate the air infiltration rate and air leakage area in building envelope parts such as exterior and interior floors and walls. Physical and acoustical methods were applied in measuring the sound reduction index to determine the leakage area. Therewith, the airflow rate through air leaks was determined using pressure difference over the floor or behind the wall and the values of leakage area. Subsequently, the calculated air infiltration rate also enabled evaluating the convective moisture rate through leaks and heat losses of the building.
The study [38] examined the airtightness performance of container houses and the impact of airtightness on their energy efficiency comparing the measurement and calculation results before and after building treatment. The identified weak places (thermal bridges, air leakages, and condensation) were mainly as junctions of walls, slabs, roof panels, and the edges of the openings. Significant improvement of the airtightness (81%) led to a certain reduction of annual energy demand (9.3%). Airtight joints and thermal brakes are essential for junction details seeking to avoid thermal problems and improve the energy performance of the building.
The authors of the work [39] studied the leakage–infiltration ratio by implementing the tests of more than twenty houses in the UK. The existing rule of thumb of the divide-by-20 (the error of using ranged from 3% to 175%) was revised and a new rule divide-by-37 as a more representative of the leakage–infiltration ratio was proposed. The mismatch of the assessment using the existing Standard Assessment Procedure (SAP) was particularly noticeable after adding the modification factors for local wind and sheltering: the overestimated infiltration rate values reached 500% and more, especially in airtight houses.
In the research [40], the airtightness role in the context of thermal insulation performance of traditional double-glazed air-filled windows was analysed. Tests were conducted in a typical dwelling in the UK by comparing the windows that are fitted with a special transparent cover improving airtightness and standard windows. The average U-value of the window sash with air-filled double-glazing was calculated to be 2.67 W/m2·K, as it was 1.79 W/m2·K for the airtight window sash which resulted in a 33% decrease in heat losses. Windows are still important in the energy demand of buildings, and effective solutions such as retrofitting windows with covers can notably contribute to decreasing the windows-related energy losses in buildings.
Performing Blower Door Tests in large buildings [41] requires airflow rates that are impractical to achieve using available equipment and because of the necessity to test only the individual zones of buildings. The Lstiburek method and the Love and Passmore method were adapted for use in multi-unit high-rise residential buildings. The results showed that neither of the proposed methods could be finally recommended as a replacement for the pressure neutralization method in traditional residential buildings. The first method was unacceptable in the accuracy estimation for exterior boundary leakage (estimation error exceeded 108%). The second method showed a small error of 0.2% for the exterior boundary leakage estimation, though the pressure neutralization method was less sensitive to measurement noise compared to the alternative Lstiburek method. There is still a need for new methods that can accurately represent the external boundary airflow while still being less labour-demanding than the pressure neutralization method.
The paper [42] describes the validation of the new model for prediction of the airtightness of buildings utilising a neural network and using four corrective factors related to the building envelope. The model was obtained based on measurements in the field at 58 units in Croatia. The model, which requires a reduced amount of data and therefore is more economical and faster than the field measurements, was validated both in the local field and outside the native country conditions. The proposed model is supposed to be appropriate for predicting airtightness values at the early design phase, as well as for the planning of regular energy refurbishment of dwellings.
Based on the literature analysis and the use of around 300 dwellings’ empirical data the study [43] analysis the relationships between the airtightness of building and eight individual variables. Correlation analyses indicated the significant relationship of the construction method, roof type, year of construction, and construction typology with building airtightness. Regression analysis showed that only the year of construction and the total leakage affect the airtightness. ANOVA tests revealed that both variables have a notable influence on the airtightness, in terms of specific leakage rate. Both variables could hardly help to assess the specific air leakage in advance because the year of construction correlates with many other variables and the building leakages can only be assessed when the construction is over.
The paper [44] concerns measurements of airtightness of 16 single-family houses with natural ventilation built from 1880 to 2007 (the measurement values ranged from 1.1 to 5.8 L/(s·m2) at 50 Pa). The results of the ventilation measurements (from 0.09 to 0.28 L/(s·m2) per heated floor area) did not meet the requirement established in the Danish Building Regulations (0.3 L/(s·m2)). The typical places of leaks were identified: the penetrations of electrical installations, exhaust ducts, chimneys, contours of older doors and windows, attic hatches, and connections with wooden ceilings. The findings are relevant for the renovation projects of the older small building stock, especially where mechanical ventilation systems are planned to be installed.
In the article [45], the research of the airtightness level of single-family energy-efficient houses was measured and compared with the requirements of Polish norms and European standards. The different wall structures of the buildings did not significantly affect the level of airtightness (ranged within n50 = 0.17 to 5.33 h−1): the buildings with the worst and the best tightness had the same brickwork wall construction. As the reason for the insufficient tightness, the human factor was referred: a lack of experience and inaccurate performance of coatings, not airtight insulating layer, the mistakes made in porous insulation of transition systems, and the leaks of vapour barrier at connections.
The study [46] focused on the infiltration rate prediction of public buildings in China by implementing the in-situ tests and simulating the infiltration rates for 1800 cases. The main factors influencing the air infiltration were described as meteorological parameters, architectural structure, infiltration path characteristics. The construction period was not useable individually as a separate factor: zones that were built later (2007) had even worse airtightness than zones built earlier (1990). The airtightness of public buildings was found to be much worse than that of traditional dwellings. The centralized HVAC system had more elements in the building envelope than the split HVAC system, and the outer windows’ airtightness was worse than the wall. For buildings with a mechanical fresh air system, the airtightness needs to be strengthened in order to reduce the impact of air infiltration. The conclusion was that the influence of air infiltration on public buildings should be acknowledged by policymakers in defining more energy-reasoned design standards.
The authors of the research [47] aimed to reveal the impact of local conditions by evaluating relations of infiltration rate and individual location and heat demand of residential buildings. Depending on the airtightness of buildings the differences in energy consumption between two different locations from the same climatic zone were evaluated in a rather wide range (from 70% to 90%) and could reach even 200% considering sheltered environmental conditions. The general conclusion of the research was that the building location and its level of exposure were recommended to be considered in forthcoming airtightness regulations.
While investigating the airtightness through the light concrete chimney elements, T.O. Relander [48] found out that better airtightness results can be achieved if the chimney is installed near the wall or in the wall corner because the external surface of the chimney through which air can penetrate will be reduced. External surface finishing workmanship and the materials used also influence the airtightness.
In the study [49], the energy performance of a school building before major renovation planning was modelled using the energy simulation software IDA ICE. The annual simulation indicated the following renovation measures with the best potential: improved envelope airtightness, changing to energy-efficient windows, new controls of the HVAC system, and improved outer wall thermal insulation.
Some articles have weaker relation to our research because the airtightness problem appears there as one among the other research aspects. The researchers investigate the association of the building envelope tightness, its improvements, and ventilation with relative humidity and air distribution in buildings [50,51], discuss the reasonable building airtightness level to seek for [52], the airtightness and thermal defect detection using thermographic research and image processing [53], the impact of airtightness of window and door openings, more stringent requirements for the products [54,55], point out very contrasting air leakage rates of some structural joints [56], the effect of airtightness when investigating the relation of the energy performance, and the indoor air quality performance [57].
The review of the recent studies helped to shed some light on the research hypothesis and formulate an adequate approach to the problem of airtightness influence on the energy performance of the particularly widely spread type of buildings. What did we expect, what did we find in the publications on the one hand, and what was subsequently visually observed, instrumentally measured, recorded, and computed from the field on the other hand speaking more generally? After the extensive review of research results, one can safely assert that the characteristics of the building airtightness or air permeability have a significant influence on the building’s energy behaviour. At the same time, it was evident both from the theoretical review and from the field measurements that the nature of these properties is characterized by a rather wide distribution of the values, despite the same construction and material of the building. One of the main reasons revealed in most of the papers and confirmed in the field is the quality of the workmanship. This generalization led to the idea of limiting the diversity of the workforce on the construction site by choosing for the investigation the buildings constructed only by the same company. Furthermore, previous studies have covered a wide range of technical factors with the discussion about their influence on airtightness (as power supply installation). The analysis of recent studies in this regard helped to focus on the aspects discussed in the next chapters.
The literature review encouraged the formation of the research methodology, as well as the logic of its process. It was apparent that the starting point should be the experimental airtightness measurements of separate flats, as the logical architectural building parts with the aim to check the hypothesis that the flats in different locations of the building could have different airtightness values. The literature provided no definite answer to this question. Airtightness-related heat loss values (expressed in percentage) provided in the papers were presented in a rather wide range (not exact), or the data came from buildings of different structures, materials, and typology. Afterwards, it would be possible to theoretically calculate the heat loss of the flats with their subsequent evaluation of compliance with the design energy performance class. More details about the research process are provided in Section 3.2.
The standard methodology of energy performance calculation was also modified based on the analysis of literature sources in the part of the heat loss differences evaluation between the equal floor area flats situated in different parts of the building. It was appropriate to undervalue the formula member for solar radiation, considering the environmental factors described in Section 3.3 in more detail.

3. Methods

3.1. Buildings under Investigation

Relatively new buildings constructed in the period between 2016 and 2019 were chosen for the research. At this time, the new requirements demanding not lower than class A energy performance for newly designed and built buildings were introduced, and airtightness measurements became mandatory in Lithuania. More than 200 measurements were implemented in this research in sum (Figure 1).
All the buildings and flats were divided into groups using several factors:
  • According to the situation of the flat in the building plan: the flats with the end location in the building and the flats with the inside location when they are surrounded by the two adjacent flats.
  • According to the floor area of flats: the largest group included the flats with a floor area of 90–120 m2, the second group of 150 m2 area, and the largest flats exceeded the floor area of 200 m2.
  • According to the structural material of the walls: the buildings of the first group were constructed of sand–lime blocks, the buildings of the second group had the walls erected of hollow clay masonry units.
  • According to the insulation level of structures: one group of the buildings that were designed as class A energy performance housing had the 200–220 mm polystyrene (EPS) insulation layer, the other group of buildings that were declared as the class A+ energy performance dwelling had the 240–260 mm polystyrene (EPS) insulation, and the most energy-efficient buildings of the class A++ were insulated with the 280–310 mm polystyrene (EPS) layer.
The main characteristics of the buildings are provided in Table 1.
All the buildings were equipped with energy-efficient plastic windows having two insulated glass units (IGU) with selective glass coating. All the windows had appropriate construction inserts positioning window frames in the range of the wall insulation layer and in that way minimizing the linear thermal bridges of the window jambs. The roof load-bearing structures were made of hollow prefabricated reinforced concrete slabs insulated with polystyrene (EPS), the thickness of which was determined by building design energy class. The floor structures consisted of the most commonly applied layers: reinforced concrete, insulation, and damp proofing. All the buildings were two-level houses. Their heights ranged from 6.25 m to 6.35 m, although the internal ceiling height of the premises remained constant at 2.7 m. Therefore, this geometric peculiarity had no significant impact in our opinion neither on heat energy loss nor on the airtightness of the buildings. The buildings chosen for the research had the same engineering system equipment: the heat source was the heat pump with the floor heating system, all the flats had the same natural ventilation system. These choices allowed to eliminate the occurrence of possible airtightness defects in different equipment mounting places or installations, such as intersections of ventilating equipment piping with the walls or different heat sources. To reduce the influence of construction works quality to airtightness measurements as much as possible [21,22,23,24,25,31,33], only the buildings constructed by the same construction enterprise were chosen.

3.2. Measurement Methods

The principal scheme of the whole research process is provided below (Figure 2), followed by a detailed explanation of the steps.
The airtightness measurements were performed in all flats of the terraced houses analysed. The airtightness values of the premises were determined according to the standard measurement method (LST EN 13829). As stated by this method, all windows of the building were fully closed, the natural ventilation channels were properly glued, and all internal doors were opened to let the air inside and distribute easily in the flat. The measurements were implemented using Blower Door Model 4 equipment with the following technical specifications: measurement precision ±3%, measurement uncertainty 8.3%. The obtained results were statistically processed to get the average values for separate building groups and define possible dependencies on the flat location in the building.
There are mandatory requirements for the airtightness value of buildings, and the energy performance class of every newly designed building cannot exceed the predefined value. In case the building does not meet the airtightness requirements, it should be classified as belonging to the lower energy performance class. As the required airtightness cannot be achieved in a smaller part of buildings, the related defects must be recorded and rectified. For this purpose, the infrared (IR) research was performed using the FLIR ThermaCAM B640 infrared camera with measurement precision of 2% or 2 °C. All research was performed in the winter period when the temperature difference between the internal and external air was about 15–20 °C.
To examine the leaks of the building envelopes the infrared camera research was done twice. At the initial stage, there the temperature measurements were obtained on the surface in the natural conditions without creating an additional pressure difference. Afterward, in order to identify the main leakage locations a 50 Pa pressure difference between the outside and inside air in the rooms was created by means of airtightness equipment and the internal wall surface temperature was measured. There was an alteration of the internal surface temperatures compared to assess the tightness of the structures and to find out if the temperature differences are normal. There were two goals to perform the infrared research: first, to identify the problematic places that do not meet the tightness requirements in the buildings, and subsequently to implement corrective actions by repairing the defects and achieving the desired airtightness level, and second, to statistically evaluate the obtained results in order to determine in what type of buildings the most frequent problems were met.

3.3. Building Energy Performance Assessment Methods

The main requirements of building energy performance related to EPBD (European Energy Performance of Buildings Directive) [1,2] are described in Building Technical Regulation STR 2.01.02: 2016 [58]. Using the building energy consumption evaluation methodology with the application of outside temperatures derived from many years of observations, it is accepted that the duration of the heating season exceeds 220 days, the average outside temperature of the heating season is 0.6 °C, and the inside temperature of the premises is 20 °C. The index of total heat energy loss calculated per 1 m2 heated area of building throughout the year is one of the assessment criteria used in the said methodology. In general, it can be expressed by the following equation:
Q s u m = Q e n v + Q v e n t + Q d o + Q i n f Q e Q i ŋ h . s . + Q E + Q h . w .
where: Q e n v is the calculated heat loss through building envelope for 1 m2 of heated floor area throughout the year, kWh/m2·year;
  • Q v e n t is the calculated energy consumption for ventilation, kWh/m2·year;
  • Q d o is the calculated heat loss due to entrance door opening, kWh/m2·year;
  • Q i n f is the calculated heat loss due to excessive air infiltration through windows and external doors, kWh/m2·year;
  • Q e is the heat gain in the building due to solar radiation, kWh/m2·year;
  • Q i is the heat gain from internal heat sources, kWh/m2·year;
  • Q E is the annual electricity consumption, kWh/m2·year;
  • Q h . w . is the annual energy consumption from domestic hot water, kWh/m2 year;
  • ŋ h . s . is the efficiency coefficient of building heating system, in part of a unit.
The aim was to evaluate the differences between the heat energy loss of the flats located in different parts of the same type buildings. Some of the formula components may be underestimated considering all the flats are operated in equal conditions. These components include heat loss because of external door opening, natural ventilation, electric power, and domestic hot water consumption. Since all the flats are designed with almost identical transparent enclosures, the heat increase resulting from direct solar radiation through the windows can be assessed as being the same.
Minor exceptions can be found in some rear facades of the end units. Because of different architectural solutions, some of these facades have one additional window with an area of around 2 m2. Therefore, during the thorough investigation of the buildings, some circumstances were found in this particular context of the built environment: most of the facades in question were not fully exposed to solar radiation for a longer time because of their shadowing by existing trees and buildings, most of the walls had East and West orientation, a large part of these windows were equipped with roller shutters, and a number of the flats did not have the additional window at all. Because of these factors substantially diminishing the solar heat energy gains, all end units were considered as solar radiation invariant in this research.
Excluding all these components mentioned above, the difference of the heat energy loss between the flats of different locations may be represented as:
Q sum ( difference ) = Q env   ( difference )   +   Q inf   ( difference )
where:
Q env = 0 . 001 · t m · 24 A p · ( θ iH - θ e , m ) · x = 1 n ( A env · U env )
and
Q inf = 0 . 001 · t m · 24 · ρ air · c air · v inf , m · ( θ iH - θ e , m )
where:
  • tm is the number of days for the appropriate month of the year;
  • Ap is the heated area of the building, m2;
  • θiH is the internal temperature of the building during the heating season °C;
  • θe,m is the average air temperature of the appropriate month, °C;
  • Aenv is the area of the building envelope, m2;
  • Uenv is the U-value of the building envelope, W/m2·K;
  • ρair is the air density, kg/m3
v inf , m = 0 . 25 · n 50 · ( 0.75 · ρ a i r 2 · 50 · ( 0.9 · v w i n d , m ) 2 ) n · V p . n 50   A p
where:
  • n 50 is the air exchange value of the building, h−1;
  • v w i n d , m is the average wind speed of the month, m/s;
  • V p . n 50 is the volume of heated premises of the building, m3.

4. Results

4.1. Analysis of Building Airtightness

The airtightness of buildings is very much dependent on the quality of construction works and even the small mistakes can lead to significant differences in airtightness; therefore, the evaluation of airtightness results was based on the comparison of statistical averages of the flats of the same type (Figure 3).
The recorded results show that the values of airtightness of the flats with the same floor area can vary in a large range reaching the difference up to two times. The analysis of airtightness values of the flats of different floor areas revealed that the statistic average of results gradually decreases with the increase of the floor area of the flat, but the overall measurement scatter remains almost constant. The comparison of the groups of flats of 90 m2 and 200 m2 floor area showed that the average value of airtightness for the flats with larger floor area is 25% smaller. The obtained results can be interpreted as the achievement of better average airtightness measurement result for the flats with a larger floor area and the same time a larger volume. This fact of the better results for larger flats could be explained as a minor defect that has a smaller effect on the general result of the airtightness of the building.
After the study of two material alternatives, such as hollow clay masonry units (also known as ceramic small blocks) (1) and sand–lime blocks (2) used for the construction of external walls, it can be stated that regardless of the floor area, airtightness values for hollow clay masonry walls were higher than the respective values for the more favourable sand–lime block walls. The processed data of the airtightness measurements of the equal-area flats located in different places of the buildings are presented in Table 2. The differences in statistical averages of the measurements reach 7–11%. When interpreting the results, the following reasons can be pointed out regarding this aspect. First, in the case of the structure of hollow clay masonry units, where the bricklaying technology requires only to fill the horizontal seams of the brickwork with the mortar, the air can circulate easier through many empty vertical seams in the wall. Second, in the case of hollow clay units, the air can circulate more freely in the structure because of the internal hollows of the elements. In addition, uncontrollable air can enter the room through the openings made for the installation of electric outlets through the other hollows that were not carefully tightened, and thus increase the air leakage in the building.
Additional information about this issue will also be given in the next chapter which concerns thermographic photo research.
A graphical illustration of the contrast of airtightness distribution data for end and inside units in the buildings with the walls of sand–lime blocks is shown below (Figure 4).
The general analysis and comparison of the data shows that the average values of airtightness in end units are 20% higher than the values in inside units of the same type.
Based on the research results, mathematical dependencies were derived to be used for the forecasting of airtightness values for the flats with various floor areas (Figure 5).
R-squared (R2) value in both flat location cases is close to 1, which indicates a high predictive quality of these models.
The comparison of statistical airtightness measurement data with the main metrics n 50 (h−1), mainly of small and medium-size low-rise residential buildings along with the national regulation values from various countries, is provided below (Table 3). The juxtaposition of earlier and the newest data show an improvement in airtightness quality in recent years in Lithuania. Another noticeable trend is better airtightness values of Northern European countries and Canada, despite various construction periods of buildings. Airtightness in countries such as the UK and Ireland seems to be worse because of a very broad period of the building samples. Interesting outstanding results were obtained from a study of relatively new Passive House buildings in Germany.
Relatively large standard deviation values of airtightness measurements can be noticed in some lines of the summary above. One of the implicit main reasons for this could be the broad construction period of buildings examined in the studies. The other significant factor is the relatively high airtightness limit value indicated in the regulation or the absence of any definite requirements in some countries. These factors lead to different levels of construction work by different companies and greater inequality of airtightness values.

4.2. Thermographic Photo Research

To determine the reasons for the rather low airtightness of the buildings, thermographic photo research was performed. It revealed the defects related to improper construction works and wrong structural solutions. The most frequently met defects are presented in the diagrams (Figure 6).
The analysis of research results showed that the most popular defect type in the buildings can be associated with improper installation of windows and their technical adjustment. During the assessment process of the buildings of the energy class A, the defects of that kind were recorded in 90% of the cases and in 75–80% of A+ and A++ energy class buildings. The most likely reason and explanation of this finding could be the thicker insulation layer of the envelopes and the opening jambs of higher energy class buildings. A thick insulation layer creates a lengthy way between the internal and external surfaces of construction, and thus stronger resistance to the moving airflow.
The joints of external walls with other parts of the building, such as floor or roof structures, can also be described as important and defect-sensitive and adding to the airtightness of entire structure. This factor can be related to the flats at different locations in the building and having different lengths of joints of these types. It also influences the differences in the airtightness measurement values of differently situated flats.
Evaluation of the junctions and details of electric installation and water pipes showed significant differences in recorded results. In structures made of hollow clay masonry units, the risk of defects in the above-mentioned junctions grows up to 30%. In the envelope structure constructed of hollow clay elements, the external layer of the building products is destroyed when electric outlets are installed and cables are routed. In this way, the interlinked hollows of the building envelope through which air can flow easily are reached. Installation and repair of these elements and their junctions must involve careful insulation, otherwise defects cannot be avoided (Figure 7).

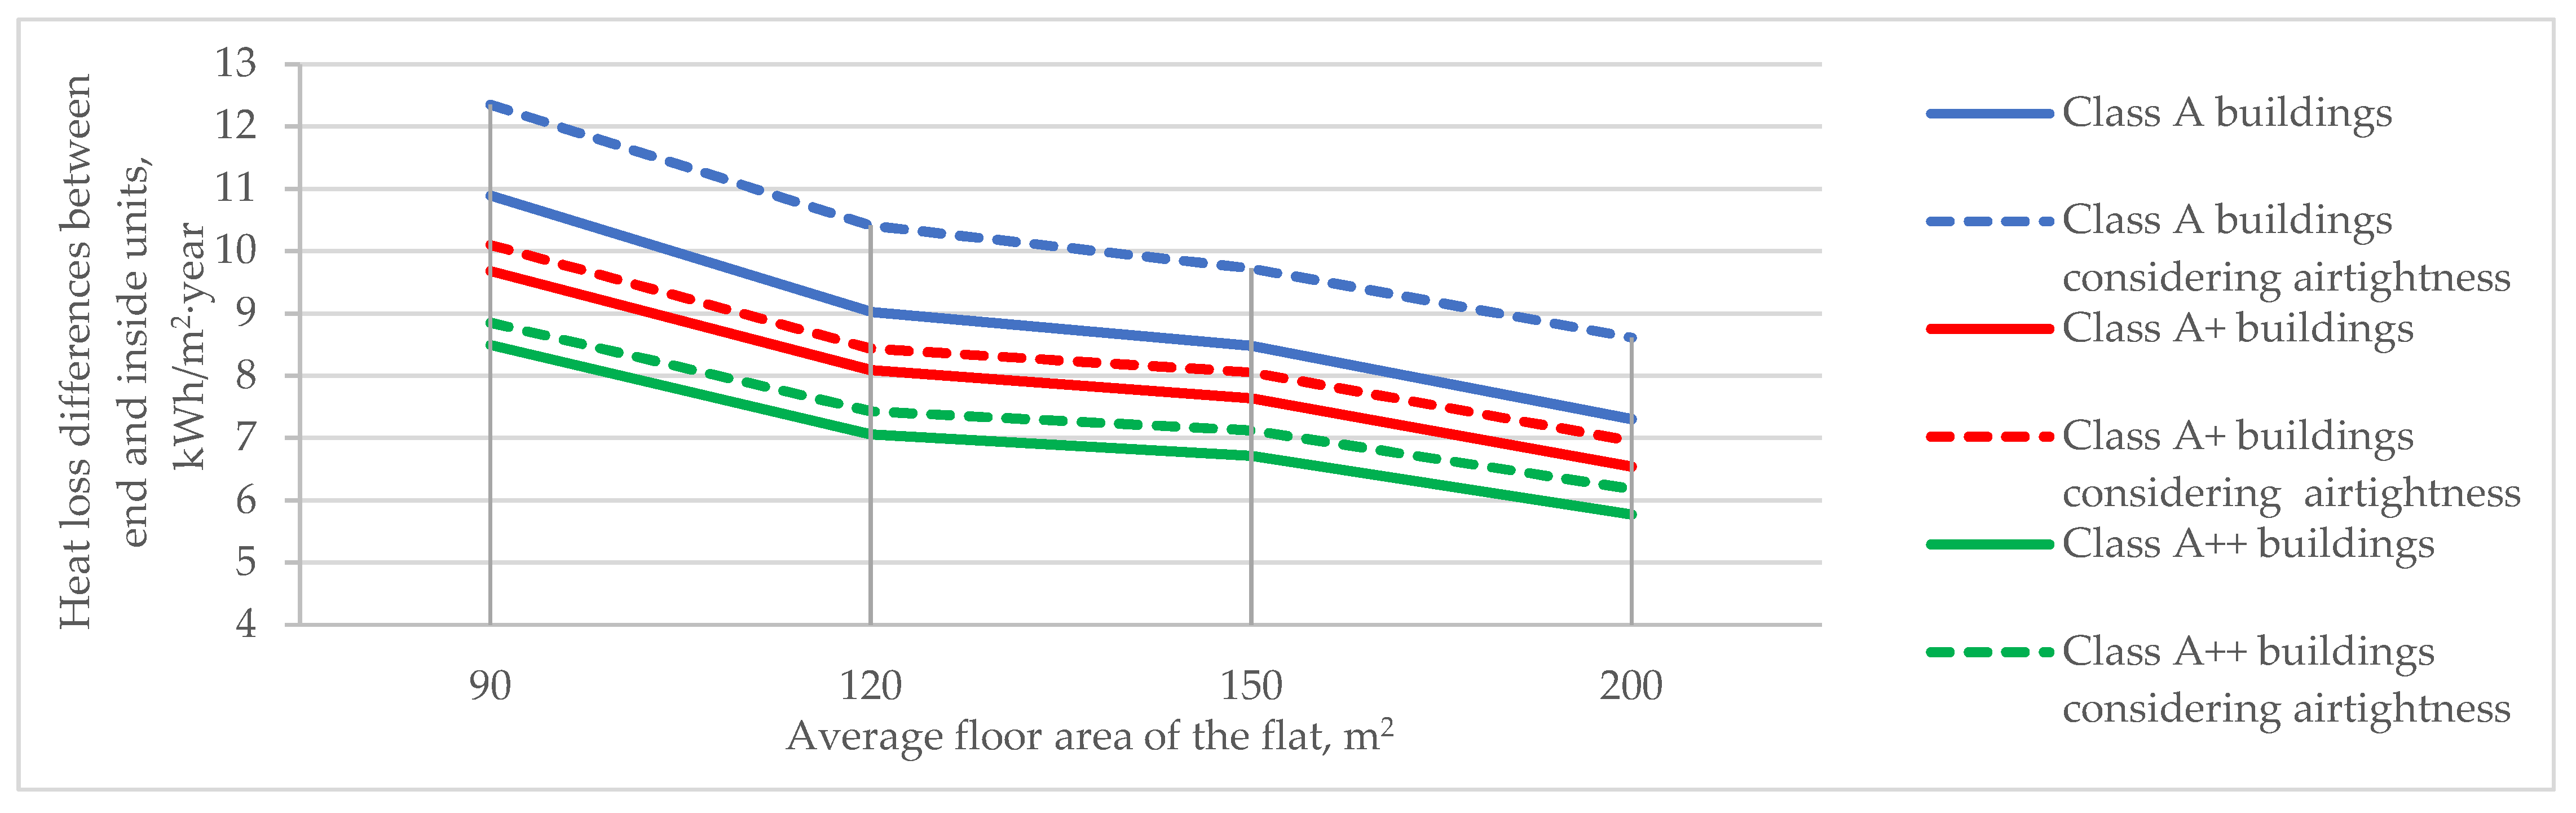
4.3. Analysis of the Heat Loss

Total heat loss through the building envelopes of the flats with different floor areas and various building energy classes calculated per 1 m2 of the heated floor area expressed in kWh/m2 per year depending on the location of the flat in the building plan are presented in Table 4.
The analysis of obtained results revealed that a bigger heated floor area leads to higher values of the total heat loss, regardless of the building energy performance class. The explanation could be that the envelope areas increase together with the floor area of the flats and the heat loss is directly related to the size of the envelope area.
The assessment of the influence of different locations in the building plan of flats with the same floor area showed that the total heat loss through the building envelopes calculated per 1 m2 of heated floor area and expressed in kWh/(m2·year) is around 9–12% higher for the end units compared to the middle units (Figure 8). The distance between the chart lines for lower energy performance building of class A (blue colour) is bigger than respective distances for the buildings of higher classes A+ and A++ (red and green colours). Accordingly, the heat loss increases calculated as differences between the values considering air infiltration and despite air infiltration are different: for the class A it makes approximately 12% and for the classes A+ and A++ it makes about 4%. This fact is logical evidence that better thermal insulation of the building contributes to higher airtightness values.
The two above-mentioned tendencies remain, regardless of the material of the flat wall structure.
Generally, the total heat loss difference considering air infiltration per 1 m2 of heated floor area (kWh/(m2 per year)) between the end units and inside units can exceed 15% because of the different airtightness of these flats.
Currently, the compliance with the allowable value of heat loss is assessed by examining the volume of the entire building in its design stage. The heat loss criterion is difficult to meet in the process of energy certification when there is a need or opportunity to assess individual flats or other logical architectural parts.
Figure 9 shows the average design values of heat energy loss for different flats and their comparison with the corresponding limit values prescribed by the regulation. The dwellings that exceed these limit values should be assigned to a lower energy performance class, i.e., moved one class down in the classification.
The results also show that all inside units of the investigated buildings meet the heat loss requirement, regardless of their design class. Therefore, the assessment of the end units shows that some of them would exceed the allowable limit, which would lead to downshifting their energy class. To avoid these problems, it would be reasonable to plan improvement measures for end units, which include both additional airtightening and thermal insulation, already on the design stage.

5. Conclusions

Airtightness as an important factor, together with other complex design solutions, can reduce heat energy expenses, increase thermal comfort, and ensure a healthy building environment and its longevity. Airtightness as a property is dependent on human factors, technical solutions, and materials, therefore it will differ in every single case.
Only the buildings constructed by the same construction company were investigated in the research. Nevertheless, the difference of airtightness values measured in the flats of the same category was twice as high. Most researchers underline the aspects related to the construction work quality. Therefore, the average values of the entire building group, but not separate measurements, should be used for the assessment of airtightness values of separate building groups.
The average airtightness value differences collating the smallest and the largest flats exceeded approximately 25%. This can be explained by the fact that local air leakages or minor construction defects of larger flats statistically had less influence on the general airtightness, understood as the air exchange speed in the premises.
Evaluating the buildings constructed of different types of brickwork, it is safe to state that the building’s airtightness values depend on the material structure of the chosen brickwork as well as on bricklaying technology and proper installation of engineering systems. When the construction of hollow clay masonry units is chosen where the bricklaying technology involves the filling of horizontal brickwork seams with mortar, the air can circulate through many open voids in the wall. The comparison of the hollow clay unit masonry structure with the solid sand–lime block masonry, the seams of which are filled with mortar both vertically and horizontally, revealed the airtightness reduction of ceramic structure around 7–11% on average.
The comparison of the airtightness measurement results for the flats of equal floor area located at different places of the buildings showed up to 20% higher airtightness measurement values for end units than in inside units, which is a significant difference. The reasons for these value differences could be explained by a larger length of structural joints in the end units. The longer structural joints and additional windows in the walls of the end units cause the higher probability of the emergence of defects worsening the general result.
The obtained results show that all the dwellings surveyed did not exceed the allowable heat loss limits when the total heat loss of the inside units was assessed. As for the end units, we see that most of them, especially the ones in the buildings belonging to higher energy classes A+ and A++, exceed the heat loss limits prescribed for these energy classes. In the further process of real estate development and design of terraced houses, they should be assessed not as a single object, but as a whole consisting of separate units, where each unit should meet the heat loss requirements.
Continuing the research, the role of airtightness should be extended to overall building energy performance assessment by combining and incorporating comprehensive experimental test results, database data, and simulation that could lead to more precise and reliable results and give the opportunity to verify them.

Author Contributions

Conceptualization, V.P., G.C., J.M. and M.D.; methodology, V.P. and M.D.; software, V.P., G.C. and J.M.; validation, V.P., G.C. and J.M.; formal analysis, V.P. and G.C.; investigation, V.P.; resources, V.P. and M.D.; data curation, V.P.; writing—original draft preparation, V.P. and G.C.; writing—review and editing, V.P., G.C. and J.M.; visualization, V.P.; supervision, V.P., G.C. and J.M.; project administration, V.P. All authors have read and agreed to the published version of the manuscript.

Funding

This research received no external funding.

Institutional Review Board Statement

Not applicable.

Informed Consent Statement

Not applicable.

Data Availability Statement

Data sharing not applicable.

Conflicts of Interest

The authors declare no conflict of interest.

References

  1. Directive 2002/91/EC of the European Parliament and of the Council of 16 December 2002 on the Energy Performance of Buildings; European Parliament: Brussels, Belgium, 2002.
  2. Directive 2010/31/EU of the European Parliament and of the Council of 19 May 2010 on the Energy Performance of Buildings (Recast); European Parliament: Brussels, Belgium, 2010.
  3. Energy Efficiency of Buildings—Calculation of the Energy Needs, Delivered Energy and Primary Energy for Heating, Cooling, Ventilation, Domestic Hot Water and Lighting; DIN V 18599; German Institute for Standardization: Berlin, Germany, 2007.
  4. Gonzalez, A.B.R.; Diaz, J.J.V.; Caamano, A.J.; Wilby, M.R. Towards a universal energy efficiency index for buildings. Energy Build. 2011, 43, 980–987. [Google Scholar] [CrossRef]
  5. Jaraminienė, E. Air Infiltration in Buildings with Uncertainty Analysis. Ph.D. Thesis, Vilnius Gediminas Technical University, Vilnius, Lithuania, 2008. (In Lithuanian). [Google Scholar]
  6. Venckus, N.; Bliūdžius, R.; Endriukaitytė, A.; Parasonis, J. Research of low energy house design and construction opportunities in Lithuania. Technol. Econ. Dev. Econ. 2010, 16, 541–554. [Google Scholar] [CrossRef]
  7. Relander, T.-O.; Holøs, S.B.; Thue, J.V. Airtightness estimation—A state of the art review and an en route upper limit evaluation principle to increase the chances that wood-frame houses with a vapour- and wind-barrier comply with the airtightness requirements. Energy Build. 2012, 54, 444–452. [Google Scholar] [CrossRef]
  8. Younes, C.; Shdid, C.A. A methodology for 3-D multiphysics CFD simulation of air leakage in building envelopes. Energy Build. 2013, 65, 146–158. [Google Scholar] [CrossRef]
  9. Wang, L.; Chen, Q. Validation of a coupled multizone-CFD program for building airflow and contaminant transport simulations. HVAC R Res. 2007, 13, 267–281. [Google Scholar] [CrossRef]
  10. Chan, W.R.; Joh, J.; Sherman, M.H. Analysis of air leakage measurements of US houses. Energy Build. 2013, 66, 616–625. [Google Scholar] [CrossRef]
  11. Montoya, M.I.; Pastor, E.; Carrié, F.R.; Guyot, G.; Planas, E. Air leakage in Catalan dwellings: Developing an airtightness model and leakage airflow predictions. Build. Environ. 2010, 45, 1458–1469. [Google Scholar] [CrossRef] [Green Version]
  12. Hassan, O.A. An alternative method for evaluating the air tightness of building components. Build. Environ. 2013, 67, 82–86. [Google Scholar] [CrossRef]
  13. International Organization for Standardization (ISO). EN ISO 9972:2015—Thermal Performance of Buildings–Determination of Air Permeability of Buildings–Fan Pressurization Method; International Organization for Standardization: Geneva, Switzerland, 2015. [Google Scholar]
  14. Feijó-Muñoz, J.; Poza-Casado, I.; González-Lezcano, R.A.; Pardal, C.; Echarri, V.; De Larriva, R.A.; Fernández-Agüera, J.; Dios-Viéitez, M.J.; Del Campo-Díaz, V.J.; Calderín, M.M.; et al. Methodology for the study of the envelope airtightness of residential buildings in Spain: A case study. Energies 2018, 11, 704. [Google Scholar] [CrossRef] [Green Version]
  15. Kalamees, T.; Kurnitski, J.; Jokisalo, J.; Eskola, L.; Jokiranta, K.; Vinba, J. Measured and simulated air pressure conditions in Finnish residential buildings. Build. Serv. Eng. Res. Technol. 2010, 31, 177–190. [Google Scholar] [CrossRef]
  16. Sfakianaki, A.; Pavlou, K.; Santamouris, M.; Livada, I.; Assimakopoulos, M.-N.; Mantas, P.; Christakopoulos, A. Air tightness measurements of residential houses in Athens, Greece. Build. Environ. 2008, 43, 398–405. [Google Scholar] [CrossRef]
  17. Becker, R. Air leakage of curtain walls—diagnostics and remediation. J. Build. Phys. 2010, 34, 57–75. [Google Scholar] [CrossRef]
  18. Kovanen, K.A.; Laamanen, J.; Kauppinen, T.; Duanmu, L. Air tightness of new residential buildings in Finland. In Proceedings of the 6th International Symposium on Heating, Ventilating and Air Conditioning, Nanjing, China, 6–9 November 2009; pp. 207–213. [Google Scholar]
  19. Lucchi, E. Non-invasive method for investigating energy and environmental performances in existing buildings. In Proceedings of the 27th Conference on Passive and Low Energy Architecture, Louvain-la-Neuve, Belgium, 13–15 July 2011; pp. 571–576. [Google Scholar]
  20. Lucchi, E.; Pereira, L.D.; Andreotti, M.; Malaguti, R.; Cennamo, D.; Calzolari, M.; Frighi, V. Development of a compatible, low cost and high accurate conservation remote sensing technology for the hygrothermal assessment of historic walls. Electronics 2019, 8, 643. [Google Scholar] [CrossRef] [Green Version]
  21. Kalamees, T.; Alev, Ü.; Pärnalaas, M. Air leakage levels in timber frame building envelope joints. Build. Environ. 2017, 116, 121–129. [Google Scholar] [CrossRef]
  22. Pereira, P.F.; Almeida, R.M.S.F.; Ramos, N.M.M.; Sousa, R. Testing for building components contribution to airtightness assessment. In Proceedings of the 35th AIVC Conference Ventilation and airtightness in transforming the building stock to high performance, Poznań, Poland, 24–25 September 2014. [Google Scholar]
  23. Sinnott, D.; Dyer, M. Air-tightness field data for dwellings in Ireland. Build. Environ. 2012, 51, 269–275. [Google Scholar] [CrossRef]
  24. Vinha, J.; Manelius, E.; Korpi, M.; Salminen, K.; Kurnitski, J.; Kiviste, M.; Laukkarinen, A. Airtightness of residential buildings in Finland. Build. Environ. 2015, 93, 128–140. [Google Scholar] [CrossRef] [Green Version]
  25. Fernández-Agüera, J.; Domínguez-Amarillo, S.; Sendra, J.J.; Suárez, R. An approach to modelling envelope airtightness in multi-family social housing in Mediterranean Europe based on the situation in Spain. Energy Build. 2016, 128, 236–253. [Google Scholar] [CrossRef]
  26. Jokisalo, J.; Kurnitski, J.; Korpi, M.; Kalamees, T.; Vinha, J. Building leakage, infiltration, and energy performance analyses for Finnish detached houses. Build. Environ. 2009, 44, 377–387. [Google Scholar] [CrossRef]
  27. Khemet, B.; Richman, R. A univariate and multiple linear regression analysis on a national fan (de) Pressurization testing database to predict airtightness in houses. Build. Environ. 2018, 146, 88–97. [Google Scholar] [CrossRef]
  28. Pinto, M.; Viegas, J.; de Freitas, V.P. Air permeability measurements of dwellings and building components in Portugal. Build. Environ. 2011, 46, 2480–2489. [Google Scholar] [CrossRef] [Green Version]
  29. Alfano, F.D.A.; Dell’Isola, M.; Ficco, G.; Tassini, F. Experimental analysis of air tightness in Mediterranean buildings using the fan pressurization method. Build. Environ. 2012, 53, 16–25. [Google Scholar] [CrossRef]
  30. Lee, D.-S.; Jeong, J.-W.; Jo, J.-H. Experimental study on airtightness test methods in large buildings; proposal of averaging pressure difference method. Build. Environ. 2017, 122, 61–71. [Google Scholar] [CrossRef]
  31. Prignon, M.; Van Moeseke, G. Factors influencing airtightness and airtightness predictive models: A literature review. Energy Build. 2017, 146, 87–97. [Google Scholar] [CrossRef]
  32. Pan, W. Relationships between airtightness and its influencing factors of post-2006 new-build dwellings in the UK. Build. Environ. 2010, 45, 2387–2399. [Google Scholar] [CrossRef]
  33. Gillott, M.C.; Loveday, D.L.; White, J.; Wood, C.J.; Chmutina, K.; Vadodaria, K. Improving the airtightness in an existing UK dwelling: The challenges, the measures and their effectiveness. Build. Environ. 2016, 95, 227–239. [Google Scholar] [CrossRef] [Green Version]
  34. Kraus, M.; Charvatova, P. Location as a determinative factor of building airtightness. Procedia Eng. 2016, 161, 1532–1537. [Google Scholar] [CrossRef] [Green Version]
  35. Bhandari, M.; Hun, D.; Shrestha, S.; Pallin, P.; Lapsa, M. A simplified methodology to estimate energy savings in commercial buildings from improvements in airtightness. Energies 2018, 11, 3322. [Google Scholar] [CrossRef] [Green Version]
  36. Ji, K.-H.; Shin, H.-K.; Han, S.; Jo, J.-H. A statistical approach for predicting airtightness in residential units of reinforced concrete apartment buildings in Korea. Energies 2020, 13, 3598. [Google Scholar] [CrossRef]
  37. Wójcik, R.; Kosinski, P. Seeming air tightness of construction partitions. Energy Procedia 2015, 78, 1519–1524. [Google Scholar] [CrossRef] [Green Version]
  38. Tanyer, A.M.; Tavukcuoglu, A.; Bekboliev, M. Assessing the airtightness performance of container houses in relation to its effect on energy efficiency. Build. Environ. 2018, 134, 59–73. [Google Scholar] [CrossRef]
  39. Pasos, A.V.; Zheng, X.; Smith, L.; Wood, C. Estimation of the infiltration rate of UK homes with the divide-by-20 rule and its comparison with site measurements. Build. Environ. 2020, 185, 107275. [Google Scholar] [CrossRef]
  40. Cuce, E. Role of airtightness in energy loss from windows: Experimental results from in-situ tests. Energy Build. 2017, 139, 449–455. [Google Scholar] [CrossRef]
  41. Fine, J.P.; Gray, J.; Tian, X.; Touchie, M.F. An investigation of alternative methods for determining envelope airtightness from suite-based testing in multi-unit residential buildings. Energy Build. 2020, 214, 109845. [Google Scholar] [CrossRef]
  42. Krstic, H.; Istoka Otkovic, I.; Todorovic, G. Validation of a model for predicting airtightness of residential units. Energy Procedia 2015, 78, 1525–1530. [Google Scholar] [CrossRef] [Green Version]
  43. Bramiana, C.N.; Entrop, A.G.; Halman, J.I.M. Relationships between building characteristics and airtightness of Dutch dwellings. Energy Procedia 2016, 96, 580–591. [Google Scholar] [CrossRef] [Green Version]
  44. Mortensen, L.H.; Bergsøe, N.C. Air tightness measurements in older Danish single-family houses. Energy Procedia 2017, 132, 825–830. [Google Scholar] [CrossRef]
  45. Miszczuk, A. The level of airtightness in energy-efficient single-family houses in Poland. Procedia Eng. 2016, 153, 461–466. [Google Scholar] [CrossRef] [Green Version]
  46. Jia, Y.; Duanmu, L.; Liu, Y.; Dong, H. Air infiltration rate of typical zones of public buildings under natural conditions. Sustain. Cities Soc. 2020, 61, 102290. [Google Scholar] [CrossRef]
  47. Miszczuk, A.; Heim, D. Parametric study of air infiltration in residential buildings—The effect of local conditions on energy demand. Energies 2021, 14, 127. [Google Scholar] [CrossRef]
  48. Relander, T.-O.; Heiskel, B.; Tyssedal, J.S. The influence of the joint between the basement wall and the wood-frame wall on the airtightness of wood-frame houses. Energy Build. 2011, 43, 1304–1314. [Google Scholar] [CrossRef]
  49. Englund, J.S.; Cehlin, M.; Akander, J.; Moshfegh, B. Measured and simulated energy use in a secondary school building in Sweden—A case study of validation, airing, and occupancy behaviour. Energies 2020, 13, 2325. [Google Scholar] [CrossRef]
  50. Prasauskas, T.; Martuzevicius, D.; Kalamees, T.; Kuusk, K.; Leivo, V.; Haverinen-Shaughnessy, U. Effects of energy retrofits on indoor air quality in three Northern European countries. Energy Procedia 2016, 96, 253–259. [Google Scholar] [CrossRef] [Green Version]
  51. Carlsson, M.; Touchie, M.; Richman, R. Investigating the potential impact of a compartmentalization and ventilation system retrofit strategy on energy use in high-rise residential buildings. Energy Build. 2019, 199, 20–28. [Google Scholar] [CrossRef]
  52. Papadopoulos, A.M. Forty years of regulations on the thermal performance of the building envelope in Europe: Achievements, perspectives and challenges. Energy Build. 2016, 127, 942–952. [Google Scholar] [CrossRef]
  53. Cai, W.; Wen, X.; Wang, S.; Wang, L. A real-time detection method of building energy efficiency based on image processing. J. Vis. Commun. Image R. 2019, 60, 295–304. [Google Scholar] [CrossRef]
  54. Gaglia, A.G.; Dialynas, E.N.; Argiriou, A.A.; Kostopoulou, E.; Tsiamitros, D.; Stimoniaris, D.; Laskos, K.M. Energy performance of European residential buildings: Energy use, technical and environmental characteristics of the Greek residential sector –energy conservation and CO2 reduction. Energy Build. 2019, 183, 86–104. [Google Scholar] [CrossRef]
  55. Kim, S.S.; Bae, M.J.; Kim, Y.D. Policies and status of window design for energy efficient buildings. Procedia Eng. 2016, 146, 155–157. [Google Scholar] [CrossRef] [Green Version]
  56. Alev, U.; Antsov, P.; Kalamees, T. Air leakage of concrete floor and foundation junctions. Energy Procedia 2015, 78, 2046–2051. [Google Scholar] [CrossRef] [Green Version]
  57. Heibati, S.; Wahid Maref, W.; Saber, H.H. Assessing the energy and indoor air quality performance for a three-story building using an integrated model, part one: The need for integration. Energies 2019, 12, 4775. [Google Scholar] [CrossRef] [Green Version]
  58. Design and Certification of Energy Performance of Buildings; STR 2.01.02:2016; Ministry of Environment of Republic of Lithuania: Vilnius, Lithuania, 2016.
  59. Kalamees, T. Air tightness and air leakages of new lightweight single-family detached houses in Estonia. Build. Environ. 2007, 42, 2369–2377. [Google Scholar] [CrossRef]
  60. Hamlin, T.; Gusdorf, J. Airtightness and Energy Efficiency of New Conventional and R-2000 Housing in Canada; The CANMET Energy Technology Centre (CETC), Energy Technology Branch, Natural Resources Canada: Ottawa, ON, Canada, 1997. [Google Scholar]
  61. Chen, S.; Levin, M.D.; Li, H.; Yowargana, P.; Xie, L. Measured air tightness performance of residential buildings in North China and its influence on district space heating energy use. Energy Build. 2012, 51, 157–164. [Google Scholar] [CrossRef]
  62. Hasper, W.; Kirtschig, T.; Siddall, M.; Johnston, D.; Vallentin, G.; Harvie-Clark, J. Long-term performance of Passive House buildings. Energy Effic. 2021, 14, 5. [Google Scholar] [CrossRef]
  63. Šadauskienė, J.; Paukštys, V.; Šeduikytė, L.; Banionis, K. Impact of air tightness on the evaluation of building energy performance in Lithuania. Energies 2014, 7, 4972–4987. [Google Scholar] [CrossRef] [Green Version]
Figure 1. Architectural plan of building with specified types of the flats.
Energies 14 06367 g001
Figure 2. Principal scheme of the research process.
Energies 14 06367 g002
Figure 3. Airtightness measurement distribution for the flats of different floor areas.
Energies 14 06367 g003
Figure 4. Airtightness of buildings with walls of sand–lime blocks, end units (a), and inside units (b).
Energies 14 06367 g004
Figure 5. Dependency diagrams of airtightness and floor area for the end (orange) and inside (blue) units in the sand–lime buildings of energy efficiency class A.
Energies 14 06367 g005
Figure 6. Frequency of defects for hollow clay masonry buildings (a) and sand–lime block masonry buildings (b).
Energies 14 06367 g006
Figure 7. Defects of electric installation influencing the airtightness of construction.
Energies 14 06367 g007
Figure 8. Heat loss differences reflecting the increase of values for end units in comparison with inside units.
Energies 14 06367 g008
Figure 9. Comparison of heat energy loss values with limit values of different flat types.
Energies 14 06367 g009
Table 1. Properties of buildings.
Construction
Type
LocationAverage Floor
Areas, m2
Energy ClassGlazed
Areas, m2
Ventilation
Type
Hollow clay
masonry units
Inside
2
facades
90A, A+, A++12.85Natural
120A, A+, A++17.14Natural
150A, A+, A++19.64Natural
200A, A+, A++24.43Natural
End
3
facades
90A, A+, A++14.35Natural
120A, A+, A++19.14Natural
150A, A+, A++21.43Natural
200A, A+, A++28.57Natural
Sand–lime
blocks
Inside
2
facades
90A, A+, A++12.85Natural
120A, A+, A++17.14Natural
150A, A+, A++19.64Natural
200A, A+, A++24.43Natural
End
3
facades
90A, A+, A++14.35Natural
120A, A+, A++19.14Natural
150A, A+, A++21.43Natural
200A, A+, A++28.57Natural
Table 2. Measurement values of the airtightness of the flats.
Construction
Type
Flat LocationAverage Flat Area, m2Max of
Airtightness n50
(h−1 at 50 Pa)
Min of
Airtightness n50
(h−1 at 50 Pa)
Average Value
of Airtightness n50 (h−1 at 50 Pa)
Hollow clay
masonry units
Inside901.250.710.97
1201.150.620.85
1501.130.490.79
2001.050.490.74
End901.490.891.10
1201.350.761.03
1501.290.700.97
2001.230.630.93
Sand–lime
blocks
Inside901.230.720.89
1201.100.640.78
1500.950.530.70
2000.940.450.67
End901.310.911.04
1201.340.780.97
1501.280.680.91
2001.180.610.85
Table 3. Comparison of statistical airtightness measurement data between previous studies and the current research.
Authors/ReferenceCountryConstruction PeriodAirtightness
n 50 (h−1) Mean Values, Standard Devia-tion or Estimated from Snedecor‘s Rule, Min/Max Values
Limit Airtightness Metrics and Value According to National RegulationNotes
Kalamees [59]Estonia2003–2005 x ¯ , σ
4.9 ± 3.5
q 50 , <6 (single- family)Values are based on results provided in the reference
Hamlin and Gusdorf [60]Canada1921–1997 x ¯ , σ S n
3.1 ± 1
No mandatory regulation requirementValues are based on results provided in the reference
Jokisalo et al. [26]FinlandPre-2007 x ¯ , σ
3.7 ± 2.2
q 50 , <4Values are based on results provided in the reference
Kalamees [59]Norway1984 x ¯ , σ n 50 , <1.5Values are based on results providedin the reference
4.0
Min 3.3
Max 5.4
Alfano et al. [29]Italy1810–2010 x ¯ , σ No mandatory regulation requirementValues are based on the measurement data
7.26 ± 4.02
Min 3.2
Max 23.3
Sfakianaki et al. [16]GreecePre-2007 x ¯ , σ No mandatory regulation requirementValues are based on the measurement data
6.79 ± 3.15
Min 1.87
Max 11.3
Sinnot and Dyer [23]Ireland1944–2008 x ¯ , σ q 50 , <5Values are based on the measurement data
9.64 ± 2.9
Min 5.39
Max 14.9
Chen et al. [61]China1980–1990 x ¯ , σ Values are based on the measurement data
9.8 ± 8.11
Min 1.59
Max 27.16
Pasos [39]UK1900–2012 x ¯ , σ q 50 , <10 Notional recommended value: 5 m3/(h·m2)Values are based on the measurement data
8.39 ± 3.22
Min 3.51
Max 14.97
Kalamees [59]SwedenPre-1978 q 50 , <0.6Values are based on results providedin the reference
x ¯ , σ
3.7 ± 0.24
Hasper [62]Germany2006–2014 x ¯ , σ n 50 < 0.6 for passive houses and <1.5 as a general valueValues are based on passive buildings measurement data
0.50 ± 0.27
Max 1.1
Min 0.18
Sadauskiene et al. [63]Lithuania
Class B
2005–2011 x ¯ , σ n 50
Class B < 1.5;
Class A < 1;
Class A+ and A++ < 0.6
Values are based on the measurement data
6.24 ± 2.63
Max—11.3
Min—2.19
Current researchLithuania
Class A
2016–2019 x ¯ , σ Values are based on the measurements of current research
0.88 ± 0.18
Min 0.618
Max 1.35
Current researchLithuania
Class A+ and
A++
2016–2019 x ¯ , σ
0.62 ± 0.08
Min 0.818
Max 0.479
Notes: “ n 50 air change rate at 50 Pa pressure difference, “ x ¯ ” mean, “ σ ” standard deviation or “ σ S n ” deviation estimated from Snedecor‘s rule. If any value is not indicated it was not available.
Table 4. Total heat energy loss kWh per 1 m2 of the floor area per year of the flats of various size and energy classes, considering where the flat is situated in the building plan.
Average Floor
Areas of the Flats,
m2
Energy
Class
Average Values
of the End Units,
Qsum
(kWh/m2·year)
Average Values
of the Inside Units,
Qsum
(kWh/m2·year)
Difference,
Qsum diferent
(kWh/m2·year)
Difference,
%
90A93.2182.3210.8911.7
A+83.6773.999.6811.6
A++74.0465.558.4911.5
120A84.2775.259.0210.7
A+75.6867.598.0910.7
A++66.9859.927.0610.5
150A79.9471.468.4810.6
A+71.8264.187.6410.6
A++63.5256.816.7110.6
200A77.7770.477.39.4
A+69.8363.296.549.4
A++61.7655.995.779.3
Publisher’s Note: MDPI stays neutral with regard to jurisdictional claims in published maps and institutional affiliations.

