1. Introduction
Sustainable development ([
1,
2,
3]) has been a priority concept for years within the framework of policies within the European Union (EU) and is the basis for formulated development strategies. Next steps for a sustainable European future European action for sustainability [
4] is currently being implemented, setting targets for 2030. This strategy clearly states that actions for sustainable development (SD) consider its three dimensions: economic, social, and environmental, and that they should be considered together. In the implementation of the sustainable development goals (SDG), particular attention is paid to the sustainable energy development (SED) aspect, which is closely related to all three of these dimensions. The areas related to activities undertaken within the framework of sustainable energy development were classified in a very synthetic way in the work [
5]. The authors list the following areas: (1) use of alternative (particularly renewable) energy sources in the energy mix; (2) greenhouse gas and air pollutant emissions reduction (3) energy efficiency improvement. The paper [
5] also points out that they are inextricably linked to the fourth area, which is (4) the quality of life of citizens improvement. Referring to the SD dimensions, it can be pointed out that areas (1) and (2) relate in particular to the environmental dimension. Area (3) is most related to the economic dimension. Eventually, all 3 areas mentioned can also be combined by referring to area (4), which has a social dimension.
Households are particularly immersed in the social dimension of sustainable energy development, mainly because access to energy sources is an indispensable part of their functioning. Household energy consumption is mentioned among the factors affecting living standards [
6]. It is worth noting that not all households can provide themselves with adequate energy, which results in them being at risk of energy poverty [
7,
8]. The elimination of poverty (in its different aspects) is an objective pursued by the sustainable development policy and has become an important element in EU policy [
8]. Moreover, households, as one of the major consumers of energy, can firstly reduce excess energy consumption and secondly increase the share of energy consumption that comes from renewable sources. According to Eurostat data (see [
9]), the share of households (residential sector) in total energy consumption in the European Union in 2018 was 26.3%. This places households among the most important energy consumers.
Determinants of household energy consumption include household income [
10,
11,
12,
13,
14]; energy prices [
15], psychological determinants [
16], climate conditions [
14,
17], household and building socio-economic characteristics [
17], among many others. We are most interested in energy prices in this overview, since to a large extent this seems to be the most controllable factor. In many EU countries, household electricity and gas prices are regulated [
18]. In addition, energy prices are influenced by the inclusion of taxes and other charges. Through such measures, governments can influence the energy price offered to the final consumer, in particular households. Among the factors mentioned above, energy prices are most reflective of energy policy measures in individual countries.
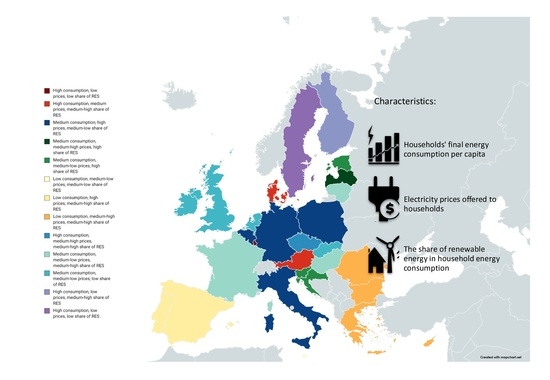
As previously mentioned, households are an important group of final energy consumers. Therefore, the question arises how their situation looks at present in individual countries, considering such features as the level of energy consumption, energy prices offered to households, and the direct use of renewable energy sources in these households. All these characteristics correspond to the International Atomic Energy Agency IAEA indicators [
19], which are used to assess the realization of the SED placed in the economic dimension. However, they can also be linked to other dimensions of SED. In the IAEA list of energy indicators for sustainable energy development, one of the indicators representing the social dimension is the share of household income spent on fuel and electricity. This share depends directly on the amount of energy consumed and on energy prices. As mentioned earlier, energy prices are subject to national energy policies and can be regulated. Therefore, by setting prices, governments have a direct influence on household expenditure on energy.
The level of use of renewable energy sources (also in households) is closely related to the environmental dimension of sustainable development. The energy policy pursued includes a number of incentives and facilitations to support this group of consumers in the process of the so-called energy modernization of households (e.g., subsidies for the installation of solar panels or tax breaks for households carrying out energy modernization). In other words, these measures can influence consumers’ pro-ecological behaviour. It is with pro-ecological behaviour that we identify the share of the use of renewable sources in household energy.
The aim of the presented analysis is to assess similarities and differences between EU countries, considering characteristics based on the selected SED indicators. They are direct use of renewable energy sources in the household (which could represents the pro-ecological behaviour of the consumers), the household’s final energy consumption per capita, and energy prices (represented by electricity prices). Two variables represent the first factor: the share of renewable energy in the final energy consumption and differences between this share and the adopted benchmark level. To simplify the analysis, we take the benchmark level as the national renewable energy consumption levels as written in the Europe 2020 strategy [
20]. The detected similarities and differences will allow characterizing the profiles of the EU countries in terms of the levels of the analysed characteristics.
Energy policy refers, among other things, to the amount of energy consumed at the household level (and the sources used to produce this energy) and its instruments include energy prices. Taking these factors into account will allow for a better characterization of country groups in terms of their energy policy and support for households to adopt pro-ecological behaviour, i.e., to use more renewable energy sources.
Existing studies in the literature tend to focus on one area of sustainability, and there is a lack of research comparing EU countries in terms of combinations of these mentioned three elements (characteristics). This study has the potential to fill this research gap. Furthermore, we focus on the household sector, which is a new approach regarding the analysis of the mentioned SED indicators.
The analysis employs the k-means, which is one of the most popular methods used to data clustering. In turn, the data come from publicly available Eurostat databases and refer to 2018 values.
The paper is divided into seven sections. The first section is the introduction. The second section presents the background (literature review) to the problem studied. The third section is a description of the methods and data used. The fourth section of the part contains the characteristics of the factors analysed in the empirical part. The fifth section contains a description of the results, and the sixth section contains their discussion. The seventh section is a summary of the presented analysis.
2. Literature Review
The report of the World Commission on Environment and Development Our Common Future ([
21] also referred to as the Brundtland Report) is considered crucial for redirecting policy towards sustainable development [
2]. This report defines sustainable development as “sustainable development is development that meets the needs of the present without compromising the ability of future generations to meet their own needs” [
21]. More than 30 years have passed since this report was written, and during this time many countries have tried to pursue policies precisely in the direction of sustainable development. To chart the path and direction of current (ongoing) development, 169 targets were formulated in 2015, grouped into 17 goals. They are presented in the document entitled Transforming our world: the 2030 Agenda for Sustainable Development [
22], called Agenda 2030 for short. It is also worth quoting here the definition of sustainable development given in Encyclopædia Britannica, “Sustainable development is an approach to economic planning that attempts to foster economic growth while preserving the quality of the environment for future generations” [
23]. This definition clearly indicates that the concept of sustainable development has been somehow “imprinted” in the concept of economic development. It should be added that one of the main factors influencing economic development is the use of energy resources. Many studies show a positive correlation between economic development and energy demand or energy use (see discussion [
24,
25,
26,
27,
28]).
Problems related to the energy sector are considered in all dimensions of sustainable development: economic, social, and environmental. A report [
21] explicitly links energy with sustainable development. [
29], citing this report, lists the following elements concerning energy and sustainable development:
- (1)
sufficient growth in energy supply to cover human needs;
- (2)
ensuring energy efficiency and appropriate measures to minimize waste of primary resources;
- (3)
public health and safety relating to the energy resources used;
- (4)
prevention of localized forms of pollution and protection of the biosphere.
In summary, the increasing demand for energy resources, the limited amount of non-renewable raw materials, and the impact of the ways in which energy resources are used on environmental pollution have necessitated a process of so-called energy transition. The energy transition fits into sustainable development primarily through Goal 7 (“Ensure access to affordable, reliable, sustainable and modern Energy for all”) and Goal 13 (“Take urgent action to combat climate change and its impacts”) (see [
22]). The process of sustainable development relating to energy in its broadest sense is called sustainable energy development in the literature ([
24,
29,
30]).
Many indicators are used to monitor sustainable energy development. Among the best known are the indicators developed by the International Atomic Energy Agency IAEA [
19], see also [
31,
32]. It is a set of 30 indicators divided according to SD dimensions: social dimension (4 indicators), economic dimension (16 indicators), and environmental dimension (10 indicators). It is these indicators that became the basis for the construction of the variables used in the presented study. The economic dimension is realized, among others, through energy efficiency [
33]. Its improvement contributes to the energy security of a country and is associated with a reduction in energy demand. Energy end users are both households and individual economic sectors [
34]. In the case of households, such a measure describing the realization of the economic aspect is, among others, total energy consumption. It was also recognized in this paper as a variable representing this area.
The literature is looking for determinants of energy consumption in households because final energy consumption is an important element in the assessment of the aspect of the sustainable energy development. Various economic, social, or psychological factors have been identified.
As household energy consumption can be considered as a determinant of living standards ([
6,
35]), income is an important determinant of energy consumption. At the global level, it breaks down the energy consumption of developed and developing countries ([
36,
37,
38]) and at the household level, by labour income, and social class [
10,
11,
12,
13]. While identifying income as an important factor affecting household final energy consumption, other elements are also highlighted. [
13] additionally pointed out the existence of a large variation in terms of CO
2 emissions among groups with different incomes. The issue of CO
2 emissions is important because, as [
39] indicate, a 1% increase in economic development at the global level results in a 0.76% increase in CO
2 emissions. Efforts to reduce emissions are also directed towards households, e.g., by encouraging energy retrofitting of homes. A key factor here is income ([
35,
40]), which confirmed the existence of a strong relationship between energy consumption and income level, but also indicated the existence of other factors, i.e., type of dwelling, tenure, household composition, and location (rural/urban). The national situation can also influence the income situation of a household. This is particularly noticeable in the case of different crises [
41]. In the case of Greece, the economic situation affected the reduction of energy consumption even in the cold winter. Indeed, many low-income families were at risk of energy poverty.
Another criterion influencing the energy consumption of households is location. In this case, the urban/rural division is usually considered [
36,
42,
43,
44,
45]. It is the development of these areas that largely contributes to increased energy consumption [
12,
45]. Additionally, urbanization processes put pressure on energy supply and the environment. [
46,
47] showed that between 1996 and 2012, urbanization in China contributed to a 15.4% increase in household energy consumption. Variation of energy consumption can also occur at the city level itself [
11]. However, electricity consumption in urban agglomerations is lower than in single-family homes located in dispersed residential areas [
48]. Household energy consumption should therefore be considered at multiple levels [
49]. Another factor influencing energy consumption is at least the number of people in a household. Single-person households are the most burdened group with this distribution [
50].
From the group of socio-economic factors, it is worth mentioning the awareness of the inhabitants, which involves, for example, the appropriate choice of heating appliances [
51]. Studies also indicate that if energy consumption decisions are controlled by a woman, consumption is lowest compared to decisions made by a man or jointly [
52]. Public appeals to reduce energy consumption also influence the awareness of residents [
53]. This is also possible by focusing on a specific income group [
54]. However, each energy feedback has a very different and individual impact on energy consumption [
55]. The exception is when energy costs are included in the housing price. No campaign then provides this incentive to save energy [
56].
Because the determinants of household energy consumption are so many, it is often impossible to account for them all, which means that the variability of energy consumption is not fully explained by the independent variables of household and building characteristics [
57].
In addition to sociological and economic determinants of energy consumption, psychological determinants are also indicated [
16]. These include beliefs and attitudes, intentions and motives, cost–benefit appraisals, social and personal norms. In doing so, some characteristics are local and others national (wind speed, the number of frost-days) or global (e.g., size, building age, population density, number of summer days) [
58].
Energy efficiency and thus energy consumption depends not only on the characteristics of the household itself, but also on the characteristics of the residential building. Thus, the construction of the building and its age, the way the building was designed [
59], or the installation of a new boiler (combining loft insulation and a new efficient boiler) are important here [
60]. Old buildings consume an excessive amount of energy [
61]. However, research [
62] contradicts this finding for China. Studies also confirm the existence of a relationship in residential buildings between energy and various design variables [
63]. It is not the characteristics of the dwelling alone that determine energy consumption; socio-economic factors are important in this regard [
64].
In recent years, a lot of attention has been paid to smart home energy management systems as an important element to support energy management [
65]. They aim to help reduce energy at times of high wholesale prices or high grid loads. The implementation of such systems in different countries is often associated with different opportunities for implementation due to different energy policies or socio-economic factors [
66].
The social aspect of a sustainable energy system will be represented in the research by the energy price. As research indicates, it is one of the determinants of energy consumption and is usually negatively correlated with it [
15]. The literature studies presented above show that there are many factors influencing energy consumption, but it is the price that causes social effects in the case of at least its increase or decrease. Therefore, it was adopted in the paper as a variable representing the social area. Even if consumption is reduced, the quality of life in poorer households changes when energy prices rise. This is because less well-off households are more vulnerable to energy price increases [
67]. Price is therefore understood here in the context of affordability. To prevent this, various solutions for home management algorithms are proposed in the literature that can minimize costs without changing the comfort of the inhabitants [
68].
In the social aspect, price is related to its availability ([
69,
70,
71]), and this in turn influences the choice of fuel type. With it, in turn, comes the appropriate choice of appliance [
72]. The price of energy to the final consumer is influenced by both the wholesale market price and distribution charges [
73]. The price is also determined by the liberalization of the respective market. However, the natural gas and electricity markets are not completely liberalized, thus, prices from international markets are not completely passed on to the consumer [
74].
An important issue here is the price increase that comes with mere availability. This is largely due to the many decisions taken to reduce CO
2 emissions [
75]. The EU CO
2 Emissions Trading Scheme (EU ETS) also has a large influence here. Here, the level and structure of the energy price can be an energy policy tool to improve energy efficiency, mainly in the new Member States. In some EU countries with low levels of energy intensity, taxation is identified as a major factor for price increases [
76].
Energy prices should also be considered from a social perspective in terms of their differentiation. Linked to this is the price elasticity of energy, which refers to the possibility of switching from one energy source to another due to a change in the price of that product. The price elasticity of electricity is higher than that of gas. This means that gas demand is less sensitive to price changes than electricity demand [
77]. This is consistent with the findings described in [
78]. Gas, on the other hand, is an inferior good as the share of money spent on gas decreases as income increases [
77]. For electricity, the existence of income elasticities is also noted [
79]. An increase in household income is likely to translate into an increase in the amount of electrical equipment. However, a greater sensitivity of demand occurs to a change in income than to a change in price. The dependence of electricity demand is negatively correlated with electricity price, gas price, and the presence of elderly people in the household [
80].
As the production, distribution, or use of energy has a negative impact on the environment, the area which combines the social and economic dimensions is the environmental area. In this context, it is important which sources the energy comes from and how it affects the environment. There are many considerations regarding renewable energy itself. It is considered from various aspects such as types of energy and how they compare with each other [
81], incentives for households to use renewable energy [
82,
83,
84], or environmental reasons for its use [
85].
In the case of the linkage between renewable energy and sustainable development goals, studies indicate that strong synergies exist [
86]. The relationship between sustainable development goals and renewable energy sources was investigated in [
87]. The similarity of the share of renewable energy in total consumption for EU countries using the k-means method was also examined in [
88], and the share of renewable energy in total energy consumption and the concentration of total energy consumption and renewable energy was examined in ([
89,
90]). An article that includes indicators from each of the three areas of sustainable development is [
32]. There are theoretical considerations in it, without any empirical research.
As existing studies in the literature tend to focus on a single area of sustainable development and there is a lack of studies comparing EU countries in terms of these three areas, this paper has the potential to fill this research gap.
3. Data and Applied Method
As previously mentioned, the aim of the presented analysis is to assess similarities and differences between EU countries, considering such features as final energy consumption in households per capita, energy prices, and renewable energy use in household energy which is represented by two variables. These characteristics reflect the directions of EU energy policy, which is based on the sustainable development of the energy sector.
We have selected variables for the analysis that can be related to how households in the energy market correspond to indicators of energy sustainability. Moreover, we aim for the data used in the analysis to come from a unified and reliable source. Relating to energy sustainability, we have several indicators available to monitor this process. Particularly noteworthy are the indicators developed by the International Atomic Energy Agency IAEA [
19], see also as well [
31,
32].
Energy use per capita is the first in the IAEA list of indicators relating to energy sustainable development in the economic dimension (it is coded there as ECO1, see [
19], p. 40). In our analysis, we have included energy consumption per capita, but only for households (variable
). The household energy intensities indicator (ECO9) is also included in the mentioned list. It is defined as “amount of total residential energy used per person or household or unit of floor area”. Therefore, assuming that we analyse households’ energy use per capita, our variable represents this indicator directly. It is also worth noting that final energy consumption in households per capita is listed in Eurostat’s list of sustainable development indicators as an indicator under Sustainable Development Goal (SDG) 7
Affordable and clean energy (indicator code sdg_07_20). Eurostat provides information on households’ energy use per country in its main database. Therefore, values are easy to obtain and to convert into a per capita indicator (the data used for the construction of variable
come from the Eurostat databases) [
34,
91].
The group of energy indicators for sustainable development (the economic dimension) also includes energy prices (end-use energy prices by fuel and by sector, indicator code ECO14, see [
19], p. 79). The IAEA defines this indicator as “actual prices paid by final consumer for energy with and without taxes and subsidies”. This indicator can be linked to the indicators for sustainable energy development in the social dimension, namely the share of household income spent on fuel and electricity (SOC2, see [
19], p. 32), as prices directly influence household energy expenditure.
Electricity prices have been included in our analysis. Eurostat only reports prices to households for electricity and natural gas prices. However, gas prices are not reported for three countries: Cyprus, Malta, and Finland. We aim to include all EU countries in the research sample (according to the 2018 composition), therefore the variable
represents only electricity prices (data are taken from the Eurostat database
Electricity prices components for household consumers—annual data (from 2007 onwards)[nrg_pc_204_c], see [
92].
Since 2017, Eurostat also reports total average of electricity prices, so-called all bands prices (without distinguishing between consumption bands). Until the end of 2016, electricity prices were only reported for individual consumption bands (annual consumption bands, for more details see [
93]. The price considered in the presented analysis (variable
) concern 1 kWh and is an average price (given for all bands together). This price includes the following components: energy and supply, network costs, and taxes, fees, levies, and charges.
Among the indicators for sustainable energy development in the economic dimension is the renewable energy share in energy and electricity (ECO13, see [
19], p. 76). It is defined as: “the share of renewable energy in total primary energy supply (TPES), total final consumption (TFC), and electricity generation and generating capacity (excluding non-commercial energy)”. In our analysis we have included a variable that concerns the share of renewable energy in households’ total final energy consumption (variable
, which is based on Eurostat data
Supply, transformation and consumption of renewables and wastes [nrg_cb_rw], see [
91]. A similar indicator is also exchanged among Eurostat’s sustainable development indicators. It is the share of renewable energy in gross final energy consumption by sector (indicator code: sdg_07_40). It is part of the indicators controlling SDG 7 (
Affordable and clean energy) and SDG 13 (
Climate action). Thus, this indicator can also be linked to the environmental dimension of sustainable development.
The potential for renewable energy, both in the household sector and in other sectors, varies among countries. Therefore, it is necessary to have a benchmark to assess the level of renewable energy sources (RES) participation. We decided to introduce one more variable into the analysis, which will concern the difference between the actual current share of RES in the energy consumption of the household sector and some established benchmark (variable
, sources used to determine the value of the variable: [
91] and [
94]). As a benchmark, we adopt the national targets of the share of energy from renewable sources in gross final consumption of energy set for 2020 in Directive 2009/28/EC. Although this target relates to the total final consumption of energy, with no sectoral division, it will also allow us to shed some light on the energy policies pursued in the EU countries—in which direction they are shifting the burden of the energy transition in terms of the use of RES.
It is worth noting that the indicators used in the analysis mainly relate to the economic dimension of SED. However, they are linked to indicators related to the other SD dimensions like social and environmental. This is mainly brought since these three dimensions of SD permeate each other.
In summarizing, the list of variables used in the analysis is as follows:
- (1)
—the households’ final consumption of the energy per capita (kWh);
- (2)
—electricity prices for household consumers (PPS € / kWh) in the i-th country;
- (3)
—the share of energy from renewable sources in the households (%) in the i-th country;
- (4)
—the differences between EU-2020 target of the green energy consumption and the achievement of the target in the 2018 (percentage points—pp):
where:
—the limit of the share of the renewable energy consumption imposed by the Europe 2020 strategy.
The analysis presented in this article concerns data from 2018. The main reason for choosing this period is that a new 4th—climate package (which includes Directive 2019/944/EU and three regulations 2019/943/EU, 2019/941/EU, and 2019/942/EU) was approved in June 2019. Although the regulations introduced by this package enter into force systematically from 2020, it should be noted that national systems have started to adapt to the new rules from that point onwards. Therefore, we consider 2018 as a kind of summary period of the 3rd climate package.
For electricity prices reported by Eurostat in 2018, we have noted some data gaps. These concern the overall price per unit of energy in Spain and the value of the third price component (taxes, fees, levies, and charges) in the case of Germany. We have completed these values from the 2019 data. It is worth noting that in the case of Spain, the 2017–2018 prices (and their components) are not reported in the Eurostat data.
As a research tool, we apply the k-means algorithm ([
95,
96,
97]) implemented in the STATISTICA software. The k-means is nonpattern classification methods. The choice of using nonpattern classification methods data as an analytical tool in our study was dictated by two premises. Firstly, this method allows us to capture statistical similarities and differences between the objects under study (objects located close to each other are considered similar and those located at a considerable distance are considered different). Secondly, this type of analysis is considered a technique related to data mining, which is used when the patterns (of similarity and difference) are not known (as in our case). The k-means, next to the Ward’s method, is one of the classical and most popular methods of data clustering. The k-means represents partitional clustering [
98], p. 533). Such type of clustering is based on the division of the sample into non-overlapping subsamples (clusters). However, each data object (each observation) is allocated to exactly one of the clusters ([
98], pp. 529–530). The literature points to the k-means as the number two ranking of data mining algorithms [
99]. It is listed as the main advantages of the k-means that it is a simple and robust, highly efficient algorithm that can be applied to a wide variety of data [
100], as well as the fact that the results obtained are easy to interpret [
101]. It is also indicated that the algorithm is effective when the number of objects is not large [
102].
This method is unfortunately not without its disadvantages. Firstly, this method requires the number of clusters (k) should be specified in advance [
103]. This problem can be solved by using different internal/relative cluster validity measures [
103,
104,
105,
106]. Secondly, this algorithm does not work well in cases where the clusters are not elliptical [
100], clusters are non-convex shaped. Thirdly, literature indicates that this algorithm is sensitive to outliers [
100]. However, practitioners sometimes apply k-means algorithm to outlier detection [
107].
In the presented analysis we apply the box and whisker plot (see e.g., [
108,
109]) [
109], also called Tukey’s fences approach [
110]. This method is the most popular tool applied for identifying outliers. In the first step, we calculate: interquartile range (
IQR) is defined as the difference between the lower (
) quartile and upper (
) quartile:
. The value of the variable is identified as the mild outlier when
or
. In turn, the value of the variable is identified as the extreme outlier when
or
. No outliers are identified in our data applying this method. Therefore, all objects (countries) are included in the study.
Before the clustering process, all variables are normalized. In the study, standardization is used as the method of normalization (see [
110,
111]):
where:
—standardized value of the
j-th variable and the
i-th object (country),
value of the
j-th variable and the
i-th object (country),
—average values of the
j-th variable, and
—standard deviation of the
j-th variable.
Euclidean distance is used as a distance measure [
112].
As is mentioned, the k-means algorithm divides the number of objects into a predetermined number of clusters (classes). We conducted clustering for a different number of clusters (from 2 to 12;
k = 2, 3,…, 12) and then selected the best division using the silhouette index (SI index), [
104,
106,
113,
114]). [
104,
106] point to this method as one of the best used for selecting the number of classes
k. [
115,
116] reports that values over 0.5 indicate that a reasonable structure has been found, then the number of clusters is acceptable.
4. Characteristics of the Different Variables Used in the Study
The adjustment of European economies to low-carbon economies is one of the EU’s priorities. As a result, several activities are being undertaken, primarily related to the increased use of renewable sources, the reduction of CO
2 emissions and, consequently, the promotion of activities aimed at reducing energy consumption. Households are one of the major consumers of energy. They are therefore significantly affected by energy policy. Many studies show significant relationships between energy consumption and energy prices ([
53,
117,
118,
119,
120] among many others) and the relationship between energy prices (in particular fossil fuel prices) and renewable energy consumption (i.e., [
121,
122,
123]). Therefore, variables representing the different areas of sustainable development policy will be the subject of study. These are: final energy consumption, electricity prices for households, and share of renewable energy in households.
Household energy consumption varies quite widely across EU countries.
Table 1 shows how much energy was consumed per capita on average per year (in 2018) in this sector (in MWh).
The highest value is recorded for Sweden (12 MWh per capita), followed by Luxembourg (9.5 MWh per capita) and Denmark (9.2 MWh per capita). In contrast, the lowest values are found in Malta (2.2), Portugal (3.3), Bulgaria, and Spain (3.7). This is mainly due to the geographical location of the country. More than 60% of energy consumed by households is used for heating purposes. Therefore, the energy consumption in this sector will necessarily be lower in the southern European countries. However, it is also worth noting that in wealthier countries (compared to poorer ones), the values of this variable are higher.
Households primarily use energy for such purposes as space heating, water heating, lighting and appliances, cooking and space cooling (Eurostat 2019, see also [
59]). It is also worth noting that more and more energy is used for cooling [
125].
As mentioned earlier, households in EU countries accounted for 26.3% of final energy consumption in 2018 [
9].
Table 2 shows the shares of the different energy sources in the energy consumption reaching the final consumer. The largest share of household energy consumption comes from natural gas. It is mainly used for space and water heating, and cooking. The second most used energy source is electricity, which is used in households for lighting and appliances. The third most important source of energy in households is renewables and biofuels. This accounted for 17.6% of the total energy used. This type of energy in households is mainly used for space heating. It should be noted that these shares may vary between countries, as energy use, including by households, is specific to each country.
For the EU, the share of household energy consumption from renewable sources is shown in
Figure 1 (orange bars). The highest value of this share (above 40%) is observed in four countries: Croatia, Slovenia, Estonia, and Latvia. On the other hand, the lowest (below 3%) is observed in Ireland and Slovakia. According to target 3 of the Europe 2020 strategy, the share of renewable energy sources in our final energy consumption (increase the share of renewable energy sources in our final energy consumption to 20%) should be at least 20% at EU level (European Commission, 2010). However, this target varies between EU countries (shown with black dots in
Figure 1). Although this target refers to the energy consumption of all actors on a national scale, we can also consider it as a benchmark for households. When implementing the Europe 2020 Objective 3, large national budgets are allocated to support households in switching to alternative energy sources.
One such example would be subsidizing the installation of solar panels. The investments involved in switching to the use of renewable energy sources are very costly, which may limit their implementation. To support such projects, the European Union has launched support programmes, including financial support, for Member States. EU funds are one source of funding for the development of renewable energy sources. In Poland, the sources of EU subsidies for this purpose are the Regional Operational Programmes managed at the level of individual regions. These programmes are co-financed by two funds: European Regional Development Fund and European Social Fund, and from national resources. According to the report of the Institute for Renewable Energy, Regional Operational Programmes have significantly contributed to the development of the photovoltaic market in Poland.
Consequently, major changes in energy use are also expected in this sector, and the household sector will also adapt to these changes. The largest in minus differences between the benchmark (Target Europe 2020) and the share of renewable energy in household energy consumption in 2018 were found for Sweden (38.3 pp), Ireland (13.6 pp), and Slovakia (11.9 pp). In contrast, the largest in-plus differences (i.e., a higher share than indicated by the benchmark) were found for Croatia (26.3 pp) and Slovenia (19.7 pp).
5. Results
In the first stage of the analysis, a classification is carried out for 28 EU countries (according to the 2018 EU composition). The best division is the one into 5 groups, for which the SI index value equals 0.543. This indicates that the obtained classification is of good quality (it is satisfactory).
Table 3 shows the composition of each group (cluster) and the average values of the analysed variables in each group.
In two of the five clusters, the algorithm qualifies one country each. These are clusters 4 and 5. Cluster 4 includes Sweden. This country stands out from the others primarily due to the significant value of the variable (38.26 pp), i.e., the difference between the share of renewable energy consumption in total energy consumption in households and the target imposed for Sweden in the Europe 2020 strategy. This share is less than 11%, while the target is set at 49%. The second country that stands out in terms of analysed characteristics among EU countries is Finland, with the highest energy consumption per capita (12,009.94 kWh) and the lowest electricity prices (0.1164 PPS € per kWh). In households in this country, 31% of energy comes from renewable sources. This value is 7 pp lower than the threshold set by the Europe 2020 strategy (38%).
The groups 2 and 3 are the most numerous (10 countries each). Group 2 includes countries such as Bulgaria, the Czech Republic, Estonia, Greece, Croatia, Cyprus, Latvia, Lithuania, Romania, and Slovenia. These are countries from Southern Europe and Central and Eastern Europe from the former socialist states. This cluster is distinguished by low average energy consumption (variable ), a rather high average electricity price (variable ) and a high value for the average share of renewable energy in total energy consumption (variable , 36.49%) and a high value for the average variable , (14.79 pp). This means that households in these countries in 2018 consumed on average 14.79 pp more renewable energy than the national limit imposed by the Europe 2020 Strategy. An equally large group is group 3. Among the countries classified in this group, 7 are countries from the so-called old “15” (Denmark, Ireland, France, Luxembourg, Netherlands, Austria, United Kingdom) and three were adopted in 2004 (Malta, Slovakia, and Hungary). In this group, the average energy consumption was = 6802.00 kWh (per capita) and the average price = 0.1739 (PPS € / kWh). The average share of renewable energy in household energy consumption was = 13.73%, with average differences between this share and the limit imposed by the Europe 2020 Strategy = −4.27 pp. Against the background of the other groups, these values can be considered “average” (“centred”). It can be interpreted that group 3 includes countries with average values of the analysed indicators. In group 1 there are 6 countries: Belgium, Germany, Poland, and three countries from Southern Europe—Italy, Spain, and Portugal. The average value of household energy consumption is one of the lowest among the analysed groups (= 5872.47 kWh per capita) and average prices (= 0.2615 PPS € / kWh) are the highest. The average share of renewable energy is = 18.96 %. The average difference between variable and the target imposed by the strategy is close to zero (= −0.04 pp).
The largest distances (or the largest differences in analysed characteristics) were between clusters 4 a 1 and 4 a 2 and 5 a 1 (
Table 4). This means that both Sweden and Finland stand out visible from the rest of the EU, mainly due to their high household energy consumption and very low electricity prices. The fact that Finland and Sweden turned out to be visible different from the others in this classification meant that the differences in the analysed characteristics between the other countries were not sufficiently highlighted. In a further step of the analysis, the classification is carried out excluding these two countries.
The results of the next classification (excluding Finland and Sweden) are presented in
Table 5. The best division is the one into 11 groups (SI coefficient = 0.569). It is much more heterogeneous, that is, the remaining countries differ more (due to the variables analysed) than the classification from the first step would indicate.
Considering the composition of the groups, 4 of them are single-object in this division (groups: 3—Czech Republic, 5—Luxembourg, 6—Malta, and 8—Latvia). On the other hand, in three groups more than three countries are included. These groups are: 1 (Belgium, Germany, Italy, Poland), 2 (Bulgaria, Greece, Cyprus, Romania), and 7 (Ireland, Netherlands, Slovakia, UK).
When we look at the average household energy consumption per capita (variable
), in three groups (2, 6, and 9), it is less than 5000 kWh. These groups include the southern European countries. On the other hand, the highest energy consumption is recorded for Luxembourg (the group 5,
=9536.1 kWh per capita) and the group 4 (Denmark and Austria,
=8883.6 kWh per capita). The Group 5 also has the lowest value for variable 2 (electricity price measured in EUR PPS). In contrast, the highest average energy (electricity) prices are recorded in the group 9 (Spain and Portugal) and the group 1 (Belgium, Germany, Italy, and Poland). It is worth mentioning here that there is a clear negative correlation between average electricity prices and energy consumption per capita in households. This suggests that, on average, countries with a higher energy price on average would consume less energy [
15].
The direct share of renewable energy in household energy consumption is highest in the groups: 11 (Estonia, Croatia, Slovenia, =44.29%), 8 (Latvia, =43.53%), and 2 (Bulgaria, Greece, Cyprus, Romania, =31.70%).
The group 11 also obtained the highest average value of the variable (20.96 pp). This means that in these countries the share of renewable energy in total energy consumption in households is higher than the target enshrined in the Europe 2020 strategy by almost 21 pp. In two more groups, this difference exceeds 10 pp: in the group 3 (Czech Republic) and the group 2 (Bulgaria, Greece, Cyprus, Romania). In contrast, the lowest average value for this variable was recorded for group 7 (Ireland, Netherlands, Slovakia, UK). In this group, the share of renewable energy is on average about 11 pp lower than the target enshrined in the Europe 2020 strategy.
When analysing the information about the average distances between clusters (
Table 6), it can be noted that one of the clusters in particular stands out with its considerable distance from most of the others. This is cluster 5, to which Luxembourg has been assigned. Two other clusters, which are also slightly more distant from most of the others, are the clusters 6 (Malta) and 7 (Ireland, Netherlands, Slovakia, UK). On the other hand, the cluster 10 (France, Lithuania, Hungary) can be considered as the “closest” of the others. The values of average distances do not exceed 0.9.
6. Discussion of the Results
In the first classification, Sweden and Finland are classified into separate groups. Considering the analysed variables, these two countries particularly stand out from the others. In the case of Sweden, we observe the large difference (−38.26 pp) between the direct use of renewable energy as an energy source in households and the target stated in the Europe 2020 Strategy. Households in Sweden use energy directly from renewable sources at a rather low rate (at 10.7%) compared to other EU countries. They mainly use electricity (51.8% of total energy consumption) and heat energy (34.4%). In contrast, both electricity and heat energy are sourced largely from renewable energy sources. 55.8% of gross electricity production and 76.4% of heat energy is produced from renewable sources. This gives, after recalculation, 55.1% of indirect renewable energy use, and a total of about 65.8% (direct and indirect household renewable energy use). Sweden has favourable natural conditions for the development of renewable energy e.g., it is constantly increasing investment in wind power (helped by the low population density), and almost 40% of the country’s total electricity production comes from hydropower. More and more so-called energy clusters based on RES and the latest technologies are being established in Sweden. Housing estate power plants, microgrids allowing for efficient use of electricity, are gaining popularity. Locally developed smart grid systems enable more efficient use of energy from wind, solar, biomass and waste [
126]. It is also worth mentioning that Sweden ranks first in energy transition (Energy Transition Index—ETI, see World Economic Forum 2021; more information about ETI one can find, i.e., in [
127]. They plan to receive 100 per cent renewable energy by 2040 (Swedish Wind Energy Association 2019, International Renewable Energy Agency 2020).
In addition, it should be noted that Sweden (along with France, Hungary, and Slovakia) is among the top European countries using nuclear heat for electricity production (over 40% of gross electricity production). In Sweden, therefore, the main pressure to adapt to a low-carbon economy has mainly fallen on the energy suppliers. The data also shows that Swedes with relatively cheap energy and consume a lot of it. In 2018, only 4 EU countries have higher per capita household energy consumption than Sweden (Austria, Luxembourg, Denmark, and Finland). Prices measured in PPS are lower only in Finland and Luxembourg.
In the second outstanding country, Finland, energy measured in PPS is the cheapest in the EU, which probably influences the fact that also households consume the most energy (even quite a lot more than in other Scandinavian countries). It is worth noting that more than 93% of energy consumed in households comes from three sources: renewable, electricity and heat in the countries from Northern Europe (Iceland, Norway, Sweden, Finland, and Estonia). The vast majority of electricity or heat is produced from renewable sources or, in addition, using nuclear energy (except in Estonia).
As Sweden and Finland stand out specially, it is decided that a further classification would be carried out without these objects. The elimination of these two countries from the sample highlighted the differences between the remaining countries. The reclassification of the (already reduced) sample resulted in as many as 11 groups. This demonstrates, above all, the significant differentiation of European (EU) countries in terms of the characteristics studied.
It is worth noting that in the new classification in some groups there are countries that are geographically close to each other (e.g., in group 2 we have countries from South-Eastern Europe, or in group 9—countries from the Iberian Peninsula (Spain, Portugal). On the other hand, among the groups formed there are also countries that are far from each other, e.g., in group 10 we have France, Lithuania, and Hungary, and e.g., in group 1 Italy stands out, especially against the rest. Thus, geographical location should be considered as a factor of importance in the classification, but it is not the key criterion for division, due to the analysed characteristics (variables). The obtained results show that the lowest average intakes are found in the groups that include the southern European countries (the groups 2, 6, and 9). In this respect, the geographical factor plays an important role. More than 60% of energy in the EU countries is used for heating purposes, and necessarily less demand in the southern countries. Indeed, energy consumption depends on climate zone (cf. e.g., [
16]) or average annual temperature (cf. e.g., [
128]). In contrast, the groups with the highest average energy consumption per capita (the clusters 4 and 5) include those countries (Denmark, Austria, and Luxembourg) that are among the most prosperous EU countries (regarding GDP per capita in EURO 2018). Additionally, it is worth mentioning that in Luxembourg, the price of electricity (measured in PPS per kWh) is among the lowest in Europe.
Considering the direct consumption of renewable energy in households, the largest shares of total energy consumption are in the groups with mainly Baltic and Balkan countries (groups: 11—Estonia, Croatia, Slovenia; 8—Latvia; 2—Bulgaria, Greece, Cyprus, Romania). According to Eurostat data [
91] in Estonia and Latvia, 100% of renewable energy comes from the category of primary solid biofuels. In Croatia, it is about 98% and in Slovenia about 90%. A high share of this type of fuel is also found in Bulgaria and Romania (close to 100%), while in Cyprus and Greece it is much lower (about 19% and about 66% respectively). In Cyprus, the main source of renewable energy in households is Solar thermal (ca. 68% of primary solid biofuels) and in Greece, it is ca. 27%. This is, of course, favoured by climatic conditions.
Latvia, Lithuania, and Estonia, are ranked in the top 20 according to ETI 2021 (World Economic Forum 2021), at positions 12, 15, and 16, respectively. These are the highest positions among the so-called ‘newcomer’ countries. Their high position is mainly due to the use of biomass. These countries are listed among the main actors of the European biomass market [
129]. Estonia and Latvia, rich in forest resources, are also listed among the main biomass exporters [
130]. While in Latvia and Estonia biomass is used directly by households, in Lithuania it is largely used to produce heat energy (64.3% of this type of energy produced from primary solid biofuels). It is also worth mentioning that in these three countries, about 10% of electricity is produced from primary solid biofuels. Lithuania has undergone an energy transition at a very fast pace. Until 2009, Lithuania used a nuclear power plant to produce electricity, which generated about 80% of electricity production [
131]. According to Eurostat data in 2018, 83.3% of electricity is obtained from renewable sources, mainly wind, hydro, and biomass [
132].
In the cluster 7 (Ireland, the Netherlands, Slovakia, and the UK), the share of renewable energy is on average about 11 pp below the established benchmark. In three of the countries in this group, more than 50% of household energy consumption is based on natural gas—in the Netherlands almost 71%, in the UK almost 63%, in Slovakia 54.5%. In Ireland the share of gas is 20%. Oil and petroleum products have the largest share in energy consumption—over 40%. It is also worth to mention that in Ireland, a significant share of household energy consumption comes from solid fuels (13.8%, solid fossil fuels, peat, peat products, oil shale, and oil sands). Ireland is one of three countries where this share for households is greater than 10% (the others being Poland with 32.4% and the Czech Republic with 12.7%). [
133] report that micro renewable energy systems (micro-RES) have started to be promoted among households in Ireland to comply with EU policy. The authors indicate that the use of micro-RES did not result in a reduction of (electricity) consumption among households. It is even reported that consumption increased. It is also worth noting that the problem of eliminating the use of coal as an energy source is very difficult, especially in a situation where it is an indigenous source of energy. This translates into reduced energy security [
134].


 ,
, 

