Review

A Review on the Dispersion and Distribution Characteristics of Pollutants in Street Canyons and Improvement Measures

School of Mechanical Engineering, Tongji University, Shanghai 200092, China
*
Author to whom correspondence should be addressed.
Energies 2021, 14(19), 6155; https://doi.org/10.3390/en14196155
Submission received: 25 July 2021 / Revised: 8 September 2021 / Accepted: 23 September 2021 / Published: 27 September 2021
(This article belongs to the Collection Review Papers in Energy and Environment)

Abstract

:
The air quality in a street canyon seriously affects the exposure level of pollutants for pedestrians and is directly related to the indoor air quality (IAQ) of surrounding buildings. In order to improve the street canyon environment, it is necessary to clarify the distribution and dispersion characteristics of pollutants. Through field tests, wind tunnel experiments, and numerical simulation, the current research studied the nature of pollutants in street canyons and provided some improvement measures. This paper comprehensively introduces the characteristics of pollutants in street canyons and reviews past studies on the following parts: (a) the dispersion principle and main impact factors of pollutants in street canyons, (b) the spatial and temporal distribution of pollutants in street canyons, (c) the relationship between pollutants in street canyons and indoor air quality, and (d) improvement measures of the street canyon environment. The dispersion of pollutants is dominated by the air exchange between the street canyon and the upper atmosphere, which is strengthened when the wind speed is high or when the temperature in the street canyon is obviously higher than the surrounding area. The heat island effect is beneficial for pollutant dispersion, while the inversion layer has a negative influence. Dense buildings mean lower pollutant diffusion capacity, which causes pollutants to easily gather. Pollutants tend to accumulate on the leeward side of buildings. The concentration of pollutants decreases with the increase of height and drops to the background level at a height of several hundred meters. The temporal distribution of pollutants in street canyons varies in diurnal, weekly, and annual periods, and the concentration peaks in the winter morning and summer evening. Besides, pollutants in street canyons have a significant influence on IAQ. To improve the street canyon environment, green belts and other facilities should be reasonably set up in the streets. Future research should pay attention to comprehensive test data, solving disagreement conclusions, and quantitative evaluation of the various impact factors on pollutants, etc.

1. Introduction

With the continuous development of cities and the rapid increase of the urban population, the air pollution problem in cities has become increasingly prominent, and the improvement of the dwelling environment has become a hot topic at present. Many studies have shown that air pollutants are closely related to human health and many common diseases. For example, particles absorbed by blood vessels can cause changes in human functions and lead to diseases such as myocardial infarction and arrhythmia [1,2]. Daily cardiovascular mortality and respiratory mortality are positively correlated with the concentration of PM2.5 and PM10 [3]. Besides, high concentrations of gaseous pollutants such as ozone, carbon monoxide, nitrogen dioxide, and sulfur dioxide can cause problems such as low fertility, respiratory diseases, and nervous system weakness [4,5,6]. According to a World Health Organization survey, environmental outdoor air pollution was estimated to cause 4.2 million premature death worldwide in 2016, which was 3.7 million in 2012. Air pollution has long been a major environmental problem affecting public health in many countries.
As one of the areas where people stay for the longest time, streets are directly connected with the atmosphere and affected by air pollutants. Attributed to dense buildings, the environmental characters of urban streets can be similar to natural canyons, which are called street canyons. The flow regime in the street canyon is strongly influenced by the dimensions of the street; Figure 1 shows three typical flow regimes (i.e., isolated roughness flow, wake interface flow, and skimming flow) in a street canyon under different aspect ratios (AR, ratio of building height to street width), and the skimming flow under a high AR value is the most representative and the worst condition in street canyon [7,8,9]. Usually, wind speed in the street canyon is low [10]; as a result, the influence of thermal buoyancy caused by temperature differences is obvious [11]. An urban heat island is the most obvious thermal character in the street canyon, which causes the temperature inside the street to be higher than the background temperature above [12,13]. Because of dense buildings, solar radiation remains trapped in the street after multiple reflections, forming an unstable temperature distribution [14,15].
Influenced by various flow regimes, temperature distributions mentioned above, and other factors such as architectural layout, the problem of pollutants becomes more serious and complicated in the street canyon, causing pollutants in the street canyon to show different distribution characteristics with time and space changes [16,17]. Traffic pollutants are one of the most important sources of pollutants in street canyons [18]; according to an investigation by the environmental protection department, the contribution rate of motor vehicle emissions to atmospheric pollutants such as CO and NOX exceeds 50% [19], which has a particularly obvious impact on the street canyon environment. According to the report, traffic pollutants such as PM10, carbon dioxide, and organic matter often exceed the safety limits recommended by local or WHO standards [20,21]. In addition, building emissions and industrial waste gas have contributed to the deterioration of the street canyon environment.
If pollutants accumulate in street canyons for a long time and cannot be effectively discharged, they seriously endanger public health over time. Besides, the environment of the street canyon not only affects the pollutants exposure level of pedestrians but is also closely related to indoor air quality [22]. The air exchange between indoor and outdoor air flow can provide fresh air to rooms, but on the other hand, it can also intensify indoor air pollution [23]. Therefore, research on the dispersion of pollutants in street canyons is necessary to improve the environment of both pedestrians and inhabitants.
At present, many pieces of research on the pollutants in street canyons mainly focus on one or some aspects, such as the influence of environmental wind speed on pollutant dispersion, how to improve the street canyon environment, etc. However, a relevant review with a comprehension introduction of the dispersion mechanism of pollutants, influencing factors of distribution rules, improvement measures, etc., is notably absent. Therefore, through sorting out and summarizing the previous studies, this paper comprehensively analyzes the related problems of pollutants in the street canyon and their dispersion so as to broaden the understanding of the street canyon microenvironment in typical cities and provide a basis for efficient natural ventilation designs for buildings and the improvement of street canyon air quality.
Reviews in this paper focus on the basic principle and the superficial phenomenon caused by it, including the following four aspects: (1) the dispersion principle and factors that affect the dispersion of pollutants; (2) temporal and spatial distribution characteristics of pollutants in street canyons; (3) coupling between indoor and outdoor air quality; (4) measures to promote the diffusion of pollutants and improve the environment in street canyons.

2. Dispersion Principle and Impact Factors

The basic motivations of dispersion include forced convection, natural convection, and gravity effect. In most cases, forced convection is the dominant driving force, but the influence of other principles cannot be ignored, especially in the condition of low wind speed.
The rate of air exchange between the canyon interior and the upper atmosphere dominates the spread of air pollution in the street canyon [24,25], and the air exchange process is mainly dominated by a vortex, and the generation and intensity of the vortex are determined by the ambient wind speed [26,27]. Generally, with the increase of turbulence intensity, the turbulence kinetic energy and diffusivity in street canyons also increase, which lead to vortex enhancement and promote the effective dispersion of pollutants [28]. When the atmospheric background wind speed is high enough, the coupling between the air inside the street and above is established, which is conducive to the effective dispersion and discharge of pollutants in street canyons [29,30,31].
In addition to forced convection that is directly caused by air flow, natural convection caused by temperature difference and the gravity effect of pollutants are also driving forces to promote pollutant dispersion. When the street canyon ground and the building walls on both sides are heated by solar radiation, thermally induced flow is formed in the canyon. The combined action of natural convection and forced convection promotes the diversity of airflow in street canyons, thus affecting the dispersion of pollutants [32,33]. Besides, the influence of gravity changes for different kinds of pollutants, and in most cases, it plays a negative role in inhibiting the effective dispersion of pollutants [34]. Especially for particles of larger size and density, gravity makes it difficult for background wind above to carry the pollutants away [35]; thus, the pollutants are accumulated for a long time or diffused to downstream blocks.
In the street canyon environment, the dispersion of pollutants is affected by many factors closely related to dispersion efficiency. This chapter focuses on four main factors, including wind environment, temperature distribution, street layout, and pollutant types, all of which are proven to be significant for the dispersion of pollutants in street canyons.

2.1. Wind Environment

Influenced by dense buildings and complex street layouts, airflow organization from empty suburbs to the interior of the city undergoes drastic changes. The wind environment in the city can be divided into two layers in the vertical direction [10], namely, “obstructed sublayer” and “free surface layer”. As shown in Figure 2, the “obstructed sublayer”, also known as the “urban canopy layer”, refers to the area from the ground to the building height; the “free surface layer”, also known as the “roughness sublayer”, refers to the area above the roof of buildings.
The airflow pattern of the canopy is affected by many factors, including air exchange rate, street layout, building size, etc. [10]. Figure 3 shows that the values of wind speed vary with height; whether the incoming wind is parallel to or oblique to the central axis of the street, the wind speed inside the street canyon increases with height and is about 20–80% lower than the ambient wind speed. Generally speaking, the wind speed inside the street canyon is often much lower than the atmospheric background wind speed, which affects the effective dispersion of pollutants to some extent [37,38].
Wind direction is a significant parameter affecting the air flow and dispersion of pollutants in the street canyon, and the cases where ambient airflow is perpendicular to the street axis (α = 90°) are thought to be the worst condition for pollutant dispersion [39]. When the ambient airflow is parallel to the street axis (α = 0°), the urban canopy layer (UCL) ventilation capacity is the best [40]. However, other research revealed that when α is equal to 30°, the UCL ventilation is better than cases where α is equal to 0° and 15° [41,42]. Generally, for cases with parallel wind direction, the pollutant concentration in streets is lowered, but the pollutant concentration on the windward side is increased. For cases with perpendicular wind direction, the pollutant concentration in streets is heightened, especially for leeward walls, while the pollutant concentration on the windward side is reduced [42,43]. However, when there are some infrastructures in the street canyon, such as avenues of trees, the worst pollutant dispersion situation cases is formed in the cases of oblique wind direction [43].
Due to the difference of the atmospheric background wind environment above the street canyon, the air flow organization inside the street canyon is constantly changing, thus affecting the air exchange between the street canyon and above (i.e., the main form of pollutant dispersion) [44,45]. For any background wind directions, when the atmospheric background wind speed above the street canyon is relatively low, the coupling of airflow inside and above the street canyon disappears; thus, the pollutants cannot be diffused effectively. The threshold of the background wind speed is closely related to the AR value of the street canyon, which indicates that the ratio of the mean building height H to the street width W represents the density of the street canyon. Many experimental tests and numerical simulation studies show that [46,47]: the threshold of ambient wind speed tends to increase with the increase of AR value.

2.2. Thermal Environment

Due to the absorption of solar radiation by the ground and the building surface, as well as large-scale human activities in urban areas, the temperature distribution in the street canyon often presents an unstable stratification phenomenon. Generally speaking, air convection dominates the horizontal dispersion of pollutants, and its influence increases significantly with the increase of surfaces and air temperature differences. Turbulent factors mainly affect the vertical dispersion of pollutants, and their influence also increases slightly with the increase of street canyon temperature differences [11]. Especially when the background wind speed is low, the temperature difference between the air inside the street canyon and different surfaces has a more significant impact on the airflow organization and pollutant dispersion.
Generally, due to the hourly variation of the solar altitude angle, the temperature distribution on the street canyon surface shows a non-uniform state most of the time. Figure 4 shows that surface temperature changes for different places, the temperature amplitude and difference during the day are greater than those at night, and the sunny facade presents a higher temperature than the opposite wall. Besides, the temperature difference between the area in direct sunlight and the shadowed area caused by the shelter of the street canyon structures can often reach more than 10 °C, and may even reach 20–30 °C on hot and sunny summer [48]. Moreover, the sky view factor decreases with an increase of the AR value, which produces more occlusion effects from solar radiation [49,50].
Natural convection caused by temperature differences produces buoyancy, causing high-temperature air to float up and low-temperature air to sink. In the daytime, due to the urban heat island effect, the surface temperature and air temperature inside the street canyon are higher than the atmospheric background temperature above [13], which facilitates the air exchange inside and above the street canyon and promotes the upward dispersion of pollutants. At night, the upper air temperature rises due to the radiation inversion formed by long wave radiation and urban heat rejection, forming an inversion layer. The air temperature in the street canyon is lower than the atmospheric background temperature above, thus inhibiting the air exchange between the street canyon and above [48], resulting in the air quality in the street canyon in the early morning being worse than that in the evening.

2.3. Street Layout

The three-dimensional landscape pattern of a city block is an important factor that determines the air flow movement and the dispersion effect of air pollutants in the block and affects the quality of the air environment inside the block [51]. Unreasonable spatial arrangement and structure of urban streets and canyons often cause local air pollution. High-density buildings reduce the abilities of urban ventilation and self-purification [52,53].
From Section 2.1 and Section 2.2 above, it can be seen that the AR value of the street canyon is one of the main factors that affect airflow organization and temperature distribution, thus affecting the dispersion of pollutants. In addition, relevant studies show that [54,55] the dispersion of pollutants in street canyons is highly dependent on the spatial form of street canyons. According to the composition of the spatial form of street canyons, the aspect ratio (H/W), length-to-width ratio (L/W), and height ratio of buildings on both sides (h2/h1) are the main factors that affect the air flow in street canyons and the dispersion and dilution of pollutants. In addition, the roof form of the building, sky view factor (SVF), ground vegetation, external environment, etc., all have certain influences on the dispersion of pollutants in the street canyon [56,57].
There is a strong positive correlation between the aspect ratio of the street canyon and the concentration of pollutants in the street canyon; that is, the greater the aspect ratio, the worse the pollutant dispersion capacity and the higher the concentration. The ratio of length to width of the street canyon has the same effect on pollutant dispersion as the ratio of height to width, which has a high positive correlation, too. Compared with symmetrical street canyons, the ventilation volume, airflow, and pollutant diffusion law of street canyons with variable height obviously change [58]. For upward street canyons (the building height of the upwind is higher than that of the downwind), pollutants move to the leeward and windward sides of the buildings and gather near the ground. In downward street canyons, the concentration of pollutants near the top of the street canyons and the leeward side of the building increases [59].
The influence of vegetation on pollutant dispersion in street canyons is mainly realized in two aspects [60], including aerodynamic factors and deposition effects. The deposition effect can reduce pollutant concentration through filtration. Aerodynamic factors change the airflow organization and reduce the air exchange inside and above the street canyon, reducing the pollutant concentration near the windward wall and increasing the pollutant concentration near the leeward wall.

2.4. Types of Pollutants

In the same street canyon environment, different pollutant types also show different dispersion laws. According to reports, traffic pollutants such as PM2.5 and black carbon in the street canyon are highly concentrated in the morning and evening peaks [61,62].
Due to the different physical properties (such as size and density) of different pollutants, the influence of airflow organization and gravity is also different. Because of strong turbulence and mixing, the concentration of submicron particles and gaseous pollutants in street canyons is reduced by 80% at 25 m height [63]; under the influence of gravity, the vertical stratification of the concentration of larger particles is more obvious [64].
There are complex connections among different pollutants, which affect their generation, dispersion, and distribution in the street canyon. Taking particulate matter and ozone as an example, they interact with each other in many ways and are closely related [65,66]. On the one hand, particulate matter can cause pollutants such as ozone to gather near the ground by changing the airflow shape and temperature distribution [67]. On the other hand, particulate matter can also hinder the generation of ozone to some extent by absorbing solar radiation and influencing the generation of ozone precursors [68,69]. Similarly, ozone can change the formation and transformation of particulate matter by affecting the oxidation of the atmosphere [68]. Therefore, the decrease of PM2.5 and other particulate matter concentrations in the street canyon may lead to the increase of ozone concentration, which in turn promotes the formation of particulate matter, forming a complex, unstable relationship.
In addition to the impact factors mentioned above, other factors such as air humidity [70] and surrounding industrial activities [71] also influence the distribution and diffusion of pollutants in a street canyon.

3. Distribution of Pollutants

In the street canyon environment, the distribution characteristics of pollutants are constantly changing with time and space and are influenced by many factors, such as upstream buildings, street canyon width and thermal environment, symmetry, and so on [72,73]. The distribution characteristics of pollutants are very important for a comprehensive understanding of pollutants in the street canyon and for proposing improvement measures. For example, the air quality in the area near the wall on both sides of the street canyon directly affects the indoor fresh air quality of buildings; the concentration of pollutants at the height of pedestrians during rush hours has a great impact on human health. This chapter mainly focuses on the spatial and temporal distribution characteristics of pollutants in street canyons.

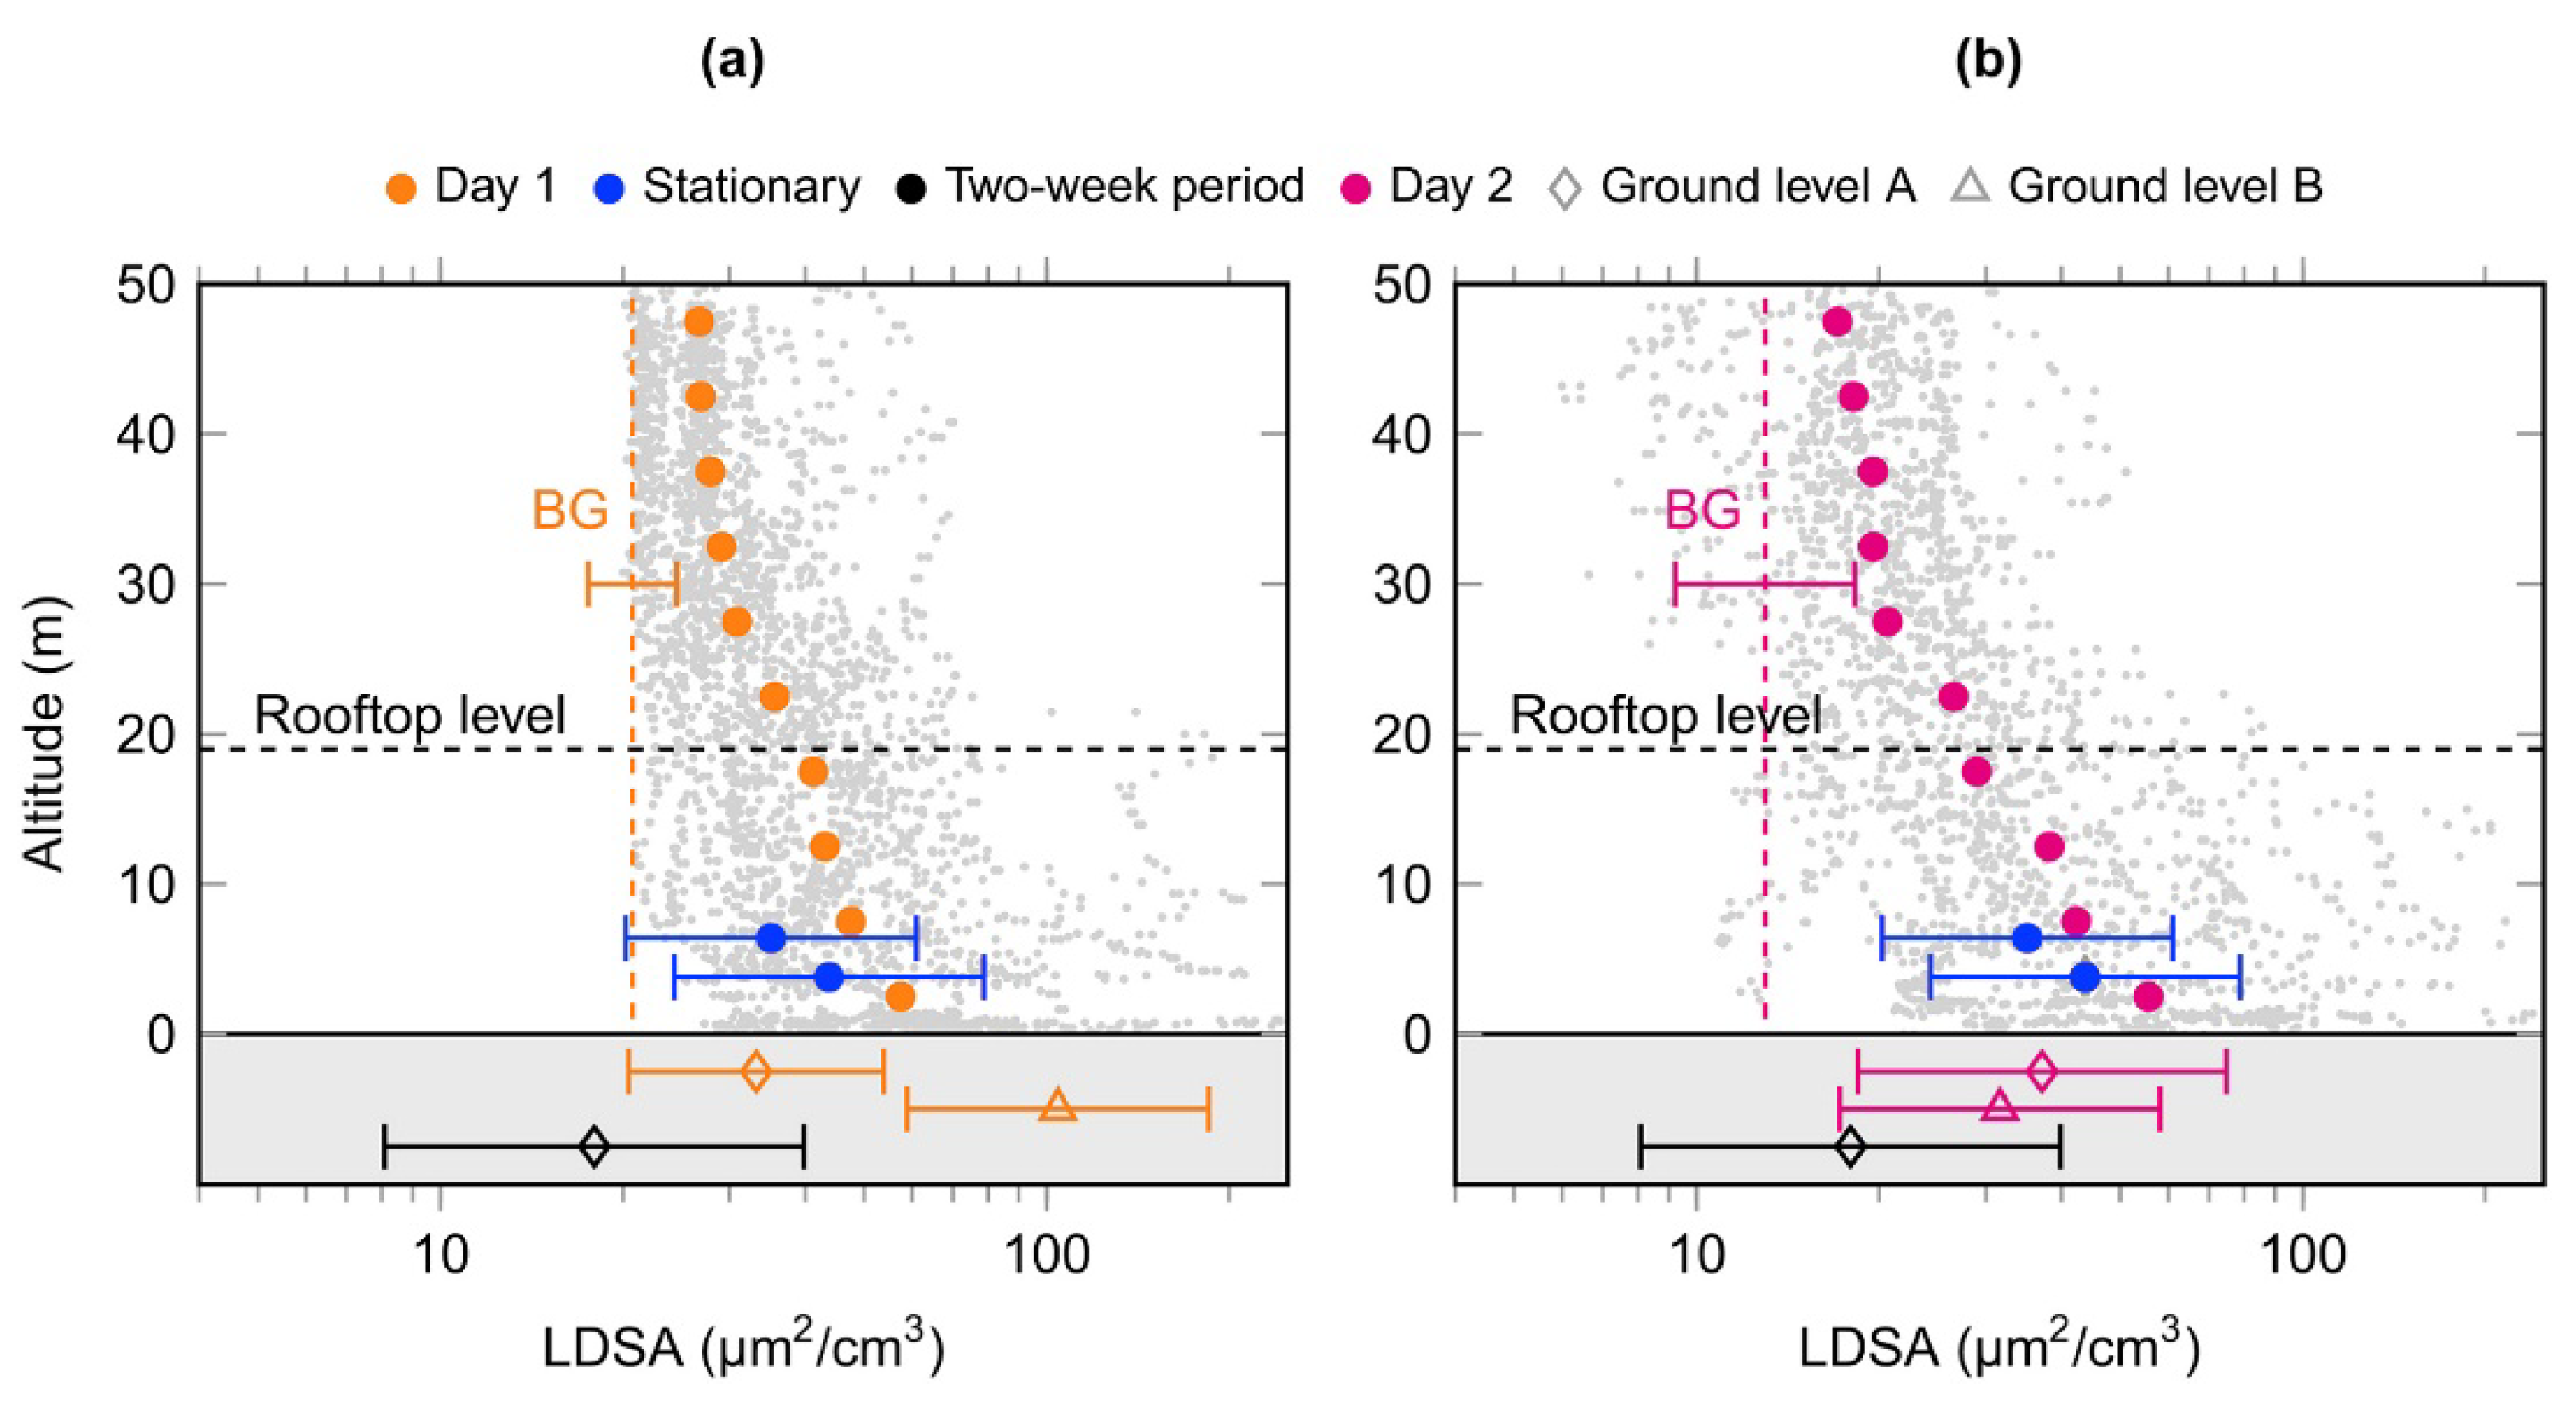
3.1. Spatial Distribution Differences

Generally, in the street canyon, the concentration of traffic pollutants on the leeward side of the building is higher, and the concentrations on both sides decrease with the increase in height [74,75,76], while concentrations decrease vertically along the height above the ground on both sides of the canyon [77]. Research shows that the concentration of ultra-fine particles (UFPs) and other major pollutants of vehicle emissions in street canyons is at a high level near roads with heavy traffic, but due to dilution and reaction, the concentration reaches the atmospheric background level at the height of several hundred meters [16]. Factors such as traffic volume, meteorological conditions, instability, and building size will all affect the attenuation gradient [78,79,80,81]. Some studies show the spatial correlation under different concentrations, especially the meteorological influence on pollutant diffusion under different pollution sources [82,83].
Conversely, pollution sources within about half a kilometer have a great influence on the concentration of UFP and CO, which tend to keep low concentrations in the air [84]. Pollutants such as UFPs and NOx near highways accumulate for a long time, and the concentration of pollutants within 100 m of the highways increases by more than 50%, resulting in surrounding residents’ long-term exposure to high pollution levels [85].
With the progress of technology and the improvement of environmental quality requirements, fixed position detectors have been proven to be largely insufficient to represent the concentration of pollutants in street canyons. Therefore, more and more numerical simulation and moving sampling methods are used for research [86]. Luz T et al. [87] used portable devices to test the concentration of pollutants in the block under different conditions and found that the concentration attenuates as the distance from the road increases, and the attenuation varies with traffic volume and weather conditions. Figure 5 presents the vertical profile of lung deposition surface area (LDSA: the concentration of aerosol expected to be deposited in the lungs after inhalation based on the size of the particulates in the aerosol) concentration in an urban street canyon in Helsinki, Finland. In the testing process, an unmanned aerial system was used as a mobile measurement platform. The results showed that the average LDSA concentration decreased from 60 mm2/cm3 measured near the ground to 36–40 mm2/cm3 measured near the roof of the street canyon and further decreased to 16–26 mm2/cm3 measured at 50 m. In addition, the vertical section above the roof level and the section measured in the street canyon show similar exponential attenuation.

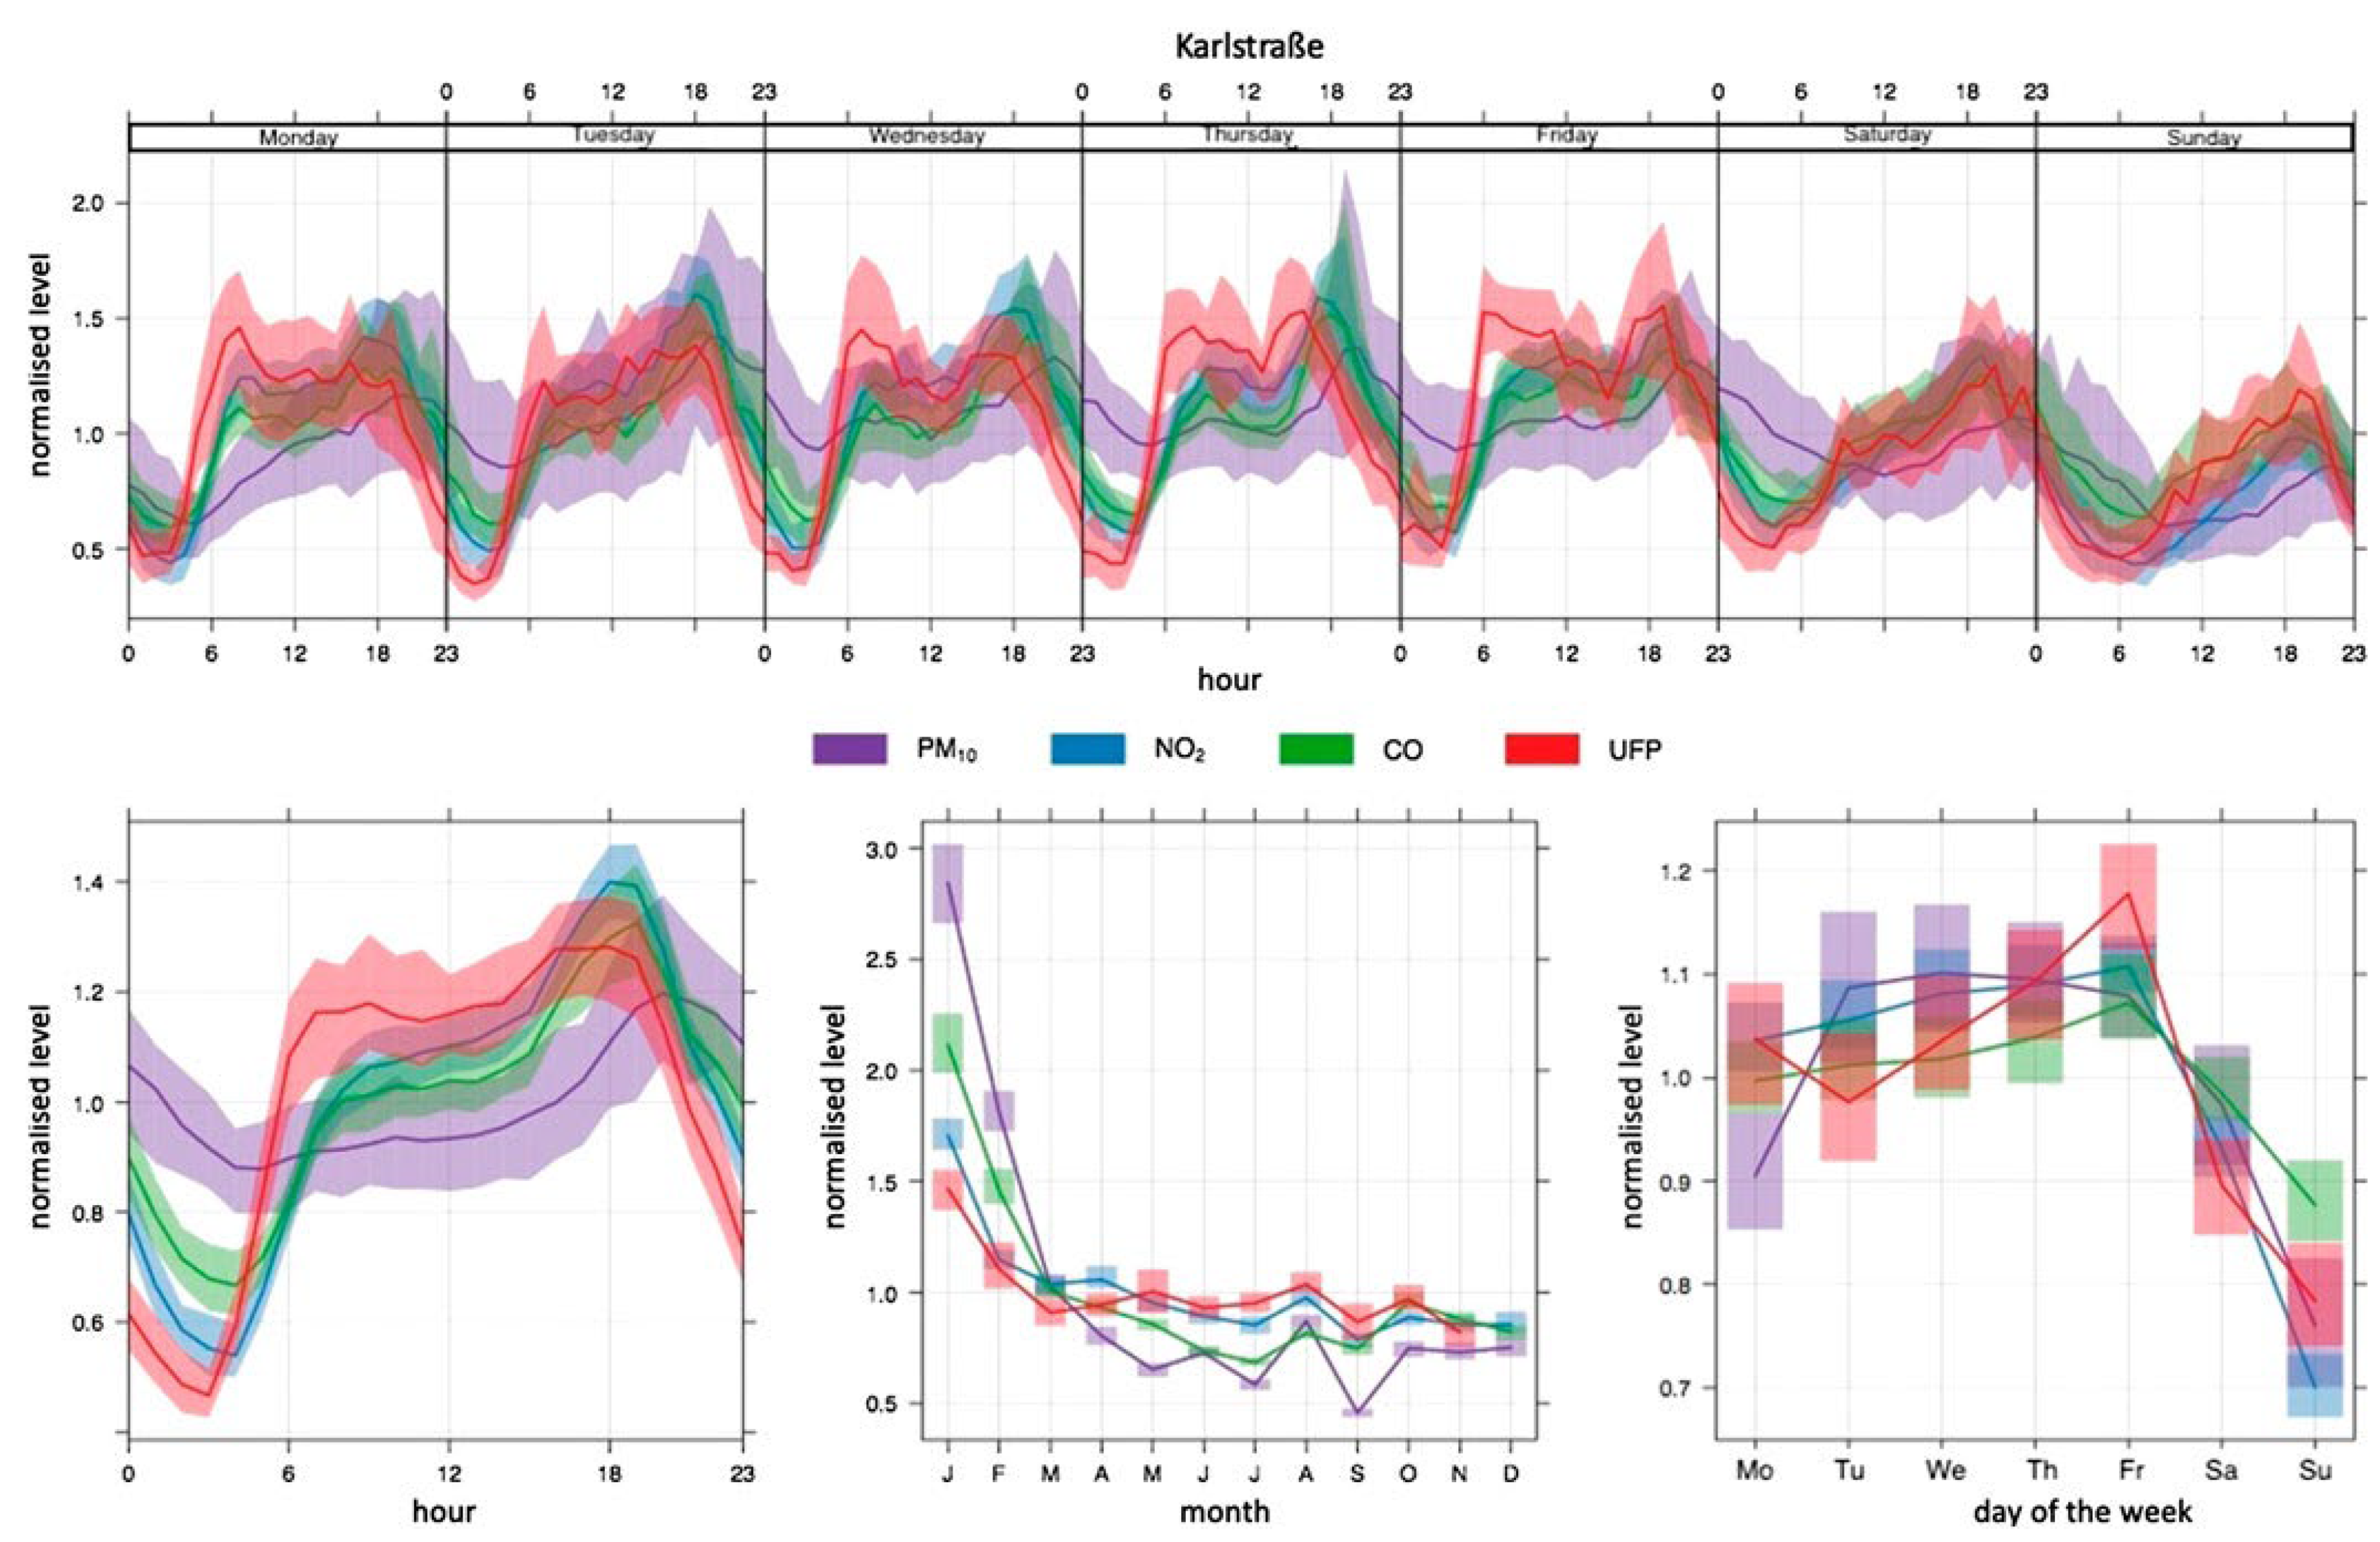
3.2. Temporal Distribution Differences

The concentration distribution of pollutants in street canyons changes with time as well as location, and its distribution characteristics are quite different in different time periods of the day and different seasons of the year. The use of continuous monitors has become increasingly widespread because they not only capture the properties of particles with greater resolution but are also more economical.
Yan C et al. [61] conducted 12-month monitoring of pollutants in a street canyon of Hong Kong. With a high concentration on working days and low concentrations over the weeks, the correlation between PM2.5 concentration and wind speed is poor. In contrast, the concentration of PM10–2.5 depends on the wind speed and increases with an increase in wind speed, with significant statistical significance. Kai F et al. [17] conducted vertical resolution traffic emission measurements on different floors of a roadside building near the inner ring viaduct in the center of Shanghai, China; the results show that due to vehicle activities and seasonal changes in meteorological factors, the concentration of pollutants in street canyons is higher in the morning of winter and in the late afternoon of summer.
Figure 6 presents the temporal distribution of pollutant concentrations in a street in Karlsruhe, Germany. The results show that the variation trends of the concentrations of different pollutants are basically the same, and they reach the peak of the day in the morning and evening, which are closely related to the increase of people and traffic flow. The lowest concentration in a day usually occurs between 2:00 and 4:00 in the morning, and the specific time depends on the type of pollutants. Besides, it is clear that the concentration of pollutants on weekends is lower than that of weekdays, and the concentrations are the highest in January, decrease to a certain extent in February, and remain at a relatively low level in the other months.
Woodrow P et al. [86] installed a portable instrument in a customized bicycle housing and sampled the concentrations of UFPs, carbon monoxide (CO), and particulate matter (PM10) in two small areas (<2.5 km) in South Auckland, New Zealand. The results show that high traffic volume and low wind speed cause higher pollutant concentrations in the morning and evening. On the whole, the concentration of particles and CO in the streets where merchants gather is higher than that of roads with large traffic volumes. Luz, T. et al. [87] used a mobile monitoring platform for testing. Their results show that the PNC level is highest in winter, lowest in summer and autumn, the concentration on weekdays and Saturdays is higher than that on Sundays, and the peak time in the morning is higher than that later in the day. The spatial and temporal trends of nitric oxide, carbon monoxide, and carbon bromide are similar, but the spatial and temporal trends of inhalable particulate matter are different. The hourly, daily, and seasonal changes of PNC have the same magnitude as the spatial changes.

4. Relationship with Indoor Air Quality

There is a common misunderstanding that with the deterioration of atmosphere quality, buildings become our shelter against pollutants. However, lots of researchers think that ventilation capacity is the most effective method to guarantee indoor air quality (IAQ), so IAQ is strongly dependent on the environment of the street canyon [90,91,92]. Especially for buildings located in an area with serious outdoor air pollution, the coupling between indoor and outdoor air does not effectively improve IAQ but instead even aggravates indoor pollution in some cases [93].

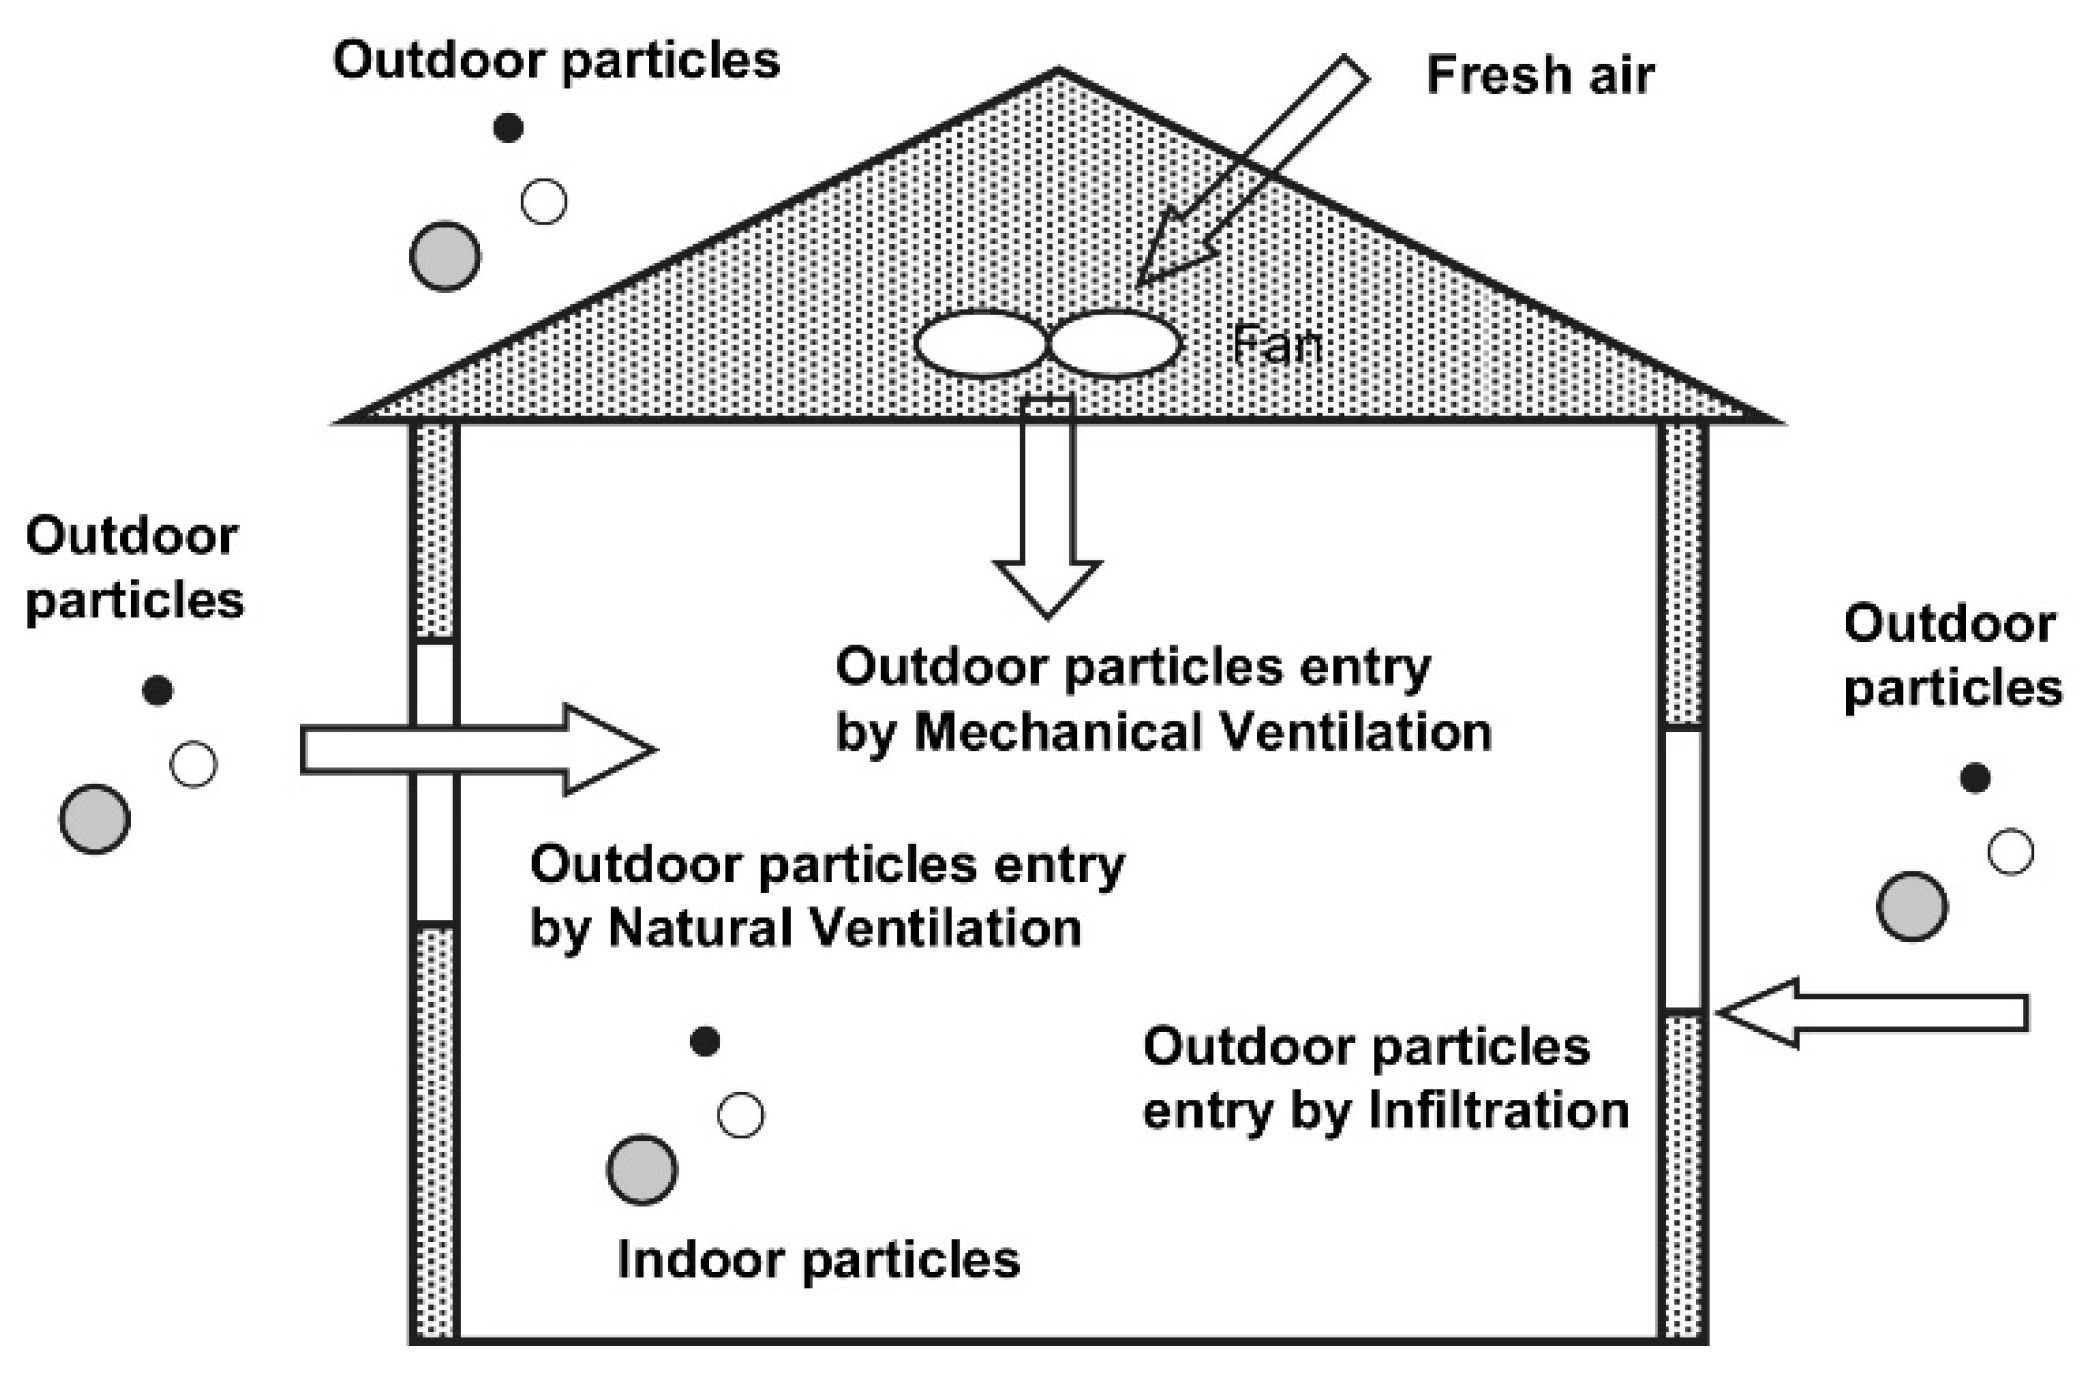
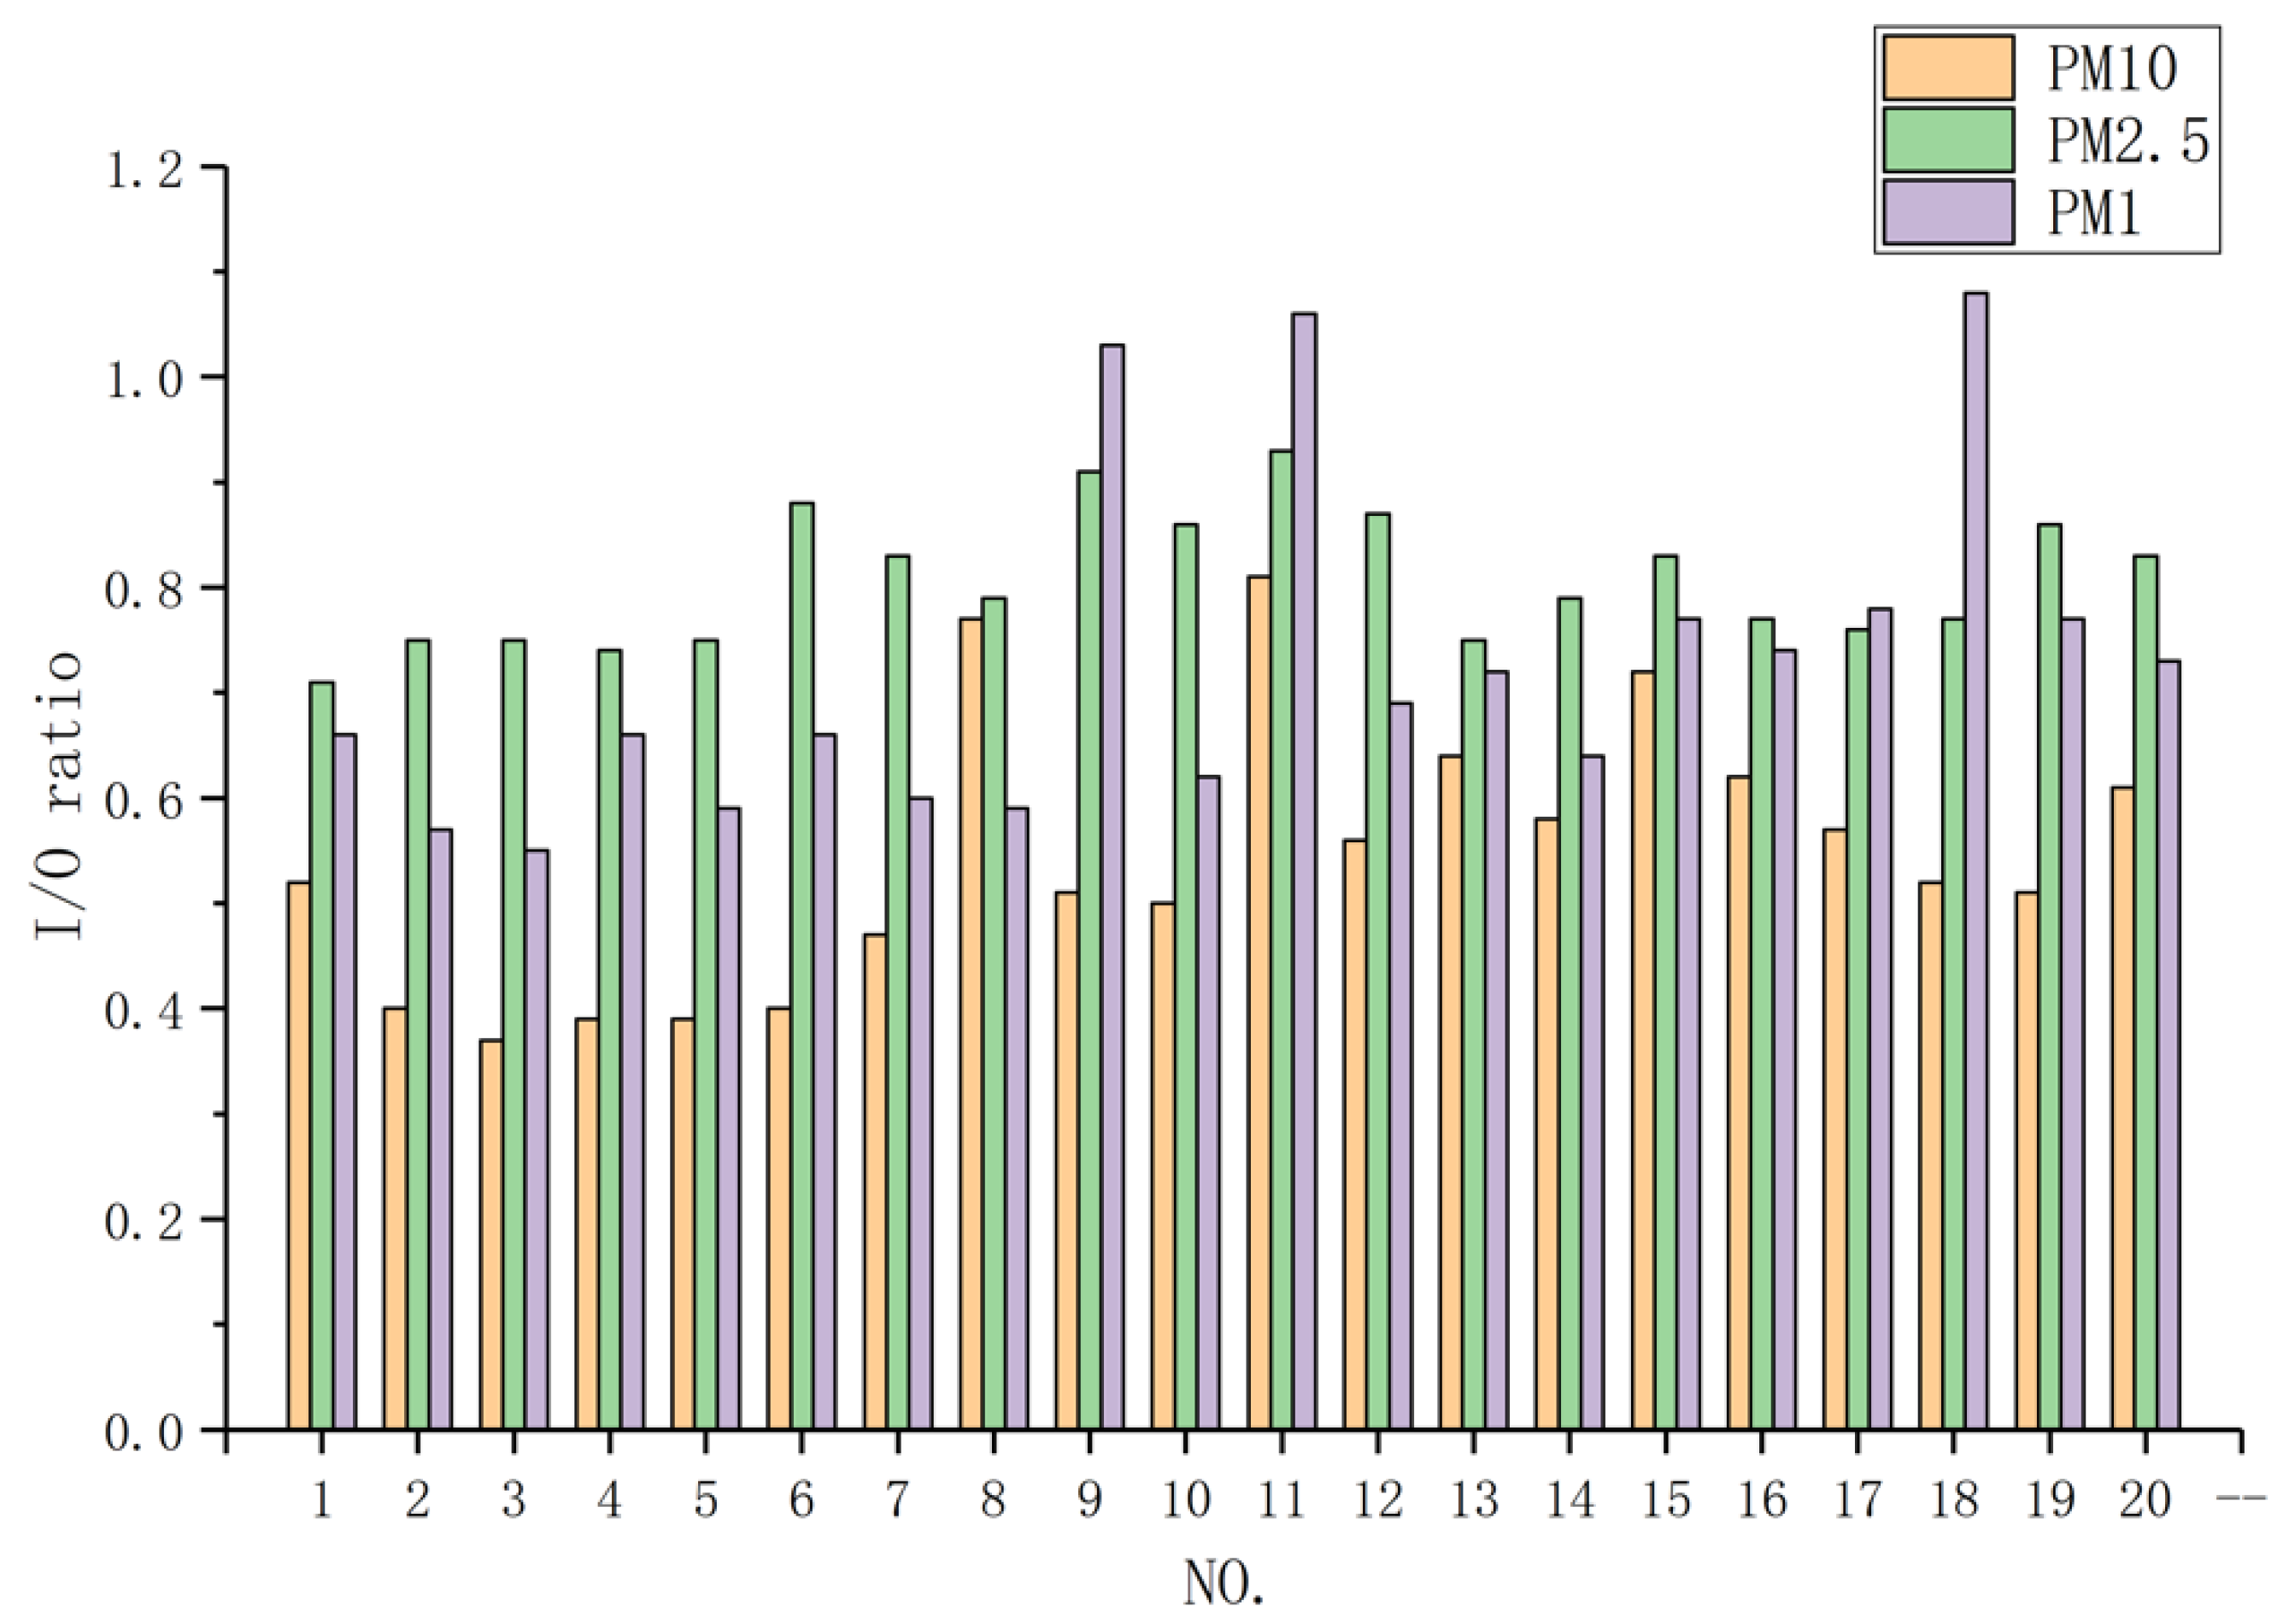
4.1. I/O Ratio and Its Impact Factors

The value of the I/O ratio (indoor and outdoor pollutant concentration ratio) is widely used to evaluate the relationship between indoor and outdoor air pollution. Research on the I/O ratio can be traced back to 1965 [22]; Dutch researchers tested SO2 and cigarette particles inside and outside 60 rooms in Rotterdam and pointed out that there are significant differences between indoor and outdoor air quality in civil architectures for the first time. After many years of relevant research, it has been found that there are many factors that affect the I/O ratio, which can be mainly attributed to the following several aspects:
(1) Types of ventilation. The ventilation modes of buildings can be roughly divided into three categories: mechanical ventilation, infiltration, and natural ventilation [94]. As shown in Figure 7, all three modes introduce pollutants from outside to some extent. Mechanical ventilation is often applied with a filter, but it cannot prevent pollutants from entering the room completely [95,96]. Outdoor air penetrates into the room through gaps when doors and windows are closed [97], which has little influence on IAQ compared with the other two ventilation modes. Natural ventilation is one of the most economical and environmentally friendly ways to improve thermal and humid conditions and air quality and strengthens the coupling relationship between indoor and outdoor air flow [96,97,98].
(2) Deposition rate of aerosol particles. When air flows through the building envelope, pollutants are deposited on the face, and their distribution characteristics are changed, thus affecting residents’ exposure to pollutants [99]. The deposition rate of aerosol is closely related to the size of particles, for a particle with a small size, Brown dispersion is the main factor to promote deposition, and small particles are more susceptible to changes in airflow [100], while gravity is the dominant factor for large ones [94]. Moreover, the deposition rate is also influenced by airflow, ventilation modes, surface properties of the building wall, etc. [99,101,102].
(3) Penetration factor. The penetration factor refers to the ability of outdoor pollutants to permeate the indoor environment [99]. For buildings with natural ventilation through doors and windows, the penetration factor is equal to 1 [94]. If doors and windows of the building are closed, the ventilation is conducted through the gaps in the enclosure structure, and the penetration is influenced by the air exchange rate, size of particles, the roughness of the wall surface [103,104], etc. When using mechanical ventilation, in order to reduce the influence of penetration, some measures such as an ozone filter or air cleaner can be used [105,106].

4.2. Research Findings

The coupling between IAQ and street canyon is not a fixed, simple linear relationship but is influenced by many factors, including street layout, types of ventilation, the microclimate of the street canyon, and so on.
Table 1 shows the vertical variation of VOC concentration in high-rise and low-rise apartments through an on-site test; the influence of outdoor is quite different. On the whole, the content of indoor VOCs on the lower floor is significantly higher than that on the higher floor, and the outdoor VOC concentration is significantly lower than indoors regardless of the height of the floor.
Figure 8 displays the I/O ratios of PM10, PM2.5, and PM1 at different locations; it is clear that the concentration of indoor particles is significantly lower than that of outdoor particles most of the time [107], which is contrary to the data in Table 1, and different kinds of pollutants show various characteristics of I/O ratios. Figure 8 shows that the I/O ratio of PM2.5 is usually the highest, the I/O ratio of PM1 is the second-highest, and the I/O ratio of PM10 is the lowest, and this law changes in different test conditions. Some filed measurement results indicated that the I/O ratios of fine particles are lower than that of course particles [108], while other research found that the I/O ratios of fine particles are higher than [102] or almost equal to [109] that of course particles. As a result, there is no clear regulation or common conclusion about the relationship between I/O ratios and pollutant categories.
The characteristics of the microenvironment have a significant influence on the air exchange and pollutants’ transportation between an inside room and the street canyon [111,112]. Generally, high wind speeds and indoor–outdoor temperature differences are beneficial for the reduction of pollutants’ concentration indoors [113]. Additionally, the I/O ratios of particles of different sizes, especially fine ones, reduce in the afternoon [114], which is partly attributed to the increase of temperature and the decrease of relative humidity.

5. Improving Measures

Pollutants in the street canyon, mainly from traffic emissions, seriously affect people’s health. Therefore, it is very important to take corresponding intervention measures to improve air quality and prevent a series of health problems related to street canyon pollution. Generally speaking, measures such as local planning, clean air areas, reduction of public transport emissions, and improvement of public awareness can be taken to improve the air quality in street canyons [115]. Due to the diversity of the street canyon environment and the numerous influencing factors of pollutant dispersion, a single intervention measure may not have an obvious improvement effect, and a variety of measures need to be reasonably used together to produce obvious changes.

5.1. Planning and Layout

First of all, governments and regional organizations should give full consideration to air pollution in urban planning, especially the long-term pollution caused by motor traffic [116]. On the one hand, residential areas should be built as far away from roads as possible, and the location and design of new buildings and facilities should be appropriately away from motor traffic, which encourages pollution to build up and increase exposure [9]. However, this kind of urban planning will cause inconvenience in people’s daily life. On the other hand, the impact of air pollution on vulnerable groups should be minimized; for example, schools, nurseries, and nursing homes should not be built in neighborhoods with high pollution levels. Special attention needs to be paid to people with low socioeconomic status because they are particularly vulnerable to the adverse effects of air pollution [117]. According to statistics, people in the poorest areas of London are, on average, more vulnerable to air pollution than people in relatively rich areas [115]. Besides, adding facilities such as wind catchers is a benefit for the air quality in a street canyon, which can reduce the concentration of pollutants by 70% [118].
Secondly, the street layout has a great influence on the dispersion efficiency of pollutants, so a reasonable street layout is needed to avoid the long-term accumulation of pollutants in street canyons on the premise of meeting basic needs. The rationality of the street canyon layout is mainly based on the following considerations [119,120,121,122,123,124]:
(1) The ratio of the height to width values of the street canyon. In the street canyons with different aspect ratios, the distribution trend of different physical parameters is different, but generally speaking, when the aspect ratio is larger, the pollutants are more difficult to be diluted, and the concentration of pollutants in the street canyons is higher. Therefore, in the street layout, besides considering that high-rise buildings can meet more occupancy, it is also necessary to ensure that the ratio of building height to street width is within a relatively reasonable range.
(2) The ratio of the length to width values of the street canyon. Similar to the ratio of the height to width value of the street canyon, when the ratio of the length to width value is larger, the pollutant dispersion capacity of the street canyon is poorer, and the pollutant concentration is higher. Therefore, the streets should not be designed to be too long in the planning process. Crossroads should be set up reasonably to ensure the width of basic streets, preventing pollutants from accumulating in the street canyons for a long time.
(3) Symmetry of the street canyon. When there are multi-story buildings on both sides, the determinant and staggered street canyons are most unfavorable to the dilution of pollutants when the building heights of the upper and lower reaches are 7/3 and 7/2, respectively. Compared with the most unfavorable proportion of street canyons, the air quality improvement rate of the upper stepped street canyon is higher than that of the lower stepped street canyon. Therefore, in urban planning, the most unfavorable proportion and lower stepped street canyons should be avoided as much as possible.
(4) Space between buildings. Upstream buildings have a great influence on the blocking effect of street canyon inflow and the distribution characteristics of pollutants, and the degree of influence is closely related to the distance between the upstream buildings. The results show that the concentration of pollutants in street canyons first increases and then decreases with the increase of the spacing and reaches the maximum value when the spacing is 90 m. Therefore, the appropriate building spacing should be selected in urban planning, and the smaller the spacing within a certain range, the better the dispersion of pollutants.
(5) Orientation of buildings. The angle between buildings and regional mainstream wind direction has a great influence on airflow and ventilation, and appropriate orientation can reduce the air pollution residual time by more than 50%, which is a vital parameter for evaluating the air quality and pollution dispersion.

5.2. Greening Facilities

Green infrastructures in the street canyon environment are considered as an effective air quality improvement measure, which helps to improve the sustainability of the city and cope with the growing urban population [125,126]. Generally speaking, roadside trees, vegetation barriers, green walls, and green roofs are all common green facilities [127]. On the one hand, green vegetation acts as a porous medium, affecting the local dispersion of pollutants, and is conducive to the deposition and filtration of pollutants in the air [128,129]; on the other hand, green facilities can also alleviate the urban heat island effect and climate change and reduce energy consumption and noise pollution [130,131,132].
According to statistics, compared with a scheme without green walls, air pollutants with green walls can be reduced by as much as 95%, and for street canyons with green roofs, the reduction of pollutants can also reach 2–52% [133,134]. Compared with trees and vegetation barriers, green walls and green roofs (Figure 9) have a weaker ability to remove pollutants; however, they have relatively lower space requirements and can become part of the building’s surface and structure, and are therefore better means to improve street canyon pollution.
However, there are also some disputes about the feasibility of using urban vegetation to alleviate street canyon pollution. Although the concentration of pollutants is reduced by the deposition effect on the surface of the vegetation, it should also be noted that trees themselves are obstacles to airflow and reduce the air exchange with the atmosphere above the roof [135]. Therefore, in some cases, vegetation causes an increase in the local pollutant concentration in street canyons [136]. Through a combination of numerical simulation and wind tunnel tests, Li et al. [60] found that aerodynamics and sedimentation effects are the main principles of vegetation to purify the air and increase pollution, respectively, and the main influencing factors are the leaf area density, dimensionless resistance coefficient, and sedimentation speed. Therefore, greening measures cannot be blindly taken to improve the street canyon environment and need to be analyzed according to the actual situation; otherwise, they may have the opposite effect [137].
Considering the best local air quality near the pollution sources, urban trees should be planted far away from pollution sources to avoid their blocking effect on air circulation. Contrarily, in order to obtain the best overall air quality, trees should be planted as close to the pollution source as possible because the ability of trees to remove pollutants increases with an increase in pollutant concentration [138]. Because vegetations have both positive and negative effects on the diffusion of pollutants, it is necessary to consider multi-scale factors and combine different measures when increasing green settings.

5.3. Other Measures

In addition to the street canyon planning layout and greening measures mentioned above, the street canyon environment can be improved in many ways. Table 2 shows some commonly used measures that have proven to be effective by many practices and studies.

6. Summary and Conclusions

This paper reviews past studies on the spread of pollutants in street canyons. From internal mechanisms to external phenomena, the dispersion characteristics of pollutants in street canyons are summarized in this paper, from which several conclusions are achieved:
(1) Forced convection, natural convection, and gravity are the basic motivation of pollutants’ dispersion, and forced convection is the dominant factor most of the time. When the wind speed is high enough, the air inside and above street canyons can be effectively exchanged, and the threshold of wind speed is positively correlated with the AR value. The correlation between PM2.5 concentration and wind speed is poor, but the PM2.5–10 concentration shows a positive correlation with the wind speed. Air convection and turbulent factors affect the horizontal and vertical dispersion, respectively, both of which increase with an increase in temperature difference. The heat island effect is beneficial to pollutant dispersion, while the inversion layer has a negative influence. As for the street layout, the aspect ratios show a positive correlation with pollutant concentration. Due to the physical properties of different pollutants, the gravity effects are variational.
(2) The spatial distribution characteristics of pollutants indicate that the concentration of pollutants decreases with height, and pollutants tend to accumulate on the leeward side of buildings and drop to the background level at a height of several hundred meters. The temporal distribution of pollutants in street canyons varies by diurnal, weekly, and annual periods and is affected by traffic volume, pedestrian flow, and environmental parameters. The concentration on weekdays and Saturdays is higher than that on Sundays, and the peak value of concentration appears in the morning and evening rush hours. In the daytime, the higher temperature inside the street canyon facilitates the air exchange between the street canyon and upper atmosphere and promotes the upward dispersion of pollutants. At night, the inversion layer inhibits the air exchange between the street canyon and above, resulting in the air quality in the early morning being worse than that in the evening. The concentrations of pollutants in street canyons are higher in the morning of winter and in the late afternoon of summer, and the highest concentration is in January.
(3) Through the indoor and outdoor air exchange, pollutants of the street canyon have a significant influence on IAQ, which is evaluated by the I/O ratio and is mainly associated with the microenvironment, ventilation modes, deposition rate, and penetration factor. Typically, the I/O ratios of VOCs are greater than 1, while for six gaseous pollutants, the values are less than 1. However, there is no clear regulation or common conclusion about the I/O ratios for different pollutants categories in past studies.
(4) Measures such as local planning, clean air areas, reduction of public transport emissions, and improvement of public awareness can be taken to improve the air quality in street canyons. Residential areas, schools, hospitals, etc., should be far away from roads with heavy traffic, and facilities such as wind catchers should be added to the street. Urban greening that includes street trees, vegetation barriers, and green walls and roofs can reduce air pollutants effectively due to the aerodynamic and deposition effects, but they may have opposite effects as a result of the obstruction to airflow. Besides, a single intervention measure may not have an obvious improvement effect, and varieties of measures need to be reasonably used together to produce obvious changes.
However, there are also some shortcomings in the current research, and in order to further grasp the characteristics of air pollutants in the street canyon, the following suggestions are put forward for future research:
(1) More long-term, large-scale, and high-precision field measurements are needed, establishing a complete systematic database about the parameters of the wind environment, thermal environment, and pollutants, which can provide an effective reference for subsequent research such as numerical simulation and model experiments.
(2) Some results of the current research are not uniform, such as the fitting equations between pollutant concentration and height, the relationship between particle diameter and indoor–outdoor concentration, etc. Therefore, more research is needed to pay attention to relevant aspects so as to deepen the understanding of street canyon pollutants.
(3) There are many factors that have an impact on the dispersion of pollutants and lack a relational expression that can fully reflect and quantify the effects of various factors, which would be very beneficial to predict and evaluate the street valley environment.

Author Contributions

Conceptualization, Y.W. and J.Z.; methodology, Y.W. and W.L.; investigation, Y.W. and W.L.; writing—original draft preparation, W.L.; writing—review and editing, Y.W., J.Z. and W.L.; funding acquisition, Y.W. All authors have read and agreed to the published version of the manuscript.

Funding

This research was funded by Shanghai Sailing Program: 19YF1451100 and Natural Science Foundation of Shanghai: 21ZR1467900.

Conflicts of Interest

The authors declare no conflict of interest.

References

  1. Su, R.; Jin, X.; Li, H.; Huang, L.; Li, Z. The mechanisms of PM2.5 and its main components penetrate into HUVEC cells and effects on cell organelles. Chemosphere 2020, 241, 125127. [Google Scholar] [CrossRef] [PubMed]
  2. Münzel, T.; Gori, T.; Al-Kindi, S.; Deanfield, J.; Lelieveld, J.; Daiber, A.; Rajagopalan, S. Effects of gaseous and solid constituents of air pollution on endothelial function. Eur. Hear. J. 2018, 39, 3543–3550. [Google Scholar] [CrossRef] [PubMed] [Green Version]
  3. Liu, C.; Chen, R.; Sera, F.; Cabrera, A.M.V.; Guo, Y.; Tong, S.; Coelho, M.S.; Saldiva, P.H.; Lavigne, E.; Matus, P.; et al. Ambient Particulate Air Pollution and Daily Mortality in 652 Cities. N. Engl. J. Med. 2019, 381, 705–715. [Google Scholar] [CrossRef] [PubMed]
  4. Kim, H.; Choe, S.-A.; Kim, O.-J.; Kim, S.-Y.; Kim, S.; Im, C.; Kim, Y.S.; Yoon, T.K. Outdoor air pollution and diminished ovarian reserve among infertile Korean women. Environ. Health Prev. Med. 2021, 26, 1–8. [Google Scholar] [CrossRef] [PubMed]
  5. Lee, D.; Robertson, C.; Ramsay, C.; Gillespie, C.; Napier, G. Estimating the health impact of air pollution in Scotland, and the resulting benefits of reducing concentrations in city centres. Spat. Spatio Temporal Epidemiol. 2019, 29, 85–96. [Google Scholar] [CrossRef] [Green Version]
  6. Costa, L.G.; Cole, T.B.; Dao, K.; Chang, Y.-C.; Garrick, J.M. Developmental impact of air pollution on brain function. Neurochem. Int. 2019, 131, 104580. [Google Scholar] [CrossRef]
  7. Hunter, L.; Johnson, G.; Watson, I. An investigation of three-dimensional characteristics of flow regimes within the urban canyon. Atmos. Environ. Part B Urban Atmos. 1992, 26, 425–432. [Google Scholar] [CrossRef]
  8. Ai, Z.; Mak, C. From street canyon microclimate to indoor environmental quality in naturally ventilated urban buildings: Issues and possibilities for improvement. Build. Environ. 2015, 94, 489–503. [Google Scholar] [CrossRef]
  9. Vardoulakis, S.; Fisher, B.E.; Pericleous, K.; Gonzalez-Flesca, N. Modelling air quality in street canyons: A review. Atmos. Environ. 2003, 37, 155–182. [Google Scholar] [CrossRef] [Green Version]
  10. Oke, T.R. Boundary layer climates. Earth Sci. Rev. 1987, 27, 265. [Google Scholar]
  11. Jiang, G.; Hu, T.; Yang, H. Effects of Ground Heating on Ventilation and Pollutant Transport in Three-Dimensional Urban Street Canyons with Unit Aspect Ratio. Atmosphere 2019, 10, 286. [Google Scholar] [CrossRef] [Green Version]
  12. Rizwan, A.M.; Dennis, L.Y.; Liu, C. A review on the generation, determination and mitigation of Urban Heat Island. J. Environ. Sci. 2008, 20, 120–128. [Google Scholar] [CrossRef]
  13. Mihalakakou, G.; Santamouris, M.; Papanikolaou, N.; Cartalis, C.; Tsangrassoulis, A. Simulation of the Urban Heat Island Phenomenon in Mediterranean Climates. Pure Appl. Geophys. PAGEOPH 2004, 161, 429–451. [Google Scholar] [CrossRef]
  14. Vallati, A.; Mauri, L.; Colucci, C.; Ocłoń, P. Effects of radiative exchange in an urban canyon on building surfaces’ loads and temperatures. Energy Build. 2017, 149, 260–271. [Google Scholar] [CrossRef]
  15. Georgakis, C.; Santamouris, M. On the estimation of wind speed in urban canyons for ventilation purposes—Part 1: Coupling between the undisturbed wind speed and the canyon wind. Build. Environ. 2008, 43, 1404–1410. [Google Scholar] [CrossRef]
  16. Karner, A.A.; Eisinger, D.S.; Niemeier, D.A. Near-Roadway Air Quality: Synthesizing the Findings from Real-World Data. Environ. Sci. Technol. 2010, 44, 5334–5344. [Google Scholar] [CrossRef] [PubMed]
  17. Lu, K.-F.; He, H.-D.; Wang, H.-W.; Li, X.-B.; Peng, Z.-R. Characterizing temporal and vertical distribution patterns of traffic-emitted pollutants near an elevated expressway in urban residential areas. Build. Environ. 2020, 172, 106678. [Google Scholar] [CrossRef]
  18. Zhong, J.; Cai, X.-M.; Bloss, W. Coupling dynamics and chemistry in the air pollution modelling of street canyons: A review. Environ. Pollut. 2016, 214, 690–704. [Google Scholar] [CrossRef]
  19. Lian, R.Y.; Dong, J.S. Study on Motor Vehicle Exhaust Pollution (Co) Control. Traffic Transp. 2013, 1, 142–144. [Google Scholar]
  20. Qian, Z.; Zhang, J.; Wei, F.; E Wilson, W.; Chapman, R.S. Long-term ambient air pollution levels in four Chinese cities: Inter-city and intra-city concentration gradients for epidemiological studies. J. Expo. Sci. Environ. Epidemiol. 2001, 11, 341–351. [Google Scholar] [CrossRef] [Green Version]
  21. Kourtidis, K.A.; Ziomas, I.; Zerefos, C.; Kosmidis, E.; Symeonidis, P.; Christophilopoulos, E.; Karathanassis, S.; Mploutsos, A. Benzene, toluene, ozone, NO2 and SO2 measurements in an urban street canyon in Thessaloniki, Greece. Atmos. Environ. 2002, 36, 5355–5364. [Google Scholar] [CrossRef]
  22. Biersteker, K.; De Graaf, H.; A Nass, C. Indoor air pollution in rotterdam homes. Air Water Pollut 1965, 9, 343–350. [Google Scholar]
  23. Jo, W.-K.; Kim, K.-Y.; Park, K.-H.; Kim, Y.-K.; Lee, H.-W.; Park, J.-K. Comparison of outdoor and indoor mobile source-related volatile organic compounds between low- and high-floor apartments. Environ. Res. 2003, 92, 166–171. [Google Scholar] [CrossRef]
  24. Riain, C.N.; Fisher, B.; Martin, C.J.; Littler, J. Flow Field and Pollution Dispersion in a Central London Street. Environ. Monit. Assess. 1998, 52, 299–314. [Google Scholar] [CrossRef]
  25. Kim, J.-J. A numerical study of the effects of ambient wind direction on flow and dispersion in urban street canyons using the RNG k-ε turbulence model. Atmos. Environ. 2004, 38, 3039–3048. [Google Scholar] [CrossRef]
  26. Li, C.; Zhou, S.; Xiao, Y.; Huang, Q.; Li, L.; Chan, P.W. Effects of inflow conditions on mountainous/urban wind environment simulation. Build. Simul. 2017, 10, 573–588. [Google Scholar] [CrossRef]
  27. Baik, J.J.; Kim, J.J. A numerical study of flow and pollutant dispersion characteristics in urban street canyons. J. Appl. Meteorol. 2010, 38, 1576–1589. [Google Scholar] [CrossRef]
  28. Kim, J.-J.; Baik, J.-J. Effects of inflow turbulence intensity on flow and pollutant dispersion in an urban street canyon. J. Wind. Eng. Ind. Aerodyn. 2003, 91, 309–329. [Google Scholar] [CrossRef]
  29. Moonen, P.; Dorer, V.; Carmeliet, J. Effect of flow unsteadiness on the mean wind flow pattern in an idealized urban environment. J. Wind. Eng. Ind. Aerodyn. 2012, 104–106, 389–396. [Google Scholar] [CrossRef]
  30. Vignati, E.; Berkowicz, R.; Hertel, O. Comparison of air quality in streets of Copenhagen and Milan, in view of the climatological conditions. Sci. Total Environ. 1996, 189–190, 467–473. [Google Scholar] [CrossRef]
  31. Jones, S.G.; Fisher, B.E.A.; Gonzalez-Flesca, N.; Sokhi, R. The Use of Measurement Programmes and Models to Assess Concentrations Next to Major Roads in Urban Areas. Environ. Monit. Assess. 2000, 64, 531–547. [Google Scholar] [CrossRef]
  32. Rincón-Casado, A.; De La Flor, F.S.; Vera, E.C.; Ramos, J.S.; De La Flor, F.J.S. New natural convection heat transfer correlations in enclosures for building performance simulation. Eng. Appl. Comput. Fluid Mech. 2017, 11, 340–356. [Google Scholar] [CrossRef]
  33. Di Sabatino, S.; Barbano, F.; Brattich, E.; Pulvirenti, B. The Multiple-Scale Nature of Urban Heat Island and Its Footprint on Air Quality in Real Urban Environment. Atmosphere 2020, 11, 1186. [Google Scholar] [CrossRef]
  34. Wang, X.; Lei, H.; Han, Z.; Zhou, D.; Shen, Z.; Zhang, H.; Zhu, H.; Bao, Y. Three-dimensional delayed detached-eddy simulation of wind flow and particle dispersion in the urban environment. Atmos. Environ. 2019, 201, 173–189. [Google Scholar] [CrossRef]
  35. Mei, X.; Gong, G. Predicting airborne particle deposition by a modified Markov chain model for fast estimation of potential contaminant spread. Atmos. Environ. 2018, 185, 137–146. [Google Scholar] [CrossRef]
  36. Chen, F.; Kusaka, H.; Bornstein, R.; Ching, J.; Grimmond, S.; Grossman-Clarke, S.; Loridan, T.; Manning, K.W.; Martilli, A.; Miao, S.; et al. The integrated WRF/urban modelling system: Development, evaluation, and applications to urban environmental problems. Int. J. Clim. 2011, 31, 273–288. [Google Scholar] [CrossRef]
  37. Cui, D.; Hu, G.; Ai, Z.; Du, Y.; Mak, C.M.; Kwok, K. Particle image velocimetry measurement and CFD simulation of pedestrian level wind environment around U-type street canyon. Build. Environ. 2019, 154, 239–251. [Google Scholar] [CrossRef]
  38. Georgakis, C.; Santamouris, M. Experimental investigation of air flow and temperature distribution in deep urban canyons for natural ventilation purposes. Energy Build. 2006, 38, 367–376. [Google Scholar] [CrossRef]
  39. Soulhac, L.; Salizzoni, P. Dispersion in a street canyon for a wind direction parallel to the street axis. J. Wind. Eng. Ind. Aerodyn. 2010, 98, 903–910. [Google Scholar] [CrossRef]
  40. Lin, M.; Hang, J.; Li, Y.; Luo, Z.; Sandberg, M. Quantitative ventilation assessments of idealized urban canopy layers with various urban layouts and the same building packing density. Build. Environ. 2014, 79, 152–167. [Google Scholar] [CrossRef]
  41. Hang, J.; Luo, Z.; Sandberg, M.; Gong, J. Natural ventilation assessment in typical open and semi-open urban environments under various wind directions. Build. Environ. 2013, 70, 318–333. [Google Scholar] [CrossRef]
  42. Huang, Y.-D.; Hou, R.-W.; Liu, Z.-Y.; Song, Y.; Cui, P.-Y.; Kim, C.-N. Effects of Wind Direction on the Airflow and Pollutant Dispersion inside a Long Street Canyon. Aerosol Air Qual. Res. 2019, 19, 1152–1171. [Google Scholar] [CrossRef]
  43. Gromke, C.C.; Ruck, B. Pollutant Concentrations in Street Canyons of Different Aspect Ratio with Avenues of Trees for Various Wind Directions. Boundary-Layer Meteorol. 2012, 144, 41–64. [Google Scholar] [CrossRef] [Green Version]
  44. Longley, I.; Gallagher, M.; Dorsey, J.; Flynn, M.; Barlow, J. Short-term measurements of airflow and turbulence in two street canyons in Manchester. Atmos. Environ. 2004, 38, 69–79. [Google Scholar] [CrossRef]
  45. Eliasson, I.; Offerle, B.; Grimmond, S.; Lindqvist, S. Wind fields and turbulence statistics in an urban street canyon. Atmos. Environ. 2006, 40, 1–16. [Google Scholar] [CrossRef]
  46. Santamouris, M.; Papanikolaou, N.; Koronakis, I.; Livada, I.; Asimakopoulos, D. Thermal and air flow characteristics in a deep pedestrian canyon under hot weather conditions. Atmos. Environ. 1999, 33, 4503–4521. [Google Scholar] [CrossRef]
  47. Santamouris, M.; Georgakis, C.; Niachou, A. On the estimation of wind speed in urban canyons for ventilation purposes—Part 2: Using of data driven techniques to calculate the more probable wind speed in urban canyons for low ambient wind speeds. Build. Environ. 2008, 43, 1411–1418. [Google Scholar] [CrossRef]
  48. Niachou, K.; Livada, I.; Santamouris, M. Experimental study of temperature and airflow distribution inside an urban street canyon during hot summer weather conditions—Part I: Air and surface temperatures. Build. Environ. 2008, 43, 1383–1392. [Google Scholar] [CrossRef]
  49. Mills, G.M.; Arnfield, A. Simulation of the energy budget of an urban canyon—II. Comparison of model results with measurements. Atmos. Environ. Part B Urban Atmos. 1993, 27, 171–181. [Google Scholar] [CrossRef]
  50. Bourbia, F.; Awbi, H. Building cluster and shading in urban canyon for hot dry climate: Part 2: Shading simulations. Renew. Energy 2004, 29, 291–301. [Google Scholar] [CrossRef]
  51. Olivardia, F.G.; Zhang, Q.; Matsuo, T.; Shimadera, H.; Kondo, A. Analysis of Pollutant Dispersion in a Realistic Urban Street Canyon Using Coupled CFD and Chemical Reaction Modeling. Atmosphere 2019, 10, 479. [Google Scholar] [CrossRef] [Green Version]
  52. Yuan, C.; Shan, R.; Zhang, Y.; Li, X.-X.; Yin, T.; Hang, J.; Norford, L. Multilayer urban canopy modelling and mapping for traffic pollutant dispersion at high density urban areas. Sci. Total Environ. 2018, 647, 255–267. [Google Scholar] [CrossRef]
  53. Zhang, K.; Chen, G.; Wang, X.; Liu, S.; Mak, C.M.; Fan, Y.; Hang, J. Numerical evaluations of urban design technique to reduce vehicular personal intake fraction in deep street canyons. Sci. Total Environ. 2018, 653, 968–994. [Google Scholar] [CrossRef] [PubMed]
  54. Hoydysh, W.G.; Dabberdt, W.F. Kinematics and dispersion characteristics of flows in asymmetric street canyons. Atmos. Environ. 1988, 22, 2677–2689. [Google Scholar] [CrossRef]
  55. Kukkonen, J.; Valkonen, E.; Walden, J.; Koskentalo, T.; Aarnio, P.; Karppinen, A.; Berkowicz, R.; Kartastenpää, R. A measurement campaign in a street canyon in Helsinki and comparison of results with predictions of the OSPM model. Atmos. Environ. 2001, 35, 231–243. [Google Scholar] [CrossRef]
  56. Kastner-Klein, P.; Plate, E. Wind-tunnel study of concentration fields in street canyons. Atmos. Environ. 1999, 33, 3973–3979. [Google Scholar] [CrossRef]
  57. Eliasson, I. The use of climate knowledge in urban planning. Landsc. Urban Plan. 2000, 48, 31–44. [Google Scholar] [CrossRef]
  58. Hang, J.; Li, Y.; Sandberg, M.; Buccolieri, R.; DI Sabatino, S. The influence of building height variability on pollutant dispersion and pedestrian ventilation in idealized high-rise urban areas. Build. Environ. 2012, 56, 346–360. [Google Scholar] [CrossRef]
  59. Xiaomin, X.; Zhen, H.; Jiasong, W. The impact of urban street layout on local atmospheric environment. Build. Environ. 2006, 41, 1352–1363. [Google Scholar] [CrossRef]
  60. Xue, F.; Li, X. The impact of roadside trees on traffic released PM 10 in urban street canyon: Aerodynamic and deposition effects. Sustain. Cities Soc. 2017, 30, 195–204. [Google Scholar] [CrossRef]
  61. Cheng, Y.; Lee, S.-C.; Gao, Y.; Cui, L.; Deng, W.; Cao, J.; Shen, Z.; Sun, J. Real-time measurements of PM2.5, PM10–2.5, and BC in an urban street canyon. Particuology 2014, 20, 134–140. [Google Scholar] [CrossRef]
  62. Chan, L.; Lau, W.; Wang, X.; Tang, J. Preliminary measurements of aromatic VOCs in public transportation modes in Guangzhou, China. Environ. Int. 2003, 29, 429–435. [Google Scholar] [CrossRef]
  63. Väkevä, M.; Hämeri, K.; Kulmala, M.; Lahdes, R.; Ruuskanen, J.; Laitinen, T. Street level versus rooftop concentrations of submicron aerosol particles and gaseous pollutants in an urban street canyon. Atmos. Environ. 1999, 33, 1385–1397. [Google Scholar] [CrossRef]
  64. Chan, L.; Kwok, W. Vertical dispersion of suspended particulates in urban area of Hong Kong. Atmos. Environ. 2000, 34, 4403–4412. [Google Scholar] [CrossRef]
  65. Xu, J.; Zhang, Y.; Zheng, S.; He, Y. Aerosol effects on ozone concentrations in Beijing: A model sensitivity study. J. Environ. Sci. 2012, 24, 645–656. [Google Scholar] [CrossRef]
  66. Xing, J.; Wang, J.; Mathur, R.; Wang, S.; Sarwar, G.; Pleim, J.; Hogrefe, C.; Zhang, Y.; Jiang, J.; Wong, D.C.; et al. Impacts of aerosol direct effects on tropospheric ozone through changes in atmospheric dynamics and photolysis rates. Atmos. Chem. Phys. Discuss. 2017, 17, 9869–9883. [Google Scholar] [CrossRef] [Green Version]
  67. Li, J.; Wang, Z.; Wang, X.; Yamaji, K.; Takigawa, M.; Kanaya, Y.; Pochanart, P.; Liu, Y.; Irie, H.; Hu, B.; et al. Impacts of aerosols on summertime tropospheric photolysis frequencies and photochemistry over Central Eastern China. Atmos. Environ. 2011, 45, 1817–1829. [Google Scholar] [CrossRef]
  68. Chameides, W.L.; Yu, H.; Liu, S.C.; Bergin, M.; Zhou, X.; Mearns, L.; Wang, G.; Kiang, C.S.; Saylor, R.; Luo, C.; et al. Case study of the effects of atmospheric aerosols and regional haze on agriculture: An opportunity to enhance crop yields in China through emission controls? Proc. Natl. Acad. Sci. USA 1999, 96, 13626–13633. [Google Scholar] [CrossRef] [PubMed] [Green Version]
  69. Lou, S.; Liao, H.; Zhu, B. Impacts of aerosols on surface-layer ozone concentrations in China through heterogeneous reactions and changes in photolysis rates. Atmos. Environ. 2013, 85, 123–138. [Google Scholar] [CrossRef]
  70. Xie, X.; Hao, C.; Huang, Y.; Huang, Z. Influence of TiO2-based photocatalytic coating road on traffic-related NOx pollutants in urban street canyon by CFD modeling. Sci. Total Environ. 2020, 724, 138059. [Google Scholar] [CrossRef]
  71. Dall’Osto, M.; Querol, X.; Amato, F.; Karanasiou, A.; Lucarelli, F.; Nava, S.; Calzolai, G.; Chiari, M. Hourly elemental concentrations in PM2.5 aerosols sampled simultaneously at urban background and road site during SAPUSS–diurnal variations and PMF receptor modelling. Atmos. Chem. Phys. Discuss. 2013, 13, 4375–4392. [Google Scholar] [CrossRef] [Green Version]
  72. Zhu, Q.; Kang, Y.M.; Yang, F.; Zhong, K. Impacts of upstream buildings on the flow fields and pollutant distributions in street canyons. China Environ. Sci. 2015, 35, 45–54. [Google Scholar]
  73. Yang, F.; Zhong, K.; Kang, Y.M. Effects of street geometric configurations on the pollutant dispersion around the canyons. China Environ. Sci. 2015, 35, 706–713. [Google Scholar]
  74. Tsai, M.-Y.; Chen, K.-S.; Wu, C.-H. Three-Dimensional Modeling of Air Flow and Pollutant Dispersion in an Urban Street Canyon with Thermal Effects. J. Air Waste Manag. Assoc. 2005, 55, 1178–1189. [Google Scholar] [CrossRef]
  75. DePaul, F.; Sheih, C. A tracer study of dispersion in an urban street canyon. Atmos. Environ. (1967) 1985, 19, 555–559. [Google Scholar] [CrossRef]
  76. Vardoulakis, S.; Gonzalez-Flesca, N.; Fisher, B. Assessment of traffic-related air pollution in two street canyons in Paris: Implications for exposure studies. Atmos. Environ. 2002, 36, 1025–1039. [Google Scholar] [CrossRef]
  77. Weber, S.; Kuttler, W.; Weber, K. Flow characteristics and particle mass and number concentration variability within a busy urban street canyon. Atmos. Environ. 2006, 40, 7565–7578. [Google Scholar] [CrossRef]
  78. Hagler, G.; Baldauf, R.; Thoma, E.; Long, T.; Snow, R.; Kinsey, J.; Oudejans, L.; Gullett, B. Ultrafine particles near a major roadway in Raleigh, North Carolina: Downwind attenuation and correlation with traffic-related pollutants. Atmos. Environ. 2009, 43, 1229–1234. [Google Scholar] [CrossRef]
  79. Hagler, G.S.; Thoma, E.D.; Baldauf, R.W. High-Resolution Mobile Monitoring of Carbon Monoxide and Ultrafine Particle Concentrations in a Near-Road Environment. J. Air Waste Manag. Assoc. 2010, 60, 328–336. [Google Scholar] [CrossRef]
  80. Hitchins, J.; Morawska, L.; Wolff, R.; Gilbert, D. Concentrations of submicrometre particles from vehicle emissions near a major road. Atmos. Environ. 2000, 34, 51–59. [Google Scholar] [CrossRef] [Green Version]
  81. Hu, S.; Fruin, S.; Kozawa, K.; Mara, S.; Paulson, S.E.; Winer, A.M. A wide area of air pollutant impact downwind of a freeway during pre-sunrise hours. Atmos. Environ. 2009, 43, 2541–2549. [Google Scholar] [CrossRef] [Green Version]
  82. Chow, J.C.; Watson, J.; Edgerton, S.A.; Vega, E.; Ortiz, E. Spatial Differences in Outdoor PM10 Mass and Aerosol Composition in Mexico City. J. Air Waste Manag. Assoc. 2002, 52, 423–434. [Google Scholar] [CrossRef]
  83. Qadir, R.; Schnelle-Kreis, J.; Abbaszade, G.; Arteaga-Salas, J.; Diemer, J.; Zimmermann, R. Spatial and temporal variability of source contributions to ambient PM10 during winter in Augsburg, Germany using organic and inorganic tracers. Chemosphere 2014, 103, 263–273. [Google Scholar] [CrossRef]
  84. Zhou, Y.; I Levy, J. Factors influencing the spatial extent of mobile source air pollution impacts: A meta-analysis. BMC Public Health 2007, 7, 89. [Google Scholar] [CrossRef] [Green Version]
  85. Kimbrough, S.; Baldauf, R.W.; Hagler, G.S.W.; Shores, R.C.; Mitchell, W.; Whitaker, D.A.; Croghan, C.W.; Vallero, D.A.; Kimbrough, E.S. Long-term continuous measurement of near-road air pollution in Las Vegas: Seasonal variability in traffic emissions impact on local air quality. Air Qual. Atmos. Health 2012, 6, 295–305. [Google Scholar] [CrossRef]
  86. Pattinson, W.; Longley, I.; Kingham, S. Using mobile monitoring to visualise diurnal variation of traffic pollutants across two near-highway neighbourhoods. Atmos. Environ. 2014, 94, 782–792. [Google Scholar] [CrossRef]
  87. Padró-Martínez, L.T.; Patton, A.; Trull, J.B.; Zamore, W.; Brugge, D.; Durant, J.L. Mobile monitoring of particle number concentration and other traffic-related air pollutants in a near-highway neighborhood over the course of a year. Atmos. Environ. 2012, 61, 253–264. [Google Scholar] [CrossRef] [PubMed] [Green Version]
  88. Kuuluvainen, H.; Poikkimäki, M.; Järvinen, A.; Kuula, J.; Irjala, M.; Maso, M.D.; Keskinen, J.; Timonen, H.; Niemi, J.; Rönkkö, T. Vertical profiles of lung deposited surface area concentration of particulate matter measured with a drone in a street canyon. Environ. Pollut. 2018, 241, 96–105. [Google Scholar] [CrossRef] [PubMed]
  89. Giemsa, E.; Soentgen, J.; Kusch, T.; Beck, C.; Münkel, C.; Cyrys, J.; Pitz, M. Influence of Local Sources and Meteorological Parameters on the Spatial and Temporal Distribution of Ultrafine Particles in Augsburg, Germany. Front. Environ. Sci. 2021, 8. [Google Scholar] [CrossRef]
  90. Sun, Y.; Cheng, R.; Hou, J.; Song, Y.; Luo, S. Investigation on Indoor Air Quality in Tianjin Residential Buildings. Procedia Eng. 2017, 205, 3811–3815. [Google Scholar] [CrossRef]
  91. Jovanović, M.; Vučićević, B.; Turanjanin, V.; Živković, M.; Spasojević, V. Investigation of indoor and outdoor air quality of the classrooms at a school in Serbia. Energy 2014, 77, 42–48. [Google Scholar] [CrossRef]
  92. Pegas, P.; Nunes, T.; Alves, C.; Silva, J.; Vieira, S.; Caseiro, A.; Pio, C. Indoor and outdoor characterisation of organic and inorganic compounds in city centre and suburban elementary schools of Aveiro, Portugal. Atmos. Environ. 2012, 55, 80–89. [Google Scholar] [CrossRef]
  93. Yang, F.; Zhong, K.; Chen, Y.; Kang, Y. Simulations of the impacts of building height layout on air quality in natural-ventilated rooms around street canyons. Environ. Sci. Pollut. Res. 2017, 24, 23620–23635. [Google Scholar] [CrossRef]
  94. Chen, C.; Zhao, B. Review of relationship between indoor and outdoor particles: I/O ratio, infiltration factor and penetration factor. Atmos. Environ. 2011, 45, 275–288. [Google Scholar] [CrossRef]
  95. Quang, T.N.; He, C.; Morawska, L.; Knibbs, L. Influence of ventilation and filtration on indoor particle concentrations in urban office buildings. Atmos. Environ. 2013, 79, 41–52. [Google Scholar] [CrossRef] [Green Version]
  96. Stasiulaitiene, I.; Krugly, E.; Prasauskas, T.; Ciuzas, D.; Kliucininkas, L.; Kauneliene, V.; Martuzevicius, D. Infiltration of outdoor combustion-generated pollutants to indoors due to various ventilation regimes: A case of a single-family energy efficient building. Build. Environ. 2019, 157, 235–241. [Google Scholar] [CrossRef]
  97. Jeng, C.-J.; Kindzierski, W.B.; Smith, D.W. Particle penetration through rectangular-shaped cracks. J. Environ. Eng. Sci. 2006, 5, S111–S119. [Google Scholar] [CrossRef]
  98. Chen, J.; Brager, G.S.; Augenbroe, G.; Song, X. Impact of outdoor air quality on the natural ventilation usage of commercial buildings in the US. Appl. Energy 2018, 235, 673–684. [Google Scholar] [CrossRef]
  99. Cong, X.C.; Zhao, J.J.; Jing, Z.; Wang, Q.G.; Ni, P.F. Indoor particle dynamics in a school office: Determination of particle concentrations, deposition rates and penetration factors under naturally ventilated conditions. Environ. Geochem. Health 2018, 40, 2511–2524. [Google Scholar] [CrossRef]
  100. Mei, X.; Gong, G. Influence of Indoor Air Stability on Suspended Particle Dispersion and Deposition. Energy Procedia 2017, 105, 4229–4235. [Google Scholar] [CrossRef]
  101. Wallace, L.; Williams, R. Use of Personal-Indoor-Outdoor Sulfur Concentrations to Estimate the Infiltration Factor and Outdoor Exposure Factor for Individual Homes and Persons. Environ. Sci. Technol. 2005, 39, 1707–1714. [Google Scholar] [CrossRef]
  102. Mleczkowska, A.; Strojecki, M.; Bratasz, L.; Kozlowski, R. Particle penetration and deposition inside historical churches. Build. Environ. 2016, 95, 291–298. [Google Scholar] [CrossRef]
  103. Bennett, D.; Koutrakis, P. Determining the infiltration of outdoor particles in the indoor environment using a dynamic model. J. Aerosol Sci. 2006, 37, 766–785. [Google Scholar] [CrossRef]
  104. El Hamdani, S.; Limam, K.; Abadie, M.; Bendou, A. Deposition of fine particles on building internal surfaces. Atmos. Environ. 2008, 42, 8893–8901. [Google Scholar] [CrossRef]
  105. Salonen, H.; Salthammer, T.; Morawska, L. Human exposure to ozone in school and office indoor environments. Environ. Int. 2018, 119, 503–514. [Google Scholar] [CrossRef]
  106. Peng, C.; Ni, P.; Xi, G.; Tian, W.; Fan, L.; Zhou, D.; Zhang, Q.; Tang, Y. Evaluation of particle penetration factors based on indoor PM2.5 removal by an air cleaner. Environ. Sci. Pollut. Res. 2020, 27, 8395–8405. [Google Scholar] [CrossRef]
  107. Hassanvand, M.S.; Naddafi, K.; Faridi, S.; Arhami, M.; Nabizadeh, R.; Sowlat, M.H.; Pourpak, Z.; Rastkari, N.; Momeniha, F.; Kashani, H.; et al. Indoor/outdoor relationships of PM10, PM2.5, and PM1 mass concentrations and their water-soluble ions in a retirement home and a school dormitory. Atmos. Environ. 2014, 82, 375–382. [Google Scholar] [CrossRef]
  108. Colbeck, I.; Nasir, Z.A.; Ali, Z. Characteristics of indoor/outdoor particulate pollution in urban and rural residential environment of Pakistan. Indoor Air 2010, 20, 40–51. [Google Scholar] [CrossRef]
  109. Li, C.-S.; Lin, C.-H. Carbon profile of residential indoor PM1 and PM2.5 in the subtropical region. Atmos. Environ. 2003, 37, 881–888. [Google Scholar] [CrossRef]
  110. Nadali, A.; Arfaeinia, H.; Asadgol, Z.; Fahiminia, M. Indoor and outdoor concentration of PM10, PM2.5 and PM1 in residential building and evaluation of negative air ions (NAIs) in indoor PM removal. Environ. Pollut. Bioavailab. 2020, 32, 47–55. [Google Scholar] [CrossRef] [Green Version]
  111. Jin, R.; Hang, J.; Liu, S.; Wei, J.; Liu, Y.; Xie, J.; Sandberg, M. Numerical investigation of wind-driven natural ventilation performance in a multi-storey hospital by coupling indoor and outdoor airflow. Indoor Built Environ. 2016, 25, 1226–1247. [Google Scholar] [CrossRef]
  112. van Hooff, T.; Blocken, B. CFD evaluation of natural ventilation of indoor environments by the concentration decay method: CO2 gas dispersion from a semi-enclosed stadium. Build. Environ. 2013, 61, 1–17. [Google Scholar] [CrossRef]
  113. Hang, J.; Buccolieri, R.; Yang, X.; Yang, H.; Quarta, F.; Wang, B. Impact of indoor-outdoor temperature differences on dispersion of gaseous pollutant and particles in idealized street canyons with and without viaduct settings. Build. Simul. 2018, 12, 285–297. [Google Scholar] [CrossRef]
  114. Talbot, N.; Kubelova, L.; Makes, O.; Cusack, M.; Ondracek, J.; Vodička, P.; Schwarz, J.; Zdimal, V. Outdoor and indoor aerosol size, number, mass and compositional dynamics at an urban background site during warm season. Atmos. Environ. 2016, 131, 171–184. [Google Scholar] [CrossRef]
  115. Vardoulakis, S.; Kettle, R.; Cosford, P.; Lincoln, P.; Holgate, S.; Grigg, J.; Kelly, F.; Pencheon, D. Local action on outdoor air pollution to improve public health. Int. J. Public Health 2018, 63, 557–565. [Google Scholar] [CrossRef] [PubMed]
  116. Excellence, H.C. Walking and Cycling: Local Measures to Promote Walking and Cycling as Forms of Travel or Recreation; NHS(National Institute for Health and Clinical Excellence): London, UK, 2012. [Google Scholar]
  117. Holgate, S.T. ‘Every breath we take: The lifelong impact of air pollution’—A call for action. Clin. Med. 2017, 17, 8–12. [Google Scholar] [CrossRef] [PubMed] [Green Version]
  118. Ming, T.; Han, H.; Zhao, Z.; De Richter, R.; Wu, Y.; Li, W.; Wong, N.H. Field synergy analysis of pollutant dispersion in street canyons and its optimization by adding wind catchers. Build. Simul. 2020, 14, 391–405. [Google Scholar] [CrossRef]
  119. Tong, N.Y.; Leung, D.Y. Effects of building aspect ratio, diurnal heating scenario, and wind speed on reactive pollutant dispersion in urban street canyons. J. Environ. Sci. 2012, 24, 2091–2103. [Google Scholar] [CrossRef]
  120. Xie, X.; Huang, Z.; Wang, J.; Xie, Z. The impact of solar radiation and street layout on pollutant dispersion in street canyon. Build. Environ. 2005, 40, 201–212. [Google Scholar] [CrossRef]
  121. Memon, R.A.; Leung, D.Y.C.; Liu, C.H. Effects of building aspect ratio and wind speed on air temperatures in urban-like street canyons. Build. Environ. 2010, 45, 176–188. [Google Scholar] [CrossRef]
  122. Hunter, L.; Watson, I.; Johnson, G. Modelling air flow regimes in urban canyons. Energy Build. 1990, 15, 315–324. [Google Scholar] [CrossRef]
  123. Yim, S.; Fung, J.; Lau, A.; Kot, S. Air ventilation impacts of the “wall effect” resulting from the alignment of high-rise buildings. Atmos. Environ. 2009, 43, 4982–4994. [Google Scholar] [CrossRef]
  124. Zhang, Y.; Yu, Y.; Kwok, K.; Yan, F. CFD-based analysis of urban haze-fog dispersion—A preliminary study. Build. Simul. 2020, 14, 365–375. [Google Scholar] [CrossRef]
  125. Kumar, P.; Andrade, M.D.F.; Ynoue, R.; Fornaro, A.; de Freitas, E.D.; Martins, J.; Martins, L.D.; Albuquerque, T.; Zhang, Y.; Morawska, L. New directions: From biofuels to wood stoves: The modern and ancient air quality challenges in the megacity of São Paulo. Atmos. Environ. 2016, 140, 364–369. [Google Scholar] [CrossRef]
  126. Kumar, P.; Khare, M.; Harrison, R.M.; Bloss, W.J.; Lewis, A.; Coe, H.; Morawska, L. New directions: Air pollution challenges for developing megacities like Delhi. Atmos. Environ. 2015, 122, 657–661. [Google Scholar] [CrossRef]
  127. Abhijith, K.; Kumar, P.; Gallagher, J.; McNabola, A.; Baldauf, R.; Pilla, F.; Broderick, B.; DI Sabatino, S.; Pulvirenti, B. Air pollution abatement performances of green infrastructure in open road and built-up street canyon environments—A review. Atmos. Environ. 2017, 162, 71–86. [Google Scholar] [CrossRef]
  128. Fantozzi, F.; Monaci, F.; Blanusa, T.; Bargagli, R. Spatio-temporal variations of ozone and nitrogen dioxide concentrations under urban trees and in a nearby open area. Urban Clim. 2015, 12, 119–127. [Google Scholar] [CrossRef]
  129. Janhäll, S. Review on urban vegetation and particle air pollution—Deposition and dispersion. Atmos. Environ. 2015, 105, 130–137. [Google Scholar] [CrossRef]
  130. Chen, D.; Wang, X.; Thatcher, M.; Barnett, G.; Kachenko, A.; Prince, R. Urban vegetation for reducing heat related mortality. Environ. Pollut. 2014, 192, 275–284. [Google Scholar] [CrossRef]
  131. Matthews, T.; Lo, A.; Byrne, J. Reconceptualizing green infrastructure for climate change adaptation: Barriers to adoption and drivers for uptake by spatial planners. Landsc. Urban Plan. 2015, 138, 155–163. [Google Scholar] [CrossRef]
  132. Salmond, J.A.; Tadaki, M.; Vardoulakis, S.; Arbuthnott, K.; Coutts, A.; Demuzere, M.; Dirks, K.N.; Heaviside, C.; Lim, S.; Macintyre, H.; et al. Health and climate related ecosystem services provided by street trees in the urban environment. Environ. Health 2016, 15, 95–111. [Google Scholar] [CrossRef] [PubMed] [Green Version]
  133. Berardi, U.; GhaffarianHoseini, A.; GhaffarianHoseini, A. State-of-the-art analysis of the environmental benefits of green roofs. Appl. Energy 2014, 115, 411–428. [Google Scholar] [CrossRef]
  134. Manso, M.; Castro-Gomes, J. Green wall systems: A review of their characteristics. Renew. Sustain. Energy Rev. 2015, 41, 863–871. [Google Scholar] [CrossRef]
  135. Buccolieri, R.; Salim, S.M.; Leo, L.; Di Sabatino, S.; Chan, A.; Ielpo, P.; de Gennaro, G.; Gromke, C. Analysis of local scale tree–atmosphere interaction on pollutant concentration in idealized street canyons and application to a real urban junction. Atmos. Environ. 2011, 45, 1702–1713. [Google Scholar] [CrossRef]
  136. Wania, A.; Bruse, M.; Blond, N.; Weber, C. Analysing the influence of different street vegetation on traffic-induced particle dispersion using microscale simulations. J. Environ. Manag. 2012, 94, 91–101. [Google Scholar] [CrossRef]
  137. Rui, L.; Buccolieri, R.; Gao, Z.; Gatto, E.; Ding, W. Study of the effect of green quantity and structure on thermal comfort and air quality in an urban-like residential district by ENVI-met modelling. Build. Simul. 2018, 12, 183–194. [Google Scholar] [CrossRef]
  138. Tallis, M.; Taylor, G.; Sinnett, D.; Freer-Smith, P. Estimating the removal of atmospheric particulate pollution by the urban tree canopy of London, under current and future environments. Landsc. Urban Plan. 2011, 103, 129–138. [Google Scholar] [CrossRef]
  139. MacNaughton, P.; Melly, S.; Vallarino, J.; Adamkiewicz, G.; Spengler, J.D. Impact of bicycle route type on exposure to traffic-related air pollution. Sci. Total Environ. 2014, 490, 37–43. [Google Scholar] [CrossRef] [Green Version]
  140. Hagler, G.S.; Lin, M.-Y.; Khlystov, A.; Baldauf, R.W.; Isakov, V.; Faircloth, J.; Jackson, L.E. Field investigation of roadside vegetative and structural barrier impact on near-road ultrafine particle concentrations under a variety of wind conditions. Sci. Total Environ. 2012, 419, 7–15. [Google Scholar] [CrossRef]
  141. Barth, M.; Boriboonsomsin, K. Energy and emissions impacts of a freeway-based dynamic eco-driving system. Transp. Res. Part D: Transp. Environ. 2009, 14, 400–410. [Google Scholar] [CrossRef]
  142. Caulfield, B.; Brazil, W.; Ni Fitzgerald, K.; Morton, C. Measuring the success of reducing emissions using an on-board eco-driving feedback tool. Transp. Res. Part D: Transp. Environ. 2014, 32, 253–262. [Google Scholar] [CrossRef] [Green Version]
  143. Casale, F.; Nieddu, G.; Burdino, E.; Vignati, D.A.L.; Ferretti, C.; Ugazio, G. Monitoring of Submicron Particulate Matter Concentrations in the Air of Turin City, Italy. Influence of Traffic-limitations. Water Air Soil Pollut. 2008, 196, 141–149. [Google Scholar] [CrossRef]
  144. Quiros, D.C.; Zhang, Q.; Choi, W.; He, M.; Paulson, S.E.; Winer, A.M.; Wang, R.; Zhu, Y. Air quality impacts of a scheduled 36-h closure of a major highway. Atmos. Environ. 2013, 67, 404–414. [Google Scholar] [CrossRef]
Figure 1. Typical flow regimes in street canyons, (a) isolated roughness flow, (b) wake interface flow, (c) skimming flow [10].
Energies 14 06155 g001
Figure 2. A schematic of the urban canopy model [36].
Energies 14 06155 g002
Figure 3. Values of wind speed inside a street canyon vary with height [15]: (a) incoming wind almost parallel to the canyon axis and (b) incoming wind oblique to the canyon axis. The box plot presents the range of the experimental values, while the red bars present the calculated values.
Energies 14 06155 g003
Figure 4. Values of facade temperature of sunny and shady sides [48]: (a) during daytime and (b) nighttime. P(1)–P(5) are measuring points from ground to roof on sunny side; P(6)–P(10) are measuring points from ground to roof on shaded side.
Energies 14 06155 g004
Figure 5. Concentration of vertical profile of lung deposition surface area (LDSA) varying with attitude [88]: (a) measurement day 1 and (b) measurement day 2.
Energies 14 06155 g005
Figure 6. Measure results of daily, weekly, and annual variations of the concentrations of PM10, NO2, CO, and UPF [89].
Energies 14 06155 g006
Figure 7. Three ways for outdoor pollutants to enter rooms [94].
Energies 14 06155 g007
Figure 8. I/O ratios of different particles [110].
Energies 14 06155 g008
Figure 9. Pictures of green roof and green wall.
Energies 14 06155 g009
Table 1. Indoor and outdoor VOCs concentration (μg/m3) of different floors at daytime and night [103].
VOCFloorDaytimeNight
OutdoorIndoorI/OOutdoorIndoorI/O
MTBELow4.55.51.22 6.16.81.11
High4.04.31.08 5.15.71.12
BenzeneLow6.26.31.02 7.713.61.77
High3.55.31.51 4.811.62.42
TolueneLow25.940.21.55 36.957.41.56
High19.830.41.54 24.844.51.79
EthylbenzeneLow4.44.61.05 4.36.11.42
High3.45.11.50 3.78.02.16
Table 2. Some other methods to improve street canyon environment.
MeasuresReasonsBenefitsReferences
Ameliorate sidewalks and lanes planningSidewalks and bicycle lanes are places where passersby are most vulnerable to pollutants By improving the facilities of sidewalks and bicycle lanes, planning bicycle lanes in relatively quiet areas with a good environment, and isolating motor lanes from other roads by vegetation, pedestrians’ exposure to pollutants can be reduced[139,140]
Reduce the emission of traffic pollutantsExhaust from public transportation and private cars is the main source of pollutants in street canyonsThrough environmental protection reform in the vehicle industry, the introduction of reasonable transportation policies, and the encouragement of low-carbon travel, energy can be saved while improving the atmospheric environment[141,142]
Raise public awarenessParticipation of all people is one of the most effective ways to improve the environmentThere are many measures that can be taken, including publicizing air pollution and its relationship with human health through the media; showing enterprises and individuals how to reduce pollution caused by themselves; in some public places, such as hospitals, stations, shopping malls, etc., an electronic screen can be set to display air quality in real-time, and so on[143,144]
Publisher’s Note: MDPI stays neutral with regard to jurisdictional claims in published maps and institutional affiliations.

