
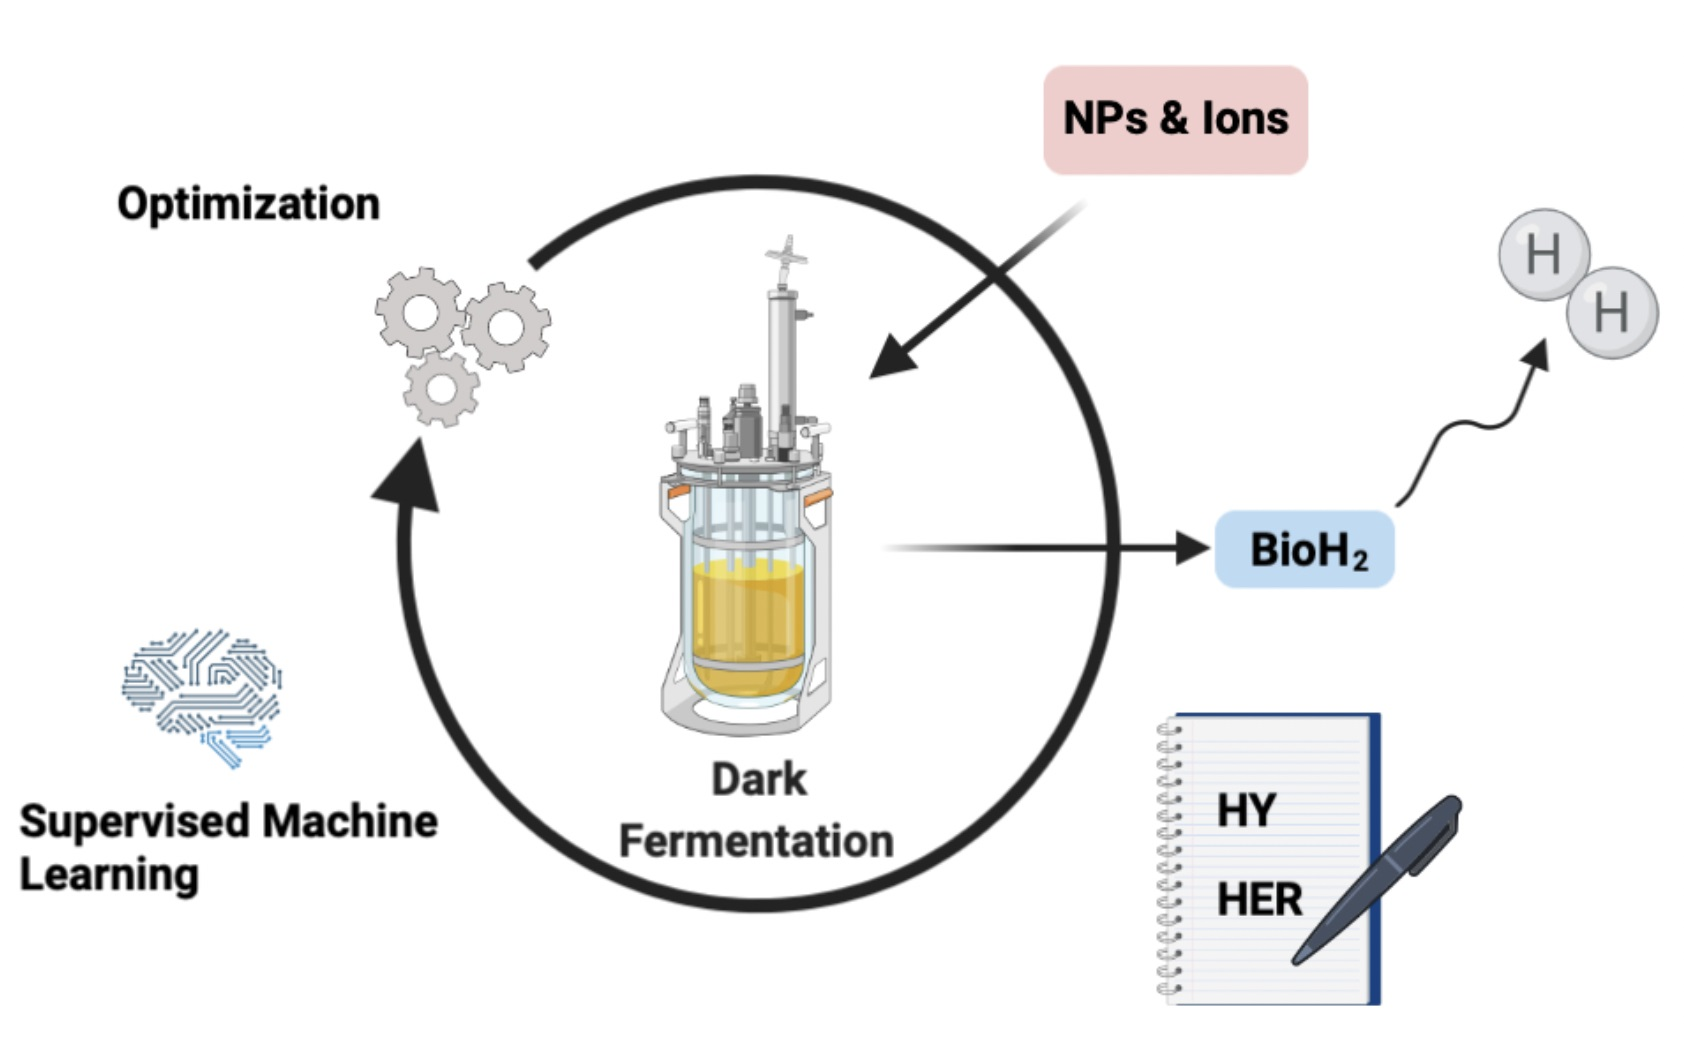
A Review of Enhancement of Biohydrogen Productions by Chemical Addition Using a Supervised Machine Learning Method

Abstract
:
1. Introduction
2. Materials and Methods
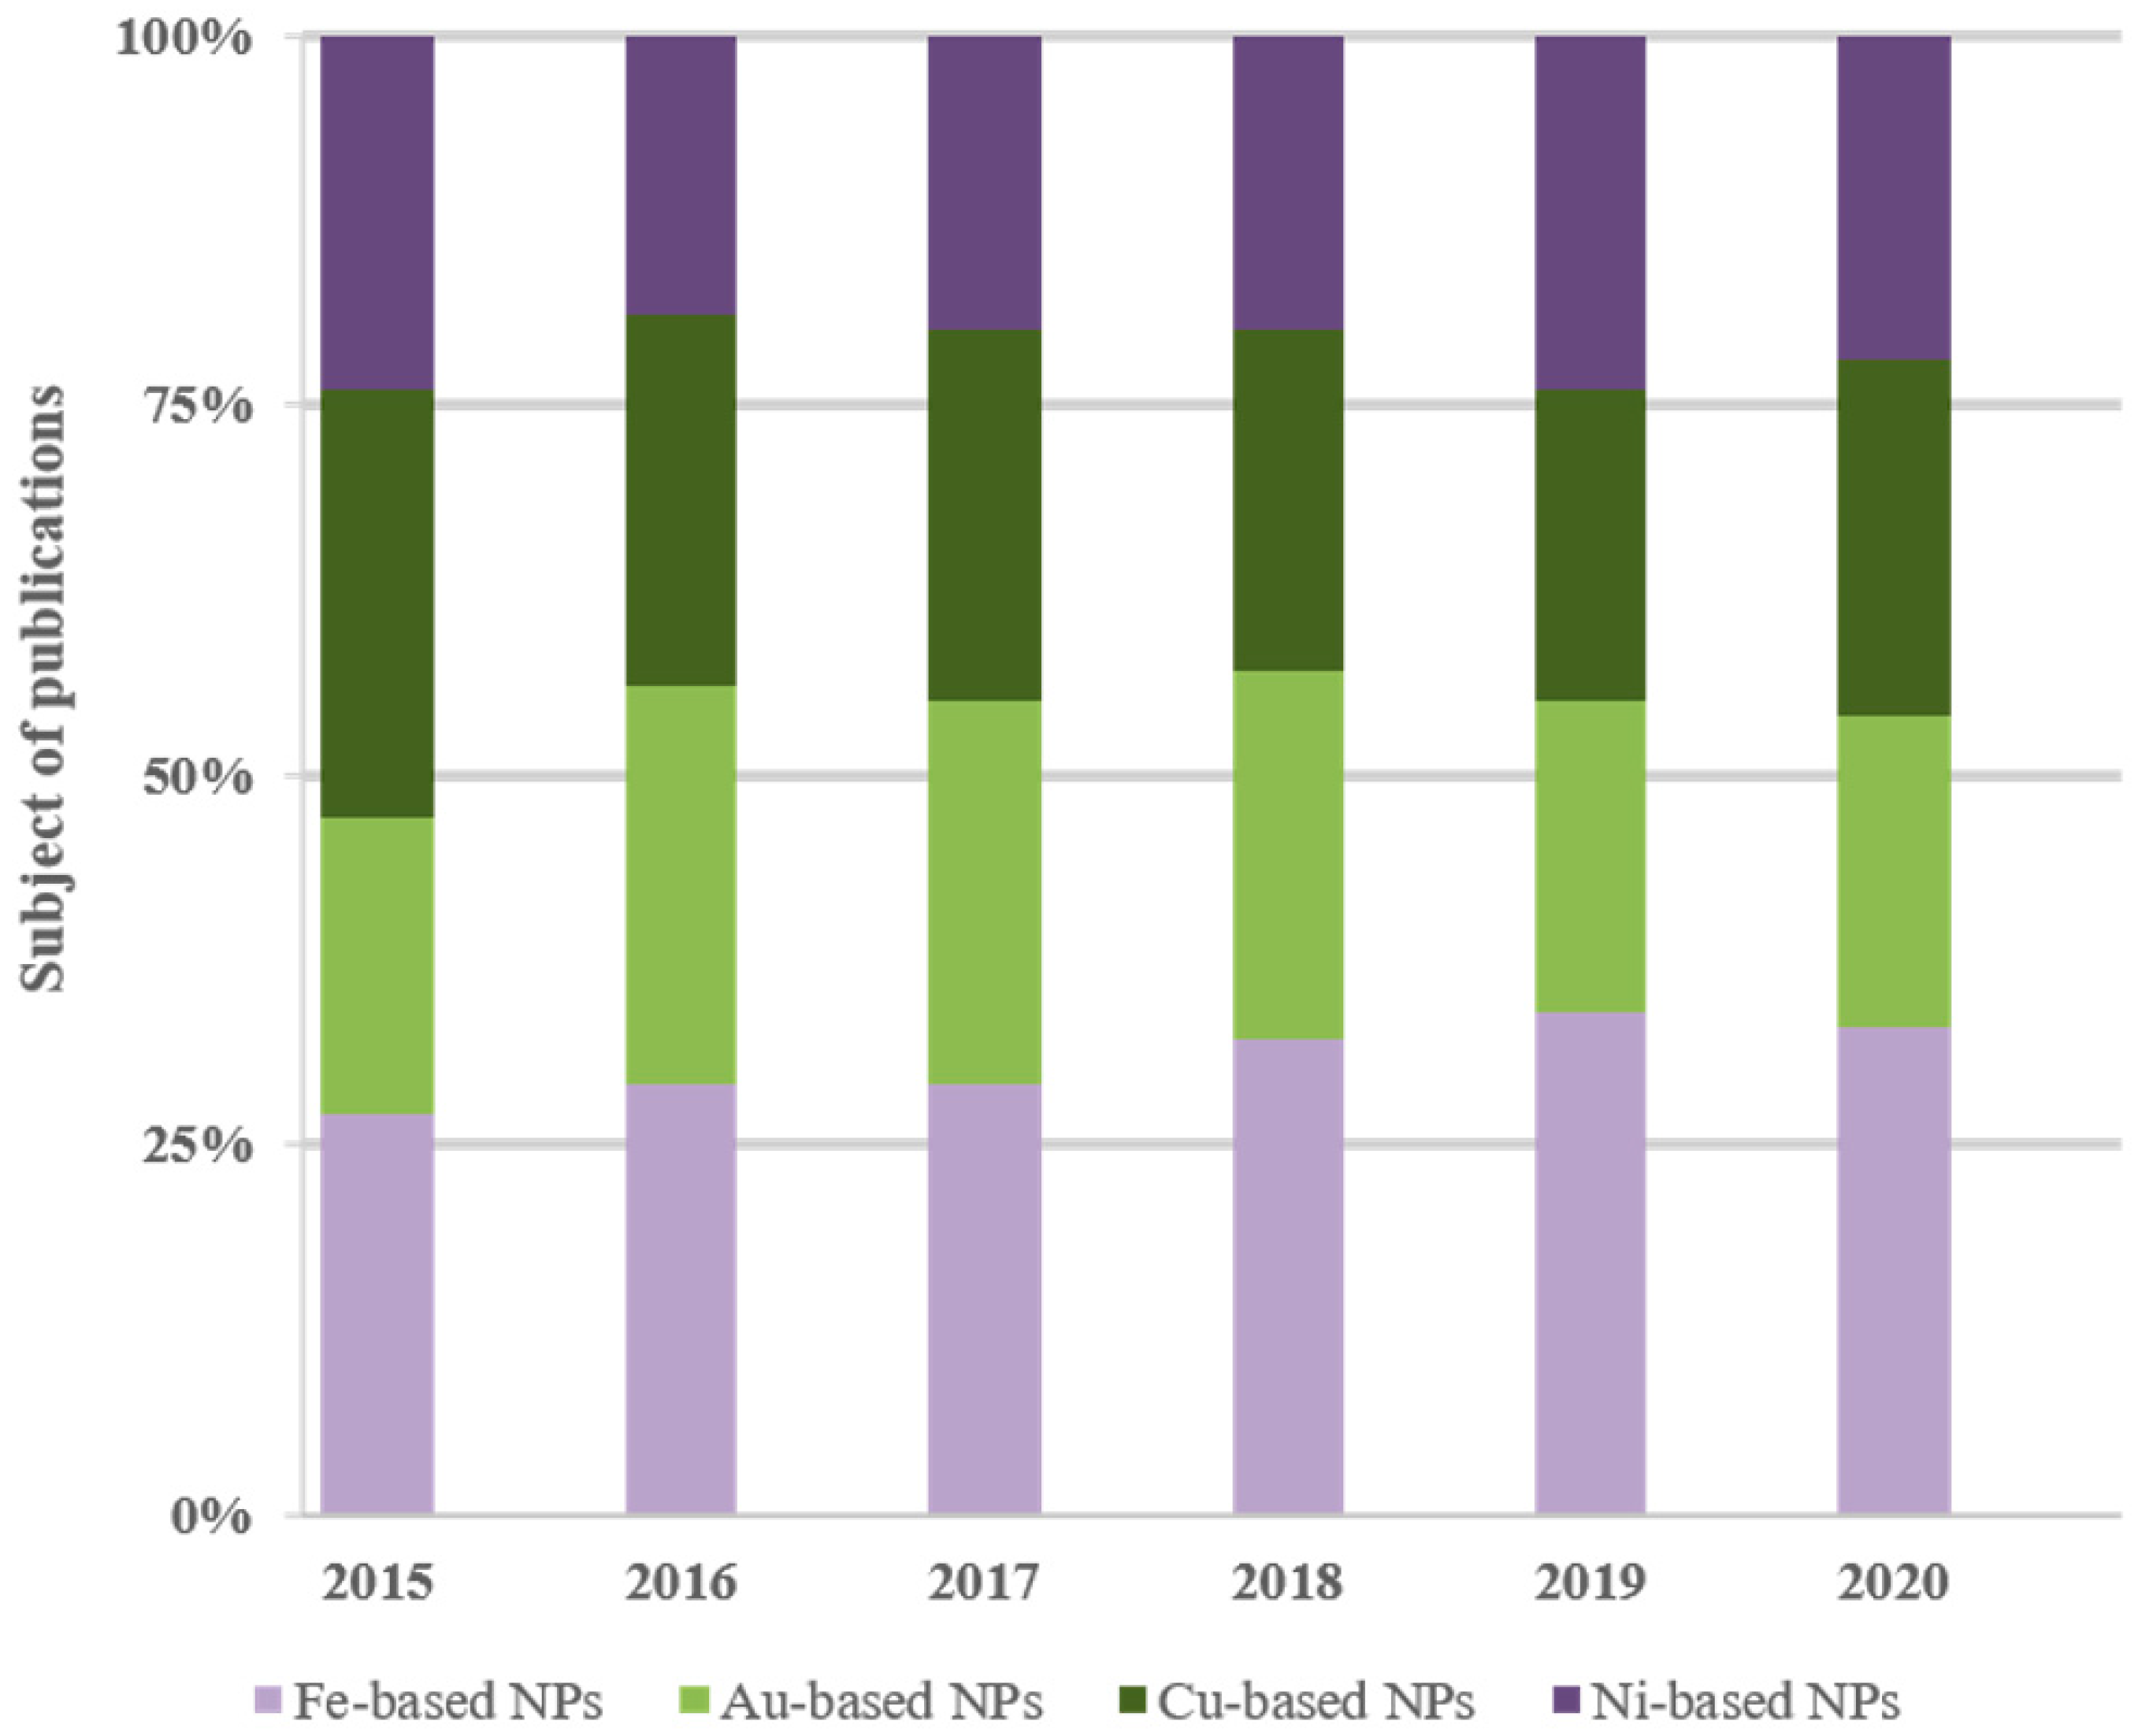
3. Literature Survey Comparisons
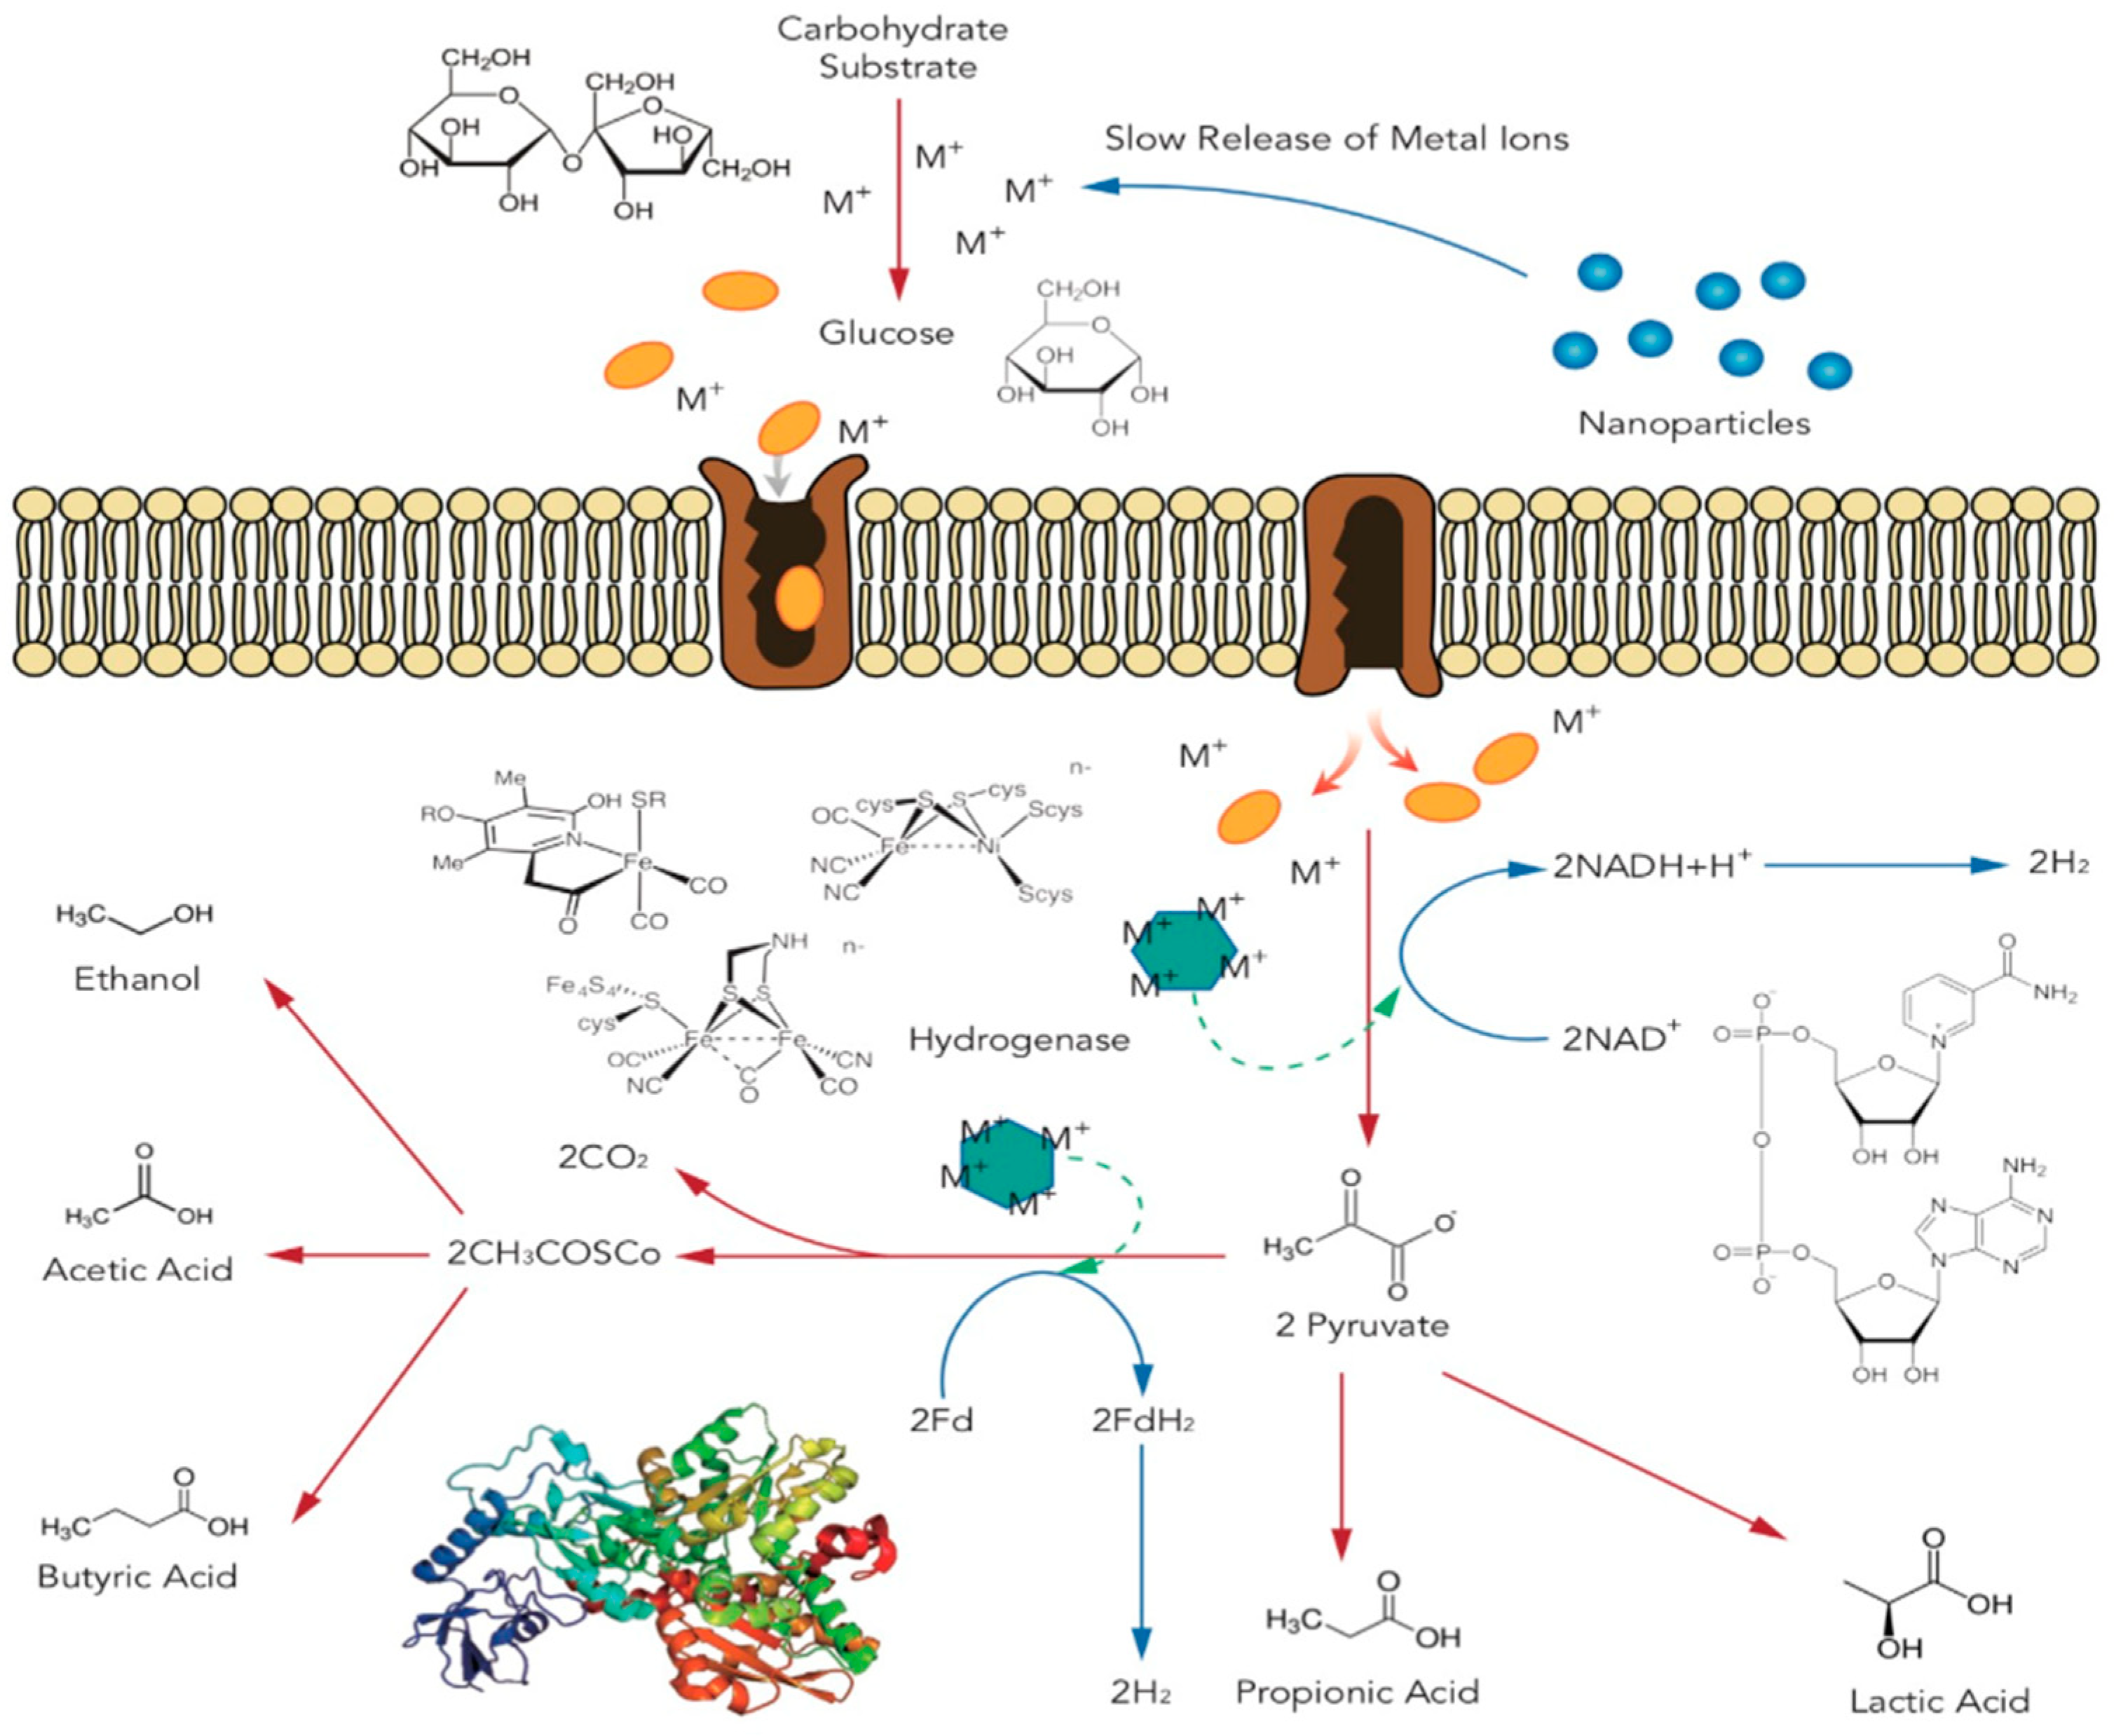
4. Underlying Mechanisms of Metal Ions and Metal-Based Nanoparticles
4.1. Fe-Based Ions and Nanoparticles
4.2. Ni-Based Ions and Nanoparticles
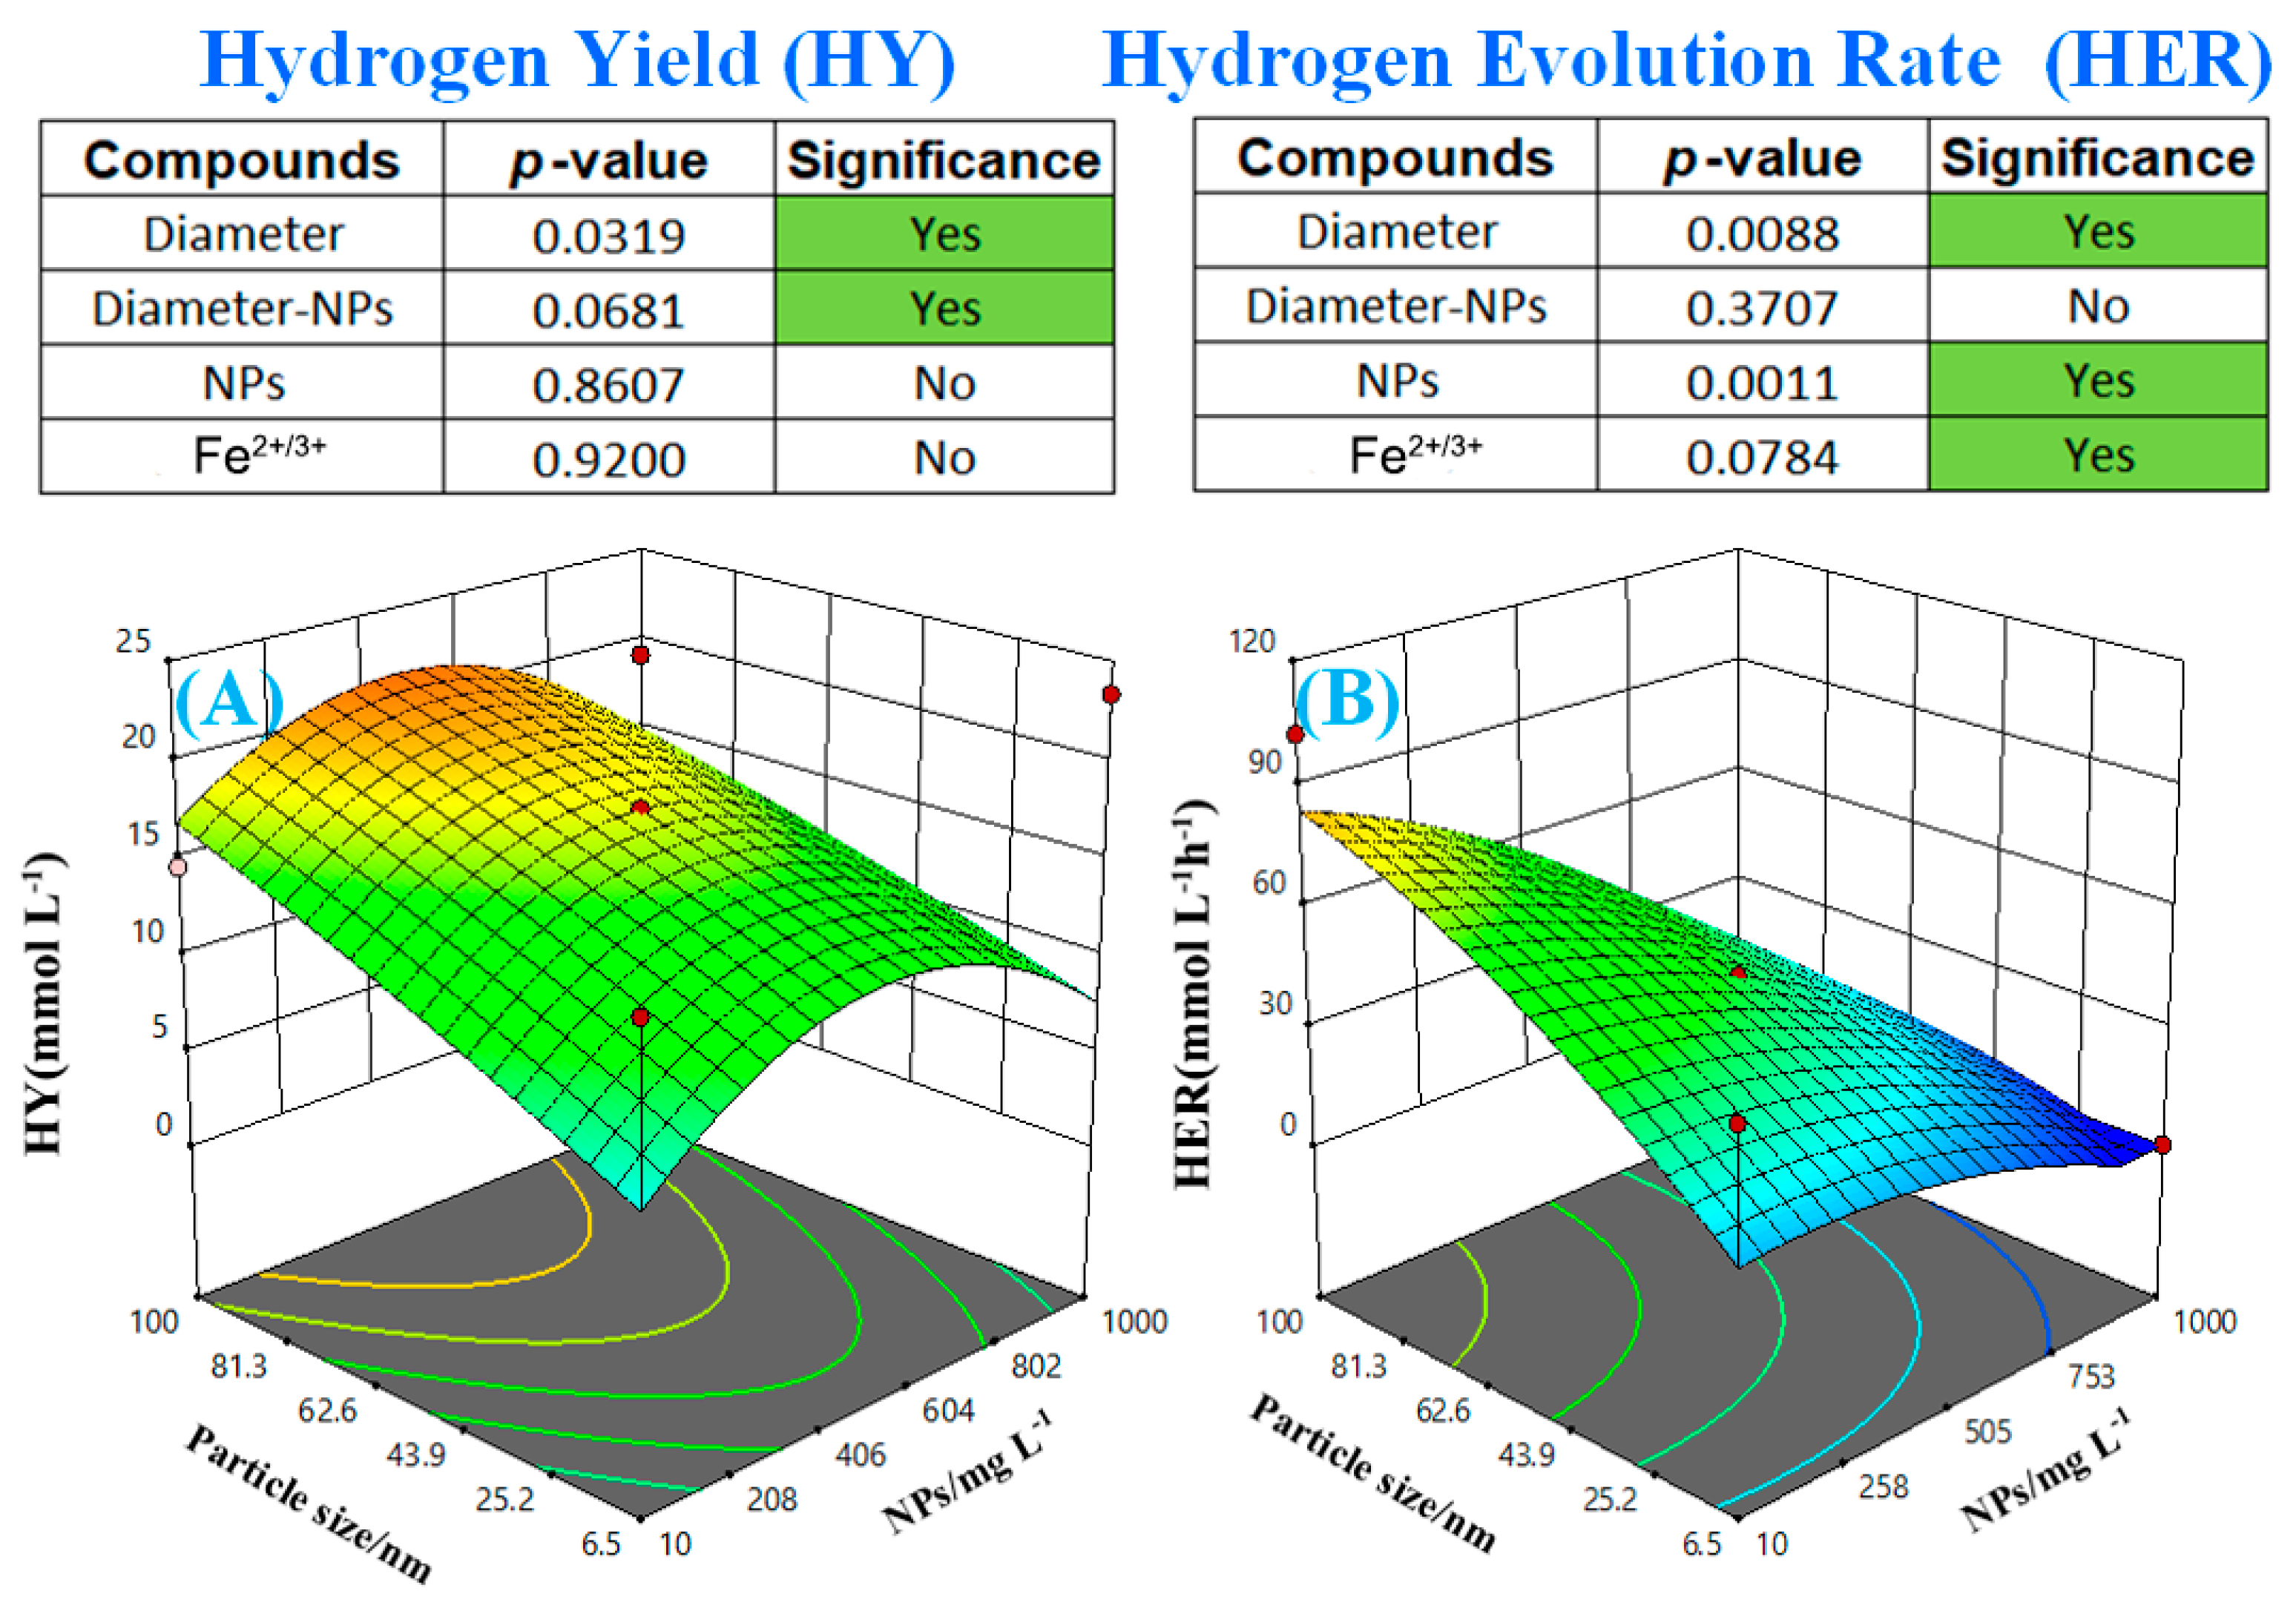
5. Results
5.1. Impact of Fe-Based Ions and NP Addition
5.2. Impact of Ni-Based Ions and NP Addition
5.3. Impact of Other Metal and Non-Metal Nanoparticle Addition
5.4. Impact of Ion Addition
6. Conclusions
Supplementary Materials
Author Contributions
Funding
Institutional Review Board Statement
Informed Consent Statement
Acknowledgments
Conflicts of Interest
Abbreviations
| ANOVA | Analysis of variation |
| ANNs | Artificial neural networks |
| ATR | Auto-thermal reforming |
| BioH2 | Biological hydrogen |
| BBD | Box–Behnken design |
| CCSU | Carbon capture storage and utilization |
| CCD | Central composite design |
| DO | Dissolved oxygen |
| GHE | Greenhouse gas emission |
| H2 | Hydrogen |
| HER | Hydrogen evolution rate |
| HY | Hydrogen yield |
| MSE | Mean square error |
| NGSR | Natural gas steam reforming |
| NGTC | Nature gas thermal cracking |
| NPs | Nanoparticles |
| RSM | Response surface methodology |
References
- Economist, T. Building up the pillars of state. The Economist, 28 March 2020. [Google Scholar]
- Bloomberg, Crude Oil (Nymex). In Bloomberg Energy Index, 2020/04/06 ed.; Bloomberg: New York, NY, USA, 2020.
- Carson, R. Silent Spring; Houghton Mifflin Harcourt: New York, NY, USA, 1962. [Google Scholar]
- Canadell, P.; Quéré, C.L.; Peters, G.; Korsbakken, J.I.; Andrew, R. Eighteen countries showing the way to carbon zero. The Conversation, 26 February 2019. [Google Scholar]
- Wang, Y.; Tang, M.; Yusuf, A.; Wang, Y.; Zhang, X.; Yang, G.; He, J.; Jin, H.; Sun, Y. Preparation of Catalyst from Phosphorous Rock Using an Improved Wet Process for Transesterification Reaction. Ind. Eng. Chem. Res. 2021, 60, 22. [Google Scholar] [CrossRef]
- Liu, Z.; Wang, K.; Chen, Y.; Tan, T.; Nielsen, J. Third-generation biorefineries as the means to produce fuels and chemicals from CO2. Nat. Catal. 2020, 3, 274–288. [Google Scholar] [CrossRef]
- Glenk, G.; Reichelstein, S. Economics of converting renewable power to hydrogen. Nat. Energy 2019, 4, 216–222. [Google Scholar] [CrossRef]
- Sun, Y.; He, J.; Yang, G.; Sun, G.; Sage, V. A review of the enhancement of bio-hydrogen generation by chemicals addition. Catalysts 2019, 9, 353. [Google Scholar] [CrossRef] [Green Version]
- Sun, Y.; Yang, G.; Zhang, L.; Sun, Z. Fischer-Tropsch synthesis in a microchannel reactor using mesoporous silica supported bimetallic Co-Ni catalyst: Process optimization and kinetic modeling. Chem. Eng. Process. Process. Intensif. 2017, 119, 44–61. [Google Scholar] [CrossRef]
- Sun, Y.; Jia, Z.; Yang, G.; Zhang, L.; Sun, Z. Fischer-Tropsch synthesis using iron based catalyst in a microchannel reactor: Performance evaluation and kinetic modeling. Int. J. Hydrog. Energy 2017, 42, 29222–29235. [Google Scholar] [CrossRef]
- Sun, Y.; Yang, G.; Wen, C.; Zhang, L.; Sun, Z. Artificial neural networks with response surface methodology for optimization of selective CO2 hydrogenation using K-promoted iron catalyst in a microchannel reactor. J. CO2 Util. 2018, 24, 10–21. [Google Scholar] [CrossRef]
- Sun, Y.; Wang, Y.; He, J.; Yusuf, A.; Wang, Y.; Yang, G.; Xiao, X. Comprehensive kinetic model for acetylene pretreated mesoporous silica supported bimetallic Co-Ni catalyst during Fischer-Trospch synthesis. Chem. Eng. Sci. 2021, 246, 116828–116844. [Google Scholar] [CrossRef]
- Wang, Y.X.; Tang, M.; Ling, J.; Wang, Y.; Liu, Y.; Jin, H.; He, J.; Sun, Y. Modeling biohydrogen production using different data driven approaches. Int. J. Hydrog. Energy 2021, 46, 29822–29833. [Google Scholar] [CrossRef]
- Kumar, G.; Mathimani, T.; Rene, E.R.; Pugazhendhi, A. Application of nanotechnology in dark fermentation for enhanced biohydrogen production using inorganic nanoparticles. Int. J. Hydrog. Energy 2019, 44, 13106–13113. [Google Scholar] [CrossRef]
- Wang, Y.; Yang, G.; Sage, V.; Xu, J.; Sun, G.; He, J.; Sun, Y. Optimization of dark fermentation for biohydrogen production using a hybrid artificial neural network (ANN) and response surface methodology (RSM) approach. Environ. Prog. Sustain. Energy 2021, 40, e13485. [Google Scholar] [CrossRef]
- Sun, Y.; Yang, G.; Xu, M.; Xu, J.; Sun, Z. A simple coupled ANNs-RSM approach in modeling product distribution of Fischer—Tropsch synthesis using a microchannel reactor with Ru-promoted Co/Al2O3 catalyst. Int. J. Energy Res. 2020, 44, 1046–1061. [Google Scholar] [CrossRef]
- Gadhe, A.; Sonawane, S.S.; Varma, M.N. Enhancement effect of hematite and nickel nanoparticles on biohydrogen production from dairy wastewater. Int. J. Hydrog. Energy 2015, 40, 4502–4511. [Google Scholar] [CrossRef]
- Taherdanak, M.; Zilouei, H.; Karimi, K. Investigating the effects of iron and nickel nanoparticles on dark hydrogen fermentation from starch using central composite design. Int. J. Hydrog. Energy 2015, 40, 12956–12963. [Google Scholar] [CrossRef]
- Trofanchuk, O.; Stein, M.; Geßner, C.; Lendzian, F.; Higuchi, Y.; Lubitz, W. Single crystal EPR studies of the oxidized active site of [NiFe] hydrogenase from Desulfovibrio vulgaris Miyazaki F. JBIC J. Biol. Inorg. Chem. 2000, 5, 36–44. [Google Scholar] [CrossRef]
- Morra, S.; Arizzi, M.; Allegra, P.; La Licata, B.; Sagnelli, F.; Zitella, P.; Gilardi, G.; Valetti, F. Expression of different types of [FeFe]-hydrogenase genes in bacteria isolated from a population of a bio-hydrogen pilot-scale plant. Int. J. Hydrog. Energy 2014, 39, 9018–9027. [Google Scholar] [CrossRef]
- Peters, J.W.; Schut, G.J.; Boyd, E.S.; Mulder, D.W.; Shepard, E.M.; Broderick, J.B.; King, P.W.; Adams, M.W. [FeFe]-and [NiFe]-hydrogenase diversity, mechanism, and maturation. Biochim. Biophys. Acta (BBA)-Mol. Cell Res. 2015, 1853, 1350–1369. [Google Scholar] [CrossRef] [Green Version]
- Kothari, R.; Singh, D.; Tyagi, V.; Tyagi, S. Fermentative hydrogen production–An alternative clean energy source. Renew. Sustain. Energy Rev. 2012, 16, 2337–2346. [Google Scholar] [CrossRef]
- Elreedy, A.; Ibrahim, E.; Hassan, N.; El-Dissouky, A.; Fujii, M.; Yoshimura, C.; Tawfik, A. Nickel-graphene nanocomposite as a novel supplement for enhancement of biohydrogen production from industrial wastewater containing mono-ethylene glycol. Energy Convers. Manag. 2017, 140, 133–144. [Google Scholar] [CrossRef]
- Pohorelic, B.K.; Voordouw, J.K.; Lojou, E.; Dolla, A.; Harder, J.; Voordouw, G. Effects of deletion of genes encoding Fe-only hydrogenase of Desulfovibrio vulgaris Hildenborough on hydrogen and lactate metabolism. J. Bacteriol. 2002, 184, 679–686. [Google Scholar] [CrossRef] [PubMed] [Green Version]
- Vignais, P.M.; Billoud, B. Occurrence, classification, and biological function of hydrogenases: An overview. Chem. Rev. 2007, 107, 4206–4272. [Google Scholar] [CrossRef]
- Kucharska, K.; Hołowacz, I.; Konopacka-Łyskawa, D.; Rybarczyk, P.; Kamiński, M. Key issues in modeling and optimization of lignocellulosic biomass fermentative conversion to gaseous biofuels. Renew. Energy 2018, 129, 384–408. [Google Scholar] [CrossRef]
- Mohanraj, S.; Kodhaiyolii, S.; Rengasamy, M.; Pugalenthi, V. Phytosynthesized iron oxide nanoparticles and ferrous iron on fermentative hydrogen production using Enterobacter cloacae: Evaluation and comparison of the effects. Int. J. Hydrog. Energy 2014, 39, 11920–11929. [Google Scholar] [CrossRef]
- Mohanraj, S.; Kodhaiyolii, S.; Rengasamy, M.; Pugalenthi, V. Green synthesized iron oxide nanoparticles effect on fermentative hydrogen production by Clostridium acetobutylicum. Appl. Biochem. Biotechnol. 2014, 173, 318–331. [Google Scholar] [CrossRef] [PubMed]
- Patel, S.K.; Lee, J.-K.; Kalia, V.C. Nanoparticles in biological hydrogen production: An overview. Indian J. Microbiol. 2018, 58, 8–18. [Google Scholar] [CrossRef] [PubMed]
- Gadhe, A.; Sonawane, S.S.; Varma, M.N. Influence of nickel and hematite nanoparticle powder on the production of biohydrogen from complex distillery wastewater in batch fermentation. Int. J. Hydrog. Energy 2015, 40, 10734–10743. [Google Scholar] [CrossRef]
- Mishra, P.; Thakur, S.; Mahapatra, D.M.; Ab Wahid, Z.; Liu, H.; Singh, L. Impacts of nano-metal oxides on hydrogen production in anaerobic digestion of palm oil mill effluent–A novel approach. Int. J. Hydrog. Energy 2018, 43, 2666–2676. [Google Scholar] [CrossRef]
- Sun, Y.; Yang, G.; Zhang, J.; Wen, C.; Sun, Z. Optimization and kinetic modeling of an enhanced bio-hydrogen fermentation with the addition of synergistic biochar and nickel nanoparticle. Int. J. Energy Res. 2019, 43, 983–999. [Google Scholar] [CrossRef]
- Kodhaiyolii, S.; Mohanraj, S.; Rengasamy, M.; Pugalenthi, V. Phytofabrication of bimetallic Co–Ni nanoparticles using Boerhavia diffusa leaf extract: Analysis of phytocompounds and application for simultaneous production of biohydrogen and bioethanol. Mater. Res. Express 2019, 6, 095051. [Google Scholar] [CrossRef]
- Jiang, X.C.; Hu, J.S.; Lieber, A.M.; Jackan, C.S.; Biffinger, J.C.; Fitzgerald, L.A.; Ringeisen, B.R.; Lieber, C.M. Nanoparticle Facilitated Extracellular Electron Transfer in Microbial Fuel Cells. Nano Lett. 2014, 14, 6737–6742. [Google Scholar] [CrossRef] [Green Version]
- El-Naggar, M.Y.; Wanger, G.; Leung, K.M.; Yuzvinsky, T.D.; Southam, G.; Yang, J.; Lau, W.M.; Nealson, K.H.; Gorby, Y.A. Electrical transport along bacterial nanowires from Shewanella oneidensis MR-1. Proc. Natl. Acad. Sci. USA 2010, 107, 18127–18131. [Google Scholar] [CrossRef] [Green Version]
- Viggi, C.C.; Rossetti, S.; Fazi, S.; Paiano, P.; Majone, M.; Aulenta, F. Magnetite Particles Triggering a Faster and More Robust Syntrophic Pathway of Methanogenic Propionate Degradation. Environ. Sci. Technol. 2014, 48, 7536–7543. [Google Scholar] [CrossRef]
- Wang, J.; Wan, W. Effect of Fe2+ concentration on fermentative hydrogen production by mixed cultures. Int. J. Hydrog. Energy 2008, 33, 1215–1220. [Google Scholar] [CrossRef]
- Frey, M. Hydrogenases: Hydroge—activating enzymes. ChemBioChem 2002, 3, 153–160. [Google Scholar] [CrossRef]
- Shanmugam, S.; Hari, A.; Pandey, A.; Mathimani, T.; Felix, L.; Pugazhendhi, A. Comprehensive review on the application of inorganic and organic nanoparticles for enhancing biohydrogen production. Fuel 2020, 270, 117453. [Google Scholar] [CrossRef]
- Nadeem, F.; Jiang, D.; Tahir, N.; Alam, M.; Zhang, Z.; Yi, W.; Chaoyang, L.; Zhang, Q. Defect engineering in SnO2 nanomaterials: Pathway to enhance the biohydrogen production from agricultural residue of corn stover. Appl. Mater. Today 2020, 21, 100850. [Google Scholar] [CrossRef]
- Shanmugam, S.; Krishnaswamy, S.; Chandrababu, R.; Veerabagu, U.; Pugazhendhi, A.; Mathimani, T. Optimal immobilization of Trichoderma asperellum laccase on polymer coated Fe3O4@SiO2 nanoparticles for enhanced biohydrogen production from delignified lignocellulosic biomass. Fuel 2020, 273, 117777. [Google Scholar] [CrossRef]
- Braga, J.K.; Stancari, R.A.; Motteran, F.; Malavazi, I.; Varesche, M.B.A. Metals addition for enhanced hydrogen, acetic and butyric acids production from cellulosic substrates by Clostridium butyricum. Biomass Bioenergy 2021, 150, 105679. [Google Scholar] [CrossRef]
- Bhatia, S.K.; Jagtap, S.S.; Bedekar, A.A.; Bhatia, R.K.; Rajendran, K.; Pugazhendhi, A.; Rao, C.V.; Atabani, A.; Kumar, G.; Yang, Y.-H. Renewable biohydrogen production from lignocellulosic biomass using fermentation and integration of systems with other energy generation technologies. Sci. Total Environ. 2020, 765, 144429. [Google Scholar] [CrossRef]
- Wang, J.; Wan, W. Influence of Ni2+ concentration on biohydrogen production. Bioresour. Technol. 2008, 99, 8864–8868. [Google Scholar] [CrossRef]
- Yang, G.; Wang, J. Improving mechanisms of biohydrogen production from grass using zero-valent iron nanoparticles. Bioresour. Technol. 2018, 266, 413–420. [Google Scholar] [CrossRef]
- Dolly, S.; Pandey, A.; Pandey, B.K.; Gopal, R. Process parameter optimization and enhancement of photo-biohydrogen production by mixed culture of Rhodobacter sphaeroides NMBL-02 and Escherichia coli NMBL-04 using Fe-nanoparticle. Int. J. Hydrog. Energy 2015, 40, 16010–16020. [Google Scholar] [CrossRef]
- Hsieh, P.-H.; Lai, Y.-C.; Chen, K.-Y.; Hung, C.-H. Explore the possible effect of TiO2 and magnetic hematite nanoparticle addition on biohydrogen production by Clostridium pasteurianum based on gene expression measurements. Int. J. Hydrog. Energy 2016, 41, 21685–21691. [Google Scholar] [CrossRef]
- Yin, Y.; Wang, J. Enhanced biohydrogen production from macroalgae by zero-valent iron nanoparticles: Insights into microbial and metabolites distribution. Bioresour. Technol. 2019, 282, 110–117. [Google Scholar] [CrossRef] [PubMed]
- Engliman, N.S.; Abdul, P.M.; Wu, S.-Y.; Jahim, J.M. Influence of iron (II) oxide nanoparticle on biohydrogen production in thermophilic mixed fermentation. Int. J. Hydrog. Energy 2017, 42, 27482–27493. [Google Scholar] [CrossRef]
- Malik, S.N.; Pugalenthi, V.; Vaidya, A.N.; Ghosh, P.C.; Mudliar, S.N. Kinetics of nano-catalysed dark fermentative hydrogen production from distillery wastewater. Energy Procedia 2014, 54, 417–430. [Google Scholar] [CrossRef] [Green Version]
- Elreedy, A.; Fujii, M.; Koyama, M.; Nakasaki, K.; Tawfik, A. Enhanced fermentative hydrogen production from industrial wastewater using mixed culture bacteria incorporated with iron, nickel, and zinc-based nanoparticles. Water Res. 2019, 151, 349–361. [Google Scholar] [CrossRef]
- Lin, R.; Cheng, J.; Ding, L.; Song, W.; Liu, M.; Zhou, J.; Cen, K. Enhanced dark hydrogen fermentation by addition of ferric oxide nanoparticles using Enterobacter aerogenes. Bioresour. Technol. 2016, 207, 213–219. [Google Scholar] [CrossRef] [PubMed]
- Zaidi, A.A.; RuiZhe, F.; Shi, Y.; Khan, S.Z.; Mushtaq, K. Nanoparticles augmentation on biogas yield from microalgal biomass anaerobic digestion. Int. J. Hydrog. Energy 2018, 43, 14202–14213. [Google Scholar] [CrossRef]
- Wang, J.; Wan, W. The effect of substrate concentration on biohydrogen production by using kinetic models. Sci. China Ser. B Chem. 2008, 51, 1110–1117. [Google Scholar] [CrossRef]
- Reddy, K.; Nasr, M.; Kumari, S.; Kumar, S.; Gupta, S.K.; Enitan, A.M.; Bux, F. Biohydrogen production from sugarcane bagasse hydrolysate: Effects of pH, S/X, Fe2+, and magnetite nanoparticles. Environ. Sci. Pollut. Res. 2017, 24, 8790–8804. [Google Scholar] [CrossRef]
- Han, H.; Cui, M.; Wei, L.; Yang, H.; Shen, J. Enhancement effect of hematite nanoparticles on fermentative hydrogen production. Bioresour. Technol. 2011, 102, 7903–7909. [Google Scholar] [CrossRef]
- Mullai, P.; Yogeswari, M.; Sridevi, K. Optimisation and enhancement of biohydrogen production using nickel nanoparticles–A novel approach. Bioresour. Technol. 2013, 141, 212–219. [Google Scholar] [CrossRef]
- Taherdanak, M.; Zilouei, H.; Karimi, K. The effects of Fe0 and Ni0 nanoparticles versus Fe2+ and Ni2+ ions on dark hydrogen fermentation. Int. J. Hydrog. Energy 2016, 41, 167–173. [Google Scholar] [CrossRef]
- Sun, Y.; Wang, Y.; Yang, G.; Sun, Z. Optimization of biohydrogen production using acid pretreated corn stover hydrolysate followed by nickel nanoparticle addition. Int. J. Energy Res. 2020, 44, 1843–1857. [Google Scholar] [CrossRef]
- Zhang, J.; Zhao, W.; Yang, J.; Li, Z.; Zhang, J.; Zang, L. Comparison of mesophilic and thermophilic dark fermentation with nickel ferrite nanoparticles supplementation for biohydrogen production. Bioresour. Technol. 2021, 329, 124853. [Google Scholar] [CrossRef]
- Zhao, W.; Zhang, Y.; Du, B.; Wei, D.; Wei, Q.; Zhao, Y. Enhancement effect of silver nanoparticles on fermentative biohydrogen production using mixed bacteria. Bioresour. Technol. 2013, 142, 240–245. [Google Scholar] [CrossRef] [PubMed]
- Mohanraj, S.; Anbalagan, K.; Rajaguru, P.; Pugalenthi, V. Effects of phytogenic copper nanoparticles on fermentative hydrogen production by Enterobacter cloacae and Clostridium acetobutylicum. Int. J. Hydrog. Energy 2016, 41, 10639–10645. [Google Scholar] [CrossRef]
- Mohanraj, S.; Anbalagan, K.; Kodhaiyolii, S.; Pugalenthi, V. Comparative evaluation of fermentative hydrogen production using Enterobacter cloacae and mixed culture: Effect of Pd (II) ion and phytogenic palladium nanoparticles. J. Biotechnol. 2014, 192, 87–95. [Google Scholar] [CrossRef] [PubMed]
- Zhang, Y.; Shen, J. Enhancement effect of gold nanoparticles on biohydrogen production from artificial wastewater. Int. J. Hydrog. Energy 2007, 32, 17–23. [Google Scholar] [CrossRef]
- Beckers, L.; Hiligsmann, S.; Lambert, S.D.; Heinrichs, B.; Thonart, P. Improving effect of metal and oxide nanoparticles encapsulated in porous silica on fermentative biohydrogen production by Clostridium butyricum. Bioresour. Technol. 2013, 133, 109–117. [Google Scholar] [CrossRef] [PubMed]
- Ameen, F.; Alsamhary, K.; Alabdullatif, J.A.; ALNadhari, S. A review on metal-based nanoparticles and their toxicity to beneficial soil bacteria and fungi. Ecotoxicol. Environ. Saf. 2021, 213, 112027. [Google Scholar] [CrossRef]
- Pu, Y.; Laratte, B.; Marks, R.S.; Ionescu, R.E. Impact of copper nanoparticles on porcine neutrophils: Ultrasensitive characterization factor combining chemiluminescence information and USEtox assessment model. Mater. Today Commun. 2017, 11, 68–75. [Google Scholar] [CrossRef] [Green Version]
- El-Dalatony, M.M.; Zheng, Y.; Ji, M.-K.; Li, X.; Salama, E.-S. Metabolic pathways for microalgal biohydrogen production: Current progress and future prospectives. Bioresour. Technol. 2020, 318, 124253. [Google Scholar] [CrossRef]
- Sun, Y.; Yang, G.; Zhang, L.; Sun, Z. Fischer-Trospch synthesis using iron-based catalyst in a microchannel reactor: Hybrid lump kinetic with ANNs/RSM. Chem. Eng. Process. Process. Intensif. 2017, 122, 181–189. [Google Scholar] [CrossRef]
- Rambabu, K.; Show, P.-L.; Bharath, G.; Banat, F.; Naushad, M.; Chang, J.-S. Enhanced biohydrogen production from date seeds by Clostridium thermocellum ATCC 27405. Int. J. Hydrog. Energy 2020, 45, 22271–22280. [Google Scholar] [CrossRef]
- Ulhiza, T.A.; Puad, N.I.M.; Azmi, A.S. Optimization of culture conditions for biohydrogen production from sago wastewater by Enterobacter aerogenes using Response Surface Methodology. Int. J. Hydrog. Energy 2018, 43, 22148–22158. [Google Scholar] [CrossRef]
- Zainal, B.S.; Zinatizadeh, A.A.; Chyuan, O.H.; Mohd, N.S.; Ibrahim, S. Effects of process, operational and environmental variables on biohydrogen production using palm oil mill effluent (POME). Int. J. Hydrog. Energy 2018, 43, 10637–10644. [Google Scholar] [CrossRef]
- Usman, M.; Kavitha, S.; Kannah, Y.; Yogalakshmi, K.; Sivashanmugam, P.; Bhatnagar, A.; Kumar, G. A critical review on limitations and enhancement strategies associated with biohydrogen production. Int. J. Hydrog. Energy 2021, 46, 31. [Google Scholar]
- Sethupathy, A.; Kumar, P.S.; Sivashanmugam, P.; Arun, C.; Banu, J.R.; Ashokkumar, M. Evaluation of biohydrogen production potential of fragmented sugar industry biosludge using ultrasonication coupled with egtazic acid. Int. J. Hydrog. Energy 2021, 46, 1705–1714. [Google Scholar] [CrossRef]
- Mirza, S.S.; Qazi, J.I.; Liang, Y.; Chen, S. Growth characteristics and photofermentative biohydrogen production potential of purple non sulfur bacteria from sugar cane bagasse. Fuel 2019, 255, 115805. [Google Scholar] [CrossRef]
- Urbaniec, K.; Bakker, R.R. Biomass residues as raw material for dark hydrogen fermentation–A review. Int. J. Hydrog. Energy 2015, 40, 3648–3658. [Google Scholar] [CrossRef]
- Hu, J.; Nagarajan, D.; Zhang, Q.; Chang, J.-S.; Lee, D.-J. Heterotrophic cultivation of microalgae for pigment production: A review. Biotechnol. Adv. 2018, 36, 54–67. [Google Scholar] [CrossRef]
- Sun, Y.; Mang, J.-P.; Yang, G.; Li, Z.-H. Study on the spectra of spruce lignin with chlorine dioxide oxidation. Spectrochim. Acta Part A Mol. Spectrosc. 2007, 27, 1551–1554. [Google Scholar]
- Tan, M.; Ma, L.; Rehman, M.S.U.; Ahmed, M.A.; Sajid, M.; Xu, X.; Sun, Y.; Cui, P.; Xu, J. Screening of acidic and alkaline pretreatments for walnut shell and corn stover biorefining using two way heterogeneity evaluation. Renew. Energy 2019, 132, 950–958. [Google Scholar] [CrossRef]
- Meghana, M.; Shastri, Y. Sustainable valorization of sugar industry waste: Status, opportunities, and challenges. Bioresour. Technol. 2020, 303, 122929. [Google Scholar] [CrossRef]
- Shuler, M.L. Bioprocess Enzineering: Basic Concepts; Prentice-Hall: New York, NY, USA, 2017; pp. 412–420. [Google Scholar]
- Zhao, X.; Xing, D.; Qi, N.; Zhao, Y.; Hu, X.; Ren, N. Deeply mechanism analysis of hydrogen production enhancement of Ethanoligenens harbinense by Fe2+ and Mg2+: Monitoring at growth and transcription levels. Int. J. Hydrog. Energy 2017, 42, 19695–19700. [Google Scholar] [CrossRef]
- Palomo-Briones, R.; Razo-Flores, E.; Bernet, N.; Trably, E. Dark-fermentative biohydrogen pathways and microbial networks in continuous stirred tank reactors: Novel insights on their control. Appl. Energy 2017, 198, 77–87. [Google Scholar] [CrossRef]
- Wimonsong, P.; Llorca, J.; Nitisoravut, R. Catalytic activity and characterization of Fe–Zn–Mg–Al hydrotalcites in biohydrogen production. Int. J. Hydrog. Energy 2013, 38, 10284–10292. [Google Scholar] [CrossRef]
- Woodward, J.; Orr, M.; Cordray, K.; Greenbaum, E. Enzymatic production of biohydrogen. Nature 2000, 405, 1014–1015. [Google Scholar] [CrossRef]
- Ergal, İ.; Gräf, O.; Hasibar, B.; Steiner, M.; Vukotić, S.; Bochmann, G.; Fuchs, W.; Simon, K.-M.R. Biohydrogen production beyond the Thauer limit by precision design of artificial microbial consortia. Commun. Biol. 2020, 3, 1–12. [Google Scholar] [CrossRef]
- Wang, S.; Tang, H.; Peng, F.; Yu, X.; Su, H.; Xu, P.; Tan, T. Metabolite-based mutualism enhances hydrogen production in a two-species microbial consortium. Commun. Biol. 2019, 2, 1–11. [Google Scholar] [CrossRef] [Green Version]
- Lu, Y.; Zhao, H.; Zhang, C.; Xing, X.-H. Insights into the global regulation of anaerobic metabolism for improved biohydrogen production. Bioresour. Technol. 2016, 200, 35–41. [Google Scholar] [CrossRef] [PubMed]
- Banu, J.R.; Ginni, G.; Kavitha, S.; Kannah, R.Y.; Kumar, S.A.; Bhatia, S.K.; Kumar, G. Integrated biorefinery routes of biohydrogen: Possible utilization of acidogenic fermentative effluent. Bioresour. Technol. 2021, 319, 124241. [Google Scholar] [CrossRef] [PubMed]
- Wang, L. Sustainable Bioenergy Production; CRC Press: Boca Raton, FL, USA, 2019. [Google Scholar]
- Banu, J.R.; Kavitha, S.; Kannah, R.Y.; Bhosale, R.R.; Kumar, G. Industrial wastewater to biohydrogen: Possibilities towards successful biorefinery route. Bioresour. Technol. 2020, 298, 122378. [Google Scholar] [CrossRef] [PubMed]
- Nawaz, M.Z.; Bilal, M.; Tariq, A.; Iqbal, H.M.; Alghamdi, H.A.; Cheng, H. Bio-purification of sugar industry wastewater and production of high-value industrial products with a zero-waste concept. Crit. Rev. Food Sci. Nutr. 2020, 1–18. [Google Scholar] [CrossRef] [PubMed]
- Liu, D.; Sun, Y.; Li, Y.; Lu, Y. Perturbation of formate pathway and NADH pathway acting on the biohydrogen production. Sci. Rep. 2017, 7, 1–8. [Google Scholar]
- Gutekunst, K.; Hoffmann, D.; Westernströer, U.; Schulz, R.; Garbe-Schönberg, D.; Appel, J. In-vivo turnover frequency of the cyanobacterial NiFe-hydrogenase during photohydrogen production outperforms in-vitro systems. Sci. Rep. 2018, 8, 1–10. [Google Scholar]
- Mangayil, R.; Karp, M.; Lamminmäki, U.; Santala, V. Recombinant antibodies for specific detection of clostridial [Fe-Fe] hydrogenases. Sci. Rep. 2016, 6, 1–9. [Google Scholar] [CrossRef] [Green Version]
- Oladokun, O.; Ahmad, A.; Abdullah, T.A.T.; Nyakuma, B.B.; Kamaroddin, M.F.A.; Nor, S.H.M. Biohydrogen production from Imperata cylindrica bio-oil using non-stoichiometric and thermodynamic model. Int. J. Hydrog. Energy 2017, 42, 9011–9023. [Google Scholar] [CrossRef]
- Show, K.-Y.; Lee, D.-J.; Chang, J.-S. Bioreactor and process design for biohydrogen production. Bioresour. Technol. 2011, 102, 8524–8533. [Google Scholar] [CrossRef] [PubMed]
- Wang, Y.; Yang, G.; He, J.; Sun, G.; Sun, Z.; Sun, Y. Preparation of biochar catalyst from black liquor by spray drying and fluidized bed carbonation for biodiesel synthesis. Process. Saf. Environ. Prot. 2020, 141, 333–343. [Google Scholar] [CrossRef]
- Park, J.-H.; Kim, D.-H.; Kim, H.-S.; Wells, G.F.; Park, H.-D. Granular activated carbon supplementation alters the metabolic flux of Clostridium butyricum for enhanced biohydrogen production. Bioresour. Technol. 2019, 281, 318–325. [Google Scholar] [CrossRef] [PubMed]
- Jamali, N.S.; Jahim, J.M.; Isahak, W.N.R.W.; Abdul, P.M. Particle size variations of activated carbon on biofilm formation in thermophilic biohydrogen production from palm oil mill effluent. Energy Convers. Manag. 2017, 141, 354–366. [Google Scholar] [CrossRef]


| NPs | Opt/mg L−1 | Substrate | SC/g L−1 | Size/nm | HY /mmol g−1 | HER /mmol L−1h−1 | Reference |
|---|---|---|---|---|---|---|---|
| Fe (NPs) | 400 | Grass | 10.7 | 50 | 2.9 | 5.4 | [45] |
| Fe (NPs) | 25 | Starch | 5 | 35 | 3 | - | [18] |
| Fe (NPs) | 300 | Malate | 3 | 16 | 20 | 0.4 | [46] |
| Fe (NPs) | 50 | Xylose | 30 | 75 | 13.3 | 2 | [47] |
| Fe (NPs) | 200 | MSJ | 10 | 50 | 0.9 | 2.4 | [48] |
| Fe (NPs) | 200 | Sucrose | 7.5 | 50 | 15.9 | 10.1 | [27] |
| Fe (NPs) | 175 | Glucose | 7.5 | 59 | 12.9 | 5.69 | [28] |
| Fe (NPs) | 50 | Starch | 6 | 35 | 5 | - | [43] |
| Fe (NPs) | 250 | Malate | 4 | 12 | 24.2 | 0.8 | [44] |
| Fe2O3 (NPs) | 50 | Glucose | 5 | 50 | 1.92 | 2.5 | [49] |
| Fe2O3 (NPs) | 50 | CDW | 15.3 | 33 | 16.75 | 102.5 | [17] |
| Fe2O3 (NPs) | 200 | DW | 56 | 23 | 7.85 | 62.4 | [30] |
| Fe2O3 (NPs) | 50 | Wastewater | 110 | 6.5 | 1.9 | 49.4 | [50] |
| Fe2O3 (NPs) | 200 | MEG | 4 | 100 | 8.4 | 0.6 | [51] |
| Fe2O3 (NPs) | 300 | CAS | 10 | 20 | 3.875 | 1.92 | [52] |
| Fe2O3 (NPs) | 200 | Glucose | 10 | 20 | 9.2 | 3.1 | [52] |
| Fe2O3 (NPs) | 60 | Glucose | 6 | 60 | 1.92 | 2.5 | [49] |
| Fe3O4(NPs) | 10 | Glucose | 2.5 | 100 | 10.1 | 0.23 | [53] |
| Fe3O4(A-C-NPs) | 250 | Glucose | 5 | 30 | 11.656 | 3.2 | [38] |
| GT-INP (Fe2O4 and FeO(OH)(NPs) | 1000 | CO | 1.008 | 70 | 1.58 | 0.0662 | [54] |
| Magnetite (NPs) | 200 | SJ | 3 | 50 | 6.7 | 0.23 | [55] |
| Hematite (NPs) | 200 | Sucrose | 12.5 | 55 | 10.4 | 6 | [56] |
| Nanoparticles | Opt/mg L−1 | Substrate | SC/g L−1 | Size/nm | HY /mmol g−1 | HER /mmol L−1h−1 | Reference |
|---|---|---|---|---|---|---|---|
| Ni (NPs) | 5.7 | Glucose | 14.01 | 13.6 | 14.1 | 11.5 | [57] |
| Ni (NPs) | 32 | Starch | 8 | 80 | 2.4 | 10.3 | [18] |
| Ni (NPs) | 60 | MEG | 4.7 | 60 | 1.11 | 1.5 | [23] |
| Ni (NPs) | 10 | Glucose | 1 | 25 | 9.5 | 30 | [32] |
| Ni (NPs) | 1 | Glucose | 2.5 | 100 | 11.7 | 0.28 | [53] |
| Ni (NPs) | 4.3 | Glucose | 13.92 | 28 | 12.7 | 10.4 | [57] |
| Ni (NPs) | 2.5 | Glucose | 5 | 42.5 | 10.8 | 1.3 | [58] |
| Ni (NPs) | 25 | Starch | 10 | 40 | 2.7 | 11.5 | [18] |
| Ni (NPs) | 11 | Glucose | 2.7 | 120 | 1.21 | 0.22 | [59] |
| NiO (NPs) | 20 | MEG | 4 | 100 | 7.25 | 0.5 | [51] |
| NiO (NPs) | 10 | CDW | 15.3 | 23 | 15.7 | 44.9 | [17] |
| NiO (NPs) | 1.5 | Wastewater | 9.6 | 23.6 | 0.5 | 12 | [31] |
| Ni (NPs) | 100 | CS | 20 | 50 | 20 | 0.27 | [60] |
| NPs | Opt/mg L−1 | Substrate | SC/g L−1 | Size/nm | HY /mmol g−1 | HER /mmol L−1h−1 | Reference |
|---|---|---|---|---|---|---|---|
| Ag | 0.002 | Glucose | 12.5 | 15 | 13.8 | 10.5 | [61] |
| Cu | 2.5 | Glucose | 2.5 | 97 | 2.8 | 5.4 | [62] |
| Pd | 5 | Glucose | 10 | 100 | 8.1 | 6.7 | [63] |
| Au | 0.002 | Sucrose | 15 | 5 | 7.5 | 7.3 | [64] |
| Co | 1 | Glucose | 2.5 | 100 | 4.85 | 0.16 | [53] |
| CoO | 1 | POME | 76.5 | 17 | 22.5 | 0.7 | [31] |
| TiO2 | 100 | Xylose | 30 | 30 | 12 | 1.8 | [47] |
| ZnO | 10 | MEG | 4 | 100 | 7.3 | 0.58 | [51] |
| MgO | 1 | Glucose | 100 | 100 | 4.3 | 0.1 | [53] |
| Cu/SiO2 | 0.064 | Glucose | 5 | 2.5 | 5.8 | 0.54 | [65] |
| Ag/SiO2 | 0.107 | Glucose | 5 | 2.5 | 5.4 | 0.5 | [65] |
| Pd/SiO2 | 0.207 | Glucose | 5 | 2.5 | 5.4 | 0.52 | [65] |
| Source | Sum of Squares | DF | Mean Square | F-Value | p-Value |
|---|---|---|---|---|---|
| Model | 38,286.08 | 20 | 1914.30 | 4.16 | 0.0005 |
| A-Mg2+ | 2467.73 | 1 | 2467.73 | 5.36 | 0.0291 |
| B-Cu2+ | 1729.50 | 1 | 1729.50 | 3.75 | 0.0640 |
| C-Na+ | 7543.84 | 1 | 7543.84 | 16.38 | 0.0004 |
| D-NH4+ | 496.57 | 1 | 496.57 | 1.08 | 0.3091 |
| E-K+ | 261.49 | 1 | 261.49 | 0.5677 | 0.4582 |
| AB | 7903.35 | 1 | 7903.35 | 17.16 | 0.0003 |
| AC | 1957.27 | 1 | 1957.27 | 4.25 | 0.0498 |
| AD | 513.91 | 1 | 513.91 | 1.12 | 0.3009 |
| AE | 1109.51 | 1 | 1109.51 | 2.41 | 0.1332 |
| BC | 41.84 | 1 | 41.84 | 0.0908 | 0.7656 |
| BD | 330.26 | 1 | 330.26 | 0.7170 | 0.4052 |
| BE | 16.50 | 1 | 16.50 | 0.0358 | 0.8514 |
| CD | 4919.66 | 1 | 4919.66 | 10.68 | 0.0031 |
| CE | 2100.83 | 1 | 2100.83 | 4.56 | 0.0427 |
| DE | 1719.79 | 1 | 1719.79 | 3.73 | 0.0647 |
| A2 | 801.66 | 1 | 801.66 | 1.74 | 0.1990 |
| B2 | 3897.09 | 1 | 3897.09 | 8.46 | 0.0075 |
| C2 | 2148.80 | 1 | 2148.80 | 4.67 | 0.0406 |
| D2 | 387.39 | 1 | 387.39 | 0.8410 | 0.3679 |
| E2 | 1539.54 | 1 | 1539.54 | 3.34 | 0.0795 |
| Residue | 11,515.22 | 25 | 460.61 | ||
| Lack of fit | 11,515.22 | 20 | 575.76 | ||
| Pure Error | 0.0000 | 5 | 0.0000 | ||
| Cor total | 49,801.31 | 45 |
Publisher’s Note: MDPI stays neutral with regard to jurisdictional claims in published maps and institutional affiliations. |
© 2021 by the authors. Licensee MDPI, Basel, Switzerland. This article is an open access article distributed under the terms and conditions of the Creative Commons Attribution (CC BY) license (https://creativecommons.org/licenses/by/4.0/).
Share and Cite
Liu, Y.; Liu, J.; He, H.; Yang, S.; Wang, Y.; Hu, J.; Jin, H.; Cui, T.; Yang, G.; Sun, Y. A Review of Enhancement of Biohydrogen Productions by Chemical Addition Using a Supervised Machine Learning Method. Energies 2021, 14, 5916. https://doi.org/10.3390/en14185916
Liu Y, Liu J, He H, Yang S, Wang Y, Hu J, Jin H, Cui T, Yang G, Sun Y. A Review of Enhancement of Biohydrogen Productions by Chemical Addition Using a Supervised Machine Learning Method. Energies. 2021; 14(18):5916. https://doi.org/10.3390/en14185916
Chicago/Turabian StyleLiu, Yiyang, Jinze Liu, Hongzhen He, Shanru Yang, Yixiao Wang, Jin Hu, Huan Jin, Tianxiang Cui, Gang Yang, and Yong Sun. 2021. "A Review of Enhancement of Biohydrogen Productions by Chemical Addition Using a Supervised Machine Learning Method" Energies 14, no. 18: 5916. https://doi.org/10.3390/en14185916