Article

A Hybrid Maximum Power Point Tracking Method without Oscillations in Steady-State for Photovoltaic Energy Systems †

Department of Electrical Engineering, National Yunlin University of Science and Technology, Douliou 640, Taiwan
*
Author to whom correspondence should be addressed.
This paper is an extended version of our paper published in 2017 IEEE Conference on Energy Conversion (CENCON), Kuala Lumpur, Malaysia, 30–31 October 2017; pp. 5–9.
Energies 2021, 14(18), 5590; https://doi.org/10.3390/en14185590
Submission received: 20 July 2021 / Revised: 30 August 2021 / Accepted: 2 September 2021 / Published: 7 September 2021
(This article belongs to the Collection Featured Papers in Solar Energy and Photovoltaic Systems Section)

Abstract

:
This paper proposes a hybrid maximum power point tracking (MPPT) method with zero oscillation in steady-state by combining genetic algorithm (GA) and perturbation and observation (P&O) method. The proposed MPPT can track the global maximum power point (GMPP) fast for a photovoltaic (PV) system even under partial shaded conditions (PSC). The oscillations around the GMPP are eliminated and the power loss can be reduced significantly. In addition, the proposed MPPT can make the PV system operate at the highest efficiencies under various atmospheric conditions. During the MPP tracking, the system will oscillate around the MPPs, resulting in unnecessary power loss. To solve the problem, the artificial intelligence (AI) algorithms, such as PSO, Bee Colony optimization, GA, etc., were developed to deal with this issue. However, the problem with the AI algorithm is that the time for convergence may be too long if the range of the MPP search space is large. In addition, if the atmospheric conditions change fast, the PV system may operate at or close to the local maximum power points (LMPPs) for a long time. In this paper, a method combining the P&O’s fast tracking and GA’s GMPP tracking ability is proposed. The proposed system can stop the oscillations as soon as the GMPP is found, thus minimizing the power loss due to oscillations. The proposed MPPT can achieve superior performance while maintaining the simplicity of implementation. Finally, the simulation and experimental results are presented to demonstrate the feasibility of the proposed system.

1. Introduction

With the increasing growth of renewable energy, photovoltaic (PV) systems are increasingly used to generate electrical power from solar irradiation incident on PV modules. The PV system installation is expected to reach 800 GW by the year 2030. This growth of PV system market is great because the available solar energy is plentiful, free, sustainable, and pollution free [1]. Although PV systems have many advantages, they have major problems: (1) low efficiency that can hardly reach 20%, (2) the conversion efficiency is worse when the weather is bad, and (3) nonlinear electrical characteristics. Normally, the efficiency of PV system mainly depends on solar irradiance level and atmospheric temperature [2,3]. Therefore, PV systems should be operated at maximum power points (MPPs) to achieve the highest possible efficiencies. A maximum power point tracking (MPPT) system is one of the important components that each PV system should include to ensure that the highest possible power is generated. The MPPT controller is an electronic control system, which monitors PV terminal voltage/current and achieves MPPT by controlling the duty ratio of a DC/DC converter to match the output load to the PV source. An efficient MPPT system is designed to track the MPPs at all times under various conditions. The MPPT control should be simple, accurate, and cost effective [4].
In [5,6,7,8,9,10], several control schemes have been presented to track the MPPs for PV systems. Some of these methods have simple configurations but low efficiencies due to the use of open-circuit voltage and short-circuit current method. These methods work well at relatively stable atmospheric conditions. In [3,11], many system parameters are required to implement the MPPT, such as irradiance (G), temperature (T), etc. Adding these parameters can enhance the tracking efficiency, but more sensors are required. Therefore, the complexity and cost of the whole system increases. The methods such as the hill-climbing (HC), perturbation and observation (P&O) [12,13,14,15,16,17] and the incremental conductance (INCs) can obtain high efficiency with a low computational cost, thus they have gained a primary position among the MPPT algorithms. However, these algorithms suffer from: (1) Operating at local maximum power points (LMPPs) under partial shaded conditions (PSCs), (2) The steady-state oscillations cause large power loss.
The PV modules are formed by placing many cells in series, then the PV system is formed by placing several PV modules in series in a string. In practical applications, differences exist between the output powers of the cells in different PV modules, e.g., due to part of the modules being shaded or pollutions on one or more cells. When PSC occurs for the PV system, multiple power peaks will appear on the P-V curve [18]. If there are more than two zero-slope points on the curve, the system with the conventional P&O may not work at the real GMPPs, resulting in the reduction of system efficiency [19,20,21].
PSCs often occur in large PV systems and cause losses in system output power. To deal with the tracking for PV system under PSCs [12,13,22,23,24], many algorithms have been proposed, such as artificial neural network (ANN) [10], particle swarm optimization (PSO) [13,18,19], fuzzy-logic control (FLC) [18], genetic algorithm (GA) [9,10], and two-stage searching [22]. Most of them have good tracking performance, but it takes longer to track the global maximum power points (GMPPs). Two-stage searching combines traditional MPPT methods to enhance tracking speed, but it cannot ensure successful GMPPT, even the tracking speed depends on the parameter used in the method [22]. For the ANN method, increasing training data and expensive sensors are required for the PSC. Although the advantages of FLC are rapid tracking speed and high tracking accuracy, a higher hardware cost is required. GA is one of the soft computing methods, and it is complex and difficult to implement with low-cost microcontrollers. PSO is an optimization method based on swarming, and it can track the GMPP in two seconds. However, a powerful microcontroller is required for digital implementation. For most of these computing methods, only simulated results are provided [22]. Load-line MPPT can track the GMPP in less than one second, however, it can only track the global MPP under certain shading conditions [23,24]. The instantaneous power optimization can track the global MPP in less than one second, but a preliminary investigation is needed to assess the currents at different maxima to calculate the required parameters for the system control [24].
In this paper, a hybrid MPPT with zero oscillation in steady-state conditions that can solve the aforementioned problems is proposed. Combining the advantages of P&O method and genetic algorithm (GA), the proposed MPPT can find the GMPPs fast and correctly even under PSCs. As soon as the GMPP is found, the perturbations are stopped, thus the oscillations and the power loss are reduced.

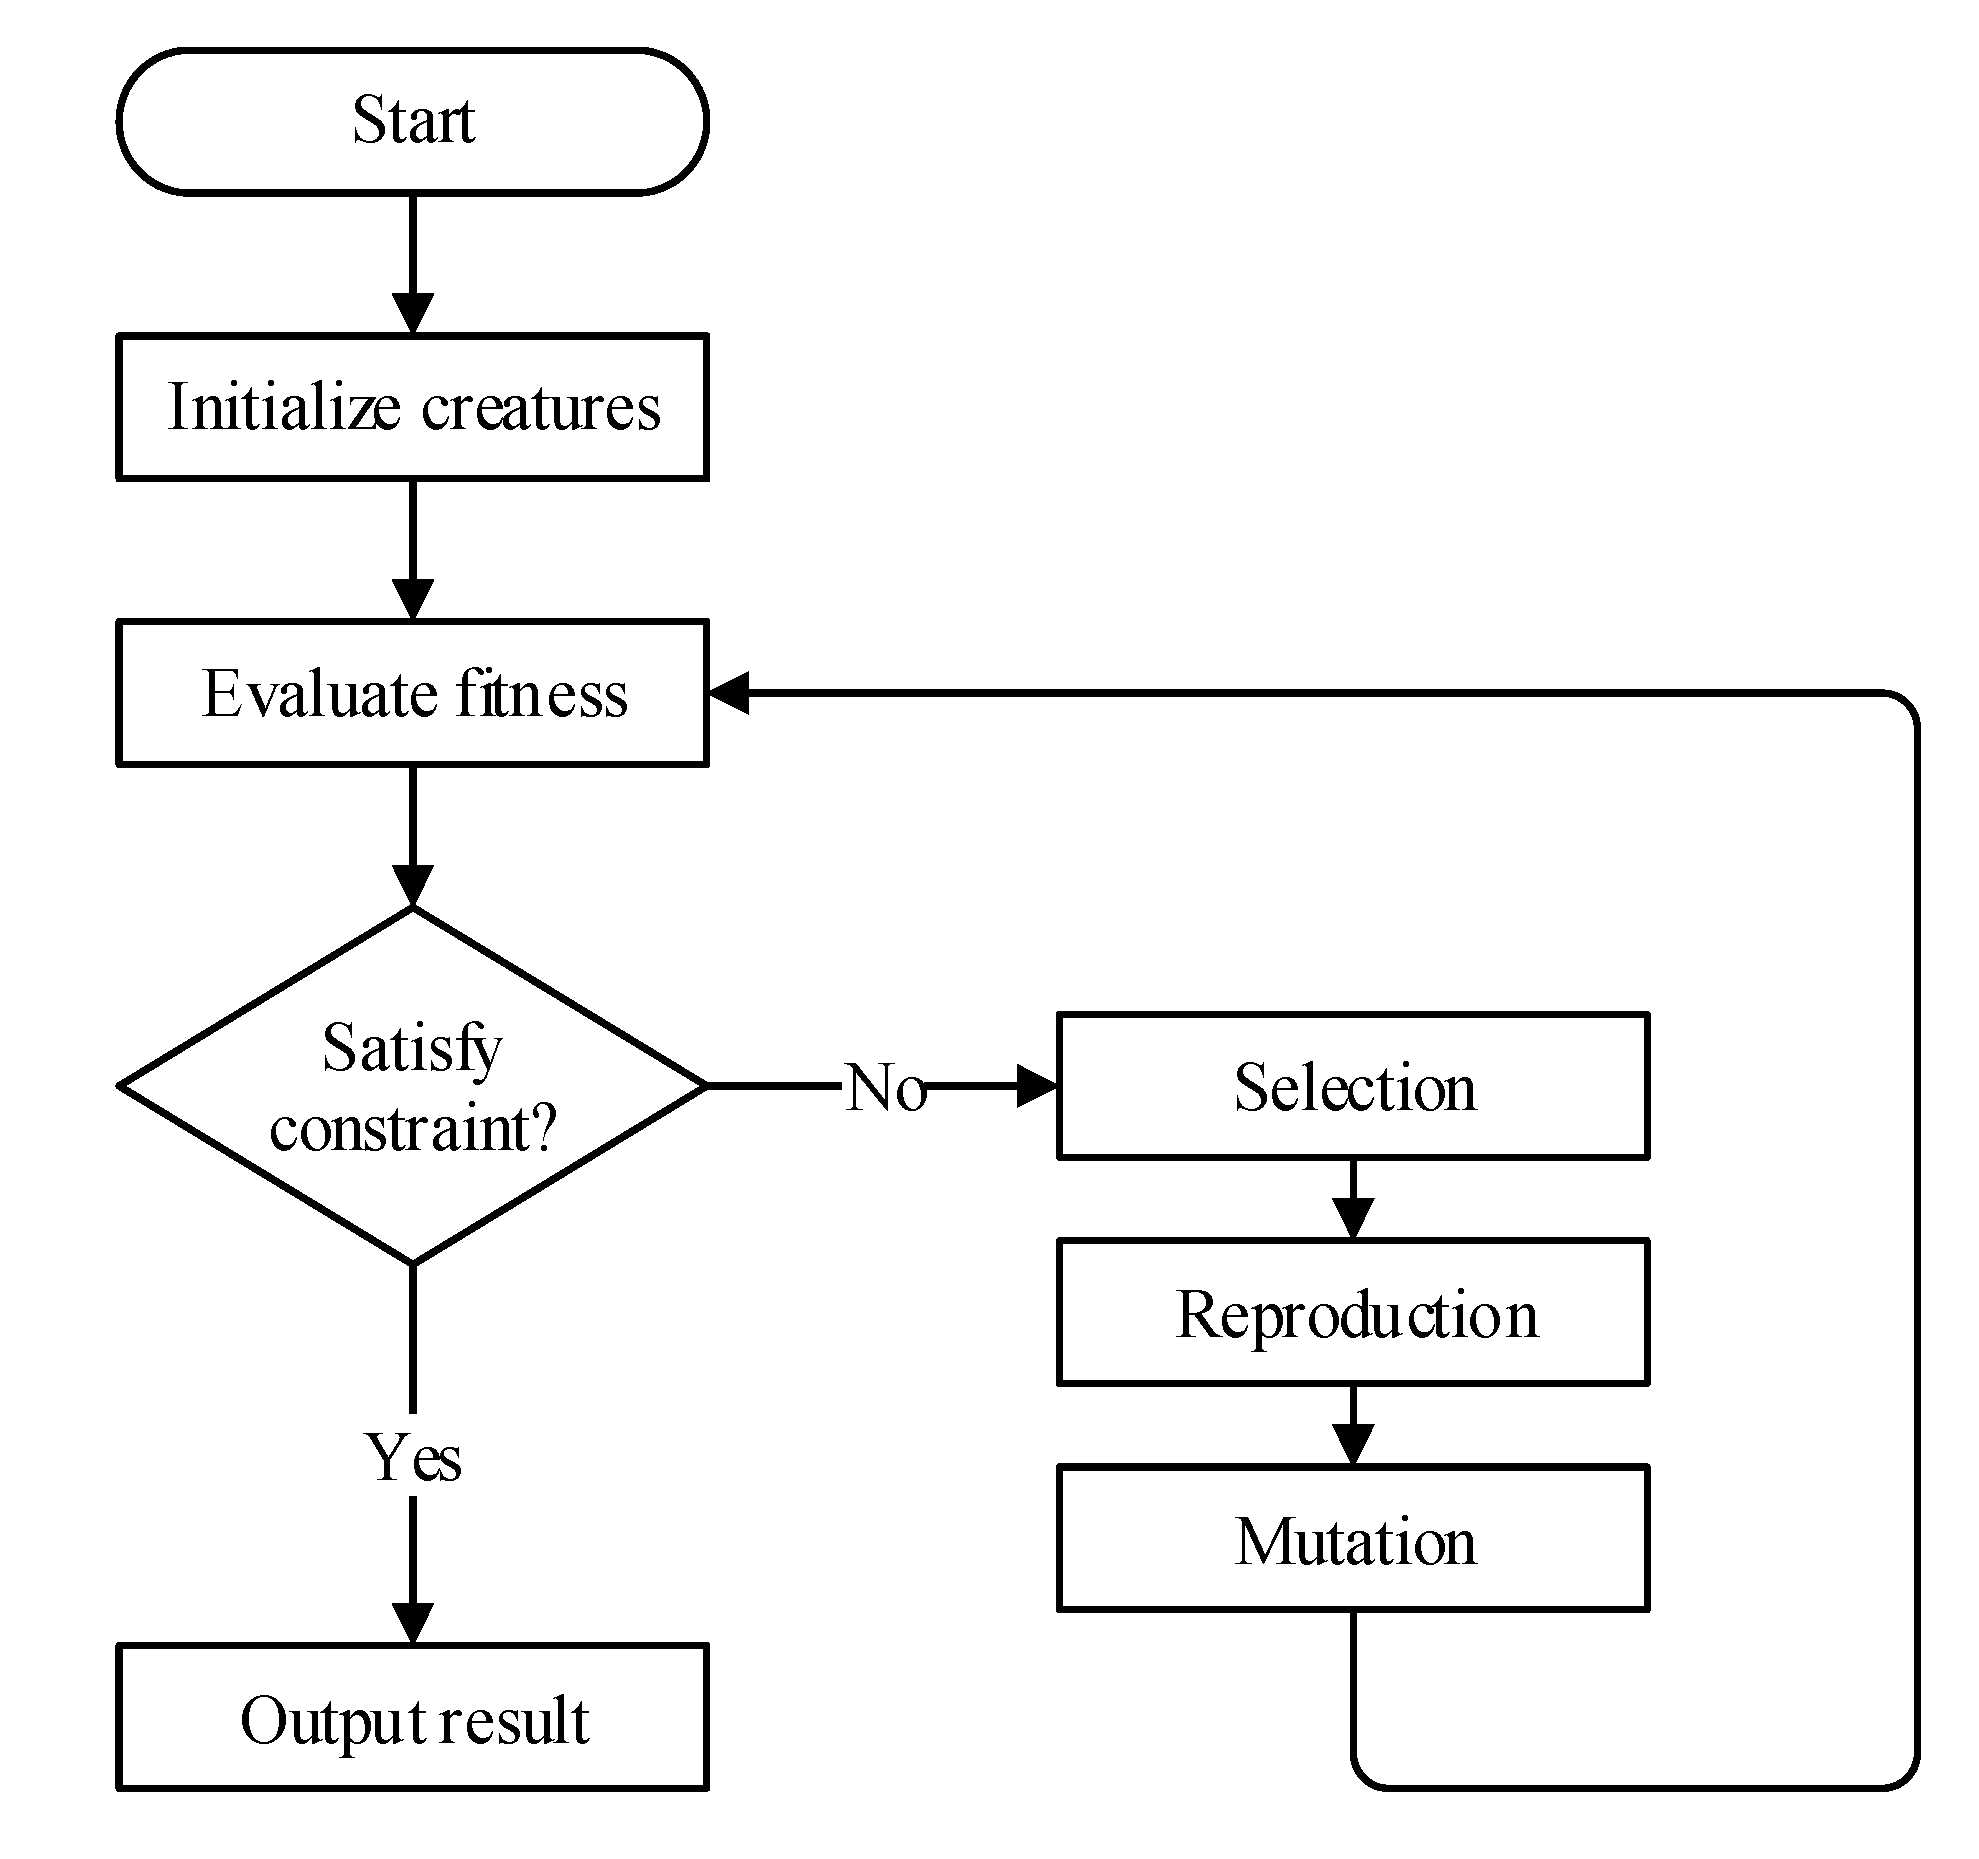
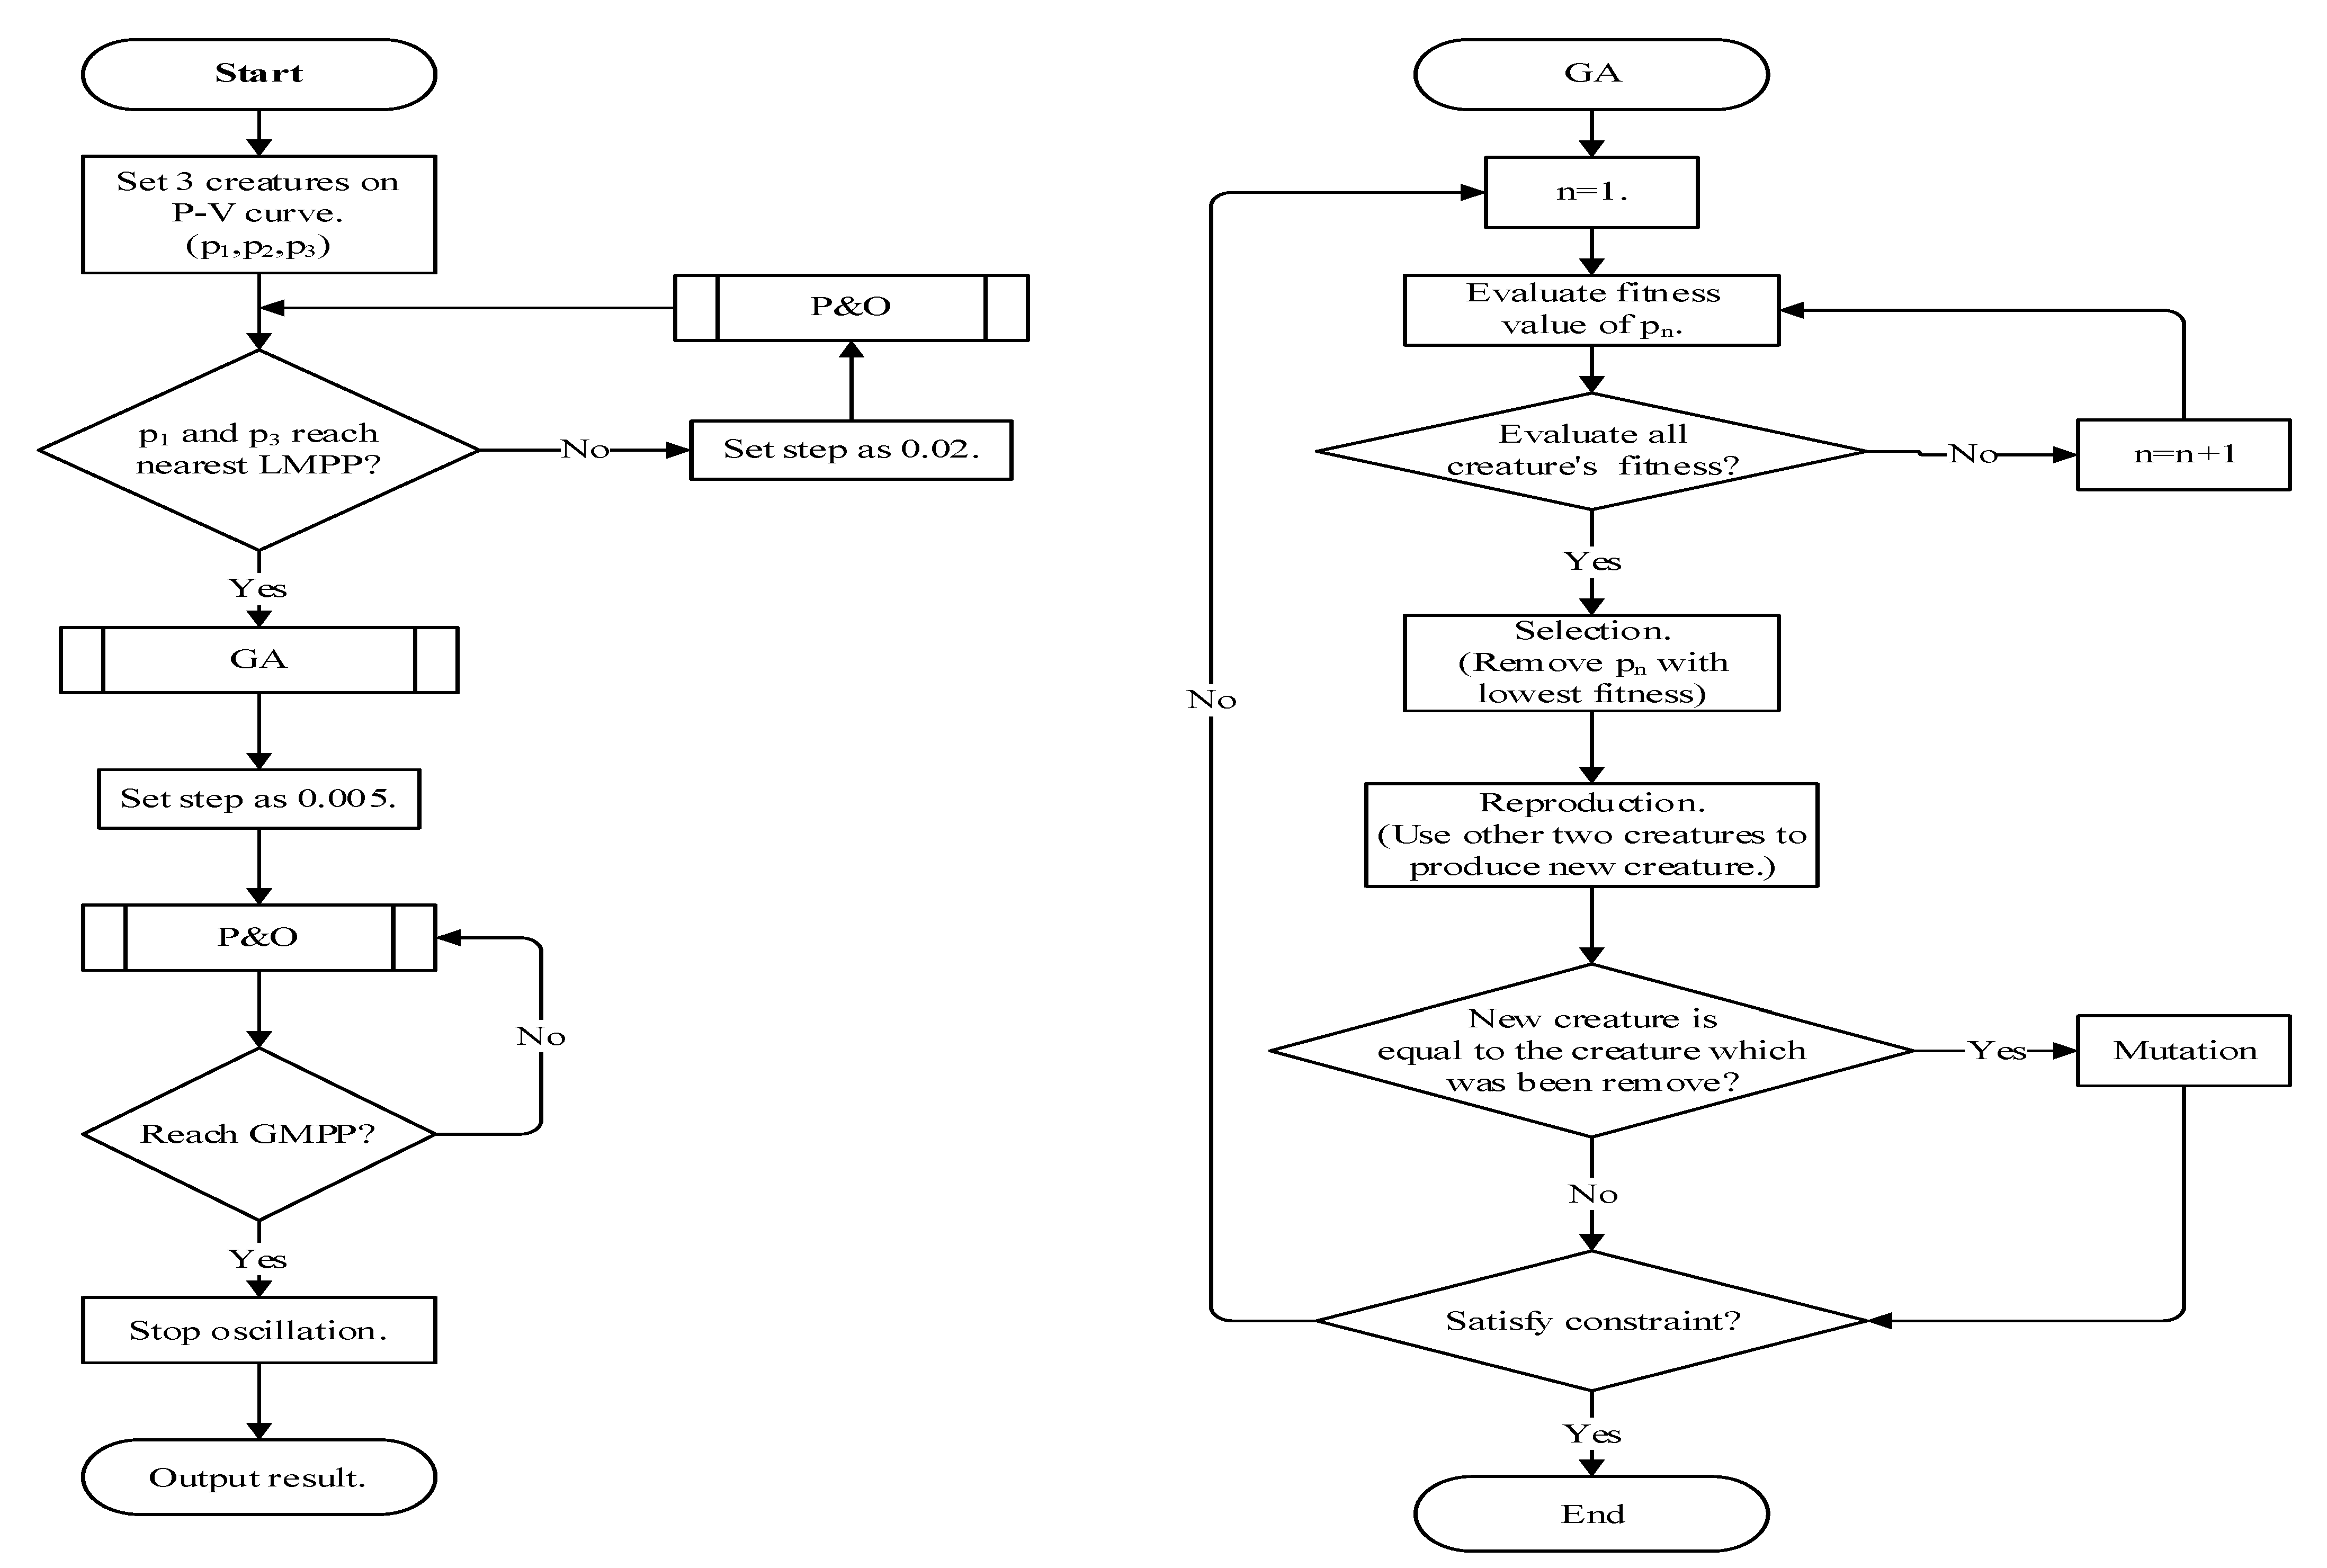
2. Genetic Algorithm

Figure 1 shows the flowchart of conventional GA. In the beginning, the algorithm will initialize several creatures randomly. The “creature” indicates any possible solution on the search area. It can be any working point on the P-V characteristic curve for a solar system. The “fitness value” indicates the power of any working point on the P-V characteristic curve, which means the working point with higher output power has higher fitness value. If the termination condition is satisfied, then the system is working on the GMPP, otherwise, the creature with lowest fitness value is removed, and a new creature is produced by the rest of the creatures. To prevent sticking to the LMPP in the searching process, the algorithm will set a mutation probability to decide whether a creature has mutation.

3. Solar System Module

The block diagram of the proposed system is shown in Figure 2. It includes three PV panels supplying power through a power converter to a load. The load is a resistor. The voltage and current are detected, then the control system adjusts the duty cycle of the DC/DC converter to produce maximum output power. A boost converter is used in this research. It can ensure a continuous current from the PV panel, minimizing the loss due to low ripple current. Next, we will show the power loss due to the steady-state oscillations and demonstrate the importance of tracking with zero oscillations for the PV system.

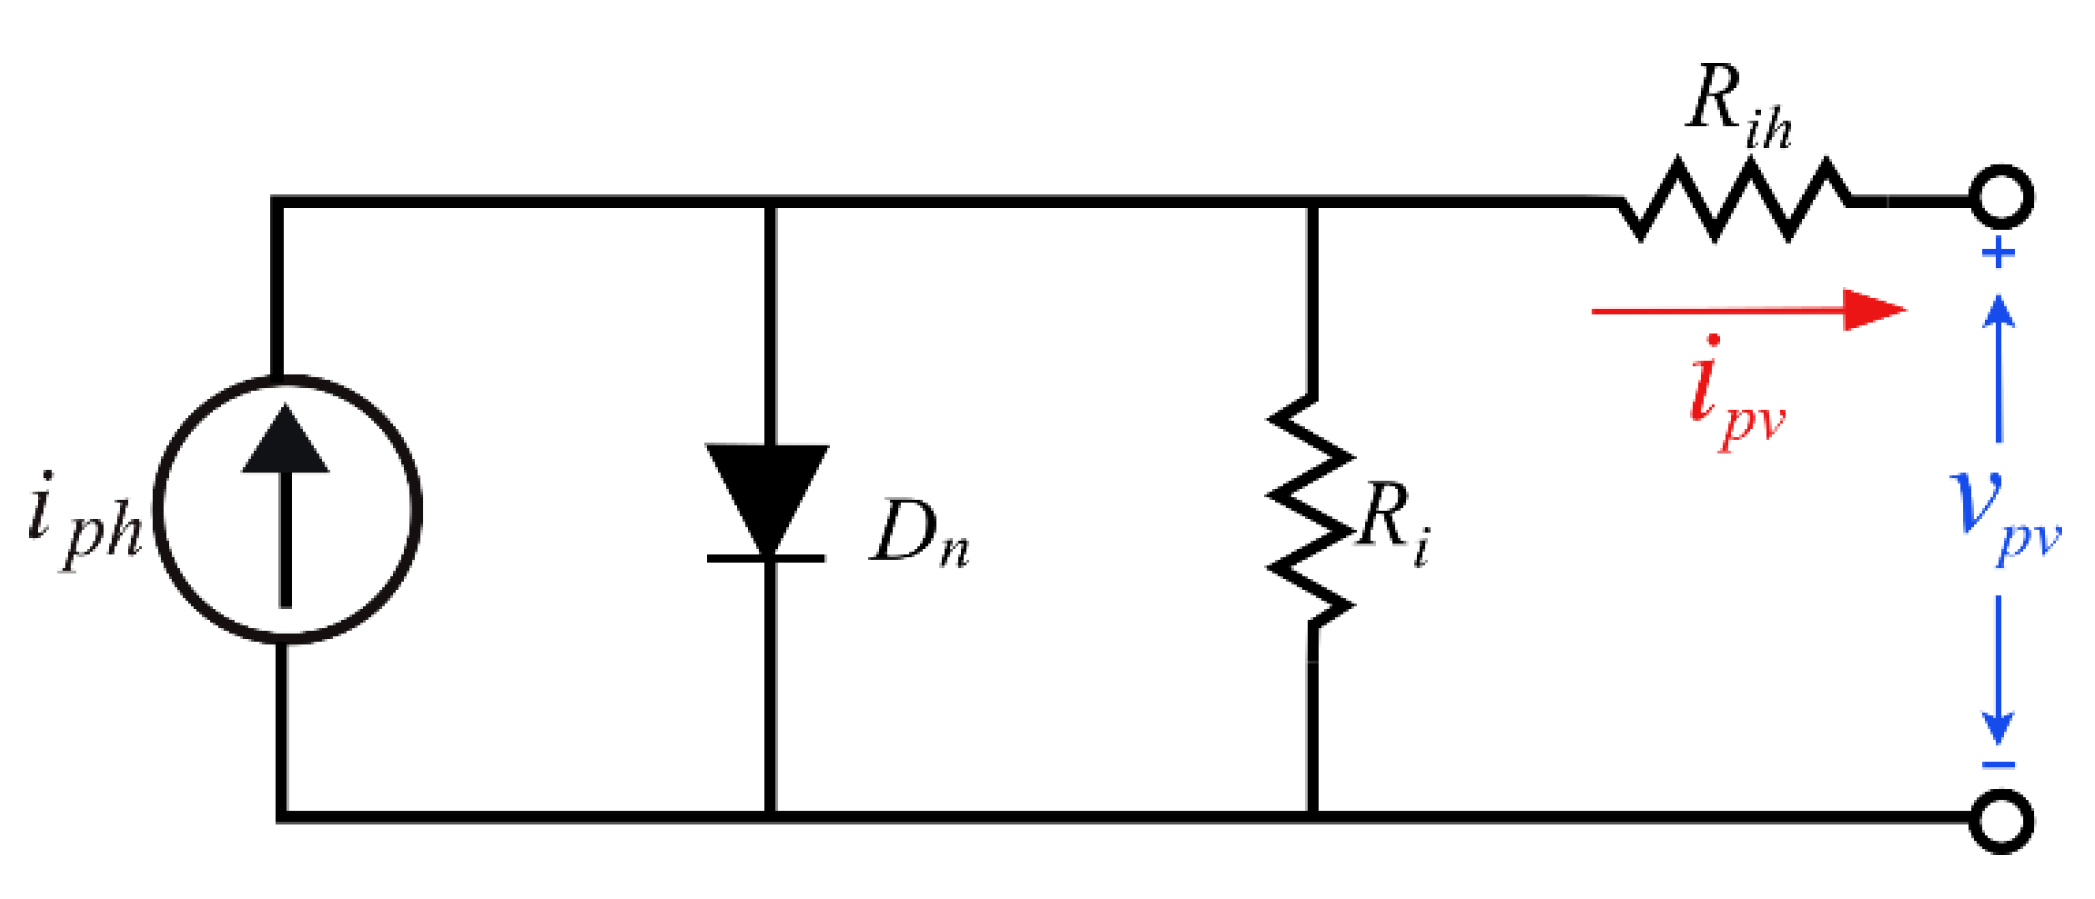
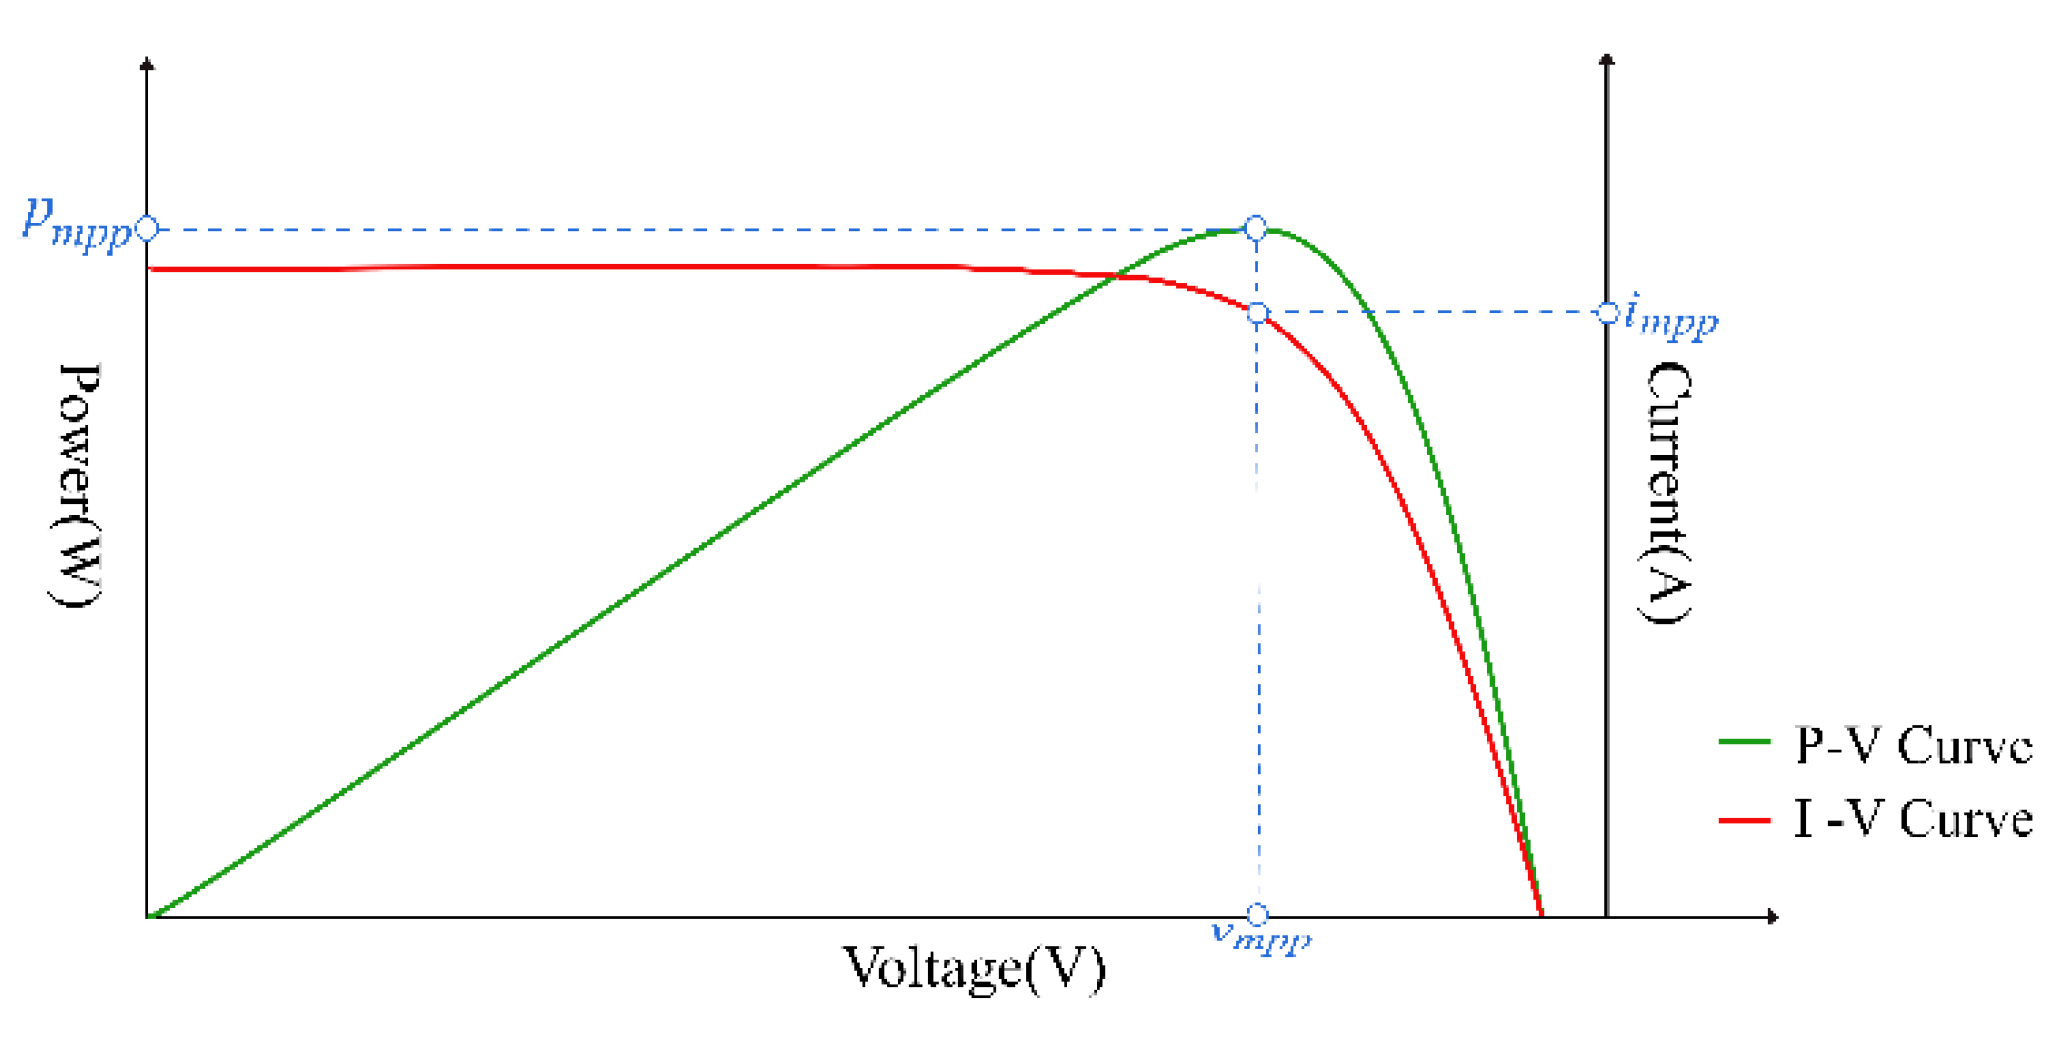
3.1. Basic Characteristics of PV Module

In order to calculate the power loss due to the steady-state oscillations, the basic characteristics of PV module needs to be reviewed first. Figure 3 shows the equivalent circuit for a PV cell, including a series resistor (Rih), a parallel resistor (Ri), and a diode (Dn). The diode is the P-N junction of the cell structure. When the solar irradiation shines on the PV panel, the electrons and the holes of the P-N junction will start to move. Then, the photocurrent (Iph) is produced by this movement. For a PV panel assembled by np parallel strings of ns cells, the panel’s current (ipv), voltage (vpv), T, and G, is given as
i p v = n p × I p h n p × I s a t [ exp ( q A T k × v p v n s ) 1 ]
where Isat is the reverse saturation current of Dn, q is the electron charge (1.6 × 10⁻¹⁹), A is the diode factor, k is the Boltzmann’s constant (J/K), T is the PV panel temperature (K), and Iph is proportional to G
I p h = [ I s s o + K i ( T T r ) ] G 1000
where Isso is the short-circuit current under standard test condition (STC: 1 kW/m2, 25 °C), Ki is temperature coefficient. This relationship determines the effect of the environmental factor on the nonlinear cell characteristics, and it is fundamental to develop an MPPT strategy that can track the MPP under weather variations.
Two circuit parameters are of special interest when describing a PV cell, and they will be used to quantify the MPPT strategy behavior: the open-circuit voltage (Voc) and the short-circuit current (Isc). The Voc is defined as vpv when ipv is zero
V o c = v p v | i p v = 0 = n s A k T q × ln ( I p h I s a t 1 )
Isc is defined as the ipv when vpv is zero
I s c = i p v | v p v = 0 = n p × I p h
From the Equations of (1)–(4), we can obtain the characteristic curves as shown in Figure 4. When the system operates at vmpp and impp, we can get the maximum output power, and the operation point is the MPP of the module. When the environmental conditions change, the characteristic curves of the PV panel will also change, and the MPP moves. At this moment, we need a MPPT to track the new MPP and make the system work at the highest efficiency.
The variations of G and T will affect the characteristics curve of the PV panel. The changes can be obtained from (1)–(4). On the other hand, the changes in G mainly influence Isc, and T mainly affects Voc. Nevertheless, in general, the G is affected the most. The reason is that the clouds, spots, etc., change the G easily.

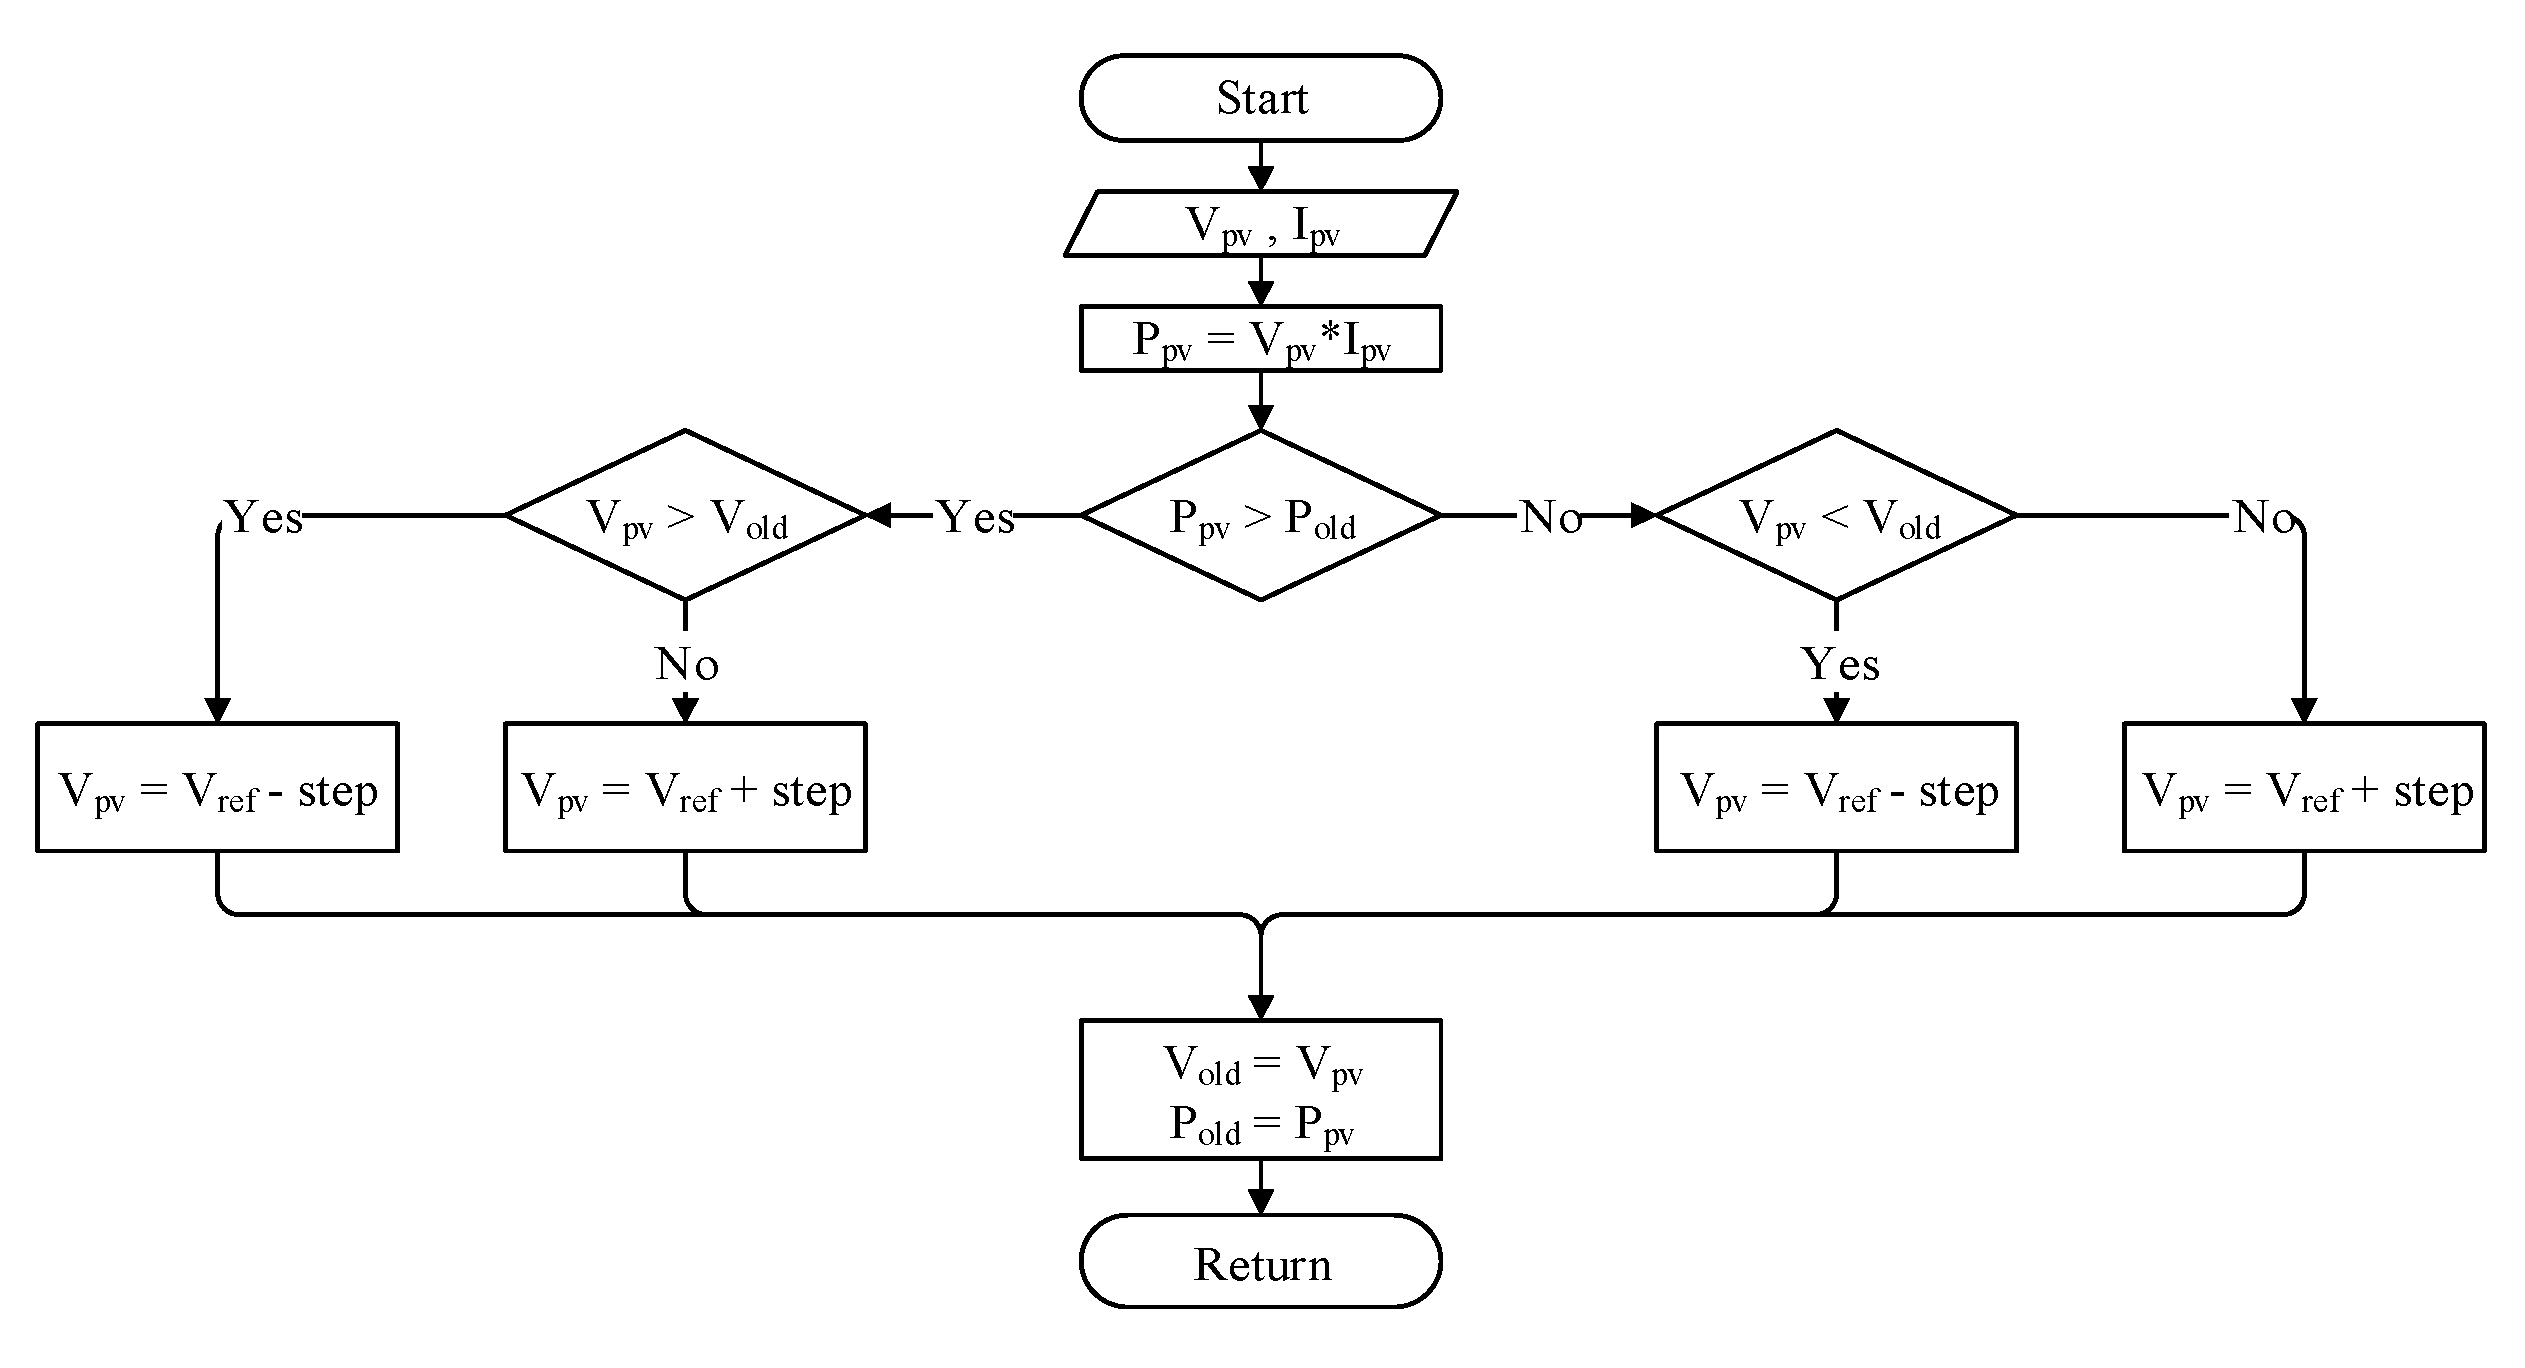
3.2. Conventional P&O

The flowchart of the conventional P&O is shown in Figure 5. By scanning the P-V characteristic curve and changing the working point, the system can achieve MPPT. If the change in power is positive, then the direction of step variation will keep the same as the previous direction; if the change is negative, then it will be the opposite direction. When the MPP is found by the conventional P&O, the operating point will oscillate around the MPP to continue the detection of variation of the atmospheric conditions.
The tracking process of the conventional P&O is shown in Figure 6. The system is activated to track the MPP when the atmospheric conditions change or PSC occurs. Due to the uneven solar irradiation under PSC, the PV curve will have more than two peak points as shown in Figure 7. This makes the PV system unable to operate at its GMPPs, which causes steady-state oscillations and power loss.

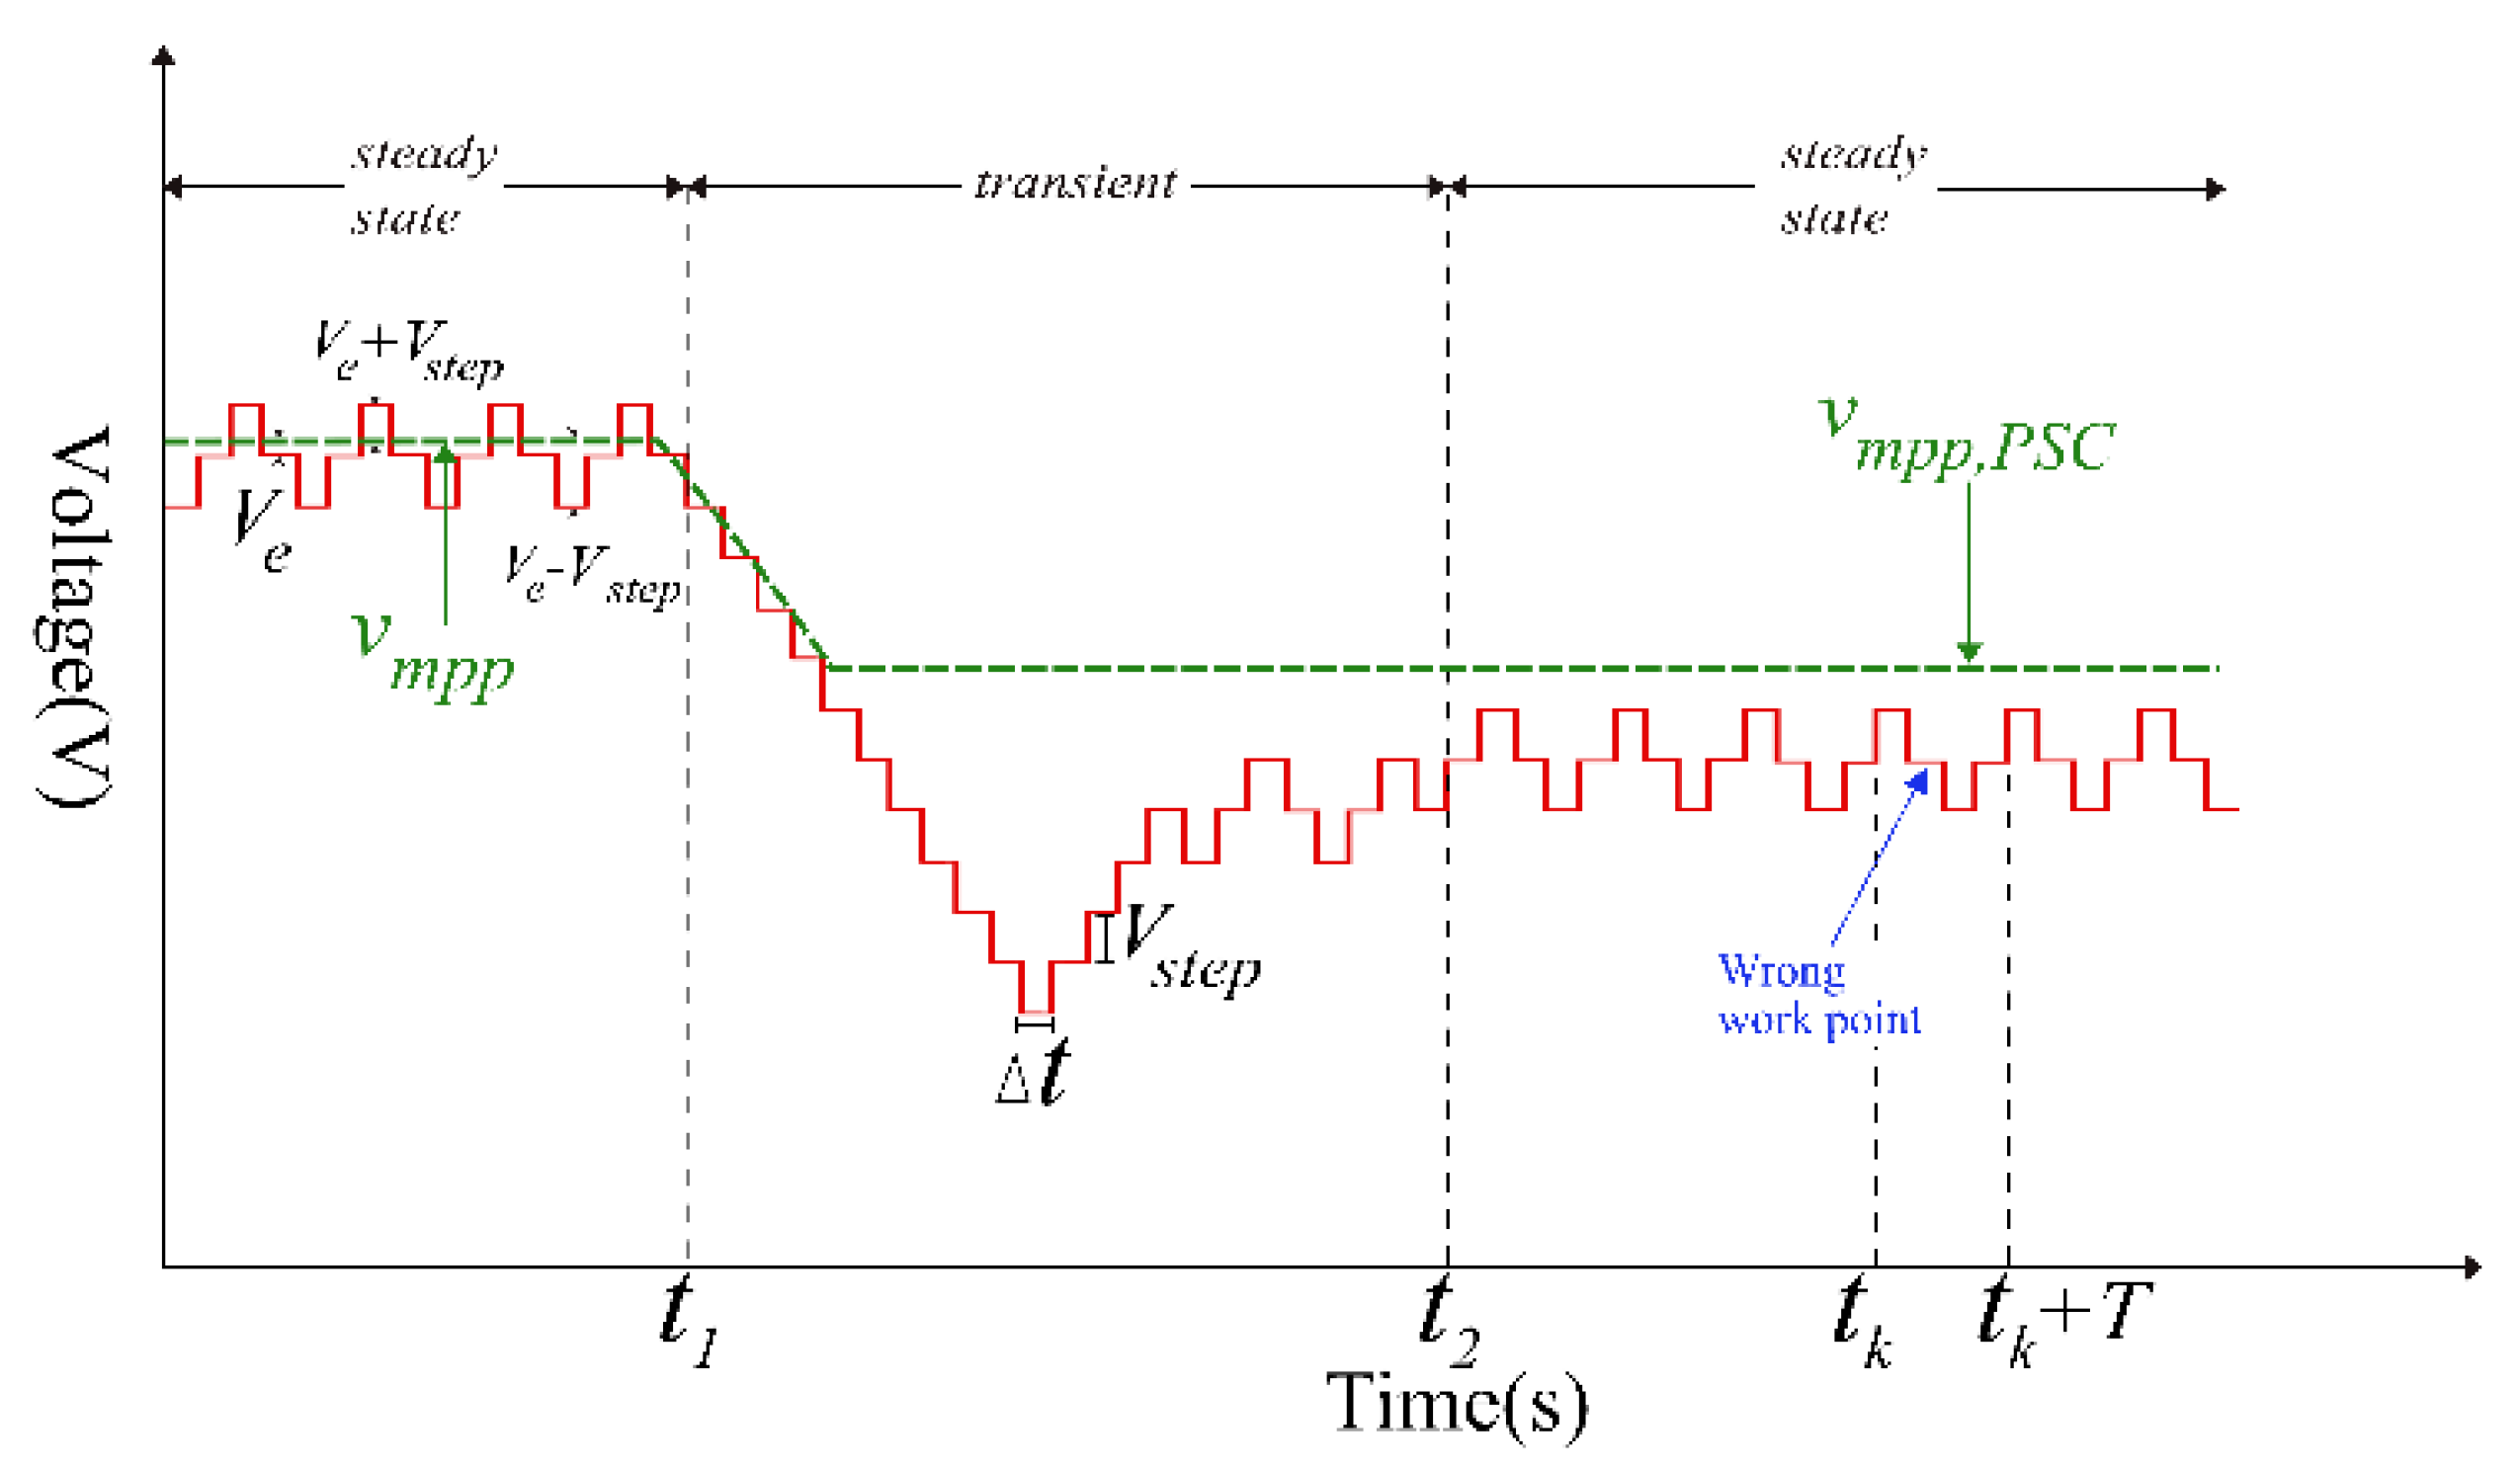
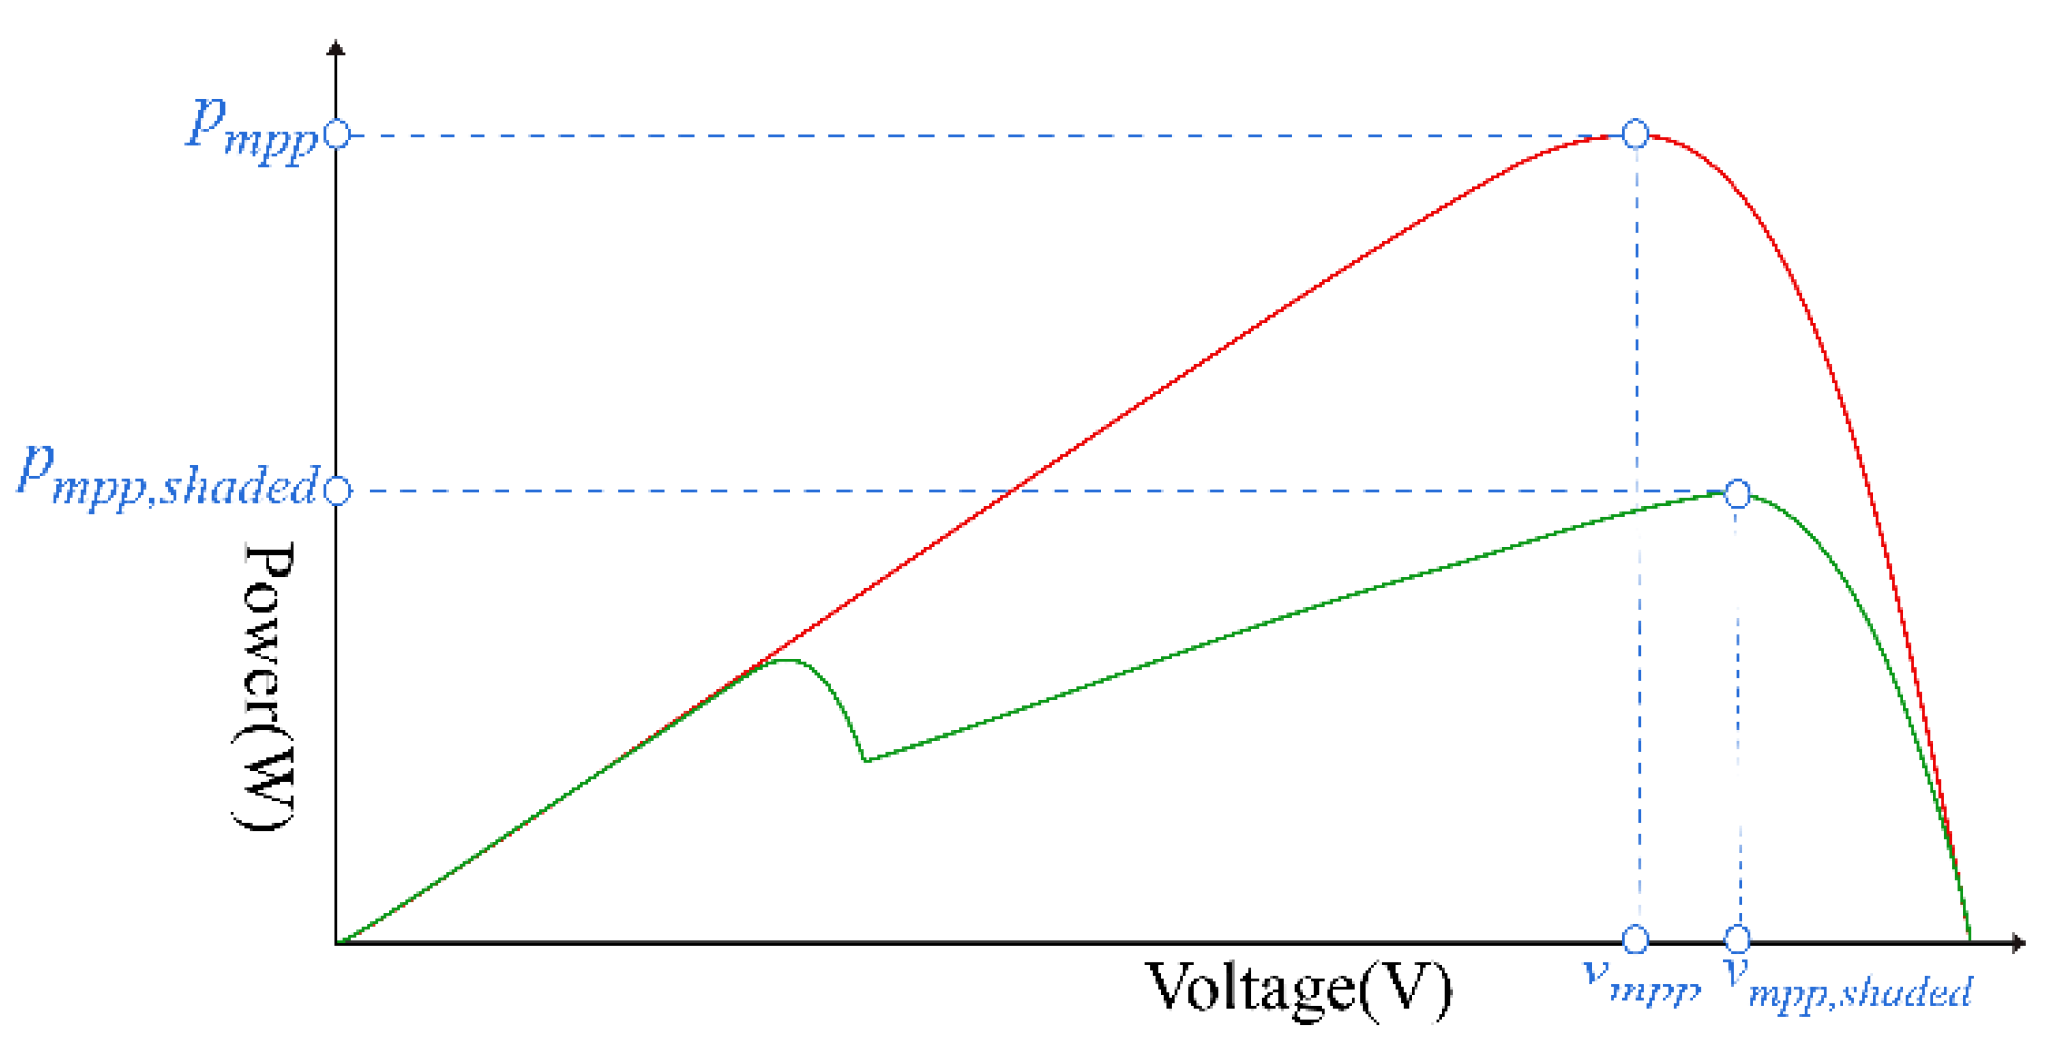
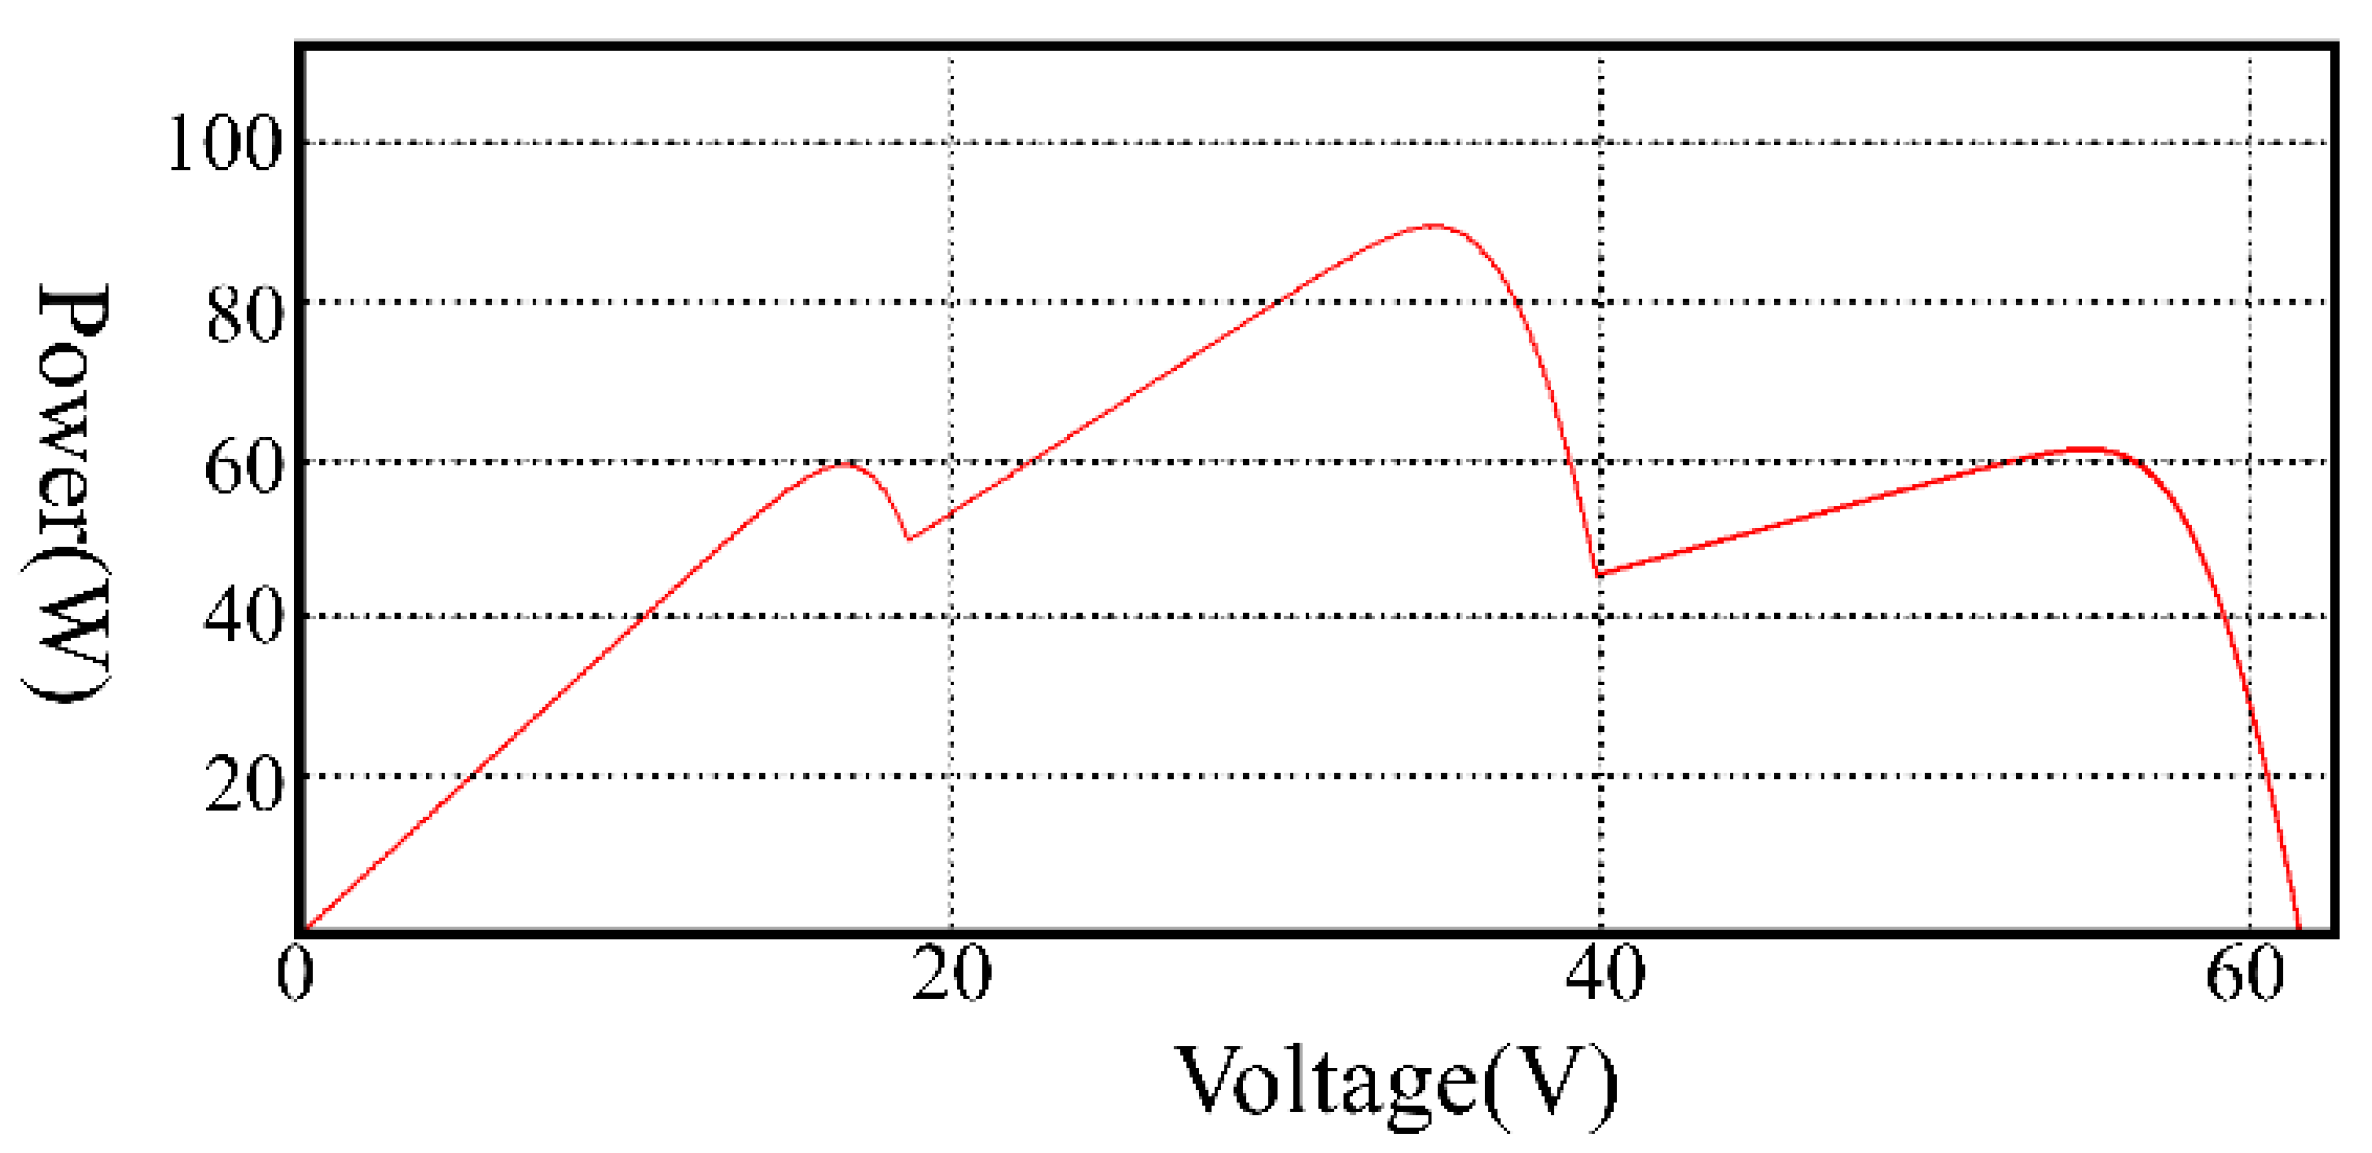
3.3. The Loss Due to Steady-State Oscillations
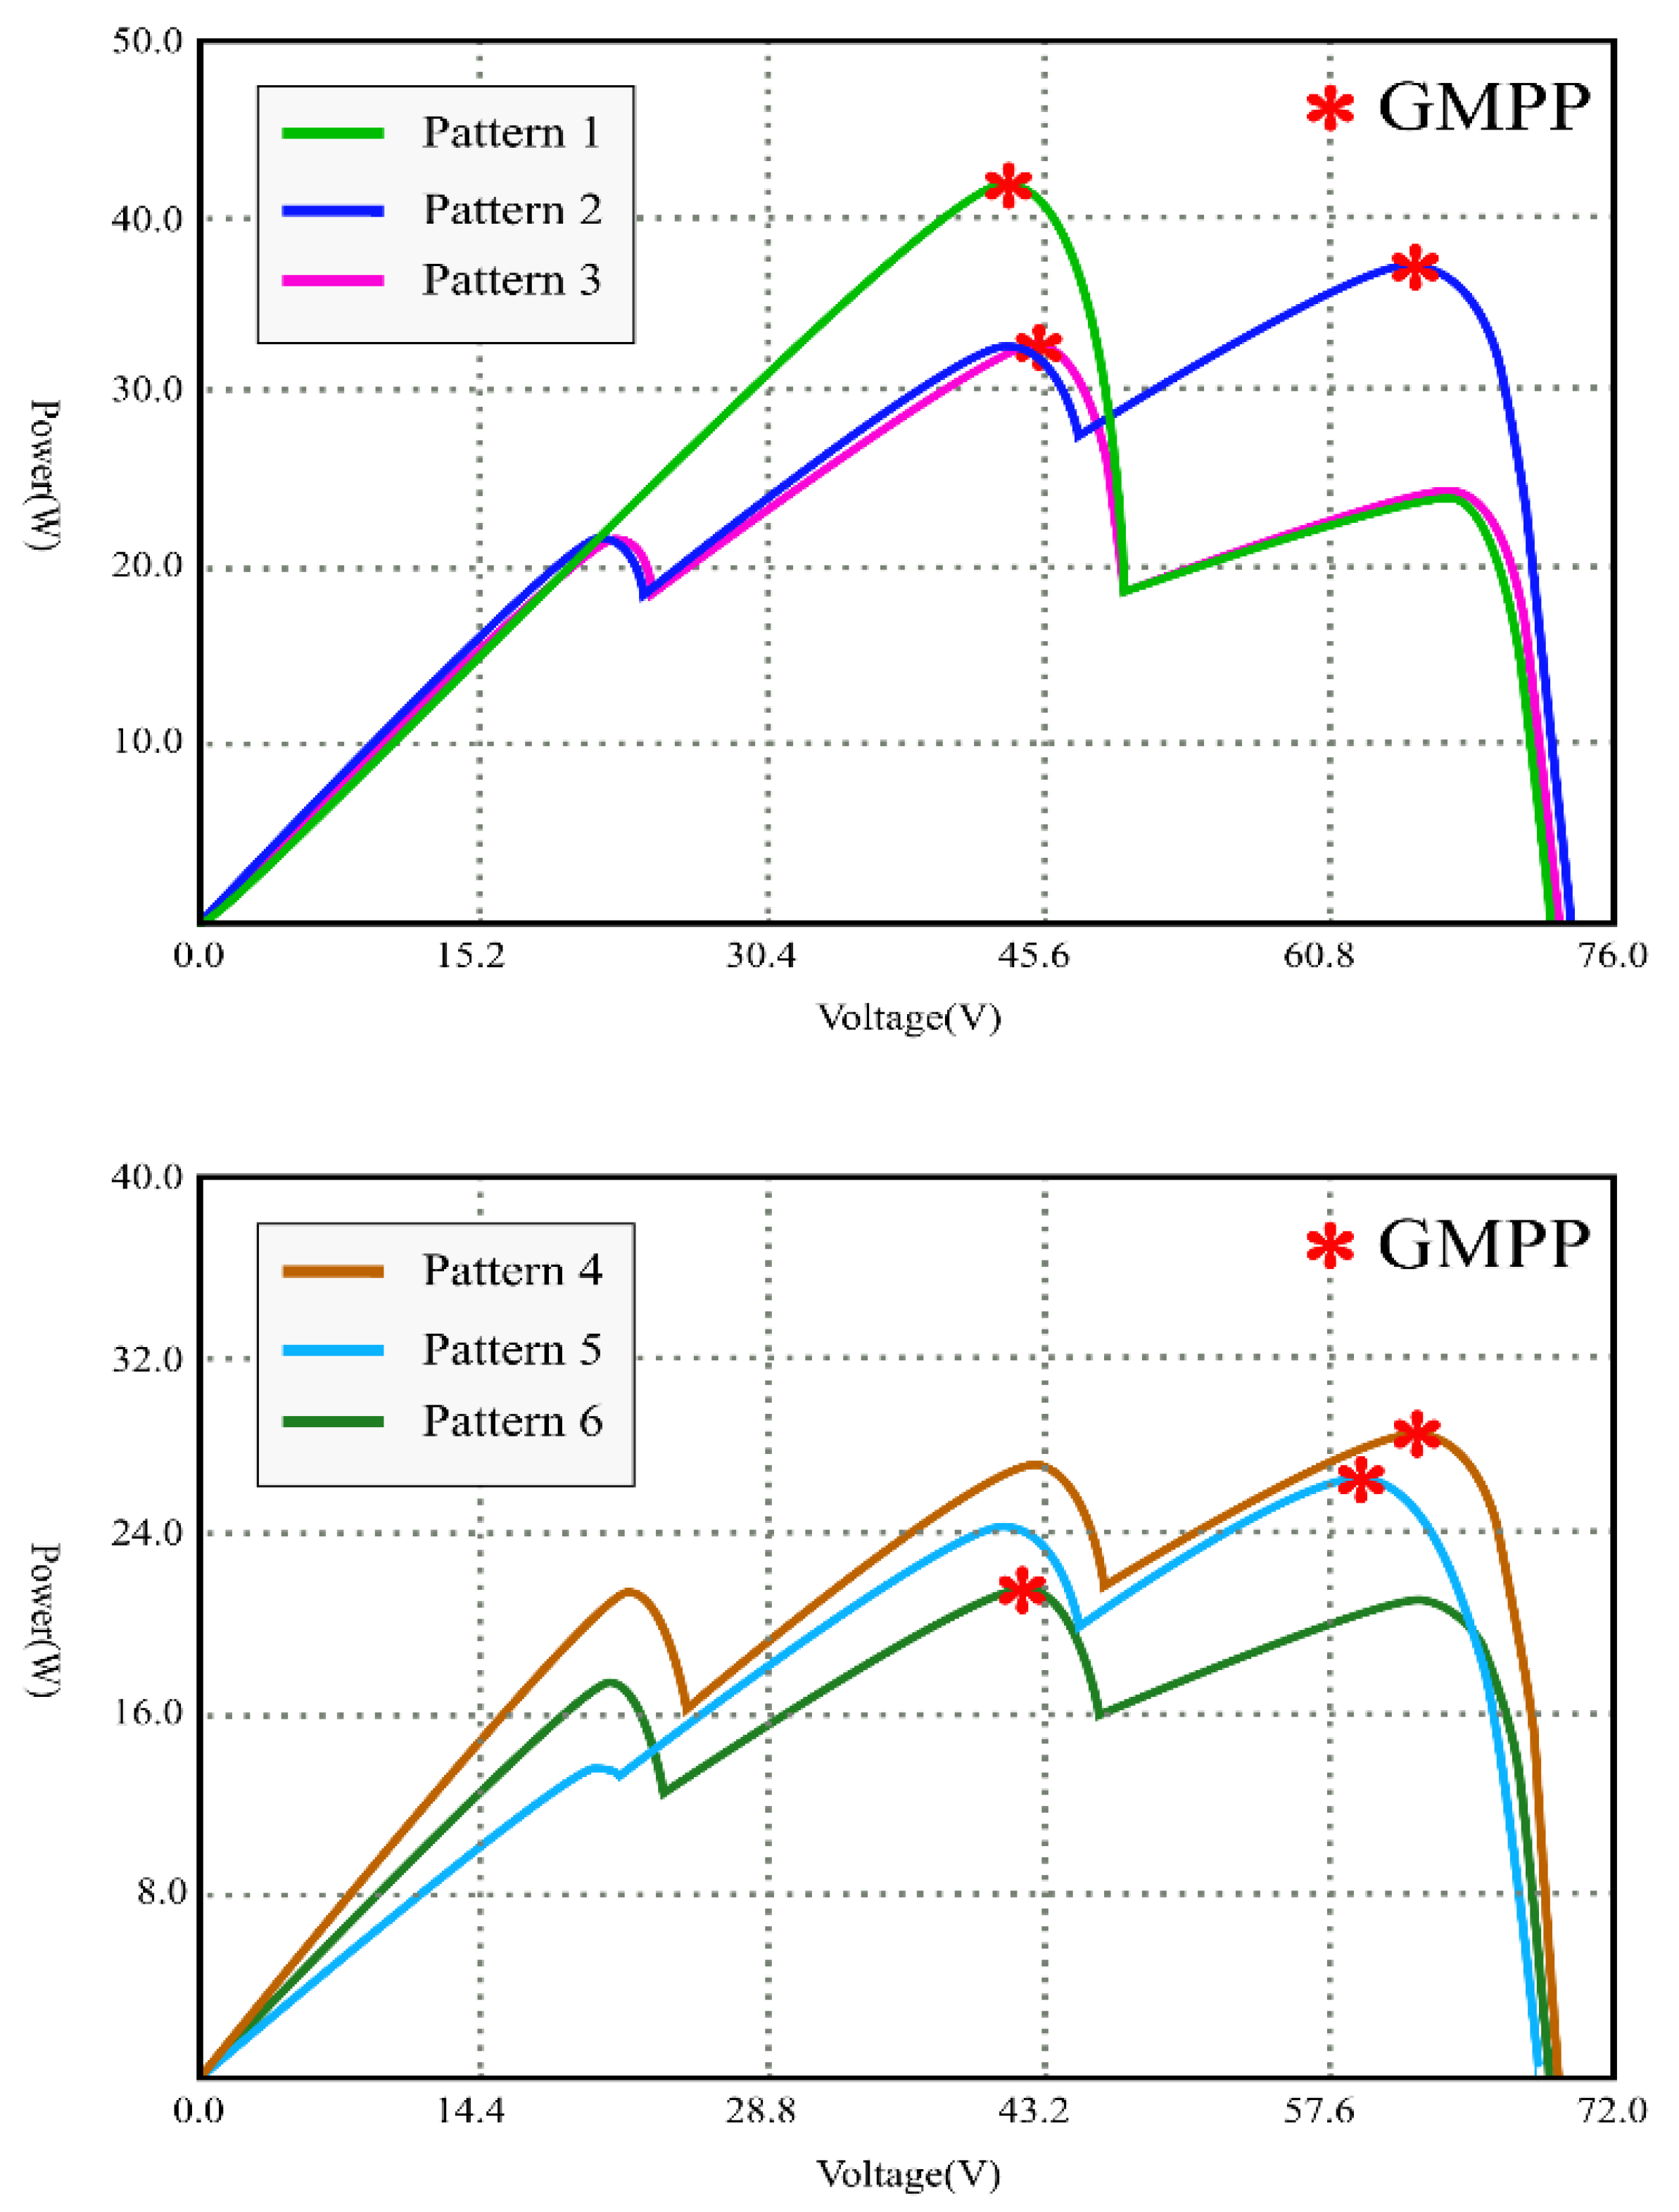
Figure 6 shows the tracking process for the system with conventional P&O, in which the voltage step changes are shown. The power loss due to the oscillations in steady-state can be calculated [13]. The ratio of the power loss to the maximum power is defined as
P l o s s P m p p ( Δ v p v , r m s v m p p ) × ( 1 + v c e l l 2 A k T / q )
where Δvpv,rms is the rms value of the voltage ripple and vcell is the maximum voltage of each cell (around 0.5 V).The rms value of the voltage ripple for the conventional P&O is
Δ v p v P & O , r m s = 1 T 0 T Δ v p v 2 ( t ) d t = V s t e p × 1 2 + b 2
where b is the deviation value between common middle point (Vmid) and vmpp (about −0.5 to 0.5). If the operating voltage is stable without any oscillations, the rms value of voltage is
Δ v p v M P & O , r m s = b × V s t e p
Replacing (6) and (7) in (5) gives the percentage of loss for the conventional P&O (8) and the percentage of loss for the algorithm without oscillations in steady-state (9)
( P l o s s P m p p ) P & O ( 1 2 + b 2 ) × ( V s t e p v m p p ) 2 × ( 1 + v c e l l 2 A k T / q )
( P l o s s P m p p ) M P & O b 2 × ( V s t e p v m p p ) 2 × ( 1 + v c e l l 2 A k T / q )
The ratio of (9) to (8) indicates the power loss in steady state with the oscillations, since the loss due to the oscillations is nearly eliminated with the proposed algorithm
( P l o s s P m p p ) M P & O ( P l o s s P m p p ) P & O = 1 + 1 2 b 2
The ratio of power loss in (10) indicates that the tracking power loss for the PV system in steady-state is increased by the factor of 1/2b2 due to the tracking oscillations. If b = 0.5, the loss is three times. This paper presents a system that can remove the oscillations around the MPPs in steady-state conditions, thus the power loss can be reduced. Generally speaking, a PV module can work about 25 years, thus a long period of steady-state oscillations causes a great power loss. If the tracking oscillations are reduced or eliminated, the power loss is reduced and the system efficiency is increased.

4. Simulations

PSIM is used for simulations in this research. The PV panel is of Voc = 21.1 V and Isc = 3.8 A, and a PV module’s maximum output power is 60 W under STC. Three PV modules in series are used for the simulations, and the G is varied to simulate PSC. The G for the three PV modules is 1000, 700, and 300 W/m2, respectively. Under this condition, the maximum power is 89.3 W and the P-V curve is shown in Figure 8.
Figure 9 shows the flowchart of the proposed method. In the beginning, three creatures on the P-V curve (three different working point) are initialized. The positions of three creatures are P1 = 0.15Voc, P2 = 0.5Voc, P3 = 0.85Voc, respectively. Then, the P&O is used with a large step to make P1 and P3 approach the nearest LMPP. Thus, the searching area of GA is substantially reduced and the tracking speed is raised. After P1 and P3 approach the nearest LMPP, the proposed method will use GA to track the GMPP. The fitness values of three creatures (the output power of each working point) are calculated, and the creature with lowest fitness value is removed. A new creature is produced by using two creatures with better fitness values. The previous steps are repeated until the termination condition is satisfied. The termination condition is: the difference between the fitness values of three creatures is lower than the deviation value (ε). The deviation value (ε) needs to be designed carefully. If the value is too large, it may make the system converge too fast; if the value is too small, it may not make the system converge.
It is worth noting that when the two consecutive creatures are eliminated at the same position, it will have a “mutation”, that is, it moves randomly to the left or right. Then it is compared with other creatures to avoid the situations that cannot converge.
The point at which the GA finally converges will be around the GMPPs with slight deviation. The proposed method uses the P&O at the very end to make the operating point right at the GMPP. To achieve an accurate control, a very small step is used in the tracking, which can effectively reduce the disturbance and the power loss. When the GMPP is found, the system decides whether it is in steady-state by calculating the counts of passing common middle point (Vmid). Therefore, it can stop the oscillations around the MPP. For a given weather condition, when the photovoltaic system tracks and converges to GMPP, the system reaches a steady state. If the weather condition changes, the system starts another new tracking process for the new search.
Figure 10 shows the simulated output power waveform for the PV system with the proposed method. The simulated step response demonstrates the dynamic response of the system. As shown in the figure, the search time is less than one second (0.8 s).
Figure 11 shows the simulated duty ratio for the PV system with the proposed method under PSCs. From the curve of duty ratio, the advantage of the proposed method is observed clearly. From the figure, the first creature (P1) is set as 0.15 at t = t1 and P1 is moved to the nearest LMPP by the P&O. A large step is used to reduce the tracking time. At t = t2, P1 reaches the LMPP; at t = t3, the second creature (P2) is set as 0.5; at t = t4, the third creature (P3) is set as 0.85 and the P&O is used to move P3 to the nearest LMPP, the LMPP is reached at t = t5. Then the GA is adopted, the fitness values of the three creatures (power) are compared, and the creature with lowest fitness value is eliminated. Other creatures with higher fitness values are used to produce a new creature. At t = t6, the fitness values of the three creatures have been very close to each other (within the set error value ε), the system exits from the GA subroutine and the P&O is used again for precise tracking. Small steps are used to reduce the tracking loss. At t = t7, the system operates at the GMPP without oscillations. Here, the output power is very close to the theoretical maximum power. Therefore, the proposed method has excellent performance and high efficiency.

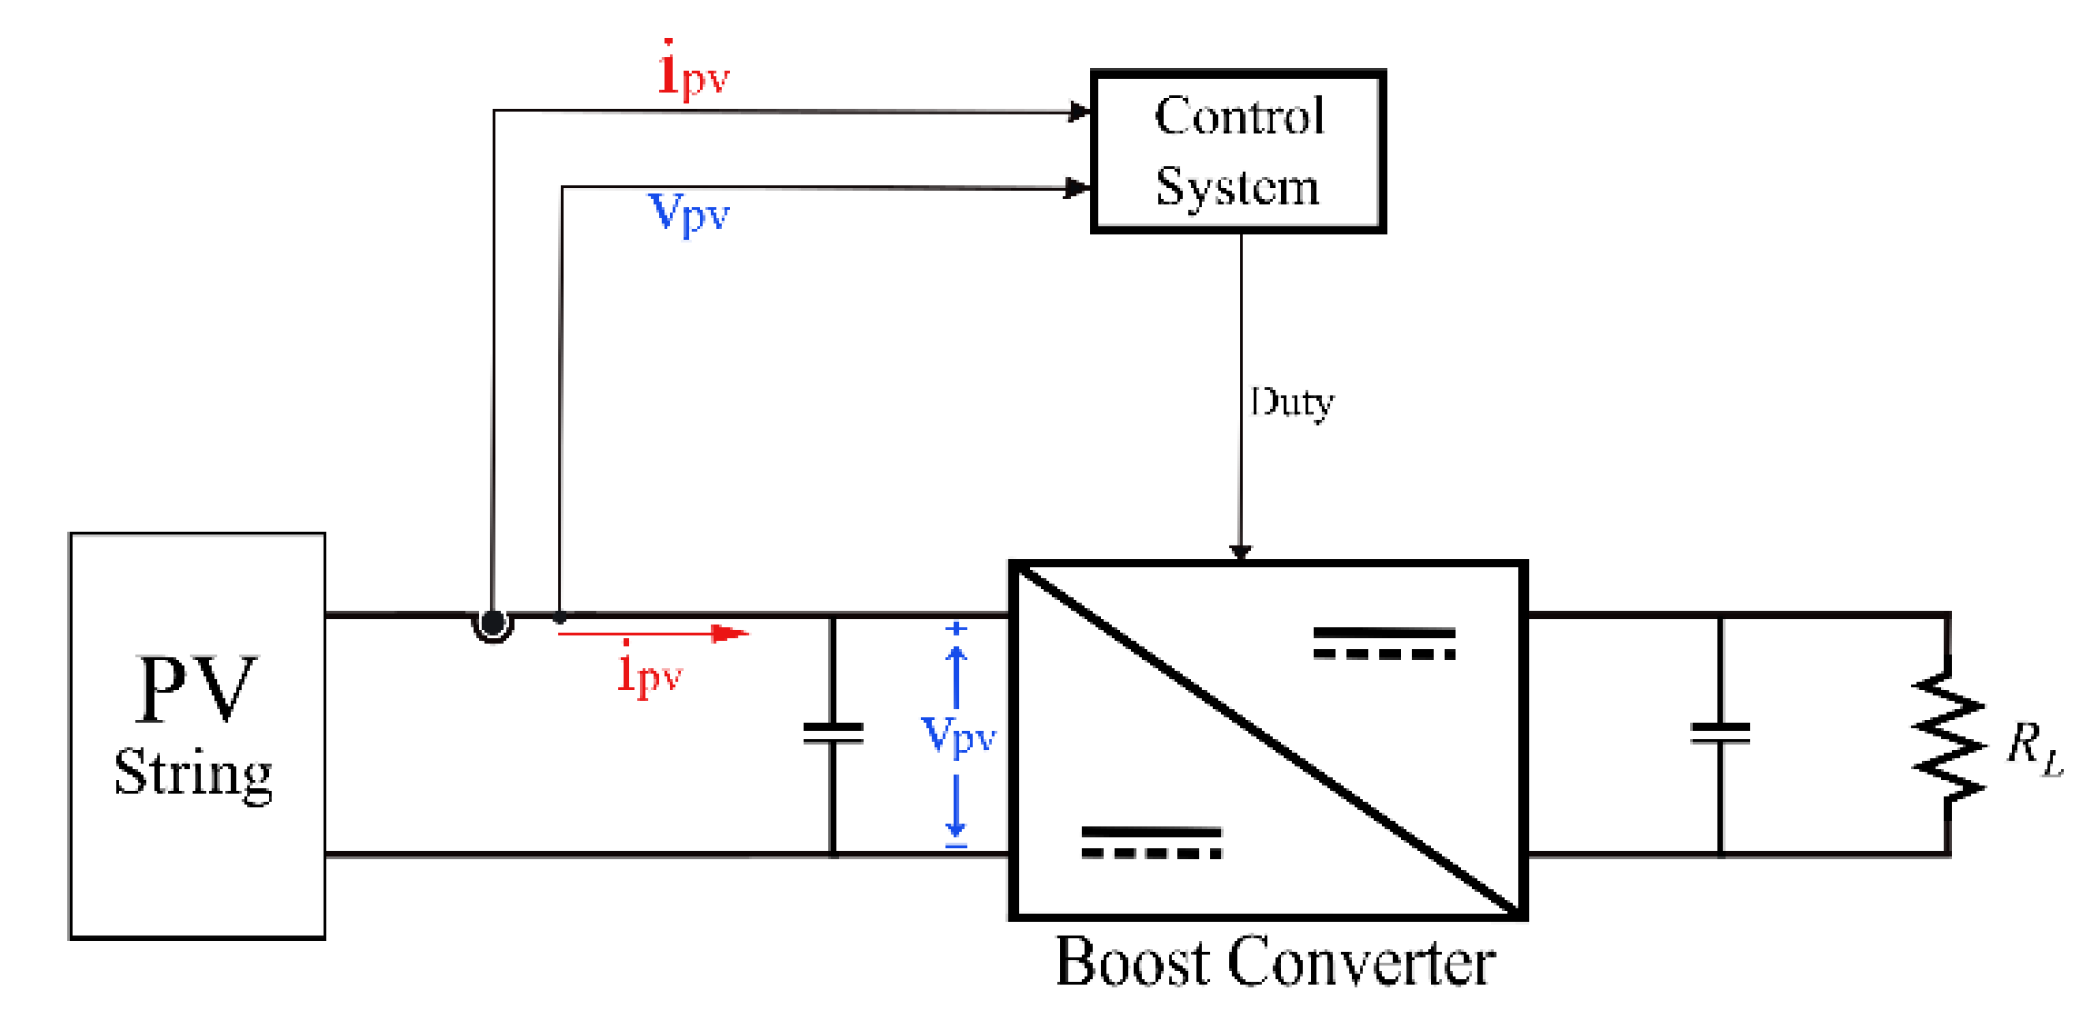
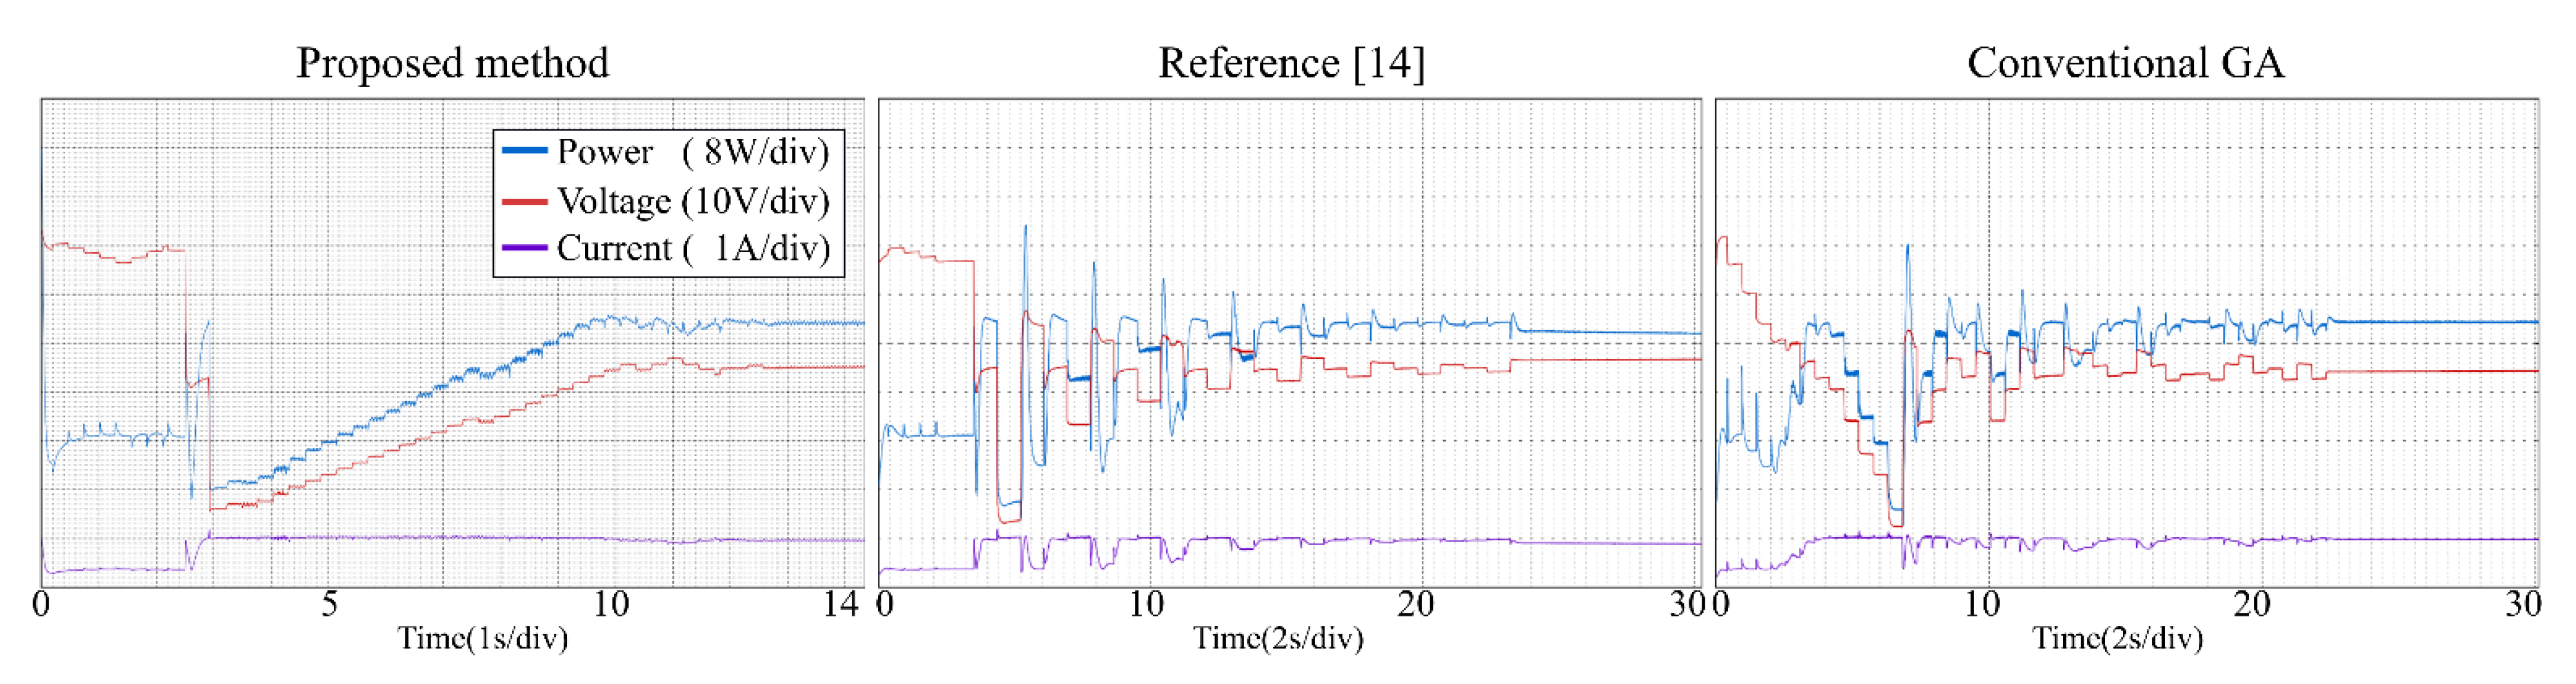
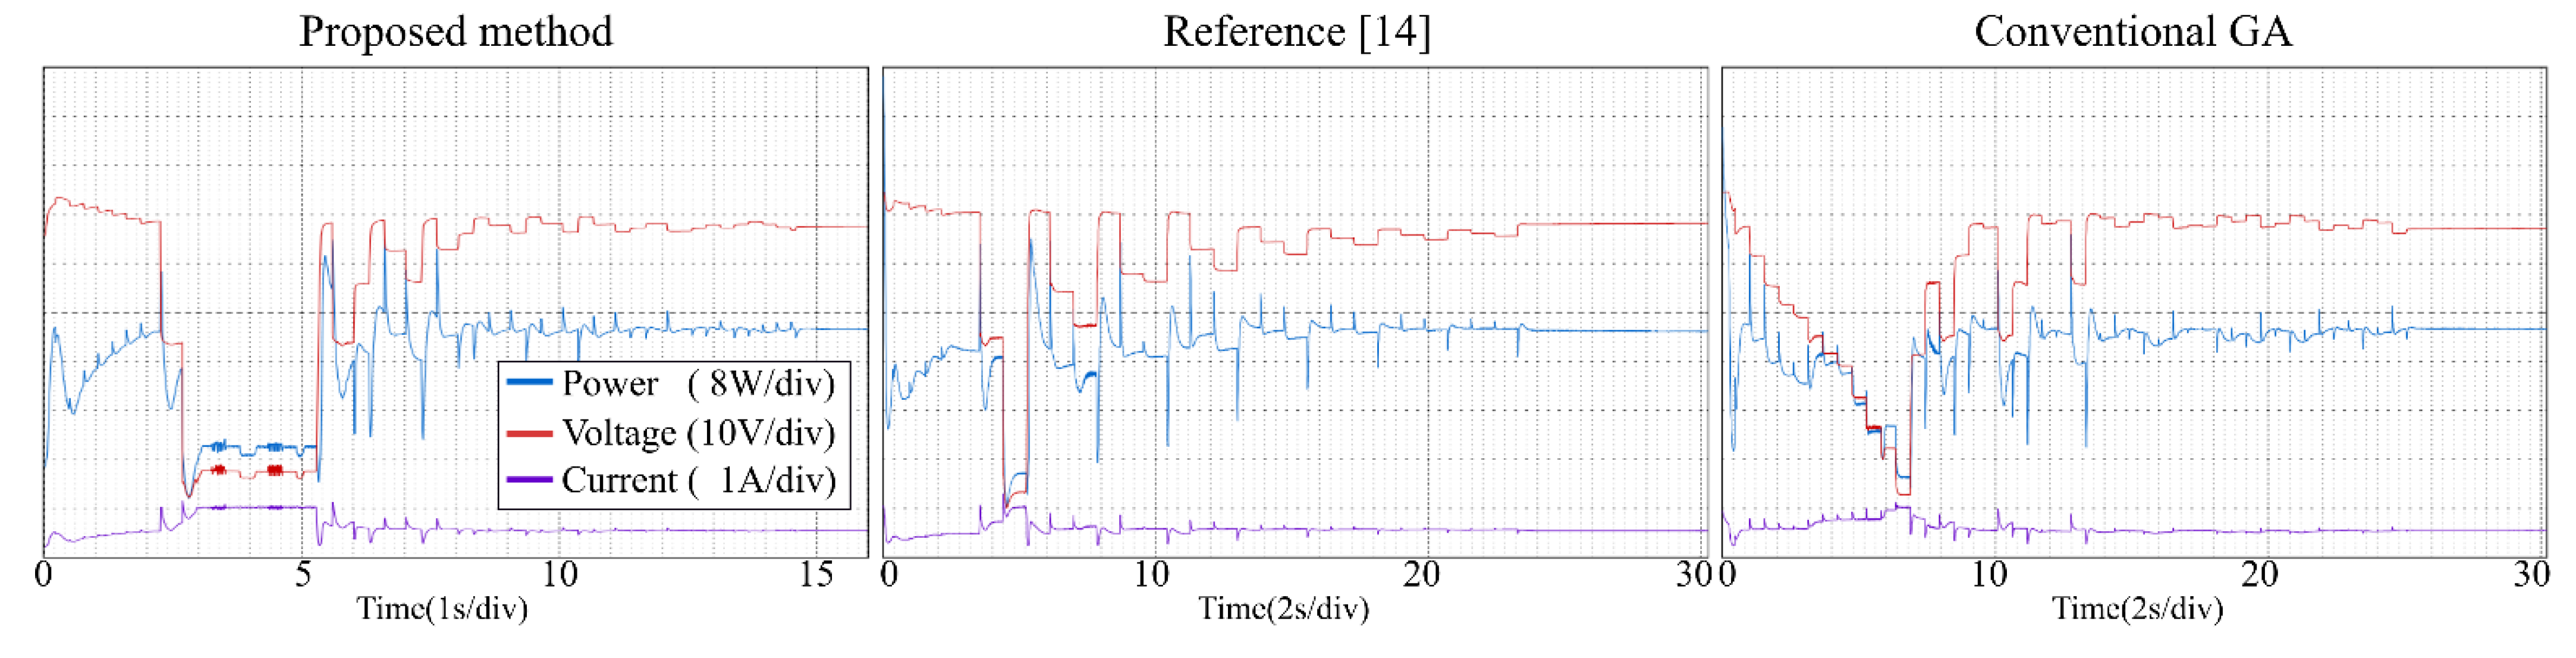
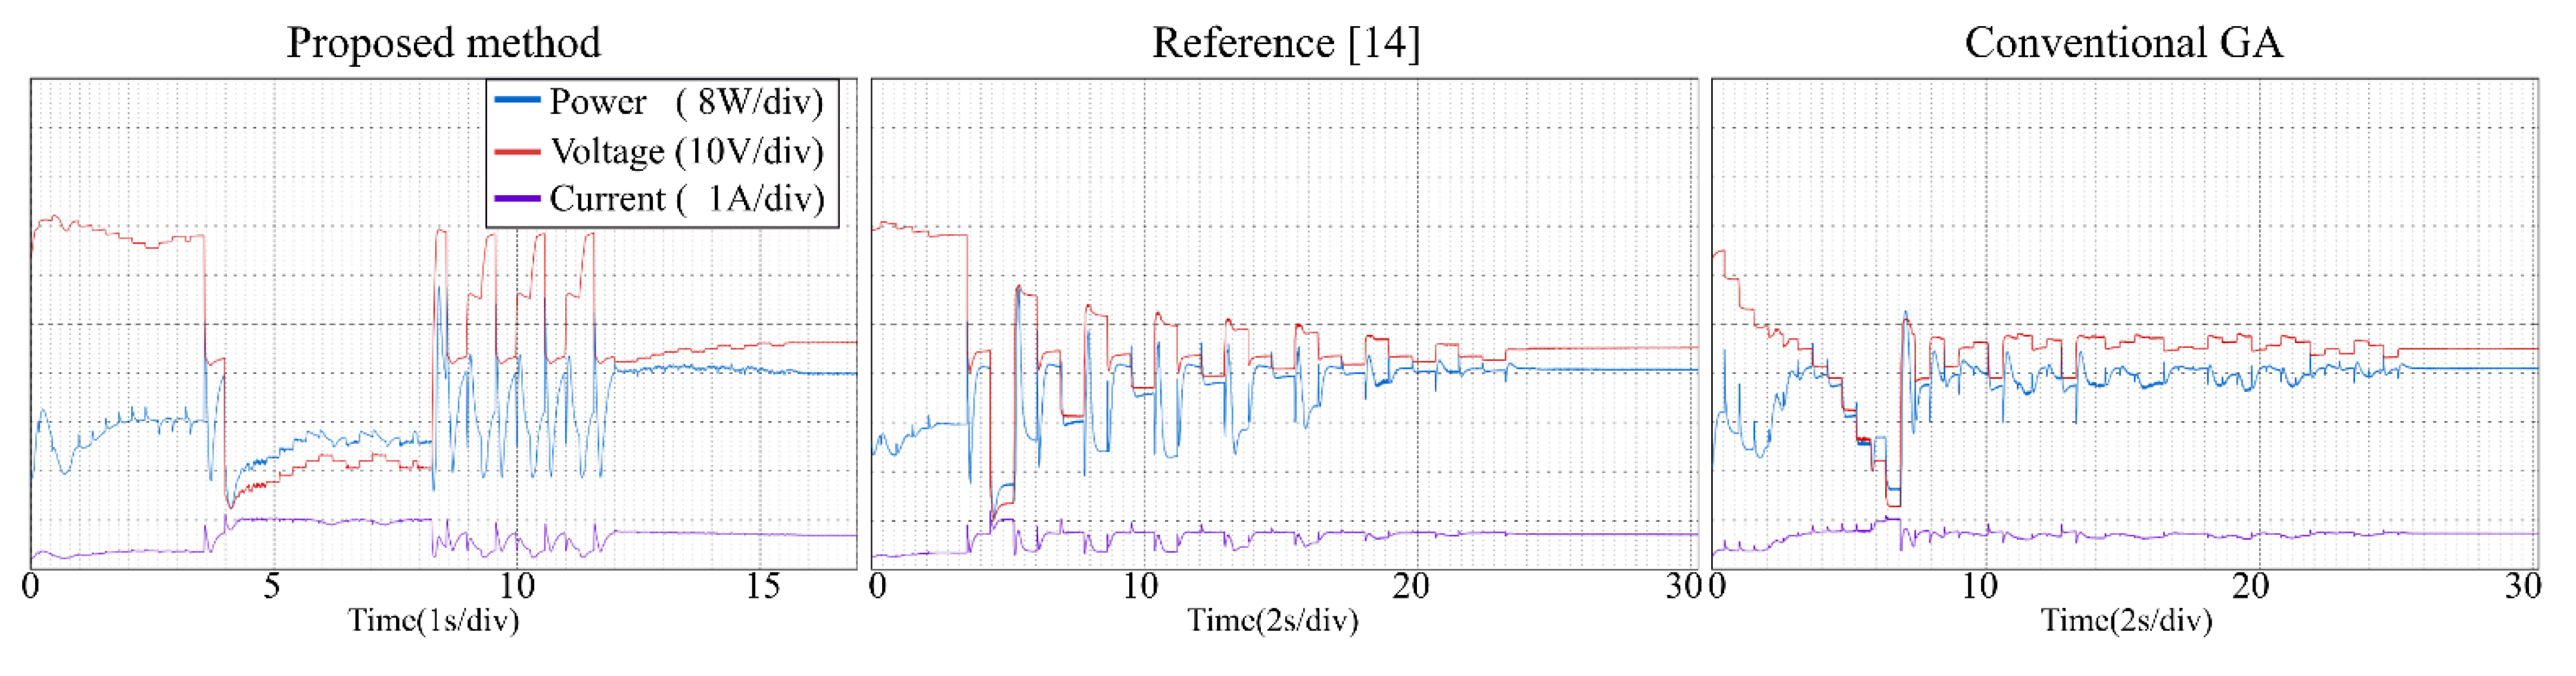
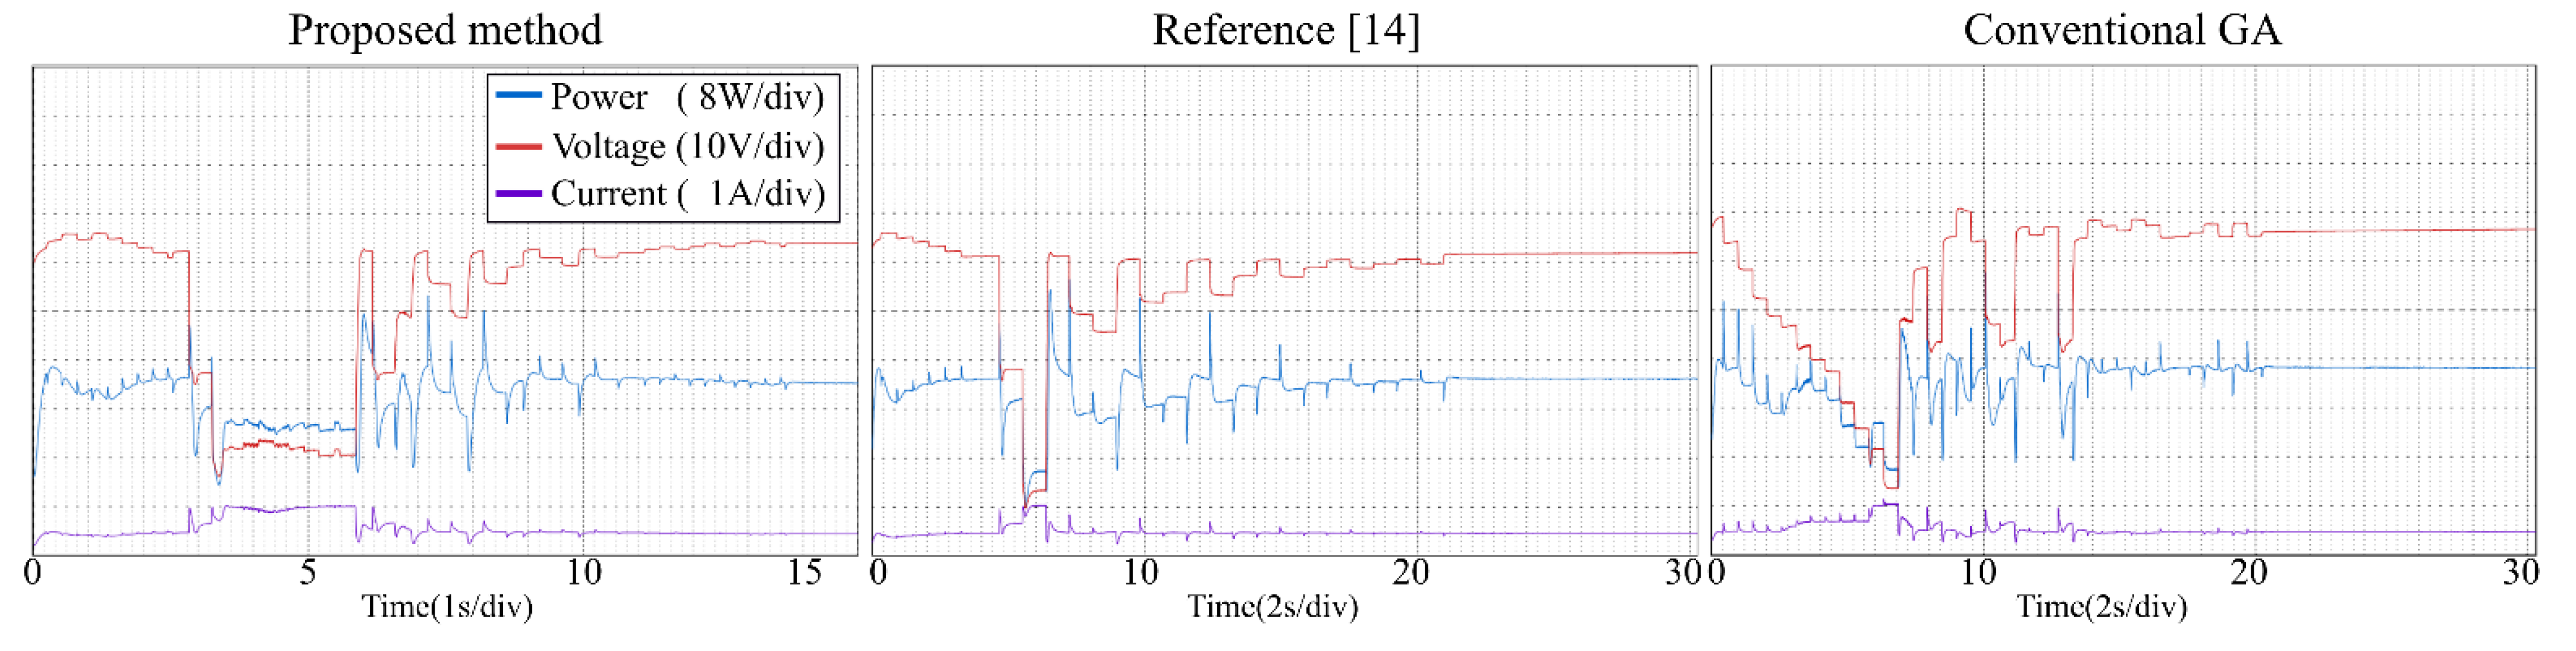
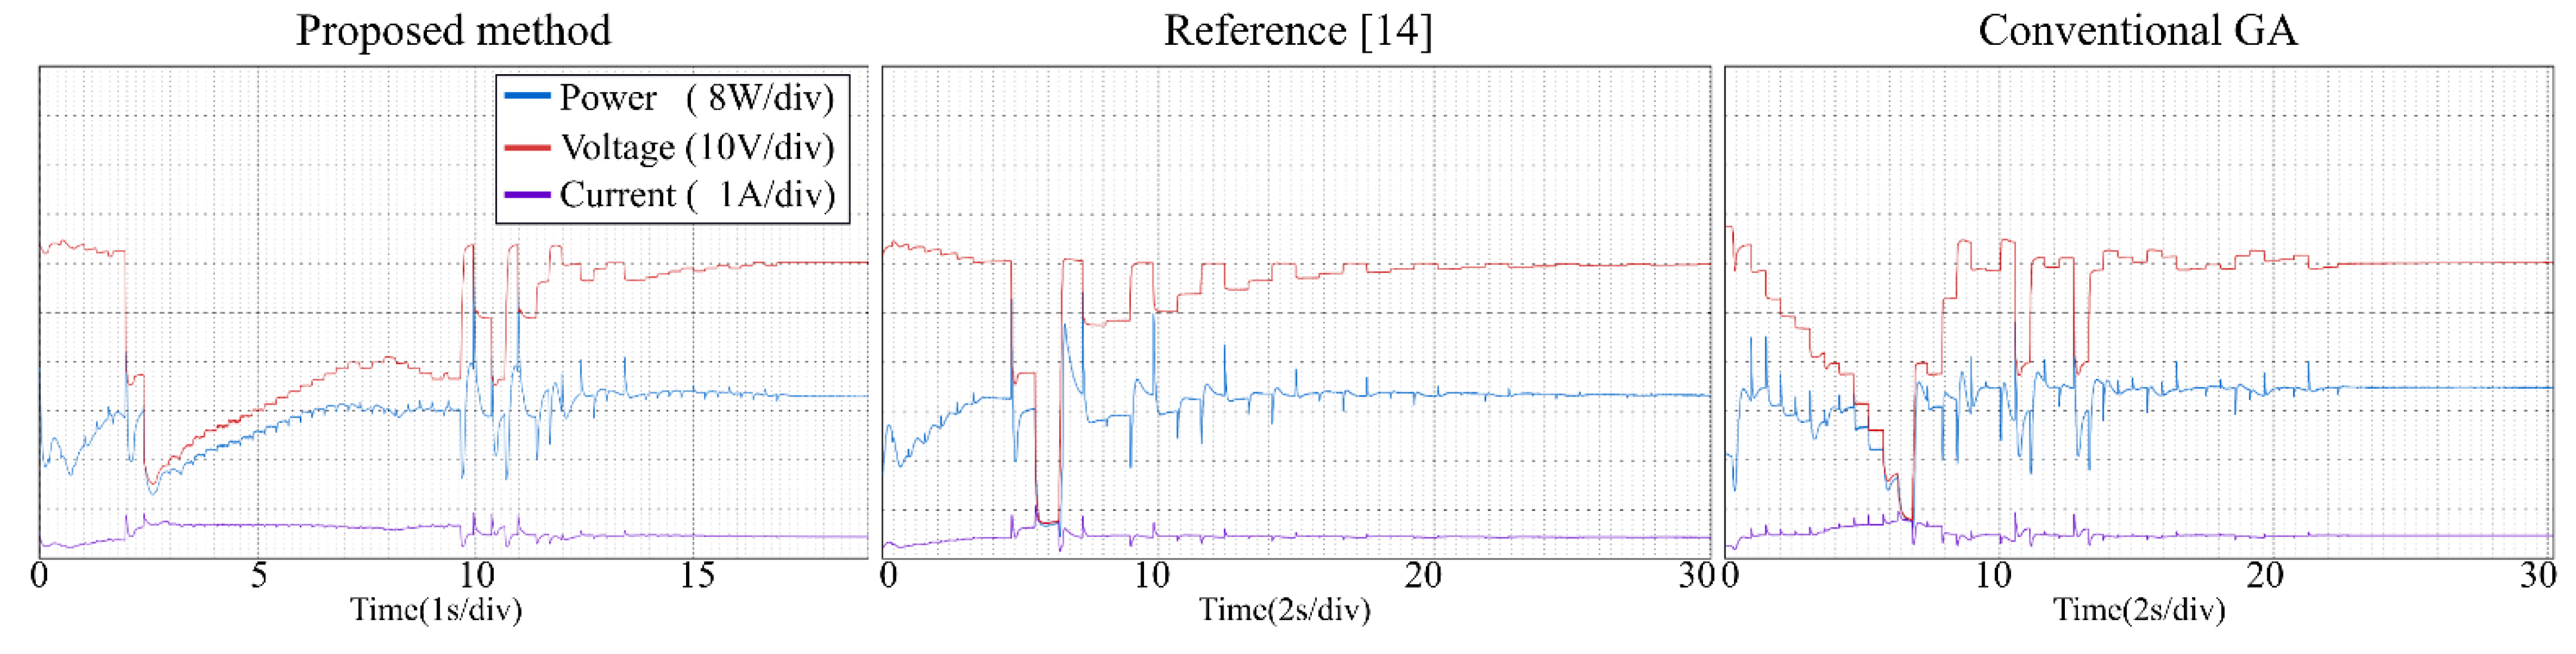
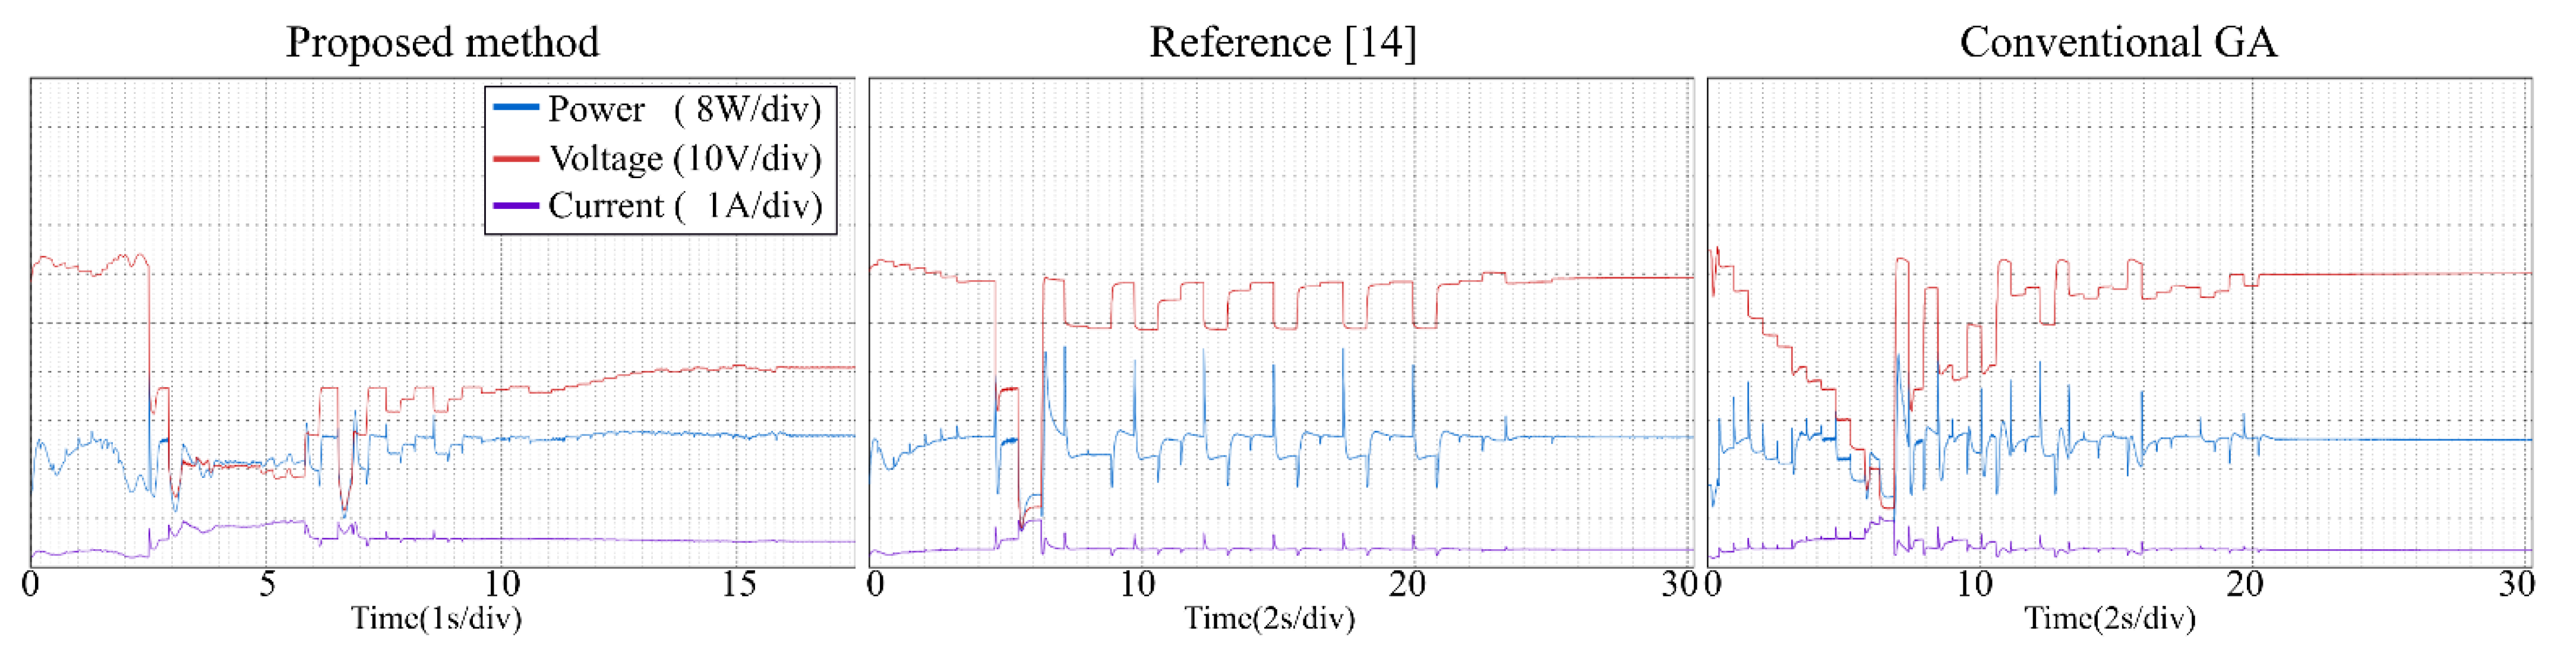
5. Experimental Results and Discussions

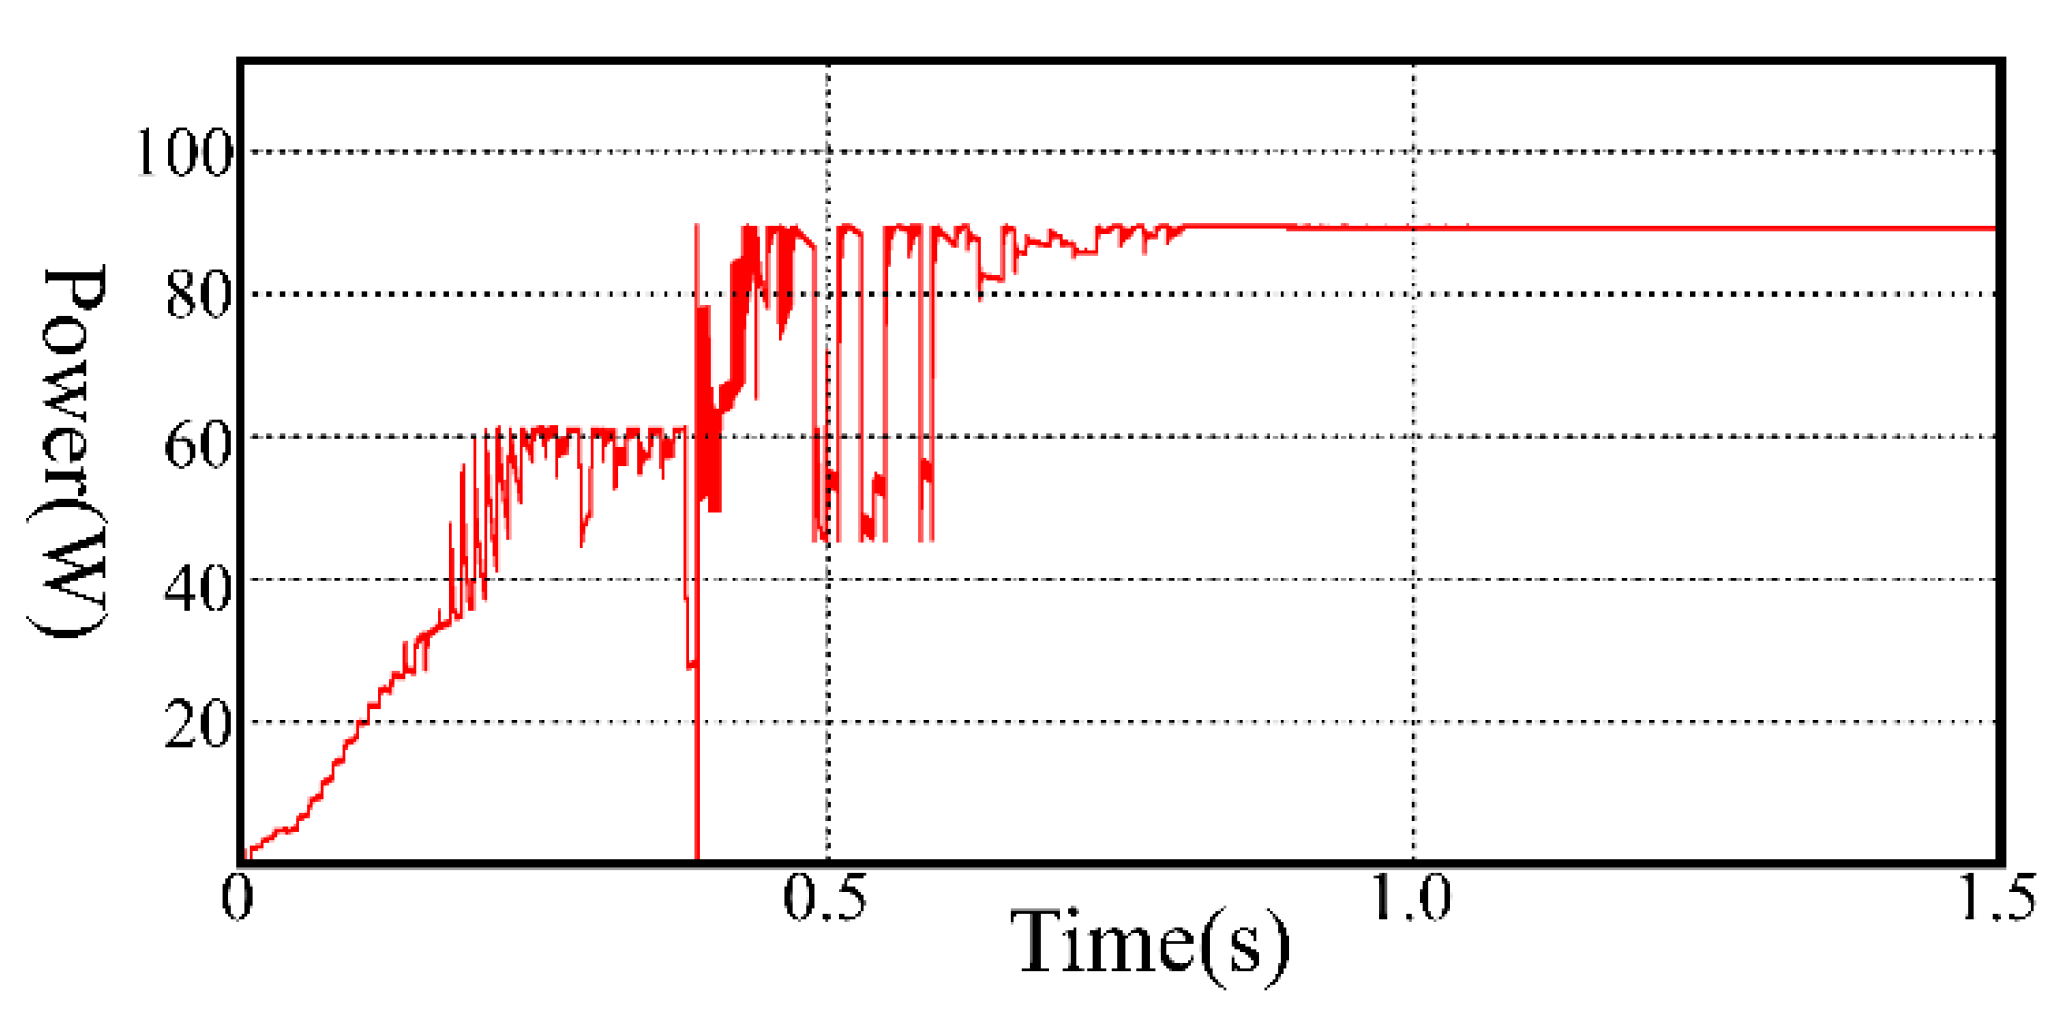
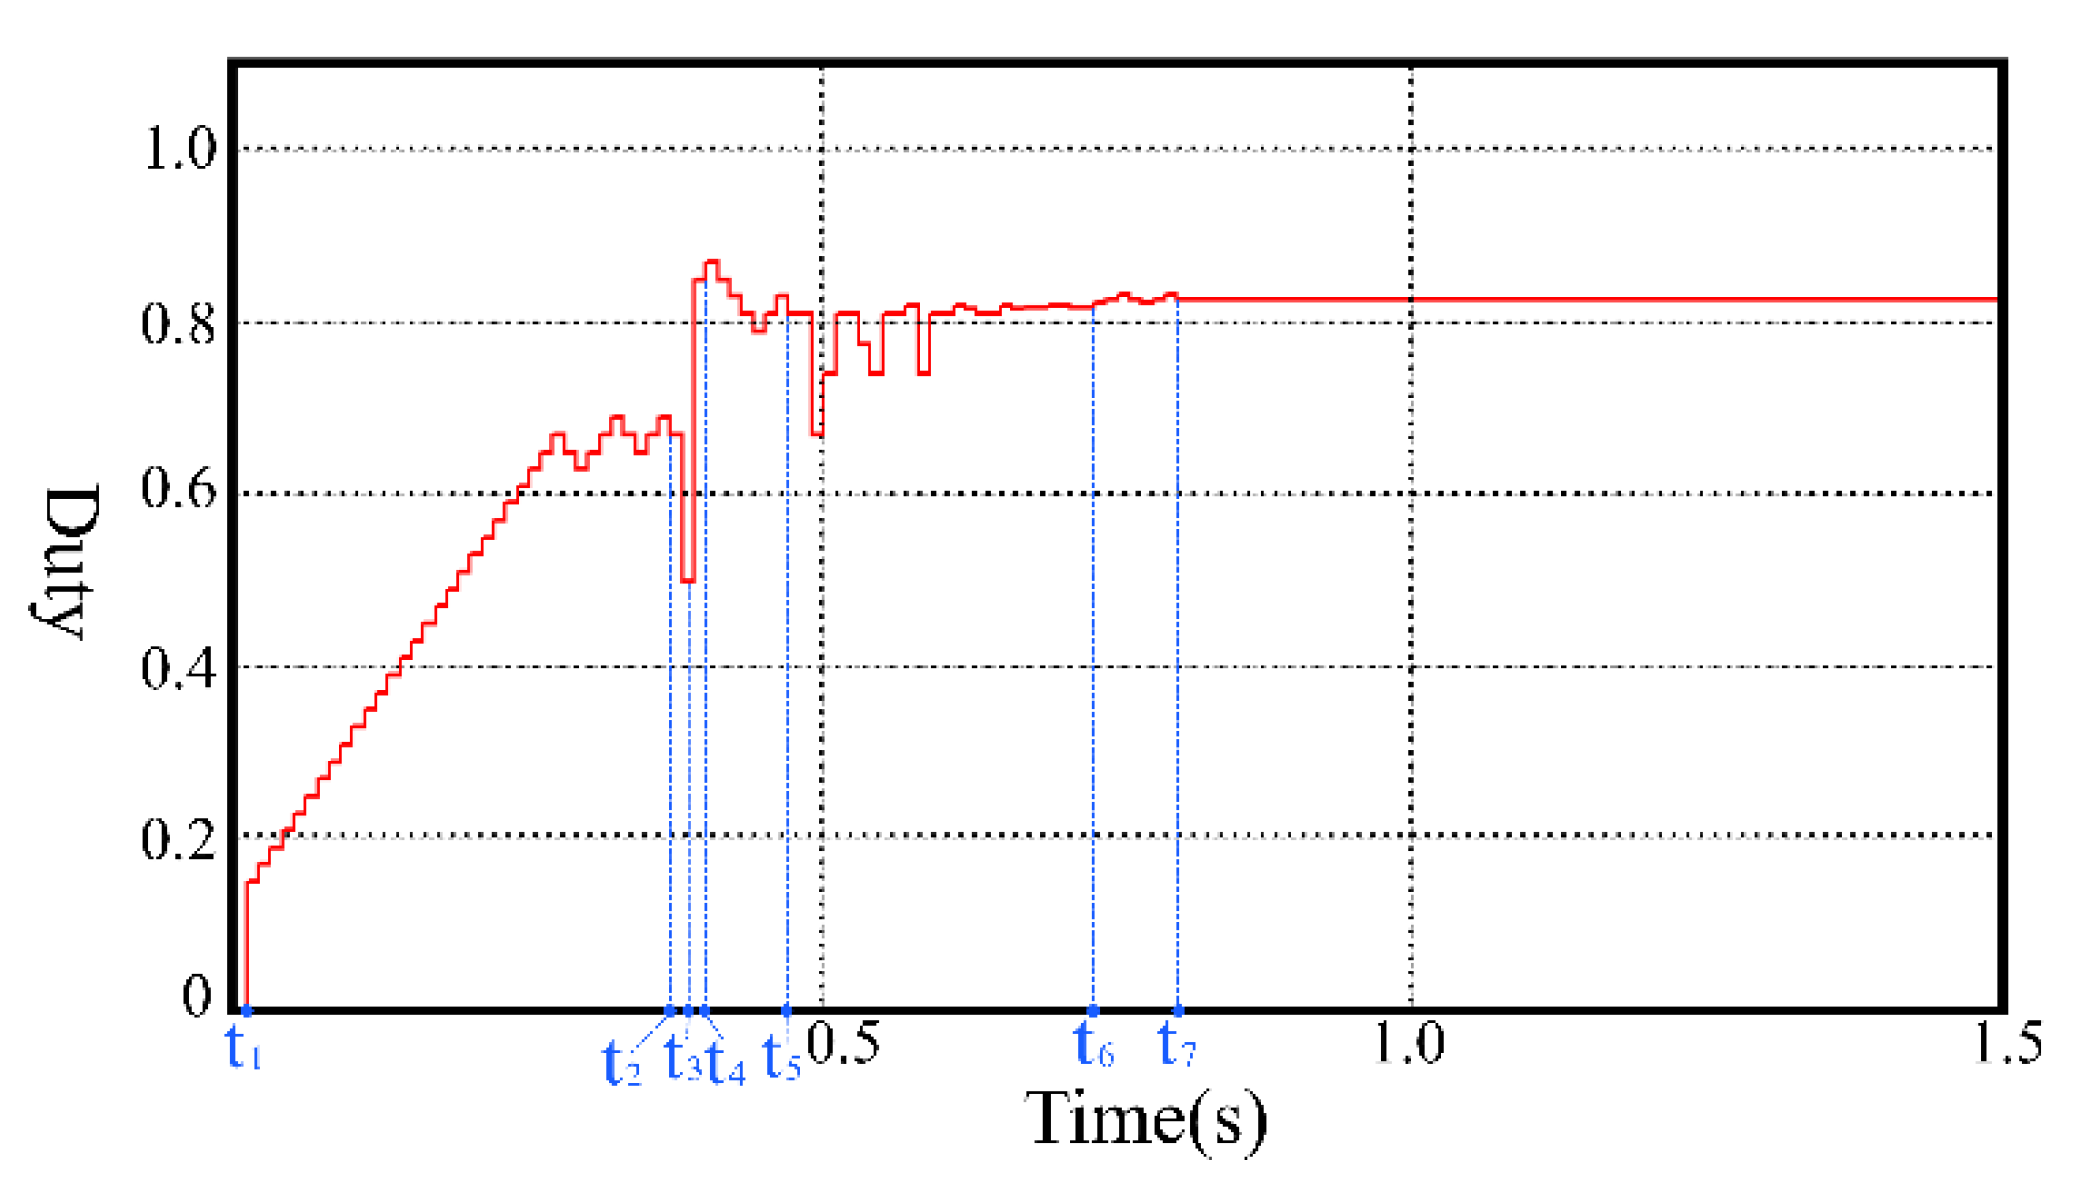
5.1. Experimental Results

The system controller used in this research is Texas Instruments TMS320F28335 DSP. A PV array simulator (ITECH IT6513C) is used to generate the required P-V and I-V curves. Table 1 lists the circuit parameters of the boost converter. Table 2 shows the parameters of PV modules.
In the experiments, three PV panels connected in a string are used to raise the output power. Six types of patterns, shown in Table 3, are considered for experiments. The resolutions of GMPP for the six test patterns: 43.2, 11.6, 24.74, 3.45, 8.41, 1.6% are listed in Table 3. Figure 12 shows the P-V curves of six patterns for the proposed system. The comparison among the proposed method, the conventional GA and the modified PSO of [14] are carried out. Figure 13, Figure 14, Figure 15, Figure 16, Figure 17 and Figure 18 show the experimental results of MPP tracking for these methods with six patterns.
From the experimental results, it is clear that the proposed method, the conventional GA and the modified PSO proposed can find the GMPP under different atmospheric conditions, and the steady-state oscillations are very small. Reference [14] combines P&O and PSO to make the tracking speed faster. However, PSO has many parameters (ω, c1, c2, r1, r2) need to be set by users, and all of the parameters affect the tracking efficiency directly. If the parameters are not setup properly, the system may have oscillations and the non-convergence will cause a large power loss. With the proposed method, the user does not need to setup any parameter, therefore the system implementation is very simple.
Table 4 gives the comparison of different MPP controls. Table 5 and Table 6 list the experimental results for the PV system with the proposed method. The proposed method uses P&O with a small step to track the GMPP more accurately. Once the GMPP is obtained, it stops the oscillations, which makes the out power almost the same as the theoretical maximum power. Therefore, the tracking efficiency (Pconv/PMPP) is very close to 100%. It is worth noting that in Pattern 6 (Green line, Figure 12), there are two peak points whose output power values are very close (resolution of 1.6%), which may lead the conventional GA and the method of [14] to not operate at the real peak power point, thus lowering the system efficiency. The tracking efficiencies for the three MPPT controls on Pattern 6 in Table 6 have relatively big differences among them compared to the data on other patterns, which is considered as the effect of the very close PV patterns. (The [(GMMP − LMPPmax)/GMPP]% of the Pattern 6 is obtained as: (21.82–21.46)/21.82% = 1.6%, GMMP = 21.82, LMPPmax = 21.46)

5.2. Discussions

The performance criteria for MPPT control include many different items such as the tracking time, tracking efficiency, implementation, cost, etc. However, it is difficult to cover all of the criteria in a research report. The proposed MPPT features the performance of MPP tracking without oscillations during the tracking process for the PV system under PSC. Therefore, the comparison of the proposed MPPT and two different MPPT controls are made in terms of the tracking time and tracking efficiency in this research.
The tracking efficiency for the proposed system under the transient response is around 99.5–99.8%. The focus of this research is on the tracking ability of the proposed MPPT, including the tracking time and the convergence of the tracking under PSC. The unique feature of the proposed control is the MPP tracking without oscillations in steady-state for photovoltaic energy systems. The measured results from experiments demonstrate the tracking performance from the beginning to the convergence of tracking for the proposed control and different MPPTs. The major difference between the proposed method and two different algorithms is the tracking time. The average tracking time of the proposed method is 14.5 s, and the average tracking time of method [14] and the conventional GA is 24.67 s and 23.5 s, respectively. It can be seen from the experiments, when the P-V curve has two or more peak power points, the algorithm of [14] and the conventional GA take longer to converge thus the tracking time is longer. Once the atmospheric conditions change faster, these algorithms may not operate at GMPPs for a long time and cause large power loss. The proposed method uses P&O with large steps to reduce the searching area, therefore saving the tracking time. It also works well to deal with the change of weather conditions and thus raise the system efficiency.
For most of the practical PV applications, noise on the PV pattern is usually filtered in order to not disturb the operation of MPPT control. Therefore, noisy PV patterns are not considered in this study.

6. Conclusions

This paper presents a hybrid global maximum power point tracking method that can track GMPP under PSC with nearly zero oscillations at steady-state. The proposed control combines the unique advantages of the P&O and the GA methods, such that the PV system can track and operate at GMPPs rapidly and accurately under different illuminance conditions. Once the GMPP is found, the system stops the oscillations. Thus, the power loss due to the perturbations of conventional MPPT in steady-state is effectively reduced. The improvement is achieved because of the following features: (1) The use of P&O quickly moves the operating point to the nearest LMPP, greatly reducing the searching area required for the GA method. (2) The use of GA makes the operating point quickly converge to the GMPP. (3) By stopping the oscillations when the steady-state condition is achieved. The simulation and the experimental results for the proposed method are provided to demonstrate the excellent performance.
This paper introduces a hybrid MPPT to achieve zero oscillation in steady-state and compares its performance in terms of tracking efficiency and tracking time to different methods in experimental tests. The experimental results have shown the excellent performance of the proposed MPPT.

Author Contributions

Conceptualization, C.-C.H.; formal analysis, Y.-J.Z. All authors have read and agreed to the published version of the manuscript.

Funding

This research was funded by Ministry of Science and Technology, Taiwan, R.O.C., grant number MOST 110-2221-E-224-020.

Conflicts of Interest

The authors declare no conflict of interest.

References

  1. Elbaset, A.A.; Ali, H.; Sattar, M.A.; Khaled, M. Implementation of a modified perturb and observe maximum power point tracking algorithm for photovoltaic system using an embedded microcontroller. IET Renew. Power Gener. 2016, 10, 551–560. [Google Scholar] [CrossRef]
  2. Kollimalla, K.; Mishra, M. Adaptive perturb & observe MPPT algorithm for photovoltaic system. In Proceedings of the 2013 IEEE Power and Energy Conference at Illinois (PECI), Urbana, IL, USA, 22–23 February 2013; pp. 42–47. [Google Scholar]
  3. Killi, M.; Samanta, S. Modified perturb and observe MPPT algorithm for drift avoidance in photovoltaic systems. IEEE Trans. Ind. Electron. 2015, 99, 1–10. [Google Scholar] [CrossRef]
  4. Faranda, R.; Leva, S. Energy comparison of MPPT techniques for PV systems. WSEAS Trans. Power Syst. 2008, 3, 446–455. [Google Scholar]
  5. Mahtab, K.; Mohammad, H.J. A Combinational Maximum Power Point Tracking Algorithm in Photovoltaic Systems under Partial Shading Conditions. In Proceedings of the 4th Iranian Conference on Renewable Energy and Distributed Generation, Iran, Mashhad, 2–3 March 2016. [Google Scholar]
  6. Subudhi, B.; Pradhan, R. A comparative study on maximum power point tracking techniques for photovoltaic power systems. IEEE Trans. Sustain. Energy 2013, 4, 89–98. [Google Scholar] [CrossRef]
  7. Petrone, G.; Spagnuolo, G.; Vitelli, M. An analog technique for distributed MPPT PV applications. IEEE Trans. Ind. Electron. 2012, 59, 4713–4722. [Google Scholar] [CrossRef]
  8. Sreeraj, E.; Chatterjee, K.; Bandyopadhyay, S. One-cycle-controlled single-stage single-phase voltage-sensorless grid-connected PV system. IEEE Trans. Ind. Electron. 2013, 60, 1216–1224. [Google Scholar] [CrossRef]
  9. Sher, H.A.; Murtaza, A.F.; Noman, A.; Addoweesh, K.E.; Al-Haddad, K.; Chiaberge, M. A New Sensorless Hybrid MPPT Algorithm Based on Fractional Short-Circuit Current Measurement and P&O MPPT. IEEE Trans. Sustain. Energy 2015, 6, 1426–1434. [Google Scholar]
  10. Kermadi, M.; Salam, Z.; Eltamaly, A.M.; Ahmed, J.; Mekhilef, S.; Larbes, C.; Berkouk, E. Recent developments of MPPT techniques for PV systems under partial shading conditions: A critical review and performance evaluation. IET Renew. Power Gener. 2020, 14, 3401–3417. [Google Scholar] [CrossRef]
  11. Blanes, J.; Toledo, F.; Montero, S.; Garrigos, A. In-site real-time photovoltaic I-V curves and maximum power point estimator. IEEE Trans. Power Electron. 2013, 28, 1234–1240. [Google Scholar] [CrossRef]
  12. Rai, A.K.; Kaushika, N.D.; Singh, B.; Agarwal, N. Simulation model of ANN based maximum power point tracking controller for solar PV system. Solar Energy Mater. Solar Cells 2011, 95, 773–778. [Google Scholar] [CrossRef]
  13. Ishaque, K.; Salam, Z.; Amjad, M.; Mekhilef, S. An Improved Particle Swarm Optimization (PSO)–Based MPPT for PV With Reduced Steady-State Oscillation. IEEE Trans. Power Electron. 2012, 27, 3627. [Google Scholar] [CrossRef]
  14. Lian, K.L.; Jhang, J.H.; Tian, I.S. A Maximum Power Point Tracking Method Based on Perturb-and-Observe Combined with Particle Swarm Optimization. IEEE J. Photovolt. 2014, 4, 626–633. [Google Scholar] [CrossRef]
  15. Sulthana, N.; Babu, K.T.H. A MPPT Controlled Switched Capacitor and Regenerative Boost Converter for PV Systems. In Proceedings of the 2020 International Conference on Futuristic Technologies in Control Systems & Renewable Energy (ICFCR), Malappuram, India, 23–24 September 2020; pp. 1–8. [Google Scholar]
  16. Ji, Y.; Wu, B.; Hou, Y.; Ding, A. A MZ Modulator Bias Control System Based on Variable Step P&O Algorithm. IEEE Photonics Technol. Lett. 2020, 32, 1473–1476. [Google Scholar]
  17. Sarika, P.E.; Jacob, J.; Mohammed, S.; Paul, S. A Novel Hybrid Maximum Power Point Tracking Technique with Zero Oscillation Based on P&O Algorithm. Int. J. Renew. Energy Res. 2020, 10, 1962–1973. [Google Scholar]
  18. Alajmi, B.N.; Ahmed, K.H.; Finney, S.J.; Williams, B.W. Fuzzy-logic-control approach of a modified hill-climbing method for maximum power point in microgrid standalone photovoltaic system. IEEE Trans. Power Electron. 2011, 26, 1022–1030. [Google Scholar] [CrossRef]
  19. Paz, F.; Ordonez, M. Zero Oscillation and Irradiance Slope Tracking for Photovoltaic MPPT. IEEE Trans. Ind. Electron. 2014, 61, 6138–6147. [Google Scholar] [CrossRef]
  20. Danandeh, M.A.; Mousavi, S.M.G. Comparative and comprehensive review of maximum power point tracking methods for PV cells. Renew. Sustain. Energy Rev. 2018, 82, 2743–2767. [Google Scholar] [CrossRef]
  21. Hua, C.-C.; Chen, Y. Modified perturb and observe MPPT with zero oscillation in steady-state for PV systems under partial shaded conditions. In Proceedings of the IEEE Conference on Energy Conversion (CENCON), Kuala Lumpur, Malaysia, 30–31 October 2017; pp. 5–9. [Google Scholar]
  22. Liu, Y.H.; Chen, J.H.; Huang, J.W. A review of maximum power point tracking techniques for use in partially shaded conditions. Renew. Sustain. Energy Rev. 2015, 41, 436–453. [Google Scholar] [CrossRef]
  23. Bizon, N. Global Maximum Power Point Tracking (GMPPT) of Photovoltaic array using the Extremum Seeking Control (ESC): A review and a new GMPPT ESC scheme. Renew. Sustain. Energy Rev. 2016, 57, 524–539. [Google Scholar] [CrossRef]
  24. Bidram, A.; Davoudi, A.; Balog, R.S. Control and Circuit Techniques to Mitigate Partial Shading Effects in Photovoltaic Arrays. IEEE J. Photovolt. 2012, 2, 532–546. [Google Scholar] [CrossRef]
Figure 1. The flowchart of conventional GA.
Energies 14 05590 g001
Figure 2. The block diagram of the PV system.
Energies 14 05590 g002
Figure 3. The equivalent circuit for a PV cell.
Energies 14 05590 g003
Figure 4. P-V, I-V characteristic curves.
Energies 14 05590 g004
Figure 5. The flowchart of conventional P&O.
Energies 14 05590 g005
Figure 6. The tracking process of the conventional P&O.
Energies 14 05590 g006
Figure 7. The P-V curve with two peak points under PSC.
Energies 14 05590 g007
Figure 8. The P-V curve under PSC (1 k, 0.7 k and 0.3 kW/m2).
Energies 14 05590 g008
Figure 9. The flowchart of the proposed method.
Energies 14 05590 g009
Figure 10. GMPP tracking under PSC with proposed method-Transient response.
Energies 14 05590 g010
Figure 11. The duty ratio of system with proposed method under PSC.
Energies 14 05590 g011
Figure 12. The P-V curves of six test patterns.
Energies 14 05590 g012
Figure 13. Tracking process—Pattern 1.
Energies 14 05590 g013
Figure 14. Tracking process—Pattern 2.
Energies 14 05590 g014
Figure 15. Tracking process—Pattern 3.
Energies 14 05590 g015
Figure 16. Tracking process—Pattern 4.
Energies 14 05590 g016
Figure 17. Tracking process—Pattern 5.
Energies 14 05590 g017
Figure 18. Tracking process—Pattern 6.
Energies 14 05590 g018
Table 1. Circuit parameters of the boost converter.
Circuit ParametersValue
Inductance
Switch Frequency
500 μH
100 k Hz
Output capacitance
Mode of operation
22 μF
CCM
Table 2. Parameters of PV module.
ParametersValue
Open-circuit voltage
Shirt-circuit current
26.74 V
1.03 A
Maximum output power
Maximum power point
21.31 W
21.97 V
Table 3. Six test patterns.
PatternT
(°C)
G
(W/m2)
Vmpp
(V)
Pmpp
(W)
Resolution (%)
1251000, 1000, 30045.0042.9643.2
21000, 700, 50067.5037.4011.6
31000, 700, 30046.1832.6024.74
4501000, 600, 40063.9128.403.45
5700, 600, 40060.2526.758.41
6900, 500, 30040.9022.061.6
Note: Resolution= [(GMMP − MPPmax)/GMPP]%.
Table 4. Comparison of MPPT methods.
MPPT AlgorithmTrack GMPPSteady-State OscillationImplementation
Proposed methodYes(Almost)zeroEasy
Reference [14]YeslowDifficult
Conventional GAYeslowMiddle
Table 5. Experimental results for Patterns 1–3.
MPPT AlgorithmPattern 1Pattern 2Pattern 3
Power
(W)
Tracking Time (s)Tracking
Efficiency
Power
(W)
Tracking Time (s)Tracking
Efficiency
Power
(W)
Tracking Time (s)Tracking
Efficiency
Proposed method42.901299.8%37.381599.9%32.561599.8%
Reference [14]41.972497.7%37.232499.5%32.362499.2%
Conventional GA42.302398.4%37.382699.9%32.382699.3%
Table 6. Experimental results for Patterns 4–6.
MPPT AlgorithmPattern 4Pattern 5Pattern 6
Power
(W)
Tracking Time (s)Tracking
Efficiency
Power
(W)
Tracking Time (s)Tracking
Efficiency
Power
(W)
Tracking Time (s)Tracking
Efficiency
Proposed method28. 1499.8%26.731699.9%22.061699.9%
Reference [14]28.152299.1%26.732899.9%21.432697.1%
Conventional GA28.302199.6%26.712399.8%20.912294.7%
Publisher’s Note: MDPI stays neutral with regard to jurisdictional claims in published maps and institutional affiliations.

