Article

Optimal Sizing of Battery-Integrated Hybrid Renewable Energy Sources with Ramp Rate Limitations on a Grid Using ALA-QPSO

by
Ramakrishna S. S. Nuvvula
1,
Devaraj Elangovan
2,*,
Kishore Srinivasa Teegala
3,
Rajvikram Madurai Elavarasan
4,*,
Md. Rabiul Islam
5,* and
Ravikiran Inapakurthi
6
1
School of Electrical Engineering, Vellore Institute of Technology (VIT), Vellore 632014, India
2
TIFAC-CORE, Vellore Institute of Technology (VIT), Vellore 632014, India
3
Electrical & Electronics Engineering, GMR Institute of Technology, Rajam 532127, India
4
Clean and Resilient Energy Systems (CARES) Laboratory, Texas A&M University, Galveston, TX 77553, USA
5
School of Electrical, Computer, and Telecommunications Engineering, University of Wollongong, Wollongong, NSW 2522, Australia
6
Electrical & Electronics Engineering, Raghu Engineering College, Dakamarri, Visakhapatnam 531162, India
*
Authors to whom correspondence should be addressed.
Energies 2021, 14(17), 5368; https://doi.org/10.3390/en14175368
Submission received: 15 July 2021 / Revised: 22 August 2021 / Accepted: 24 August 2021 / Published: 28 August 2021
(This article belongs to the Collection Feature Papers in Smart Grids and Microgrids)

Abstract

:
Higher penetration of variable renewable energy sources into the grid brings down the plant load factor of thermal power plants. However, during sudden changes in load, the thermal power plants support the grid, though at higher ramping rates and with inefficient operation. Hence, further renewable additions must be backed by battery energy storage systems to limit the ramping rate of a thermal power plant and to avoid deploying diesel generators. In this paper, battery-integrated renewable energy systems that include floating solar, bifacial rooftop, and wind energy systems are evaluated for a designated smart city in India to reduce ramping support by a thermal power plant. Two variants of adaptive-local-attractor-based quantum-behaved particle swarm optimization (ALA-QPSO) are applied for optimal sizing of battery-integrated and hybrid renewable energy sources to minimize the levelized cost of energy (LCoE), battery life cycle loss (LCL), and loss of power supply probability (LPSP). The obtained results are then compared with four variants of differential evolution. The results show that out of 427 MW of the energy potential, an optimal set of hybrid renewable energy sources containing 274 MW of rooftop PV, 99 MW of floating PV, and 60 MW of wind energy systems supported by 131 MWh of batteries results in an LPSP of 0.005%, an LCoE of 0.077 USD/kW, and an LCL of 0.0087. A sensitivity analysis of the results obtained through ALA-QPSO is performed to assess the impact of damage to batteries and unplanned load appreciation, and it is found that the optimal set results in more energy sustainability.

1. Introduction

Energy being one of the most imported commodities in developing nations, an increase in crude oil and coal prices witnessed widening fiscal deficits. In contrast, renewable energy costs have drastically reduced from 2010 to 2019 owing to mass production. These favorable conditions allowed developing economies to invest in eco-friendly and cost-effective renewable energy sources to comply with Sustainable Development Goals decided during the Paris Agreement. India, with its crude imports pegged at 82% of its energy needs, witnessed an 84% fall in renewable energy costs in this period, with tenders falling to as low as 33 USD/MWh [1]. With digital transformation creating exciting employment opportunities, urban areas in India are witnessing a mass exodus from rural areas [2]. This has resulted in significant demographic changes that have propped up the energy, water, and transportation needs of the cities. This has led to dented air quality mainly due to conventional transportation and outdated and inefficient industrial equipment. With all these developments, the energy needs of urban areas are set to double by 2030. Substantial deployment of renewable energy systems is essential to evade coal-/gas-based power plants to meet the additional energy needs.

1.1. Current Electric Energy Scenario in India

With the introduction of the Electricity Act of 2003, plenty of opportunities unfolded for private players as all the electric power segments (generation, transmission, and distribution) opened up for investments. As of February 2020, the total installed capacity in India was 367.28 GW, of which only 25.2% was from the central sector and the remaining was shared between state and private sectors. The capacity addition is at a compounded annual growth rate of 5.19%, which reflects staggering economic growth in recent years. Besides, the share of renewable energy is pegged at 23.5%, though it is far from the ambitious target of 175 GW of renewable additions by 2021–2022. The rising cost of oil and coal mining policy issues in coal-exporting countries have led to a decrease in the plant load factor of conventional generators, as shown in Figure 1 [3]. This has also led to reduced growth of conventional energy sources, as evident from Table 1. Difficulties in land acquisition, especially in urban areas, where the actual demand exists, have led to diminished interest from private players. In this context, municipal corporations and distribution companies are required to step up investments in renewable energy systems in partnership with private players to exude confidence in private players.
In addition, municipal corporations can benefit from such partnerships that open up investments in other needs of the city, such as piped gas and fiber optics. To make such partnerships viable, a proper methodology has to be followed for optimally sizing renewable energy systems. Since the energy usage pattern is subjected to economic activity, which is affected by factors such as special economic zones, access to roads, and the main city, site selection becomes a key factor in planning for renewable energy systems. With the data regarding economic activity in hand, land cover and load data can be forecasted, and hence, a distribution system can be planned accordingly.

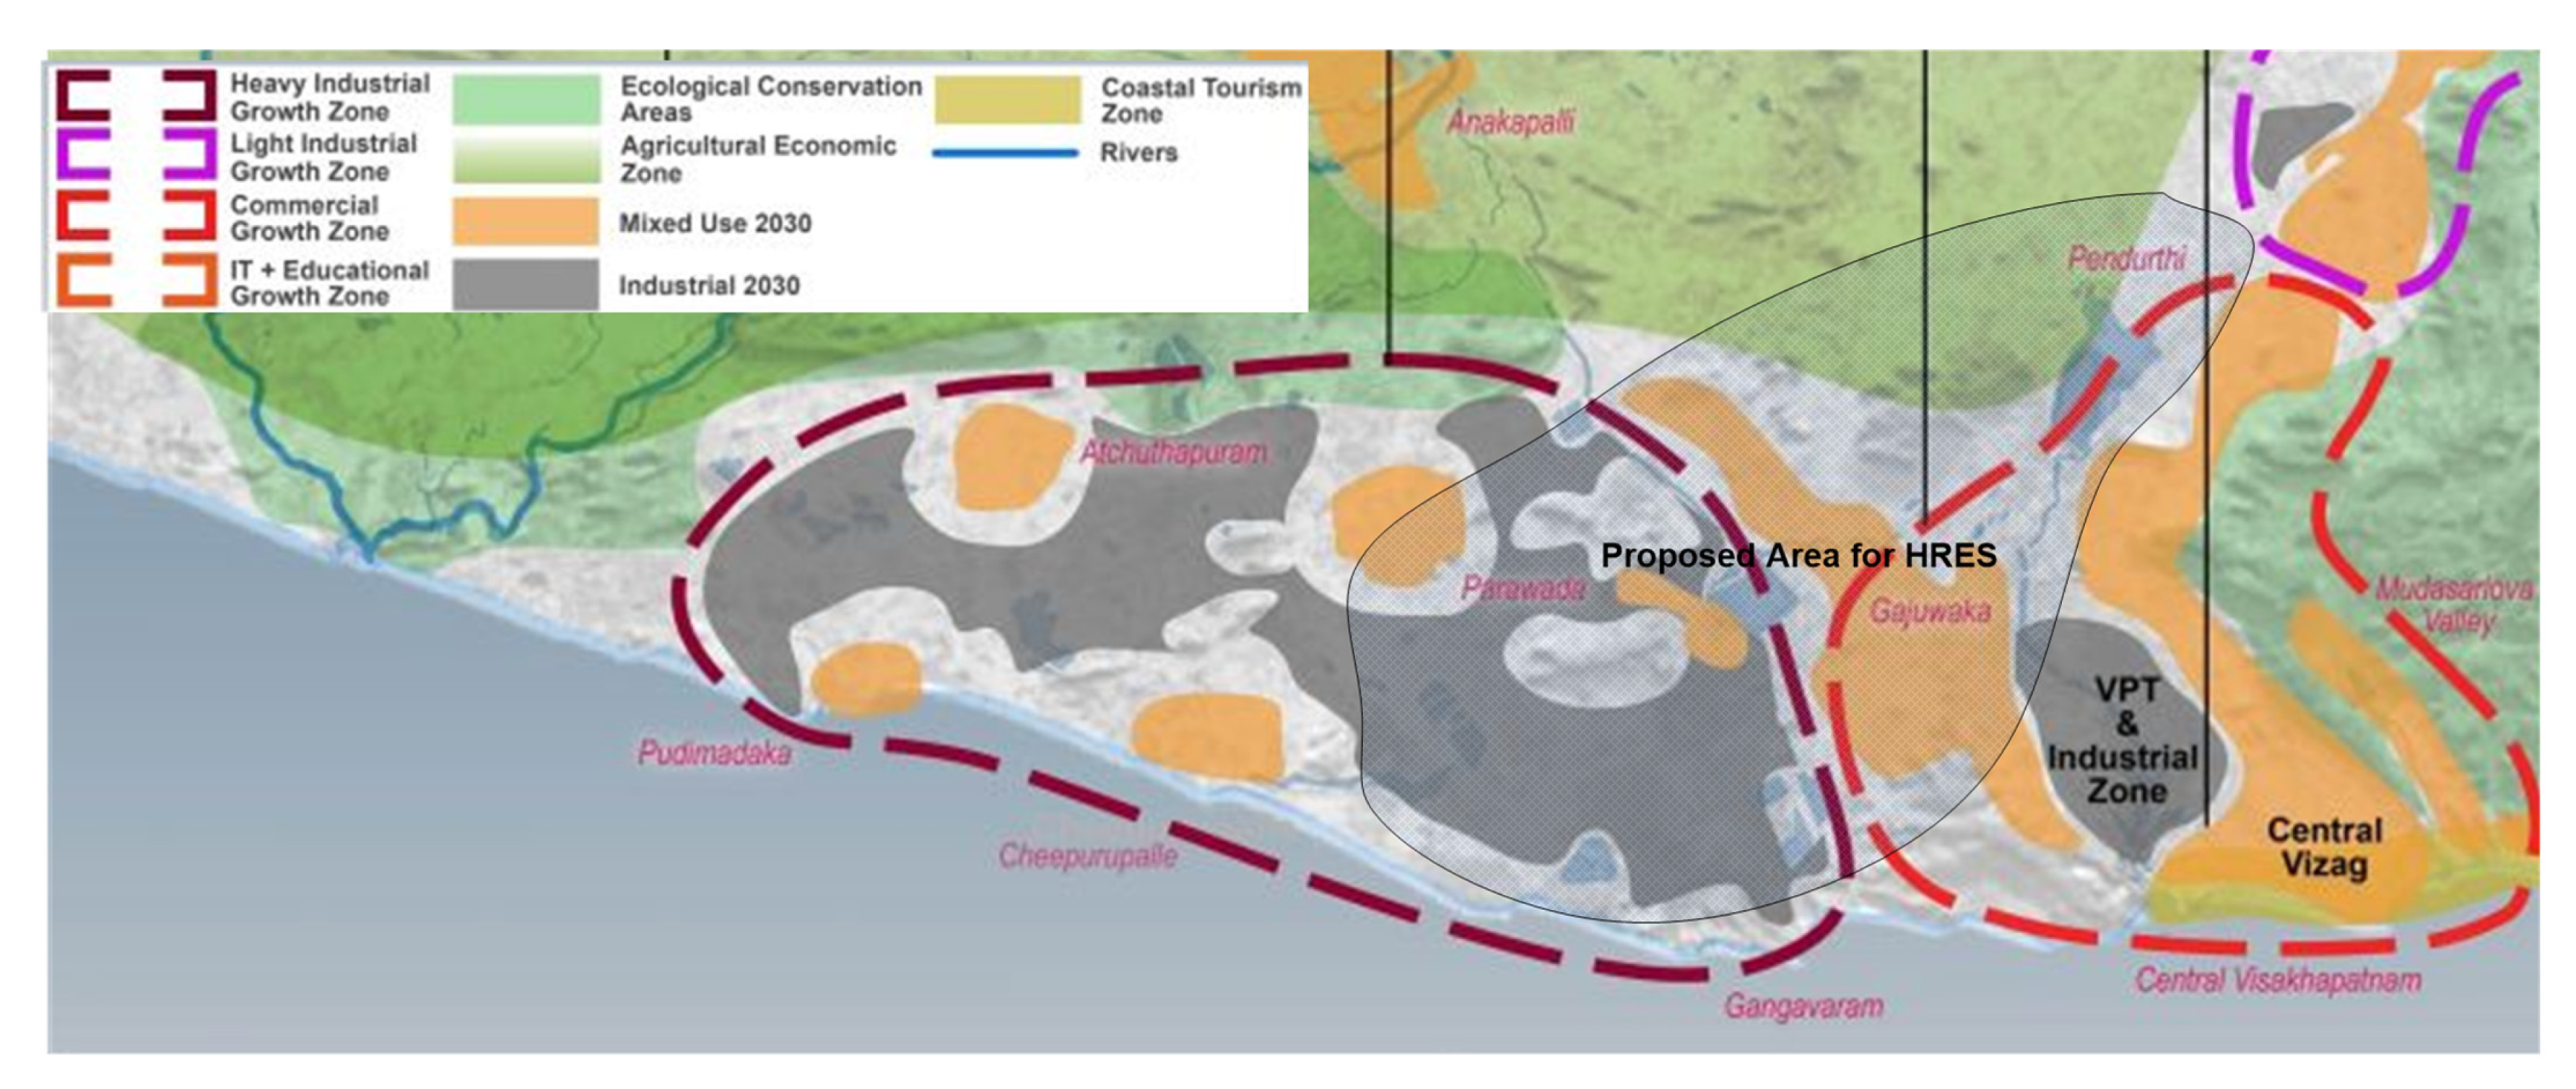
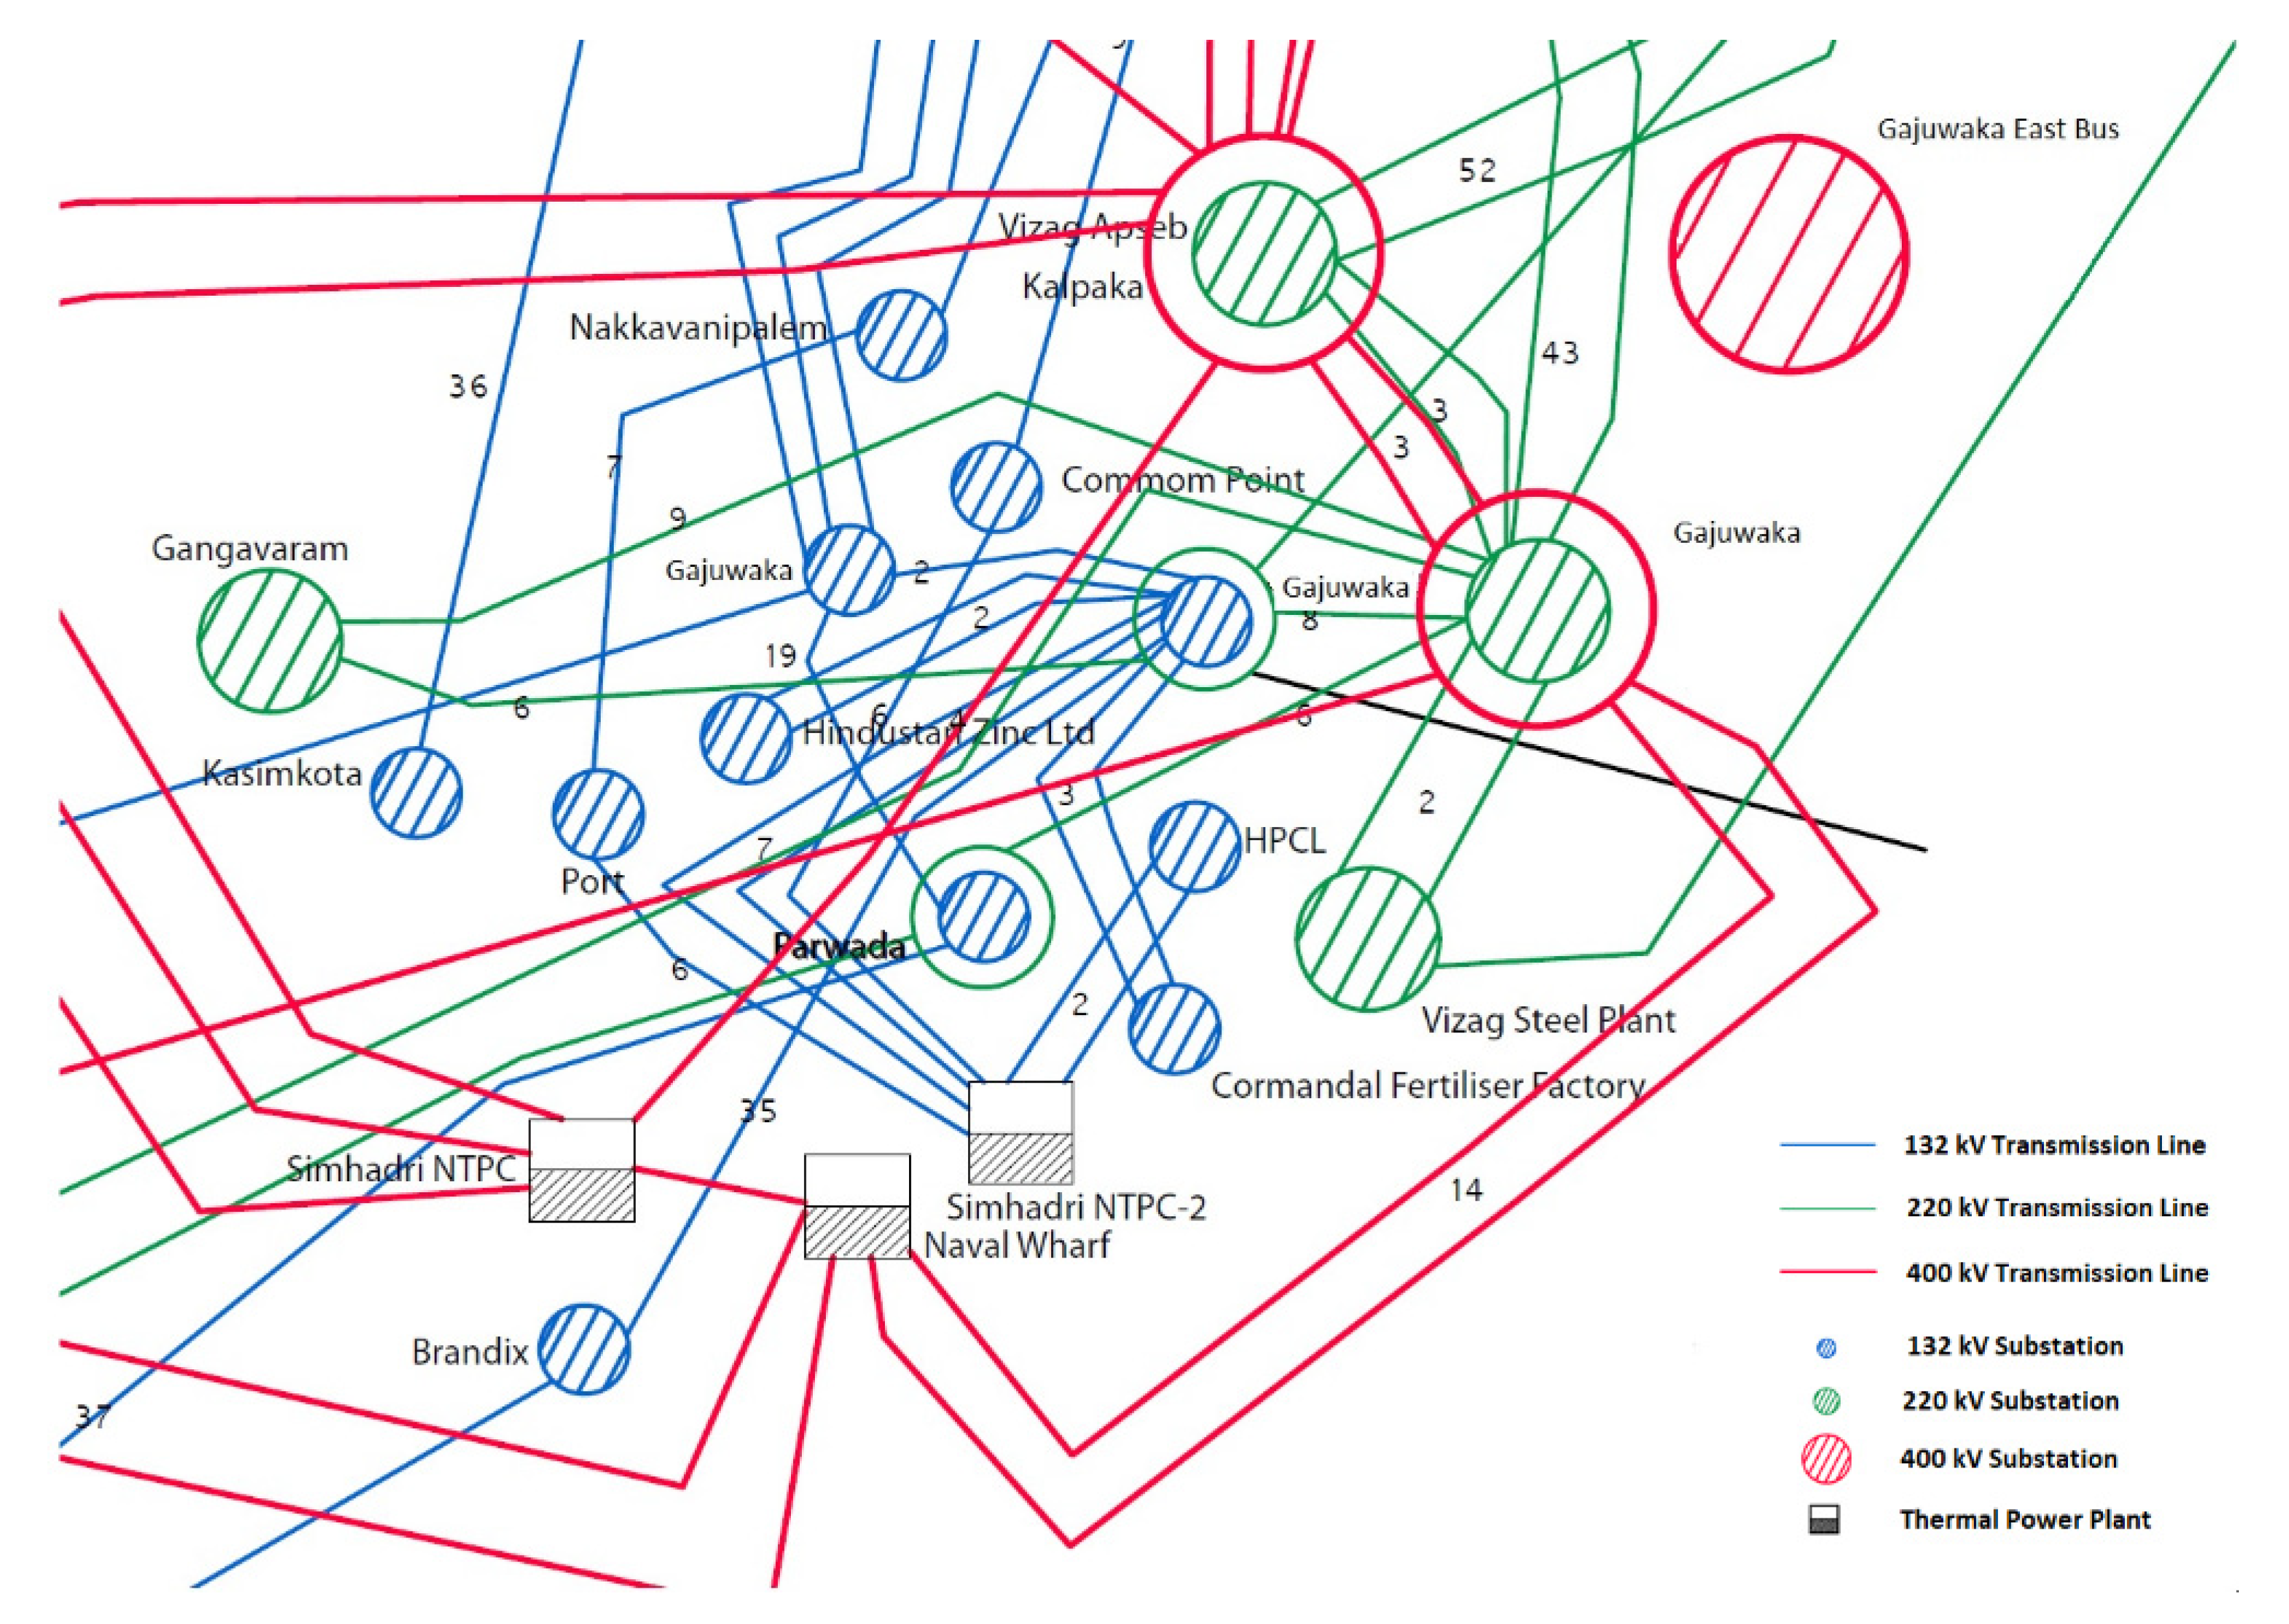
1.2. Electric Energy Scenario in the Proposed Location

As of February 2020, the installed capacity of Andhra Pradesh was 24.803 GW, with renewable energy pegged at just 8.313 GW in contrast to the target of 18 GW by 2021–2022 [4]. To meet the target, involvement from all the stakeholders such as municipal corporations, cooperative societies, and private players is desired. Visakhapatnam, being the second-largest city in Andhra Pradesh, is contributing more than 10% of the state gross domestic product, strengthened by its diversified industrial segments such as steel and pharma and needs to contribute heavily in meeting the renewable energy target. With the city designated as a smart city by the central government, funds amounting to 150 million USD yearly are awarded for its development. The Greater Visakhapatnam Municipal Corporation (GVMC), with modest revenue receipts, is leveraging itself in sustainable projects in the city.
Recent renewable investments of the GVMC, a 2 MW floating solar PV power plant in the Mudasarlova Reservoir, and a proposed 15 MW floating power plant over the Meghadrigedda Reservoir are evidence of its efforts for deploying clean energy systems in the city. Further, the GVMC has installed rooftop solar panels over all the government offices and schools, making use of the incentives provided by the central government. The GVMC has also been actively installing LED-based street lights all over the city and has installed 91,775 LED streetlights with a project cost of 10.5 million USD, resulting in an annual saving of 24 GWh of energy. This has been achieved through the annuity-based deemed savings model without any investment from the GVMC. These investment models by the corporation can further be leveraged to envision a DC distribution system to facilitate aggressive solar PV installations by the public as well.

2. Literature Review

High penetration of variable renewable energy sources results in wide frequency fluctuations due to the low inertia of the electric grid [5]. To improve the reliability of the electric grid, it is highly recommended to deploy an energy storage system (ESS). Of all ESS technologies, a battery energy storage system (BESS) is preferable owing to their modularity. Batteries are used for grid applications such as time shifting, regulation, spinning and non-spinning reserves, voltage support, demand charge management, load following, transmission/distribution line upgrade deferral, and black start. However, their capacity is limited by capital and O&M costs, and regular replacements though their costs are more competitive than ever [6]. The size of a BESS drastically changes the economics of the entire project. The optimal sizing of a BESS under different settings is widely cited in the literature [7,8,9,10]. Lithium-ion-based BESSs have been studied to act as spinning reserves when the grid capacity is maxed out, as they have advantages of a large number of cycles and specific energy compared to lead-acid batteries. However, since they suffer from degradation issues, estimation techniques are employed to assess the health of a BESS [11]. Minimizing life cycle loss is considered as one of the objectives to avoid over-exploitation of a BESS. In this context, a balanced mixture of renewable energy sources and conventional energy sources is required. Nevertheless, conventional energy sources are required to operate at their technical minimum and are regulated by their ramping limits. This necessitates the optimal sizing of a hybrid renewable energy system (HRES) by using appropriate techno-economic reliability indices.
Meta-heuristic methods such as particle swarm optimization, differential evolution, evolutionary algorithms, and nature-inspired techniques such as ant-lion optimization and gray-wolf optimization are used in various research areas of electrical engineering [12,13,14,15,16]. Particle swarm optimization (PSO), introduced by Kennedy and Eberhart in 1995, is a nature-inspired algorithm inspired by the collective behavior of birds in search of food. The introduction of traditional PSO created a lot of interest in the research community, and it led to adaptations to it, resulting in several variants of PSO to improve the exploration and exploitation of particles. The convergence behavior of particles was analyzed in [17], which demonstrated that the particles in PSO are attracted by an attractor. By using this phenomenon, several variants of PSO were proposed. However, not all of them guarantee global convergence. Along similar lines, QPSO was introduced in 2004 inspired by both quantum mechanics and the concepts of PSO for enhanced exploration capabilities [18]. In QPSO, the velocity component in the original PSO is replaced by a delta potential well, thus enabling the particles to venture the entire search space with some probability. This allows the particles to attain a global optimum. There have been several variants of QPSO as well [19,20,21]. An adaptive local attractor QPSO (ALA-QPSO) was proposed in [21] to enhance the search performance by introducing the weighted mean personal best of the particles.
Optimal sizing of an HRES has been widely explored in the literature, however with different combinations of technologies [16,22]. Most of the research work is focused on stand-alone systems to enhance the sustainability of remote areas [23,24,25]. Recently, the focus has been shifted toward grid-connected scenarios due to the fall in solar PV prices [26,27,28,29,30]. There have been quite a few studies on optimal sizing of large-scale grid-connected systems, mostly due to the complexities involved in renewable energy potential assessment, especially for rooftop PV systems [31]. To increase power density, bifacial PV panels were studied in [32,33]. The use of roofing materials to improve rear-side power generation results in reduced cooling needs in heat-prevalent areas. The integration of floating solar PV systems is on the rise worldwide due to low leasing costs and ease of plant availability for maintenance [34,35,36]. Due to the intermittent nature of renewable energy sources, energy storage systems are included in the HRES to provide stiffness to the grid. There are several studies on optimizing the size of energy storage systems, focusing on peak shifting and renewable smoothing, along with ancillary services such as voltage regulation and frequency regulation [28,37,38]. In [39], a multi-objective equilibrium optimizer was used to achieve operational and economic efficiency by integrating renewable energy sources into the grid. In [40], an optimal combination of PV systems and DSTATCOM was achieved using the multi-objective modified ant lion optimizer. With the growing acceptance of electric vehicles, Li-ion batteries are becoming more prominent in vehicle-to-grid scenarios [28,41,42,43]. In addition to modularity, significant research in fault diagnosis, and second-use energy storage applications, a BESS has become more acceptable compared to other technologies [44,45,46].
To avoid the premature convergence problem of conventional PSO, a double-exponential-function-based dynamic inertia weight technique was developed for the optimal parameter estimation of a PV cell module [47]. As a way to solve energy management problems, lower bill costs, peak-to-average ratio, and carbon emissions, efficient integration of RES with BES a load scheduling and energy storage Management controller based is discussed [48].

2.1. Key Contributions

Despite a large number of articles in the area of optimal sizing of RE sources, there are few papers that address potential assessment in cities using GIS tools to arrive at the upper bounds. Most of the papers address the issue of either cost optimization or voltage and frequency issues, but they do not consider the limitations on the ramp rates of thermal power plants (TPPs) and the financial repercussions on the TPPs in the event of phasing out diesel and gas generators to improve the sustainability of cities.
This paper addresses the issue of optimally sizing the HRES in Visakhapatnam by considering the sustainability and ramp rate limitations on conventional energy sources using GIS tools to assess the renewable energy potential. The process flowchart for the proposed work is shown in Figure 2. Initially, a city is selected and its potential for renewable energy sources is studied using geographic information system (GIS) tools. Based on the available resources, possible land cover is assessed and optimal sizing of the system is arrived at by applying optimization techniques to realize techno-economic requirements such as loss of power supply probability (LPSP), levelized cost of energy (LCoE), and battery life cycle loss (LCL).
The main contributions of this paper are as follows:
i.
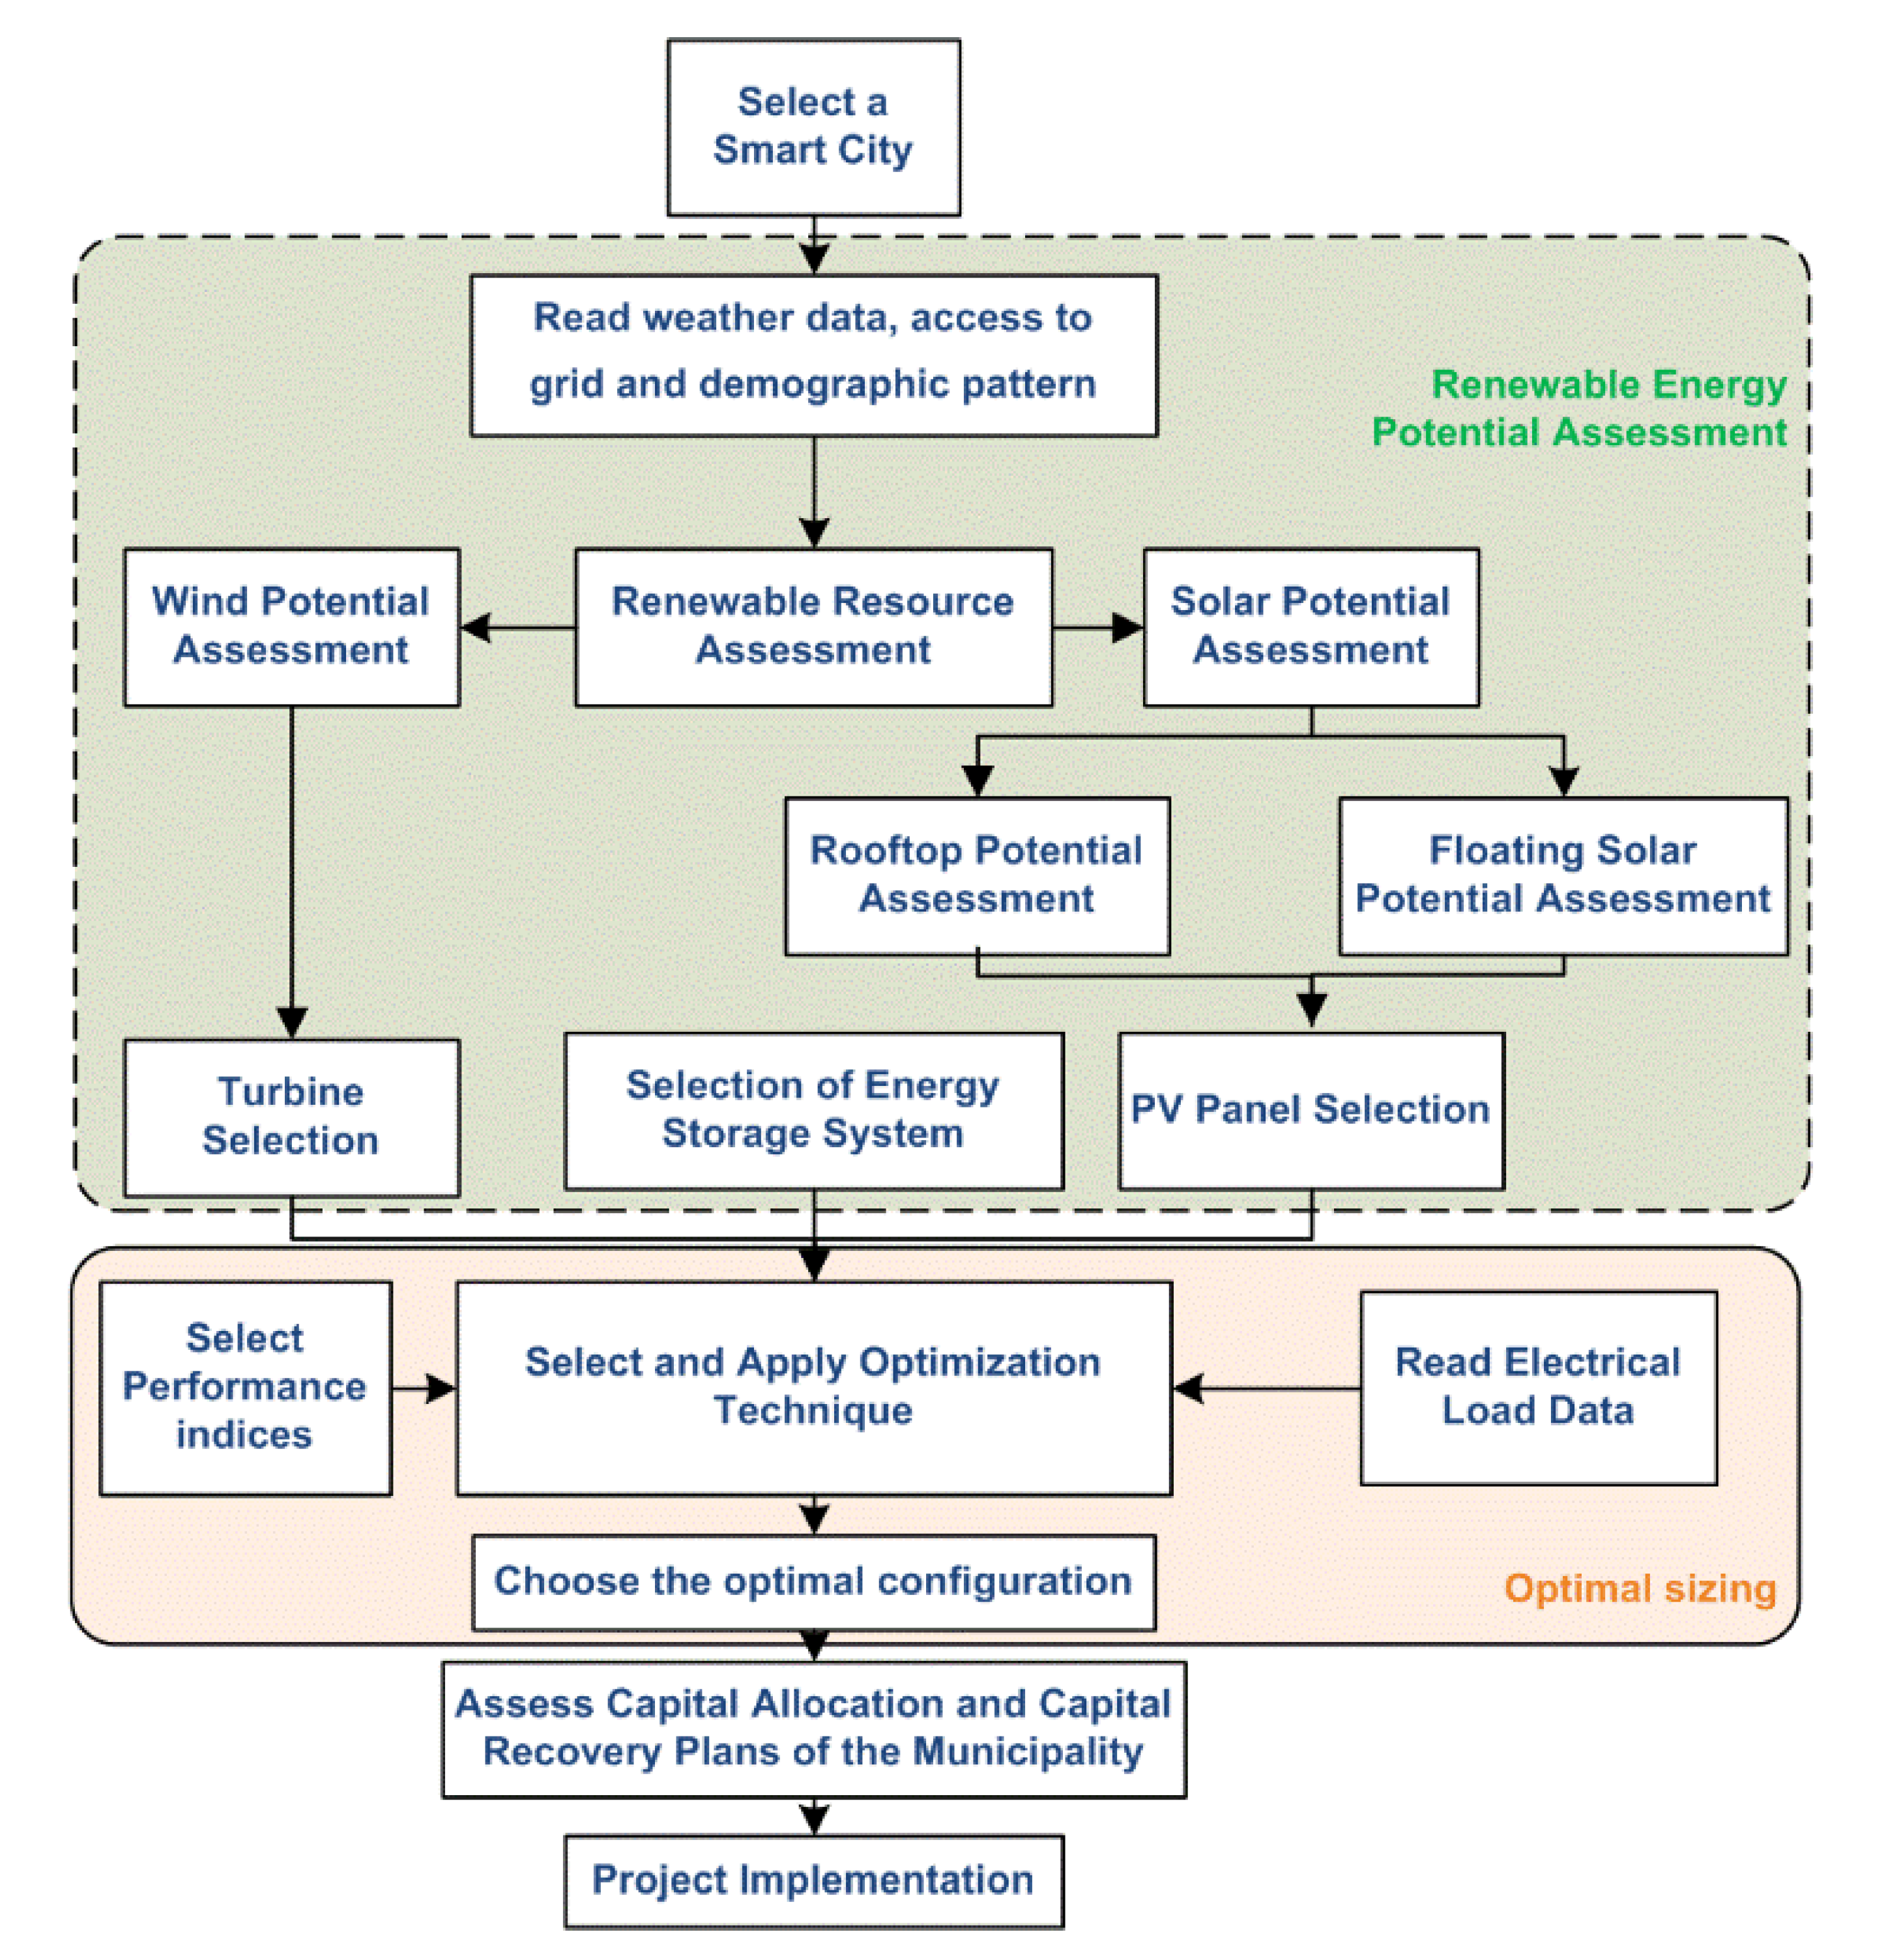
A methodology for site selection, resource assessment, and energy management for large-scale renewable energy integration is developed.
ii.
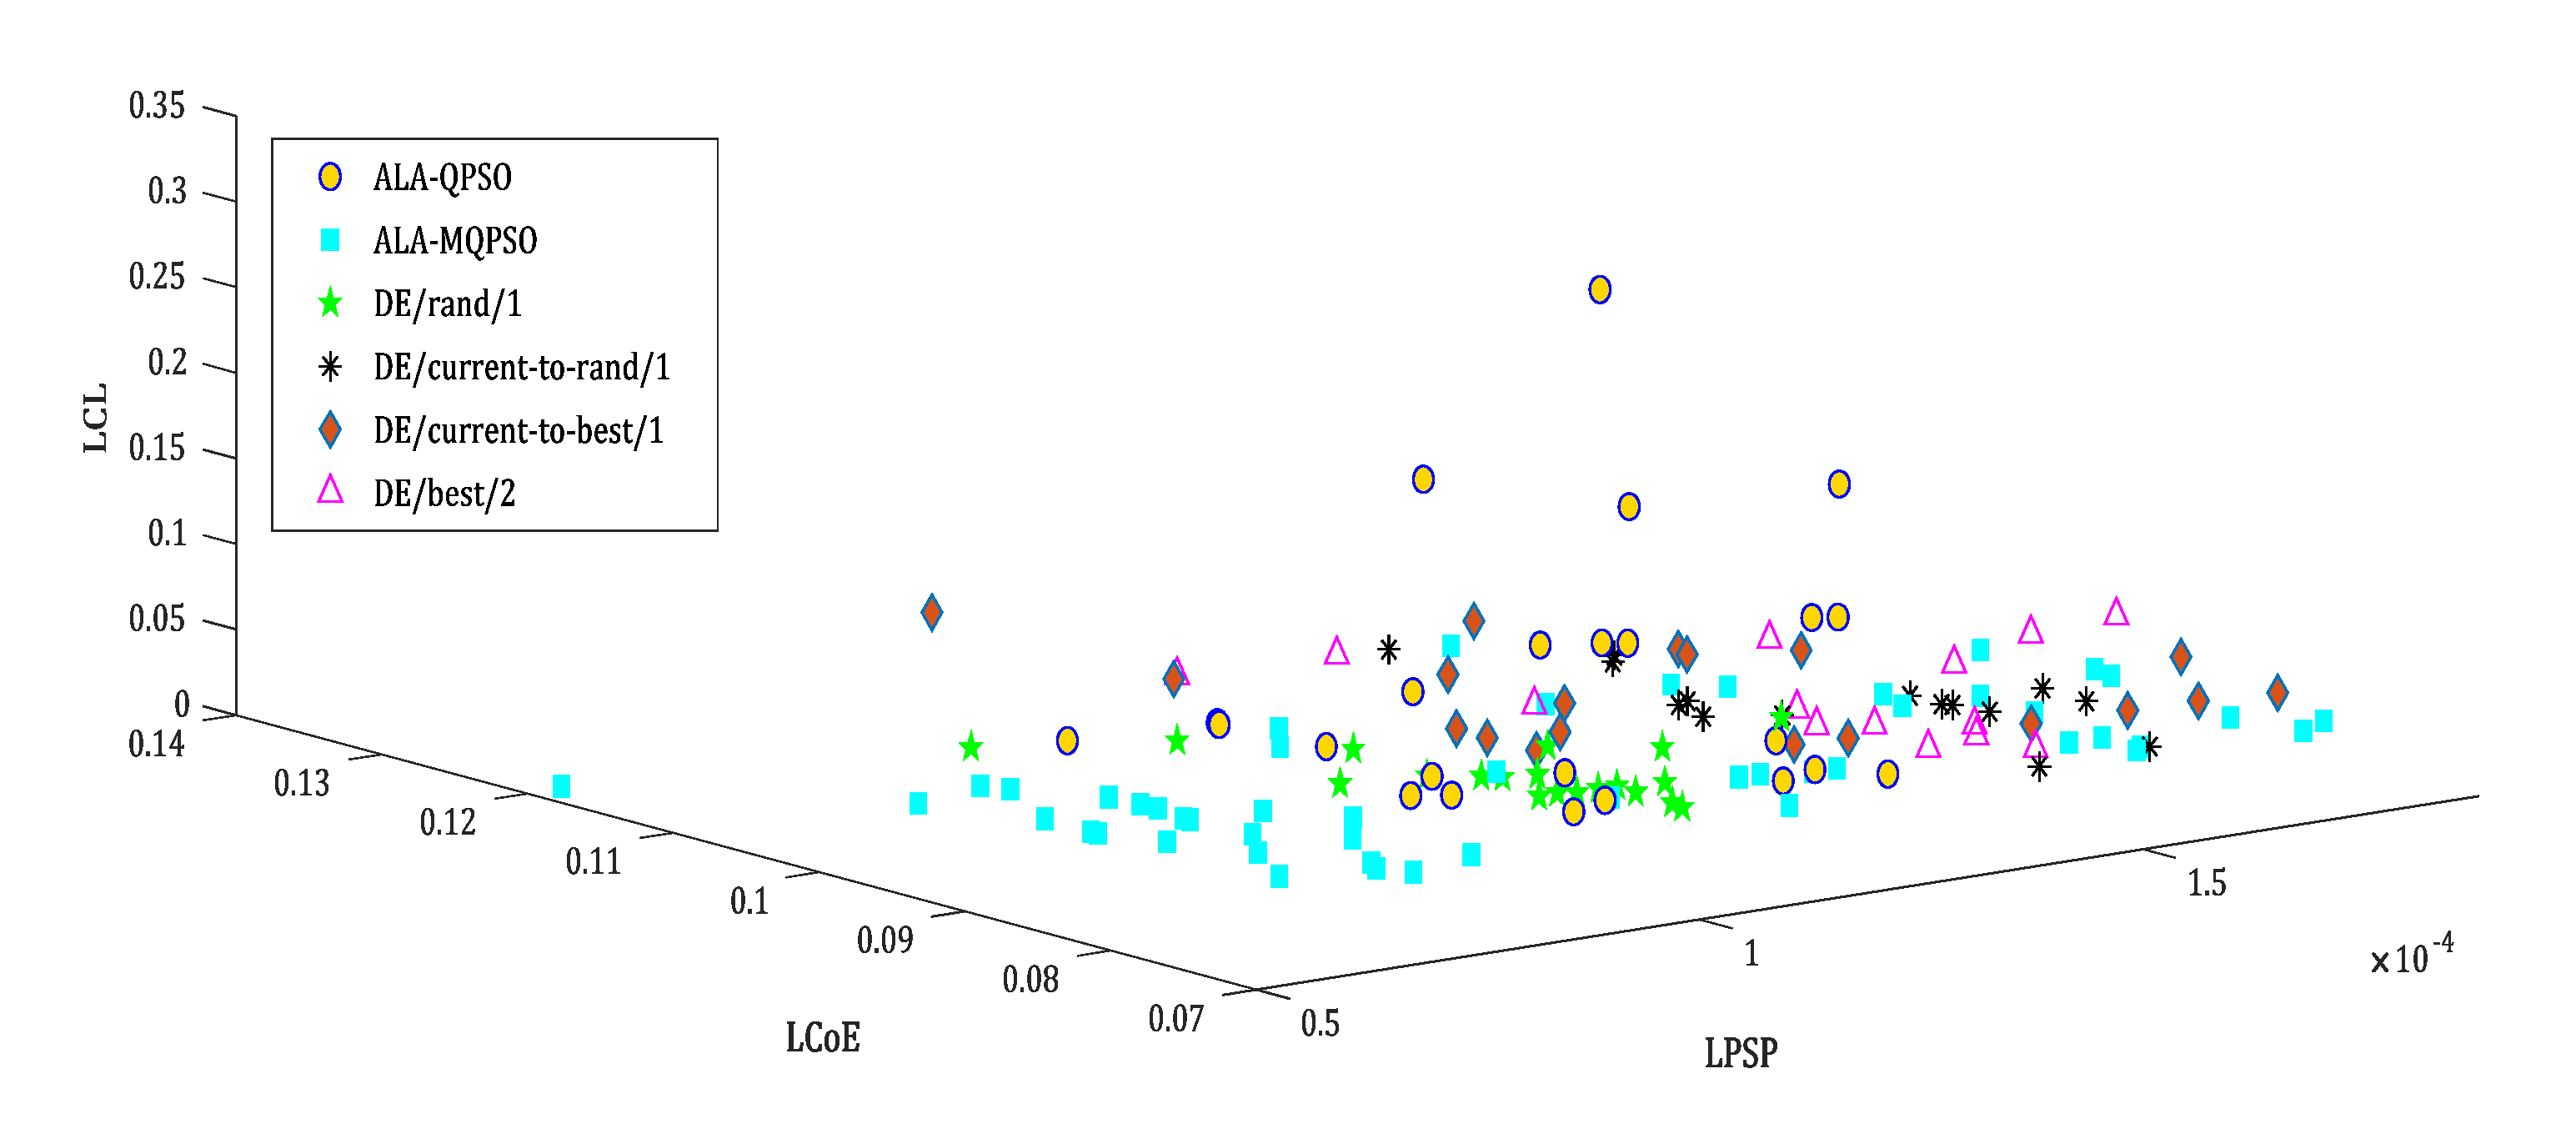
Optimal sizing of potential renewable energy sources and a battery bank is assessed to minimize grid ramping, levelized cost of energy, and loss of load using various multi-objective optimization techniques.
Subsequent sections of this paper are organized as follows: Section 2 deals with site selection and renewable resource assessment in the chosen urban areas. In Section 3, a mathematical model of the presented renewable energy sources is developed. In Section 4, the adopted multi-objective optimization technique is explained, while in Section 5, the results are compared with legacy optimization techniques. In addition, sensitivity analysis is presented to evaluate the impact of reduced battery size due to outages and price appreciation due to policy changes. Finally, concluding remarks are made in Section 6.

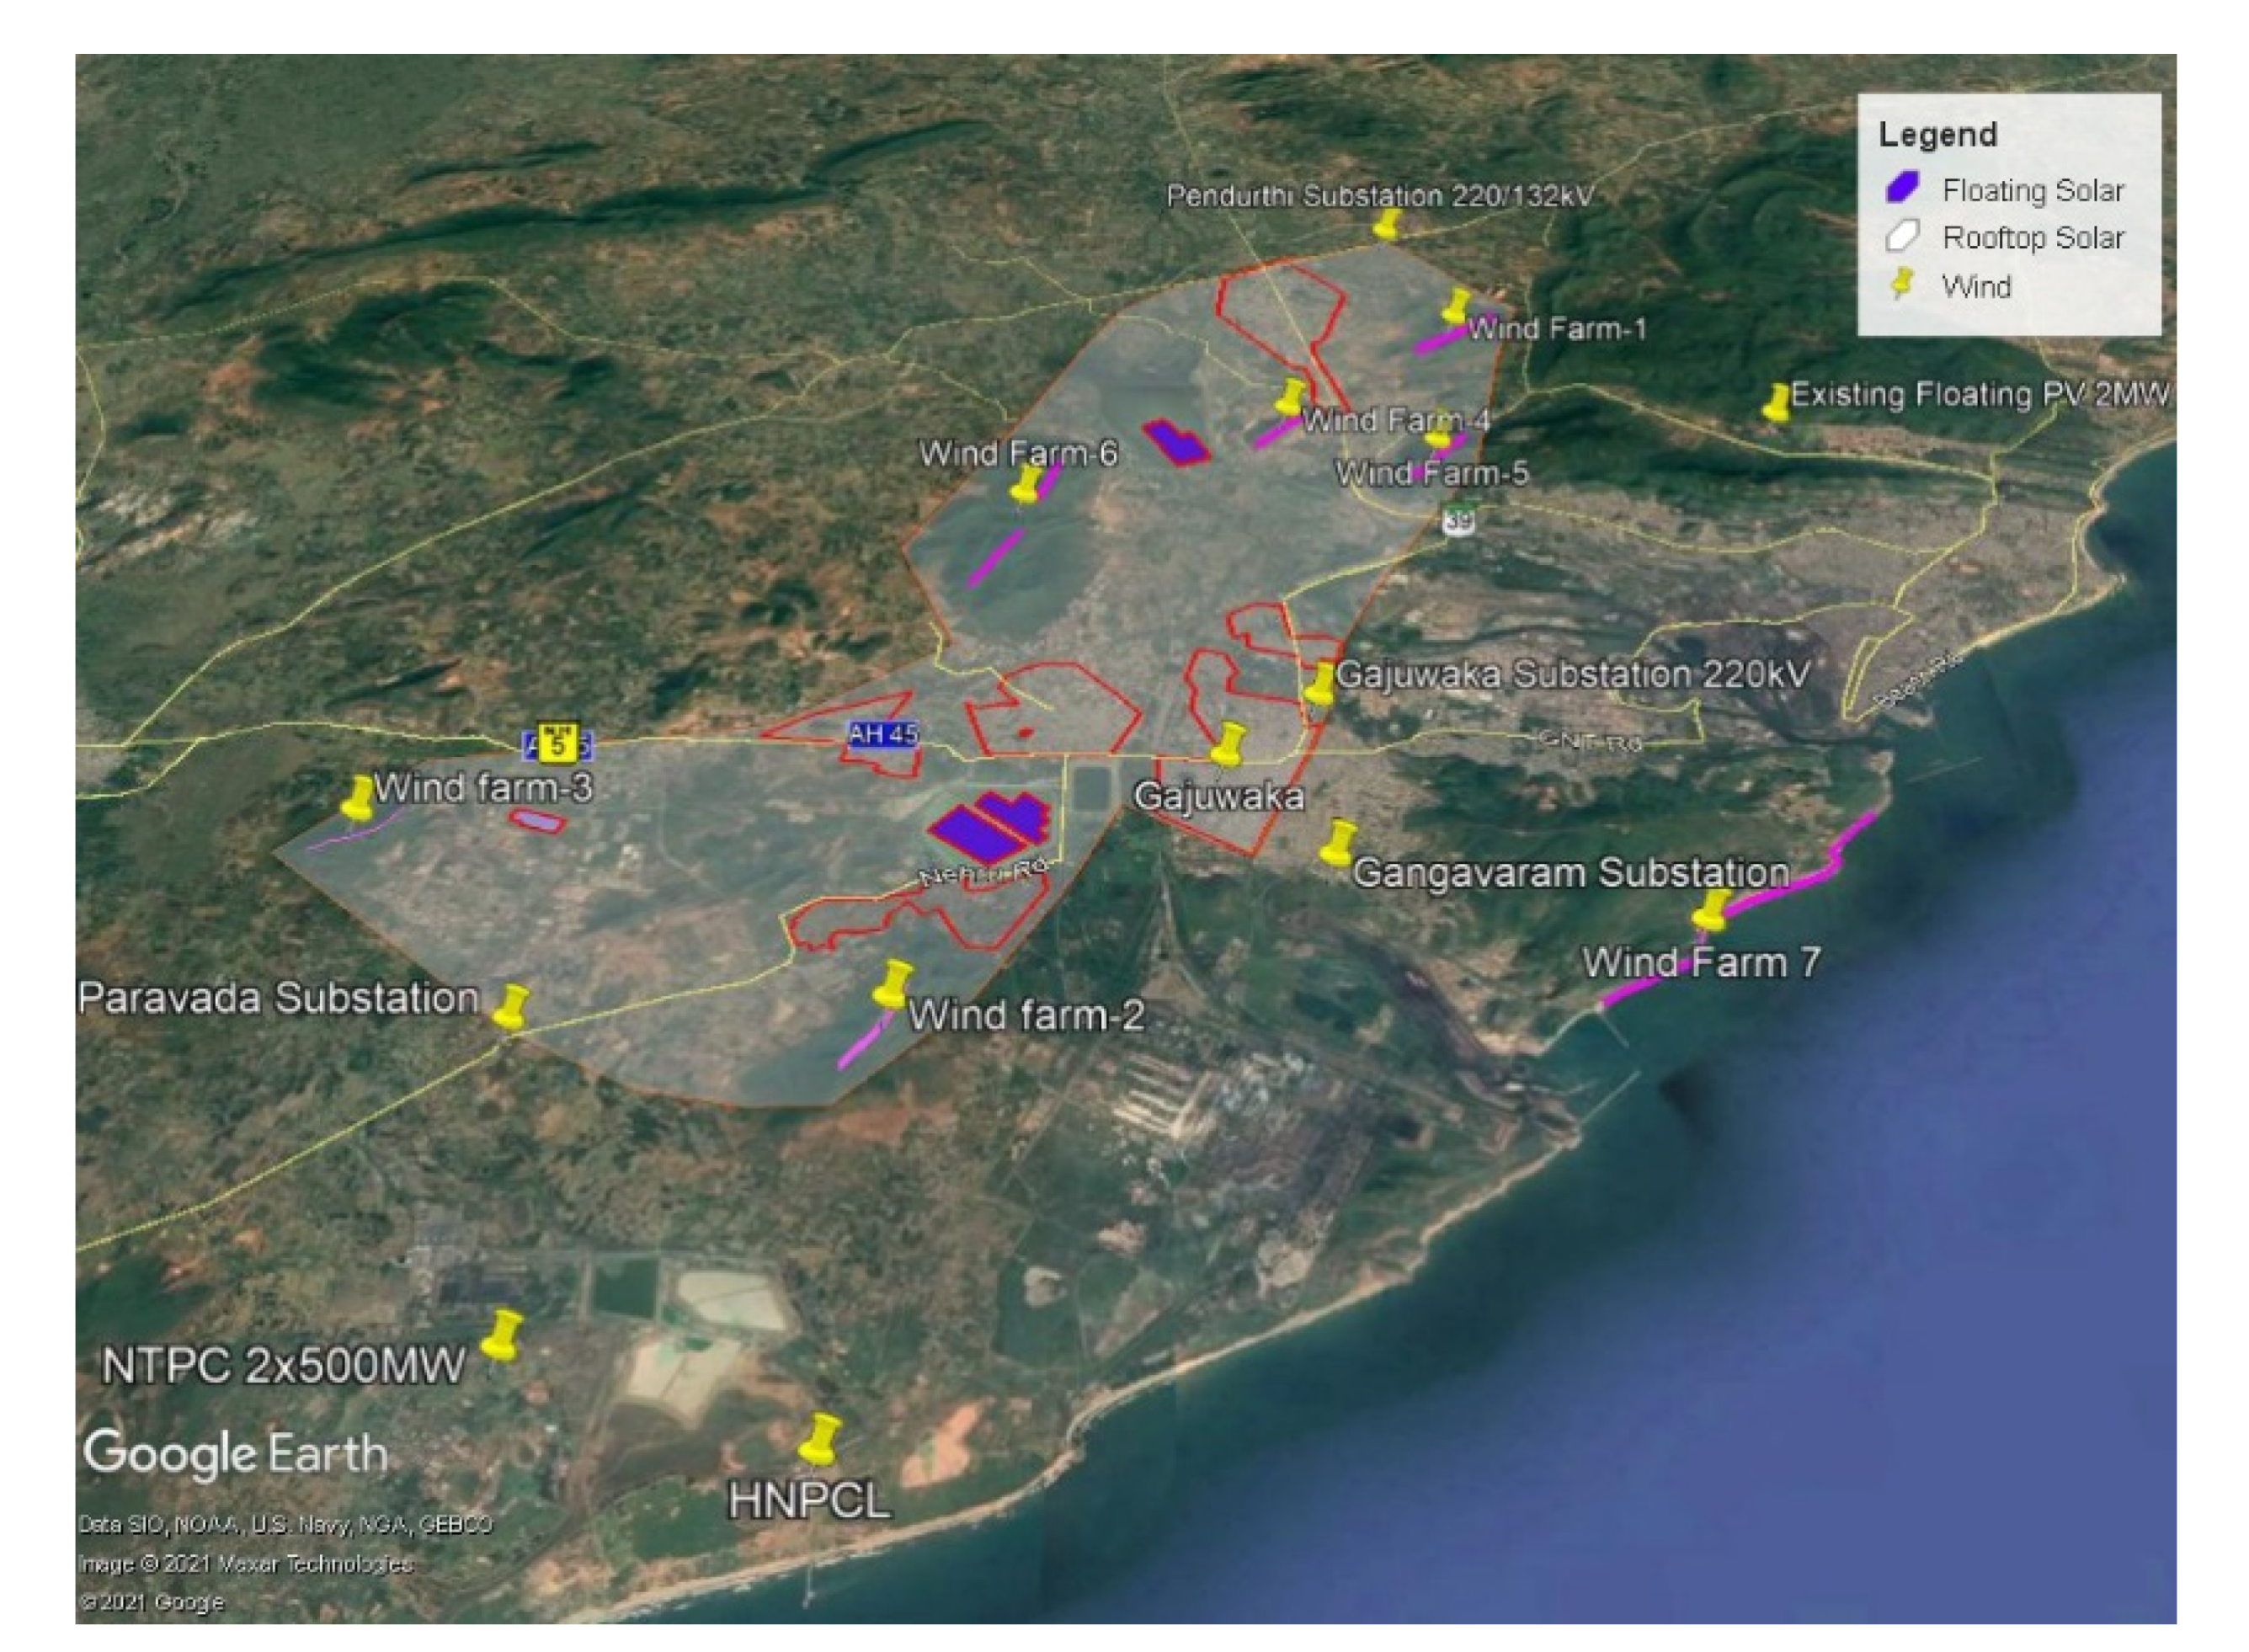
2.2. Site Selection and Resource Assessment

The proposed HRES with a battery bank is shown in Figure 3. The system contains decentralized rooftop PV panels, floating PV panels, and wind turbines installed over hilltops and seashores. Due to their intermittency, suitable converters are placed to integrate with the battery-integrated DC bus. The DC bus accommodates EV charging stations and street-lighting systems with which better efficiency is envisaged. A battery bank is also associated with the DC bus for charging and discharging during the mismatch between generation and load demand. Further, the DC bus is integrated with the AC grid through a transformer to supply the AC loads of the city. After matching the supply and demand, any excess power is wheeled to other load centers via the grid.
As mentioned in Section 1, Visakhapatnam has become an investment destination for companies ever since the bifurcation of the state of Andhra Pradesh, along with the designation of a smart city. The city is one of the leading pharmaceutical hubs in India that cater to world needs. In addition, electricity demand is expected to spike further due to announcements such as a railway zone and industrial corridors, leading to further investments. However, capacity addition using thermal power plants takes a long time.
Further, some of the power purchase agreements have already expired in 2019, while some power plants in the vicinity are close to their end of life. In contrast, renewable energy systems take only months to install and integrate with the grid and their capacities can be easily expandable at a faster pace. This study focuses on the city boundaries, where there is a drastic change in land usage and building cover due to the special economic zones. The type of housing is more inclined toward multi-story buildings where rooftops are under-used or individual houses with sufficient space for solar installations. The GVMC can propose a public–private partnership model with those rooftop owners and hence reduce the leasing costs of rooftop solar power systems. Besides, water bodies are explored to enable the interested parties to invest in floating solar PV systems. This will also benefit the city with reduced water evaporation as the city is struggling for water security for decades. Likewise, wind energy systems can be mounted on shorelines and hilltops. Based on the master plan provided by the infrastructure firm AECOM [49], growth centers and human settlements in the proposed city are shown in Figure 4.
It is observed that the industrial activities in Parawada and Atchutapuram areas have enabled satellite growth centers, marked by orange stripes, to grow at a faster rate, in addition to the expansion of the city core. Given this, the area marked with grid lines is taken for the proposed area for the HRES to be set up. Assessment of HRESs is done at the proposed location using the Polygon tool of Google Earth Pro, where purple and blue patches along with yellow pins indicate potential areas for floating PV, rooftop, and wind energy system installations, respectively, as shown in Figure 5.
Four potential areas for floating PV systems, are identified and their areas are calculated. Similarly, six possible areas for rooftop solar power systems are recognized after taking out unused land cover and dense areas where the installation is not viable. Further, the potential of wind energy systems is assessed over hilltops with a minimum of 200 m height in the region and on the shorelines that are not part of any economic activity. The potential of each HRES is given in Table 2, along with the potential quantity of solar panels and wind turbines. These values are considered as the upper bounds for optimal sizing of the HRES. Further, accessibility of the HRES to the grid is assessed, as shown in Figure 6 [50], through which concerns regarding grid connectivity are addressed. The proposed location has a good number of substations with 132 kV, 220 kV, and 400 kV voltage levels. The entire energy in the HRES can be evacuated through these substations.

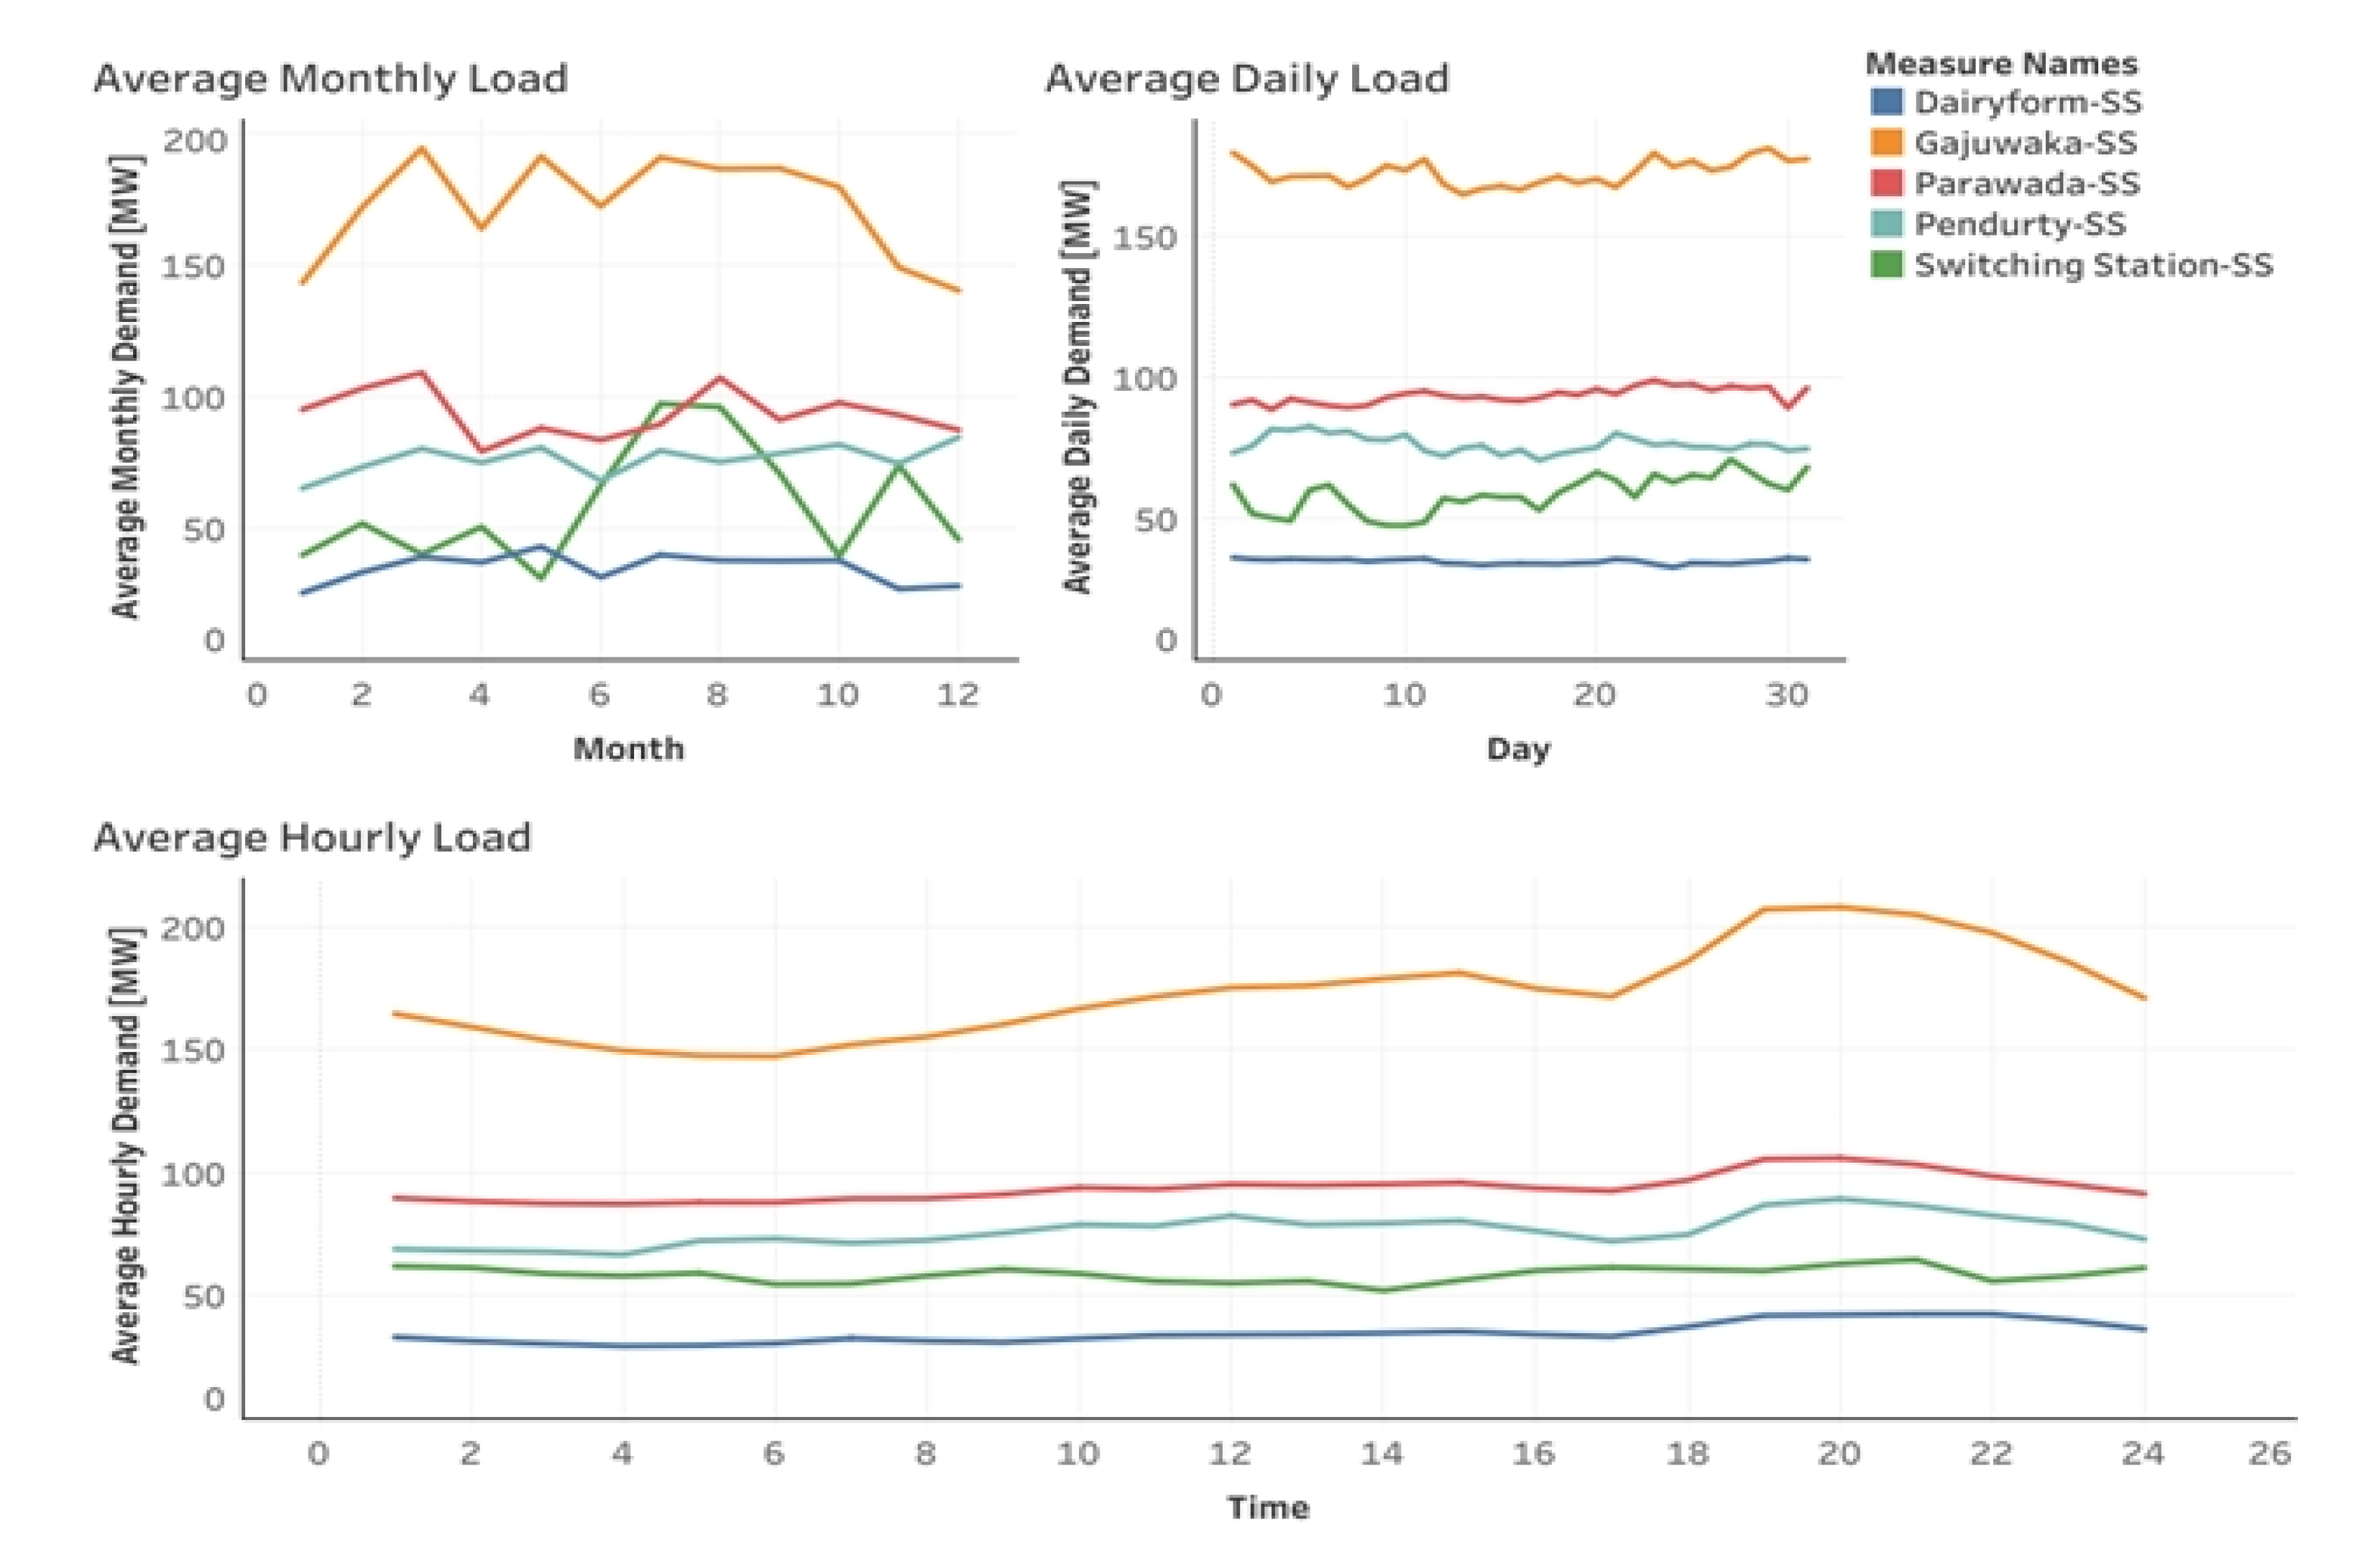
2.3. Observations from the Load Profile of the Proposed Location

The load profile is generated from five different areas in the proposed location, as shown in Figure 7, that represent various load segments, viz. predominantly industrial (Gajuwaka and switching station), residential (Pendurty and dairy farm), and pharma (Parawada) sectors. It is also evident that pharma needs are high and the load profile is almost flat similar to residential loads. However, the heavy industry zone has a diversified load profile with peaks from 6 PM to 11 PM. From the load profile at the proposed location, it is observed that demand rises from the first quarter (Q1) onward and peaks in the second quarter, while Q4 exhibits weak demand. Since the peak loads correspond to the second quarter during which monsoon retreats, solar PV systems suffer from cloud cover. Hence, a BESS plays a crucial role during these days. Besides, the daily load curve indicates that load peaks from 6 PM to 10 PM, during which time energy is drawn either from the grid or from the combination of a BESS and a wind energy system.

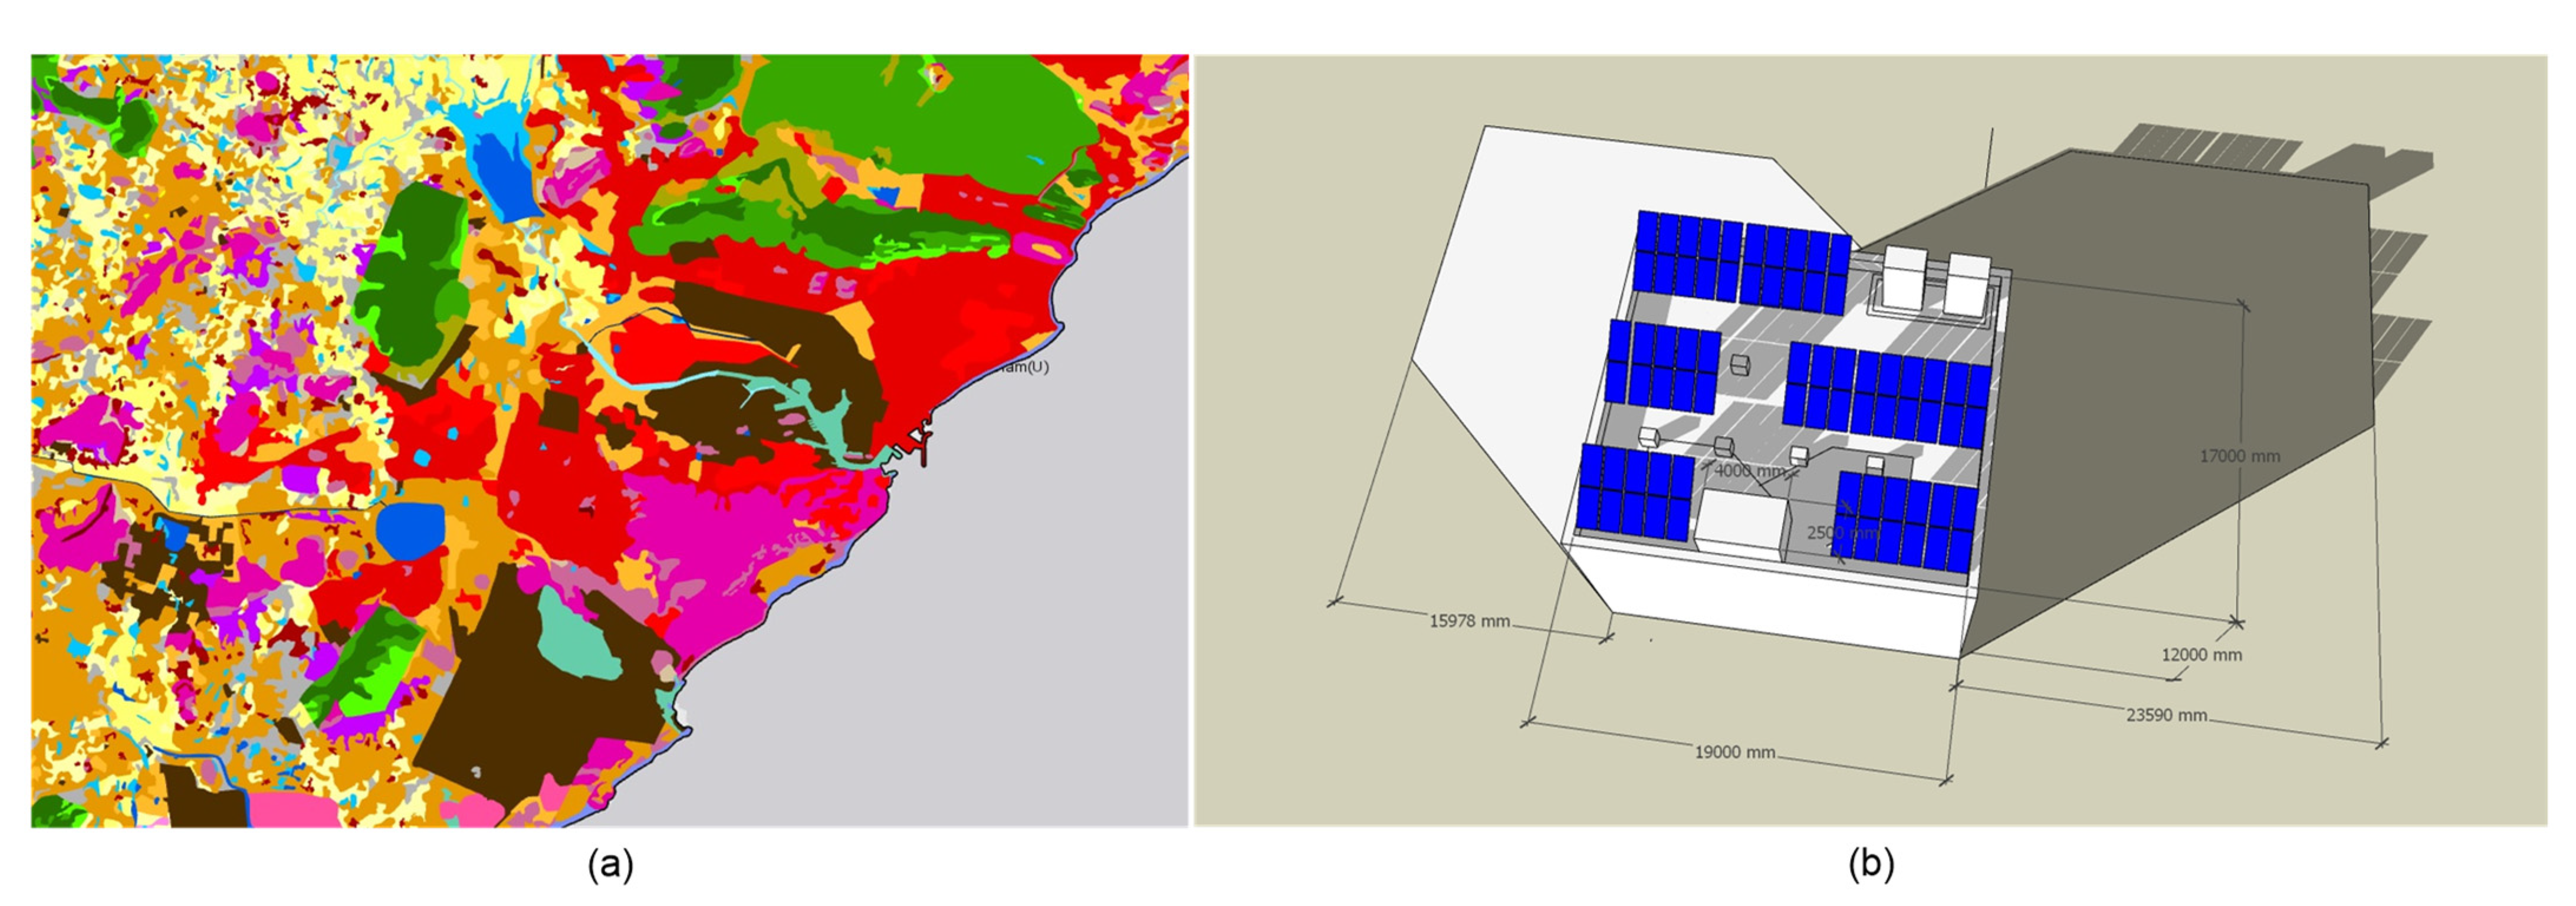
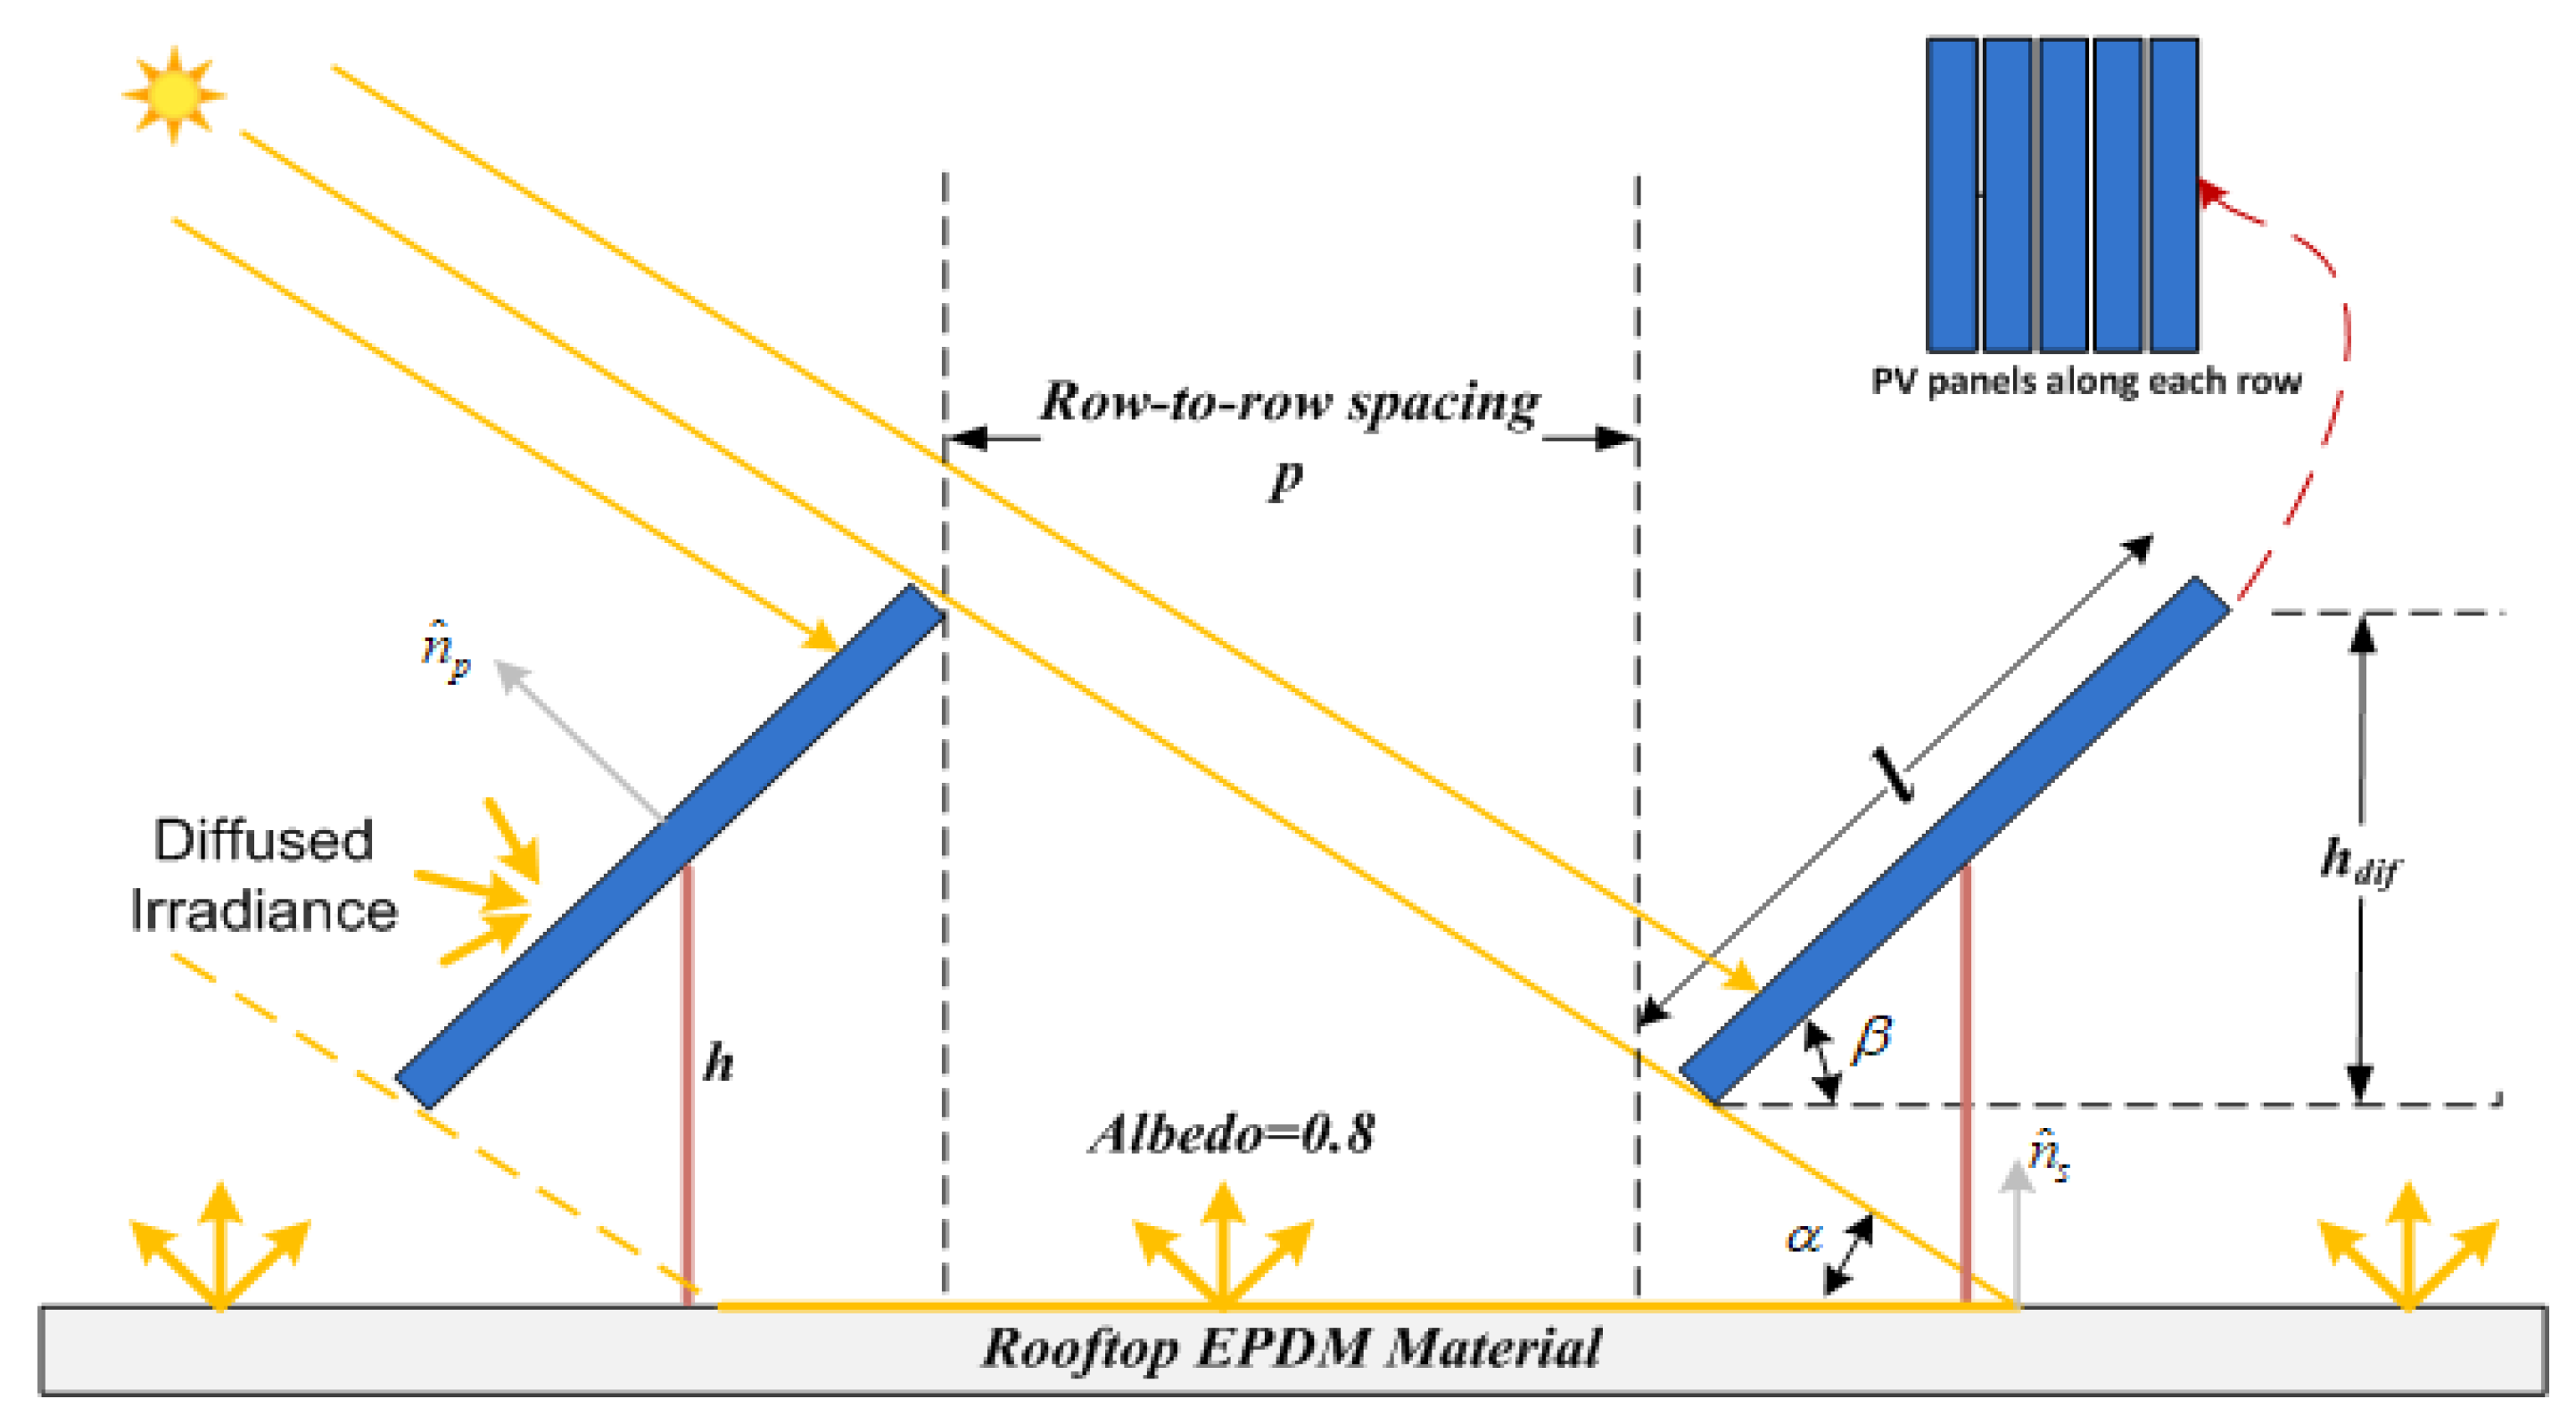
2.4. Land Cover and Shading Analysis

From the land cover of Visakhapatnam, as shown in Figure 8a, it is seen that building density, indicated in red color, is on the rise in the proposed location, with a large number of industries being set up in the special economic zones. Similarly, the blue color indicates water bodies with sufficient depth for floating solar panels. The 3D map of one of the residential areas is obtained using an open CADmapper online tool and is fed to the Sketchup Pro, which is also freeware, for shading analysis. The shading time is rated from yellow to dark blue, yellow indicating less shading time and dark blue indicating more shading time.
The result shows that a good number of rooftops can be used for installation as long as there is sufficient spacing between buildings when adjacent building heights differ by a large margin. A rooftop PV system is designed for a sample building in the proposed location, and shading analysis is performed at 4 PM when the maximum shading occurs, as shown in Figure 8b. The total area of the rooftop is 323 m2, including water tanks and a stairway. The illustrated PV array has an area of 183 m2 (70 panels of 2.61 m2 each) and hence amounting to a ground coverage ratio of 0.56. Though azimuth correction of 42° can be applied for the rooftop system, thus increasing the irradiance on the rear part of the panels to boost the bifacial gain, it is aesthetically not appealing. In some cases, this causes inconvenience to operating personnel during maintenance. Hence, azimuth correction is advised for those buildings constructed with azimuth correction.

3. Mathematical Modeling

Due to the lack of sufficient data regarding bio-waste and its feasibility in the proposed location, along with technology developments in other renewable energy technologies, only solar and wind energy technologies are considered in this study. The model equations for the two technologies are well cited in the literature, and hence only their equations are provided in this section to avoid redundancy. However, modeling of bifacial PV panels that are used for rooftop systems is presented explicitly.

3.1. Solar PV System

In this work, bifacial solar panels are considered for rooftop PV systems, while mono-facial PV panels are considered for the floating PV system. The modeling of irradiance on the front part of the panels is the same for both cases, while only rear irradiance applies for bifacial panels. As a first step, the angle of incidence on both sides of the panel is calculated, as in Equation (1). Equations (1)–(6) of the irradiance of PV panels are adapted from [51].
θ i F r o n t = cos - 1 ( cos θ z . cos ( 180 - β ) + { sin θ z . sin β . cos [ ( γ - 180 ) - ( θ A Z - 180 ) ] } ) θ i Re a r = cos - 1 ( cos θ z . cos ( 180 - β ) + { sin θ z . sin ( 180 - β ) . cos [ ( γ - 180 ) - θ A z ] } )
There are a total of three components of irradiance that fall on the front and rear sides of the bifacial panel, i.e., direct normal irradiance (DNI), diffused horizontal irradiance (DHI), and an albedo, due to reflected irradiance, as shown in Figure 9. The total irradiance on the PV panels is given by Equation (2).
I P V T o t a l = I P V f r o n t + I P V r e a r I P V f r o n t ( r e a r ) = I P V D N f r o n t ( r e a r ) + I P V D H f r o n t ( r e a r ) + I P V A l b f r o n t ( r e a r )
The albedo further has two components, a reflected direct beam and reflected diffused irradiance, as given in Equation (3).
I P V . A l b T o t a l = I P V A l b d i r F a r m + I P V A l b d i f F a r m
The albedo can be arrived at by integrating reflected irradiance along all the breadth of the row, as given in Equation (4).
I P V A l b . d i r ( d i f ) F . P a n e l ( l ) = I G n d D I ( D H I ) R A F d l g n d ( l ) η d i f f I P V A l b . d i r ( d f ) F . F a r m ( l ) = 1 h 0 h I P V . A l b . d r ( d i f ) F . p a n e l ( l ) d l
where Fdl-gnd is the view factor given by
F d l g n d = { 1 2 ( 1 - sin ψ o ( l ) ) ......................... m o r n i n g 1 2 ( sin ψ 2 ( l ) - sin ψ 1 ( l ) ) .................... a f t e r n o o n }
Finally, the hourly PV power can be assessed using Equation (5).
p r p v _ h o u r l y = η f r o n t . p r _ f r o n t I P V F r o n t + η Re a r . p r _ Re a r I P v Re a r
  • where η f r o n t , η Re a r —efficiencies of front and rear cells
  • p r _ f r o n t , p r _ Re a r —front &rear sides rating of panel
Similar equations are applied for mono-facial PV panels used in floating solar PV systems, however without considering rear irradiance, as given in Equation (6).
p f p v _ h o u r l y = η f p v . p f p v I P V F r o n t

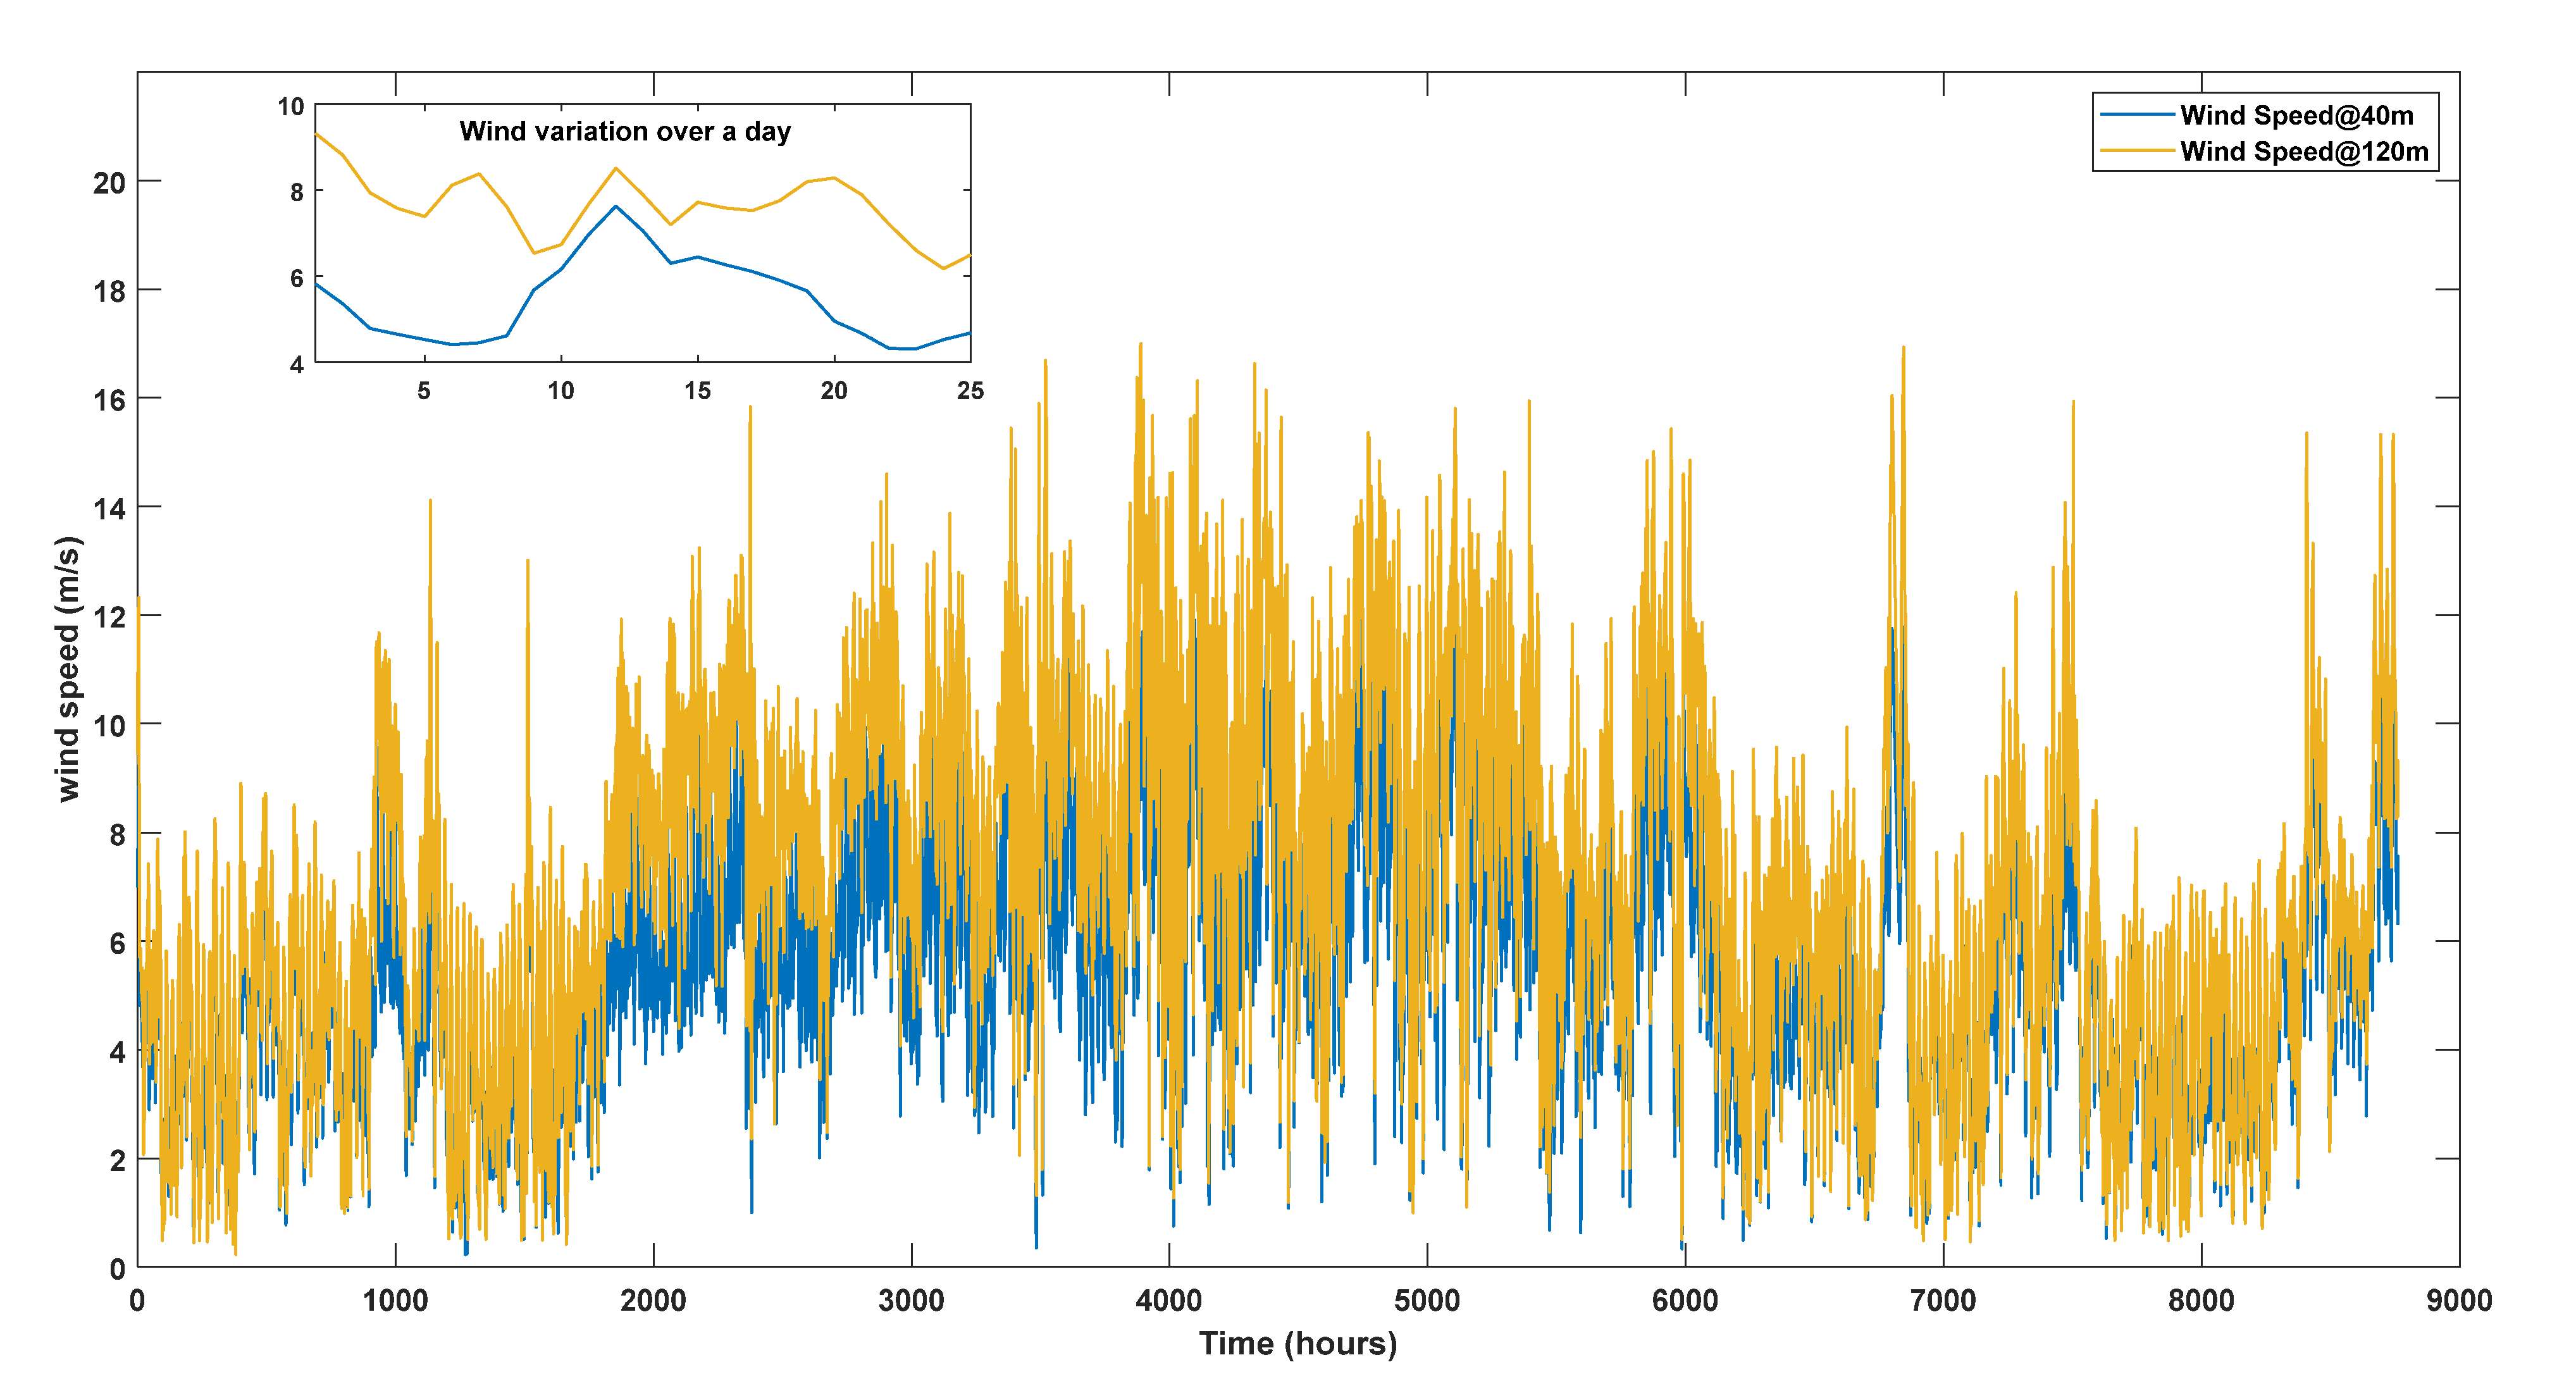
3.2. Wind Energy Conversion System (WECS)

The city is not a good location for installing wind power plants at the ground level. However, there are some specific locations such as hilltops with more than 200 m elevation from the ground and the shoreline where a WECS can be installed at higher altitudes. Though they can accommodate a low number of turbines, the system will support the grid during peak hours in the evening, as shown in the wind profile, obtained after processing the data generated from the NREL Geospatial wind data of the proposed location and given in Figure 10. This reduces the need for higher BESS racks, helping in reducing the cost and maintenance of the system.
The wind speeds at the proposed location are obtained from weather stations and are extrapolated to the required height using Equation (7). The power generated from the WECS can be obtained using Equation (8) [10]. Per the technical details of wind turbines provided in Section 3, a capacity use factor of ~40% can be achieved.
v = v r e f ( h d e s h r e f ) γ
where γ is the surface roughness and is chosen to be 0.18 for the proposed location.
p w t g = { 0 f o r v < v c i o r v > v c o P r ( v 3 - v c i 3 ) ( v r 3 - v c i 3 ) f o r v c i v v r P r f o r v r < v v c o
where rate power p r = 0.5 C p . ρ a . η g . A w . v r 3 .

3.3. Battery Energy Storage System

As discussed in Section 1, a Li-ion-based BESS is considered in this study as BESSs have more specific energy and can be scaled to racks and containers. Further, they have a good round-trip efficiency of 87–94%. The size of a BESS depends on the required number of hours of support. In this study, a maximum of one daily cycle is considered to support the grid for 4 hours during peak time, i.e., 7 PM to 11 PM. The technical details of the selected BESS are presented in Table 3, which is based on the Samsung SDI E3-R099 [52] model with a life cycle performance of 6000 cycles for continuous discharge of 1C at 25 °C. In this paper, the maximum limit for the number of racks is derived from the peak load, the number of hours, and the grid capacity.

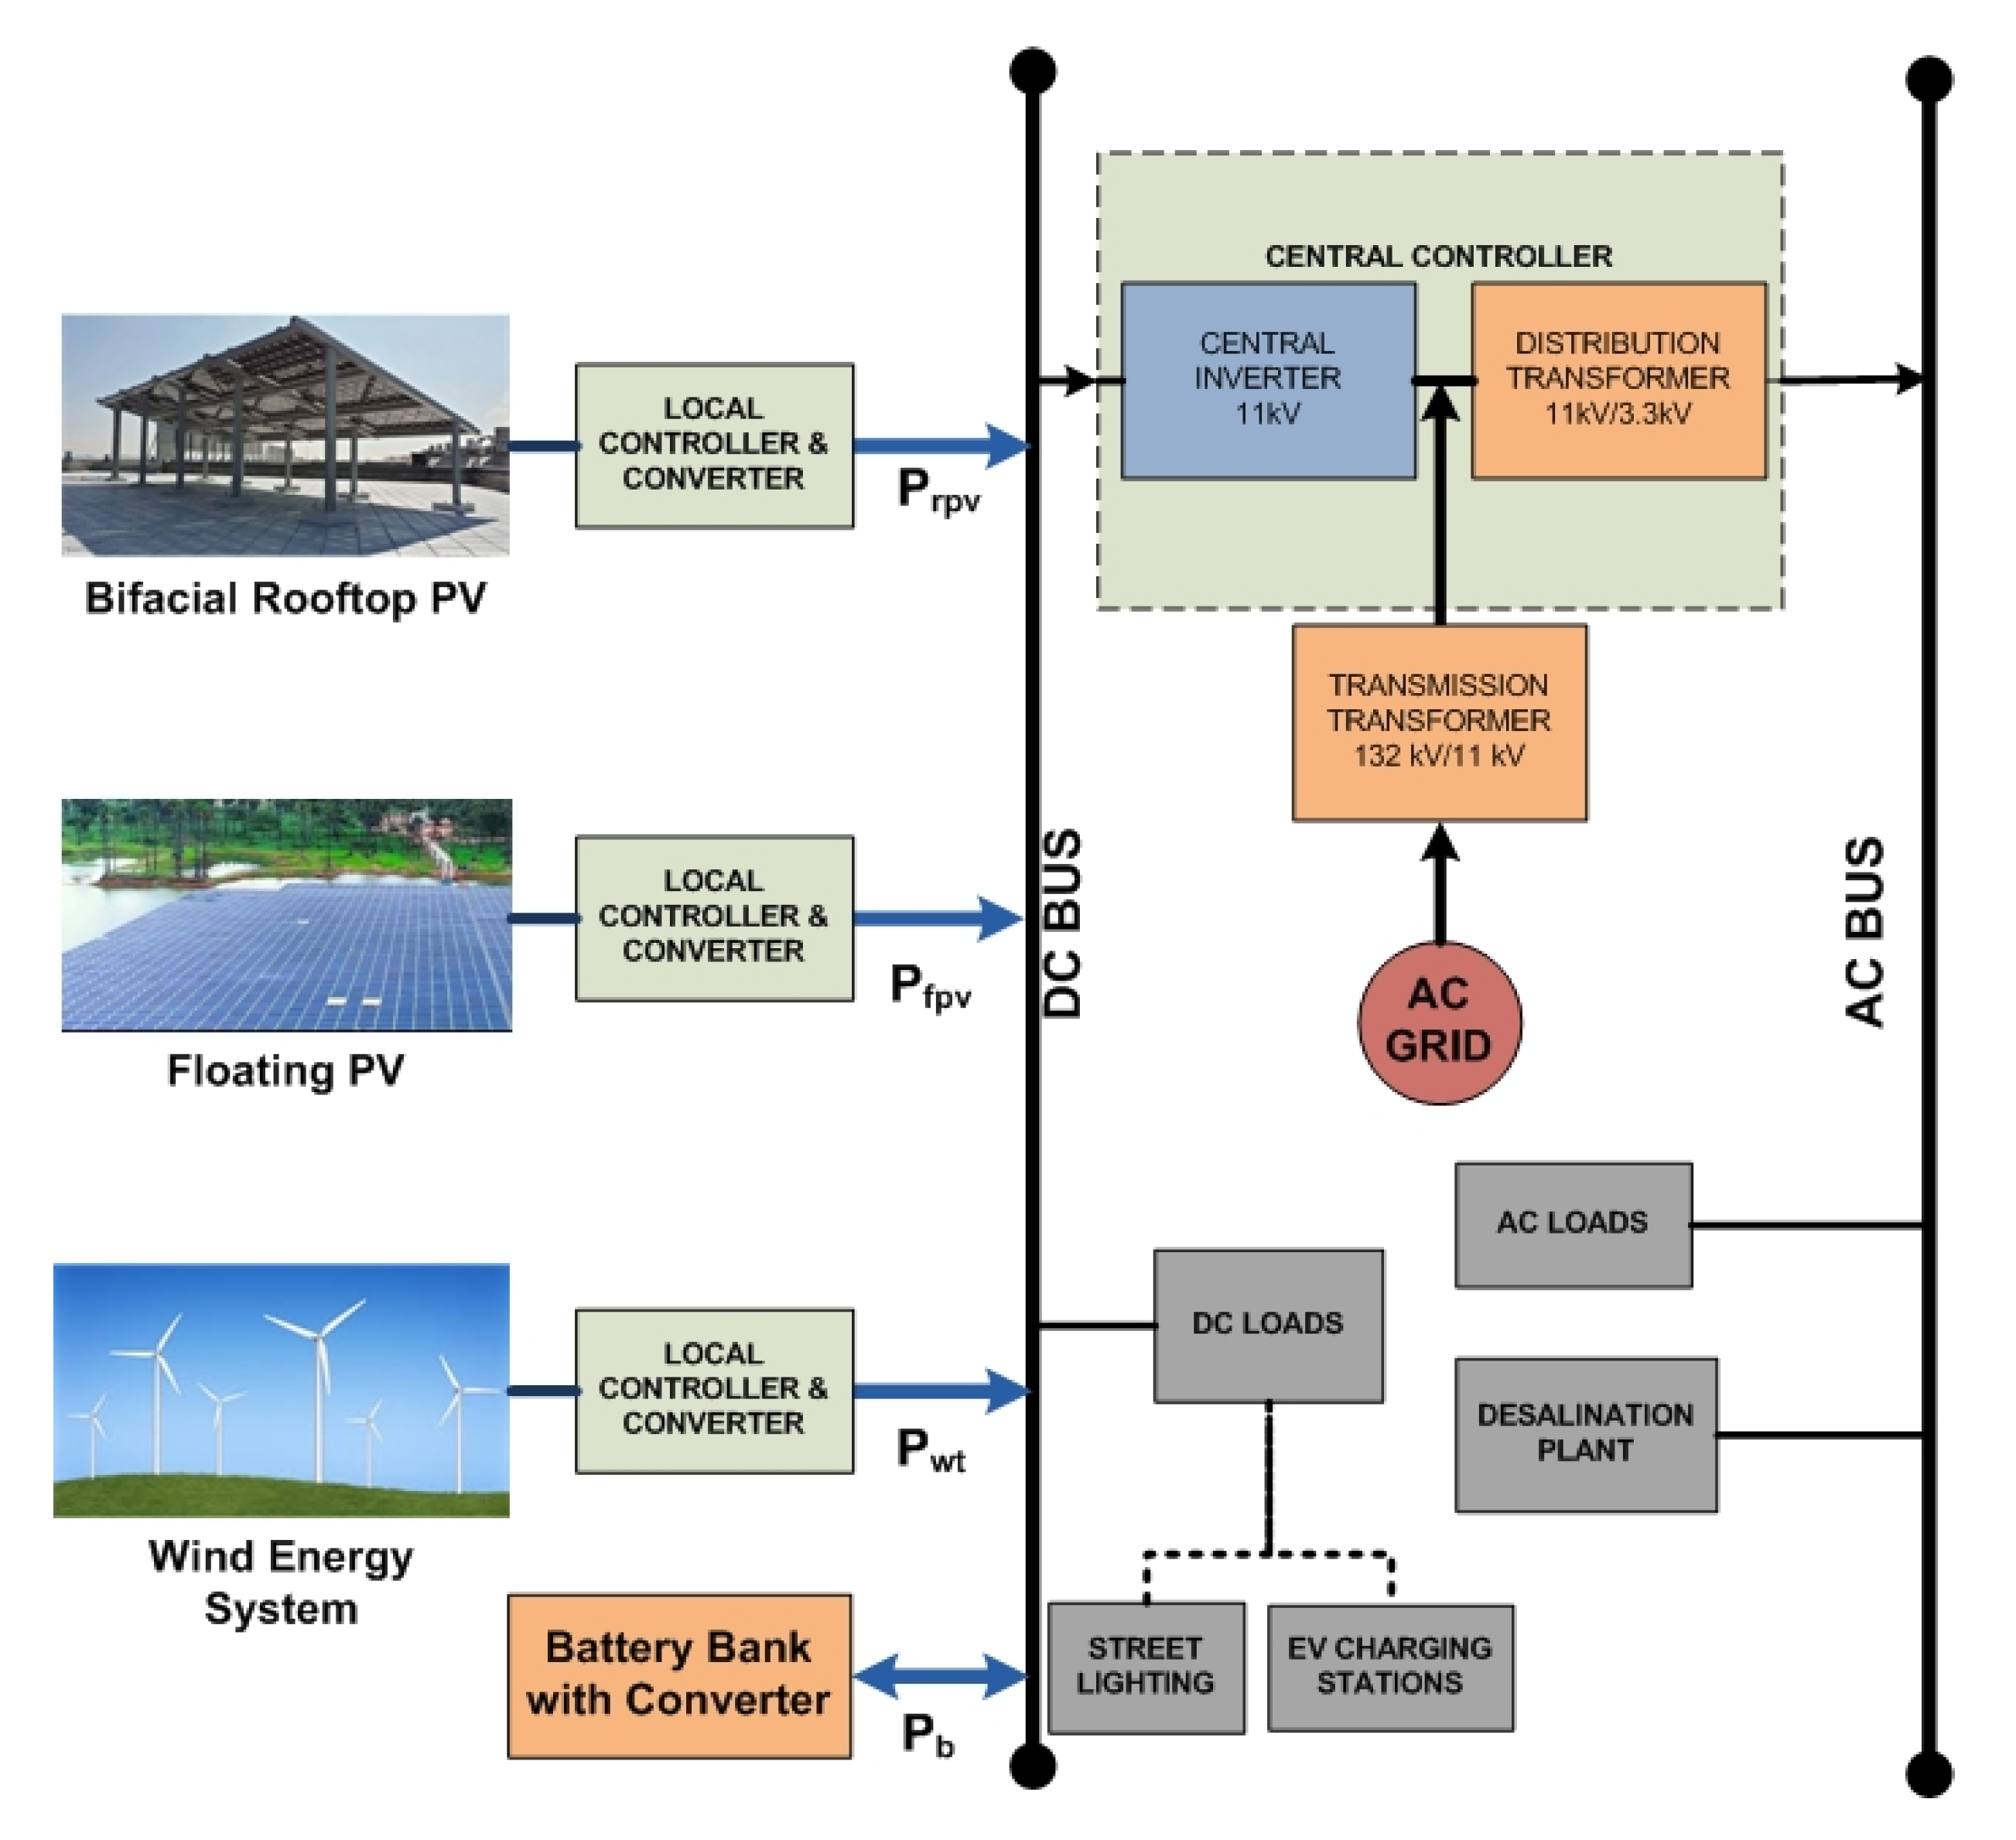
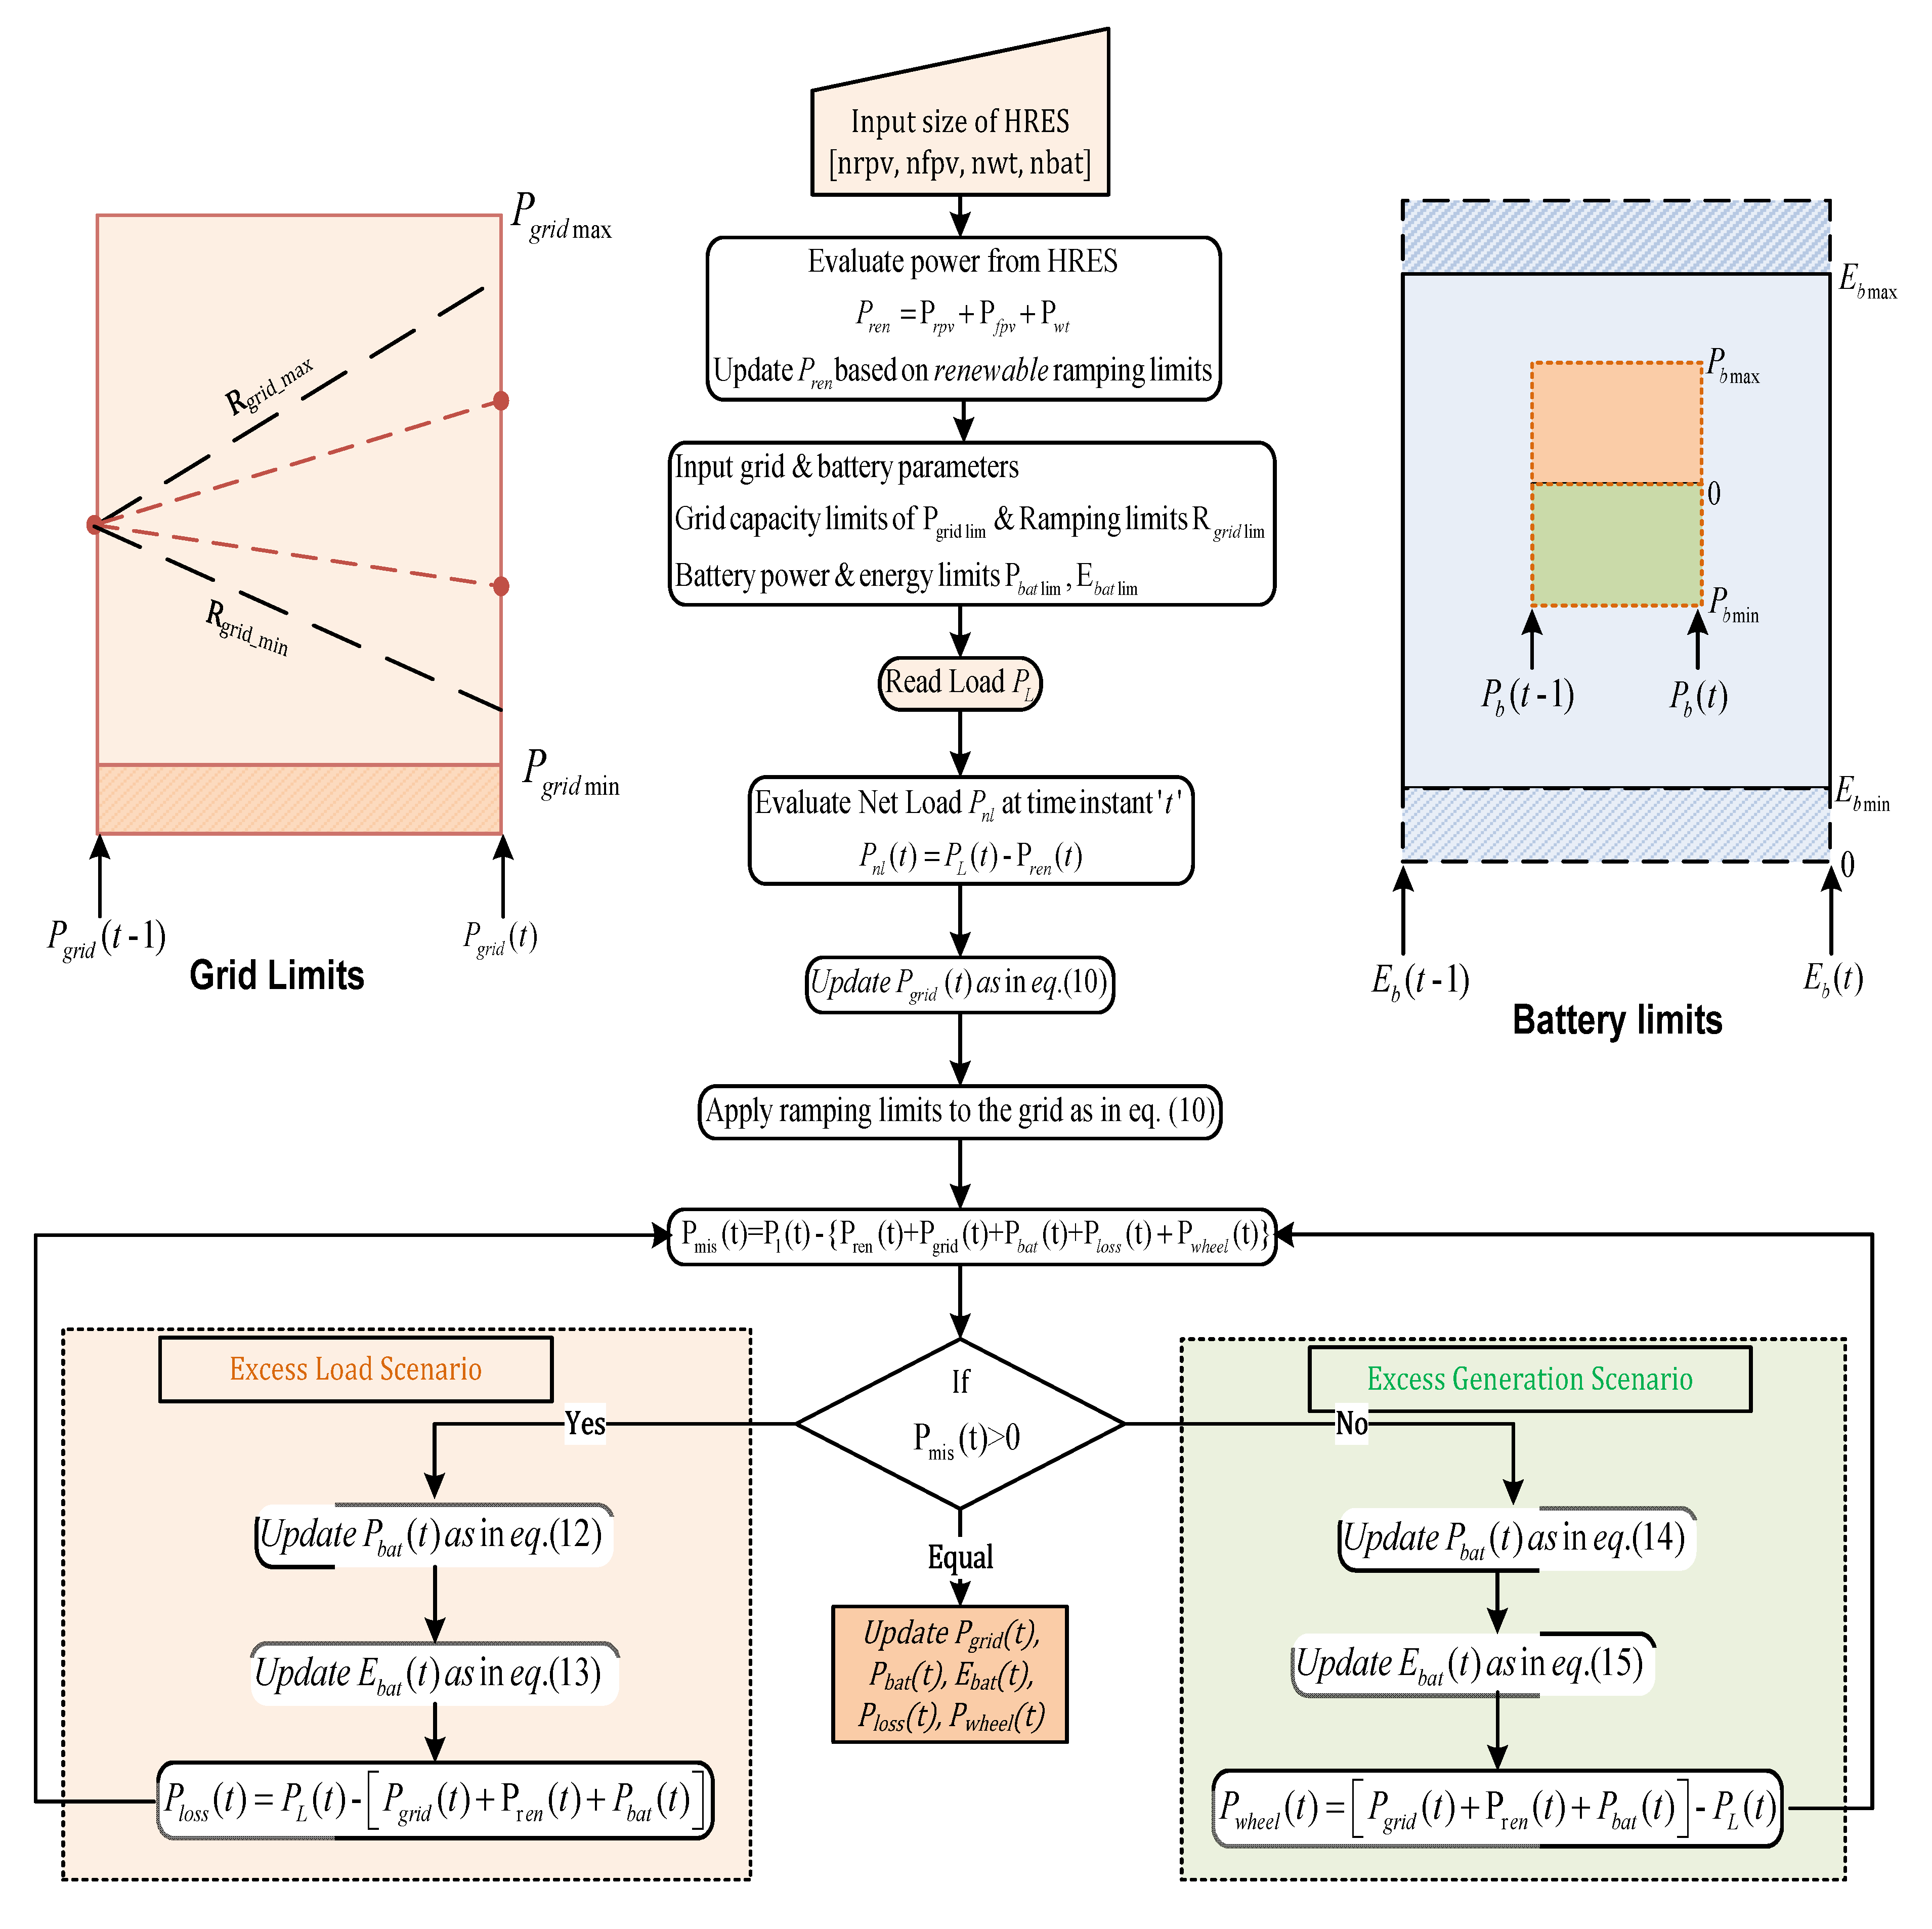
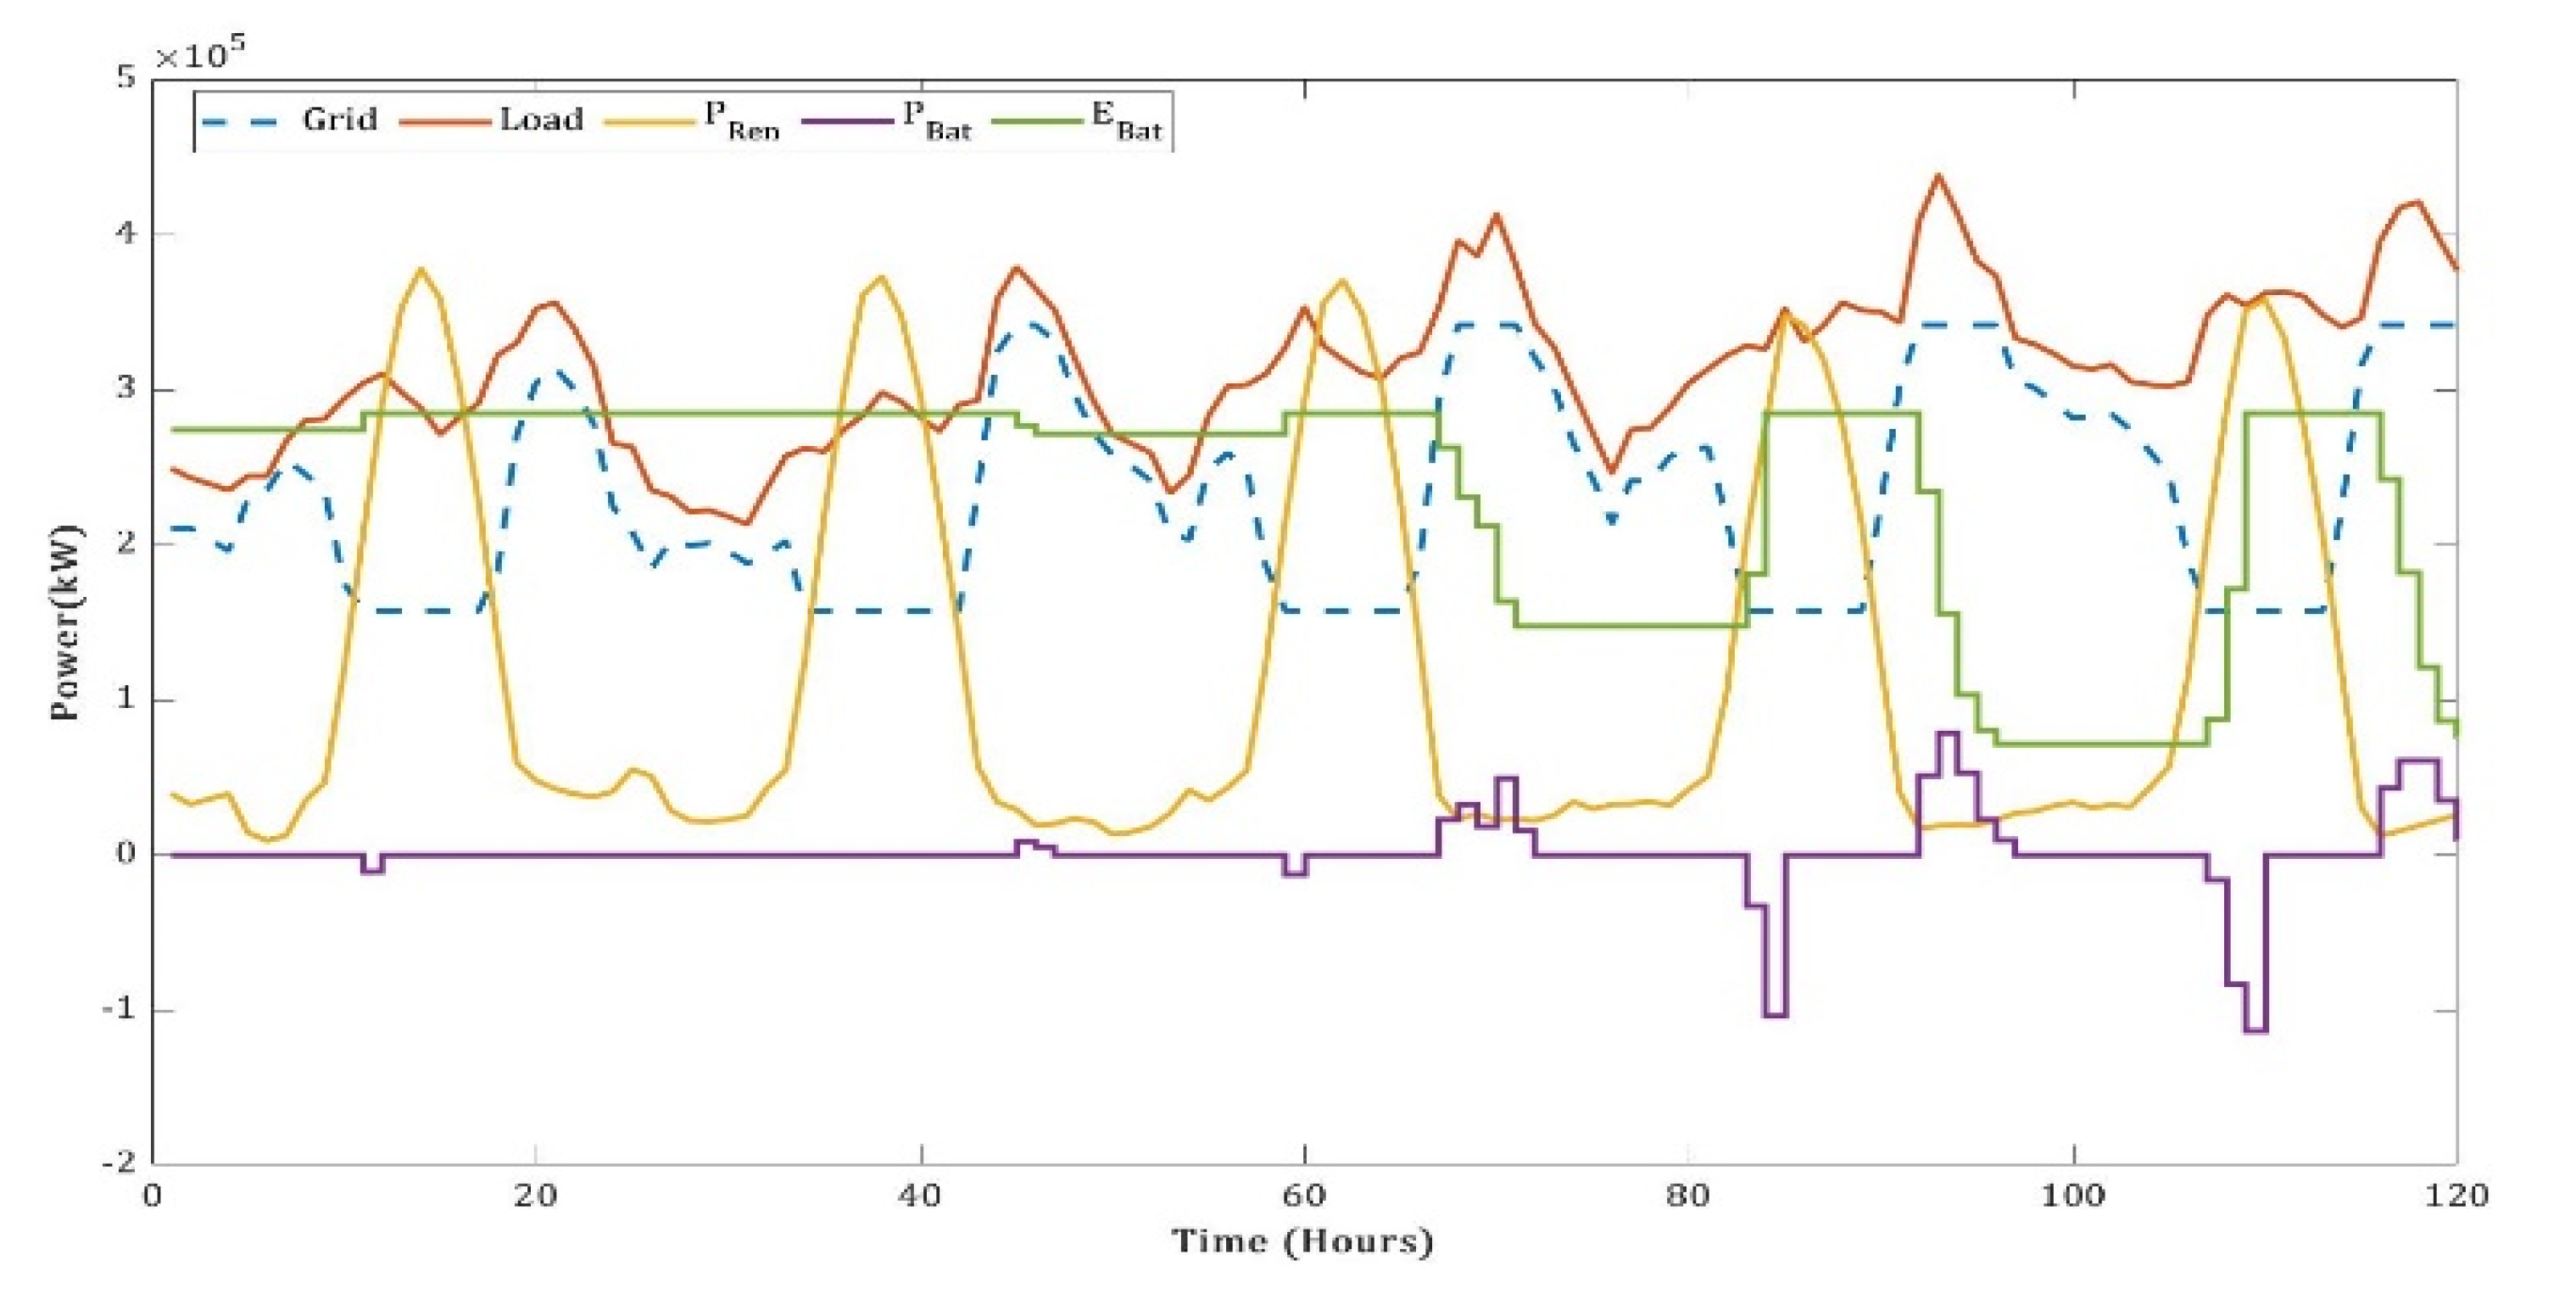
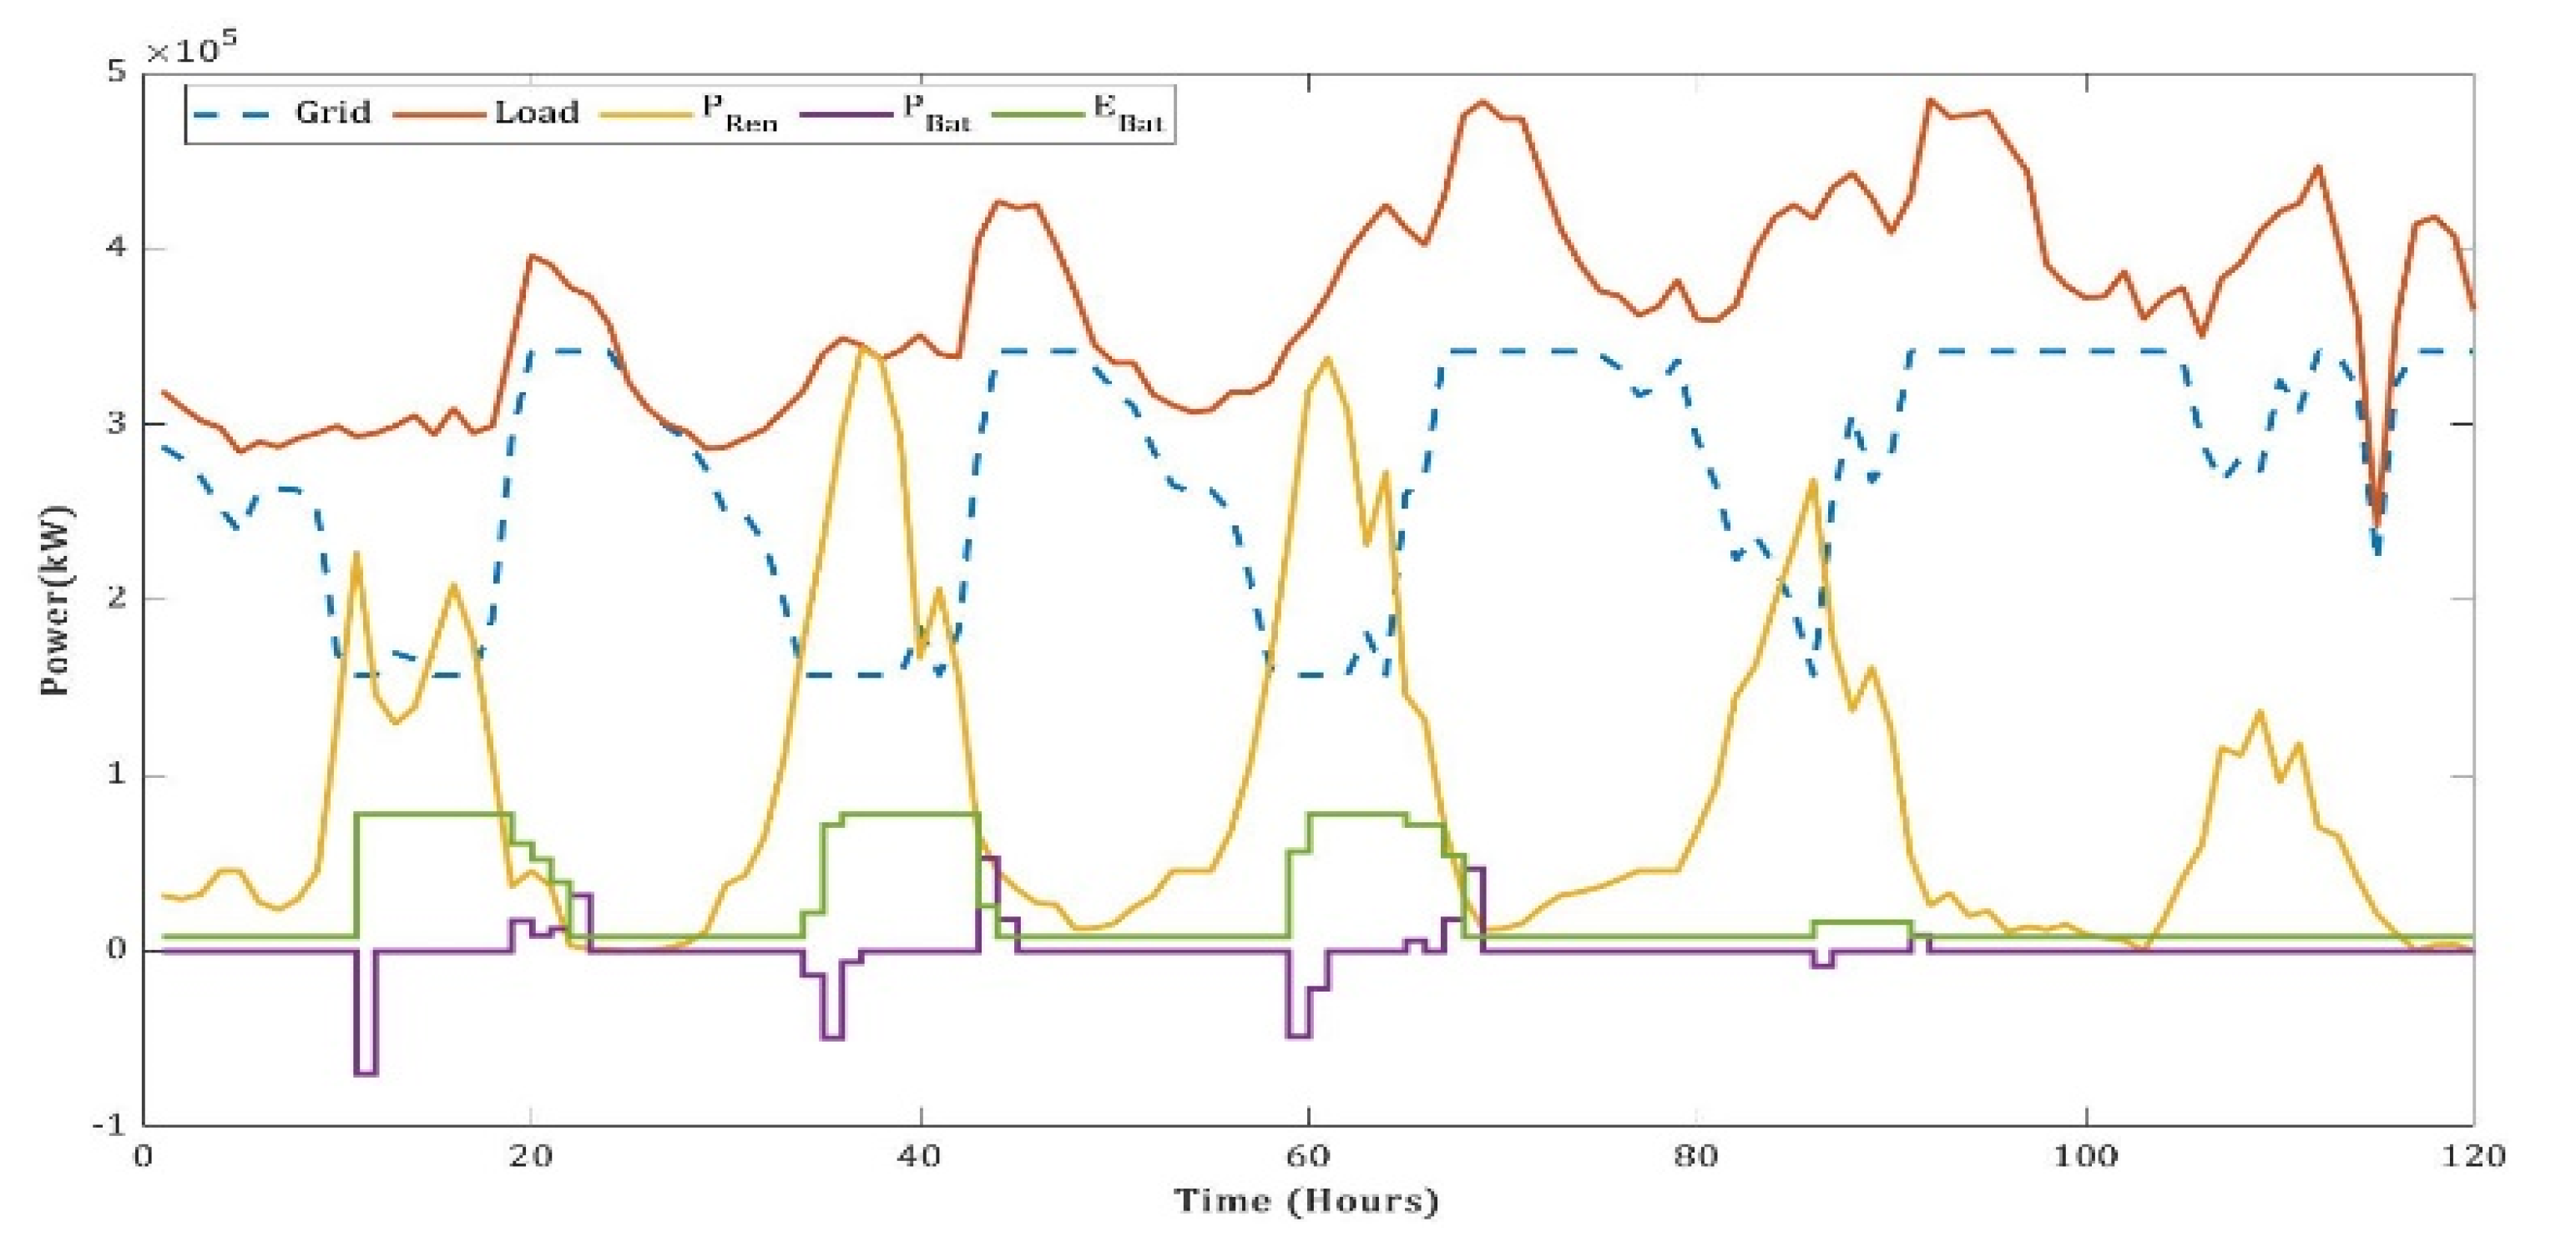
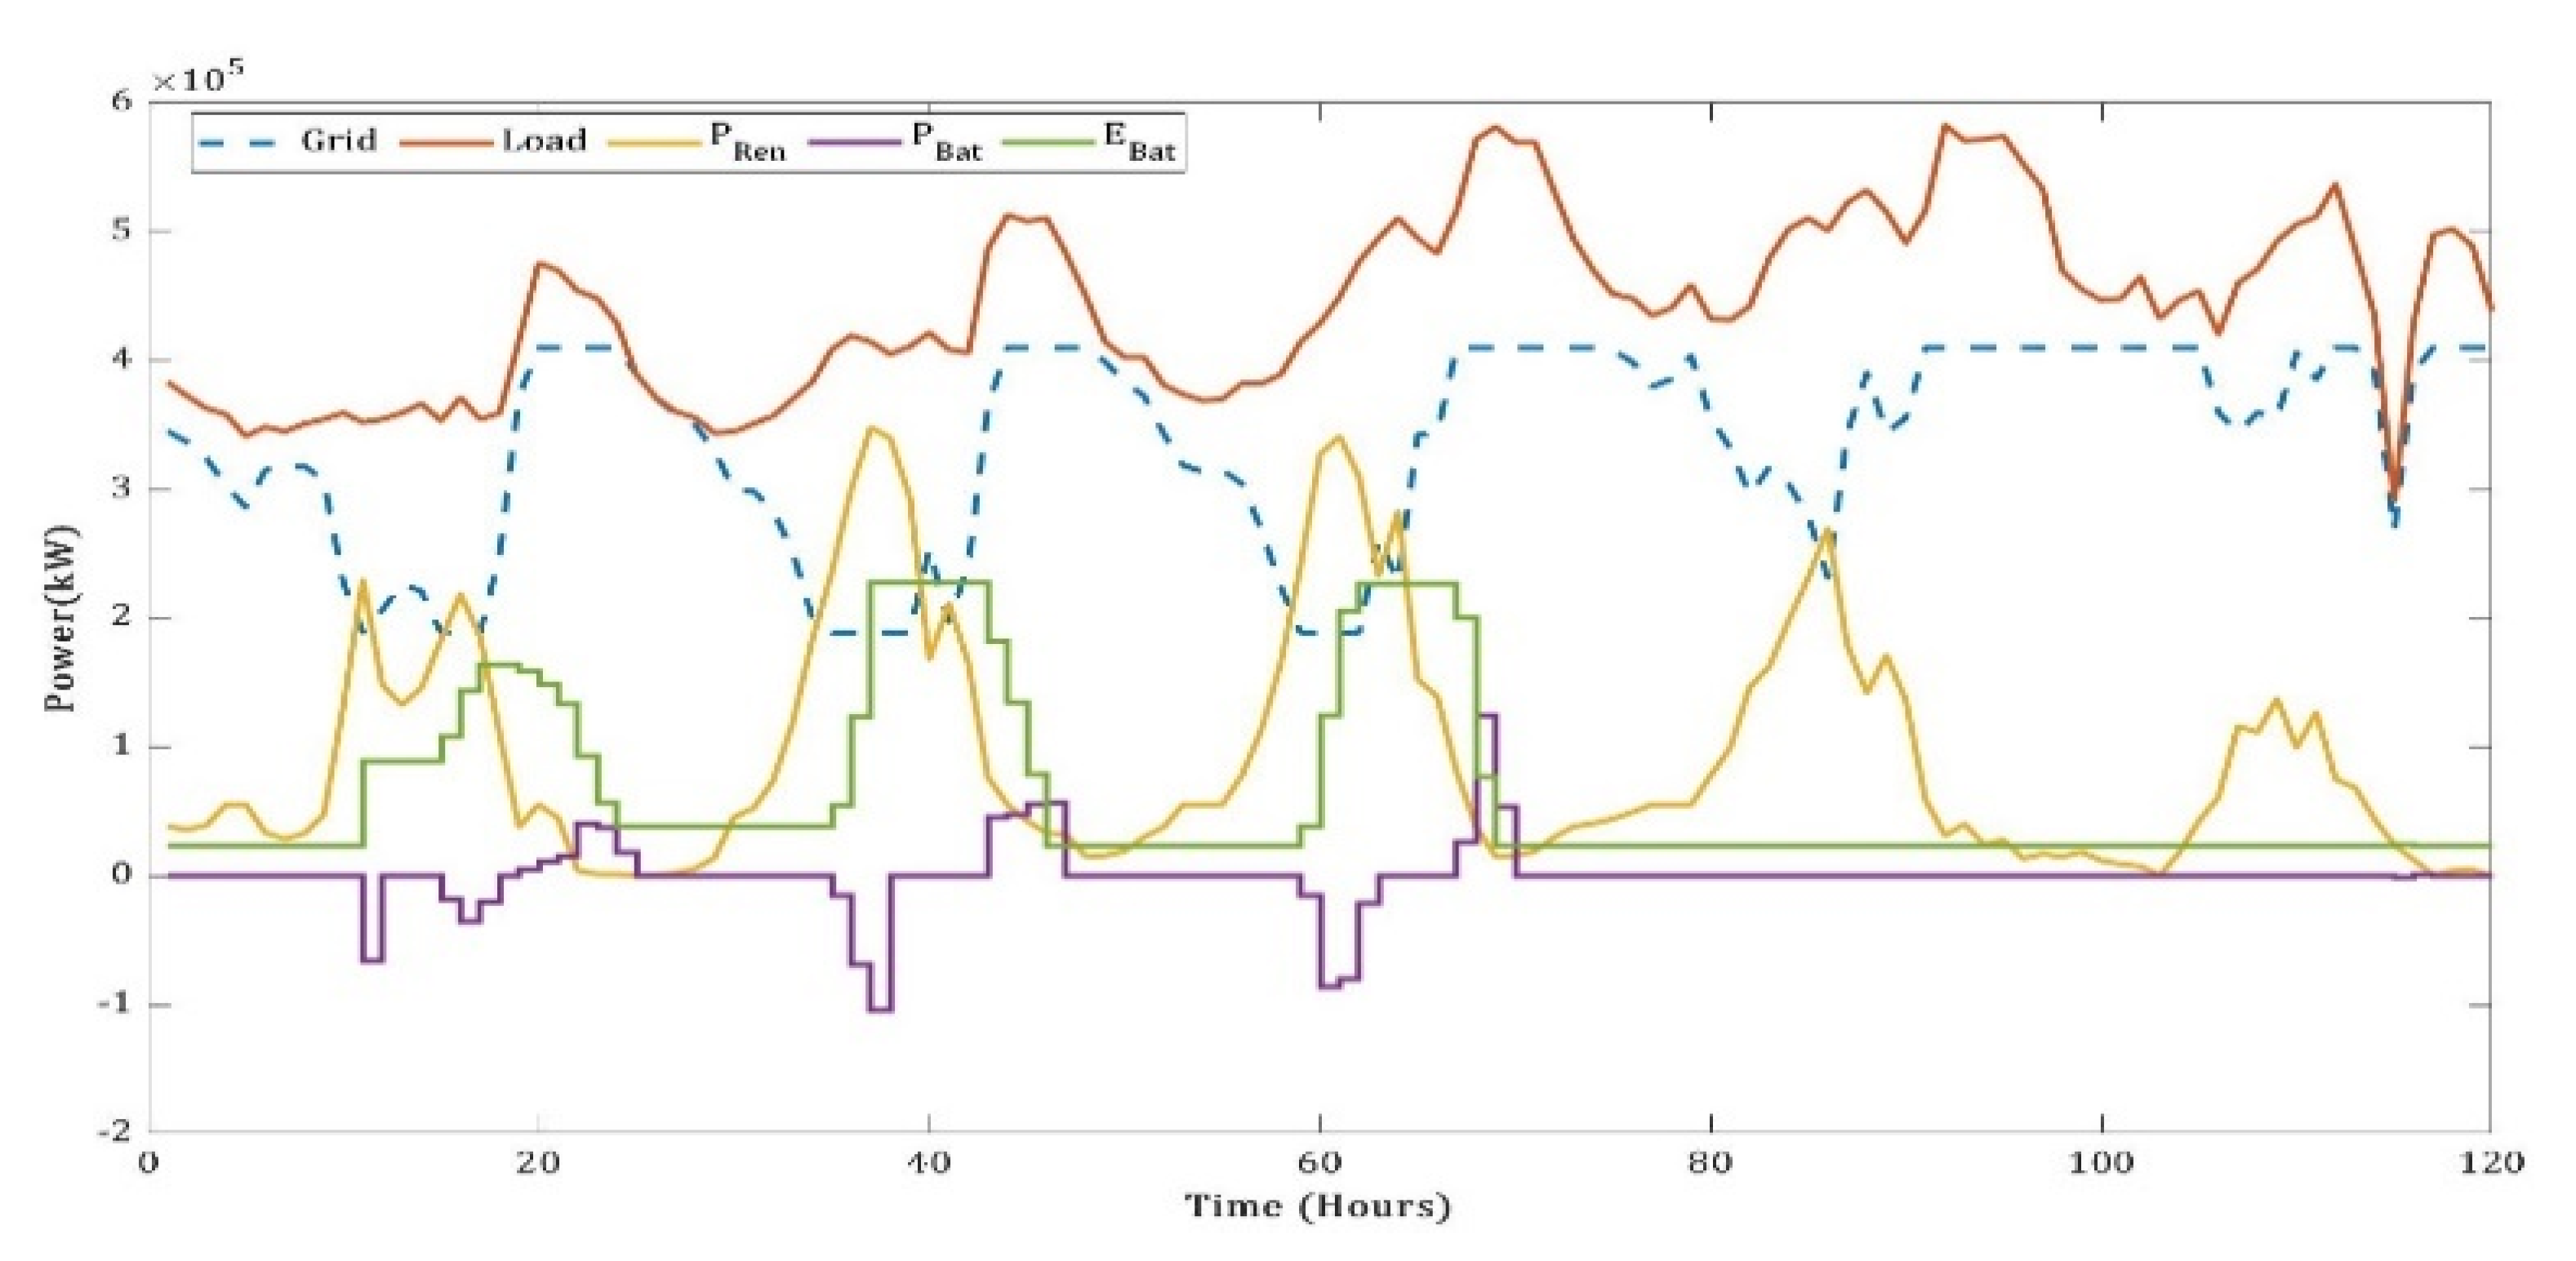
3.4. Energy Management Strategy

To regulate the power flow and frequency in the power system network, the load demand must be met by the generating stations, as given in Equation (9) [10].
P L = ( P f p v + P r p v + P w t ) + P g r i d ± P b a t
The grid is constrained by the following assumptions to ensure network reliability:
i.
The grid is never operated below the technical minimum of 55% of the load.
ii.
The grid is allowed to supply only 80% of the maximum load to accommodate future demand.
iii.
The ramp rates of the grid are restricted to ±0.5%/min of its capacity.
The quantity of power accessed from the grid follows Equation (10). The grid compensates the net load after the load is met by renewable energy. However, the grid is limited by ramping rates and then the maximum capacity.
P g r i d lim : { P g r i d min , P g r i d max } , R g r i d lim : { R g r i d min , R g r i d max }
P g r i d ( t ) = { P l ( t ) - P r e n ( t ) i f   P g r i d min < P l - P r e n < P g r i d max P g r i d ( t - 1 ) + R g r i d max i f   P g r i d ( t ) - P g r i d ( t - 1 ) > R g r i d max P g r i d ( t - 1 ) + R g r i d min i f   P g r i d ( t ) - P g r i d ( t - 1 ) > R g r i d min }
The power mismatch between the load, HRES, and grid is given by Equation (11).
P m i s ( t ) = P 1 ( t ) - { P r e n ( t ) + P g r i d ( t ) }
The flowchart for the EMS is shown in Figure 11. Initially, the size of the renewable energy system is fed to the EMS and the corresponding powers are calculated. The ramp rate limitations of the thermal power plants, battery power, and energy limitations are considered. Using these, the net power mismatch is calculated for the given load at any given instant. Then, power dispatch based on the two scenarios of power mismatch, excess load and excess generation, is carried out.

3.5. Excess Load Scenario

In case the ramping rates or power drawn from the grid exceeds the maximum capacity, the BESS provides support to the system, thereby matching the load demand. Nevertheless, the BESS is also limited by the minimum and maximum power and energy constraints, as given by Equations (12) and (13), respectively, taken from [10].
P b a t ( t ) = min { P b a t max ( t ) , P m i s ( t ) η b a t , d c h , E b a t ( t - 1 ) - E b a t min }
E b a t ( t ) = max { E b a t min , E b a t ( t - 1 ) - P b a t ( t ) Δ t }
Battery energy power limits
P b a t lim : { P b a t min , P b a t max } , E b a t lim : { E b a t min , E b a t max }
Then the mismatched power is updated as P m i s ( t ) = P 1 ( t ) { P r e n ( t ) + P g r i d ( t ) + P b a t } In the case of any further supply–demand mismatch, the demand response will have to set in and curtail the non-essential loads.

3.6. Excess Generation Scenario

In the case of excess generation, the grid intake is reduced until the mismatch nullifies or the grid reaches its technical minimum. If the excess supply persists, then the BESS will charge. As before, the battery intake is limited by its constraints on charging power and energy, as in Equations (14) and (15), taken from [10].
P b a t ( t ) = max { P b a t min ( t ) , P m i s ( t ) η b a t , c h , E b a t max - E b a t ( t - 1 ) }
E b a t ( t ) = min { E b a t max , E b a t ( t - 1 ) - P b a t ( t ) Δ t }
If there is any excess generation even after the battery capacity reaches a maximum, the excess energy is wheeled to other load centers.

4. Multi-Objective Adaptive-Local-Attractor-Based Quantum-Behaved Particle Swarm Optimization (ALA-QPSO)

In the original PSO, the position and velocity of the i-th particle in each iteration ‘it’ are updated according to Equation (16). As discussed in Section 1, the trajectory of these particles is influenced by an attractor [21].
v e l i i t + 1 = ω . v e l i i t + c 1 . r 1 . ( p b e s t i - p o s i i t ) + c 2 . r 2 . ( g b e s t - p o s i i t ) p o s i i t + 1 = p o s i i t + v e l i i t + 1
Using the concept of particle trajectory, the principle of uncertainty from quantum mechanics is applied to generate a delta potential well that allows the particles to move across the entire search space. The position pos of the j-th dimension in the i-th particle is updated using the adaptive local attractor in each iteration according to Equation (17) [21]. The first term is updated based on the adaptive local attractor given in Equation (18), which is updated based on an adaptive contraction–expansion coefficient in Equation (19) and the diversity of the fitness of the population fitij from the mean fitness fitmean in Equation (20). The second term in Equation (17) is updated according to the weighted mean personal best position of all the particles, as given in Equation (21).
p o s i j ( i t + 1 ) = a t r i j α | m p b e s t j ( i t ) - p o s i j ( i t ) | ln ( 1 u i j ( i t ) ) +   f o r   r a n d 0.5 ; -   o t h e r w i s e
where atrij (it) is the adaptive local attractor, as defined in
a t r i j ( i t ) = ζ i j ( t ) d i v ( t ) p o p p b e s t i j ( i t ) + [ 1 - ζ i j ] ( 1 - d i v ( i t ) p o p ) g b e s t j ( i t )
where pop is the population size, pbestij(it) indicates the personal best of the i-th particle during the it-th iteration, and gbestj(it) is the global best of all the particles in the it-th iteration.
The contraction–expansion coefficient is given by
α = α o + ( α 1 - α o ) ( i t max - i t ) i t max
where α0 is the initial weight and itmax is the maximum number of iterations.
The diversity factor in each iteration, div(it), is given by Equation (20).
d i v ( i t ) = i = 1 p o p f i t i j ( i t ) - f i t m e a n ( i t ) 2 F , F = { max | f i t i j i t - f m e a n i t | , i f max | f i t i j ( i t ) - f i t m e a n ( i t ) | 1 , o t h e r w i s e
The weighted mean personal best of each particle in the it-th iteration, mpbest(it), is given in Equation (21).
m p b e s t ( i t ) = i = 1 p o p r i ( i t ) p b e s t i ( i t ) , w h e r e r i ( i t ) = { 1 p o p - 1 ( 1 - f i t i ( i t ) k = 1 p o p f i t k ( i t ) ) ,     i f   k = 1 p o p f i t k ( i t ) 0 1 p o p ,   o t h e r w i s e }
Then the fitness of the particles is evaluated until convergence is achieved or until maximum iterations are completed. The Algorithm 1 for the same is given below.
Algorithm 1 ALA-QPSO
i. 
Initialize the parameters and particles in the population with random position vectors.
ii. 
Evaluate the fitness of all the particles and calculate the personal best for each particle and the global best for the swarm.
iii. 
Calculate the population diversity as in Equation (20).
iv. 
Update the weighted mean personal-best position using Equation (21).
v. 
Update the adaptive local attractor for each particle as in Equation (18)
vi. 
Update the position for each particle using Equation (17).
vii. 
If the terminating condition is not met, go to step iii.
In the case of ALA-MQPSO, a mutation strategy is introduced after step vi to enhance the exploitation capability of the algorithm. For optimal sizing of the HRES, three objective functions, LPSP, LCoE [10], and LCL [54] of the BESS, are considered and are given in Equations (22)–(24). The LPSP represents the amount of load that is cut off by the demand response control, while the LCL represents the usage of the BESS. A higher LCL means frequent cycling of the BESS, which reduces the life of the battery pack even before its rated end-of-life period.
L P S P = t = 1 8760 [ P L ( t ) - ( P g r i d ( t ) + P f p v ( t ) + P r p v ( t ) + P w t ( t ) ± P b a t ( t ) ) ] t = 1 8760 P L ( t )
L C o E = [ i = 1 4 N i . C i . f c r + N i . O M i ] i = 1 4 P i
where f c r = r ( 1 + r ) l ( 1 + r ) l - 1 is the discount factor, r is the interest rate, l is the lifetime of the project, Ci is the capital expenditure, and OMi is the cost of operation and maintenance.
L C L = n 100 e q N 100 f a i l = 1 N 100 f a i l t = 1 8760 0.5 | E b a t ( t ) - E b a t ( t - 1 ) E b a t max | k p
where kp is the Peukert lifetime constant, N 100 f a i l is the maximum number of cycles that a battery experiences before its rated end of life, and n 100 e q is equivalent 100%-DOD cycle number of K half cycles.

5. Simulation Results and Analysis

Based on the assessed potential in Section 2, optimal sizing of the HRES is achieved to minimize the LPSP, LCoE, and LCL. ALA-QPSO techniques are applied, and the results are compared with four other benchmark techniques, four variants of differential evolution (DE) algorithms. The adopted algorithm is compared with variants of DE as it has proven to be an effective optimization technique for enhancing the exploration of the population. The optimization parameters for the algorithms under comparison are presented in Table 4. The same values are chosen for parameters, wherever necessary, for all the algorithms to prove the effectiveness of the proposed algorithm. The results are screened further based on the minimum LPSP, as shown in Table 5. The result obtained is shown to be near optimal as the combination fared well in most of the constraints that include the least number of hours of load loss and the least number of hours of excess generation. This will result in better profitability of the proposed system.
A comparison of the Pareto fronts of three optimization techniques is depicted in Figure 12. Further, the power distribution among the sources over 5 days in each quarter of a year, i.e., 21 to 26 March, June, September, and December, is shown in Figure 13, Figure 14, Figure 15 and Figure 16 with the minimum LPSP configuration. The same is shown with the minimum LCOE configuration for June in Figure 17. The results prove that the use of the BESS is limited only for a transition from peak to off-peak hours in most of the cases, except in June since it is the monsoon season.
During this time, the BESS has helped in maintaining the frequency of the grid constant by compensating for any generation loss by the PV system. It should also be noted that the participation of battery power in the proposed system is mostly during the violation of ramp rate limits, in the early morning or in the evening. Hence, we notice that at noon, ramp rates are not violated the power dispatch from the grid is at its technical minimum. This shows that the higher penetration of variable renewable energy sources into the grid brings down the plant load factor of thermal power plants. Hence, if BESSs are not used during the violation of ramp rate limits, it may burden the TPPs further in the event of phasing-out of diesel- or gas-based plants. Similarly, the power distribution for June with mutation-based ALA-QPSO is plotted in Figure 18 for the minimum LCoE configuration. Here, the month of June is selected, as solar power undergoes wide changes during that month.
A sensitivity analysis is performed on the results obtained through ALA-QPSO. In the first scenario, it is assumed that there is 50% damage to the BESS. The power distribution with this scenario is shown in Figure 19 for June. It can be observed that the demand response is enforced during peak hours. It should be noted that the LCoE has increased drastically to 0.1372 USD, which is 73% more. In addition, the LPSP has increased to 1.62%. We conclude that preventive maintenance is necessary to avoid any load loss due to BESS reduction. Another sensitivity analysis is performed for 20% demand appreciation and 20% BESS reduction. The results for the same are shown in Figure 20. It is observed that due to the rise in demand, ramping rates of the grid are maxed out, and hence the BESS supports the grid during sunset, leading to less backup power for the peak time. It is observed that the LCoE has increased drastically to 0.1577 USD/kW, which is twice that of the actual, and the LPSP has increased to 1.85%. Further, in the case of reduced solar power, the BESS cannot compensate for the generation, even when the ramping is maxed out. It can be concluded that for reliable operation, the size of the BESS should be increased when the LCoE configuration is considered.

6. Conclusions

With the increase in energy demands in smart cities, it is more important than ever to integrate renewable energy sources to stop relying on traditional energy sources. In this study, a hybrid renewable energy system with bifacial rooftop PV, floating PV, and wind energy systems, as well as lithium-ion batteries for energy storage, is considered. The renewable energy potential of a city in India is assessed using Google Earth Pro’s Polygon tool, CAD mapper, and SketchUp Pro. The real-time 1-hour interval-based load profile of the selected locations is considered for calculating the upper limits of the BESS. Reliability indices such as loss of load probability (LPSP), levelized cost of energy (LCoE), and life cycle loss (LCL) of the BESS are considered for optimizing the size under certain constraints on the grid. The optimal sizing of the available HRES is achieved using the ALA-QPSO technique and is compared with benchmark algorithms such as variants of the differential algorithm. A mutation strategy is applied to the adopted ALA-QPSO to enhance exploitation. Though the results of this study are superior, they need further investigation. A sensitivity analysis is performed for conditions such as demand appreciation, battery damage, and cost escalation. The results prove that with the financial fitness of the municipal corporation of the region, the proposed system can be implemented in a phased manner with the help of financial institutions such as the Asian Development Bank, with which the municipal corporation has already tied up for some projects. To assess the operational feasibility of the system, stability analysis of the system can be performed in the future, given the transmission data. This work can be extended to other cities by assessing the potential of RES feasible in those areas. This approach will help the world in achieving the RE targets within the time limits.

Author Contributions

Conceptualization, methodology, formal analysis, and writing—original draft preparation, R.S.S.N and R.M.E; writing—review and editing, D.E., R.S.S.N. and M.R.I.; visualization, M.R.I.; supervision, D.E. and K.S.T. All authors have read and agreed to the published version of the manuscript.

Funding

This research received no external funding.

Institutional Review Board Statement

Not applicable.

Informed Consent Statement

Not applicable.

Data Availability Statement

Not applicable.

Conflicts of Interest

The authors declare no conflict of interest.

References

  1. International Renewable Energy Agency (IRENA). Renewable Power Generation Costs in 2017. Available online: https://www.irena.org/publications/2018/Jan/Renewable-power-generation-costs-in-2017 (accessed on 21 February 2021).
  2. Arto, I.; Capellán-Pérez, I.; Lago, R.; Bueno, G.; Bermejo, R. The energy requirements of a developed world. Energy Sustain. Dev. 2016, 33, 1–13. [Google Scholar] [CrossRef] [Green Version]
  3. Central Electricity Authority of India. Installed Capacity-February 2020. Available online: http://www.cea.nic.in/reports/monthly/installedcapacity/2020/installed_capacity-02.pdf (accessed on 21 February 2021).
  4. APERC. Andhra Pradesh Electricity Regulatory Commission 4th Floor; Singareni: Vijayawada, India, 2019. [Google Scholar]
  5. Tummala, A.S.; Inapakurthi, R.; Ramanarao, P.V. Observer based sliding mode frequency control for multi-machine power systems with high renewable energy. J. Mod. Power Syst. Clean Energy 2018, 6, 473–481. [Google Scholar] [CrossRef] [Green Version]
  6. Mongird, K. Energy Storage Technology and Cost Characterization Report, Department of Energy. Available online: https://www.energy.gov/eere/water/downloads/energy-storage-technology-and-cost-characterization-report (accessed on 18 August 2020).
  7. van der Stelt, S.; AlSkaif, T.; van Sark, W. Techno-economic analysis of household and community energy storage for residential prosumers with smart appliances. Appl. Energy 2018, 209, 266–276. [Google Scholar] [CrossRef]
  8. Jacob, A.S.; Banerjee, R.; Ghosh, P.C. Sizing of hybrid energy storage system for a PV based microgrid through design space approach. Appl. Energy 2018, 212, 640–653. [Google Scholar] [CrossRef]
  9. Raguraman, L.; Ravindran, M. MFLRS-RDF technique for optimal sizing and performance analysis of HRES. Int. J. Numer. Model. Electron. Netw. Devices Fields 2019, 33, e2675. [Google Scholar] [CrossRef]
  10. Ramli, M.A.; Bouchekara, H.; Alghamdi, A.S. Optimal sizing of PV/wind/diesel hybrid microgrid system using multi-objective self-adaptive differential evolution algorithm. Renew. Energy 2018, 121, 400–411. [Google Scholar] [CrossRef]
  11. Noura, N.; Boulon, L.; Jemeï, S. A Review of Battery State of Health Estimation Methods: Hybrid Electric Vehicle Challenges. World Electr. Veh. J. 2020, 11, 66. [Google Scholar] [CrossRef]
  12. Dong, C.; Wang, G.; Chen, Z.; Yu, Z. A method of self-adaptive inertia weight for PSO. In Proceedings of the International Conference on Computer Science and Software Engineering, Wuhan, China, 12–14 December 2008; Volume 1, pp. 1195–1198. [Google Scholar] [CrossRef]
  13. Mallipeddi, R.; Suganthan, P.; Pan, Q.-K.; Tasgetiren, M.F. Differential evolution algorithm with ensemble of parameters and mutation strategies. Appl. Soft Comput. 2011, 11, 1679–1696. [Google Scholar] [CrossRef]
  14. Nagra, A.A.; Han, F.; Ling, Q.H. An improved hybrid self-inertia weight adaptive particle swarm optimization algorithm with local search. Eng. Optim. 2018, 51, 1115–1132. [Google Scholar] [CrossRef]
  15. Zhang, Q.; Ding, J.; Shen, W.; Ma, J.; Li, G. Multiobjective Particle Swarm Optimization for Microgrids Pareto Optimization Dispatch. Math. Probl. Eng. 2020, 2020, 1–13. [Google Scholar] [CrossRef] [PubMed]
  16. Ming, M.; Wang, R.; Zha, Y.; Zhang, T. Multi-Objective Optimization of Hybrid Renewable Energy System Using an Enhanced Multi-Objective Evolutionary Algorithm. Energies 2017, 10, 674. [Google Scholar] [CrossRef] [Green Version]
  17. Clerc, M.; Kennedy, J. The particle swarm-explosion, stability, and convergence in a multidimensional complex space. IEEE Trans. Evol. Comput. 2002, 6, 58–73. [Google Scholar] [CrossRef] [Green Version]
  18. Sun, J.; Feng, B.; Xu, W. Particle swarm optimization with particles having quantum behavior. In Proceedings of the 2004 Congress on Evolutionary Computation, Portland, OR, USA, 19–23 June 2004; Volume 1, pp. 325–331. [Google Scholar] [CrossRef]
  19. Han, F.; Sun, Y.-W.; Ling, Q.-H. An Improved Multiobjective Quantum-Behaved Particle Swarm Optimization Based on Double Search Strategy and Circular Transposon Mechanism. Complexity 2018, 2018, 1–22. [Google Scholar] [CrossRef]
  20. Sun, J.; Fang, W.; Palade, V.; Wu, X.; Xu, W. Quantum-behaved particle swarm optimization with Gaussian distributed local attractor point. Appl. Math. Comput. 2011, 218, 3763–3775. [Google Scholar] [CrossRef]
  21. Chen, S. Quantum-Behaved Particle Swarm Optimization with Weighted Mean Personal Best Position and Adaptive Local Attractor. Information 2019, 10, 22. [Google Scholar] [CrossRef] [Green Version]
  22. González, A.; Riba, J.-R.; Rius, A. Optimal Sizing of a Hybrid Grid-Connected Photovoltaic–Wind–Biomass Power System. Sustainability 2015, 7, 12787–12806. [Google Scholar] [CrossRef] [Green Version]
  23. Zhang, W.; Maleki, A.; Rosen, M.A.; Liu, J. Optimization with a simulated annealing algorithm of a hybrid system for renewable energy including battery and hydrogen storage. Energy 2018, 163, 191–207. [Google Scholar] [CrossRef]
  24. Jamshidi, M.; Askarzadeh, A. Techno-economic analysis and size optimization of an off-grid hybrid photovoltaic, fuel cell and diesel generator system. Sustain. Cities Soc. 2018, 44, 310–320. [Google Scholar] [CrossRef]
  25. Samy, M.; Barakat, S.; Ramadan, H. A flower pollination optimization algorithm for an off-grid PV-Fuel cell hybrid renewable system. Int. J. Hydrogen Energy 2019, 44, 2141–2152. [Google Scholar] [CrossRef]
  26. Kusakana, K. Optimal peer-to-peer energy management between grid-connected prosumers with battery storage and photovoltaic systems. J. Energy Storage 2020, 32, 101717. [Google Scholar] [CrossRef]
  27. Hakimi, S.M.; Hasankhani, A.; Shafie-Khah, M.; Catalão, J.P. Optimal sizing and siting of smart microgrid components under high renewables penetration considering demand response. IET Renew. Power Gener. 2019, 13, 1809–1822. [Google Scholar] [CrossRef] [Green Version]
  28. Bhatti, A.R.; Salam, Z.; Sultana, B.; Rasheed, N.; Awan, A.B.; Sultana, U.; Younas, M. Optimized sizing of photovoltaic grid-connected electric vehicle charging system using particle swarm optimization. Int. J. Energy Res. 2018, 43, 500–522. [Google Scholar] [CrossRef]
  29. Akram, U.; Khalid, M.; Shafiq, S. Optimal sizing of a wind/solar/battery hybrid grid-connected microgrid system. IET Renew. Power Gener. 2017, 12, 72–80. [Google Scholar] [CrossRef]
  30. Dominguez, O.D.M.; Kasmaei, M.P.; Lavorato, M.; Mantovani, J.R.S. Optimal siting and sizing of renewable energy sources, storage devices, and reactive support devices to obtain a sustainable electrical distribution systems. Energy Syst. 2017, 9, 529–550. [Google Scholar] [CrossRef] [Green Version]
  31. Miñambres-Marcos, V.M.; Guerrero-Martínez, M.; Barrero-González, F.; Milanés-Montero, M.I. A Grid Connected Photovoltaic Inverter with Battery-Supercapacitor Hybrid Energy Storage. Sensors 2017, 17, 1856. [Google Scholar] [CrossRef] [PubMed] [Green Version]
  32. Chudinzow, D.; Haas, J.; Díaz-Ferrán, G.; Moreno-Leiva, S.; Eltrop, L. Simulating the energy yield of a bifacial photovoltaic power plant. Sol. Energy 2019, 183, 812–822. [Google Scholar] [CrossRef]
  33. Asgharzadeh, A.; Marion, B.; Deline, C.; Hansen, C.; Stein, J.S.; Toor, F. A Sensitivity Study of the Impact of Installation Parameters and System Configuration on the Performance of Bifacial PV Arrays. IEEE J. Photovolt. 2018, 8, 798–805. [Google Scholar] [CrossRef]
  34. Campana, P.E.; Wästhage, L.; Nookuea, W.; Tan, Y.; Yan, J. Optimization and assessment of floating and floating-tracking PV systems integrated in on- and off-grid hybrid energy systems. Sol. Energy 2018, 177, 782–795. [Google Scholar] [CrossRef]
  35. Energy Sector Management Assistance Program; Solar Energy Research Institute of Singapore. Where Sun Meets Water: Floating Solar Market Report; World Bank: Washington, DC, USA, 2019. [Google Scholar]
  36. Dizier, A. Techno-Economic Analysis of floating PV Solar Power Plants Using Active Cooling Technique A case Study for Taiwan; p. 68. Available online: http://www.diva-portal.org/smash/get/diva2:1290021/FULLTEXT01.pdf (accessed on 14 April 2020).
  37. Siratarnsophon, P.; Lao, K.W.; Rosewater, D.; Santoso, S. A Voltage Smoothing Algorithm Using Energy Storage PQ Control in PV-Integrated Power Grid. IEEE Trans. Power Deliv. 2019, 34, 2248–2250. [Google Scholar] [CrossRef]
  38. de la Parra, J.; Marcos, J.; García, M.; Marroyo, L. Control strategies to use the minimum energy storage requirement for PV power ramp-rate control. Sol. Energy 2015, 111, 332–343. [Google Scholar] [CrossRef]
  39. Ahmed, D.; Ebeed, M.; Ali, A.; Alghamdi, A.; Kamel, S. Multi-Objective Energy Management of a Micro-Grid Considering Stochastic Nature of Load and Renewable Energy Resources. Electronics 2021, 10, 403. [Google Scholar] [CrossRef]
  40. Oda, E.S.; El Hamed, A.M.A.; Ali, A.; Elbaset, A.A.; El Sattar, M.A.; Ebeed, M. Stochastic Optimal Planning of Distribution System Considering Integrated Photovoltaic-Based DG and DSTATCOM Under Uncertainties of Loads and Solar Irradiance. IEEE Access 2021, 9, 26541–26555. [Google Scholar] [CrossRef]
  41. Münderlein, J.; Ipers, G.; Steinhoff, M.; Zurmühlen, S.; Sauer, D.U. Optimization of a hybrid storage system and evaluation of operation strategies. Int. J. Electr. Power Energy Syst. 2020, 119, 105887. [Google Scholar] [CrossRef]
  42. Wang, S.; Guo, D.; Han, X.; Lu, L.; Sun, K.; Li, W.; Sauer, D.U.; Ouyang, M. Impact of battery degradation models on energy management of a grid-connected DC microgrid. Energy 2020, 207, 118228. [Google Scholar] [CrossRef]
  43. Figgener, J.; Stenzel, P.; Kairies, K.-P.; Linßen, J.; Haberschusz, D.; Wessels, O.; Angenendt, G.; Robinius, M.; Stolten, D.; Sauer, D.U. The development of stationary battery storage systems in Germany—A market review. J. Energy Storage 2020, 29, 101153. [Google Scholar] [CrossRef]
  44. Moseley, P.T.; Rand, D.A.; Davidson, A.; Monahov, B. Understanding the functions of carbon in the negative active-mass of the lead–acid battery: A review of progress. J. Energy Storage 2018, 19, 272–290. [Google Scholar] [CrossRef]
  45. Tran, M.-K.; Fowler, M. A Review of Lithium-Ion Battery Fault Diagnostic Algorithms: Current Progress and Future Challenges. Algorithms 2020, 13, 62. [Google Scholar] [CrossRef] [Green Version]
  46. Madlener, R.; Kirmas, A. Economic Viability of Second Use Electric Vehicle Batteries for Energy Storage in Residential Applications. Energy Procedia 2017, 105, 3806–3815. [Google Scholar] [CrossRef]
  47. Rehman, A.U.; Wadud, Z.; Elavarasan, R.M.; Hafeez, G.; Khan, I.; Shafiq, Z.; Alhelou, H.H. An Optimal Power Usage Scheduling in Smart Grid Integrated with Renewable Energy Sources for Energy Management. IEEE Access 2021, 9, 84619–84638. [Google Scholar] [CrossRef]
  48. Kiani, A.T.; Nadeem, M.F.; Ahmed, A.; Khan, I.; Elavarasan, R.M.; Das, N. Optimal PV Parameter Estimation via Double Exponential Function-Based Dynamic Inertia Weight Particle Swarm Optimization. Energies 2020, 13, 4037. [Google Scholar] [CrossRef]
  49. AECOM. Smart City Master Planning and Sector-Specific Smart City Infrastructure Projects for Visakhapatnam, Visakhapatnam. Available online: https://www.smartvizag.in/wp-content/uploads/2017/01/Green_Framework.pdf (accessed on 14 April 2020).
  50. Nuvvula, R.; Devaraj, E.; Srinivasa, K.T. A Comprehensive Assessment of Large-scale Battery Integrated Hybrid Renewable Energy System to Improve Sustainability of a Smart City. Energy Sources Part. A Recover. Util. Environ. Eff. 2021, 1–22. [Google Scholar] [CrossRef]
  51. Patel, M.T.; Khan, M.; Sun, X.; Alam, M.A. A worldwide cost-based design and optimization of tilted bifacial solar farms. Appl. Energy 2019, 247, 467–479. [Google Scholar] [CrossRef] [Green Version]
  52. Samsung, S.D.I. Datasheet: Battery-Spec-Samsung-P3-R101. 2018. Available online: https://www.samsungsdi.com/upload/ess_brochure/201804_SamsungSDI%20ESS_EN.PDF (accessed on 17 June 2020).
  53. Trina Solar, Datasheet: Duomax-Bi-facial Dual Glass 72-Cell Module. Available online: https://static.trinasolar.com/sites/ default/files/Datasheet%20DUOMAX%20Twin_DEG14C.07%28II%29_July_2017_B_web.pdf (accessed on 17 June 2020).
  54. Suzlon, “Technical Data S97-2.1 MW,” 2010. Available online: https://oakland.edu/Assets/upload/docs/Energy /Wind-Project/07-Suzlon-2.1-MW-S97---Technical-Data.pdf. (accessed on 17 June 2020).
  55. Ralon, P.; Taylor, M.; Ilas, A.; Diaz-Bone, H.; Kai-Philipp, K. Electricity Storage and Renewables: Costs and Markets To 2030, International Renewable Energy Agency (IRENA), Abu Dhabi UAE, October 2017. Available online: https://www.irena.org/-/media/Files/IRENA/Agency/Publication/2017/Oct/IRENA_Electricity_Storage_Costs_2017.pdf (accessed on 17 June 2020).
Figure 1. Plant load factors of various sectors in India.
Energies 14 05368 g001
Figure 2. Process flowchart of the proposed research.
Energies 14 05368 g002
Figure 3. Block diagram of the proposed hybrid renewable energy system.
Energies 14 05368 g003
Figure 4. Growth centers and human settlements in Visakhapatnam.
Energies 14 05368 g004
Figure 5. Identification of potential areas for renewable energy plant installations using Google Earth Pro.
Energies 14 05368 g005
Figure 6. Access to grid in the proposed site.
Energies 14 05368 g006
Figure 7. Electric load pattern at the proposed location.
Energies 14 05368 g007
Figure 8. (a) Land cover of the proposed area. (b) Shading analysis of a proposed rooftop PV configuration over a building.
Energies 14 05368 g008
Figure 9. Illustration of irradiance on the titled solar panel.
Energies 14 05368 g009
Figure 10. Wind profile at the proposed location at different elevations.
Energies 14 05368 g010
Figure 11. Flow chart for the energy management system.
Energies 14 05368 g011
Figure 12. Pareto fronts of proposed techniques.
Energies 14 05368 g012
Figure 13. Power distribution with ALA-QPSO for the minimum LPSP for 21–26 March.
Energies 14 05368 g013
Figure 14. Power distribution with ALA-QPSO for the minimum LPSP for 21–26 June.
Energies 14 05368 g014
Figure 15. Power distribution with ALA-QPSO for the minimum LPSP for 21–26 September.
Energies 14 05368 g015
Figure 16. Power distribution with ALA-QPSO for the minimum LPSP for 21–26 December.
Energies 14 05368 g016
Figure 17. Power distribution with ALA-QPSO for the minimum LCoE for 21–26 June.
Energies 14 05368 g017
Figure 18. Power distribution with mutation-based ALA-QPSO for the minimum LCoE for 21–26 June.
Energies 14 05368 g018
Figure 19. Power distribution with ALA-QPSO for the minimum LPSP for 21–26 June with 50% damage to the BESS assumed.
Energies 14 05368 g019
Figure 20. Power distribution with ALA-QPSO for the minimum LCOE for 21–26 June with 20% damage to the BESS and 20% demand appreciation assumed.
Energies 14 05368 g020
Table 1. Energy scenario in India, 2010–2019 [3].
YearRequired (MU)Available (MU)Deficit
(%)
Peak Demand (MW)Peak Met
(MW)
Conventional
Energy Generation(MU)
Year-on-Year Growth
(%)
2009–20108,30,5947,46,644−10.11,19,1661,04,009771,5516.6
2010–20118,61,5917,88,355−8.51,22,2871,10,256811,1435.56
2011–20129,37,1998,57,886−8.51,30,0061,16,191876,8878.11
2012–20139,95,5579,08,652−8.71,35,4531,23,294912,0564.01
2013–201410,02,2579,59,829−4.21,35,9181,29,815967,1506.04
2014–201510,68,92310,30,785−3.61,48,1661,41,1601048,6738.43
2015–201611,14,40810,90,850−2.11,53,3661,48,4631107,8225.64
2016–201711,42,92911,35,334−0.71,59,5421,56,9341160,1414.72
2017–201812,13,32612,04,697−0.71,64,0661,60,7521206,3063.98
2018–201912,74,59512,67,526−0.61,77,0221,75,5281249,3373.57
Table 2. Energy potential of various renewable energy technologies in the proposed location.
S. no.TechnologyPotential of Renewable Resource
1Floating PV systemIdentified number of areas4
Total available area (km2) 2.933
Available area (m2)
(assuming 20% use)
586,630
Potential for installed capacity (MW) (power density 180 W/m2)105 MW
Maximum-possible number of solar panels (360 Wp)293,315
2Rooftop bifacial
PV system
Identified number of areas6
Total available area (km2)24.46
Available area (km2)
(assuming 5% acceptance)
1.223
Potential for installed capacity (MW) (power density 215 W/m2)260 MW
Maximum-possible number of bifacial solar panels (430 Wp)611,500
3Wind energy systemIdentified number of areas5
Total length of hilltops and shoreline (m)11,140
Available length (m)
(assuming 100% use)
11,140
Potential for installed capacity (MW)62 MW
Maximum-possible number of wind turbines (2.1 MW)30
Table 3. Technical details of components, along with costs.
S. no.Type of
Specification
ParameterBifacial Rooftop
PV Panels [53]
Floating
PV Panels [53]
Wind
Turbines [54]
Batteries [52]
1TechnologyCell typePolycrystallineMono c-SiTubularLithium ion
2ElectricalVoltage (VMPP)52.2733.75690774–1004 V
Current (A)9.319.781895 111 Ah
Power (energy)430 W360 W2.1 MW(99 kWh)
Temperature coefficient −0.42%/°C−0.39%/°CNANA
3MechanicalDimensions1996 × 1310 × 40 (mm3)1640 × 992 × 35
(mm3)
111 (m)442 × 702 × 2124
(mm3)
Weight36.5 kg17.5 kgNA670 kg
4Financial [55]Capital requirements796 USD1031 USD980 USD350 USD/kWh
O&M costs12 USD16 USD25 USD35 USD
Table 4. Optimization parameters of benchmark techniques.
S. no.Optimization TechniquePopulationNo of IterationsScaling FactorCrossover RateInertiaPersonal WeightSocial Weight
1ALA-mQPSO20100--122
2ALA-QPSO20100--122
3DE/best/11001000.80.9---
4DE/rand/11001000.80.9---
5DE/rand-to-best/11001000.80.9---
6DE/best/21001000.80.9---
Table 5. Results for optimal sizing with the adopted optimization technique.
Optimization TechniqueTechnologiesObjectives
No of Bifacial Rooftop PV Panels# Floating PV PanelsNo of Wind TurbinesNo of BatteriesLPSP
(%)
LCoELCL
ALA-MQPSO6115002587563036900.0050.0770.0087
ALA-QPSO5966922757162932760.00980.07890.0096
ModeDE/rand/16071252607312933610.00890.0770.0094
DE/current-to-rand/14183232055342921810.01440.07650.0091
DE/current-to-best/13496102889652911300.01030.07860.0103
DE/best/25590141579212996900.01230.08050.0091
Publisher’s Note: MDPI stays neutral with regard to jurisdictional claims in published maps and institutional affiliations.

