
Augmented Power Dispatch for Resilient Operation through Controllable Series Compensation and N-1-1 Contingency Assessment

 ,
, 
 , ,
, , 
Abstract
:1. Introduction
1.1. Background and Motivation
1.2. Related Works and Research Gap
1.3. Contributions of This Paper
- A new N-1-1 security criterion is defined to select the disruptive contingency cases that might trigger cascading failures. It is defined from the perspective of preventing further propagation of N-1 contingency. The security constraints of the defined contingency set are formulated by using the line outage distribution factors and are taken into account in the proposed power dispatch model through an iterative contingency filtering process.
- Two objectives related to active power flow on transmission lines are considered in the dispatch model to avoid full or heavy loads on lines in the transmission system, thus reducing the probability of massive power flow transfer and overload cascading outages after the initial outage. The adjustment of transmission line reactance by controllable series compensation devices is considered in the optimization model.
- The proposed augmented power dispatch model is nonlinear due to the line flow-related objective function and the consideration of controllable series compensation devices. Linear relaxation techniques are introduced to convert the model into a mixed-integer linear program. Although MILP is less challenging compared to the original nonlinear programming, it is not preferred, especially for large-scale real power systems. A computationally efficient two-stage solution is proposed to further reduce computational complexity.
2. The Proposed Augmented Power Dispatch Model and Solution Methodology
2.1. Definition of the Defined N-1-1 Contingency Set
2.2. Mathematical Formulation of the Proposed Power Dispatch Optimization Model
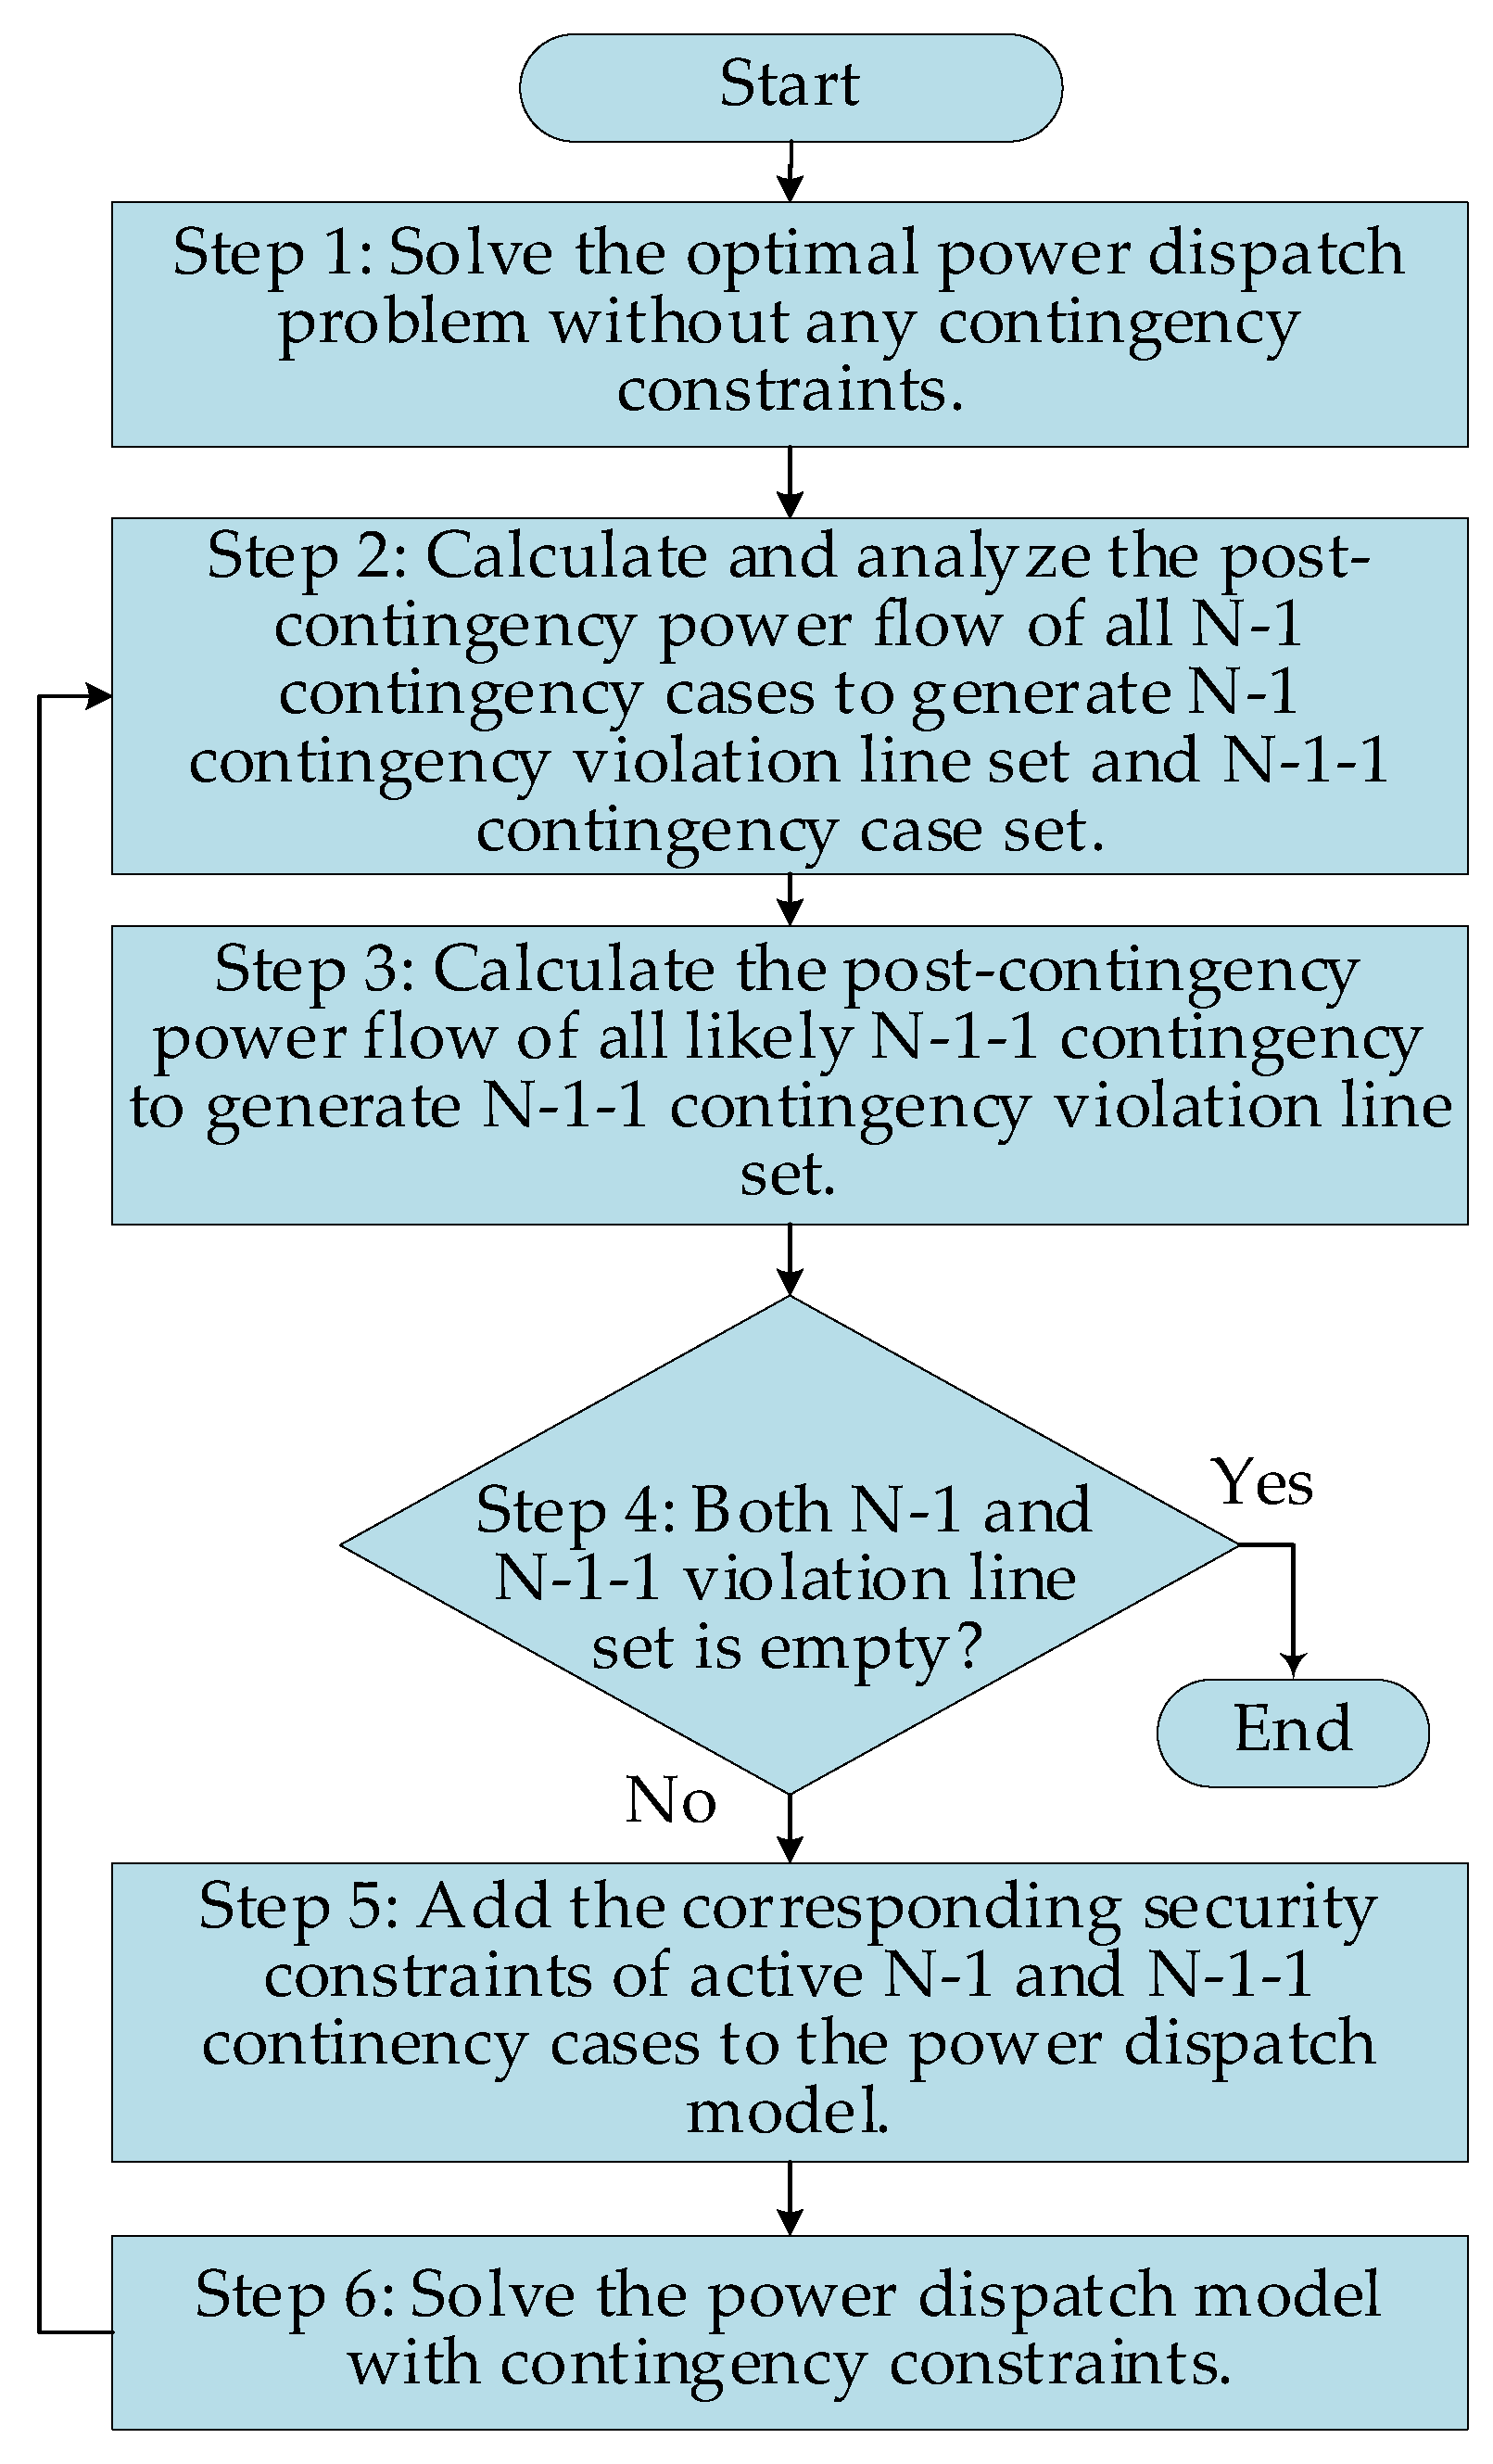
2.3. Iterative Contingency Filtering Process
3. Case Studies
3.1. IEEE 30-Bus System
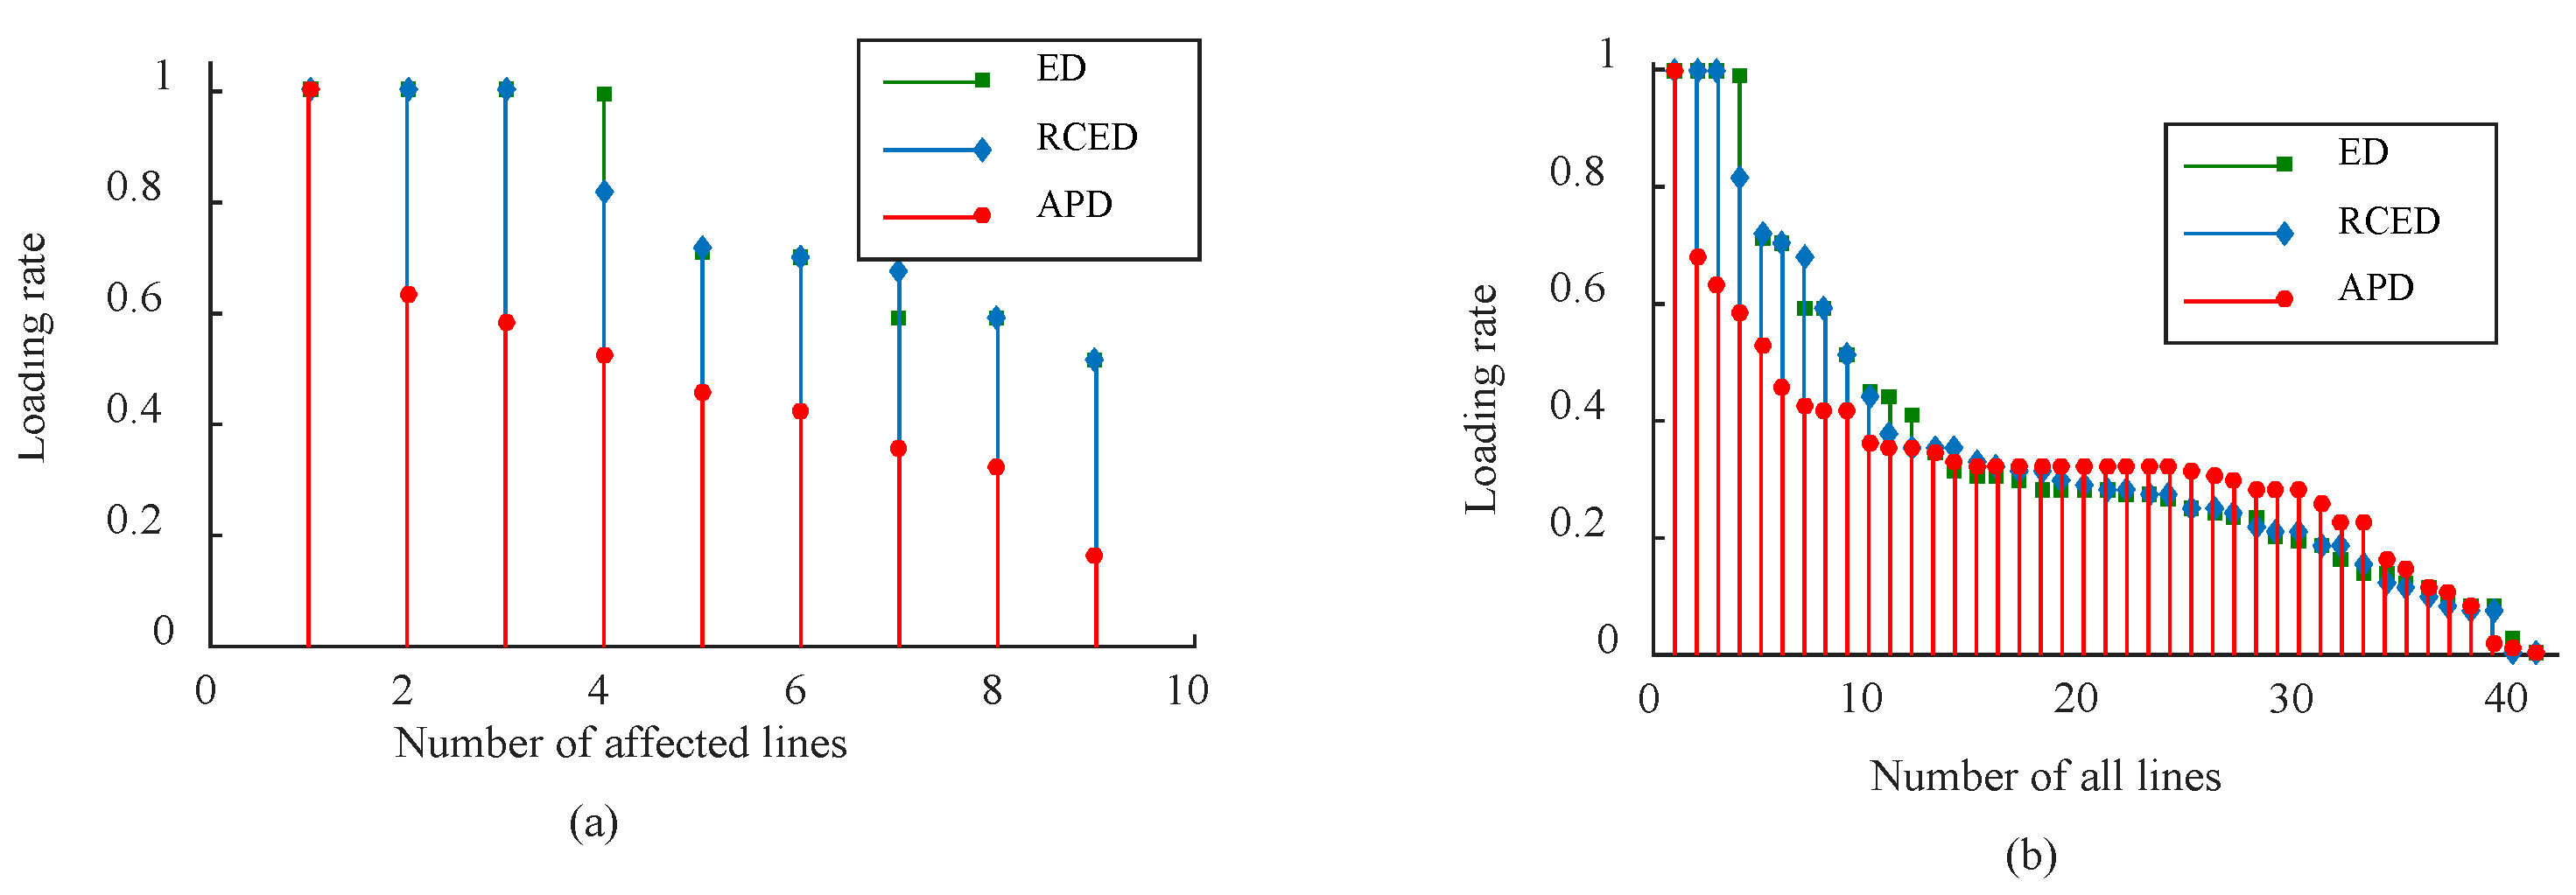
3.1.1. Case 1
3.1.2. Case 2
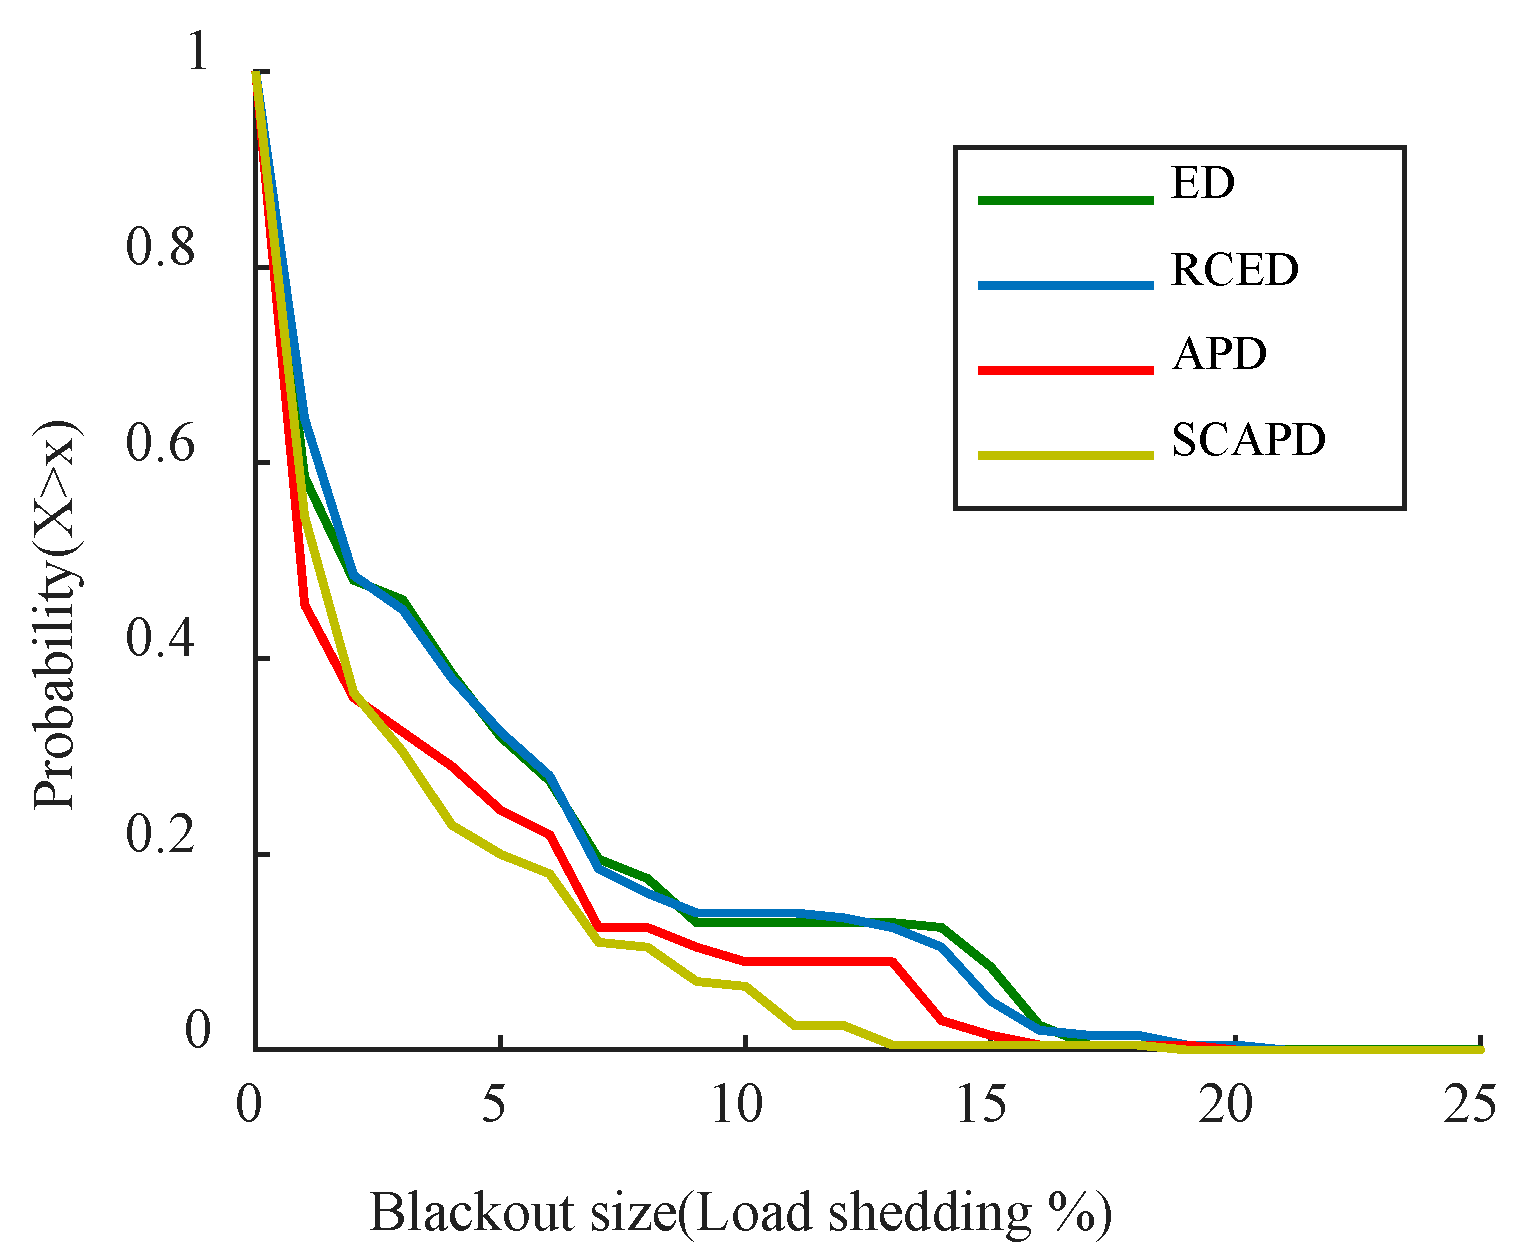
3.1.3. Case 3
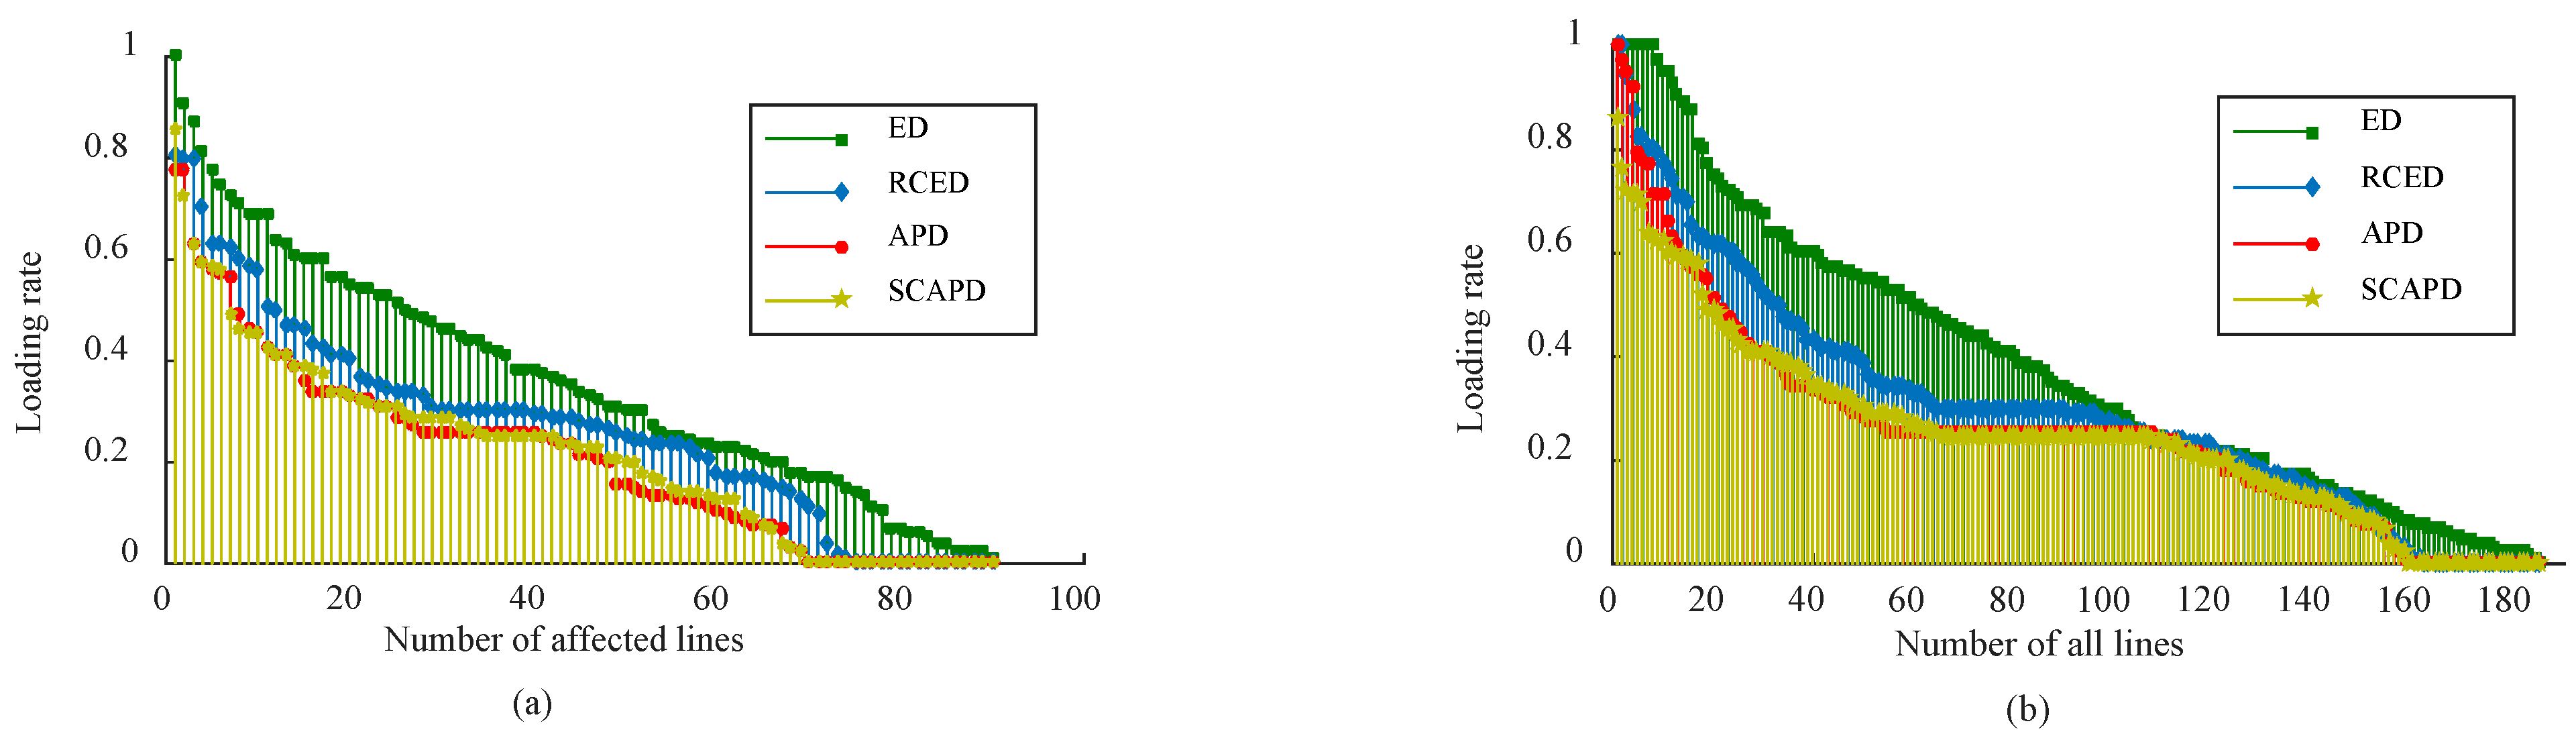
3.2. IEEE 118-Bus and Polish 2383-Bus Systems
4. Discussions
5. Conclusions
- By controlling series compensation devices to adjust the impedance of transmission lines, the proposed augmented power dispatch model can avoid some lines from taking excessive loads, especially those lines affected by extreme weather events.
- The reduction of power flow on lines can reduce the possibility of overload cascade faults, thus reducing load shedding under extreme weather events and improving the resilience of the power system.
- The proposed N-1-1 security criteria have an impact on mitigating the further propagation of N-1 contingency cases and reducing the risk of overload cascade failures.
- The proposed iterative contingency assessment process enables us to solve the security-constrained power dispatch problem iteratively, reducing the problem size and computation time.
Author Contributions
Funding
Institutional Review Board Statement
Informed Consent Statement
Data Availability Statement
Conflicts of Interest
Appendix A

| U | Bus No. | Unit Cost Coefficients | Pmax (MW) | Pmin (MW) | ||
|---|---|---|---|---|---|---|
| a (MBtu) | b (MBtu/MW) | c (MBtu/MW2) | ||||
| G1 | 1 | 0 | 2.0000 | 0.0200 | 120 | 0 |
| G2 | 2 | 0 | 1.7500 | 0.0175 | 120 | 0 |
| G3 | 22 | 0 | 1.0000 | 0.0625 | 75 | 0 |
| G4 | 27 | 0 | 3.2500 | 0.0083 | 82.5 | 0 |
| G5 | 23 | 0 | 3.0000 | 0.0250 | 45 | 0 |
| G6 | 13 | 0 | 3.0000 | 0.0250 | 60 | 0 |
| Bus No. | d(MW) | Bus No. | d(MW) | Bus No. | d(MW) | Bus No. | d(MW) |
|---|---|---|---|---|---|---|---|
| 1 | 0 | 9 | 0 | 17 | 11.7 | 25 | 0 |
| 2 | 28.21 | 10 | 7.54 | 18 | 4.16 | 26 | 4.55 |
| 3 | 3.12 | 11 | 0 | 19 | 12.35 | 27 | 0 |
| 4 | 9.88 | 12 | 14.56 | 20 | 2.86 | 28 | 0 |
| 5 | 0 | 13 | 0 | 21 | 22.75 | 29 | 3.12 |
| 6 | 0 | 14 | 8.06 | 22 | 0 | 30 | 13.78 |
| 7 | 29.64 | 15 | 10.66 | 23 | 4.16 | ||
| 8 | 39 | 16 | 4.55 | 24 | 11.31 |
| Line No. | From Bus | To Bus | X (pu) | Flow Limit (MW) | Line No. | From Bus | To Bus | X (pu) | Flow Limit (MW) |
|---|---|---|---|---|---|---|---|---|---|
| 1 | 1 | 2 | 0.06 | 123.5 | 22 | 15 | 18 | 0.22 | 15.2 |
| 2 | 1 | 3 | 0.19 | 123.5 | 23 | 18 | 19 | 0.13 | 15.2 |
| 3 | 2 | 4 | 0.17 | 61.75 | 24 | 19 | 20 | 0.07 | 30.4 |
| 4 | 3 | 4 | 0.04 | 123.5 | 25 | 10 | 20 | 0.21 | 30.4 |
| 5 | 2 | 5 | 0.2 | 123.5 | 26 | 10 | 17 | 0.08 | 30.4 |
| 6 | 2 | 6 | 0.18 | 61.75 | 27 | 10 | 21 | 0.07 | 30.4 |
| 7 | 4 | 6 | 0.04 | 85.5 | 28 | 10 | 22 | 0.15 | 30.4 |
| 8 | 5 | 7 | 0.12 | 66.5 | 29 | 21 | 22 | 0.02 | 30.4 |
| 9 | 6 | 7 | 0.08 | 123.5 | 30 | 15 | 23 | 0.2 | 15.2 |
| 10 | 6 | 8 | 0.04 | 30.4 | 31 | 22 | 24 | 0.18 | 15.2 |
| 11 | 6 | 9 | 0.21 | 61.75 | 32 | 23 | 24 | 0.27 | 15.2 |
| 12 | 6 | 10 | 0.56 | 30.4 | 33 | 24 | 25 | 0.33 | 15.2 |
| 13 | 9 | 11 | 0.21 | 61.75 | 34 | 25 | 26 | 0.38 | 15.2 |
| 14 | 9 | 10 | 0.11 | 61.75 | 35 | 25 | 27 | 0.21 | 15.2 |
| 15 | 4 | 12 | 0.26 | 61.75 | 36 | 28 | 27 | 0.4 | 61.75 |
| 16 | 12 | 13 | 0.14 | 61.75 | 37 | 27 | 29 | 0.42 | 15.2 |
| 17 | 12 | 14 | 0.26 | 30.4 | 38 | 27 | 30 | 0.6 | 15.2 |
| 18 | 12 | 15 | 0.13 | 30.4 | 39 | 29 | 30 | 0.45 | 15.2 |
| 19 | 12 | 16 | 0.2 | 30.4 | 40 | 8 | 28 | 0.2 | 30.4 |
| 20 | 14 | 15 | 0.2 | 15.2 | 41 | 6 | 28 | 0.06 | 30.4 |
| 21 | 16 | 17 | 0.19 | 15.2 |
| Unit | Bus No. | Unit Cost Coefficients | Pmax (MW) | Pmin (MW) | U | Bus No. | Unit Cost Coefficients | Pmax (MW) | Pmin (MW) | ||||
|---|---|---|---|---|---|---|---|---|---|---|---|---|---|
| a (MBtu) | b (MBtu/MW) | c (MBtu/MW2) | a (MBtu) | b (MBtu/MW) | c (MBtu/MW2) | ||||||||
| 1 | 1 | 0 | 40 | 0.010 | 300 | 0 | 28 | 65 | 0 | 20 | 0.026 | 1473 | 0 |
| 2 | 4 | 0 | 40 | 0.010 | 300 | 0 | 29 | 66 | 0 | 20 | 0.026 | 1476 | 0 |
| 3 | 6 | 0 | 40 | 0.010 | 300 | 0 | 30 | 69 | 0 | 20 | 0.019 | 2415.6 | 0 |
| 4 | 8 | 0 | 40 | 0.010 | 300 | 0 | 31 | 70 | 0 | 40 | 0.010 | 300 | 0 |
| 5 | 10 | 0 | 20 | 0.022 | 1650 | 0 | 32 | 72 | 0 | 40 | 0.010 | 300 | 0 |
| 6 | 12 | 0 | 20 | 0.118 | 555 | 0 | 33 | 73 | 0 | 40 | 0.010 | 300 | 0 |
| 7 | 15 | 0 | 40 | 0.010 | 300 | 0 | 34 | 74 | 0 | 40 | 0.010 | 300 | 0 |
| 8 | 18 | 0 | 40 | 0.010 | 300 | 0 | 35 | 76 | 0 | 40 | 0.010 | 300 | 0 |
| 9 | 19 | 0 | 40 | 0.010 | 300 | 0 | 36 | 77 | 0 | 40 | 0.010 | 300 | 0 |
| 10 | 24 | 0 | 40 | 0.010 | 300 | 0 | 37 | 80 | 0 | 20 | 0.021 | 1731 | 0 |
| 11 | 25 | 0 | 20 | 0.045 | 960 | 0 | 38 | 85 | 0 | 40 | 0.010 | 300 | 0 |
| 12 | 26 | 0 | 20 | 0.032 | 1242 | 0 | 39 | 87 | 0 | 20 | 2.500 | 312 | 0 |
| 13 | 27 | 0 | 40 | 0.010 | 300 | 0 | 40 | 89 | 0 | 20 | 0.016 | 2121 | 0 |
| 14 | 31 | 0 | 20 | 1.429 | 321 | 0 | 41 | 90 | 0 | 40 | 0.010 | 300 | 0 |
| 15 | 32 | 0 | 40 | 0.010 | 300 | 0 | 42 | 91 | 0 | 40 | 0.010 | 300 | 0 |
| 16 | 34 | 0 | 40 | 0.010 | 300 | 0 | 43 | 92 | 0 | 40 | 0.010 | 300 | 0 |
| 17 | 36 | 0 | 40 | 0.010 | 300 | 0 | 44 | 99 | 0 | 40 | 0.010 | 300 | 0 |
| 18 | 40 | 0 | 40 | 0.010 | 300 | 0 | 45 | 100 | 0 | 20 | 0.040 | 1056 | 0 |
| 19 | 42 | 0 | 40 | 0.010 | 300 | 0 | 46 | 103 | 0 | 20 | 0.250 | 420 | 0 |
| 20 | 46 | 0 | 20 | 0.526 | 357 | 0 | 47 | 104 | 0 | 40 | 0.010 | 300 | 0 |
| 21 | 49 | 0 | 20 | 0.049 | 912 | 0 | 48 | 105 | 0 | 40 | 0.010 | 300 | 0 |
| 22 | 54 | 0 | 20 | 0.208 | 444 | 0 | 49 | 107 | 0 | 40 | 0.010 | 300 | 0 |
| 23 | 55 | 0 | 40 | 0.010 | 300 | 0 | 50 | 110 | 0 | 40 | 0.010 | 300 | 0 |
| 24 | 56 | 0 | 40 | 0.010 | 300 | 0 | 51 | 111 | 0 | 20 | 0.278 | 408 | 0 |
| 25 | 59 | 0 | 20 | 0.065 | 765 | 0 | 52 | 112 | 0 | 40 | 0.010 | 300 | 0 |
| 26 | 61 | 0 | 20 | 0.063 | 780 | 0 | 53 | 113 | 0 | 40 | 0.010 | 300 | 0 |
| 27 | 62 | 0 | 40 | 0.010 | 300 | 0 | 54 | 116 | 0 | 40 | 0.010 | 300 | 0 |
| Bus No. | D (MW) | Bus No. | D (MW) | Bus No. | D (MW) | Bus No. | D (MW) |
|---|---|---|---|---|---|---|---|
| 1 | 153 | 31 | 129 | 61 | 0 | 91 | 30 |
| 2 | 60 | 32 | 177 | 62 | 231 | 92 | 195 |
| 3 | 117 | 33 | 69 | 63 | 0 | 93 | 36 |
| 4 | 117 | 34 | 177 | 64 | 0 | 94 | 90 |
| 5 | 0 | 35 | 99 | 65 | 0 | 95 | 126 |
| 6 | 156 | 36 | 93 | 66 | 117 | 96 | 114 |
| 7 | 57 | 37 | 0 | 67 | 84 | 97 | 45 |
| 8 | 84 | 38 | 0 | 68 | 0 | 98 | 102 |
| 9 | 0 | 39 | 81 | 69 | 0 | 99 | 126 |
| 10 | 0 | 40 | 198 | 70 | 198 | 100 | 111 |
| 11 | 210 | 41 | 111 | 71 | 0 | 101 | 66 |
| 12 | 141 | 42 | 288 | 72 | 36 | 102 | 15 |
| 13 | 102 | 43 | 54 | 73 | 18 | 103 | 69 |
| 14 | 42 | 44 | 48 | 74 | 204 | 104 | 114 |
| 15 | 270 | 45 | 159 | 75 | 141 | 105 | 93 |
| 16 | 75 | 46 | 84 | 76 | 204 | 106 | 129 |
| 17 | 33 | 47 | 102 | 77 | 183 | 107 | 150 |
| 18 | 180 | 48 | 60 | 78 | 213 | 108 | 6 |
| 19 | 135 | 49 | 261 | 79 | 117 | 109 | 24 |
| 20 | 54 | 50 | 51 | 80 | 390 | 110 | 117 |
| 21 | 42 | 51 | 51 | 81 | 0 | 111 | 0 |
| 22 | 30 | 52 | 54 | 82 | 162 | 112 | 204 |
| 23 | 21 | 53 | 69 | 83 | 60 | 113 | 18 |
| 24 | 39 | 54 | 339 | 84 | 33 | 114 | 24 |
| 25 | 0 | 55 | 189 | 85 | 72 | 115 | 66 |
| 26 | 0 | 56 | 252 | 86 | 63 | 116 | 552 |
| 27 | 213 | 57 | 36 | 87 | 0 | 117 | 60 |
| 28 | 51 | 58 | 36 | 88 | 144 | 118 | 99 |
| 29 | 72 | 59 | 831 | 89 | 0 | ||
| 30 | 0 | 60 | 234 | 90 | 489 |
| Line No. | From Bus | To Bus | X (pu) | Flow Limit (MW) | Line No. | From Bus | To Bus | X (pu) | Flow Limit (MW) |
|---|---|---|---|---|---|---|---|---|---|
| 1 | 1 | 2 | 0.0999 | 176 | 94 | 55 | 56 | 0.0151 | 176 |
| 2 | 1 | 3 | 0.0424 | 176 | 95 | 55 | 59 | 0.2158 | 176 |
| 3 | 2 | 12 | 0.0616 | 176 | 96 | 56 | 57 | 0.0966 | 176 |
| 4 | 3 | 5 | 0.108 | 176 | 97 | 56 | 58 | 0.0966 | 176 |
| 5 | 3 | 12 | 0.16 | 176 | 98 | 56 | 59 | 0.251 | 176 |
| 6 | 4 | 5 | 0.00798 | 352 | 99 | 56 | 59 | 0.239 | 176 |
| 7 | 4 | 11 | 0.0688 | 176 | 100 | 59 | 60 | 0.145 | 176 |
| 8 | 5 | 6 | 0.054 | 176 | 101 | 59 | 61 | 0.15 | 176 |
| 9 | 5 | 11 | 0.0682 | 176 | 102 | 60 | 61 | 0.0135 | 352 |
| 10 | 6 | 7 | 0.0208 | 176 | 103 | 60 | 62 | 0.0561 | 176 |
| 11 | 7 | 12 | 0.034 | 176 | 104 | 61 | 62 | 0.0376 | 176 |
| 12 | 8 | 9 | 0.0305 | 880 | 105 | 62 | 66 | 0.218 | 176 |
| 13 | 8 | 5 | 0.0267 | 704 | 106 | 62 | 67 | 0.117 | 176 |
| 14 | 8 | 30 | 0.0504 | 176 | 107 | 63 | 59 | 0.0386 | 352 |
| 15 | 9 | 10 | 0.0322 | 880 | 108 | 63 | 64 | 0.02 | 352 |
| 16 | 11 | 12 | 0.0196 | 176 | 109 | 64 | 61 | 0.0268 | 176 |
| 17 | 11 | 13 | 0.0731 | 176 | 110 | 64 | 65 | 0.0302 | 352 |
| 18 | 12 | 15 | 0.0707 | 176 | 111 | 65 | 66 | 0.037 | 176 |
| 19 | 12 | 17 | 0.0834 | 176 | 112 | 65 | 68 | 0.016 | 176 |
| 20 | 12 | 117 | 0.14 | 176 | 113 | 66 | 67 | 0.1015 | 176 |
| 21 | 13 | 15 | 0.2444 | 176 | 114 | 68 | 69 | 0.037 | 352 |
| 22 | 14 | 15 | 0.195 | 176 | 115 | 68 | 81 | 0.0202 | 176 |
| 23 | 15 | 17 | 0.0437 | 352 | 116 | 68 | 116 | 0.00405 | 352 |
| 24 | 15 | 19 | 0.0394 | 176 | 117 | 69 | 70 | 0.127 | 352 |
| 25 | 15 | 33 | 0.1244 | 176 | 118 | 69 | 75 | 0.122 | 352 |
| 26 | 16 | 17 | 0.1801 | 176 | 119 | 69 | 77 | 0.101 | 176 |
| 27 | 17 | 19 | 0.0505 | 176 | 120 | 70 | 71 | 0.0355 | 176 |
| 28 | 17 | 31 | 0.1563 | 176 | 121 | 70 | 74 | 0.1323 | 176 |
| 29 | 17 | 113 | 0.0301 | 176 | 122 | 70 | 75 | 0.141 | 176 |
| 30 | 18 | 19 | 0.0493 | 176 | 123 | 71 | 72 | 0.18 | 176 |
| 31 | 19 | 20 | 0.117 | 176 | 124 | 71 | 73 | 0.0454 | 176 |
| 32 | 19 | 34 | 0.247 | 176 | 125 | 74 | 75 | 0.0406 | 176 |
| 33 | 20 | 21 | 0.0849 | 176 | 126 | 75 | 77 | 0.1999 | 176 |
| 34 | 21 | 22 | 0.097 | 176 | 127 | 75 | 118 | 0.0481 | 176 |
| 35 | 22 | 23 | 0.159 | 176 | 128 | 76 | 77 | 0.148 | 176 |
| 36 | 23 | 24 | 0.0492 | 176 | 129 | 76 | 118 | 0.0544 | 176 |
| 37 | 23 | 25 | 0.08 | 352 | 130 | 77 | 78 | 0.0124 | 176 |
| 38 | 23 | 32 | 0.1153 | 176 | 131 | 77 | 80 | 0.0485 | 352 |
| 39 | 24 | 70 | 0.4115 | 176 | 132 | 77 | 80 | 0.105 | 176 |
| 40 | 24 | 72 | 0.196 | 176 | 133 | 77 | 82 | 0.0853 | 176 |
| 41 | 25 | 27 | 0.163 | 352 | 134 | 78 | 79 | 0.0244 | 176 |
| 42 | 26 | 25 | 0.0382 | 176 | 135 | 79 | 80 | 0.0704 | 176 |
| 43 | 26 | 30 | 0.086 | 528 | 136 | 80 | 96 | 0.182 | 176 |
| 44 | 27 | 28 | 0.0855 | 176 | 137 | 80 | 97 | 0.0934 | 176 |
| 45 | 27 | 32 | 0.0755 | 176 | 138 | 80 | 98 | 0.108 | 176 |
| 46 | 27 | 115 | 0.0741 | 176 | 139 | 80 | 99 | 0.206 | 176 |
| 47 | 28 | 31 | 0.0943 | 176 | 140 | 81 | 80 | 0.037 | 176 |
| 48 | 29 | 31 | 0.0331 | 176 | 141 | 82 | 83 | 0.03665 | 176 |
| 49 | 30 | 17 | 0.0388 | 528 | 142 | 82 | 96 | 0.053 | 176 |
| 50 | 30 | 38 | 0.054 | 176 | 143 | 83 | 84 | 0.132 | 176 |
| 51 | 31 | 32 | 0.0985 | 176 | 144 | 83 | 85 | 0.148 | 176 |
| 52 | 32 | 113 | 0.203 | 176 | 145 | 84 | 85 | 0.0641 | 176 |
| 53 | 32 | 114 | 0.0612 | 176 | 146 | 85 | 86 | 0.123 | 176 |
| 54 | 33 | 37 | 0.142 | 176 | 147 | 85 | 88 | 0.102 | 176 |
| 55 | 34 | 36 | 0.0268 | 176 | 148 | 85 | 89 | 0.173 | 176 |
| 56 | 34 | 37 | 0.0094 | 352 | 149 | 86 | 87 | 0.2074 | 176 |
| 57 | 34 | 43 | 0.1681 | 176 | 150 | 88 | 89 | 0.0712 | 352 |
| 58 | 35 | 36 | 0.0102 | 176 | 151 | 89 | 90 | 0.032 | 528 |
| 59 | 35 | 37 | 0.0497 | 176 | 152 | 89 | 91 | 0.032 | 176 |
| 60 | 37 | 39 | 0.106 | 176 | 153 | 89 | 92 | 0.0505 | 176 |
| 61 | 37 | 40 | 0.168 | 176 | 154 | 90 | 91 | 0.0505 | 528 |
| 62 | 38 | 37 | 0.0375 | 528 | 155 | 91 | 92 | 0.1272 | 176 |
| 63 | 38 | 65 | 0.0986 | 352 | 156 | 92 | 93 | 0.032 | 176 |
| 64 | 39 | 40 | 0.0605 | 176 | 157 | 92 | 94 | 0.158 | 176 |
| 65 | 40 | 41 | 0.0487 | 176 | 158 | 92 | 100 | 0.295 | 176 |
| 66 | 40 | 42 | 0.183 | 176 | 159 | 92 | 102 | 0.0559 | 176 |
| 67 | 41 | 42 | 0.135 | 176 | 160 | 93 | 94 | 0.0732 | 176 |
| 68 | 42 | 49 | 0.323 | 176 | 161 | 94 | 95 | 0.0434 | 176 |
| 69 | 42 | 49 | 0.323 | 176 | 162 | 94 | 96 | 0.0869 | 176 |
| 70 | 43 | 44 | 0.2454 | 176 | 163 | 94 | 100 | 0.058 | 176 |
| 71 | 44 | 45 | 0.0901 | 176 | 164 | 95 | 96 | 0.0547 | 176 |
| 72 | 45 | 46 | 0.1356 | 176 | 165 | 96 | 97 | 0.0885 | 176 |
| 73 | 45 | 49 | 0.186 | 176 | 166 | 98 | 100 | 0.179 | 176 |
| 74 | 46 | 47 | 0.127 | 176 | 167 | 99 | 100 | 0.0813 | 176 |
| 75 | 46 | 48 | 0.189 | 176 | 168 | 100 | 101 | 0.1262 | 176 |
| 76 | 47 | 49 | 0.0625 | 176 | 169 | 100 | 103 | 0.0525 | 352 |
| 77 | 47 | 69 | 0.2778 | 176 | 170 | 100 | 104 | 0.204 | 176 |
| 78 | 48 | 49 | 0.0505 | 176 | 171 | 100 | 106 | 0.229 | 176 |
| 79 | 49 | 50 | 0.0752 | 176 | 172 | 101 | 102 | 0.112 | 176 |
| 80 | 49 | 51 | 0.137 | 176 | 173 | 103 | 104 | 0.1584 | 176 |
| 81 | 49 | 54 | 0.289 | 176 | 174 | 103 | 105 | 0.1625 | 176 |
| 82 | 49 | 54 | 0.291 | 176 | 175 | 103 | 110 | 0.1813 | 176 |
| 83 | 49 | 66 | 0.0919 | 352 | 176 | 104 | 105 | 0.0378 | 176 |
| 84 | 49 | 66 | 0.0919 | 352 | 177 | 105 | 106 | 0.0547 | 176 |
| 85 | 49 | 69 | 0.324 | 176 | 178 | 105 | 107 | 0.183 | 176 |
| 86 | 50 | 57 | 0.134 | 176 | 179 | 105 | 108 | 0.0703 | 176 |
| 87 | 51 | 52 | 0.0588 | 176 | 180 | 106 | 107 | 0.183 | 176 |
| 88 | 51 | 58 | 0.0719 | 176 | 181 | 108 | 109 | 0.0288 | 176 |
| 89 | 52 | 53 | 0.1635 | 176 | 182 | 109 | 110 | 0.0762 | 176 |
| 90 | 53 | 54 | 0.122 | 176 | 183 | 110 | 111 | 0.0755 | 176 |
| 91 | 54 | 55 | 0.0707 | 176 | 184 | 110 | 112 | 0.064 | 176 |
| 92 | 54 | 56 | 0.00955 | 176 | 185 | 114 | 115 | 0.0104 | 176 |
| 93 | 54 | 59 | 0.2293 | 176 |
References
- Jufri, F.; Widiputra, V.; Jung, J. State-of-the-art review on power grid resilience to extreme weather events: Definitions, frameworks, quantitative assessment methodologies, and enhancement strategies. Appl. Energy 2019, 239, 1049–1065. [Google Scholar] [CrossRef]
- Vaccaro, A.; Pisica, I.; Lai, L.L.; Zobaa, A.F. A review of enabling methodologies for information processing in smart grids. Int. J. Electr. Power Energy Syst. 2019, 107, 516–522. [Google Scholar] [CrossRef]
- Lai, C.S.; Jia, Y.; Dong, Z.; Wang, D.; Tao, Y.; Lai, Q.H.; Wong, R.T.K.; Zobaa, A.F.; Wu, R.; Lai, L.L. A review of technical standards for smart cities. Clean Technol. 2020, 2, 19. [Google Scholar] [CrossRef]
- Bie, Z.; Lin, Y.; Li, G.; Li, F. Battling the extreme: A study on the power system resilience. Proc. IEEE 2017, 105, 1253–1266. [Google Scholar] [CrossRef]
- Xu, Z.; Lai, L.L.; Wong K., P.; Pinson, P.; Li, F.X. Guest editorial-special section on emerging informatics for risk hedging and decision making in smart grids. IEEE Trans. Ind. Inform. 2017, 13, 2507–2510. [Google Scholar] [CrossRef]
- Panteli, M.; Mancarella, P. The grid: Stronger, bigger, and smarter? Presenting a conceptual framework of power system resilience. IEEE Power Energy Mag. 2015, 13, 58–66. [Google Scholar] [CrossRef]
- Zhang, G.; Zhang, F.; Zhang, X.; Wu, Q.; Ke, M. A multi-disaster-scenario distributionally robust planning model for enhancing the resilience of distribution systems. Int. J. Electr. Power Energy Syst. 2020, 122, 106161. [Google Scholar] [CrossRef]
- Pepiciello, A.; Vaccaro, A.; Lai, L.L. An interval mathematic-based methodology for reliable resilience analysis of power systems in the presence of data uncertainties. Energies 2020, 13, 6632. [Google Scholar] [CrossRef]
- Tari, A.N.; Sepasian, M.S.; Kenari, M.T. Resilience assessment and improvement of distribution networks against extreme weather events. Int. J. Electr. Power Energy Syst. 2021, 125, 106414. [Google Scholar] [CrossRef]
- Panteli, M.; Trakas, D.N.; Mancarella, P.; Hatziargyriou, N.D. Power systems resilience assessment: Hardening and smart operational enhancement strategies. Proc. IEEE 2017, 105, 1202–1213. [Google Scholar] [CrossRef] [Green Version]
- Mahzarnia, M.; Moghaddam, M.P.; Baboli, P.T.; Siano, P. A review of the measures to enhance power systems resilience. IEEE Syst. J. 2020, 14, 4059–4070. [Google Scholar] [CrossRef]
- Arab, A.; Khodaei, A.; Khator, S.K.; Ding, K.; Emesih, V.A.; Han, Z. Stochastic pre-hurricane restoration planning for electric power systems infrastructure. IEEE Trans. Smart Grid 2015, 6, 1046–1054. [Google Scholar] [CrossRef]
- Eskandarpour, R.; Edwards, G.; Khodaei, A. Resilience-constrained unit commitment considering the impact of microgrids. In Proceedings of the 2016 North American Power Symposium (NAPS), Denver, CO, USA, 18–20 September 2016; pp. 1–5. [Google Scholar]
- Xie, C.; Wang, D.; Lai, C.S.; Wu, R.; Wu, X.; Lai, L.L. Optimal sizing of battery energy storage system in smart microgrid considering virtual energy storage system and high photovoltaic penetration. J. Clean. Prod. 2021, 281, 125308. [Google Scholar] [CrossRef]
- Sahraei-Ardakani, M.; Ou, G. Day-ahead preventive scheduling of power systems during natural hazards via stochastic optimization. In Proceedings of the 2017 IEEE Power & Energy Society General Meeting, Chicago, IL, USA, 16–20 July 2017; p. 1. [Google Scholar]
- Khaloie, H.; Vallee, F.; Lai, C.S.; Toubeau, J.F.; Hatziargyriou, N.D. Day-ahead and intraday dispatch of an integrated biomass-concentrated solar system: A multi-objective risk-controlling approach. IEEE Trans. Power Syst. 2021. [Google Scholar] [CrossRef]
- Wang, C.; Hou, Y.; Qiu, F.; Lei, S.; Liu, K. Resilience enhancement with sequentially proactive operation strategies. IEEE Trans. Power Syst. 2017, 32, 2847–2857. [Google Scholar] [CrossRef] [Green Version]
- Wang, Y.; Huang, L.; Shahidehpour, M.; Lai, L.L.; Yuan, H.; Xu, F.Y. Resilience-constrained hourly unit commitment in electricity grids. IEEE Trans. Power Syst. 2018, 33, 5604–5614. [Google Scholar] [CrossRef]
- Trakas, D.N.; Hatziargyriou, N.D. Resilience constrained day-ahead unit commitment under extreme weather events. IEEE Trans. Power Syst. 2020, 35, 1242–1253. [Google Scholar] [CrossRef]
- Jie, C.; Thorp, J.S.; Dobson, I. Cascading dynamics and mitigation assessment in power system disturbances via a hidden failure model. Int. J. Electr. Power Energy Syst. 2005, 27, 318–326. [Google Scholar]
- Tejada-Arango, D.A.; Sánchez-Martın, P.; Ramos, A. Security constrained unit commitment using line outage distribution factors. IEEE Trans. Power Syst. 2018, 33, 329–337. [Google Scholar] [CrossRef]
- Bao, Z.J.; Cao, Y.J.; Wang, G.Z.; Ding, L.J. Analysis of cascading failure in electric grid based on power flow entropy. Phys. Lett. A 2009, 373, 3032–3040. [Google Scholar] [CrossRef]
- Zhang, S.; Liu, C.C.; Gu, X.; Wang, T. Optimal transmission line switching incorporating dynamic line ratings. In Proceedings of the 2017 IEEE PES Innovative Smart Grid Technologies Conference Europe (ISGT-Europe), Torino, Italy, 26–29 September 2017; pp. 1–5. [Google Scholar]
- Wang, Y.; Huang, L.; Shahidehpour, M.; Lai, L.L.; Zhou, Y. Impact of cascading and common-cause outages on resilience-constrained optimal economic operation of power systems. IEEE Trans. Smart Grid 2020, 11, 590–601. [Google Scholar] [CrossRef]
- Ding, T.; Bo, R.; Li, F.; Sun, H. Optimal power flow with the consideration of flexible transmission line impedance. IEEE Trans. Power Syst. 2016, 31, 1655–1656. [Google Scholar] [CrossRef]
- Singh, A.K.; Pal, B.C. Dynamic Estimation and Control of Power Systems; Academic Press: Cambridge, MA, USA, 2018; p. 5. [Google Scholar]
- Sahraei-Ardakani, M.; Hedman, K.W. Day-ahead corrective adjustment of FACTS reactance: A linear programming approach. IEEE Trans. Power Syst. 2016, 31, 2867–2875. [Google Scholar] [CrossRef]
- Sahraei-Ardakani, M.; Hedman, K.W. Computationally efficient adjustment of FACTS set points in DC optimal power flow with shift factor structure. IEEE Trans. Power Syst. 2017, 32, 1733–1740. [Google Scholar] [CrossRef]
- Jia, Y.; Xu, Z.; Lai, L.L.; Wong, K.P. Risk-based power system security analysis considering cascading outages. IEEE Trans. Ind. Informat. 2016, 12, 872–882. [Google Scholar] [CrossRef]
- Lai, L.L.; Ma, J.T.; Yokoyama, R.; Zhao, M. Improved genetic algorithms for optimal power flow under both normal & contingent operation states. Int. J. Electr. Power Energy Syst. 1997, 19, 287–292. [Google Scholar]
- Liu, M.; Gross, G. Role of distribution factors in congestion revenue rights applications. IEEE Trans. Power Syst. 2004, 19, 802–810. [Google Scholar] [CrossRef]
- Guo, J.; Fu, Y.; Li, Z.; Shahidehpour, M. Direct calculation of line outage distribution factors. IEEE Trans. Power Syst. 2009, 24, 1633–1634. [Google Scholar]
- Guler, T.; Gross, G.; Liu, M. Generalized line outage distribution factors. IEEE Trans. Power Syst. 2007, 22, 879–881. [Google Scholar] [CrossRef]
- Fu, Y.; Shahidehpour, M.; Li, Z. AC contingency dispatch based on security-constrained unit commitment. IEEE Trans. Power Syst. 2006, 21, 897–908. [Google Scholar] [CrossRef]
- Salim, N.A.; Othman, M.M.; Musirin, I.; Serwan, M.S. Cascading collapse assessment considering hidden failure. In Proceedings of the 1st Int Conf Informatics Comput Intell ICI 2011, Bandung, Indonesia, 12–14 December 2011; pp. 318–323. [Google Scholar]


| Model | Cost ($) | Ave. | Ave. | Var. | Max. | Num. | Num. | Num. |
|---|---|---|---|---|---|---|---|---|
| ED | 801.57 | 0.352 | 0.79 | 0.072 | 1 | 4 | 4 | 6 |
| RCED | 826.62 | 0.35 | 0.78 | 0.068 | 1 | 3 | 4 | 7 |
| APD | 819.3 | 0.323 | 0.382 | 0.033 | 1 | 1 | 1 | 3 |
| Models | Cost ($) | Ave. | Var. | Max. | S1 | S2 | S3 |
|---|---|---|---|---|---|---|---|
| ED | 801.5 | 0.352 | 0.072 | 1 | 13 | 59 | 68 |
| APD | 819.3 | 0.323 | 0.033 | 1 | 5 | 21 | 35 |
| SCAPD | 777.1 | 0.313 | 0.029 | 0.77 | 0 | 0 | 0 |
| SCAPD(N-1) | 802.6 | 0.320 | 0.029 | 0.93 | 0 | 2 | 3 |
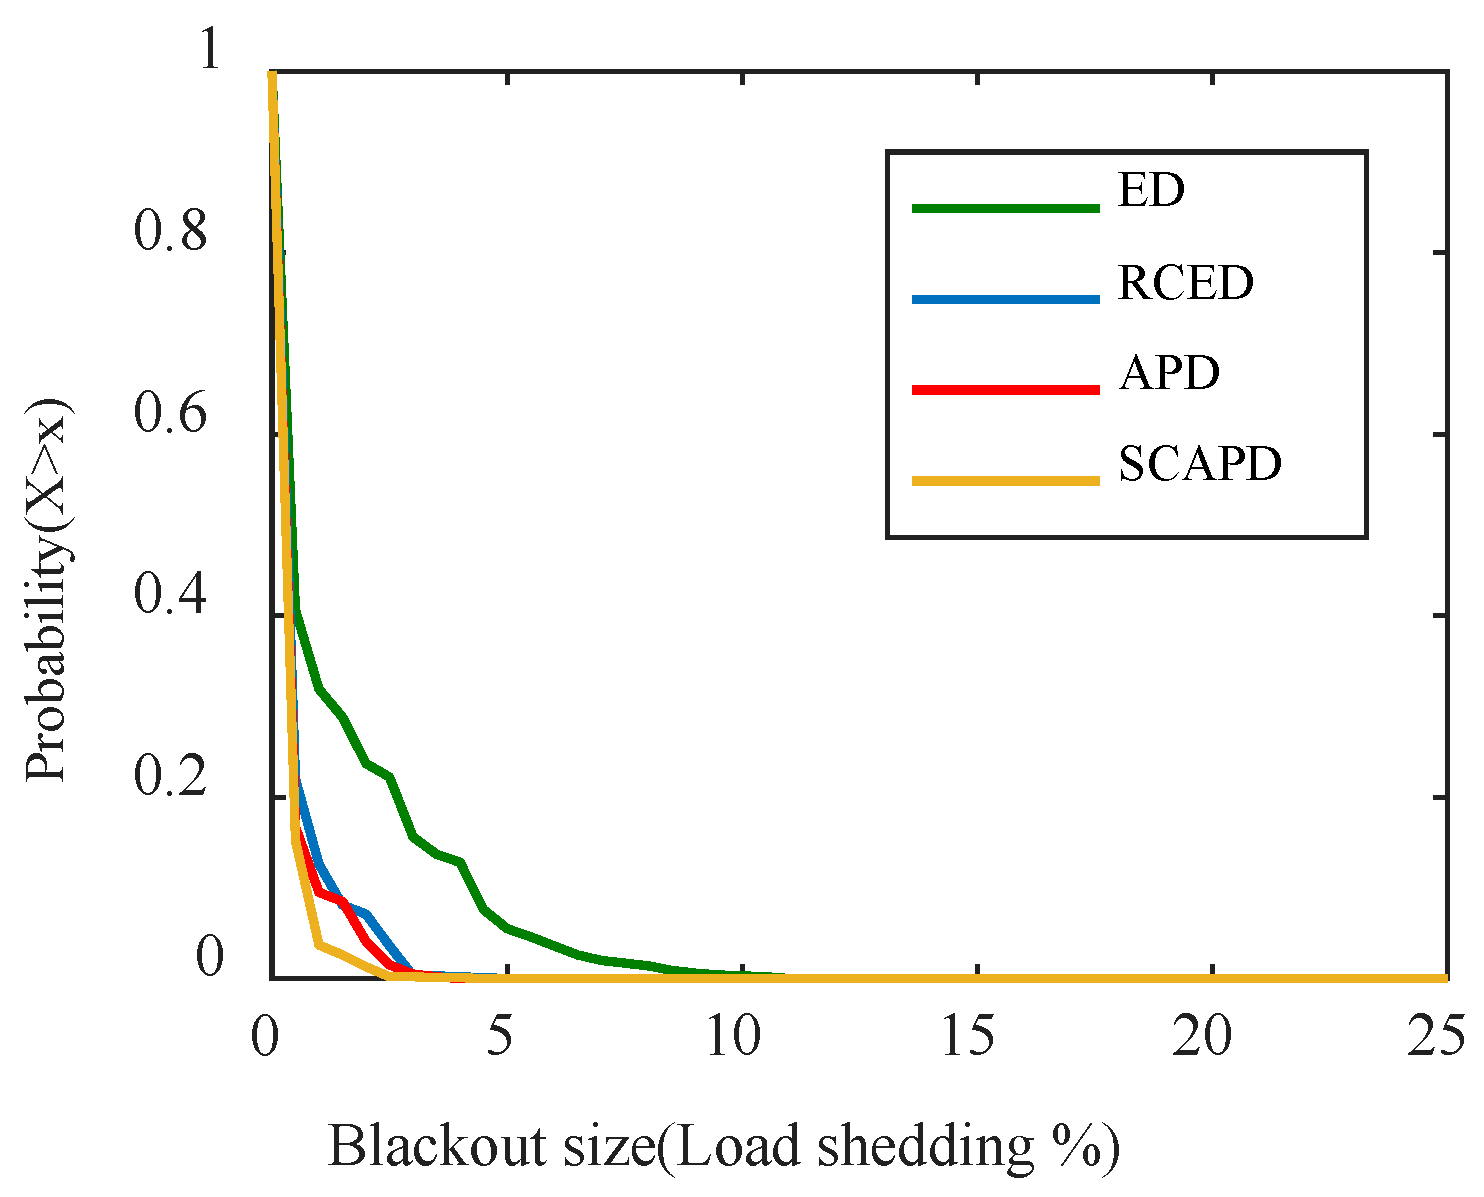
| Models | Max. LS% | Probability (LS% > 15%) | Ave. LS% | Outages Caused by the Event | Outages Caused by Overload |
|---|---|---|---|---|---|
| ED | 19.5% | 0.085 | 4.21% | 1.03 | 2.22 |
| RCED | 20.21% | 0.050 | 4.24% | 1.02 | 2.43 |
| APD | 19.23% | 0.015 | 2.98% | 1.05 | 1.52 |
| SCAPD | 18.07% | 0.005 | 2.57% | 1.03 | 1.05 |
| Iterations | Generation Cost | Number of N-1 Violation Scenarios | Number of N-1-1 Violation Scenarios | Computation Time (s) |
|---|---|---|---|---|
| 0 | 582,259.3 | 10 | 15 | 4.9 |
| 1 | 575,352.5 | 3 | 19 | 4.4 |
| 2 | 563,046.5 | 1 | 3 | 2.1 |
| 3 | 572,850.9 | 0 | 0 | 3.1 |
| Iterations | Generation Cost | Number of N-1 Violation Scenarios | Number of N-1-1 Violation Scenarios | Computation Time (s) |
|---|---|---|---|---|
| 0 | 1,851,036.5 | 65 | 711 | 174.6 |
| 1 | 2,006,177.3 | 5 | 9 | 170.0 |
| 2 | 1,981,281.7 | 6 | 5 | 195.9 |
| 3 | 2,018,414.2 | 0 | 1 | 185.6 |
| 4 | 2,004,039.8 | 0 | 0 | 171.2 |
| Test Systems | Total Iterations | Total Time (s) |
|---|---|---|
| IEEE 30-bus | 3 | 7.8 |
| IEEE 118-bus | 3 | 14.5 |
| Polish 2383-bus | 4 | 897.3 |
| Models | Cost ($) | Ave. | Var. | Max. | Num. | Num. | Num. | S1 | S2 | S3 | Max. LS% | Ave. LS% | Outages Caused by the Event | Outages Caused by Overload |
|---|---|---|---|---|---|---|---|---|---|---|---|---|---|---|
| ED | 489,152.5 | 0.382 | 0.074 | 1 | 8 | 18 | 38 | 44 | 535 | 719 | 10.93% | 1.23% | 2.23 | 9.35 |
| RCED | 556,491.5 | 0.301 | 0.051 | 1 | 2 | 8 | 24 | 15 | 111 | 136 | 4.57% | 0.36% | 2.13 | 2.46 |
| APD | 582,259.3 | 0.257 | 0.041 | 1 | 1 | 4 | 13 | 10 | 57 | 13 | 4.12% | 0.30% | 2.11 | 2.26 |
| SCAPD | 572,850.9 | 0.251 | 0.032 | 0.86 | 0 | 1 | 11 | 0 | 8 | 0 | 3.86% | 0.19% | 2.17 | 1.57 |
Publisher’s Note: MDPI stays neutral with regard to jurisdictional claims in published maps and institutional affiliations. |
© 2021 by the authors. Licensee MDPI, Basel, Switzerland. This article is an open access article distributed under the terms and conditions of the Creative Commons Attribution (CC BY) license (https://creativecommons.org/licenses/by/4.0/).
Share and Cite
Huang, L.; Huang, Z.; Lai, C.S.; Yang, G.; Zhao, Z.; Tong, N.; Wu, X.; Lai, L.L. Augmented Power Dispatch for Resilient Operation through Controllable Series Compensation and N-1-1 Contingency Assessment. Energies 2021, 14, 4756. https://doi.org/10.3390/en14164756
Huang L, Huang Z, Lai CS, Yang G, Zhao Z, Tong N, Wu X, Lai LL. Augmented Power Dispatch for Resilient Operation through Controllable Series Compensation and N-1-1 Contingency Assessment. Energies. 2021; 14(16):4756. https://doi.org/10.3390/en14164756
Chicago/Turabian StyleHuang, Liping, Zhaoxiong Huang, Chun Sing Lai, Guangya Yang, Zhuoli Zhao, Ning Tong, Xiaomei Wu, and Loi Lei Lai. 2021. "Augmented Power Dispatch for Resilient Operation through Controllable Series Compensation and N-1-1 Contingency Assessment" Energies 14, no. 16: 4756. https://doi.org/10.3390/en14164756