
Techno-Economic Planning and Operation of the Microgrid Considering Real-Time Pricing Demand Response Program


Abstract
:1. Introduction
1.1. Motivations
1.2. Literature Review
1.3. Contributions
- Proposing a price-based DR program according to the long-term electricity load consumptions.
- Techno-economic analysis of an off-grid MG considering the price-based DR program to increase the flexibility of the system.
- Considering coordinated planning and operation of the MG under different pricing schemes, as well as concerning the environmental impacts of each scheme.
- Performing a sensitivity analysis on the inflation rate and discount rate to evaluate the corresponding effects on optimization results.
2. Materials and Methods
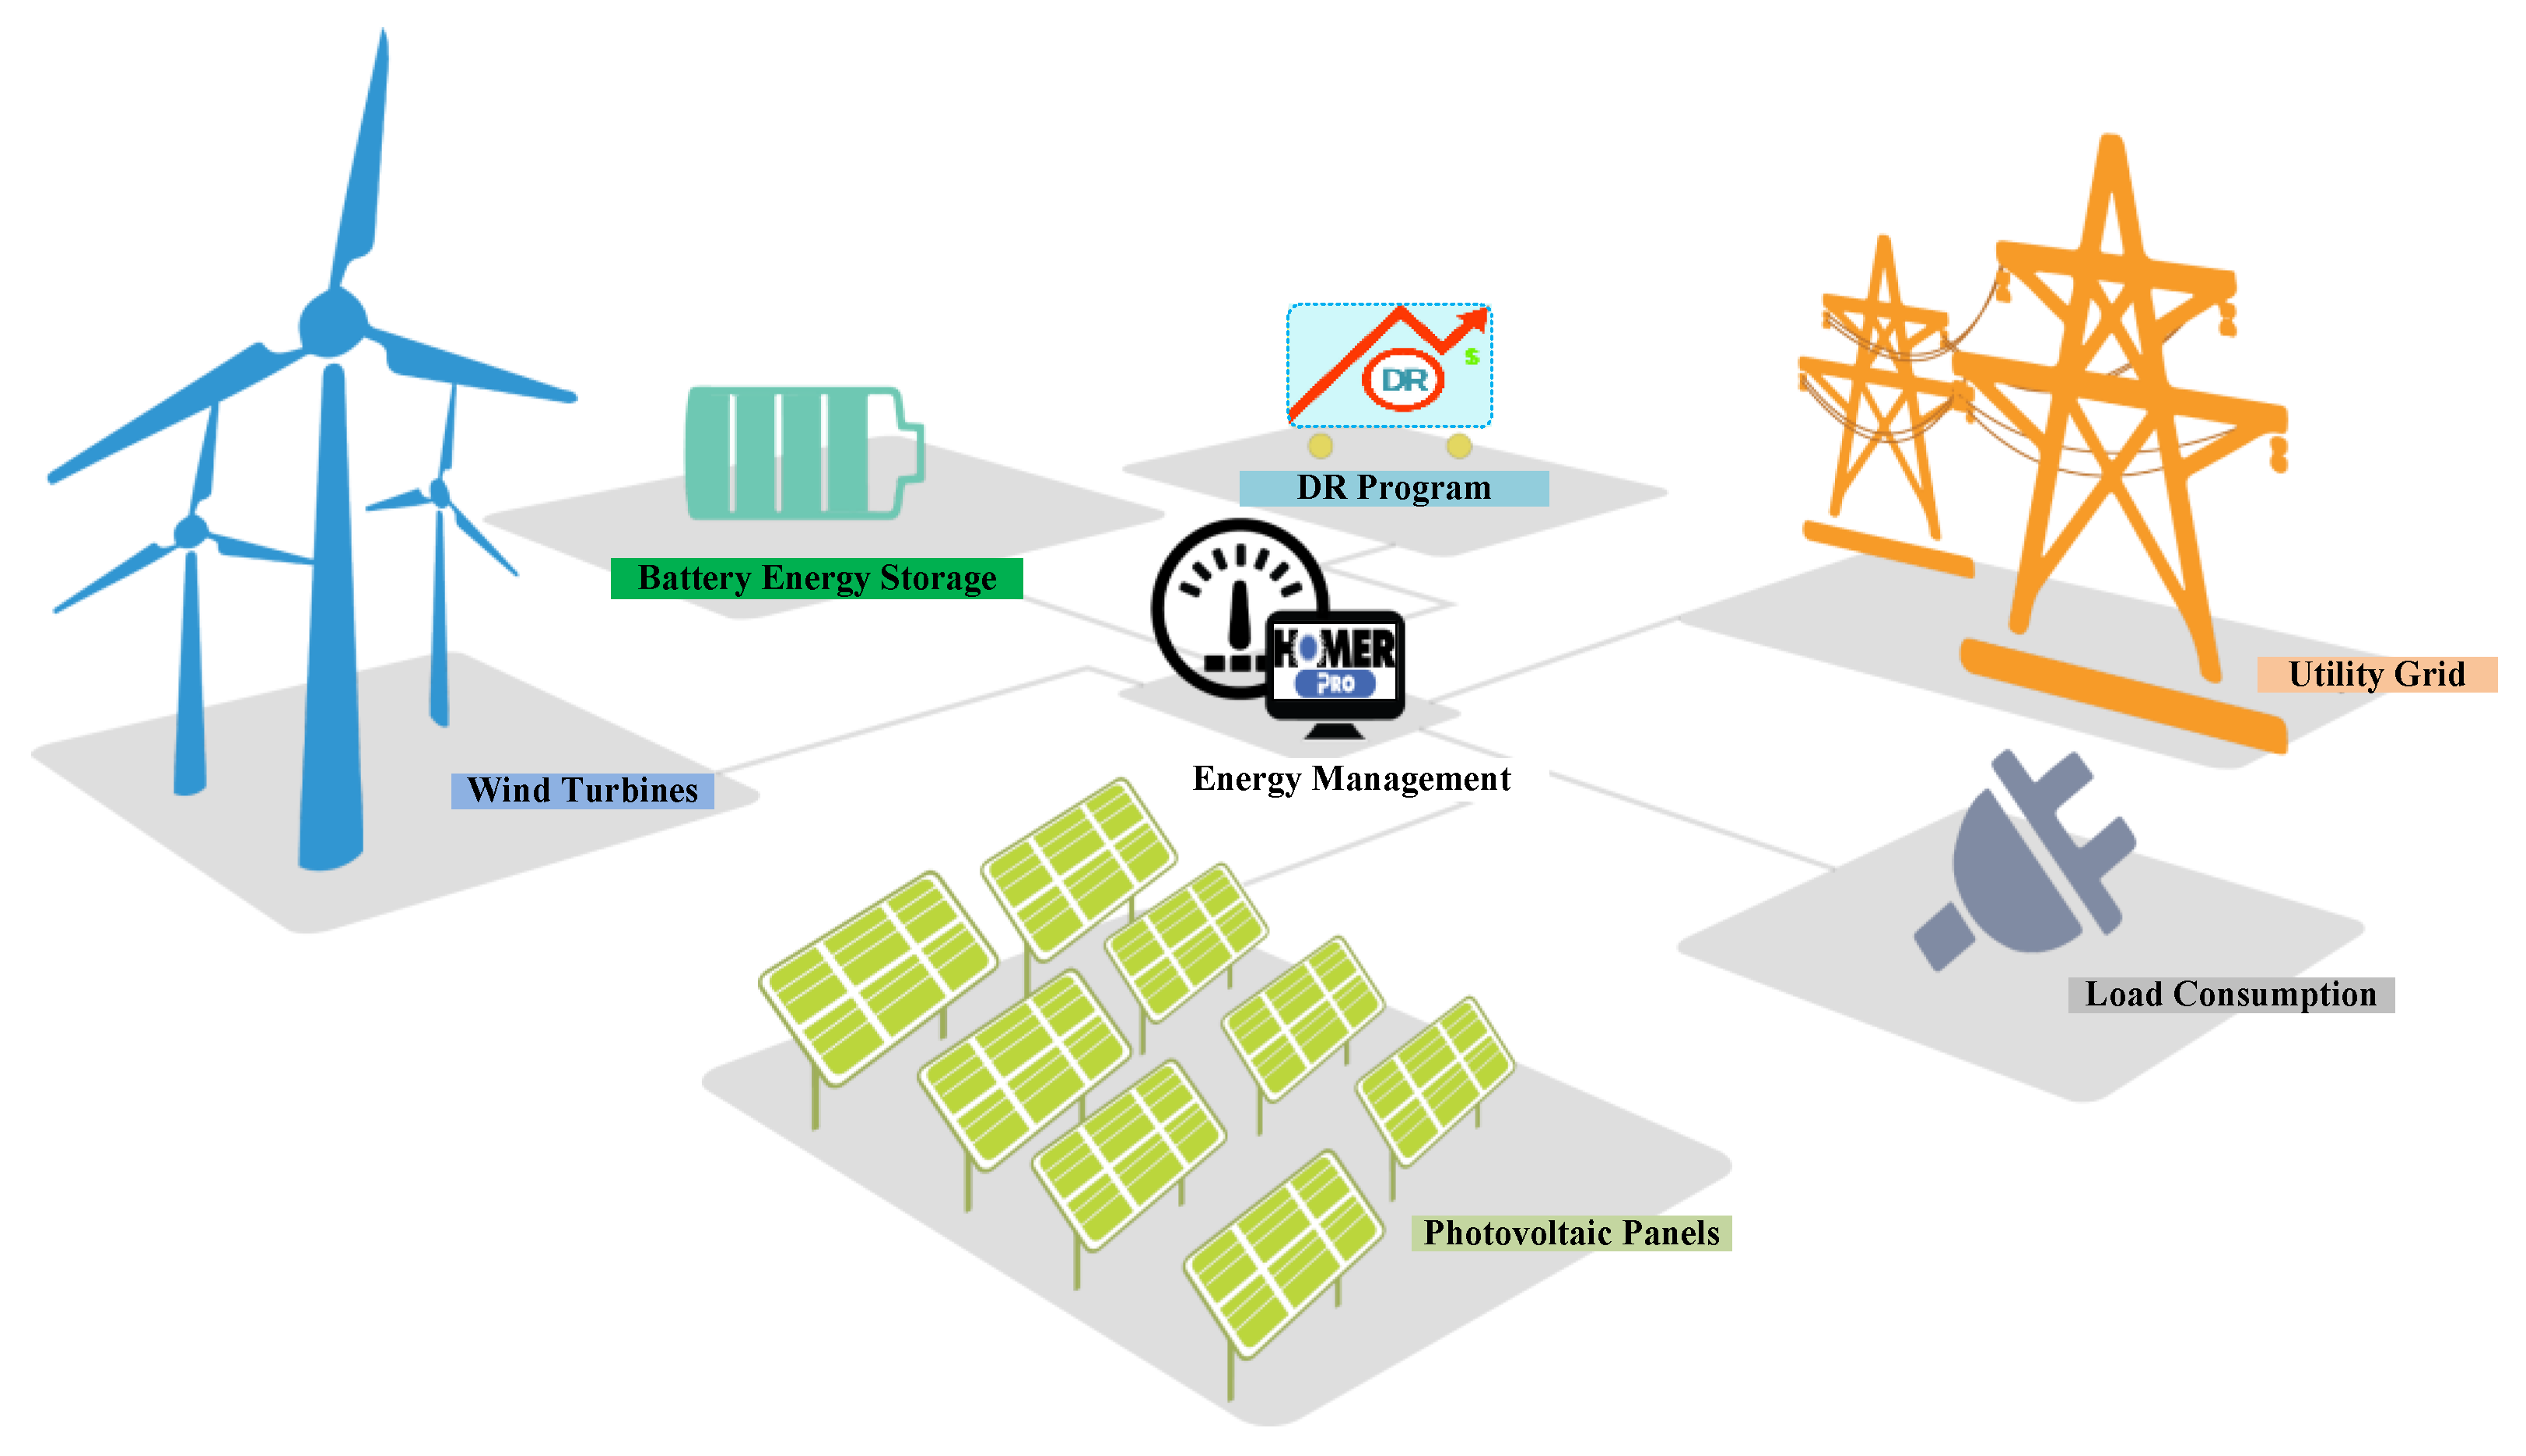
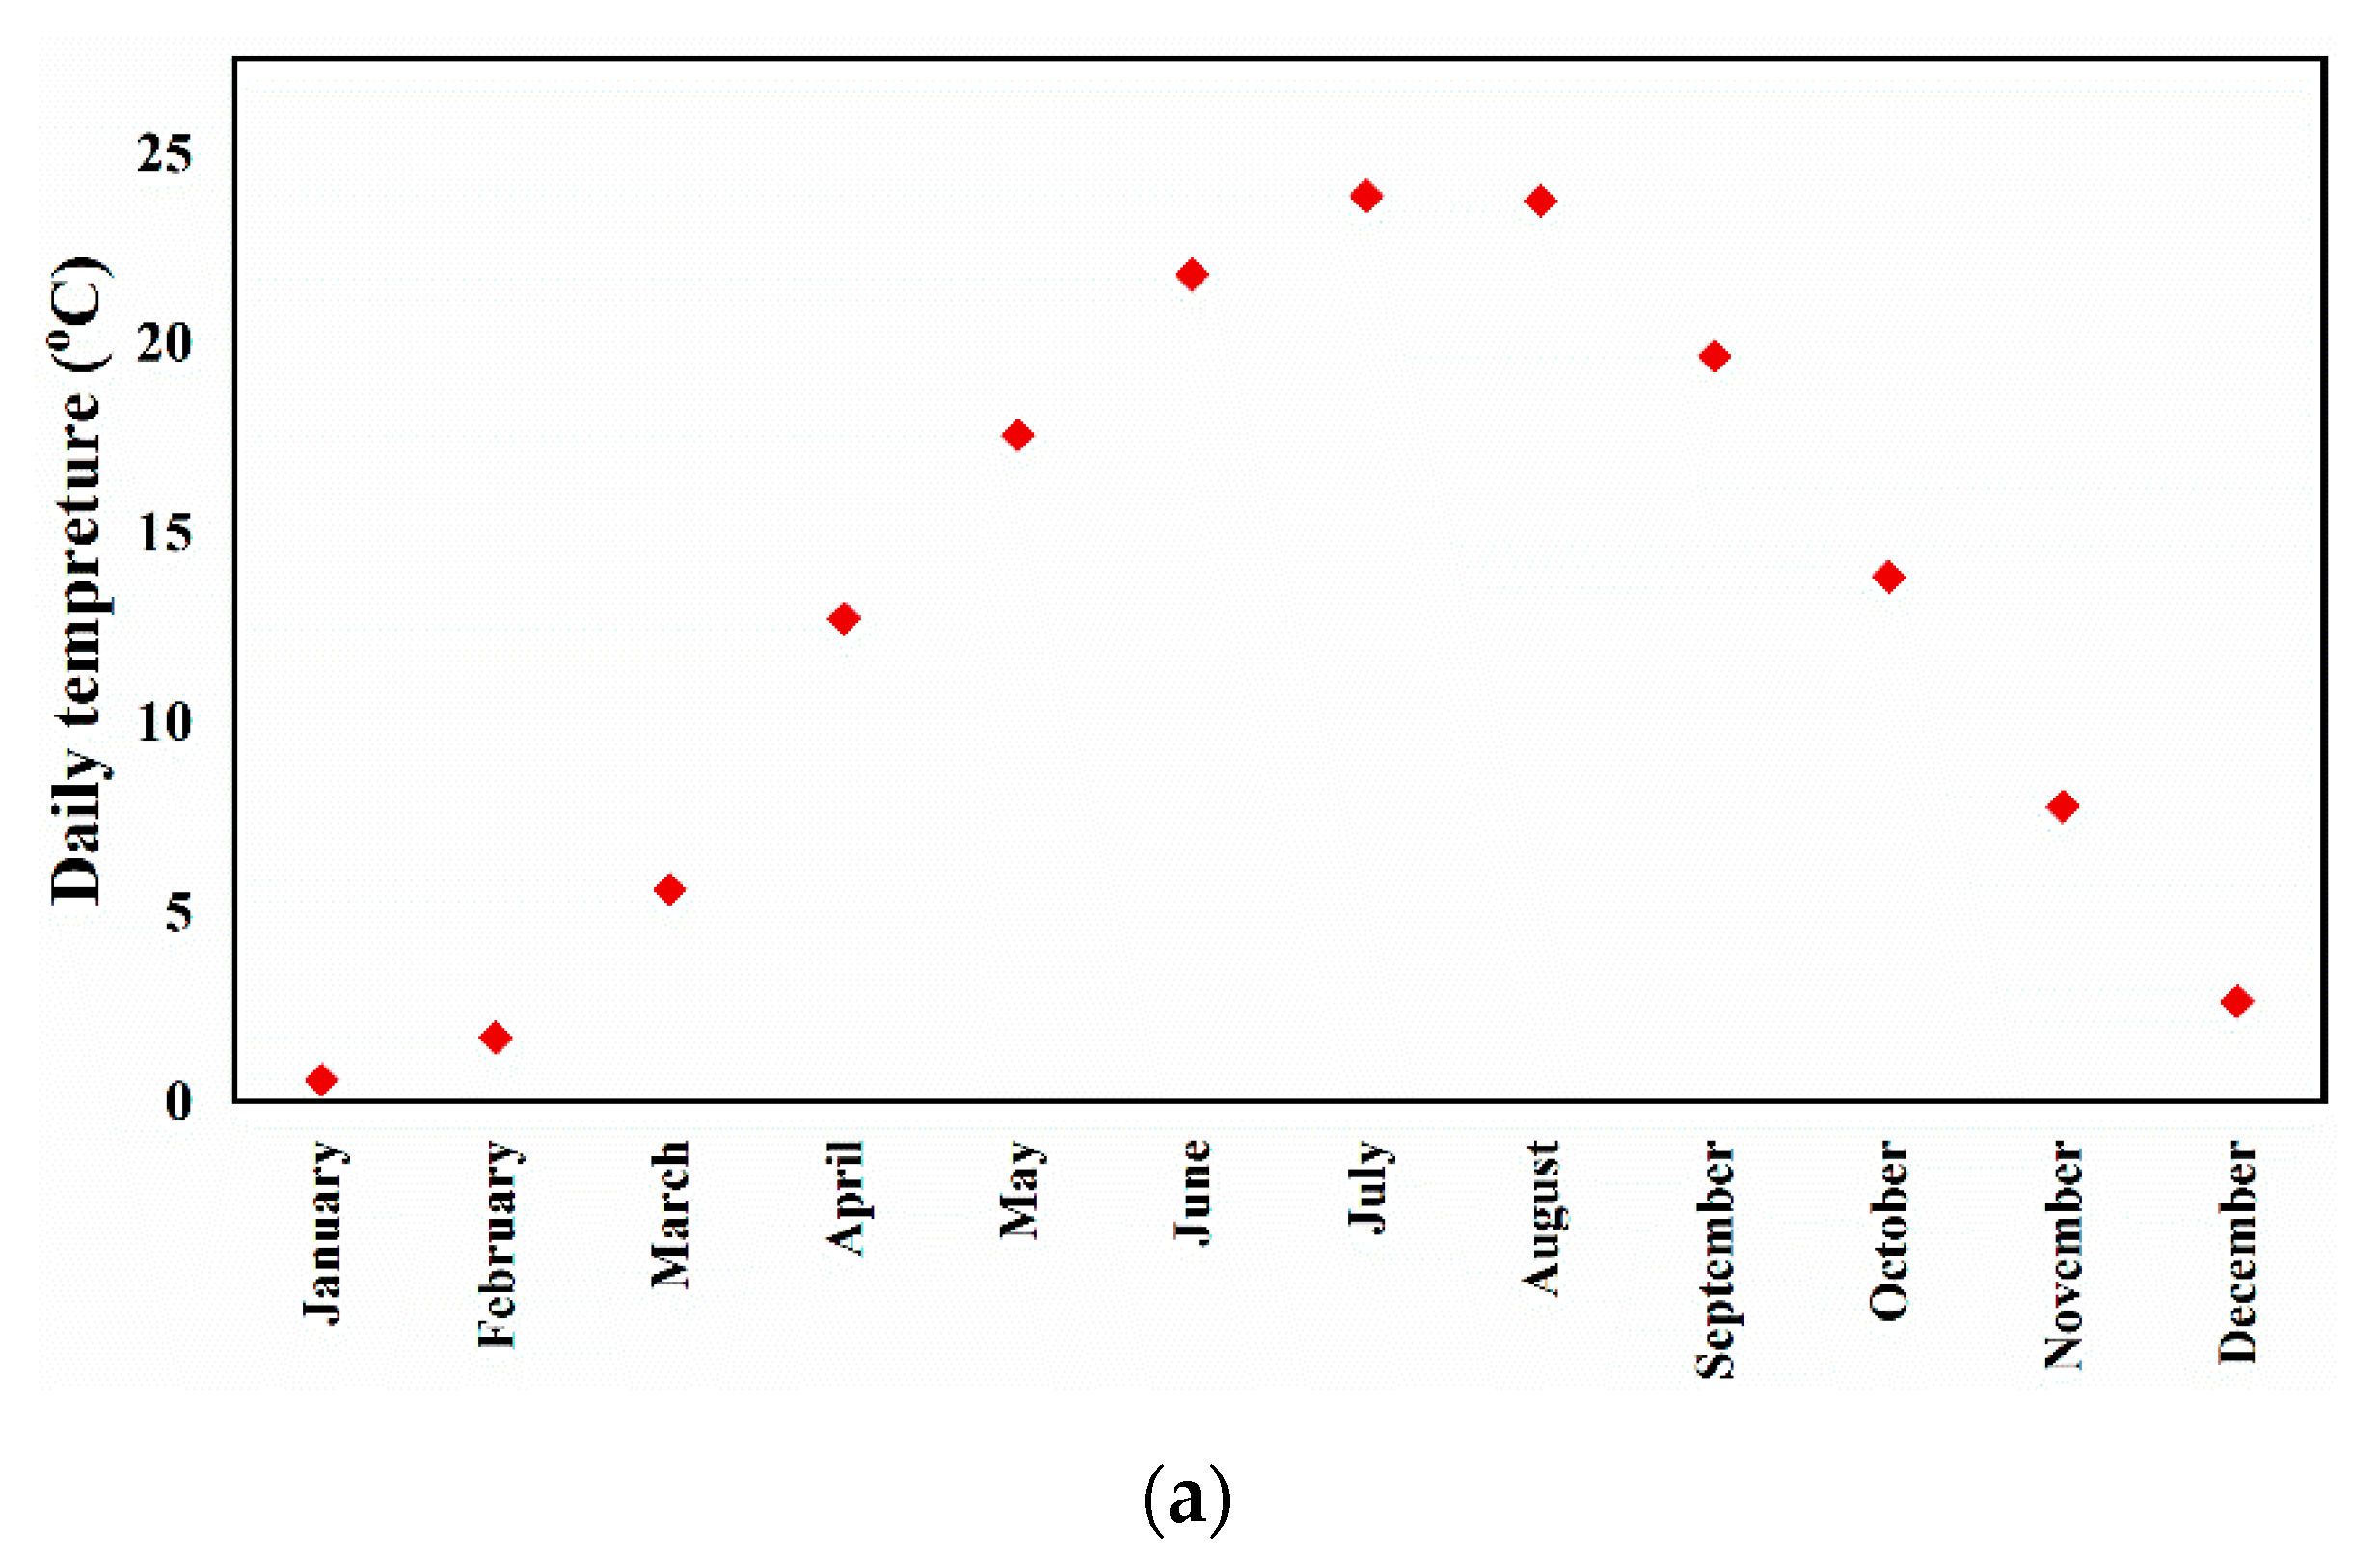
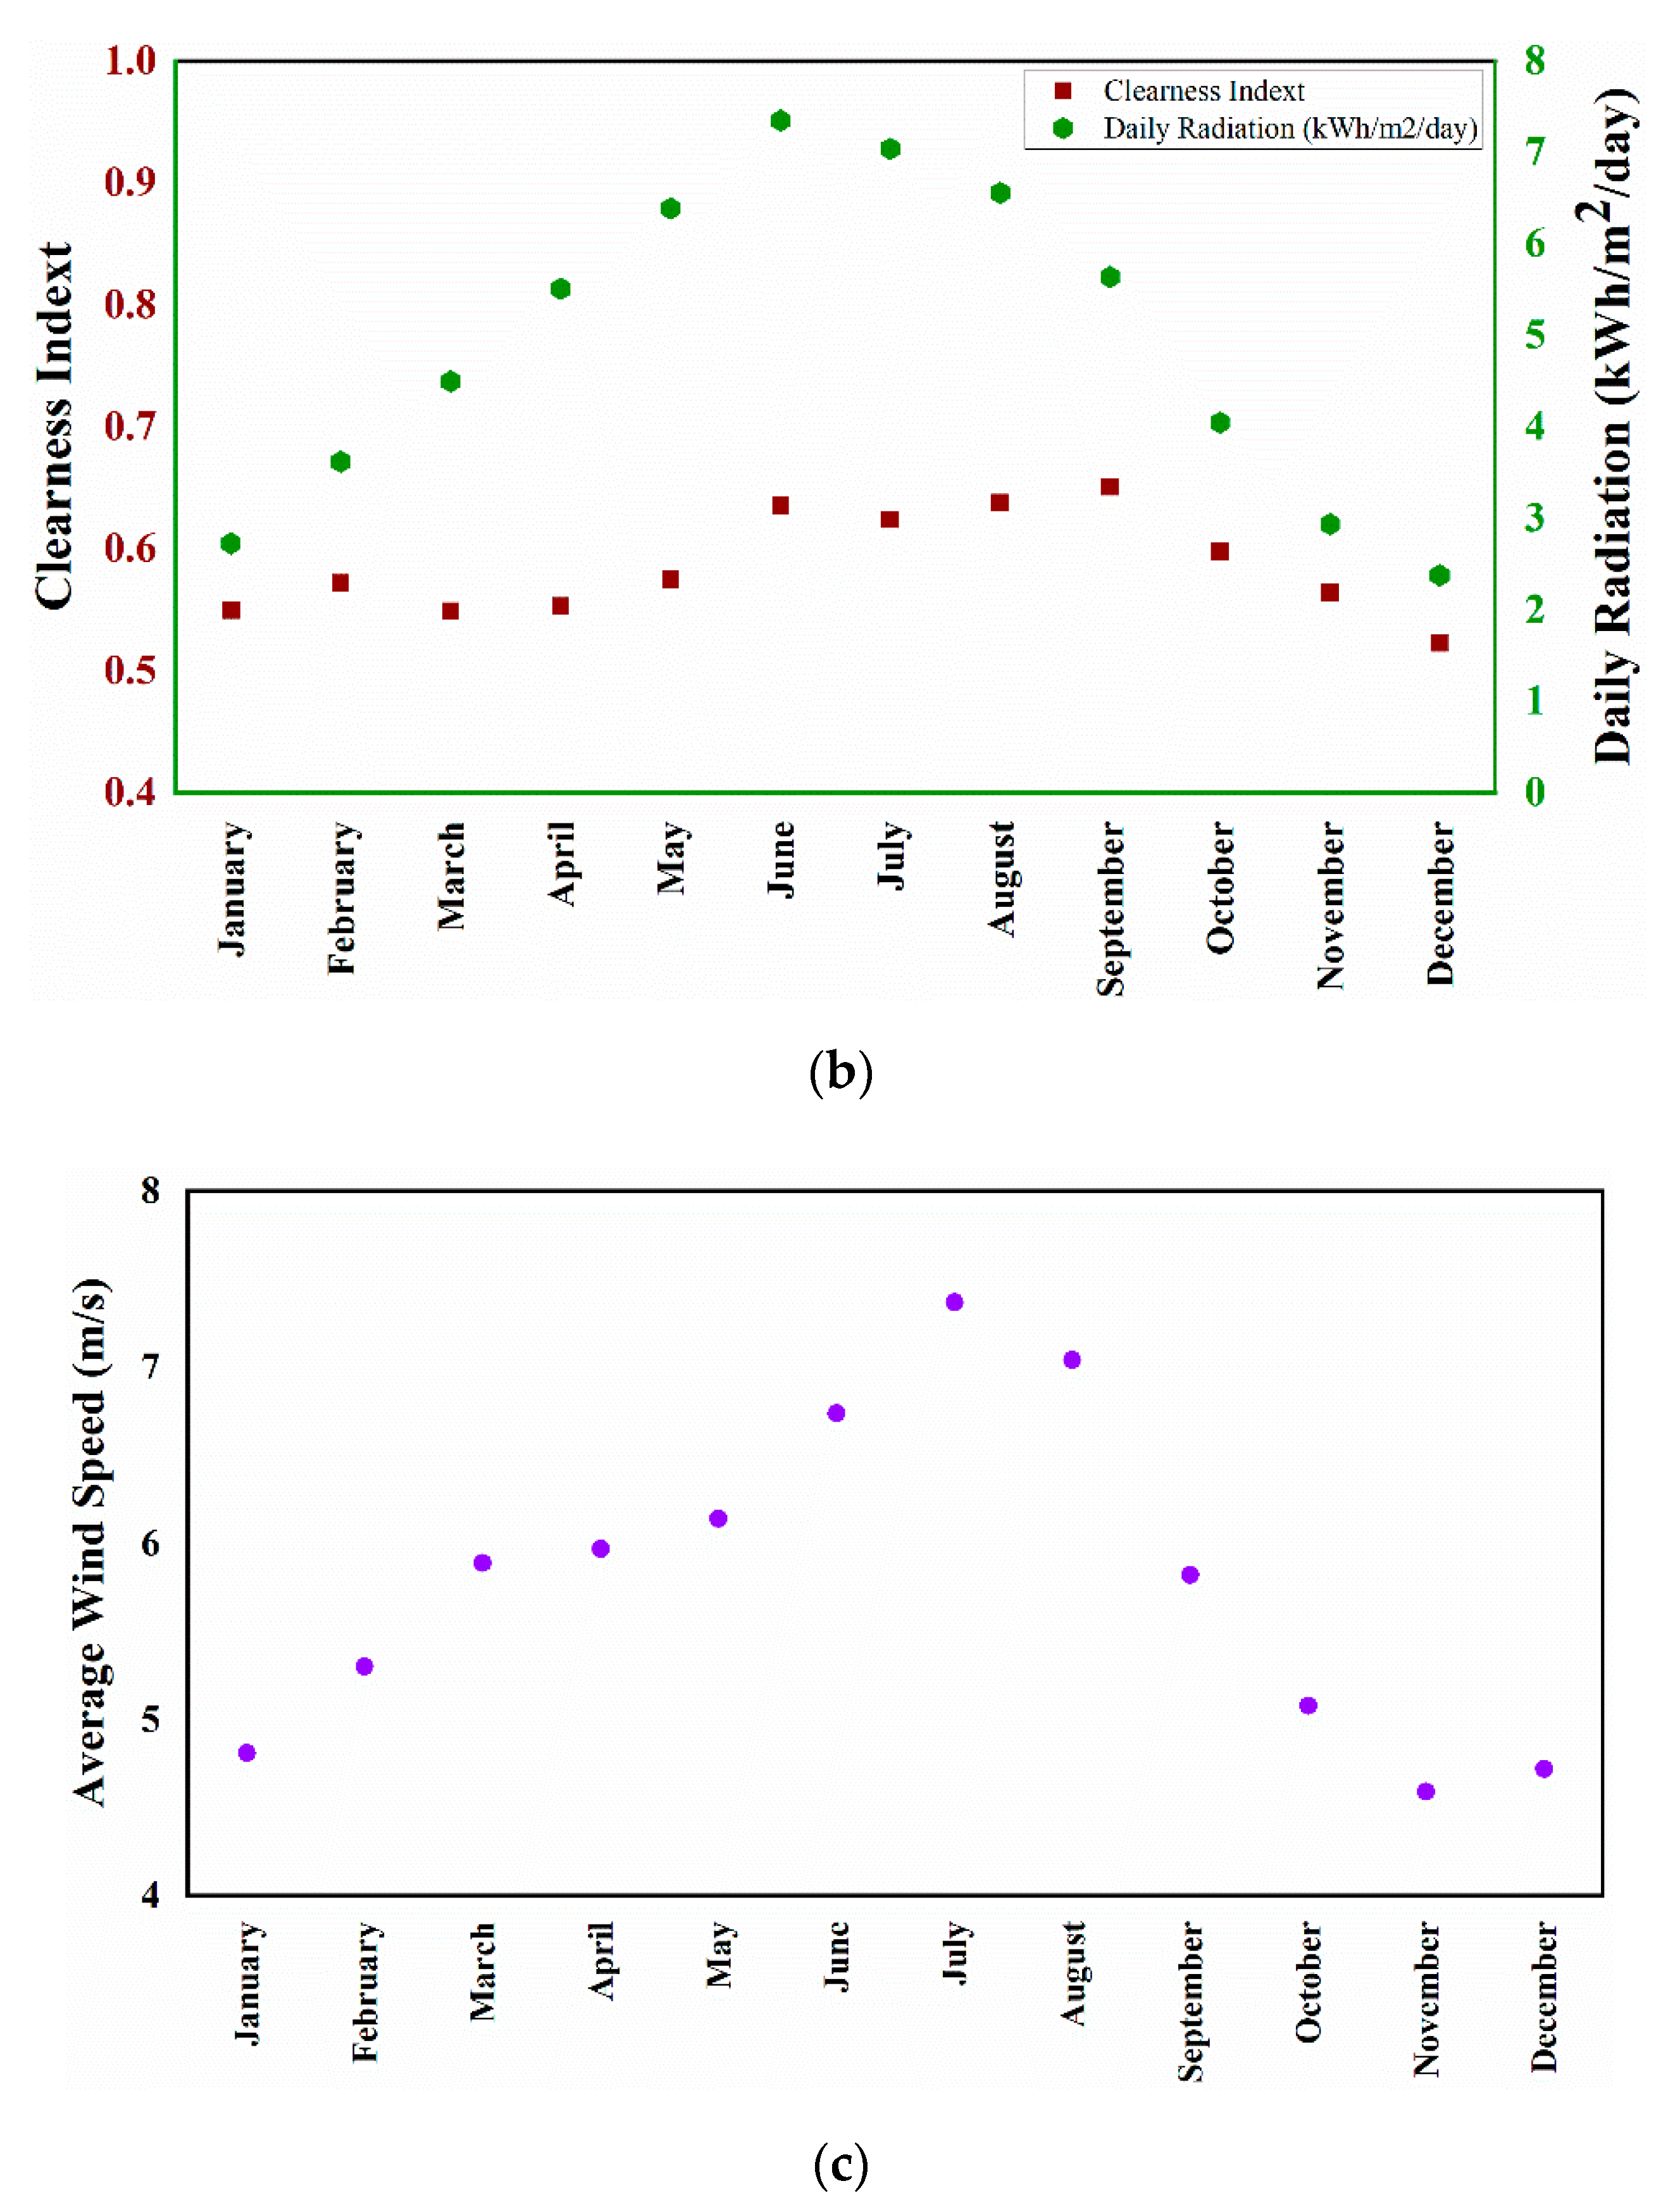
2.1. System Overview
2.2. Optimization Method
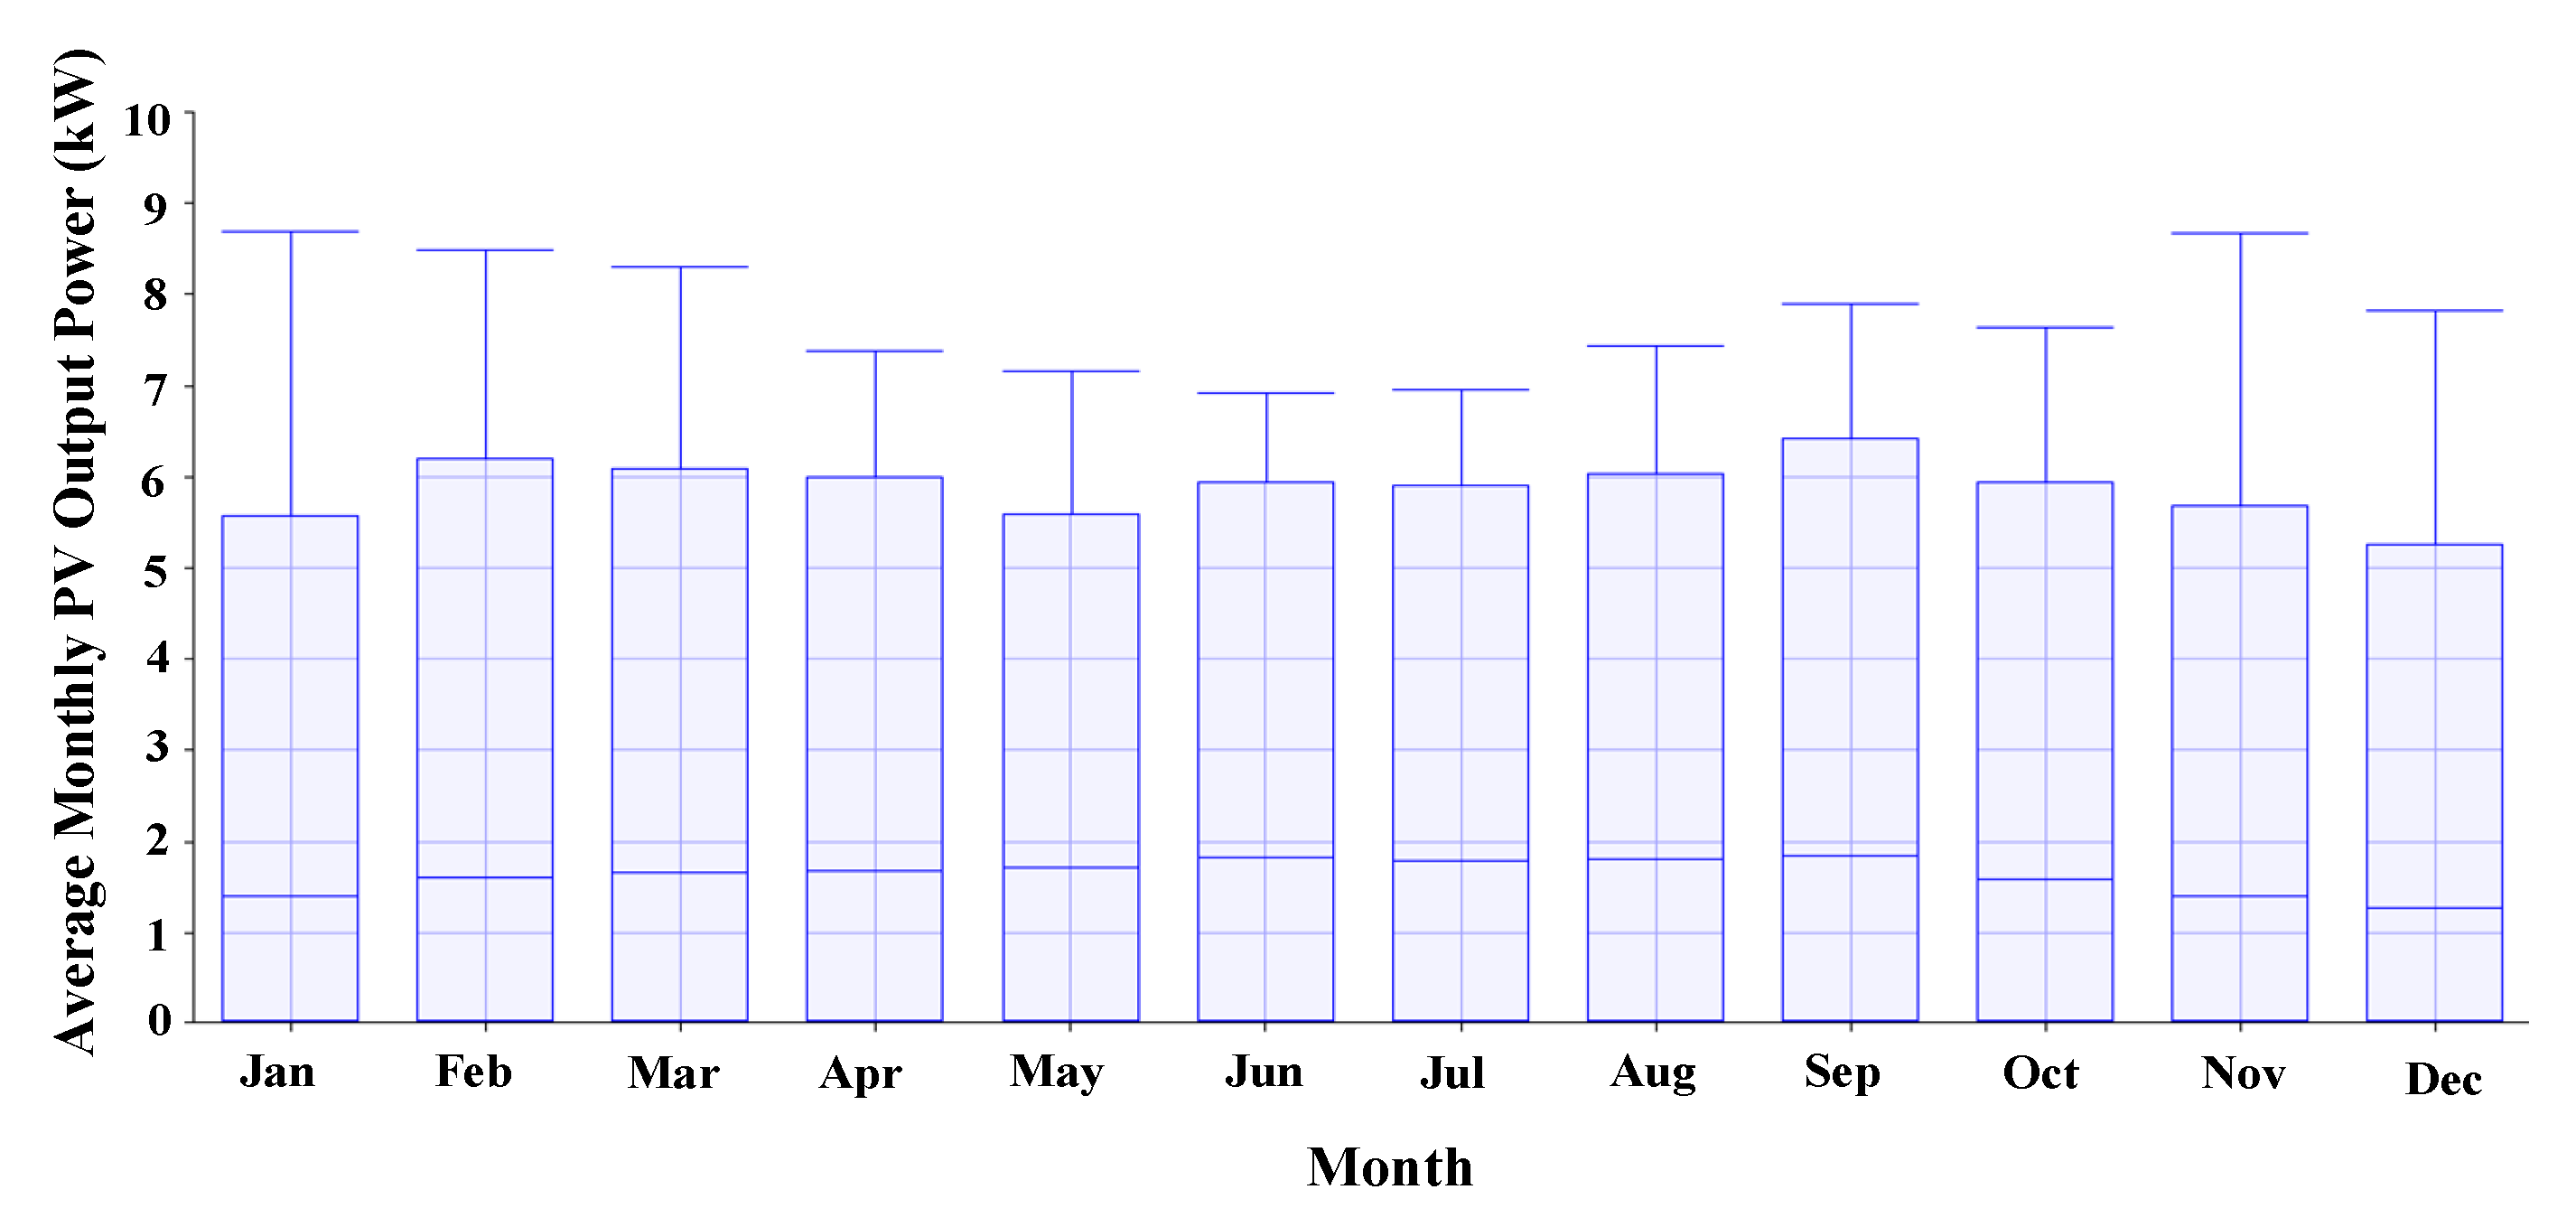
2.3. Renewability
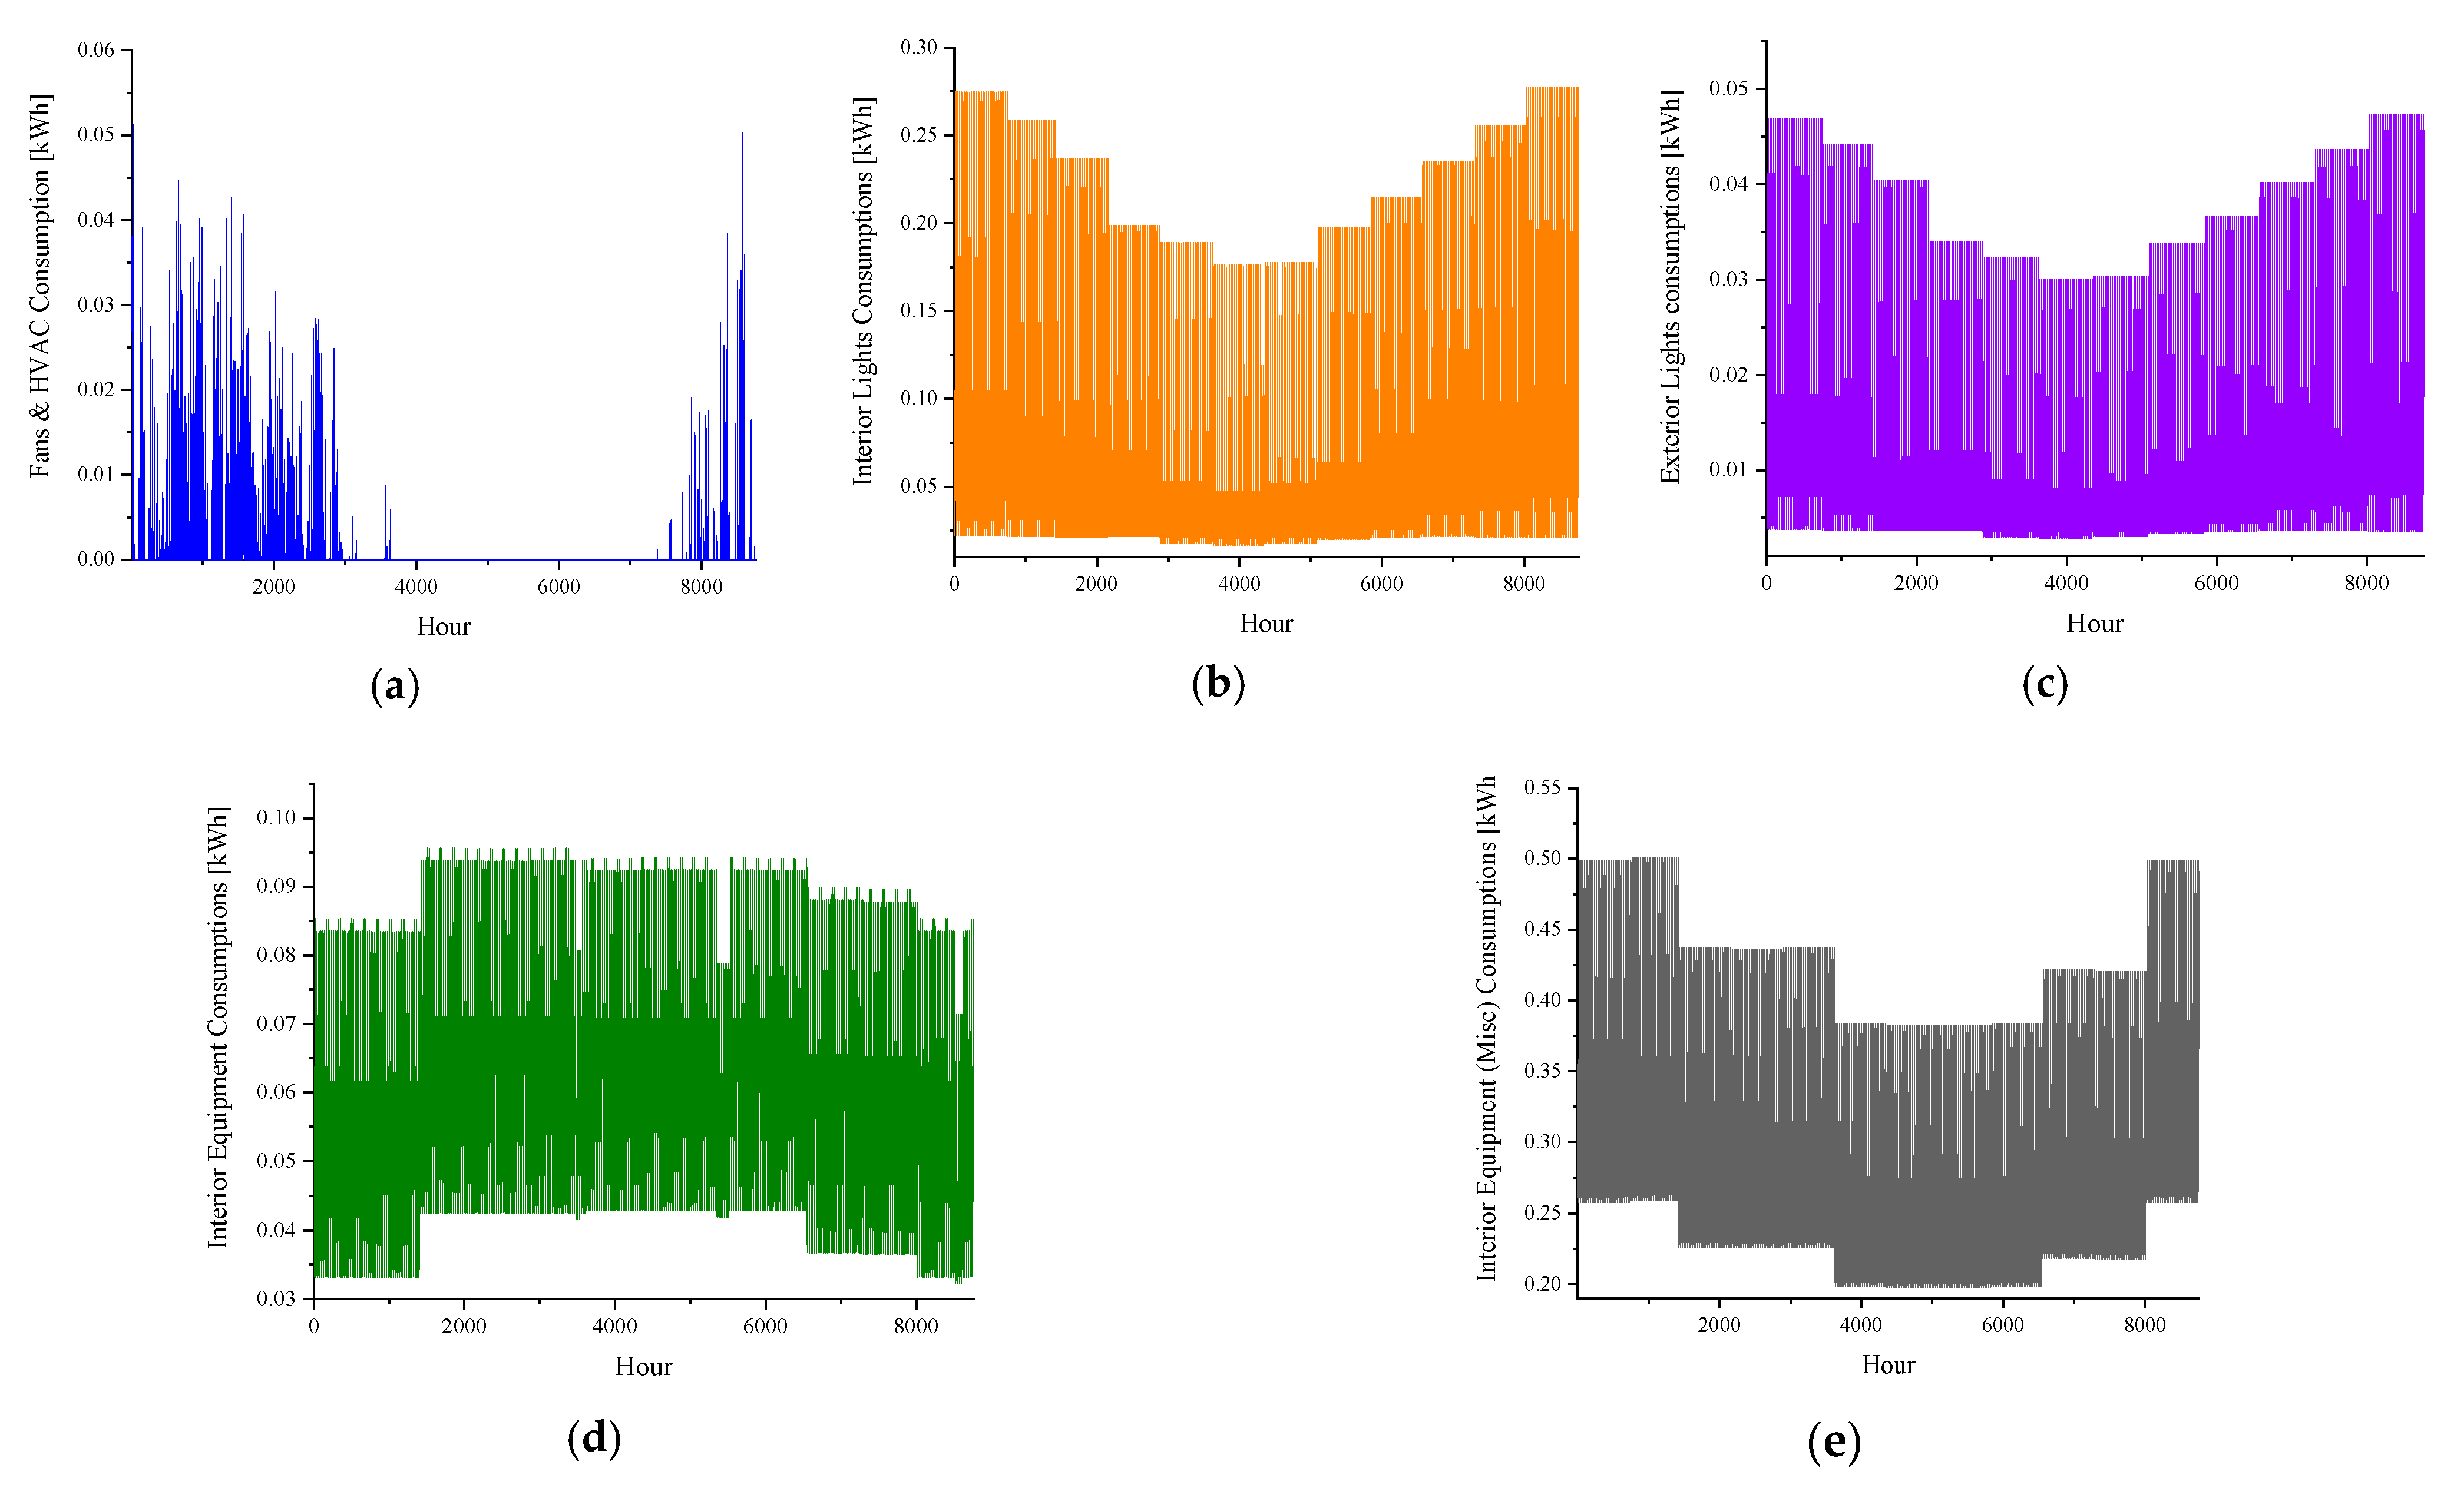
2.4. System Components
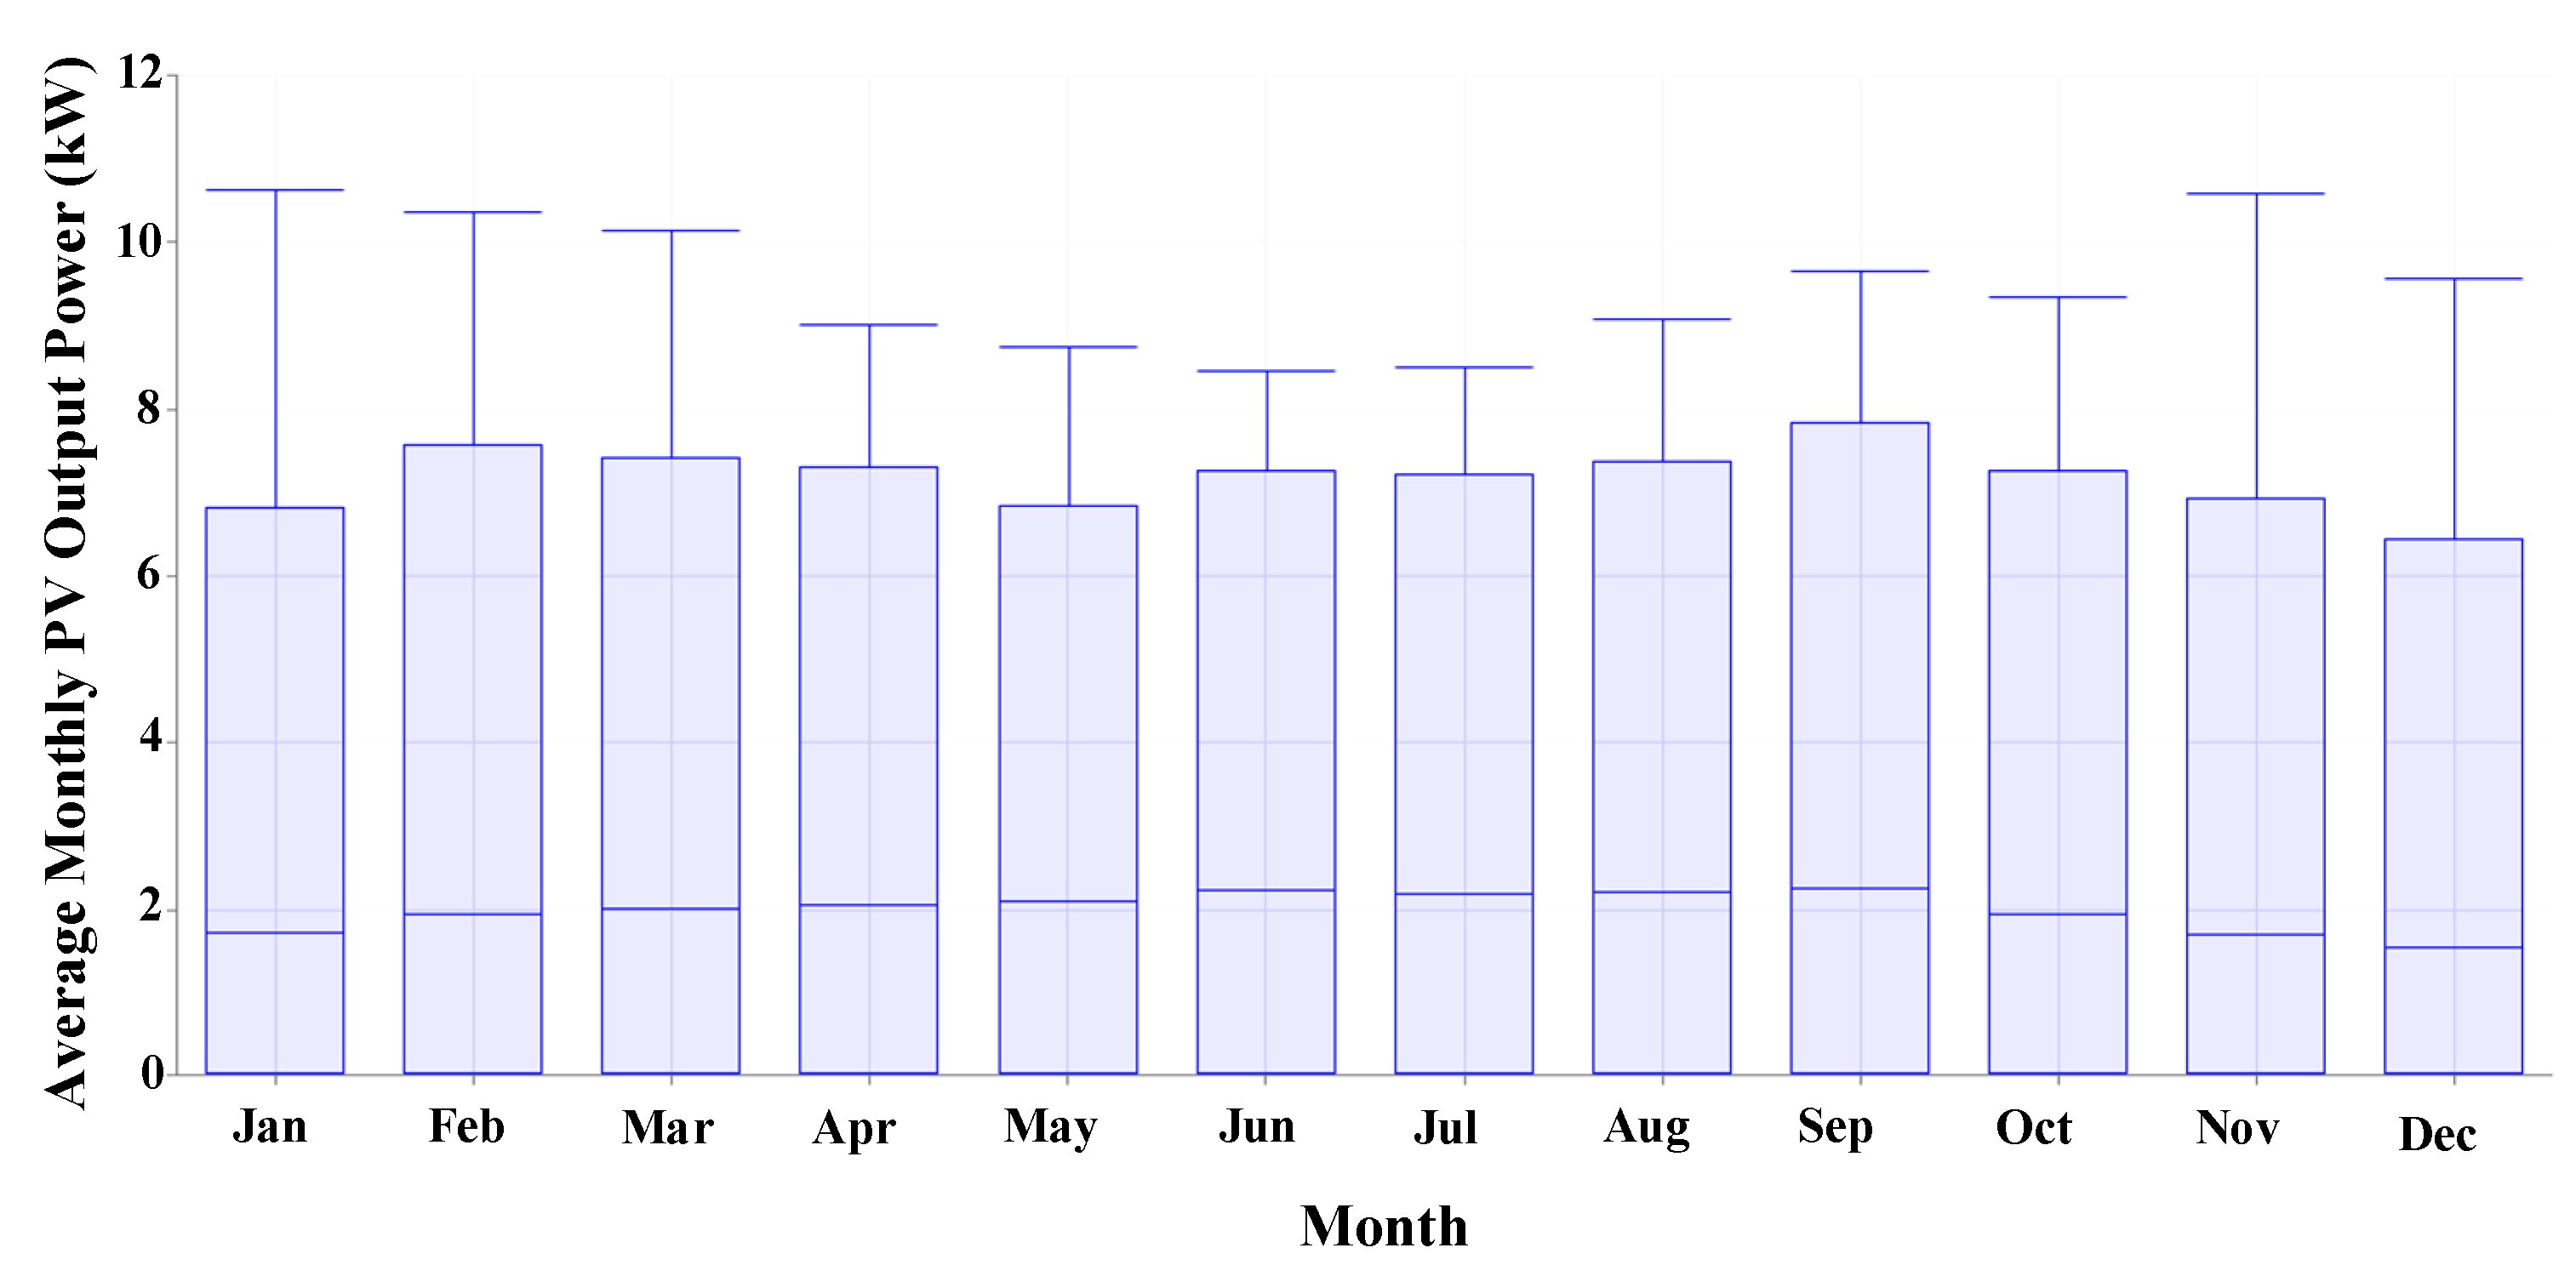
2.4.1. Solar PV System
2.4.2. WT System
2.4.3. Battery ESS
2.4.4. Converter
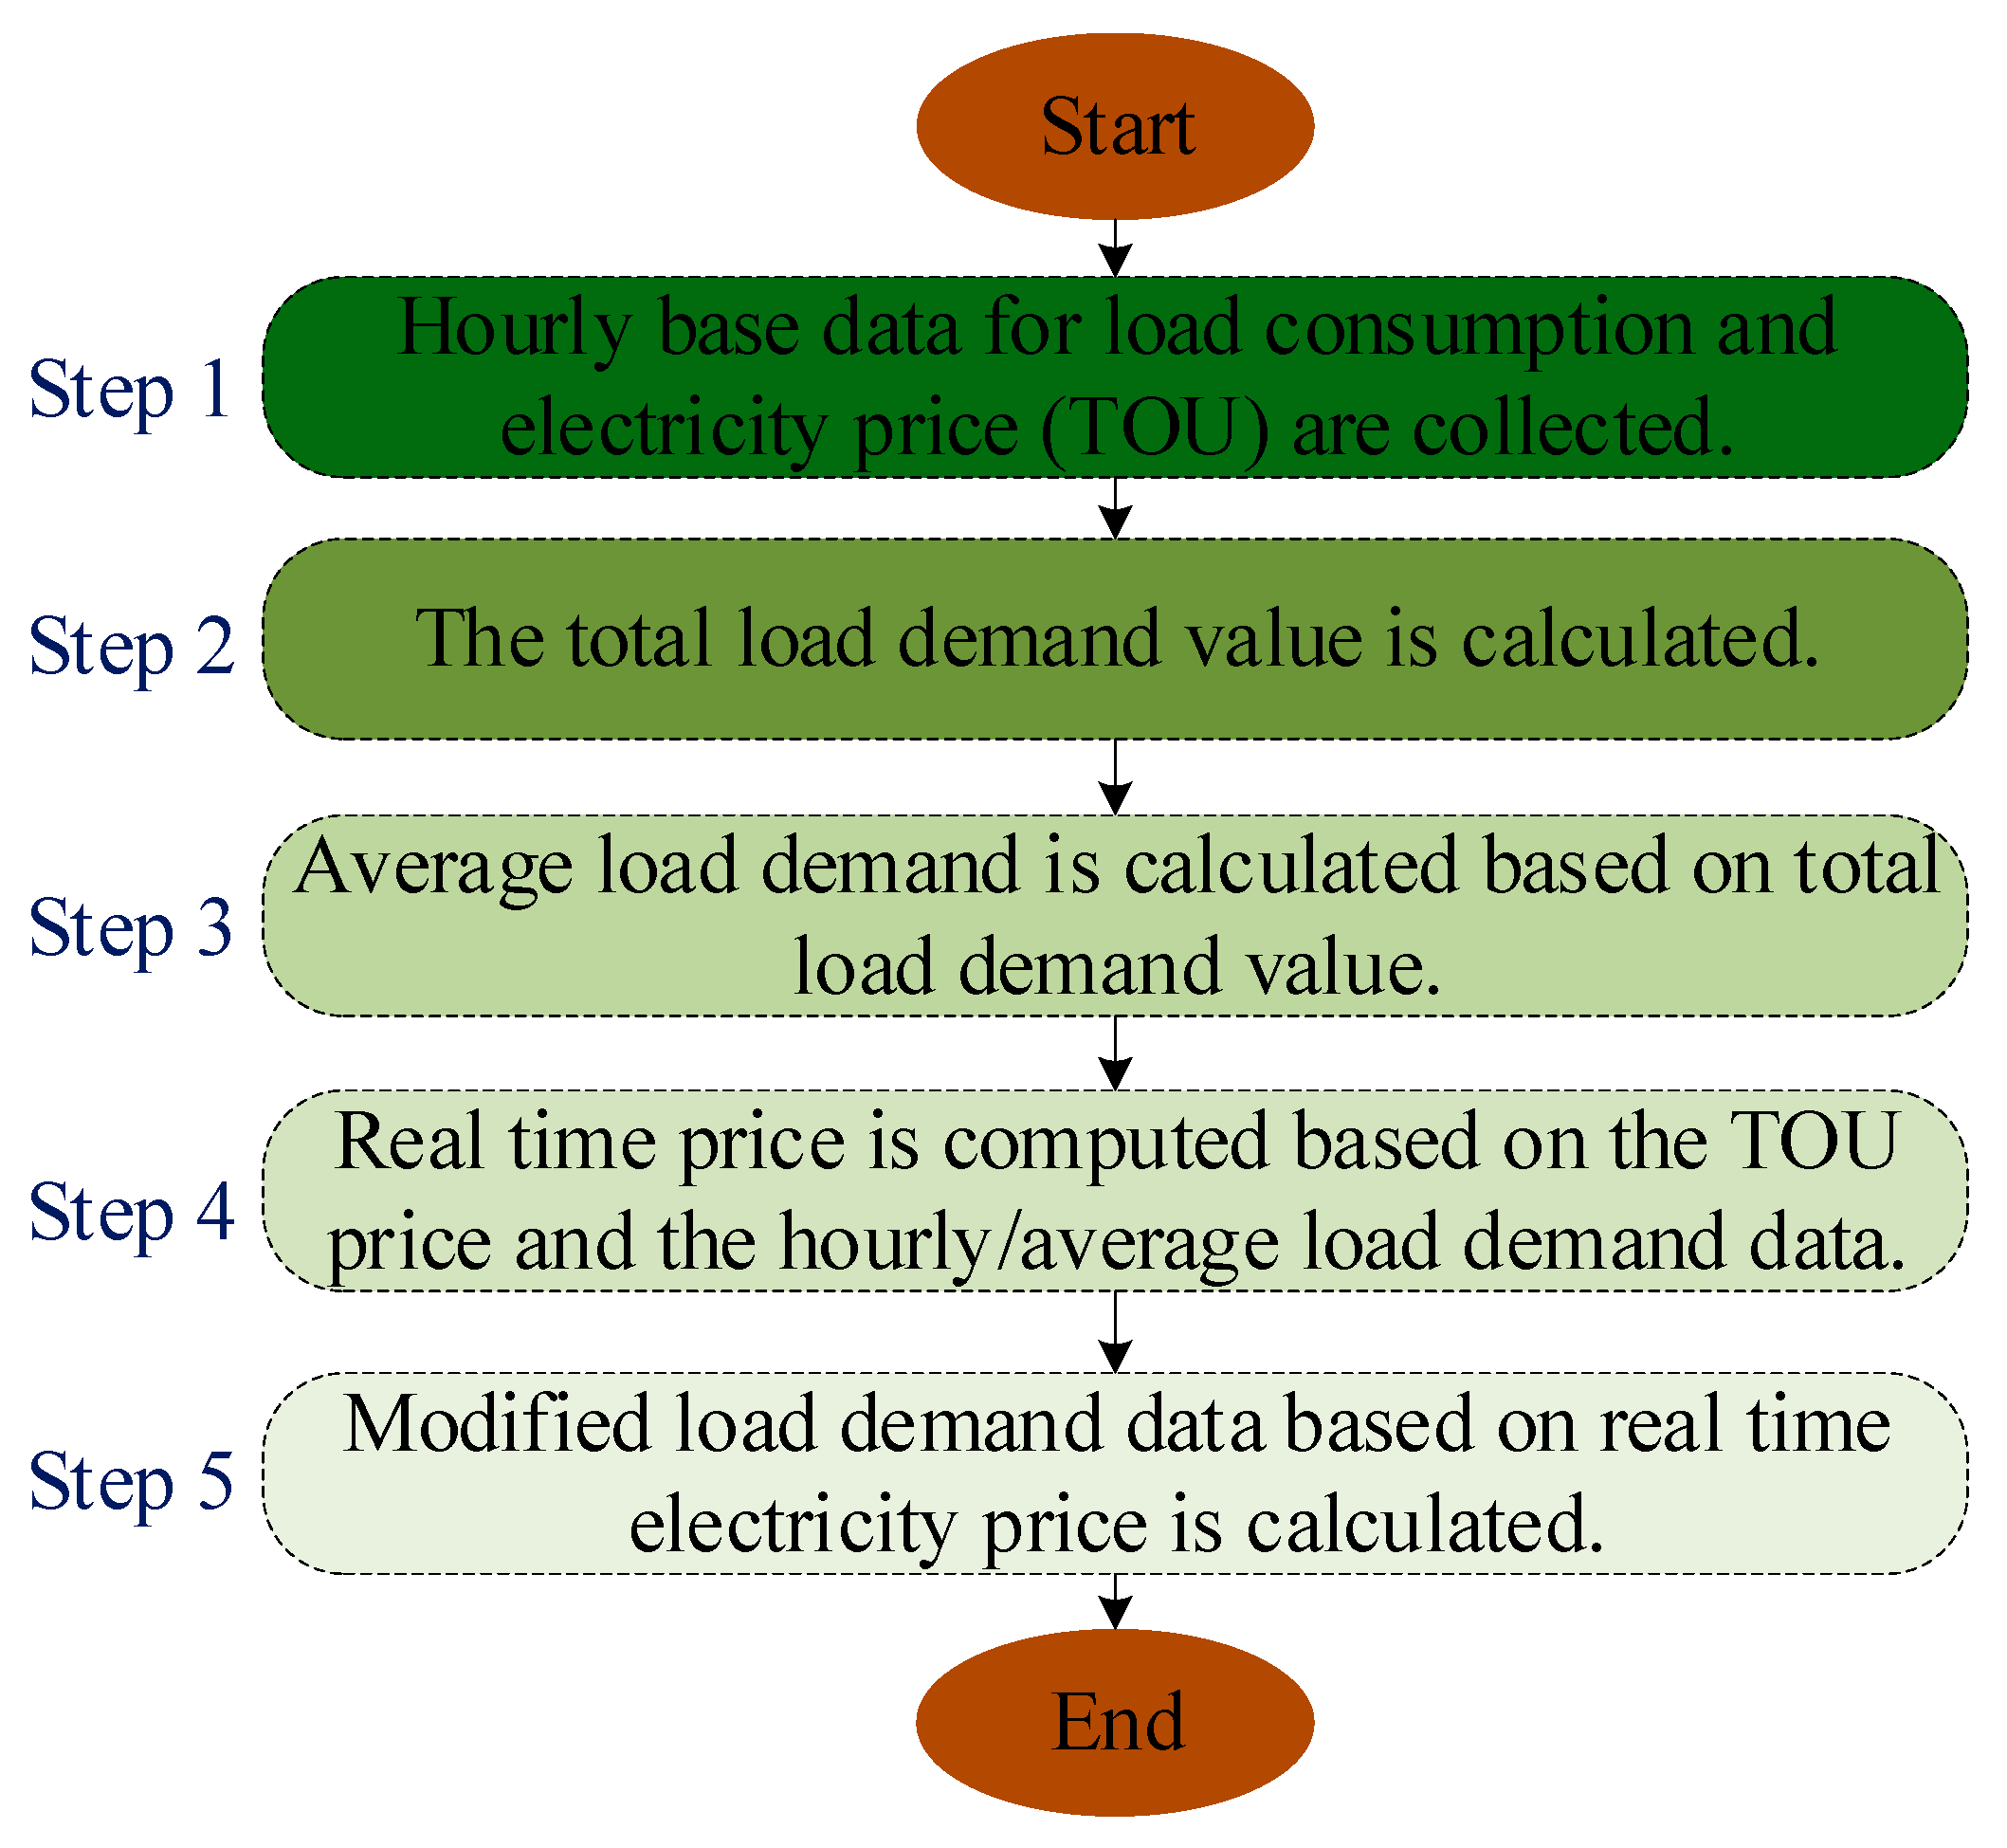
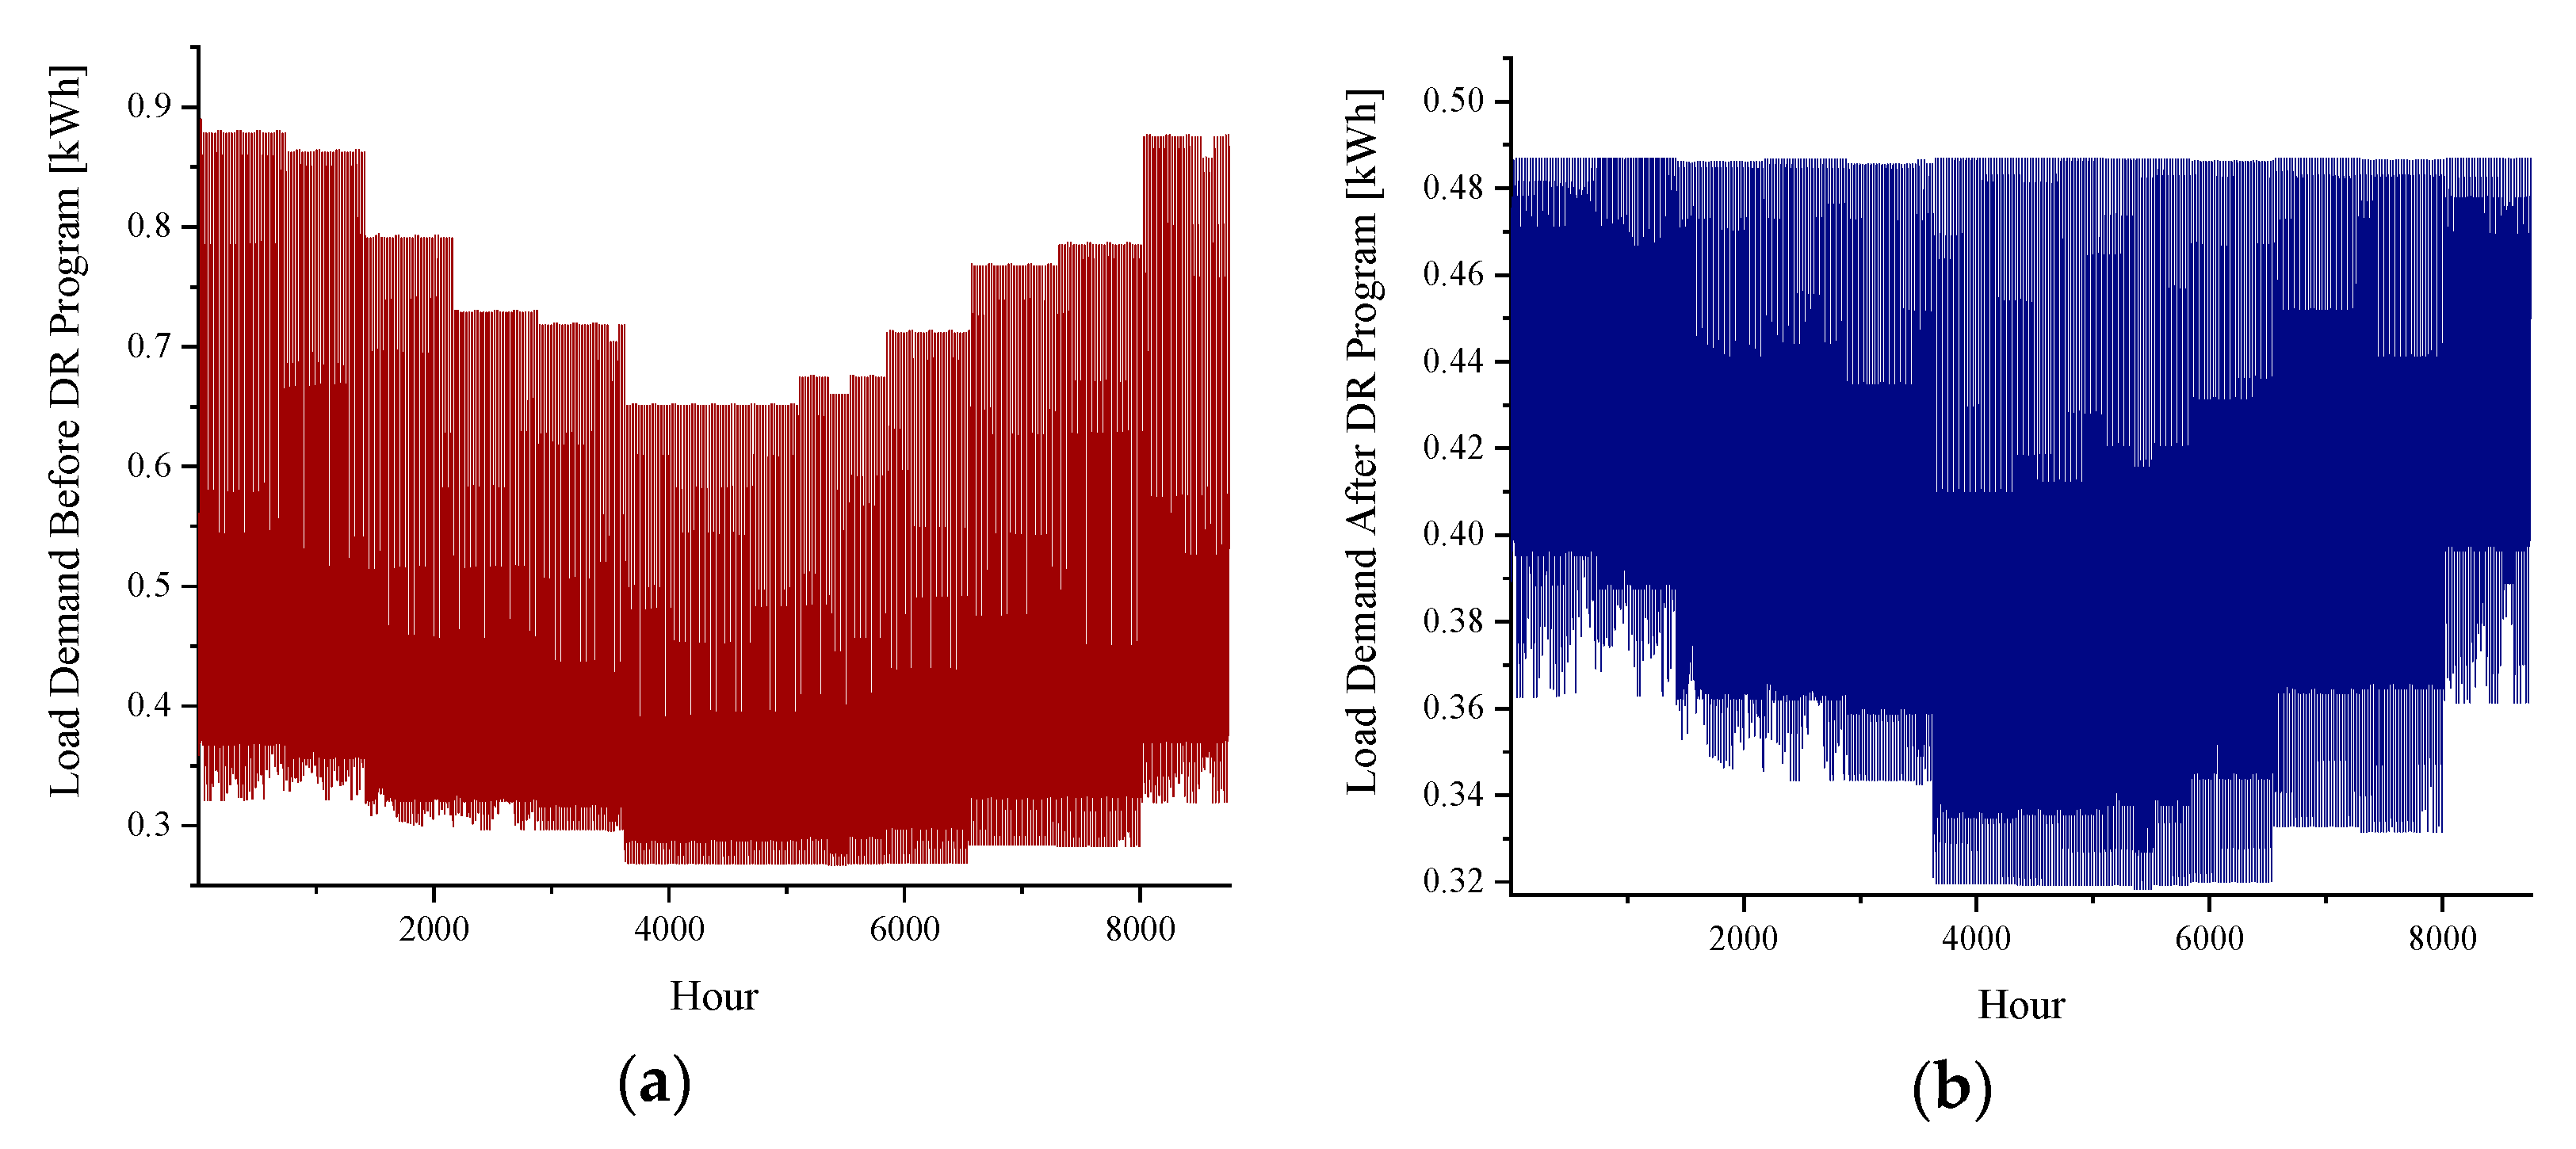
2.5. DR Program
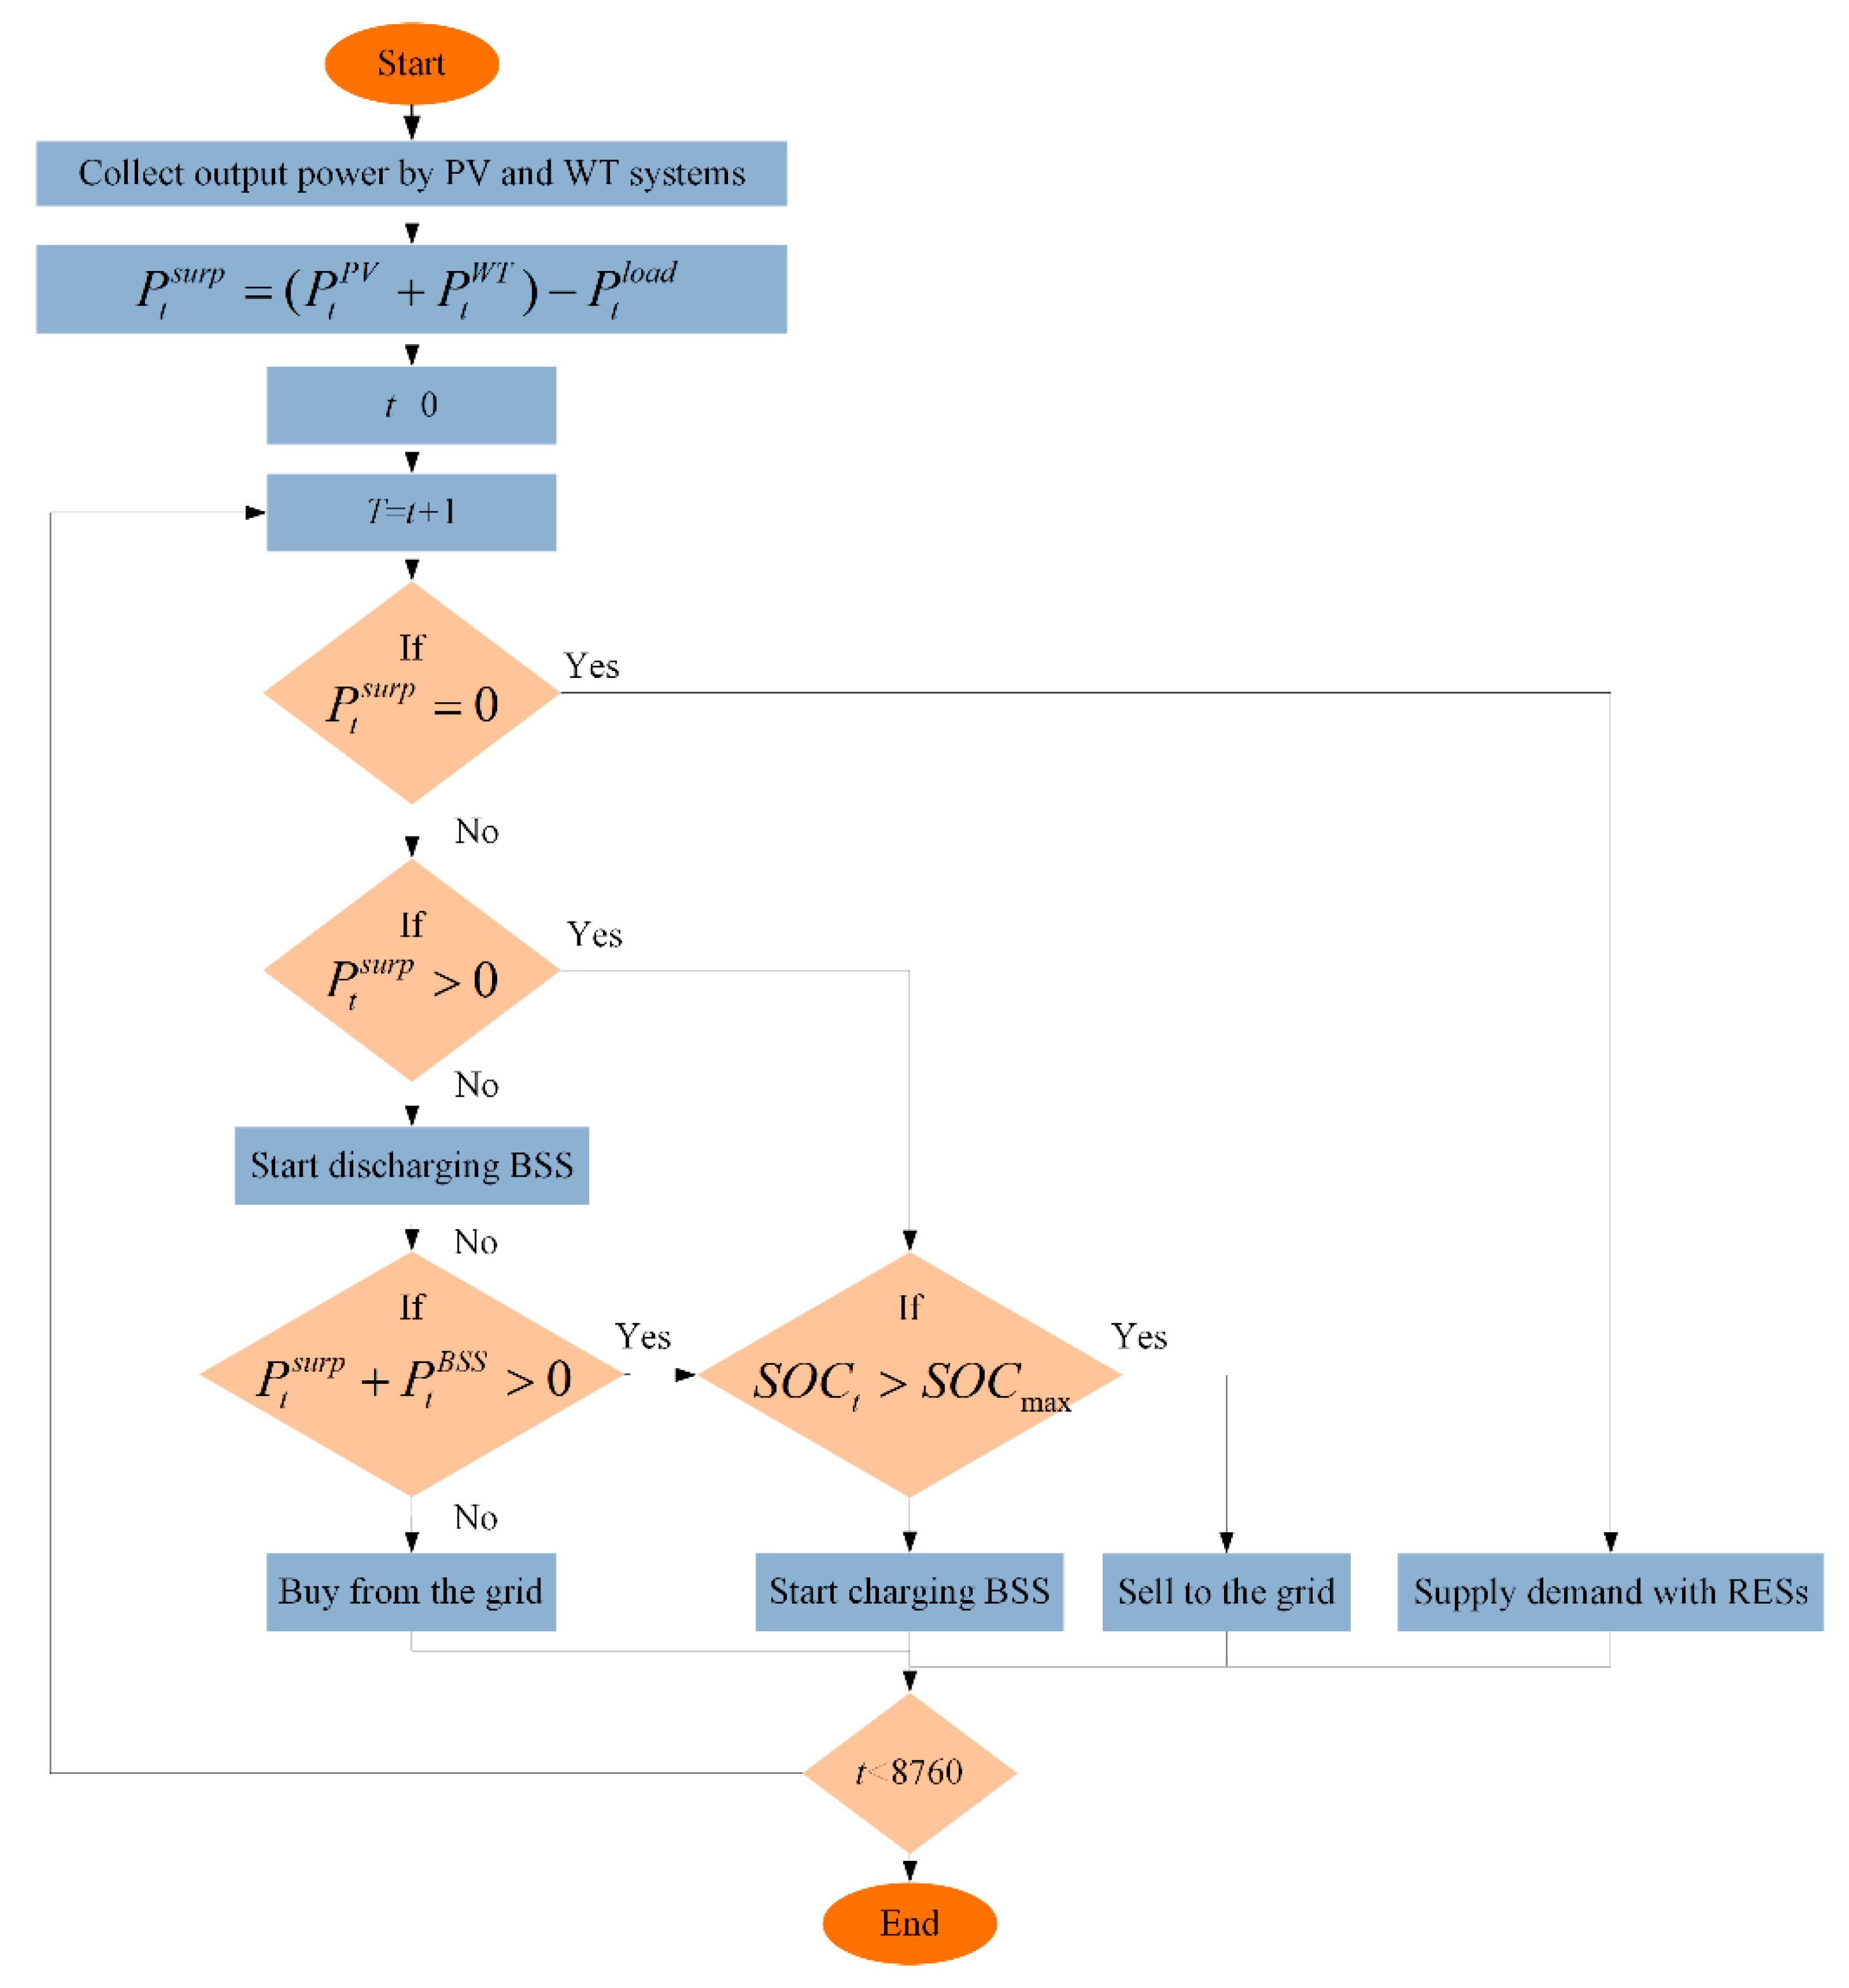
2.6. Energy Management Strategy
3. Case Study and Results
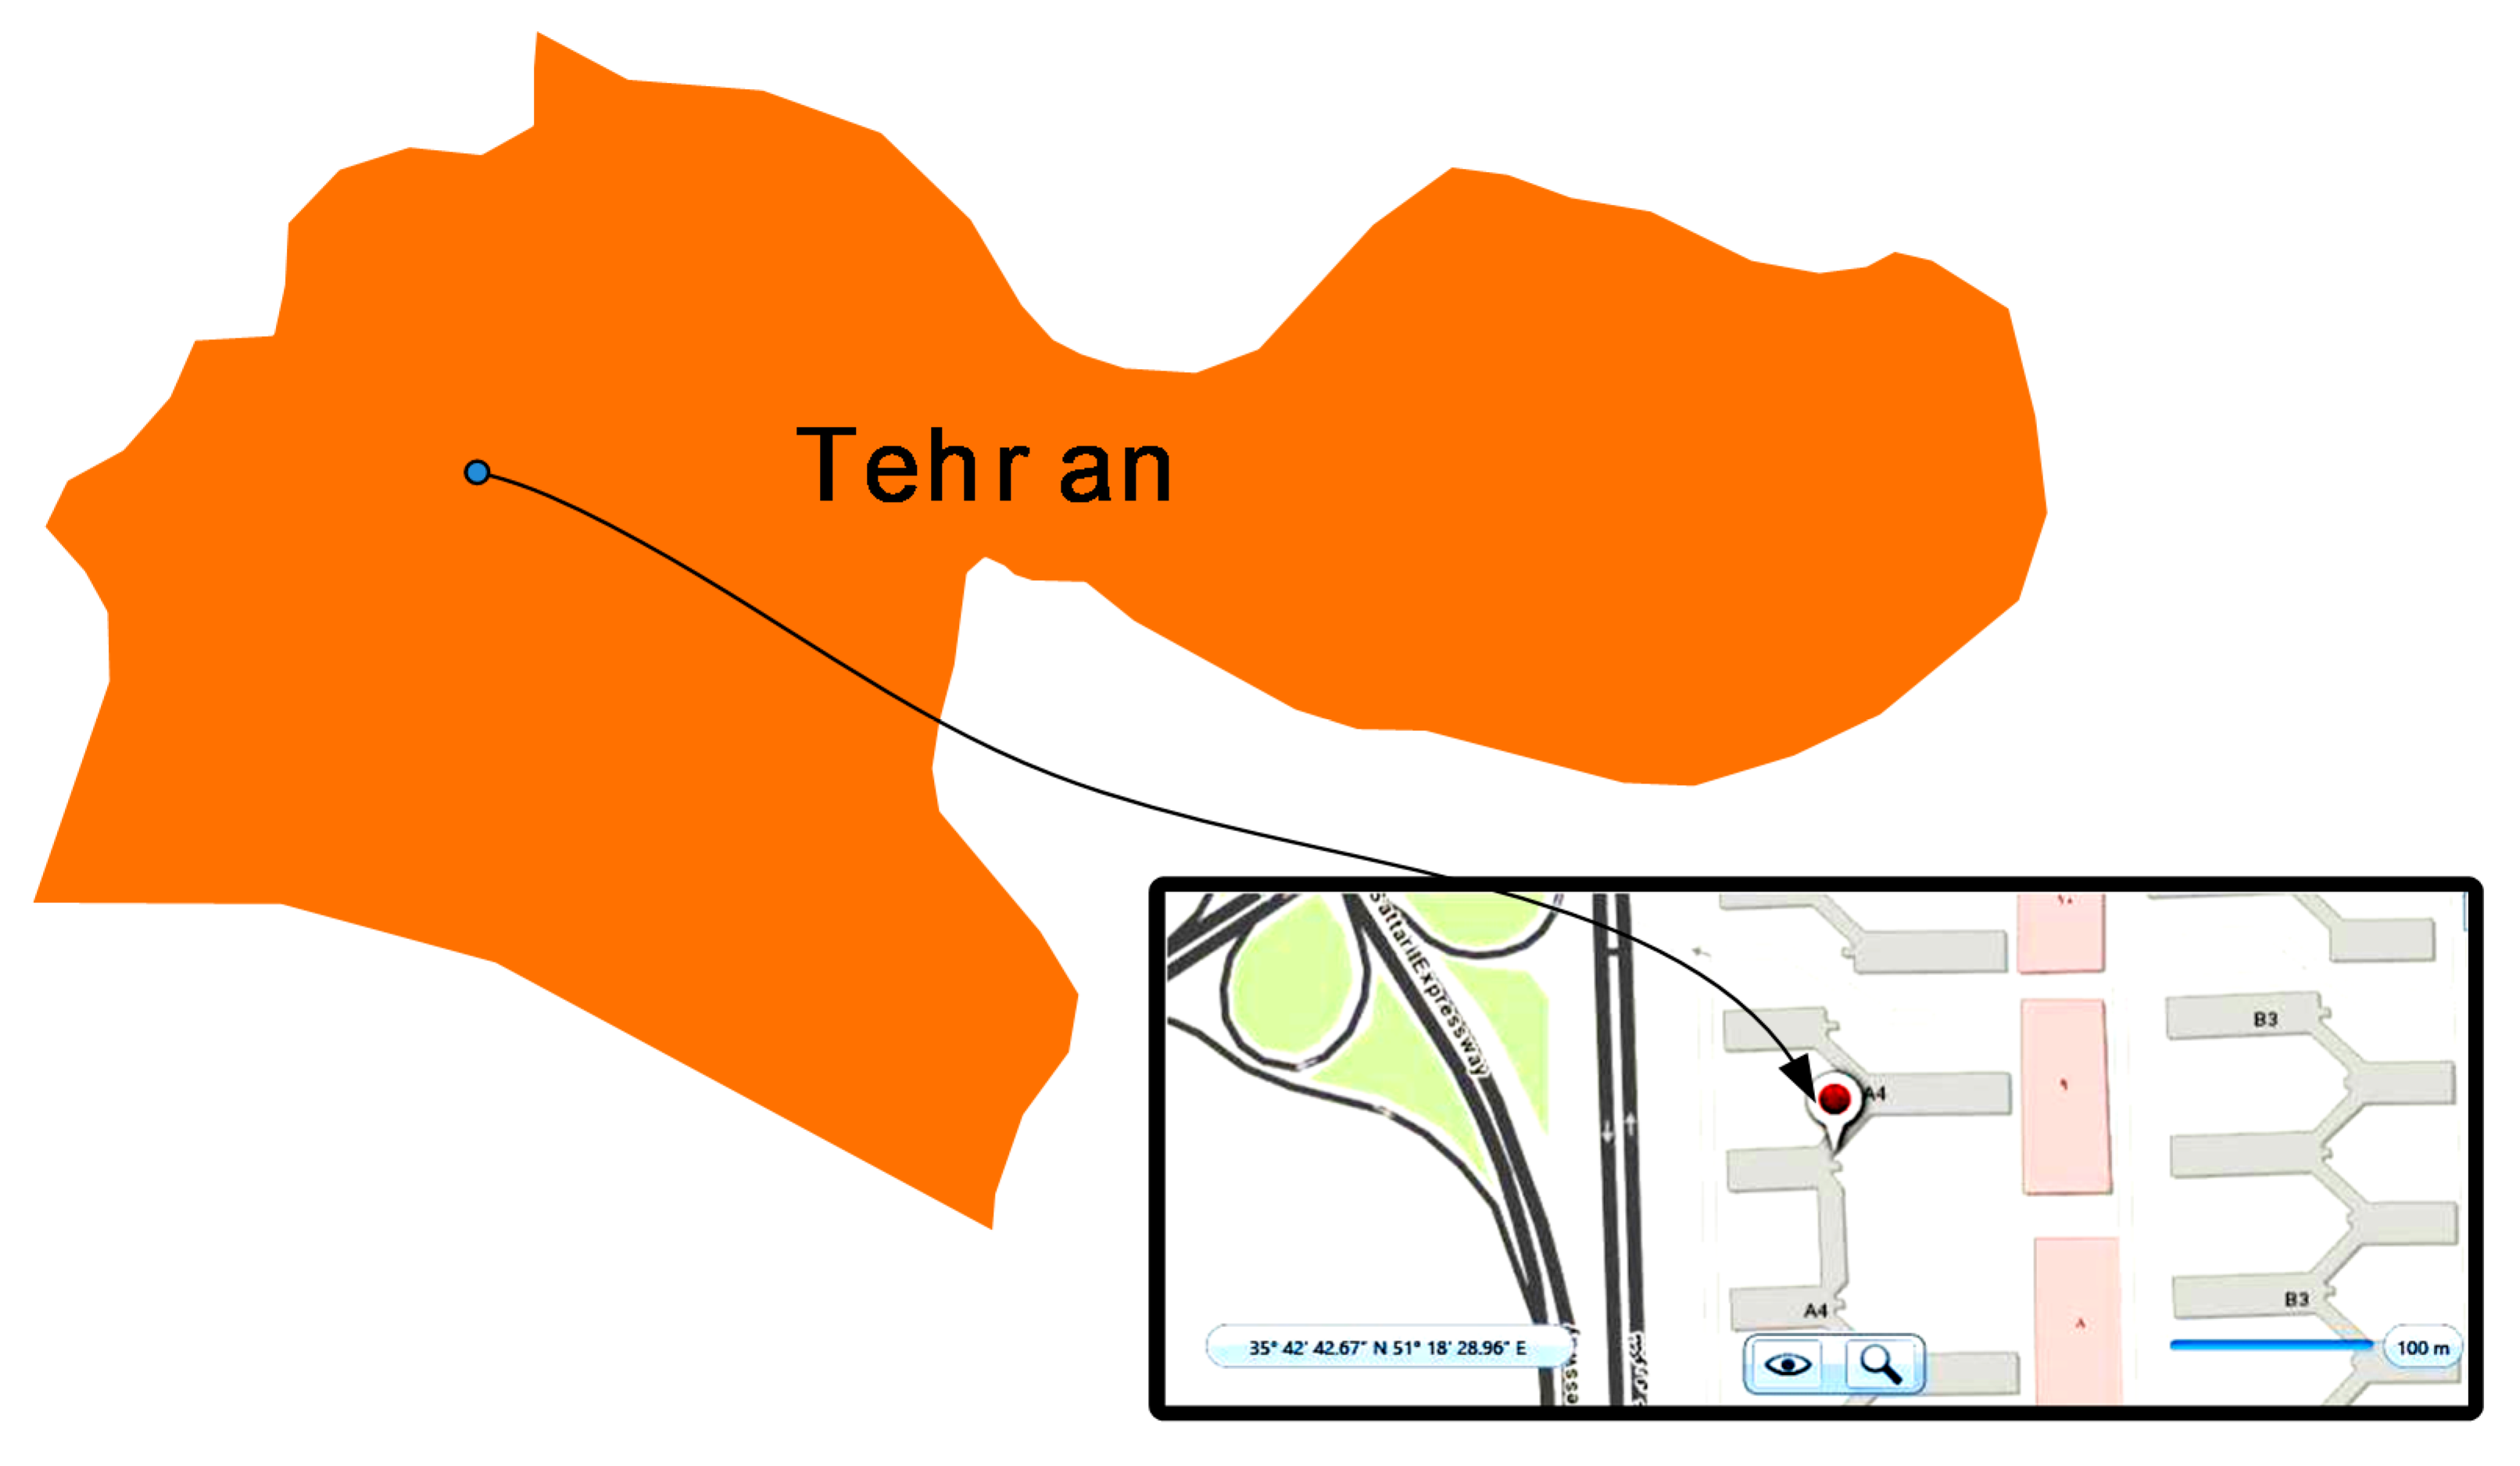
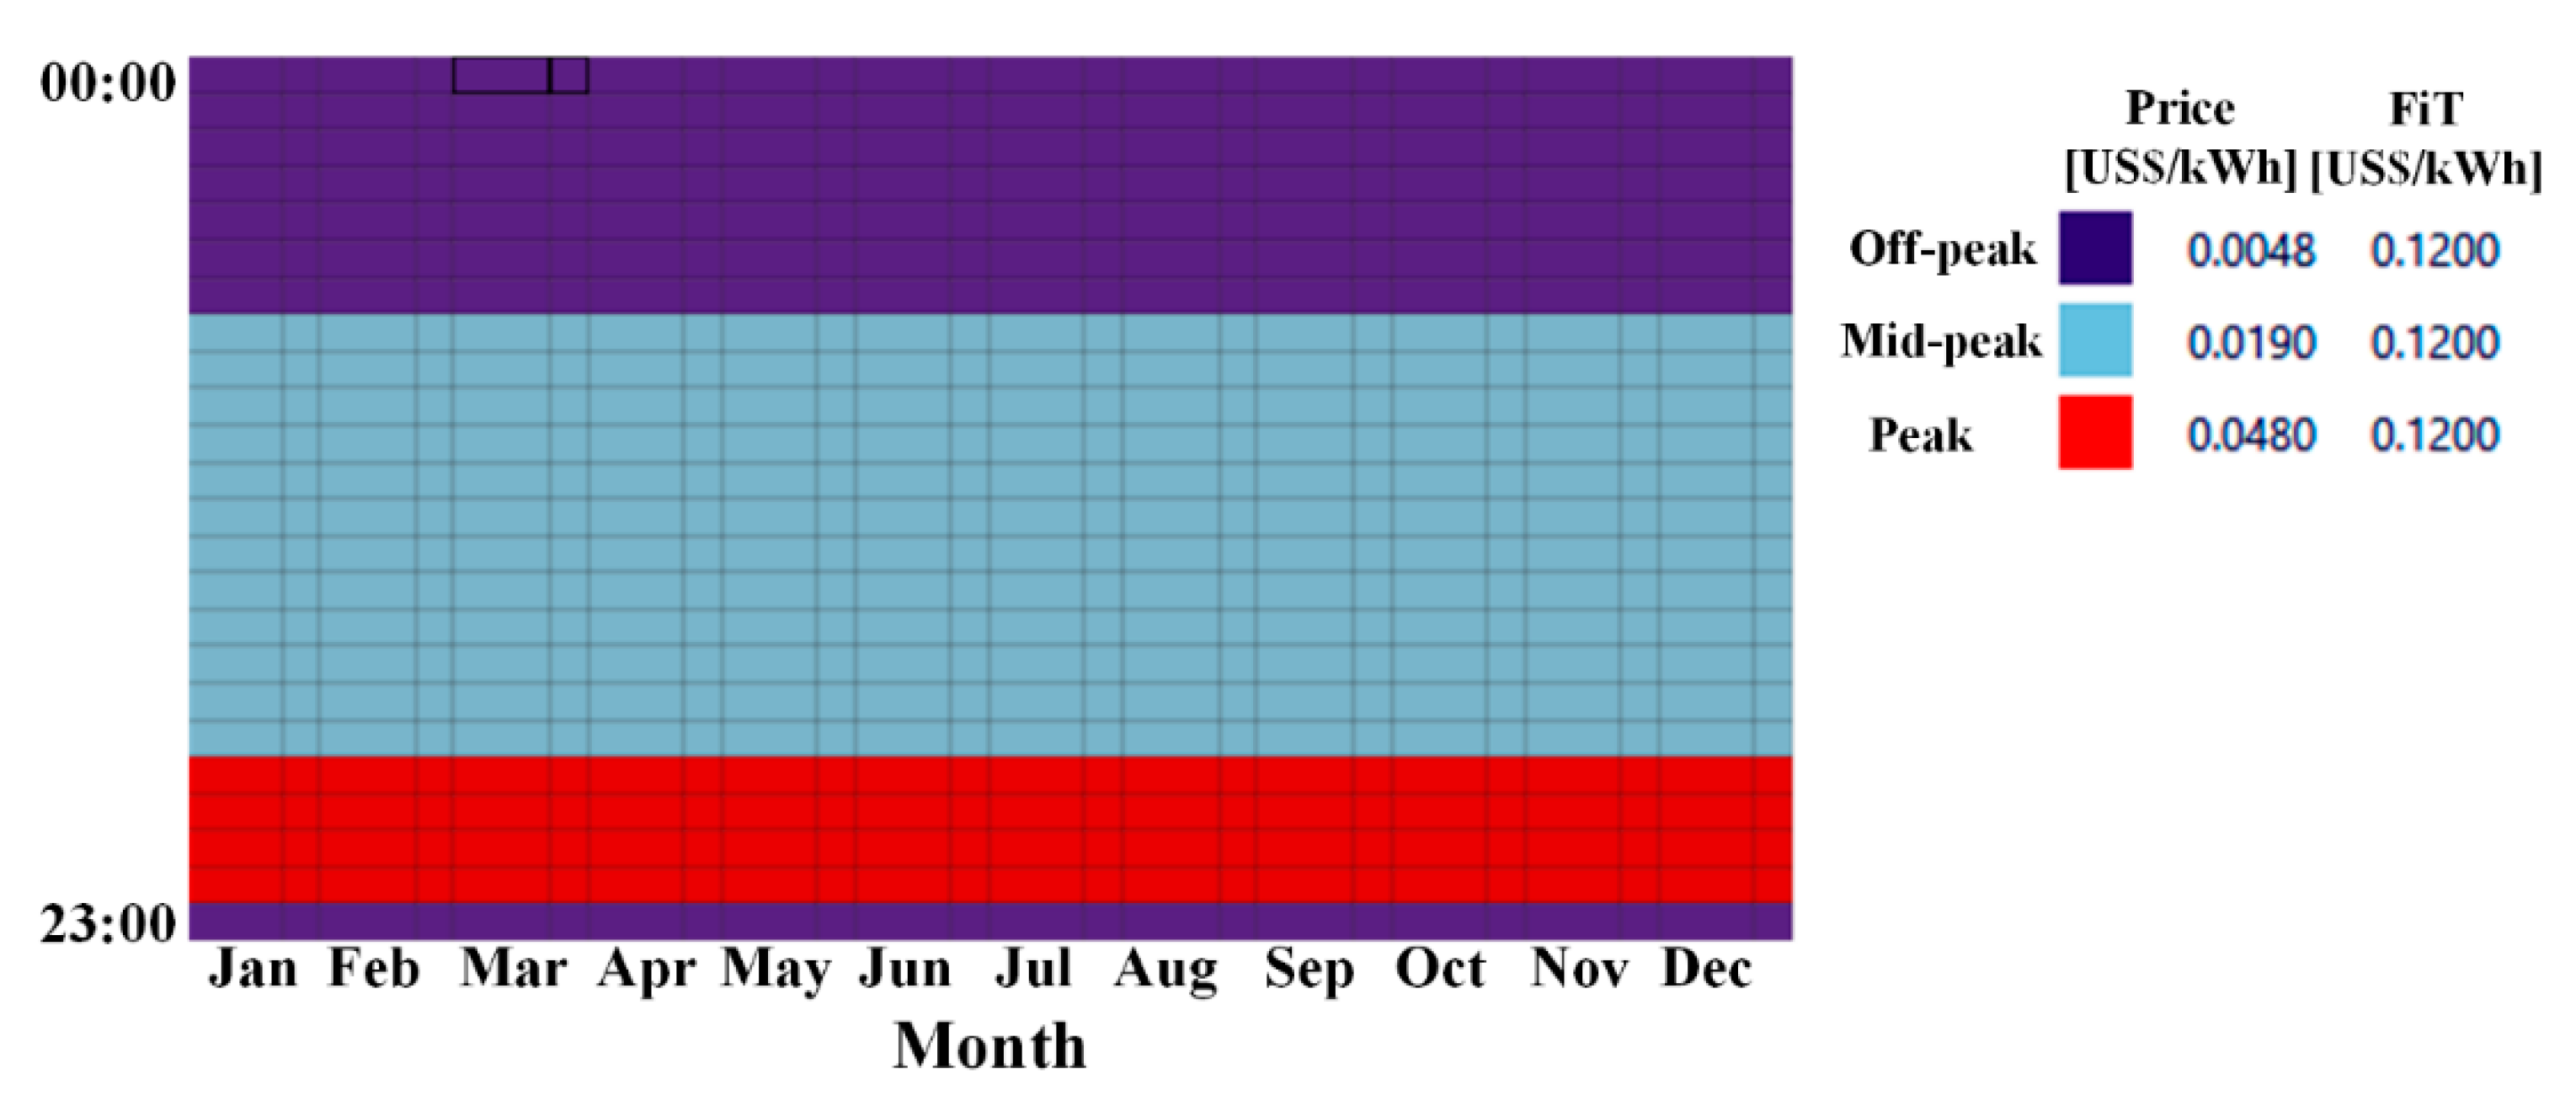
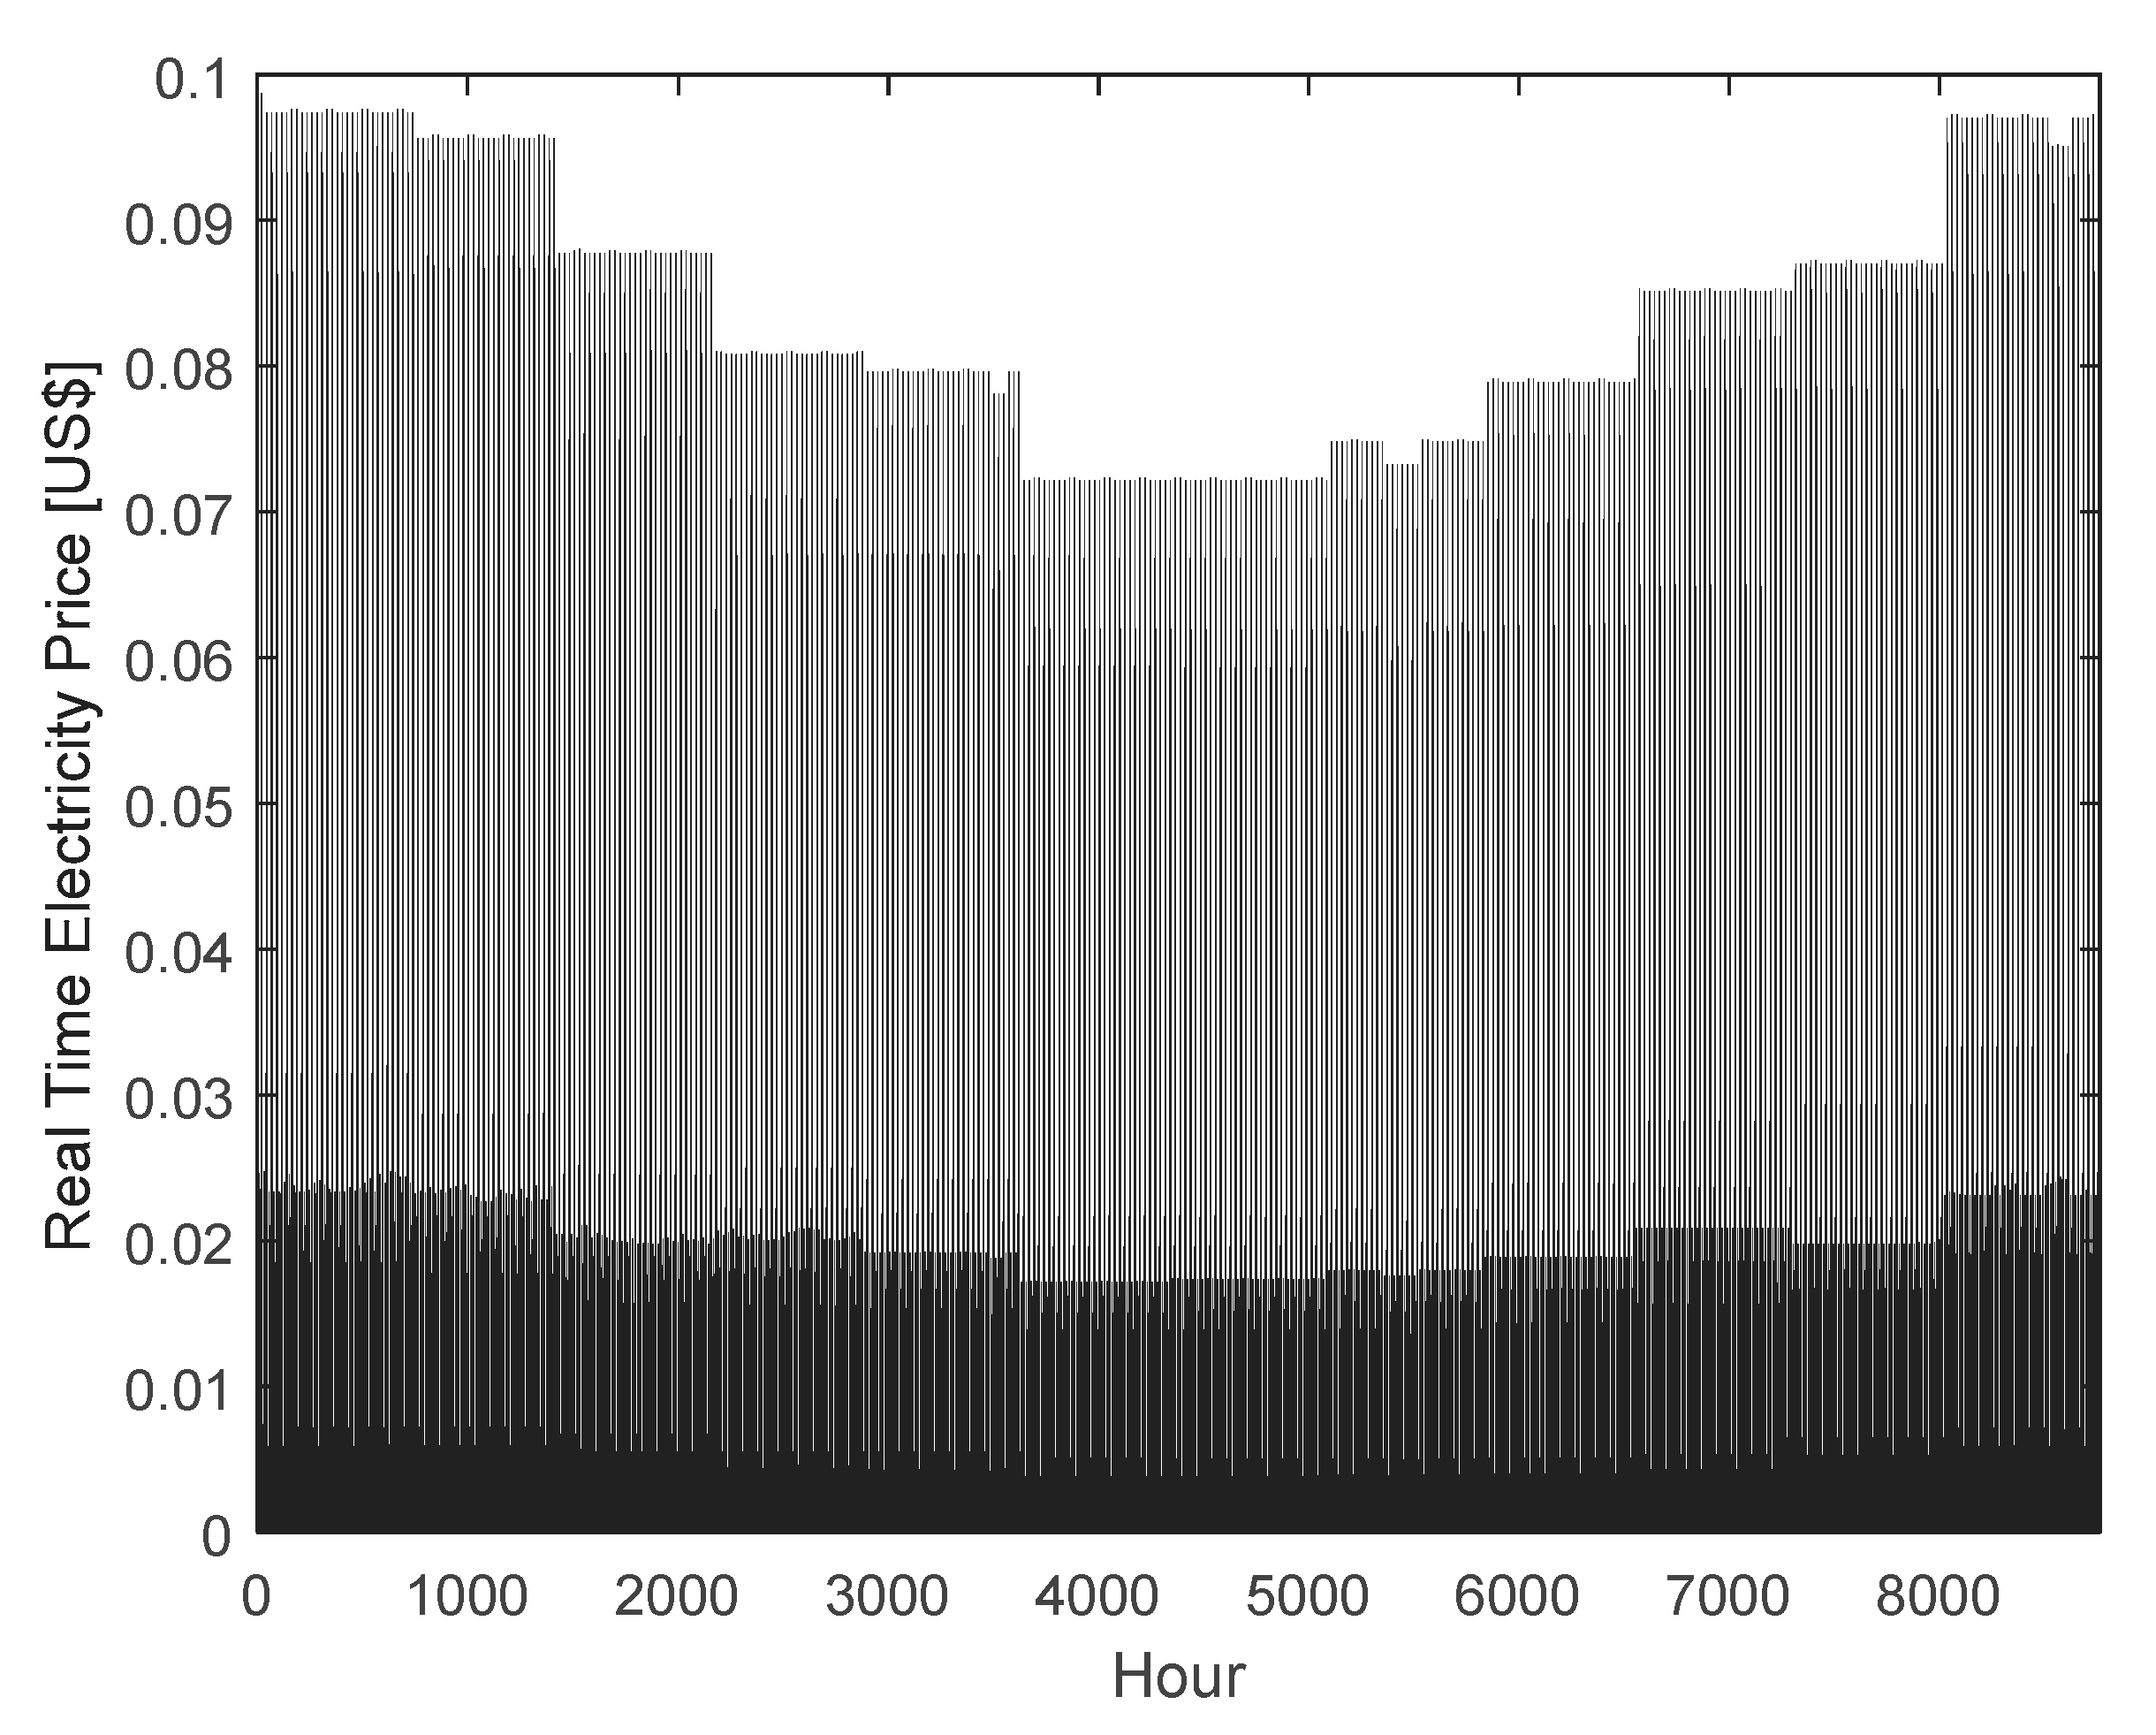
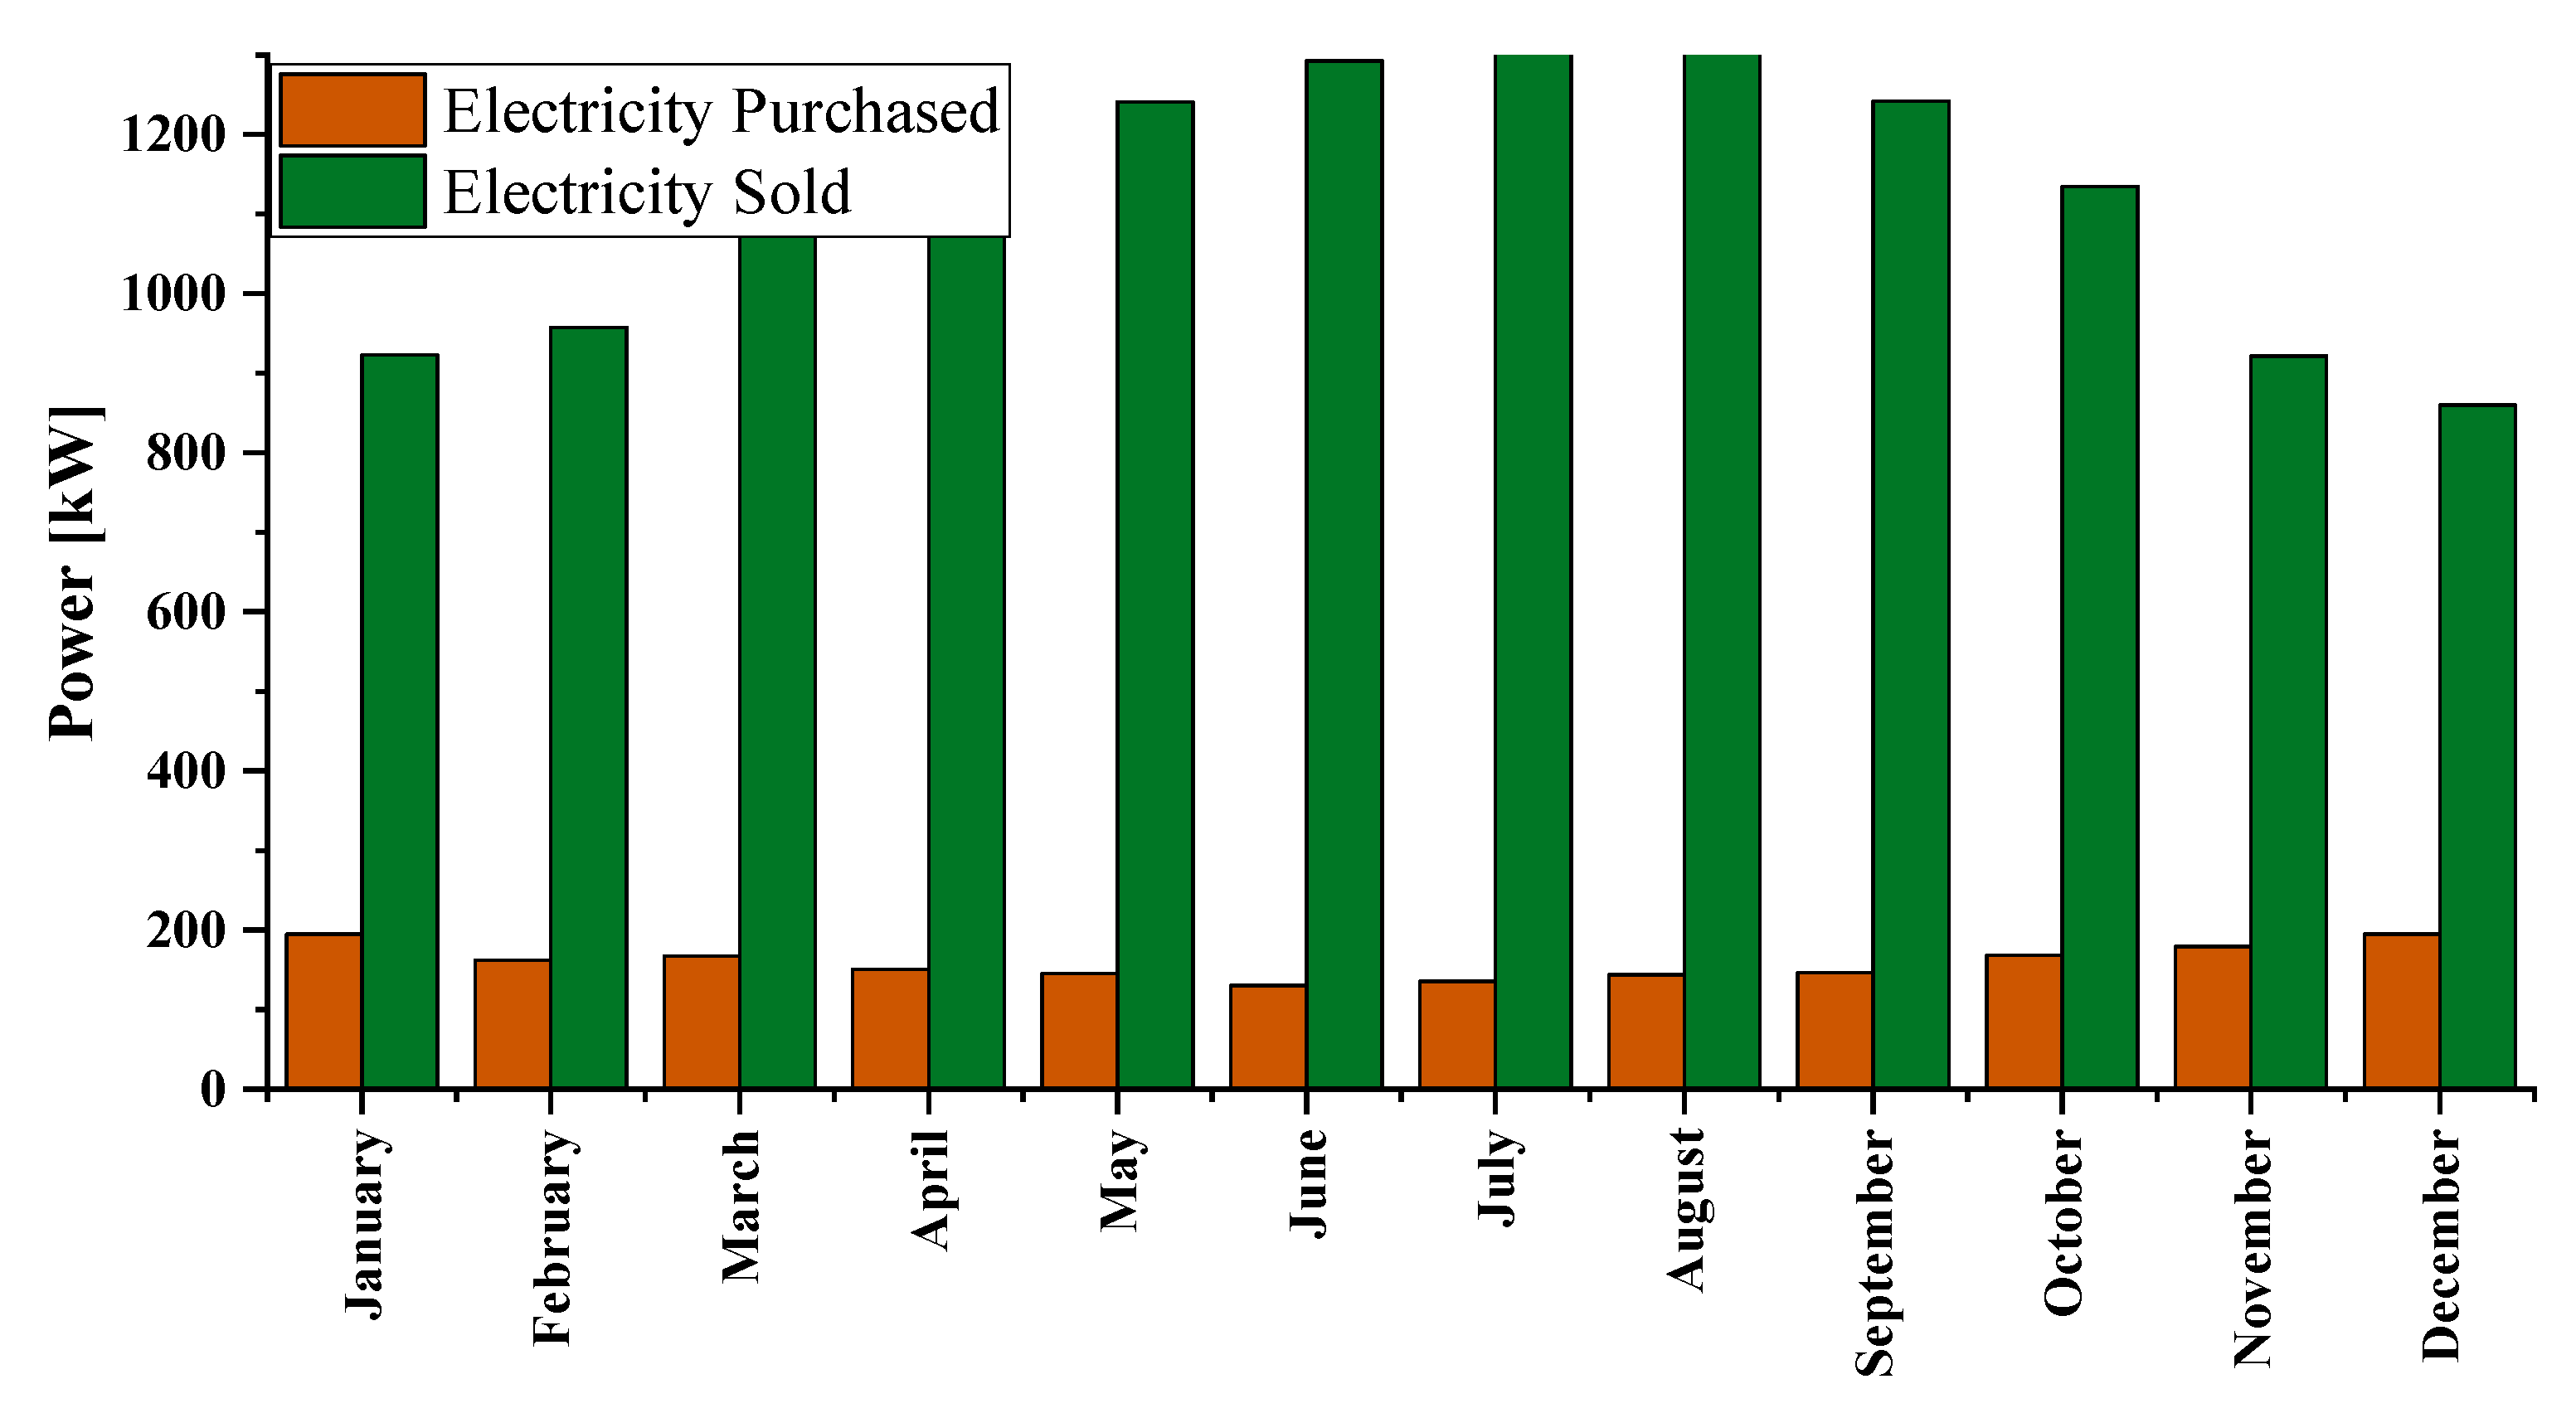
3.1. Utility Grid and DR Program Implementation
3.2. Long-Term Planning Results
- Scenario 1: Optimal planning of the MG using TOU pricing mechanism.
- Scenario 2: Optimal planning of the MG using RTP mechanism.
3.2.1. Scenario 1
3.2.2. Scenario 2
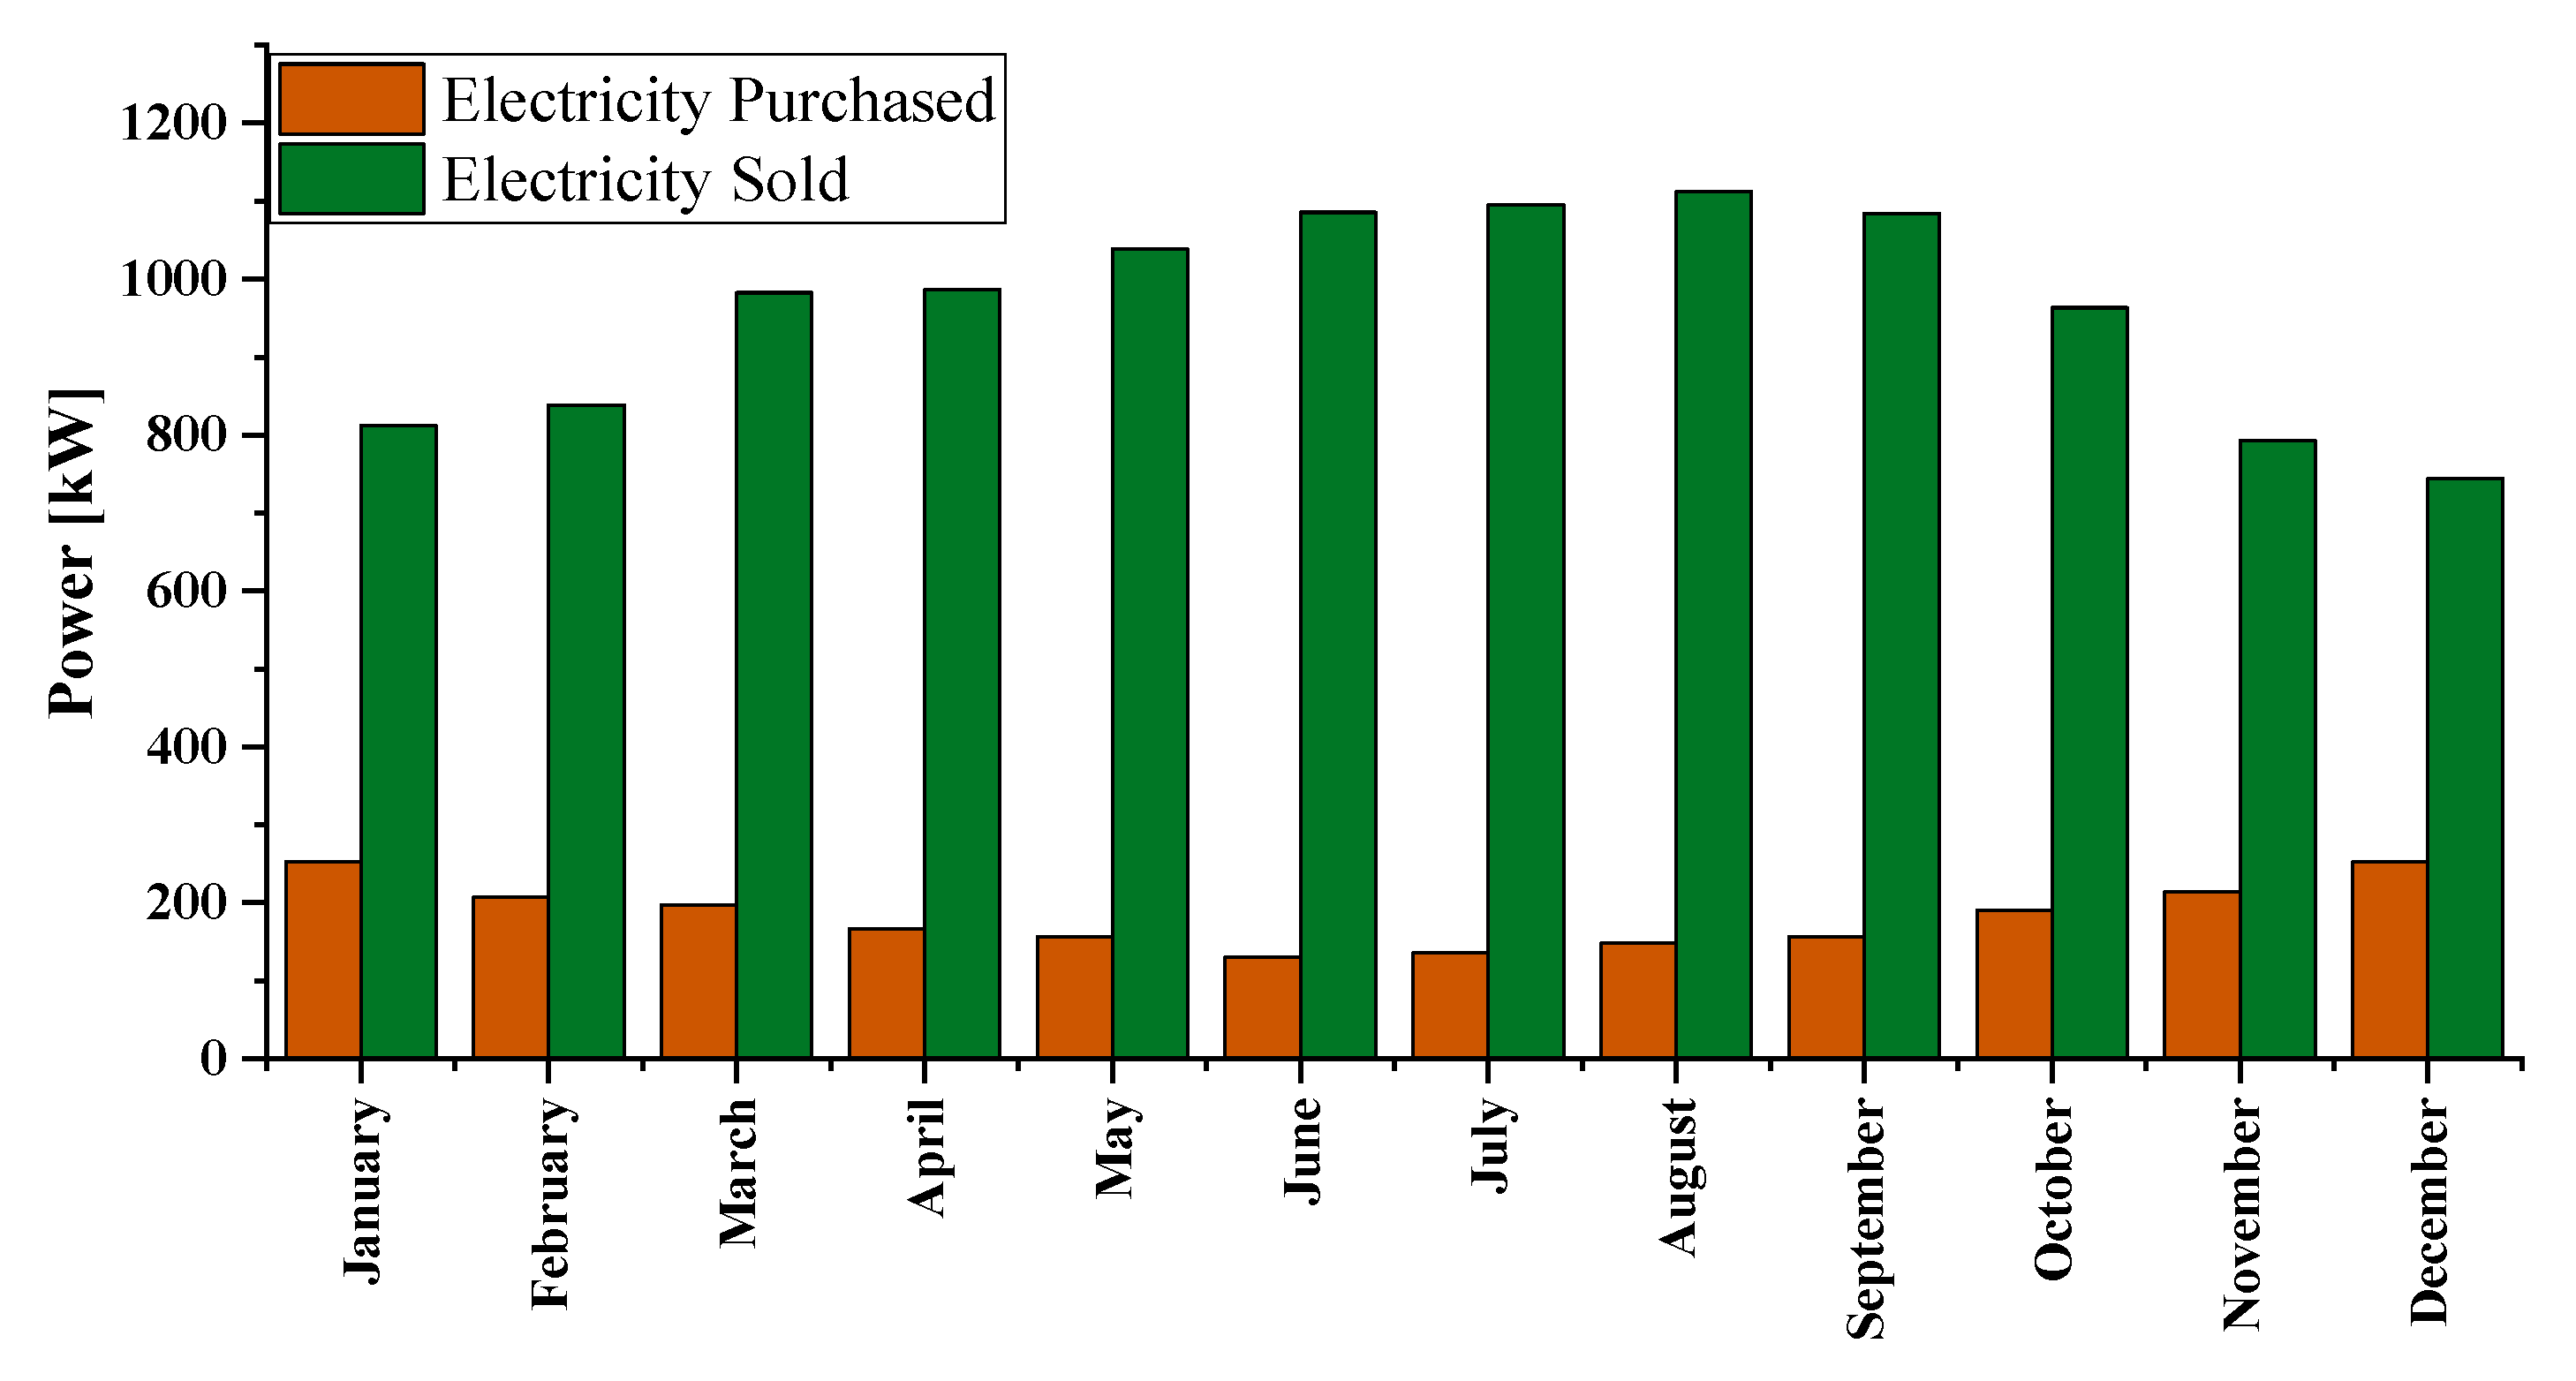
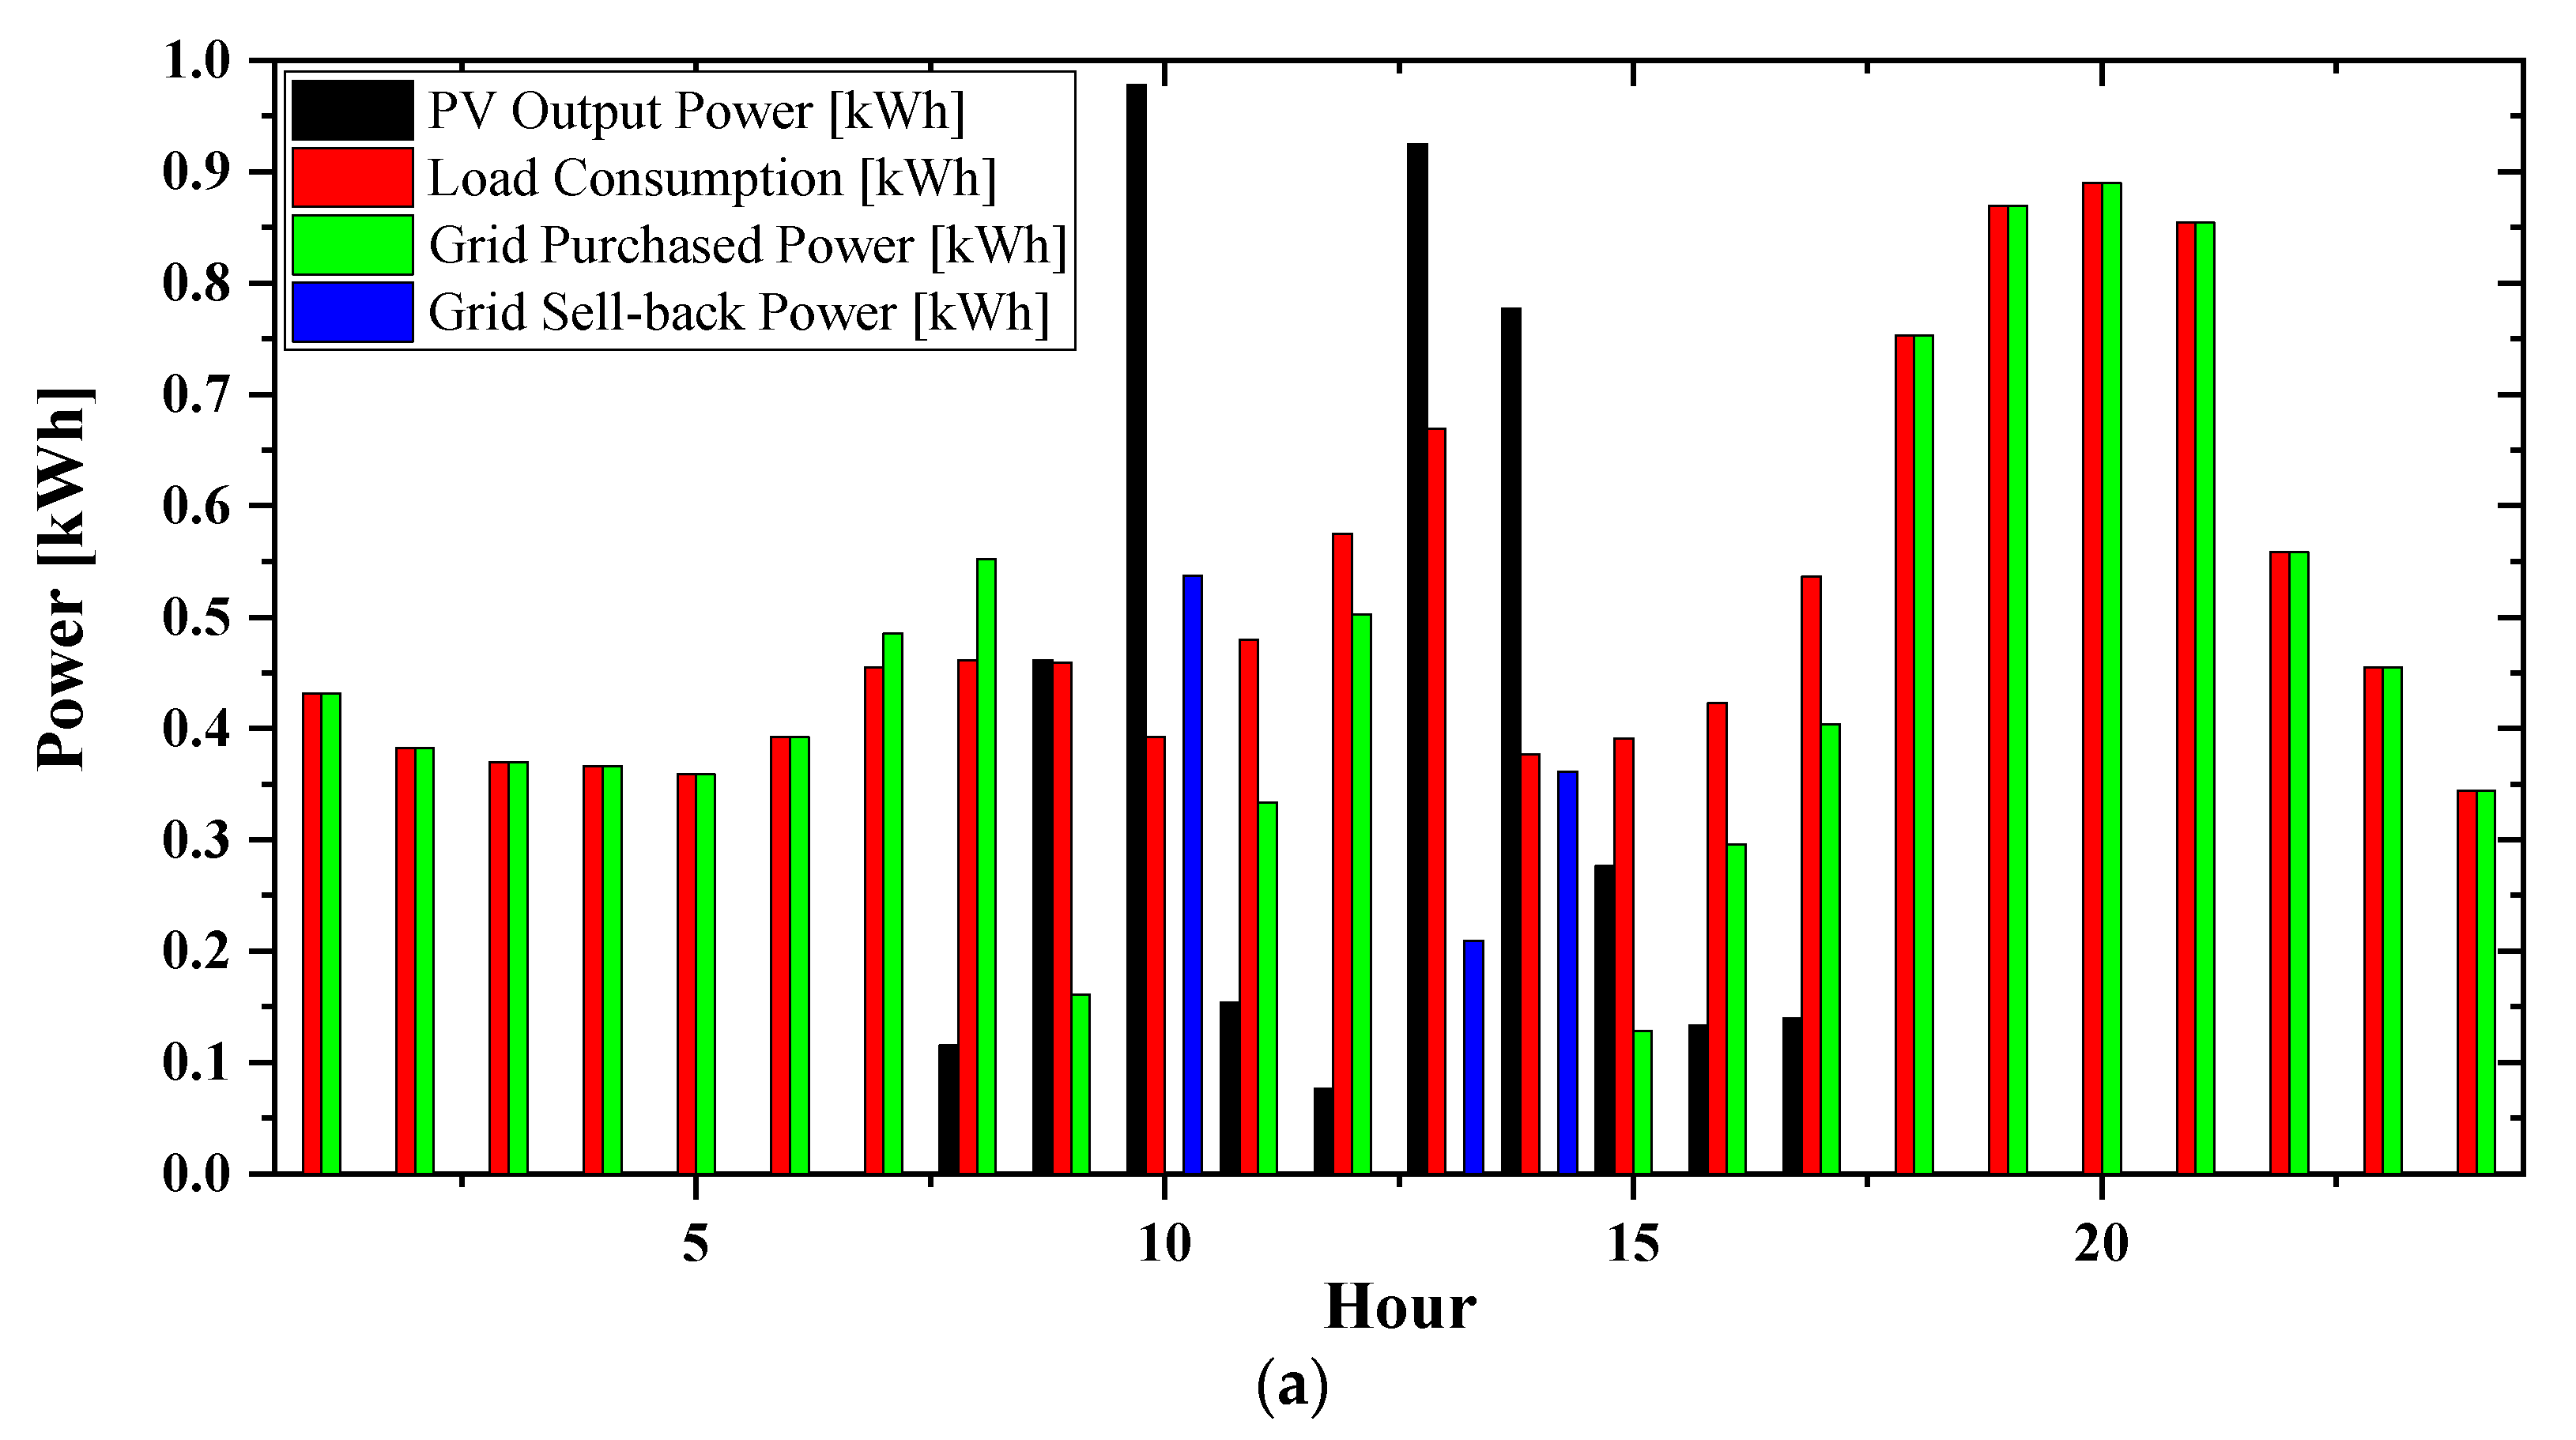
3.3. Day-Ahead Operation Results
- Scenario 1: Optimal operation of the MG using TOU pricing mechanism.
- Scenario 2: Optimal operation of the MG using RTP mechanism.
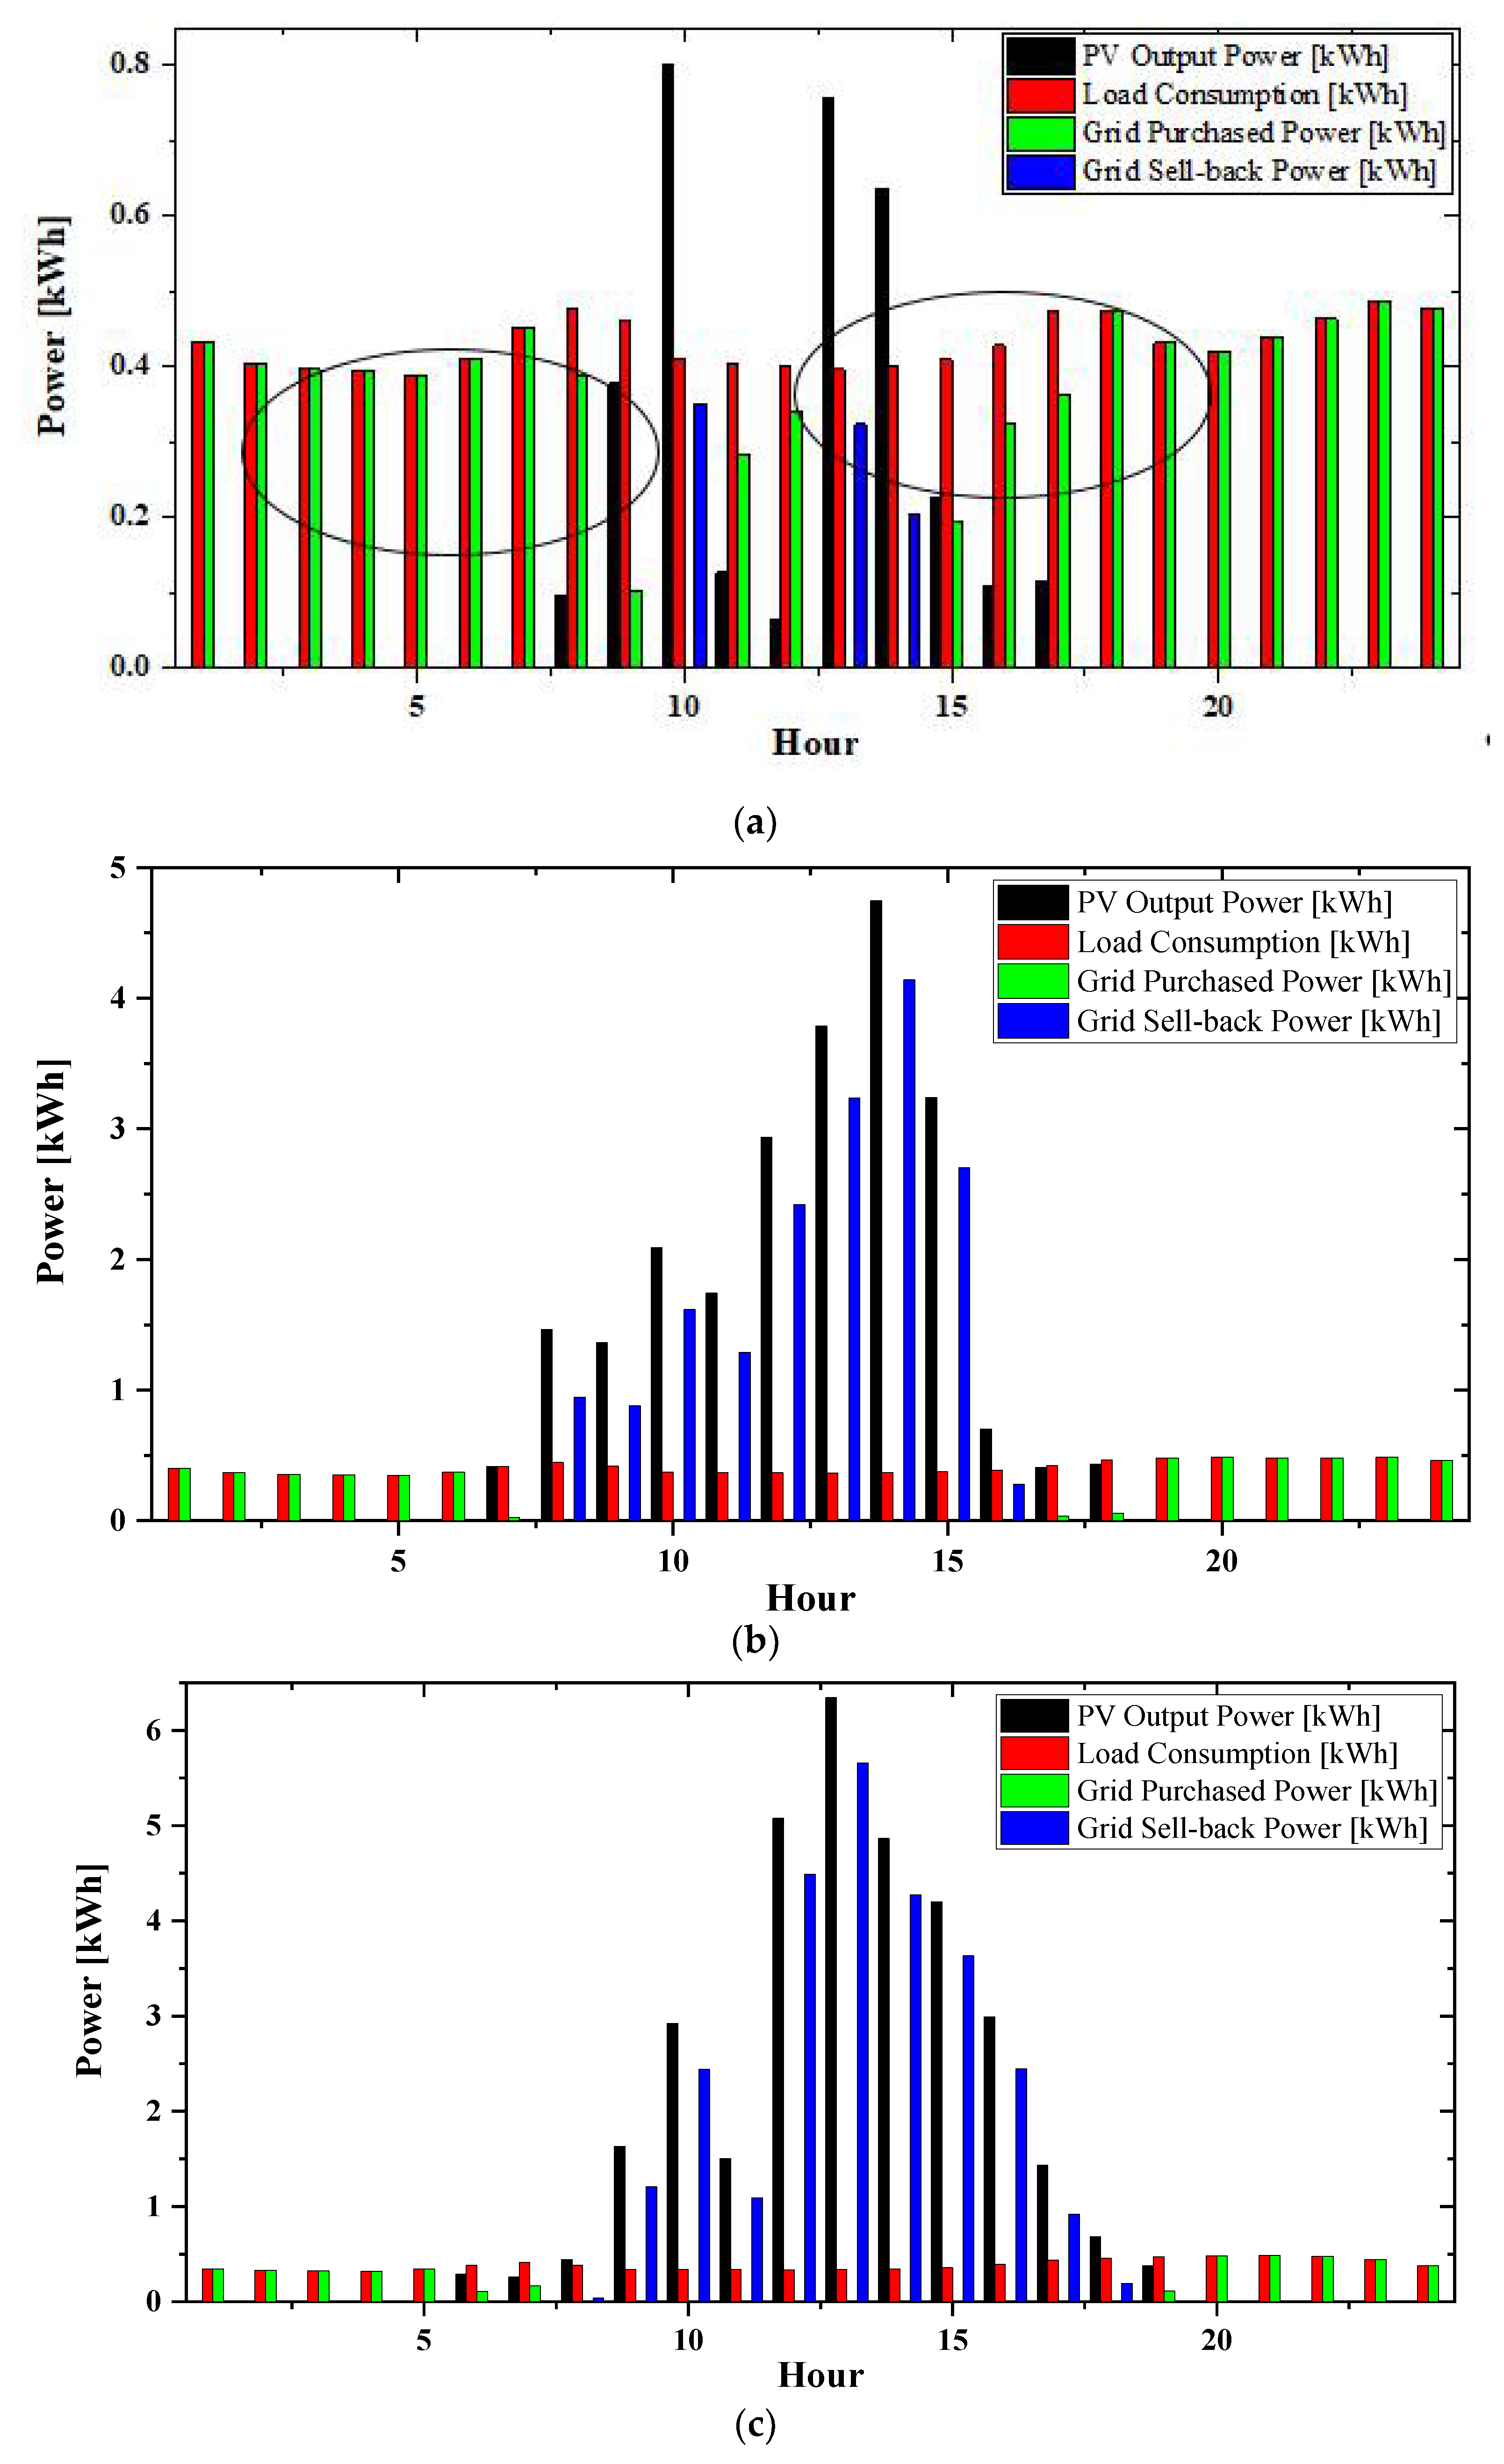
3.3.1. Scenario 1
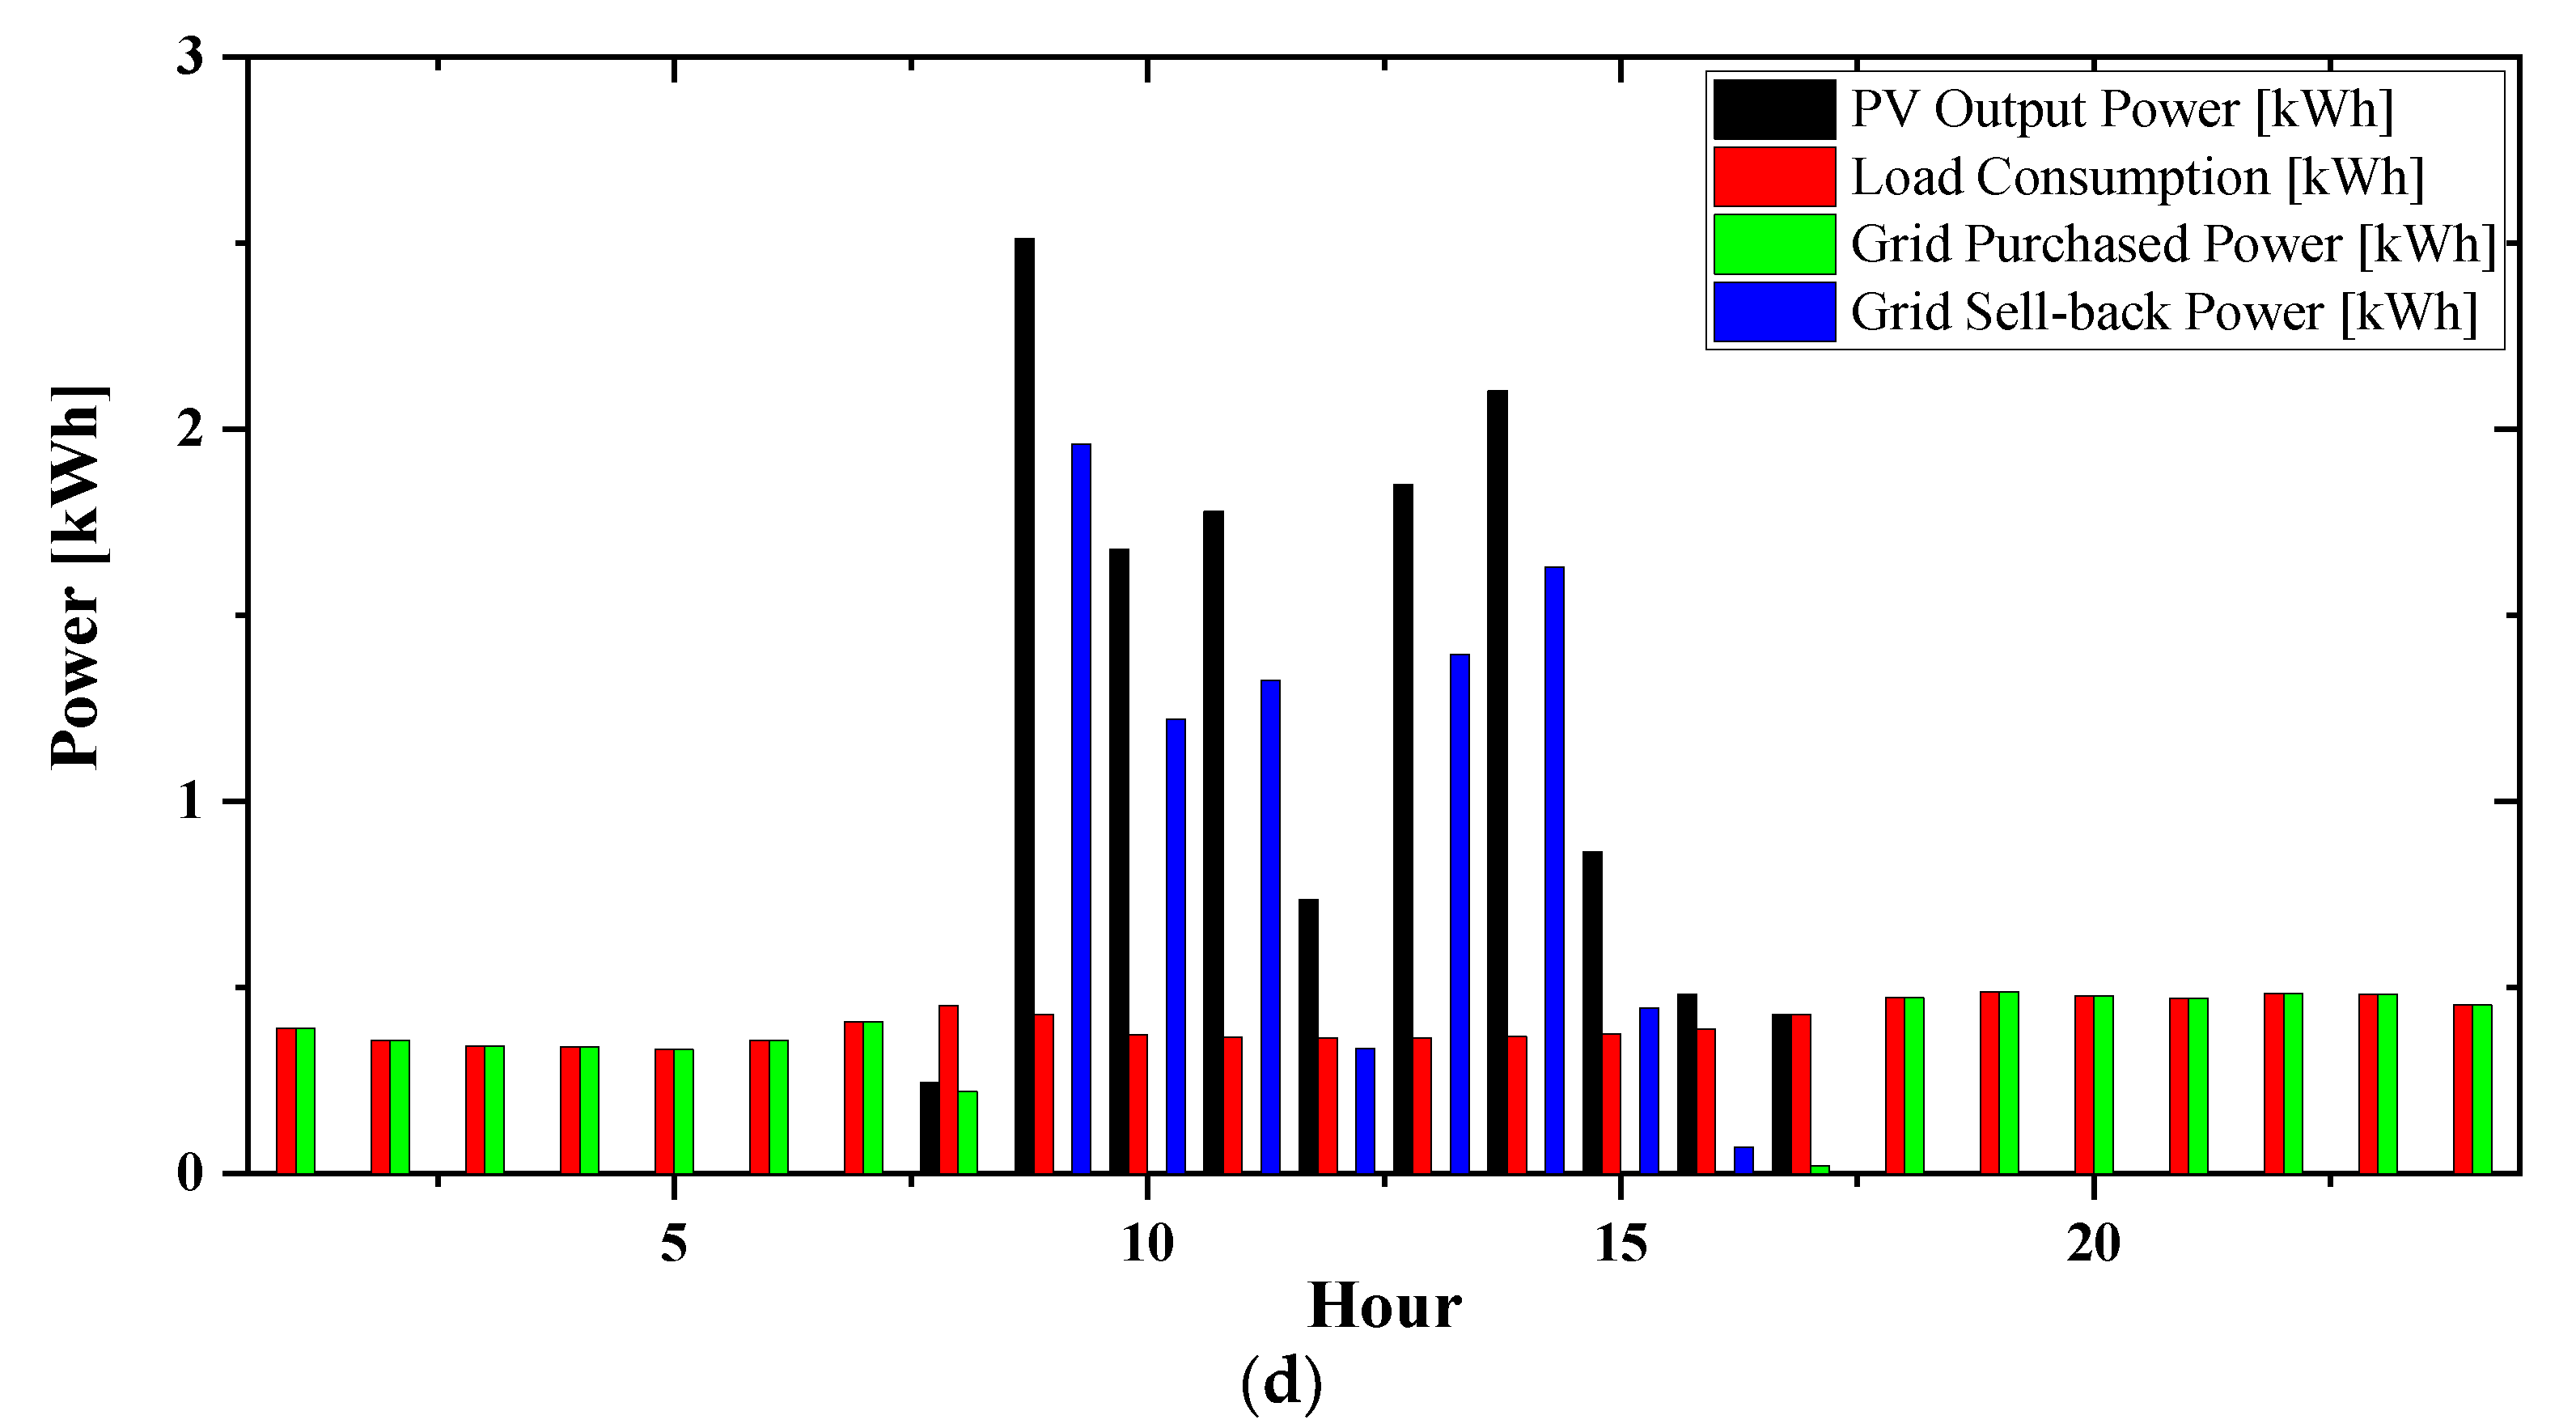
3.3.2. Scenario 2
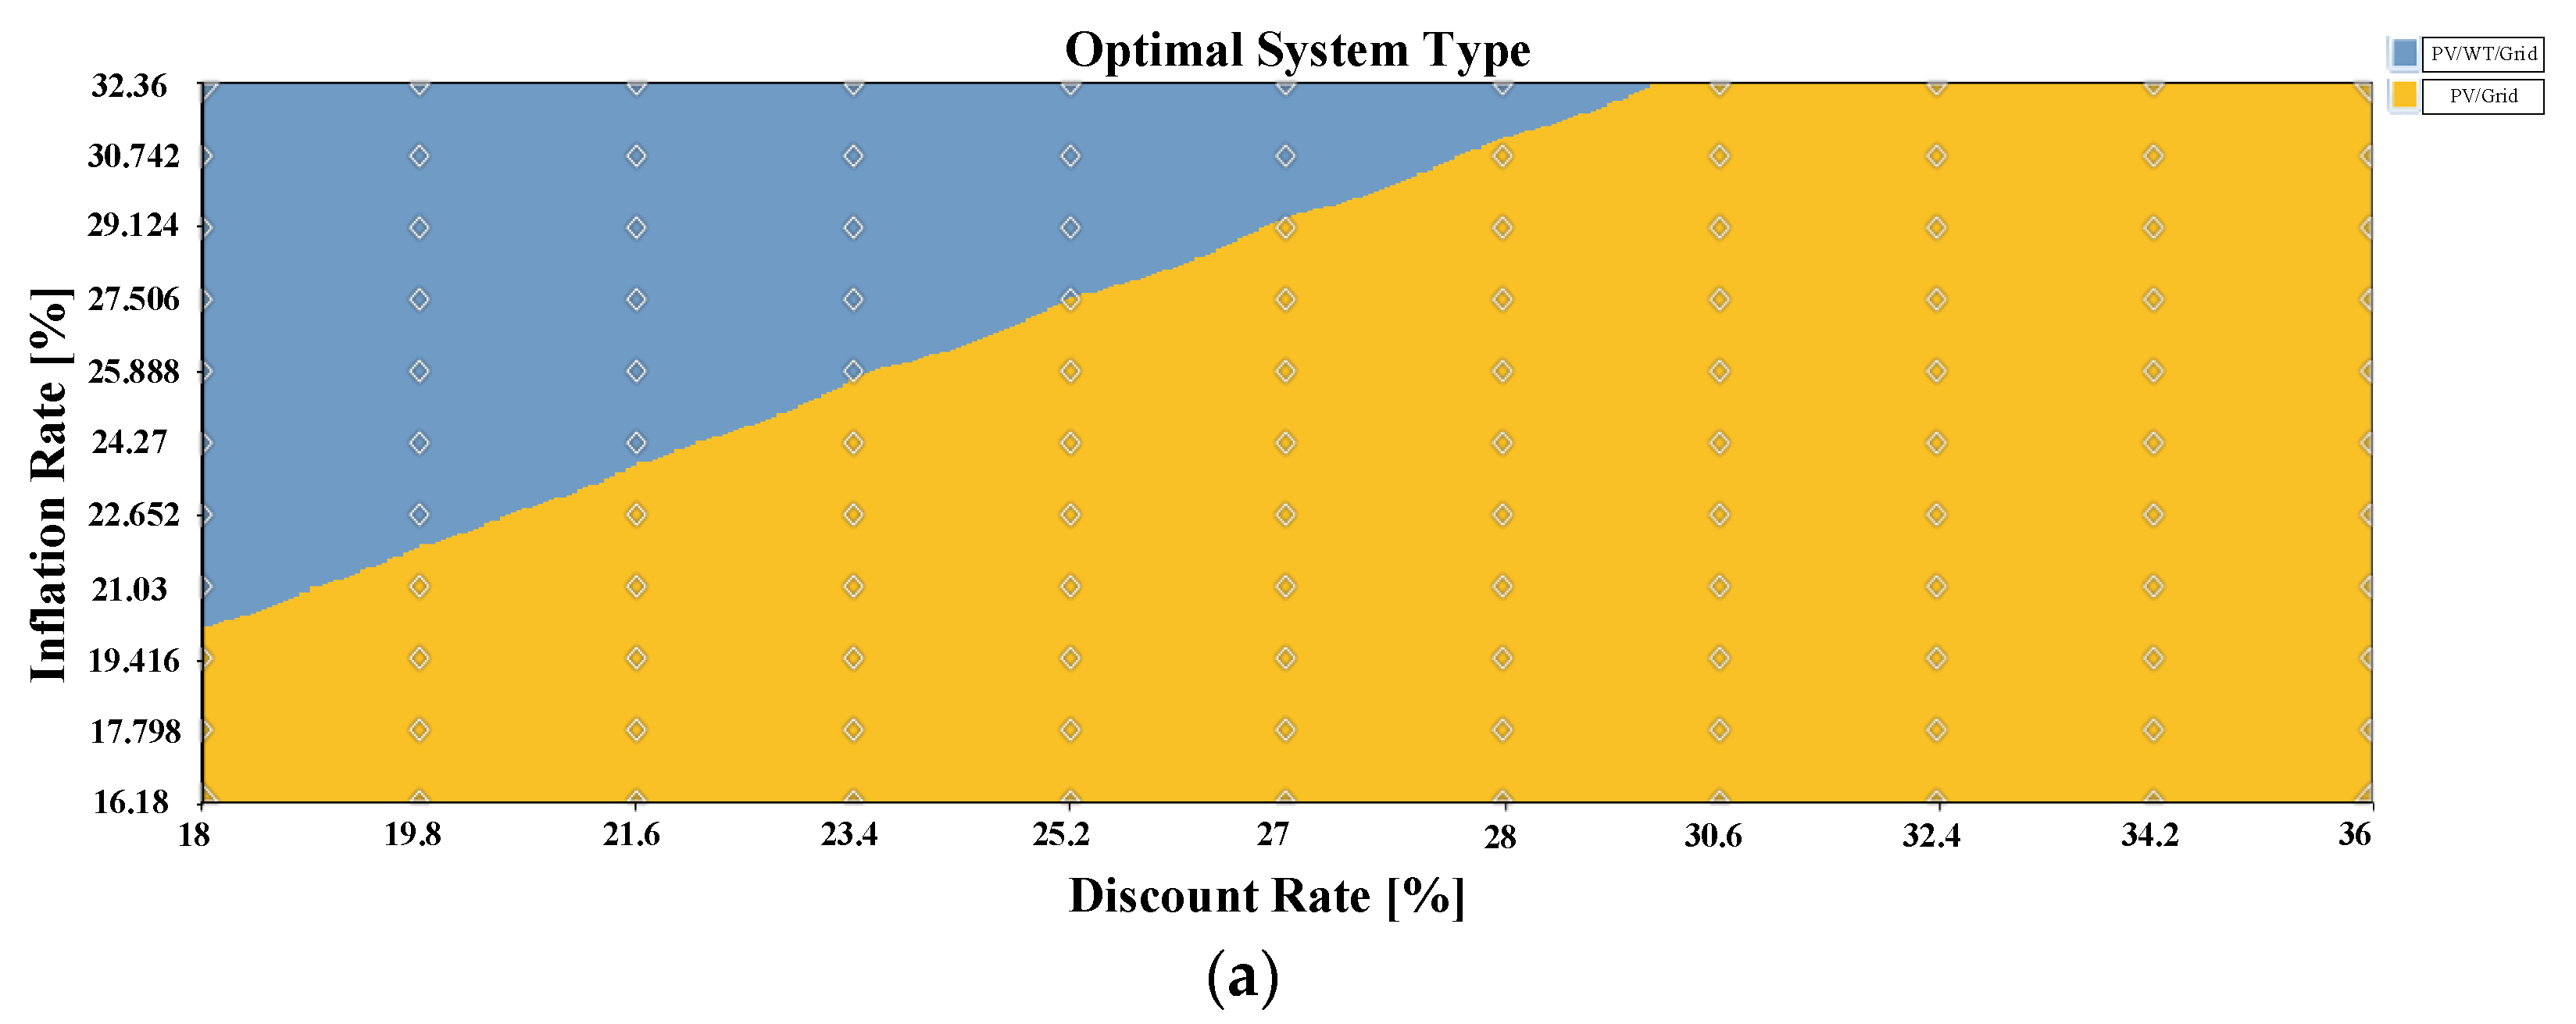
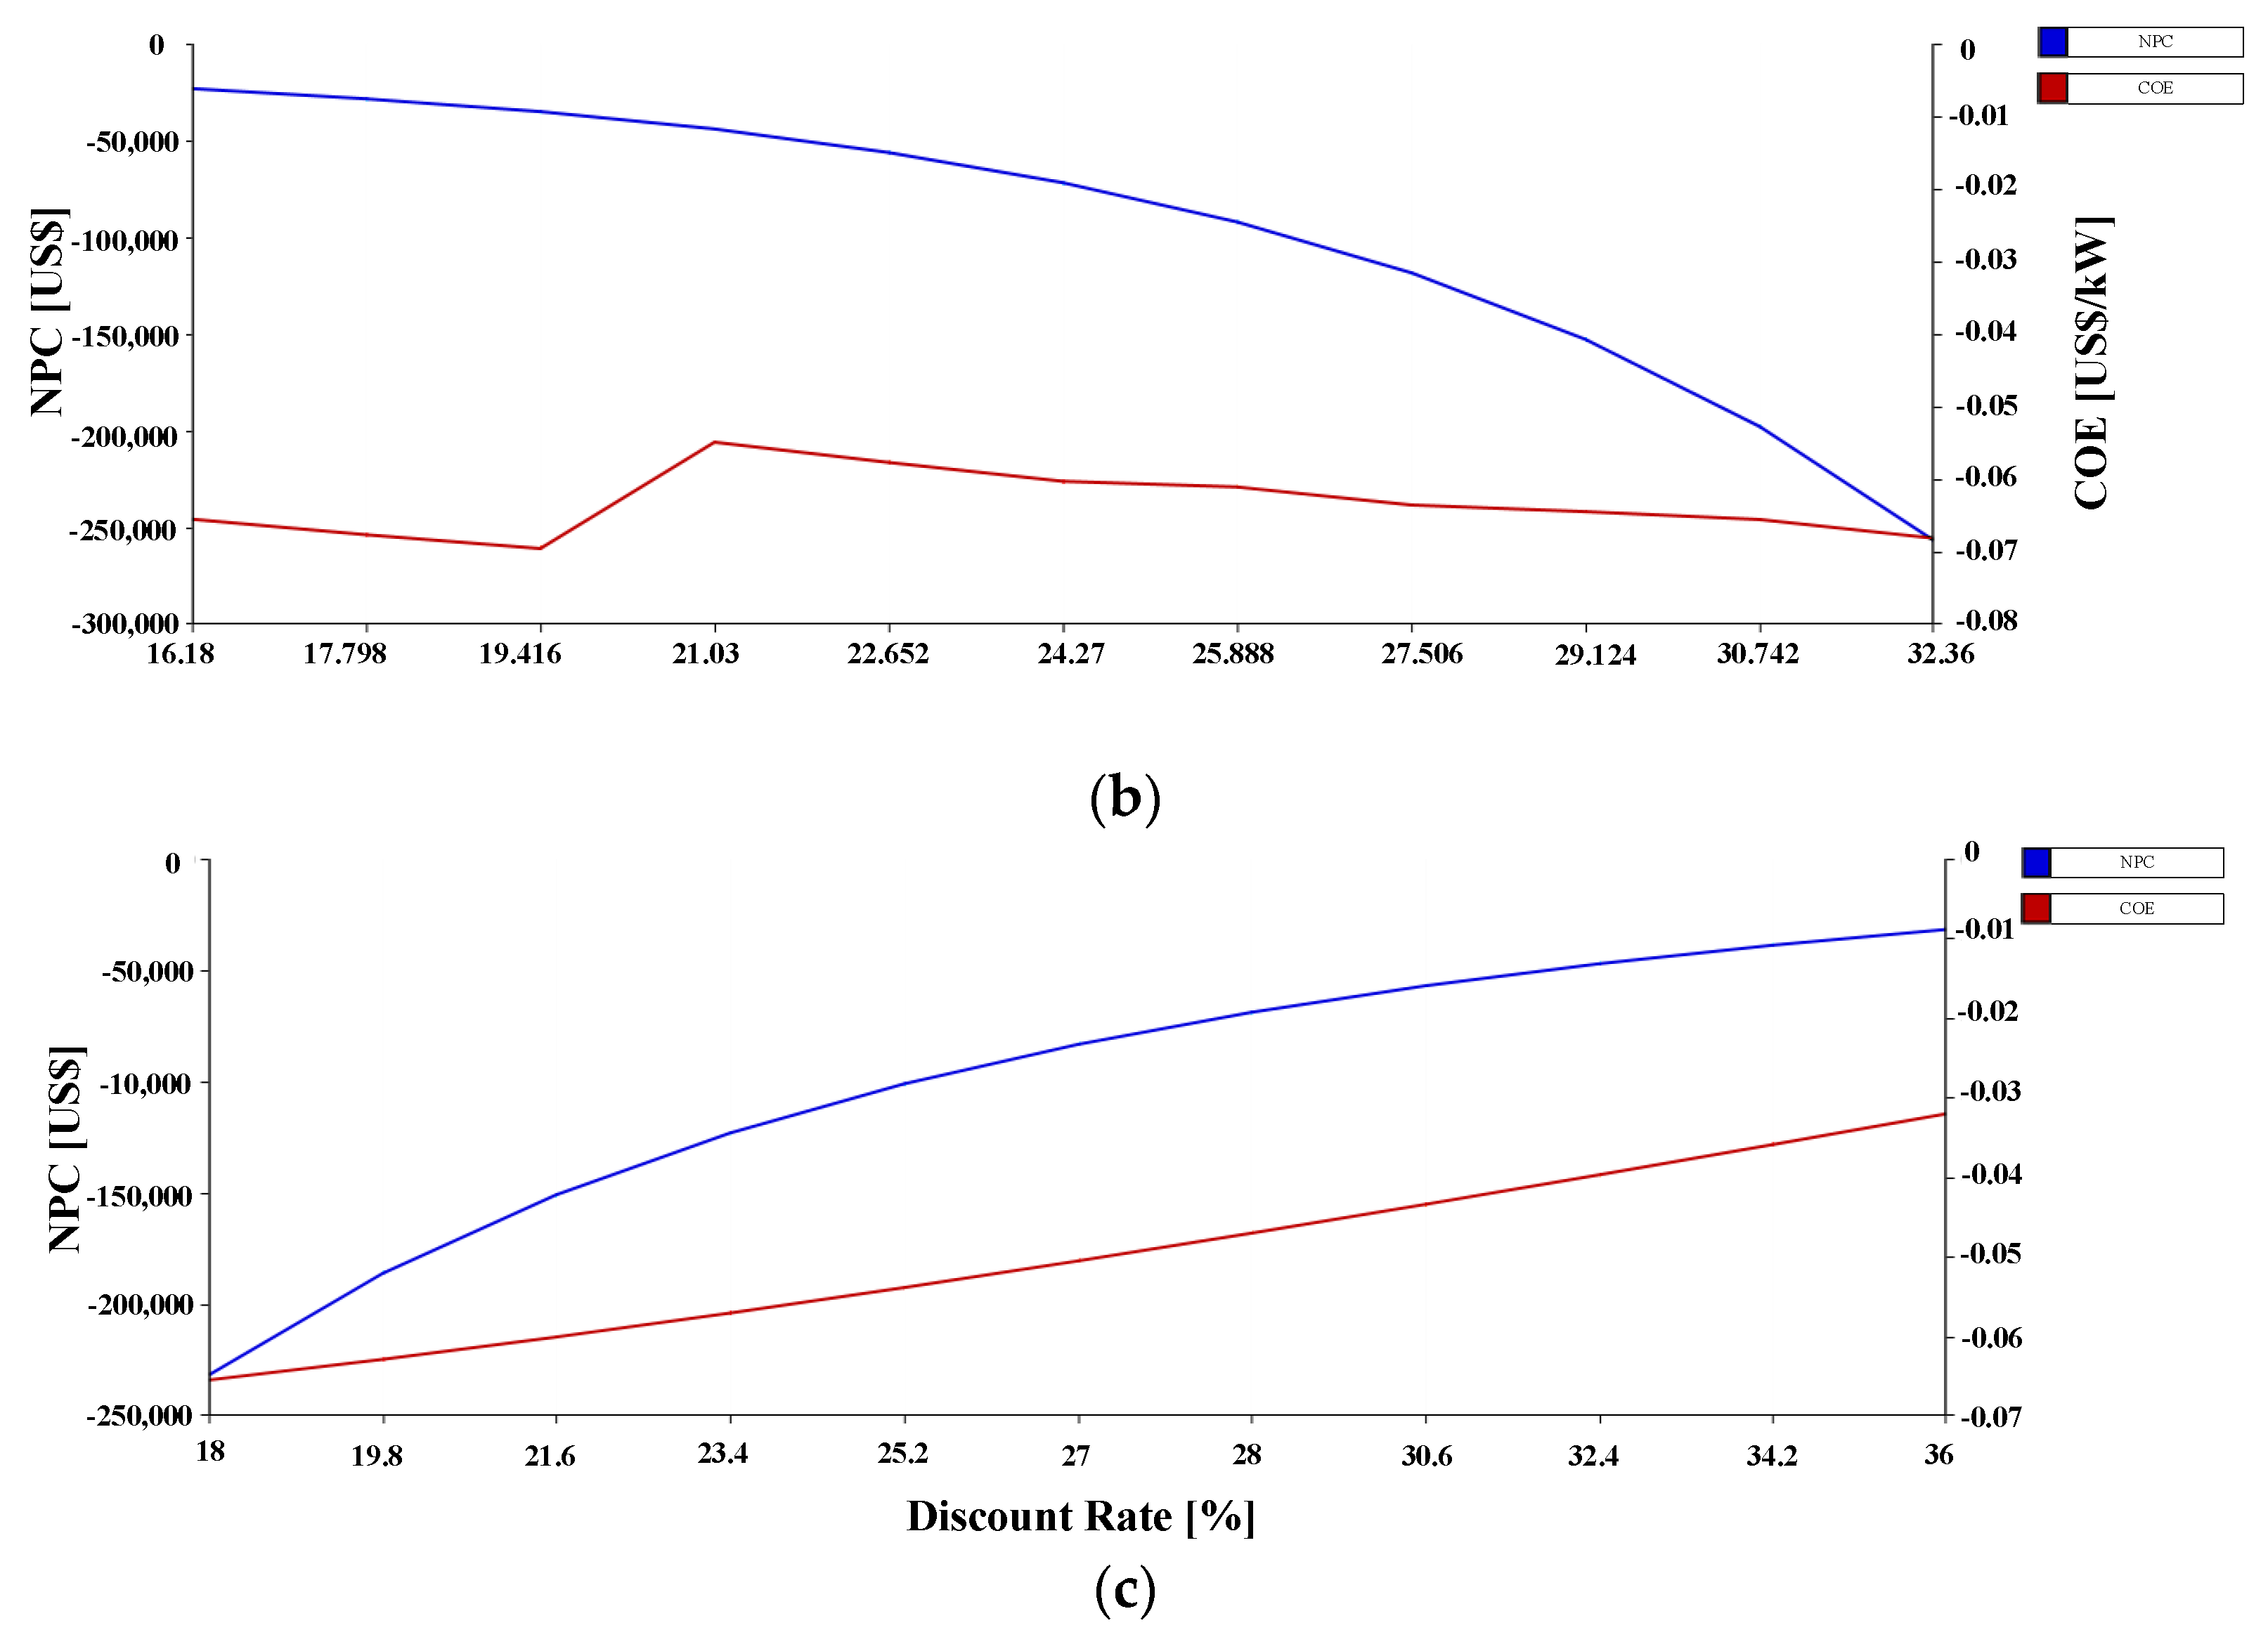
3.4. Sensitivity Analysis
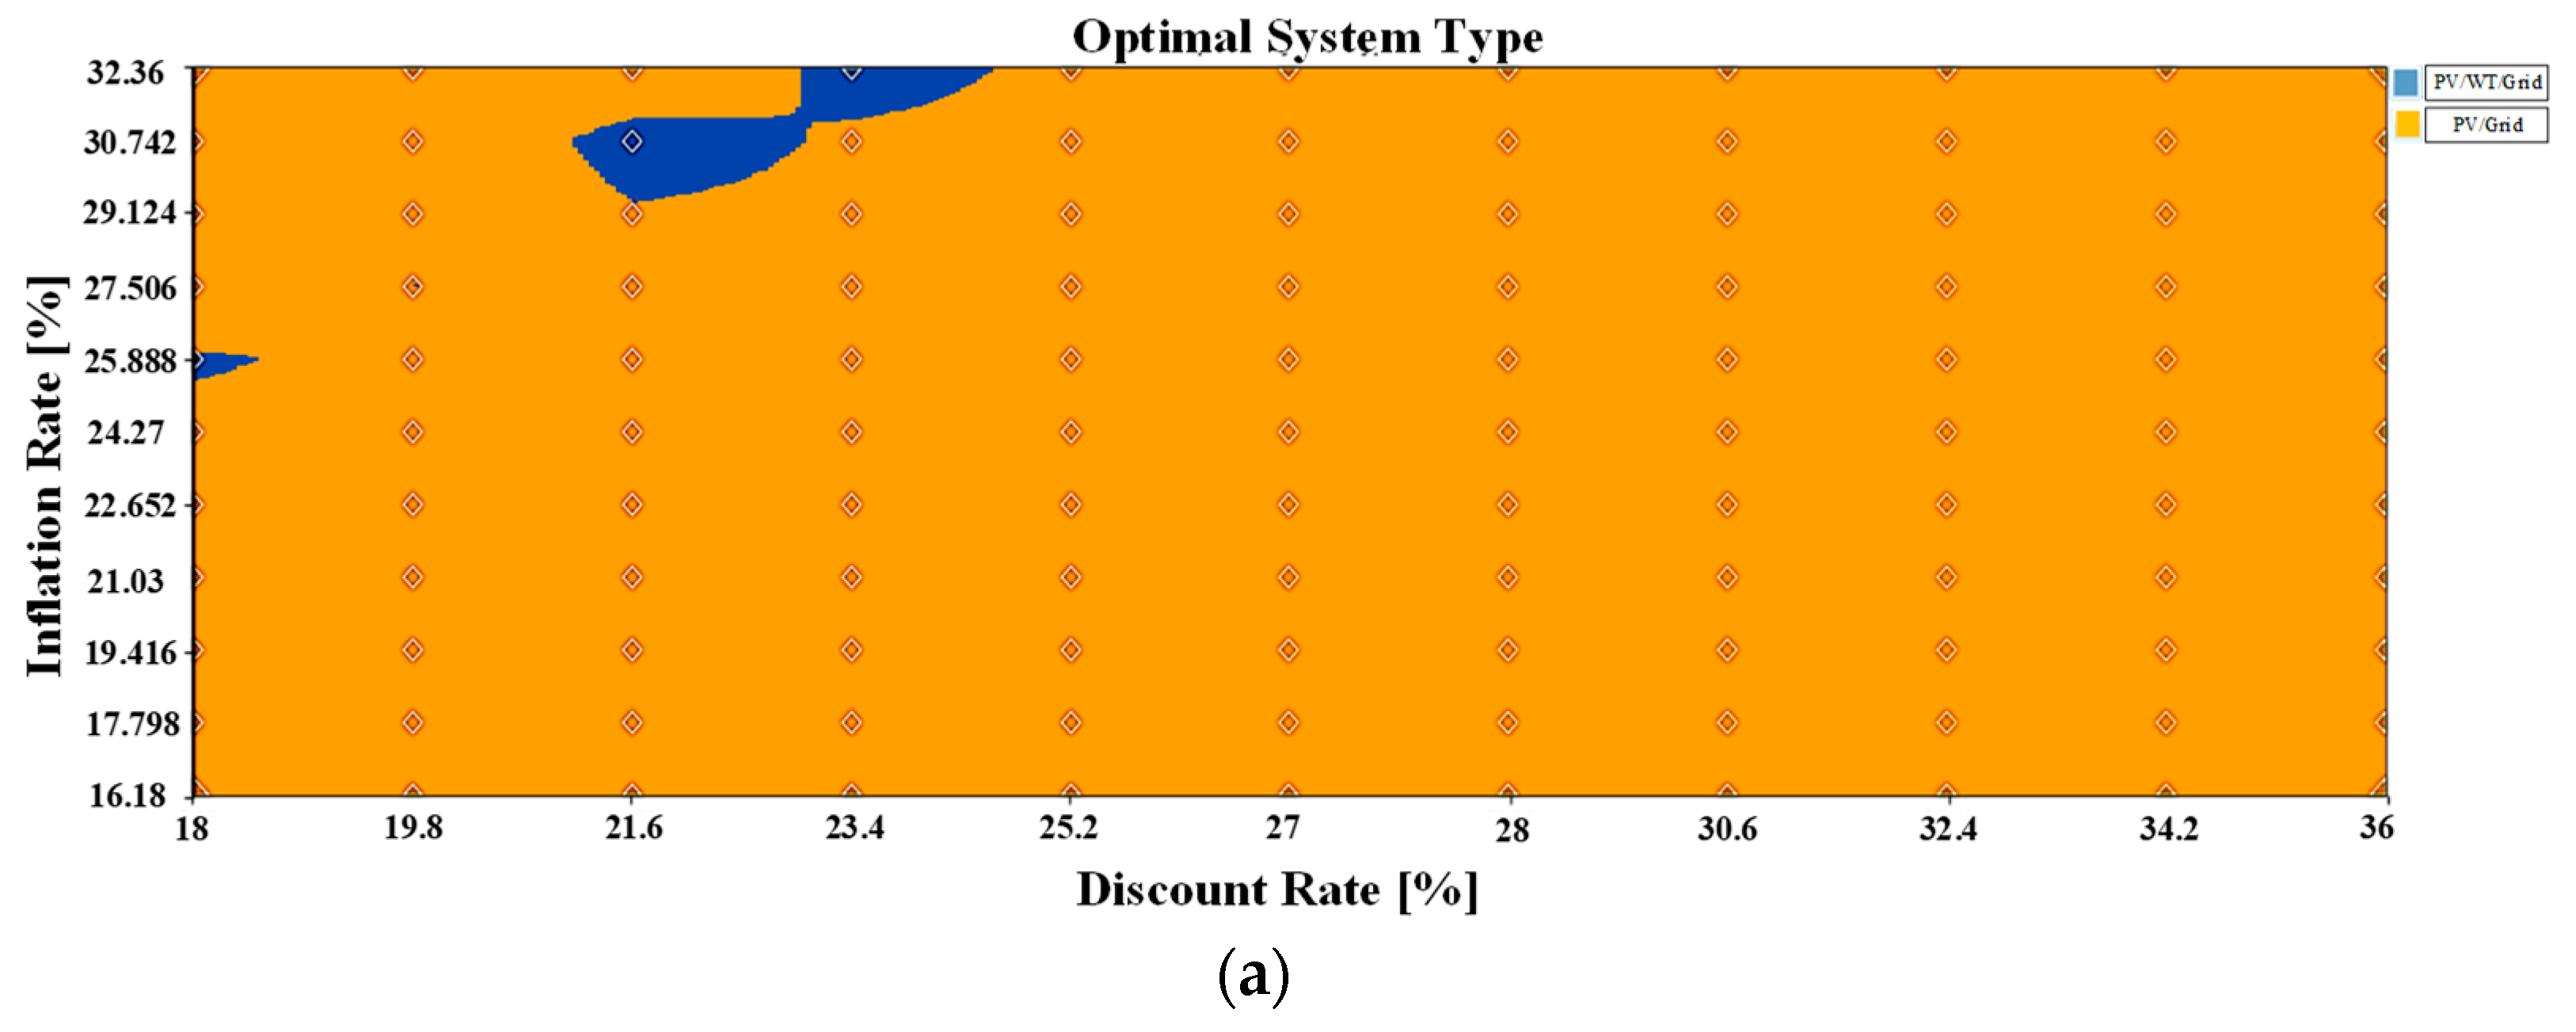
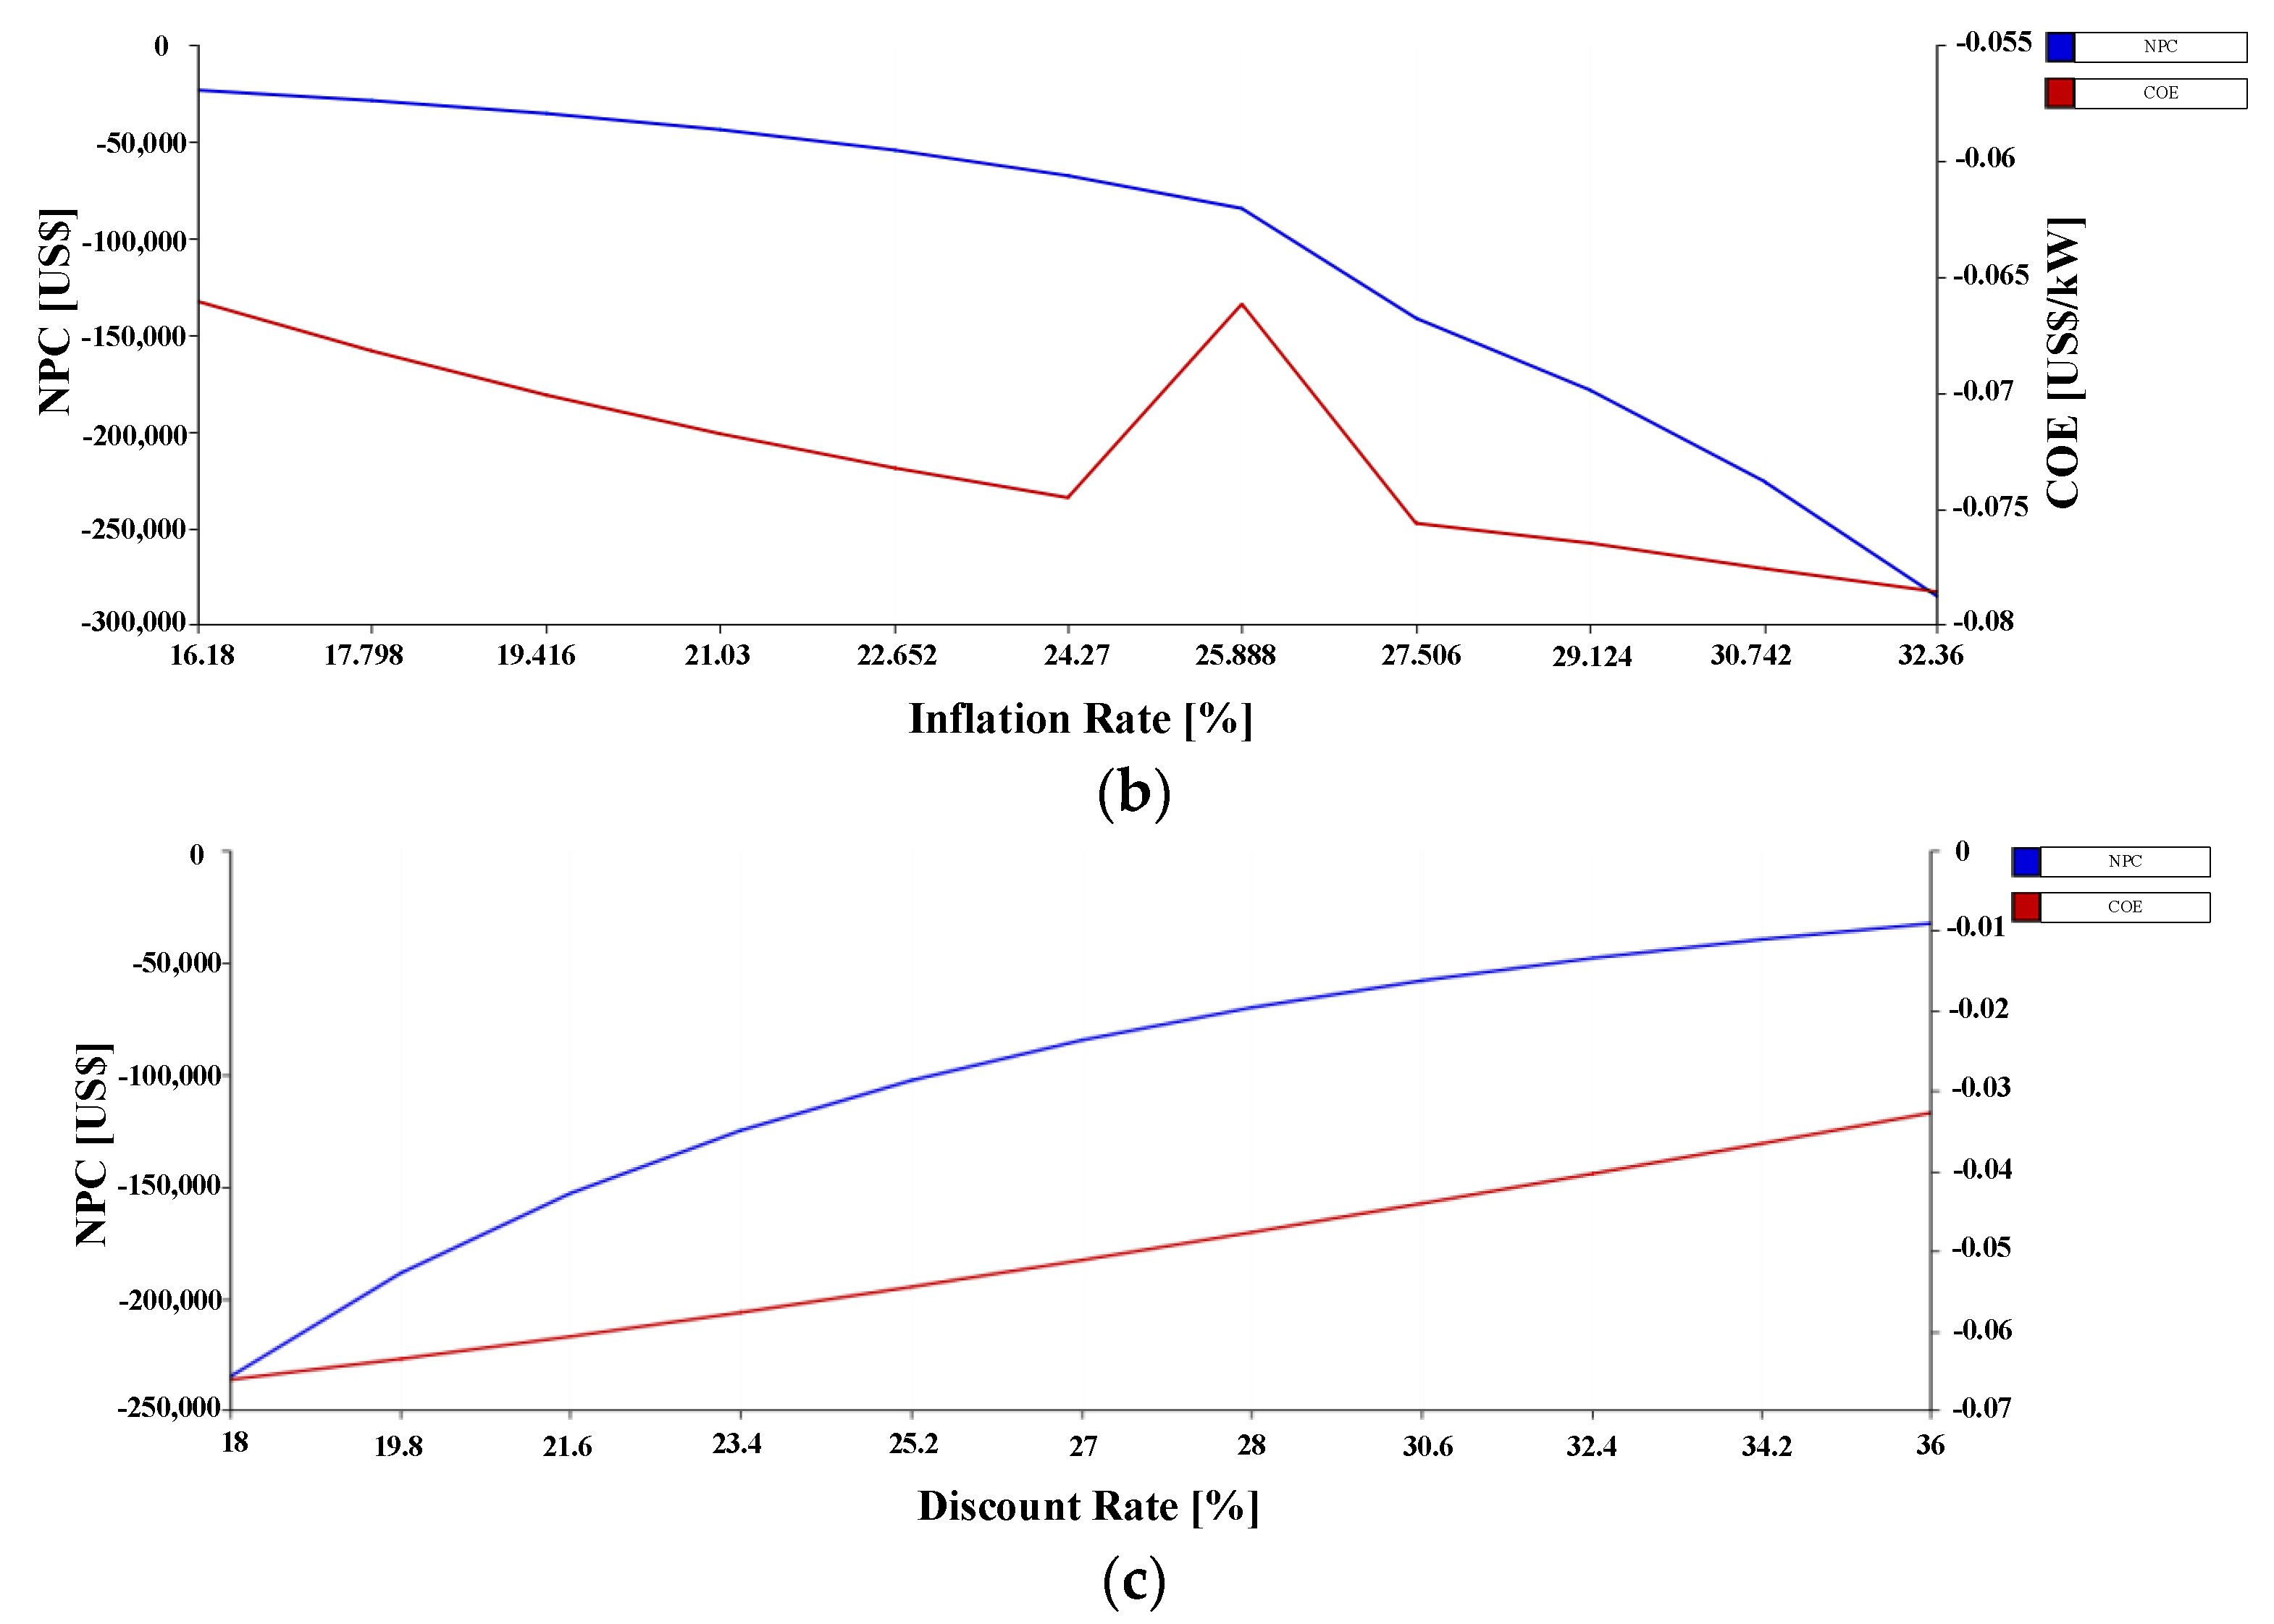
3.4.1. Sensitivity Analysis 1
3.4.2. Sensitivity Analysis 2
4. Conclusions
Author Contributions
Funding
Institutional Review Board Statement
Informed Consent Statement
Data Availability Statement
Conflicts of Interest
References
- Hu, X.; Xie, J.; Cai, W.; Wang, R.; Davarpanah, A. Thermodynamic effects of cycling carbon dioxide injectivity in shale reservoirs. J. Pet. Sci. Eng. 2020, 195, 107717. [Google Scholar] [CrossRef]
- Ehyaei, M.A.; Ahmadi, A.; Rosen, M.A.; Davarpanah, A. Thermodynamic Optimization of a Geothermal Power Plant with a Genetic Algorithm in Two Stages. Processes 2020, 8, 1277. [Google Scholar] [CrossRef]
- Dibazar, S.Y.; Salehi, G.; Davarpanah, A. Comparison of Exergy and Advanced Exergy Analysis in Three Different Organic Rankine Cycles. Processes 2020, 8, 586. [Google Scholar] [CrossRef]
- Esfandi, S.; Baloochzadeh, S.; Asayesh, M.; Ehyaei, M.A.; Ahmadi, A.; Rabanian, A.A.; Das, B.; Costa, V.A.; Davarpanah, A. Energy, exergy, economic, and exergoenvironmental analyses of a novel hybrid system to produce electricity, cooling, and syngas. Energies 2020, 13, 6453. [Google Scholar] [CrossRef]
- Alizadeh, S.M.; Ghazanfari, A.; Ehyaei, M.A.; Ahmadi, A.; Jamali, D.H.; Nedaei, N.; Davarpanah, A. Investigation the integration of heliostat solar receiver to gas and combined cycles by energy, exergy, and economic point of views. Appl. Sci. 2020, 10, 5307. [Google Scholar] [CrossRef]
- Wang, B.; Ma, F.; Ge, L.; Ma, H.; Wang, H.; Mohamed, M.A. Icing-EdgeNet: A Pruning Lightweight Edge Intelligent Method of Discriminative Driving Channel for Ice Thickness of Transmission Lines. IEEE Trans. Instrum. Meas. 2021, 70, 1–12. [Google Scholar] [CrossRef]
- Zhu, D.; Wang, B.; Ma, H.; Wang, H. Research on evaluating vulnerability of integrated electricity-heat-gas systems based on high-dimensional random matrix theory. CSEE J. Power Energy Syst. 2019, 6, 878–889. [Google Scholar] [CrossRef]
- Wang, B.; Zhang, L.; Ma, H.; Wang, H.; Wan, S. Parallel LSTM-Based Regional Integrated Energy System Multienergy Source-Load Information Interactive Energy Prediction. Complexity 2019, 2019, 7414318. [Google Scholar] [CrossRef] [Green Version]
- Zhang, X.; Wang, Y.; Wang, C.; Su, C.-Y.; Li, Z.; Chen, X. Adaptive Estimated Inverse Output-Feedback Quantized Control for Piezoelectric Positioning Stage. IEEE Trans. Cybern. 2019, 49, 2106–2118. [Google Scholar] [CrossRef] [PubMed]
- Wang, J.; Gao, Y.; Yin, X.; Li, F.; Kim, H.-J. An Enhanced PEGASIS Algorithm with Mobile Sink Support for Wireless Sensor Networks. Wirel. Commun. Mob. Comput. 2018, 2018, 9472075. [Google Scholar] [CrossRef]
- Liao, Z.; Wang, J.; Zhang, S.; Cao, J.; Min, G. Minimizing Movement for Target Coverage and Network Connectivity in Mobile Sensor Networks. IEEE Trans. Parallel Distrib. Syst. 2015, 26, 1971–1983. [Google Scholar] [CrossRef]
- Lv, X.; Liu, Y.; Xu, S.; Li, Q. Welcoming host, cozy house? The impact of service attitude on sensory experience. Int. J. Hosp. Manag. 2021, 95, 102949. [Google Scholar] [CrossRef]
- Liu, C.; Deng, F.; Heng, Q.; Cai, X.; Zhu, R.; Liserre, M. Crossing Thyristor Branches-Based Hybrid Modular Multilevel Converters for DC Line Faults. IEEE Trans. Ind. Electron. 2021, 68, 9719–9730. [Google Scholar] [CrossRef]
- Liu, Y.; Lv, X.; Tang, Z. The impact of mortality salience on quantified self behavior during the COVID-19 pandemic. Pers. Individ. Differ. 2021, 180, 110972. [Google Scholar] [CrossRef]
- Yang, Y.; Liu, Y.; Lv, X.; Ai, J.; Li, Y. Anthropomorphism and customers’ willingness to use artificial intelligence service agents. J. Hosp. Mark. Manag. 2021, 1–23. [Google Scholar] [CrossRef]
- Wang, J.; Gao, Y.; Liu, W.; Sangaiah, A.K.; Kim, H.J. An intelligent data gathering schema with data fusion supported for mobile sink in wireless sensor networks. Int. J. Distrib. Sens. Netw. 2019, 15, 1550147719839581. [Google Scholar] [CrossRef] [Green Version]
- Zhang, J.; Jin, X.; Sun, J.; Wang, J.; Sangaiah, A.K. Spatial and semantic convolutional features for robust visual object tracking. Multimed. Tools Appl. 2018, 79, 15095–15115. [Google Scholar] [CrossRef]
- Li, J.; Wang, F.; He, Y. Electric Vehicle Routing Problem with Battery Swapping Considering Energy Consumption and Carbon Emissions. Sustainability 2020, 12, 10537. [Google Scholar] [CrossRef]
- Zhang, Z.; Liu, S.; Niu, B. Coordination mechanism of dual-channel closed-loop supply chains considering product quality and return. J. Clean. Prod. 2020, 248, 119273. [Google Scholar] [CrossRef]
- Yu, B. Urban spatial structure and total-factor energy efficiency in Chinese provinces. Ecol. Indic. 2021, 126, 107662. [Google Scholar] [CrossRef]
- Peng, X.; Liu, Z.; Jiang, D. A review of multiphase energy conversion in wind power generation. Renew. Sustain. Energy Rev. 2021, 147, 111172. [Google Scholar] [CrossRef]
- Yu, F.; Liu, L.; Xiao, L.; Li, K.; Cai, S. A robust and fixed-time zeroing neural dynamics for computing time-variant nonlinear equation using a novel nonlinear activation function. Neurocomputing 2019, 350, 108–116. [Google Scholar] [CrossRef]
- Wang, J.; Gu, X.; Liu, W.; Sangaiah, A.K.; Kim, H.-J. An empower hamilton loop based data collection algorithm with mobile agent for WSNs. Human-Centric Comput. Inf. Sci. 2019, 9, 18. [Google Scholar] [CrossRef]
- Li, H.; Xu, B.; Lu, G.; Du, C.; Huang, N. Multi-objective optimization of PEM fuel cell by coupled significant variables recognition, surrogate models and a multi-objective genetic algorithm. Energy Convers. Manag. 2021, 236, 114063. [Google Scholar] [CrossRef]
- Li, H.-W.; Gao, Y.-F.; Du, C.-H.; Hong, W.-P. Numerical study on swirl cooling flow, heat transfer and stress characteristics based on fluid-structure coupling method under different swirl chamber heights and Reynolds numbers. Int. J. Heat Mass Transf. 2021, 173, 121228. [Google Scholar] [CrossRef]
- Zhang, L.; Zheng, H.; Wan, T.; Shi, D.; Lyu, L.; Cai, G. An Integrated Control Algorithm of Power Distribution for Islanded Microgrid Based on Improved Virtual Synchronous Generator. IET Renew. Power Gener. 2021. [Google Scholar] [CrossRef]
- Jiang, T.; Liu, Z.; Wang, G.; Chen, Z. Comparative study of thermally stratified tank using different heat transfer materials for concentrated solar power plant. Energy Rep. 2021, 7, 3678–3687. [Google Scholar] [CrossRef]
- Xu, Q.; Wang, K.; Zou, Z.; Zhong, L.; Akkurt, N.; Feng, J.; Xiong, Y.; Han, J.; Wang, J.; Du, Y. A new type of two-supply, one-return, triple pipe-structured heat loss model based on a low temperature district heating system. Energy 2021, 218, 119569. [Google Scholar] [CrossRef]
- Li, W.; Chen, Z.; Gao, X.; Liu, W.; Wang, J. Multimodel Framework for Indoor Localization Under Mobile Edge Computing Environment. IEEE Int. Things J. 2019, 6, 4844–4853. [Google Scholar] [CrossRef]
- Xiang, L.; Shen, X.; Qin, J.; Hao, W. Discrete Multi-graph Hashing for Large-Scale Visual Search. Neural Process. Lett. 2019, 49, 1055–1069. [Google Scholar] [CrossRef]
- Zhao, X.; Gu, B.; Gao, F.; Chen, S. Matching Model of Energy Supply and Demand of the Integrated Energy System in Coastal Areas. J. Coast. Res. 2020, 103, 983–989. [Google Scholar] [CrossRef]
- Zhang, J.; Wang, M.; Tang, Y.; Ding, Q.; Wanga, C.; Huang, X.; Chen, D.; Yan, F. Angular Velocity Measurement with Improved Scale Factor Based on a Wideband-tunable Optoelectronic Oscillator. IEEE Trans. Instrum. Meas. 2021, 1, 1. [Google Scholar] [CrossRef]
- Chen, Y.; Duan, L.; Sun, W.; Xu, J. Two-Dimensional Interpolation Criterion Using Dft Coefficients. Comput. Mater. Contin. 2020, 62, 849–859. [Google Scholar] [CrossRef]
- Tian, Z.; Yang, W.; Jin, Y.; Xie, L.; Huang, Z. Mfpl: Multi-frequency phase difference combination based device-free localization. Comput. Mater. Contin. 2020, 62, 861–876. [Google Scholar] [CrossRef]
- Zhou, C.; Feng, Y.; Yin, Z. Maintaining Complex Formations and Avoiding Obstacles for Multi-agents. Comput. Mater. Contin. 2020, 62, 877–891. [Google Scholar] [CrossRef]
- Ni, H.; Wang, Y.; Xu, B. Self-Organizing Gaussian Mixture Map Based on Adaptive Recursive Bayesian Estimation. Intell. Autom. Soft Comput. 2019, 26, 227–236. [Google Scholar] [CrossRef]
- Adel, E.; El-Sappagh, S.; Elmogy, M.; Barakat, S.; Kwak, K.-S. A Fuzzy Ontological Infrastructure for Semantic Interoperability in Distributed Electronic Health Record. Intell. Autom. Soft Comput. 2019, 26, 237–251. [Google Scholar] [CrossRef]
- Parvathavarthini, S.; Visalakshi, N.; Shanthi, S.; Mohan, J. An improved crow search based intuitionistic fuzzy clustering algorithm for healthcare applications. Intell. Autom. Soft Comput. 2020, 26, 253–260. [Google Scholar] [CrossRef]
- Nejad, R.M.; Berto, F.; Wheatley, G.; Tohidi, M.; Ma, W. On fatigue life prediction of Al-alloy 2024 plates in riveted joints. Struct. Elsevier 2021, 33, 1715–1720. [Google Scholar] [CrossRef]
- Davarpanah, A. Parametric study of polymer-nanoparticles-assisted injectivity performance for axisymmetric two-phase flow in EOR processes. Nanomaterials 2020, 10, 1818. [Google Scholar] [CrossRef] [PubMed]
- Balakrishnan, S.; Surendran, D. Secure Information Access Strategy for a Virtual Data Centre. Comput. Syst. Sci. Eng. 2020, 35, 357–366. [Google Scholar] [CrossRef]
- Nejad, M.B. Parametric Evaluation of Routing Algorithms in Network on Chip Architecture. Comput. Syst. Sci. Eng. 2020, 35, 367–375. [Google Scholar] [CrossRef]
- Zeng, Z. Implementation of Embedded Technology-Based English Speech Identification and Translation System. Comput. Syst. Sci. Eng. 2020, 35, 377–383. [Google Scholar] [CrossRef]
- Taghavifar, H.; Zomorodian, Z.S. Techno-economic viability of on grid micro-hybrid PV/wind/Gen system for an educational building in Iran. Renew. Sustain. Energy Rev. 2021, 143, 110877. [Google Scholar] [CrossRef]
- Support of Renewable and Clean Power Plants. Available online: http://www.satba.gov.ir/fa/localization/supportforthelocalizationofrenewableandcleanpowerplants (accessed on 10 June 2021).
- Neto-Bradley, A.P.; Rangarajan, R.; Choudhary, R.; Bazaz, A. A clustering approach to clean cooking transition pathways for low-income households in Bangalore. Sustain. Cities Soc. 2021, 66, 102697. [Google Scholar] [CrossRef]
- Wang, Y.; Huang, Y.; Wang, Y.; Zeng, M.; Li, F.; Wang, Y.; Zhang, Y. Energy management of smart micro-grid with response loads and distributed generation considering demand response. J. Clean. Prod. 2018, 197, 1069–1083. [Google Scholar] [CrossRef]
- Lan, H.; Cheng, B.; Gou, Z.; Yu, R. An evaluation of feed-in tariffs for promoting household solar energy adoption in Southeast Queensland, Australia. Sustain. Cities Soc. 2020, 53, 101942. [Google Scholar] [CrossRef]
- Cheng, T.; Zhu, X.; Gu, X.; Yang, F.; Mohammadi, M. Stochastic energy management and scheduling of microgrids in correlated environment: A deep learning-oriented approach. Sustain. Cities Soc. 2021, 69, 102856. [Google Scholar] [CrossRef]
- Singh, M.; Balachandra, P. Microhybrid Electricity System for Energy Access, Livelihoods, and Empowerment. Proc. IEEE 2019, 107, 1995–2007. [Google Scholar] [CrossRef]
- Ahmadi, S.E.; Rezaei, N. A new isolated renewable based multi microgrid optimal energy management system considering uncertainty and demand response. Int. J. Electr. Power Energy Syst. 2020, 118, 105760. [Google Scholar] [CrossRef]
- Rahman, M.; Oo, A. Distributed multi-agent based coordinated power management and control strategy for microgrids with distributed energy resources. Energy Convers. Manag. 2017, 139, 20–32. [Google Scholar] [CrossRef]
- Daneshvar, M.; Eskandari, H.; Sirous, A.B.; Esmaeilzadeh, R. A novel techno-economic risk-averse strategy for optimal scheduling of renewable-based industrial microgrid. Sustain. Cities Soc. 2021, 70, 102879. [Google Scholar] [CrossRef]
- Bahramian, F.; Akbari, A.; Nabavi, M.; Esfandi, S.; Naeiji, E.; Issakhov, A. Design and tri-objective optimization of an energy plant integrated with near-zero energy building including energy storage: An application of dynamic simulation. Sustain. Energy Technol. Assess. 2021, 47, 101419. [Google Scholar]
- Aslam, S.; Herodotou, H.; Mohsin, S.M.; Javaid, N.; Ashraf, N.; Aslam, S. A survey on deep learning methods for power load and renewable energy forecasting in smart microgrids. Renew. Sustain. Energy Rev. 2021, 144, 110992. [Google Scholar] [CrossRef]
- Nabavi, M.; Elveny, M.; Danshina, S.D.; Behroyan, I.; Babanezhad, M. Velocity prediction of Cu/water nanofluid convective flow in a circular tube: Learning CFD data by differential evolution algorithm based fuzzy inference system (DEFIS). Int. Commun. Heat Mass Transfer. 2021, 126, 105373. [Google Scholar] [CrossRef]
- Al-Shahri, O.A.; Ismail, F.B.; Hannan, M.; Lipu, M.H.; Al-Shetwi, A.Q.; Begum, R.; Al-Muhsen, N.F.; Soujeri, E. Solar photovoltaic energy optimization methods, challenges and issues: A comprehensive review. J. Clean. Prod. 2021, 284, 125465. [Google Scholar] [CrossRef]
- HassanzadehFard, H.; Jalilian, A. Optimal sizing and location of renewable energy based DG units in distribution systems considering load growth. Int. J. Electr. Power Energy Syst. 2018, 101, 356–370. [Google Scholar] [CrossRef]
- Cao, M.; Xu, Q.; Cai, J.; Yang, B. Optimal sizing strategy for energy storage system considering correlated forecast uncertainties of dispatchable resources. Int. J. Electr. Power Energy Syst. 2019, 108, 336–346. [Google Scholar] [CrossRef]
- Borowy, B.S.; Salameh, Z.M. Optimum photovoltaic array size for a hybrid wind/PV system. IEEE Trans. Energy Convers. 1994, 9, 482–488. [Google Scholar] [CrossRef]
- Ali, L.; Muyeen, S.M.; Bizhani, H.; Simoes, M.G. Game Approach for Sizing and Cost Minimization of a Multi-microgrids using a Multi-objective Optimization. In Proceedings of the 2021 IEEE Green Technologies Conference (GreenTech), Denver, CO, USA, 7–9 April 2021; pp. 507–512. [Google Scholar]
- Wang, L.; Singh, C. PSO-Based Multi-Criteria Optimum Design of a Grid-Connected Hybrid Power System with Multiple Renewable Sources of Energy. In Proceedings of the 2007 IEEE Swarm Intelligence Symposium, Honolulu, HI, USA, 1–5 April 2007; pp. 250–257. [Google Scholar]
- Ali, L.; Muyeen, S.M.; Bizhani, H.; Ghosh, A. Optimal planning of clustered microgrid using a technique of cooperative game theory. Electr. Power Syst. Res. 2020, 183, 106262. [Google Scholar] [CrossRef]
- AbouZahr, I.; Ramakumar, R. Loss of power supply probability of stand-alone photovoltaic systems: A closed form solution approach. IEEE Trans. Energy Convers. 1991, 6, 1–11. [Google Scholar] [CrossRef]
- Beyer, H.G.; Langer, C. A method for the identification of configurations of PV/wind hybrid systems for the reliable supply of small loads. Sol. Energy 1996, 57, 381–391. [Google Scholar] [CrossRef]
- Yang, H.X.; Lu, L.; Burnett, J. Weather data and probability analysis of hybrid photovoltaic–wind power generation systems in Hong Kong. Renew. Energy 2003, 28, 1813–1824. [Google Scholar] [CrossRef]
- Burke, W.J.; Merrill, H.M.; Schweppe, F.C.; Lovell, B.E.; McCoy, M.F.; Monohon, S.A. Trade off methods in system planning. IEEE Trans. Power Syst. 1988, 3, 1284–1290. [Google Scholar] [CrossRef]
- Chedid, R.; Akiki, H.; Rahman, S. A decision support technique for the design of hybrid solar-wind power systems. IEEE Trans. Energy Convers. 1998, 13, 76–83. [Google Scholar] [CrossRef] [Green Version]
- Sadat, S.A.; Faraji, J.; Babaei, M.; Ketabi, A. Techno-economic comparative study of hybrid microgrids in eight climate zones of Iran. Energy Sci. Eng. 2020, 8, 3004–3026. [Google Scholar] [CrossRef]
- Ali, L.; Shahnia, F. Determination of an economically-suitable and sustainable standalone power system for an off-grid town in Western Australia. Renew. Energy 2017, 106, 243–254. [Google Scholar] [CrossRef] [Green Version]
- Jin, S.; Kim, H.; Kim, T.H.; Shin, H.; Kwag, K.; Kim, W. A Study on Designing Off-grid System Using HOMER Pro—A Case Study. In Proceedings of the 2018 IEEE International Conference on Industrial Engineering and Engineering Management (IEEM), Bangkok, Thailand, 16–19 December 2018; pp. 1851–1855. [Google Scholar]
- Fikari, S.G.; Sigarchian, S.G.; Chamorro, H.R. Modeling and simulation of an autonomous hybrid power system. In Proceedings of the 2017 52nd International Universities Power Engineering Conference (UPEC), Heraklion, Greece, 28–31 August 2017; pp. 1–6. [Google Scholar]
- Bohra, S.S.; Anvari-Moghaddam, A.; Mohammadi-Ivatloo, B. AHP-Assisted Multi-Criteria Decision-Making Model for Planning of Microgrids. In Proceedings of the IECON 2019—45th Annual Conference of the IEEE Industrial Electronics Society, Lisbon, Portugal, 14–17 October 2019; pp. 4557–4562. [Google Scholar]
- Faraji, J.; Hashemi-Dezaki, H.; Ketabi, A. Multi-year load growth-based optimal planning of grid-connected microgrid considering long-term load demand forecasting: A case study of Tehran, Iran. Sustain. Energy Technol. Assess. 2020, 42, 100827. [Google Scholar] [CrossRef]
- Jahangir, M.H.; Mousavi, S.A.; Vaziri Rad, M.A. A techno-economic comparison of a photovoltaic/thermal organic Rankine cycle with several renewable hybrid systems for a residential area in Rayen, Iran. Energy Convers. Manag. 2019, 195, 244–261. [Google Scholar] [CrossRef]
- Shirinabadi, M.; Azami, A. The Feasibility of Photovoltaic and Grid-Hybrid Power Plant for Water Pumping Station in Tabriz-Iran. In Proceedings of the 2018 International Conference on Photovoltaic Science and Technologies (PVCon), Ankara, Turkey, 4–6 July 2018; pp. 1–4. [Google Scholar]
- Shahinzadeh, H.; Moazzami, M.; Fathi, S.H.; Gharehpetian, G.B. Optimal sizing and energy management of a grid-connected microgrid using HOMER software. In Proceedings of the 2016 Smart Grids Conference (SGC), Kerman, Iran, 20–21 December 2016; pp. 1–6. [Google Scholar]
- Wang, B.; Yang, X.; Short, T.; Yang, S. Chance constrained unit commitment considering comprehensive modelling of demand response resources. IET Renew. Power Gener. 2017, 11, 490–500. [Google Scholar] [CrossRef]
- Jordehi, A.R. Optimisation of demand response in electric power systems, a review. Renew. Sustain. Energy Rev. 2019, 103, 308–319. [Google Scholar] [CrossRef]
- Pallonetto, F.; De Rosa, M.; D’Ettorre, F.; Finn, D.P. On the assessment and control optimisation of demand response programs in residential buildings. Renew. Sustain. Energy Rev. 2020, 127, 109861. [Google Scholar] [CrossRef]
- Zachar, M.; Daoutidis, P. Energy management and load shaping for commercial microgrids coupled with flexible building environment control. J. Energy Storage 2018, 16, 61–75. [Google Scholar] [CrossRef]
- Kumar, A.; Verma, A. Optimal techno-economic sizing of a solar-biomass-battery hybrid system for off-setting dependency on diesel generators for microgrid facilities. J. Energy Storage 2021, 36, 102251. [Google Scholar] [CrossRef]
- Faraji, J.; Ketabi, A.; Hashemi-Dezaki, H. Optimization of the scheduling and operation of prosumers considering the loss of life costs of battery storage systems. J. Energy Storage 2020, 31, 101655. [Google Scholar] [CrossRef]
- Afrakhte, H.; Bayat, P. A contingency based energy management strategy for multi-microgrids considering battery energy storage systems and electric vehicles. J. Energy Storage 2020, 27, 101087. [Google Scholar] [CrossRef]
- Nosratabadi, S.M.; Hemmati, R.; Jahandide, M. Eco-environmental planning of various energy storages within multi-energy microgrid by stochastic price-based programming inclusive of demand response paradigm. J. Energy Storage 2021, 36, 102418. [Google Scholar] [CrossRef]
- Kiptoo, M.K.; Lotfy, M.E.; Adewuyi, O.B.; Conteh, A.; Howlader, A.M.; Senjyu, T. Integrated approach for optimal techno-economic planning for high renewable energy-based isolated microgrid considering cost of energy storage and demand response strategies. Energy Convers. Manag. 2020, 215, 112917. [Google Scholar] [CrossRef]
- Mansouri, S.A.; Ahmarinejad, A.; Ansarian, M.; Javadi, M.S.; Catalao, J.P.S. Stochastic planning and operation of energy hubs considering demand response programs using Benders decomposition approach. Int. J. Electr. Power Energy Syst. 2020, 120, 106030. [Google Scholar] [CrossRef]
- Amrollahi, M.H.; Bathaee, S.M.T. Techno-economic optimization of hybrid photovoltaic/wind generation together with energy storage system in a stand-alone micro-grid subjected to demand response. Appl. Energy 2017, 202, 66–77. [Google Scholar] [CrossRef]
- Liu, J.; Jian, L.; Wang, W.; Qiu, Z.; Zhang, J.; Dastbaz, P. The role of energy storage systems in resilience enhancement of health care centers with critical loads. J. Energy Storage 2021, 33, 102086. [Google Scholar] [CrossRef]
- Singh, A.; Baredar, P.; Gupta, B. Computational simulation & optimization of a solar, fuel cell and biomass hybrid energy system using HOMER pro software. Procedia Eng. 2015, 127, 743–750. [Google Scholar]
- Faraji, J.; Babaei, M.; Bayati, N.; Hejazi, M.A. A Comparative Study between Traditional Backup Generator Systems and Renewable Energy Based Microgrids for Power Resilience Enhancement of a Local Clinic. Electronics 2019, 8, 1485. [Google Scholar] [CrossRef] [Green Version]
- Das, B.K.; Hasan, M. Optimal sizing of a stand-alone hybrid system for electric and thermal loads using excess energy and waste heat. Energy 2021, 214, 119036. [Google Scholar] [CrossRef]
- Chen, X.; Chen, Y.; Zhang, M.; Jiang, S.; Gou, H.; Pang, Z.; Shen, B. Hospital-oriented quad-generation (HOQG)—A combined cooling, heating, power and gas (CCHPG) system. Appl. Energy 2021, 300, 117382. [Google Scholar] [CrossRef]
- Critz, D.K.; Busche, S.; Connors, S. Power systems balancing with high penetration renewables: The potential of demand response in Hawaii. Energy Convers. Manag. 2013, 76, 609–619. [Google Scholar] [CrossRef]
- Faraji, J.; Ketabi, A.; Hashemi-Dezaki, H.; Shafie-Khah, M.; Catalão, J.P.S. Optimal Day-Ahead Self-Scheduling and Operation of Prosumer Microgrids Using Hybrid Machine Learning-Based Weather and Load Forecasting. IEEE Access 2020, 8, 157284–157305. [Google Scholar] [CrossRef]
- Qiu, T.; Faraji, J. Techno-economic optimization of a grid-connected hybrid energy system considering electric and thermal load prediction. Energy Sci. Eng. 2021. [Google Scholar] [CrossRef]
- Tehran Power Distribution Company (TPDC). Available online: https://en.tbtb.ir/ (accessed on 13 February 2021).


| Emission Type | Value | Unit |
|---|---|---|
| Carbon Dioxide | 6.32 | g/kWh |
| Sulfur Dioxide | 2.74 | g/kWh |
| Nitrogen Oxides | 1.34 | g/kWh |
| Technical Results | Economic Results | ||||||
|---|---|---|---|---|---|---|---|
| SPV (kW) | WT (kW) | BSS (kW) | Conv. (kW) | RF (%) | COE (USD/kWh) | NPC (USD) | Initial Cost (USD) |
| 11.00 | - | - | 6.00 | 87.2 | −0.0635 | −19,687 | 4675 |
| 11.00 | - | 1.00 | 6.00 | 87.2 | −0.0595 | −19,272 | 4799 |
| 11.00 | 1.00 | - | 6.00 | 89.5 | −0.0619 | −19,202 | 5400 |
| 11.00 | 1.00 | 1.00 | 6.00 | 85.5 | −0.0580 | −18,788 | 5524 |
| Emissions | Value |
|---|---|
| Carbon Dioxide | 1397 kg/year |
| Sulfur Dioxide | 6.08 kg/year |
| Nitrogen Oxides | 2.96 kg/year |
| Technical Results | Economic Results | ||||||
|---|---|---|---|---|---|---|---|
| SPV (kW) | WT (kW) | BSS (kW) | Conv. (kW) | RF (%) | COE (USD/kWh) | NPC (USD) | Initial Cost (US$) |
| 9.00 | - | - | 6.00 | 83.3 | −0.0660 | −23,461 | 3975 |
| 9.00 | 1.00 | - | 6.00 | 90.0 | −0.0647 | 22,977 | 4700 |
| 9.00 | 1.00 | 1.00 | 6.00 | 87.3 | −0.0618 | 22,663 | 4099 |
| 9.00 | 1.00 | 1.00 | 6.00 | 90.0 | −0.0605 | 22,178 | 4824 |
| Emissions | Value |
|---|---|
| Carbon Dioxide | 1212 kg/year |
| Sulfur Dioxide | 5.26 kg/year |
| Nitrogen Oxides | 2.57 kg/year |
| Hour | Standard Deviation Values | |||
|---|---|---|---|---|
| Winter | Spring | Summer | Fall | |
| 1 | 0.1445 | 0.1298 | 0.10951 | 0.17311 |
| 2 | 0.14837 | 0.13355 | 0.11306 | 0.17687 |
| 3 | 0.15048 | 0.13441 | 0.11422 | 0.18068 |
| 4 | 0.15054 | 0.13399 | 0.11399 | 0.18336 |
| 5 | 0.14973 | 0.13345 | 0.11345 | 0.18475 |
| 6 | 0.14938 | 0.1331 | 0.11343 | 0.18446 |
| 7 | 0.14986 | 0.13316 | 0.11386 | 0.18396 |
| 8 | 0.15054 | 0.1336 | 0.11435 | 0.18431 |
| 9 | 0.15129 | 0.13408 | 0.11489 | 0.18511 |
| 10 | 0.15175 | 0.1343 | 0.11489 | 0.18608 |
| 11 | 0.15185 | 0.13394 | 0.11458 | 0.18665 |
| 12 | 0.15148 | 0.13355 | 0.11423 | 0.18721 |
| 13 | 0.15106 | 0.13309 | 0.11389 | 0.1874 |
| 14 | 0.15063 | 0.13298 | 0.11389 | 0.1869 |
| 15 | 0.15066 | 0.13301 | 0.114 | 0.18632 |
| 16 | 0.15088 | 0.13314 | 0.1142 | 0.18588 |
| 17 | 0.15133 | 0.13341 | 0.1146 | 0.18618 |
| 18 | 0.15142 | 0.13386 | 0.11472 | 0.18681 |
| 19 | 0.15021 | 0.13394 | 0.11431 | 0.18576 |
| 20 | 0.147 | 0.13335 | 0.11319 | 0.18253 |
| 21 | 0.14272 | 0.13144 | 0.11053 | 0.17854 |
| 22 | 0.13954 | 0.12775 | 0.10676 | 0.17501 |
| 23 | 0.13902 | 0.12455 | 0.10566 | 0.17236 |
| 24 | 0.14083 | 0.12515 | 0.1067 | 0.17142 |
| Hour | Standard Deviation Values | |||
|---|---|---|---|---|
| Winter | Spring | Summer | Fall | |
| 1 | 0.034416 | 0.047639 | 0.055011 | 0.05175 |
| 2 | 0.034409 | 0.048225 | 0.055883 | 0.05198 |
| 3 | 0.03439 | 0.048599 | 0.05661 | 0.052198 |
| 4 | 0.034516 | 0.048866 | 0.057055 | 0.052301 |
| 5 | 0.034909 | 0.048697 | 0.056891 | 0.05189 |
| 6 | 0.034949 | 0.048192 | 0.056684 | 0.051631 |
| 7 | 0.034916 | 0.048154 | 0.056872 | 0.051924 |
| 8 | 0.035133 | 0.048423 | 0.057149 | 0.052184 |
| 9 | 0.035191 | 0.048554 | 0.057514 | 0.052633 |
| 10 | 0.03551 | 0.048833 | 0.057764 | 0.053087 |
| 11 | 0.036092 | 0.048742 | 0.057743 | 0.053169 |
| 12 | 0.036252 | 0.048524 | 0.057517 | 0.052986 |
| 13 | 0.036187 | 0.048451 | 0.057321 | 0.052985 |
| 14 | 0.03636 | 0.048177 | 0.057111 | 0.052849 |
| 15 | 0.036365 | 0.048123 | 0.057178 | 0.052868 |
| 16 | 0.03641 | 0.048225 | 0.057346 | 0.053017 |
| 17 | 0.03654 | 0.048426 | 0.057593 | 0.053172 |
| 18 | 0.036347 | 0.048709 | 0.057584 | 0.052925 |
| 19 | 0.036119 | 0.04861 | 0.057272 | 0.052391 |
| 20 | 0.036209 | 0.048216 | 0.056662 | 0.051917 |
| 21 | 0.036243 | 0.047592 | 0.055711 | 0.051463 |
| 22 | 0.036214 | 0.047027 | 0.054623 | 0.050832 |
| 23 | 0.036315 | 0.046783 | 0.054019 | 0.050678 |
| 24 | 0.036226 | 0.046692 | 0.054231 | 0.051171 |
Publisher’s Note: MDPI stays neutral with regard to jurisdictional claims in published maps and institutional affiliations. |
© 2021 by the authors. Licensee MDPI, Basel, Switzerland. This article is an open access article distributed under the terms and conditions of the Creative Commons Attribution (CC BY) license (https://creativecommons.org/licenses/by/4.0/).
Share and Cite
Yu, Z.-X.; Li, M.-S.; Xu, Y.-P.; Aslam, S.; Li, Y.-K. Techno-Economic Planning and Operation of the Microgrid Considering Real-Time Pricing Demand Response Program. Energies 2021, 14, 4597. https://doi.org/10.3390/en14154597
Yu Z-X, Li M-S, Xu Y-P, Aslam S, Li Y-K. Techno-Economic Planning and Operation of the Microgrid Considering Real-Time Pricing Demand Response Program. Energies. 2021; 14(15):4597. https://doi.org/10.3390/en14154597
Chicago/Turabian StyleYu, Zi-Xuan, Meng-Shi Li, Yi-Peng Xu, Sheraz Aslam, and Yuan-Kang Li. 2021. "Techno-Economic Planning and Operation of the Microgrid Considering Real-Time Pricing Demand Response Program" Energies 14, no. 15: 4597. https://doi.org/10.3390/en14154597