Article

Investigation of Insulation Characteristics of GFRP Crossarm Subjected to Lightning Transient

by
Muhammad Syahmi Abd Rahman
1,*,
Mohd Zainal Abidin Ab Kadir
2,
Muhamad Safwan Abd Rahman
1,
Miszaina Osman
1,
Shamsul Fahmi Mohd Nor
1 and
Noorlina Mohd Zainuddin
1
1
Institute of Power Engineering, Universiti Tenaga Nasional, Kajang 43000, Selangor, Malaysia
2
Centre for Electromagnetic and Lightning Protection Research (CELP), Advanced Lightning, Power and Energy Research (ALPER), Universiti Putra Malaysia, Serdang 43400, Selangor, Malaysia
*
Author to whom correspondence should be addressed.
Energies 2021, 14(14), 4386; https://doi.org/10.3390/en14144386
Submission received: 17 June 2021 / Revised: 9 July 2021 / Accepted: 13 July 2021 / Published: 20 July 2021
(This article belongs to the Section F: Electrical Engineering)

Abstract

:
The advancement of material technology has contributed to the variation of high-performance composites with good electrical insulation and mechanical properties. Their usage in electrical applications has grown since then. In Malaysia, the composite made of Glass Fiber Reinforced Polymer (GFRP) has been adopted for crossarm manufacturing and has successfully served 275 kV lines for a few decades. However, the combination of extreme conditions such as lightning transient and tropical climate can impose threats to the material. These issues have become major topics of discussion among the utilities in the Southeast Asian (SEA) region, and also in previous research. In Malaysia, more than 50% of total interruptions were caused by lightning. Limited studies can be found on the composite crossarm, especially on the square tube GFRP filled crossarm used in Malaysia. Therefore, this paper proposes to study the behavior of the particular GFRP crossarm, by means of its insulation characteristics. Experimental and simulation approaches are used. Throughout the study, the GFRP specimen is known to have an average breakdown strength at 7.2 kV/mm. In addition, the CFO voltages of the crossarm at different lengths are presented, whereby the behavior under dry and wet conditions is comparably discussed. At the same time, the polarity effect on the CFO voltages is highlighted. The maximum E-fields at the immediate moment before breakdown are analyzed by adopting the finite element method (FEM). Non-uniform distribution of E-fields is witnessed at different parts of the crossarm structure. Simultaneously, the maximum field localized on the crossarm immediately before the breakdown is also presented.

Graphical Abstract

1. Introduction

The trend of using composite material in electrical applications is increasing since the last decades. Fiber-reinforced plastic (FRP) composites have been utilized for manufacturing pylons, wind turbine blades, insulators, crossarms, etc. [1,2,3,4]. In general, glass fibers have been widely used as reinforcement where the E-glass fibers are more dominant compared to other types of glass fiber e.g., ECR-glass, R-glass, T-glass and S-glass due to their large production rate, relatively low cost, and good electrical as well as mechanical strength [5,6]. The concept of using composite material is not only due to the mechanical strength, but also the good insulation properties [7]. The combination of these two characteristics is a significant advantage for designing a compact and reliable transmission system where Right-of-Way (ROW) has been an issue [5].
History shows that composites were first used to manufacture insulators in the 1960s in Europe and the USA before they are gradually gained acceptance for a large range of voltage levels worldwide [5,8,9,10,11]. Meanwhile, the Japanese have introduced composite crossarms for a 66 kV transmission tower in which a simple structure of bare FRP bars has been used. However, the design is vulnerable to surface discharges, especially when contaminated [12]. Nowadays, glass fiber reinforced polymer (GFRP) composite has specifically been used as the core structure for an insulating crossarm used on compact transmission lines [13,14].
Meanwhile, in Malaysia, most of the 275 kV transmission towers are equipped with the GFRP crossarm. It appears to be the best alternative to the wooden crossarm, which is now being replaced due to a limited source of high-quality timber [15,16]. The GFRP crossarm constitutes a hollow square tube of bare GFRP filled with closed-cell foam. Malaysia experiences high lightning activities throughout the year. It has been reported that lightning overvoltages have contributed to more than 50% of the total outages, since higher cases have been reported in 275 kV lines [17,18]. The combination of the harsh tropical environment and high lightning activities could progressively affect the insulating material of the composite crossarm.
In the literature, many studies have been carried out to investigate the insulation performance of GFRP material. A previous study presents the breakdown voltage of GFRP sheets, referred to as G10 at different thicknesses, in which the breakdown strength varies from 21 kV/mm to 45 kV/mm [19].
The influence of thickness on the electrical strength and rigidity of the composite has been highlighted in [3], where the GFRP composite with more lamination was found to have a lower breakdown voltage. According to [2], the occurrence of micro-voids which normally exist within the laminations of the pultruded product might promote partial discharges under sufficient electrical stress. Eventually, the insulation strength would be affected. Such agreements were also reported in the earlier study, where the breakdown strength of GFRP composite sandwiched between parallel planes decreased with the thickness [19].
Some researchers have dedicated their work to investigating the damage modes of GFRP, concerning the electrical stresses caused by the electrical breakdown. In [2], a failed GFRP composite due to the electrical arc has been inspected, whereby the micro-fractures within the layers of the composite are correlated to the visible burnt area. Another study suggested that the degradation of GFRP rods caused by electrical stress under AC voltage and wet conditions can be divided into four stages, namely the inception stage, hydrolysis stage, carbonization stage and breakdown stage [20]. The investigation reveals that the epoxy resin matrix of the composites has oxidized and carbonized when subjected to sufficient electrical stress. In this case, an increase of leakage current was expected as the resistance of the degraded GFRP gradually decreased until the breakdown stage occurred [20]. To some extent, finding the cause of electrical failure on the GFRP can be challenging, as the extreme heat and flame produced by the electrical arc will typically eradicate any sign of the failure mode [2]. Thus, numerical approaches have been utilized to locate the potential threats through field prediction at different parts of the crossarm [21,22,23,24].
In the acceptance or type test, the performance of the GFRP crossarm is evaluated through some sets of tests, which mainly cover the structural and mechanical aspects [25,26,27,28]. Meanwhile, for electrical aspects, an inclined plane test is normally adopted to evaluate the tracking and erosion resistance of the material due to electrical stress where the methods suggested by standard ASTM D2303 and IEC 60587 are the most preferred [29,30,31]. Meanwhile, IEC 60060-1 and IEC 60383-2 have been adopted for the voltage withstand test concerning lightning impulse voltage and power frequency (AC) voltage [32,33]. From a research perspective, critical flashover (CFO) and AC flashover voltages have been widely used to describe the insulation strength of insulating equipment against lightning impulse and AC voltage, respectively. According to the series of investigations conducted in the earlier studies, the expected CFO and AC flashover voltages of solid cylindrical GFRP crossarms at various lengths and conditions have been determined [34,35,36]. 
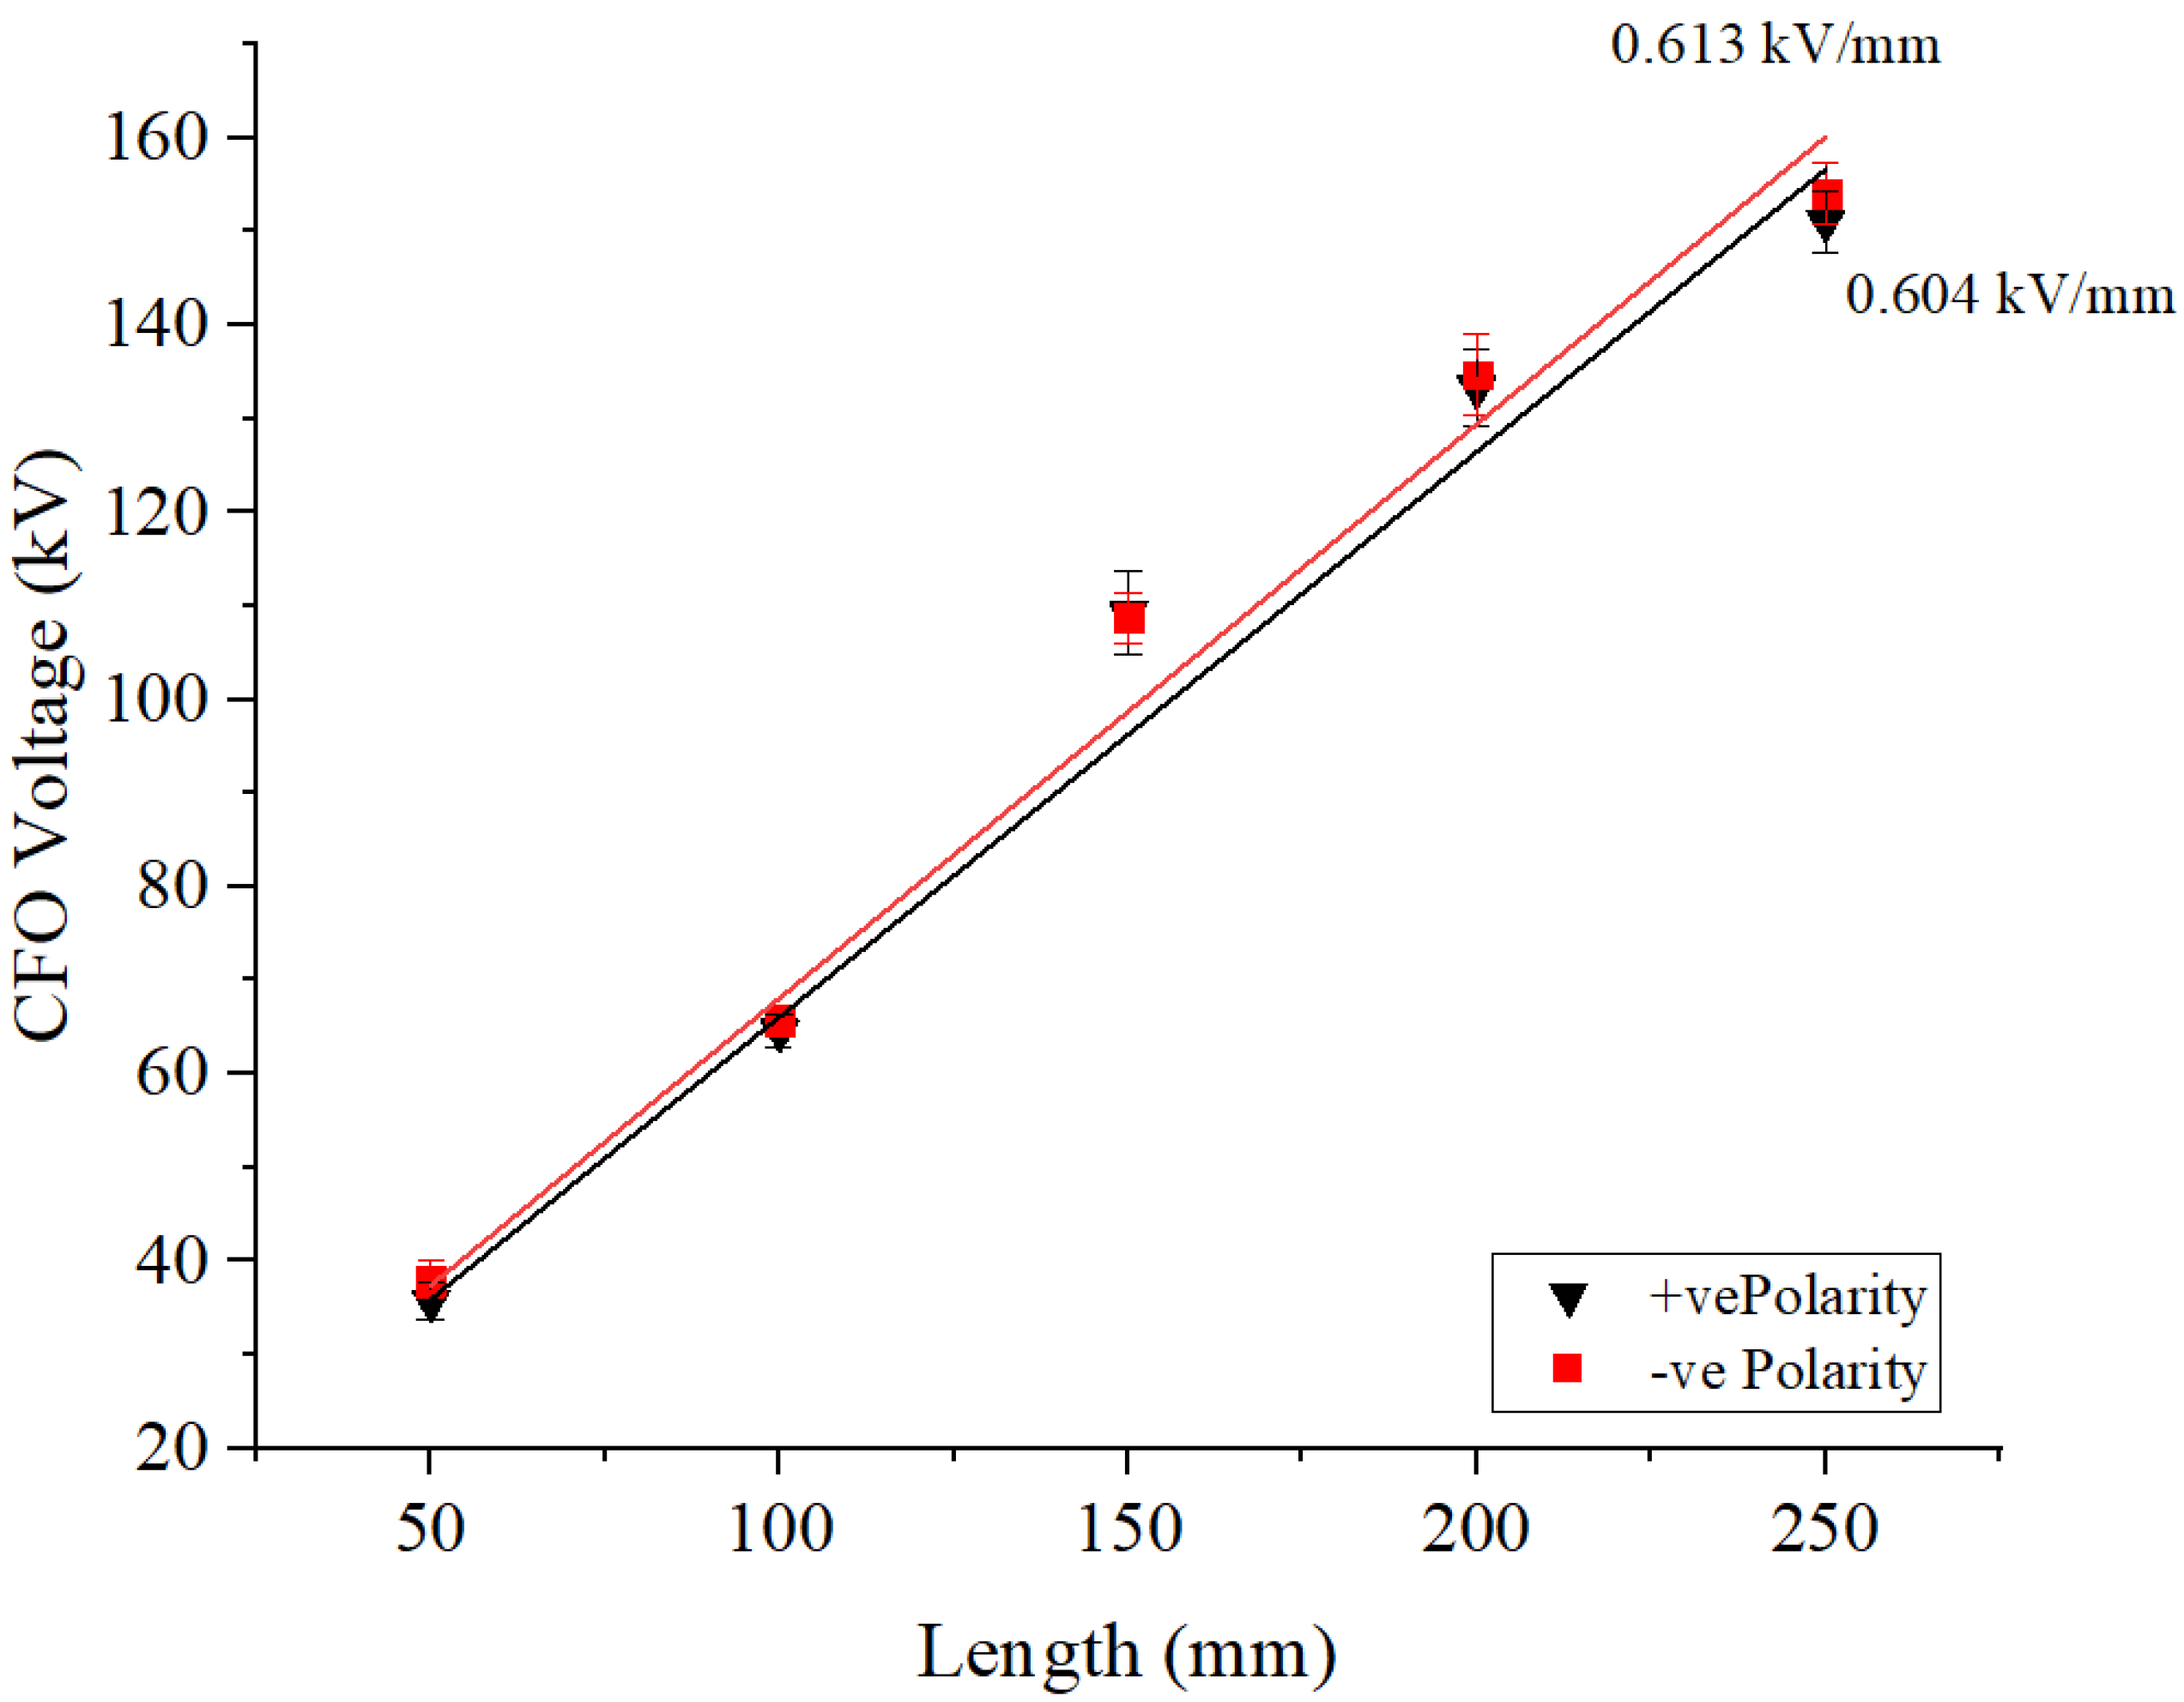
Figure 1 illustrates the CFO voltage of the crossarm in dry and wet conditions for which the CFO gradient has been determined at 0.700 kV/mm and 0.605 kV/mm respectively.
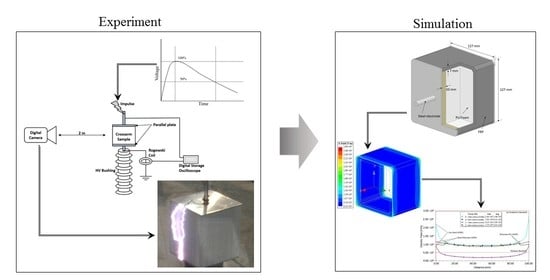
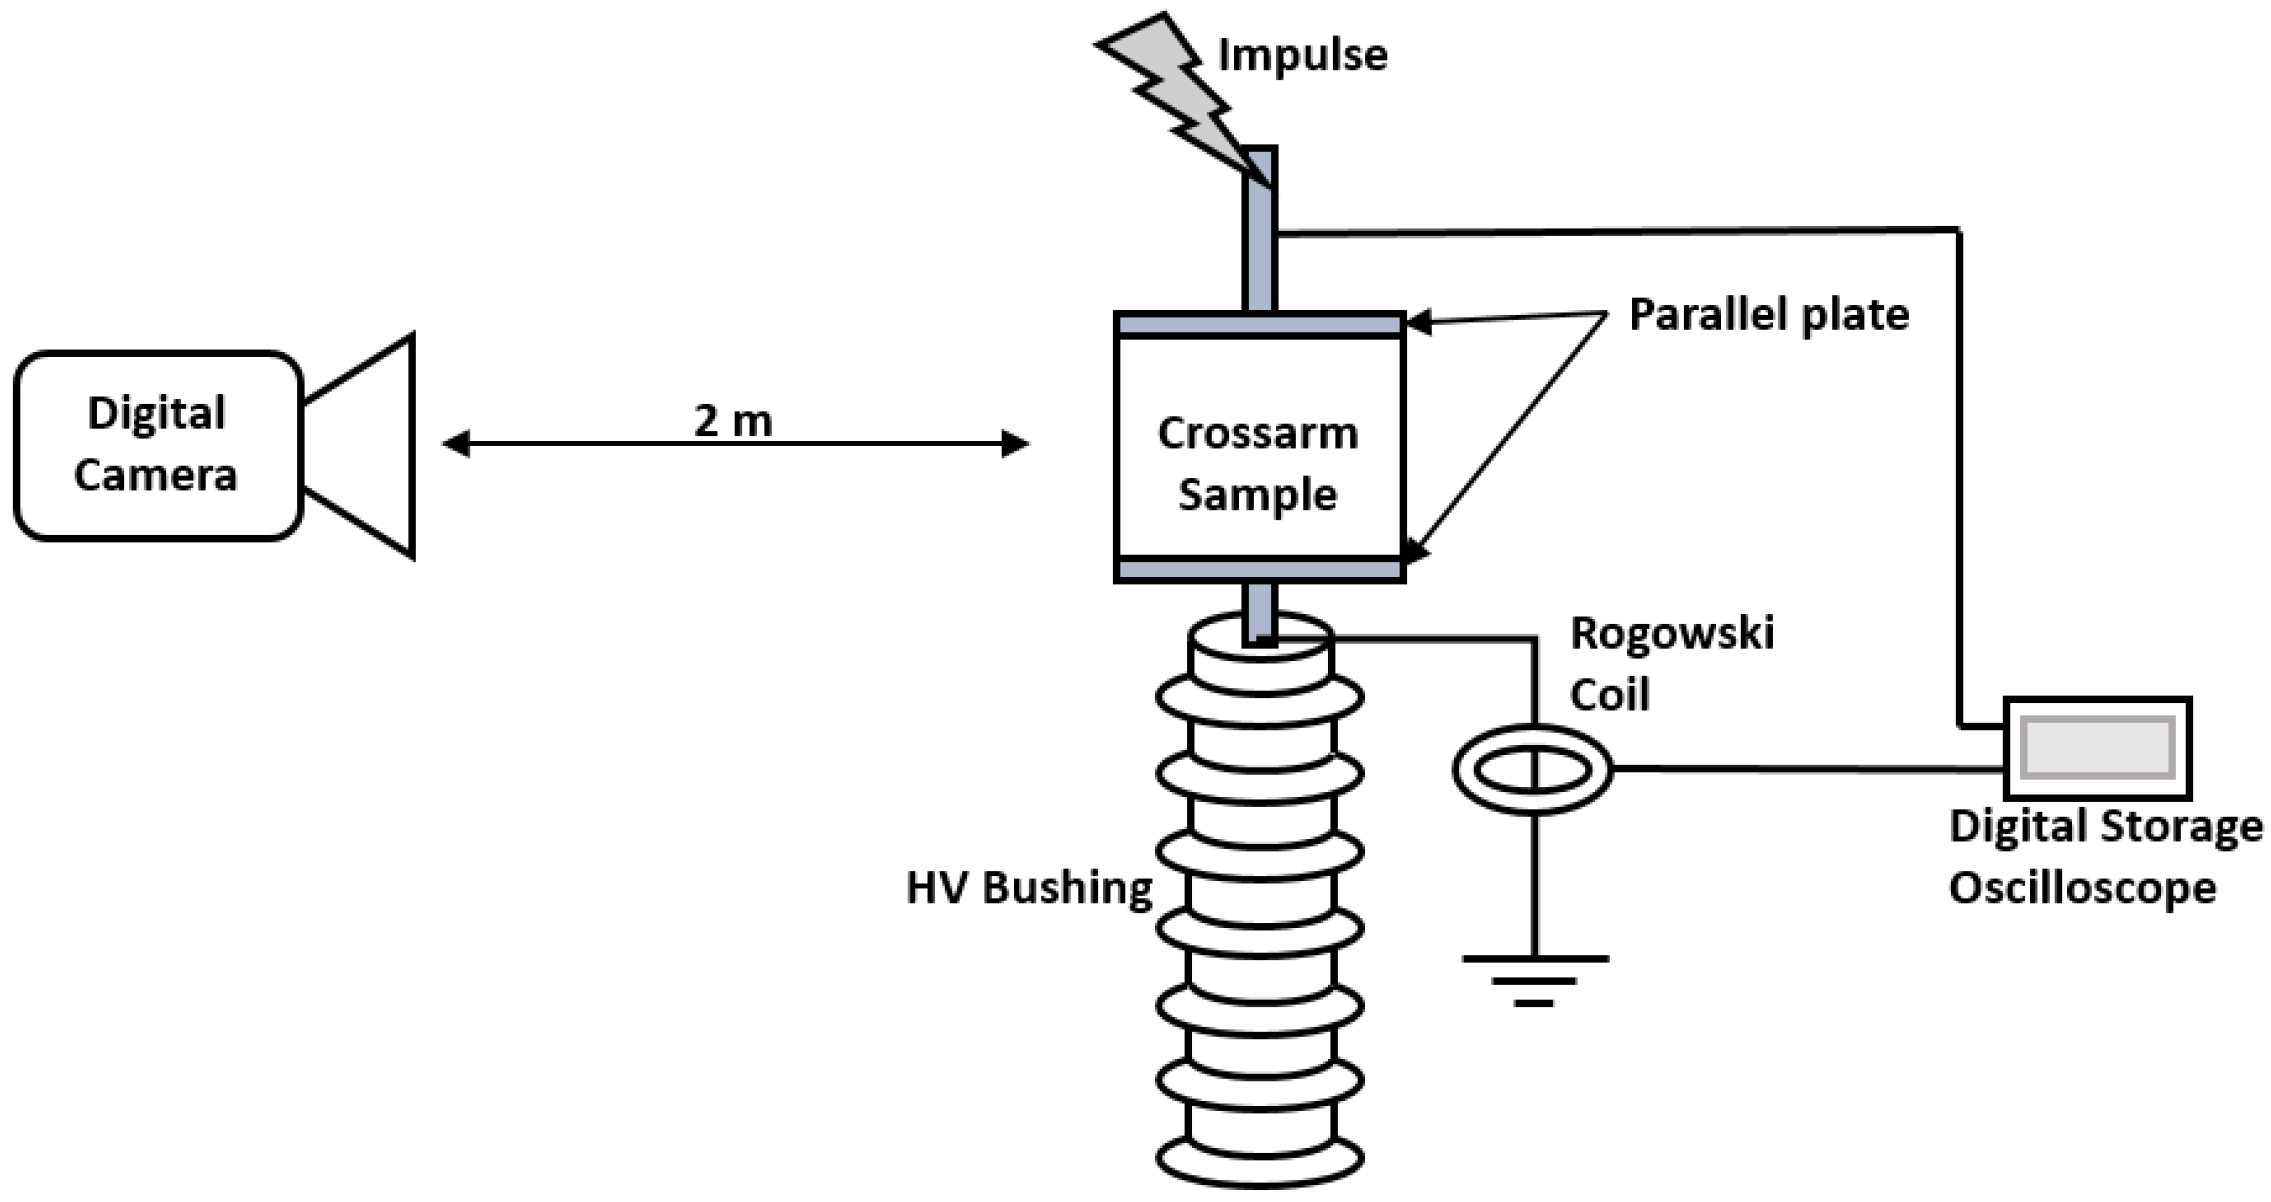
To date, there are challenges in designing good composite crossarms. One of the challenges is to select the most suitable GFRP material for the application. With limited studies available, particularly on the square tube GFRP crossarm, this work intends to understand the behavior of GFRP under different conditions. In this case, the performance of the square tube GFRP crossarm was investigated by determining the insulation characteristic for both internal and external insulation, considering the lightning impulse voltage (LIV) stress.

2. Methodology

The methodology of this study is divided into experimental and simulation works. The experimental works focused on determining the insulation strength of the crossarm, whereas the simulation works focused on analyzing the stress distribution on different parts of the crossarm.

2.1. Methodology for Experimental Works

A few samples were collected from the main member of a newly pultruded 275 kV crossarm. In this work, samples, as illustrated in Figure 2, were prepared at different lengths i.e., 50, 100, 150, 200 and 250 mm. A few samples of GFRP sheets were also obtained from the same production batch (see Figure 3).
Experimental work was carried out to evaluate the CFO voltage by conducting a lightning impulse test. The up-and-down method was adopted as suggested in IEC60060-1, in which at least 20 impulses were applied to each of the samples to satisfy the statistical validity [32,37]. An impulse voltage generating system of 400 kV/30kJ, equipped with a 150 Ω current shunt, was used to generate the standard LIV waveform, where the front time: T1 equal to 1.2 µs, and the time to half value: T2 equal to 50 µs. The generation circuit and the output waveform are shown in Figure 4 and Figure 5, respectively. Considerations have been made on both positive and negative impulse voltage.
In the lightning impulse test, the samples were sandwiched between two parallel plate electrodes made of stainless steel (refer to Figure 6). The upper electrode was connected to the output circuit of the impulse generator, while another electrode was grounded. A digital camera was used to capture the flashover path on the crossarm surfaces. To compensate for the speed of the flashover arc, an appropriate camera setting, as indicated in Table 1, was required. The test was conducted in both dry and wet conditions. The wetting was applied using a nonstandard spraying method, which is applied uniformly across the crossarm surface in every two subsequent flashovers.
Moreover, a lightning breakdown test on the GFRP sheets was carried out to investigate the breakdown strength of the internal insulation of the material. A test cell, as shown in Figure 7, was fabricated to hold the electrodes, allowing the test samples to be slotted in between. The configuration of the test cell and lightning impulse voltage application was adopted with the guide of the previous study and IEC 60243 standard [38,39,40]. The upper and lower hemispherical electrodes are both high voltage and low voltage respectively, and are made of brass. Negative impulse polarity was used in this study to avoid the breakdown across the external insulation. An initial voltage was set at approximately 40 kV, and the voltage was raised at a constant increment of 2 kV until a breakdown occurred, which was indicated by the puncture of the sample. The effect of polarity in this test can be ignored, since it is negligible.

2.2. Methodology for Simulation Works

Complementarily, a simulation work using the finite element method was carried out to extend the experimental analyses. The experimental setup was replicated in ANSYS Maxwell by utilizing the transient solver for time-domain analyses. The three-dimensional (3D) geometrical model of the samples at different lengths was drawn accordingly (refer to Figure 8). Each of the samples was subjected to the LIV equivalent to the respective CFO voltages obtained from the experiment. Negative impulse polarity was selected for the LIV injection, since it was agreed that the higher CFO voltage would provide higher stress.
In the simulation, the meshes were preliminarily conducted in the electrostatic solver, where it can support the execution of adaptive meshing. Adaptive meshing starts with the initial mesh and is refined until the required accuracy is met or the maximum number of passes is reached. In this study, the energy error was set to 1%, while the maximum number of passes was set to 10. Simultaneously, length-based and surface approximation mesh operations were applied to the model, as it can limit the mesh size in the model and be helpful to resolve curved surfaces with good quality mesh. The flow of adaptive meshing can be best illustrated in Figure 9. Figure 10 shows the optimal mesh of the 100 mm sample obtained in this study, where it consisted of 696471 fine tetrahedral elements. Notably, as the model increased in length, the total number of mesh elements increased correspondingly, as indicated in Table 2.

3. Results and Discussion

Based on the experimental work, the breakdown voltage of GFRP sheets was determined. Besides, the variation of CFO voltage of the crossarm samples under dry and wet conditions was presented considering both polarities of lightning impulse. Complementarily, the electric field (E-Field) stress on the GFRP material immediately before breakdown was successfully evaluated.

3.1. Breakdown Voltage of GFRP Specimens

Based on the conducted breakdown test on the 7 mm GFRP sheets, the breakdown voltage, Ub is evidently varied from 44 kV to 58 kV. As summarized in Table 3, the ten subsequent shots indicate an average of 50.6 kV, with a standard deviation of 4.12 kV.
Based on the data, the average lightning breakdown strength of the GFRP sheets is obtained at 7.2 kV/mm, with a standard deviation of 0.54 kV/mm. The breakdown strength is significantly lesser than those presented in previous studies, in which the breakdown strength was normally indicated by a value above the breakdown strength in AC overvoltage condition. Figure 11 indicates the plotted Weibull distribution which provides the cumulative failure probability for the breakdown. The failure probability can be calculated using Equation (1) as follows:
F ( t ) = 1 e ( t η ) β
where F(t) is the failure probability, t is the value of breakdown voltage, β is the shape of distribution and η is the scale. In this case, β is equal to 13.62 and η is equal to 52.44. It should be noted that the blue and red lines represent the median and confidence interval based on 95% of confidence level, respectively.
The inspection of the specimens after the test reveals that the material suffers local burns, which can be characterized by the charred region and delamination on the outermost laminae (see Figure 12). Meanwhile, the bottom surface suffers burn damage that is indicated by a black spot. It is believed that damages associated with LIV are more greatly dictated by the impact effect, possibly due to the shockwave and electromagnetic force due to the strike [41]. During the process, it is believed that pyrolysis gas is produced and entrapped in the inter-laminar areas due to Joule heating; eventually, the high temperature and highly pressurized area triggered an internal explosion, causing internal delamination and fiber bulging, as shown in Figure 12 [42]. At least 9 out of 10 samples experienced such damages, where it can be suggested that its rigidity would also be compromised.

3.2. Variation of CFO Voltage with Length

The obtained CFO voltages of the crossarm samples associated with positive and negative impulse polarity are indicated in Table 4. As can be seen in the table, the CFO voltages consistently increase with length. However, CFO voltages under the negative polarity exhibit a greater value than those under positive polarity. In some ways, this behavior is very common and predictable.
In the dry condition, the influence of impulse polarity is highly significant, where the difference of CFO between the polarities indicates 6.5% to 18.2% of the difference. To estimate the trend of CFO voltages against length, the data was plotted and linearly fitted, as illustrated in Figure 13.
Based on the trend lines, the mean gradient of CFO voltages is estimated. The CFO gradient for positive and negative impulses are separately determined at 0.706 kV/mm and 0.794 kV/mm. This trend can be further extrapolated linearly, by using the equation for a straight line. Compared to the previous study, the obtained CFO gradient of the square tube crossarm is much higher compared to that of the solid rod crossarm, at 0.700 kV/mm (negative polarity) [35]. Therefore, it means the insulation strength of the crossarm considered in this study is greater. However, a solid conclusion shall not be made, as the surface flashover is not only dependent on the shapes but the surface topologies and materials as well.
In the current study, the CFO gradient is expected to be constant across the defined length [35]. This behavior certainly differs from the behavior of the CFO gradient of an air gap, which is reported to be constantly changing at a definite length [43,44]. It is also reported that the CFO gradient of air gaps ranges from 0.575 to 0.625 kV/mm and 0.600 to 0.625 kV/mm under positive and negative polarity, respectively.

3.3. Wetting Influence on CFO

The conducted wet lightning test has shown that the CFO voltage is considerably reduced due to the wetting (see Table 5). As compared to the dry condition, the reduction indicated a range of 9.6% to 22.7%, and 15.5% to 30.5% for the positive and negative CFO voltages, respectively. This is consistent with the findings presented in [45], where the wet conditions decrease the CFO greater for negative compared to positive polarity. The curve of CFO voltages versus length is presented in Figure 14. It was found that the polarity effect on the CFO voltages is insignificant during the wet condition, where only a slight difference of up to 6.4% was observed between both polarities.
Some of the captured flashovers of dry and uniformly wetted samples are indicated in Table 6. Overall, there are three recognized flashover paths found in this study, which are at the crossarm surface, air gaps, and a combination of these two which is consistent with the previous studies [34,35]. However, these paths are influenced by the surface condition. For the dry condition, flashover seems to occur across the crossarm surface in the air, where two significant patterns are recorded. As can be seen in Table 6, the arcs can travel at a proximity to the surface, and some can travel roughly 1 cm from the surface. Meanwhile, for the wet condition, the flashovers seem to bridge the water droplets across the dry-band (air). In non-uniform topologies in the air, it is common to expect a higher breakdown voltage for a negatively energized electrode as compared to positively charged electrodes [46]. However, since the flashover occurs through the combination of water and air mediums, the polarity effect is less likely.
CFO voltage per unit length of FRP crossarm is presented in Figure 15. As expected, when the length increases, the CFO voltages per unit length were decreased, and a similar trend was also reported in previous research [34,35]. The highest CFO voltage per unit length recorded was at 1.1 kV/mm at negative and dry conditions. Meanwhile, the lowest was recorded at 0.6 kV/mm under positive and wet conditions. The relationship between the CFO per unit length and the sample length can be presented by y = axb, where the constant a and b are indicated in Table 7.

3.4. E-Field Distribution

Figure 16 presents the E-field distribution on the 100 mm crossarm model immediately before the flashover. The E-field was generated during the peak of applied impulse voltage. It can be seen that the field stress was abnormally distributed around the structure, which is anticipated to be evenly distributed based on the theory of parallel plate distribution. Higher stress can be seen at the edge corner of the sample nearer to the plates. The non-homogenous E-field distribution on the surfaces indicates a maximum strength of approximately 2.60 × 10⁶ V/m. The areas with maximum E-field were identified as triple junctions, in which more than two materials are placed closed to each other (refer to Figure 17).
The E-field stress distribution at the internal surface of the crossarm is equally important. Therefore, the E-field distribution on both outer and inner surfaces of the sample is analyzed and presented in Figure 17. As can be seen, the E-field profiles of the outer surface having a U-shape distribution, where the triple that junctions occur between air, steel and GFRP have caused a rise in the field. It should be noted that the maximum E-field at the middle and corner of the sample is significantly different, which marks 64.5% of the difference. Whereas, the E-field profiles on the inner surfaces are slightly curved, with a pair of bumps at both ends of the sample at which the triple junction between the polyester, PU and GFRP existed. Another triple junction can be found between the steel, polyester and GFRP. The comparison of the maximum E-field at the middle and the corner shows only 7.89%, with a higher field found at the corner.
Based on Figure 17, most of the E-field exceeds the streamer threshold at which the streamer could have initiated [47,48]. It is assumed that at the field greater than 0.50 × 10⁶ V/m, propagation and sustenance of the streamer have taken place. Despite the fact the maximum E-field has not reached the air breakdown threshold, flashover possibly happens at a lower field.
The simulations on different crossarm lengths have shown that the crossarm suffers at approximately the same maximum E-field, although the CFO voltages injected are different in magnitude. The maximum E-field presented in Table 8 resulted in an average field of 2.45 × 10⁶ V/m, with a standard deviation of 0.079 × 10⁶ V/m. It is estimated that the longer or full-scale crossarm will have the approximate value of field presented in this study.
Overall, the non-uniform distribution field could be minimized by adopting a cylindrical shape; it is noted that the maximum E-field at the curved corner indicated the lowest. As far as this study is concerned, the changes in shape are not recommended for the replacement purpose, as it may require a new design of fittings and modification of the existing towers, thus adding potential issues of clearance and some extra cost into the listing. More studies shall be made to further investigate the insulation characteristics of the GFRP crossarm, especially on the contaminated conditions which have been issues to any outdoor insulation. In this case, a few types of coating applications can be examined for performance improvement. Meanwhile, for future line application, an investigation shall be made to explore the field performance of various shapes of pultruded crossarms, while the impact of the shape on the mechanical strength should be considered as well.

4. Conclusions

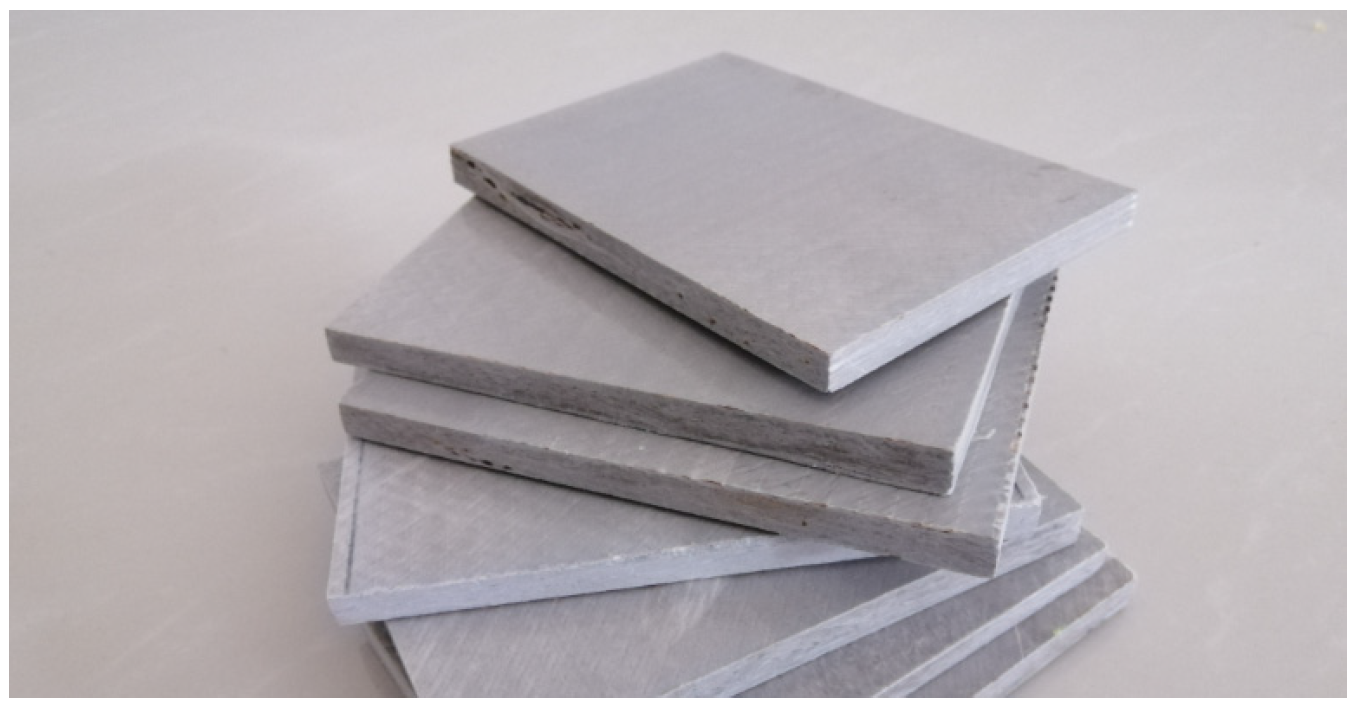
In this paper, the behavior of typical 275 kV crossarm samples used in Malaysia was investigated. The insulation performance under the LIV condition was considered, where the breakdown strength and CFO voltages were evaluated.
The study revealed that the breakdown of the GFRP material is approximately 7.2 kV/mm. The breakdown strength under the LIV condition was much lower than that obtained under the AC voltage presented in previous studies.
In addition, the CFO voltage was highly influenced by the length of the crossarm, where the increasing trends have been witnessed. Based on the trends, CFO gradients were determined, and thus the CFO of any crossarm length can be estimated.
A significant effect of polarity was found in dry conditions compared to wet conditions. Simultaneously, it was realized that the CFO voltages for negative impulses are greater than that for positive impulses, marking a difference up to 18.2% and 6.4% for dry and wet conditions, respectively.
The surface conditions have distinctly influenced the flashover paths during the lightning test. The dry condition governs the flashover path across the air gaps on the surface, whereas during the wet conditions, flashover took place across the dry-band while bridging the water droplets.
The use of a FEM-based simulation was proven to particularly locate the stresses along the crossarm surfaces under LIV. The 3D simulation sufficiently predicted and located the maximum E-field localization immediately before the breakdown. It was found that the different length of crossarm samples suffers approximate similar field stress, with an average field at 2.45 × 10⁶ V/m. A similar field magnitude was also predicted for a longer crossarm.

Author Contributions

Conceptualization, M.S.A.R. (Muhammad Syahmi Abd Rahman); resources, S.F.M.N.; writing—original draft preparation, M.S.A.R. (Muhammad Syahmi Abd Rahman); writing—review and editing, M.S.A.R. (Muhamad Safwan Abd Rahman), M.O. and N.M.Z.; supervision, M.Z.A.A.K., All authors have read and agreed to the published version of the manuscript.

Funding

This research received no external funding.

Acknowledgments

The authors would like to thank the Universiti Tenaga Nasional for the BOLD Scholarship, and URND for the RA Scheme. Special thanks to the Tenaga Nasional Berhad (Grid Maintenance) team for their kind support on the data.

Conflicts of Interest

The authors declare no conflict of interest.

References

  1. Grzybowski, S.; Li, X. Electrical degradation of fiberglass distribution line pole. IEEE Trans. Dielectr. Electr. Insul. 2006, 13, 927–934. [Google Scholar] [CrossRef]
  2. Pieper, R.J. The Use of Mechanical Testing, Photomicrography, and Electron Microscopy to Characterize an Insulating Fiberglass Composite Post-Electrical Arc Failure. Microsc. Microanal. 2016, 22, 1830–1831. [Google Scholar] [CrossRef] [Green Version]
  3. Madsen, S.F.; Holboell, J.; Henriksen, M.; Larsen, F.; Hansen, L.; Bertelsen, K. Breakdown tests of glass fibre reinforced polymers (GFRP) as part of improved lightning protection of wind turbine blades. In Proceedings of the Conference Record of the 2004 IEEE International Symposium on Electrical Insulation, Indianapolis, IN, USA, 19–22 September 2004; pp. 484–491. [Google Scholar]
  4. Li, H.-M.; Deng, S.-C.; Wei, Q.-H.; Wu, Y.-N.; Xiang, Q.-Q. Research on composite material towers used in 110kV overhead transmission lines. In Proceedings of the 2010 International Conference on High Voltage Engineering and Application, New Orleans, LA, USA, 11–14 October 2010; pp. 572–575. [Google Scholar]
  5. Jahangiri., T.; Wang, Q.; Da Silva, F.F.; Bak, C.L. Electrical Design of a 400 kV Composite Tower; Springer: Berlin/Heidelberg, Germany, 2020. [Google Scholar]
  6. Sathishkumar, T.P.; Satheeshkumar, S.; Naveen, J. Glass fiber-reinforced polymer composites—A review. J. Reinf. Plast. Compos. 2014, 33, 1258–1275. [Google Scholar] [CrossRef]
  7. Shao, J.; Wang, J.; Long, M.; Li, J.; Ma, Y. 5000 h multi-factor accelerated aging test of frp made transmission tower: Characterization, thermal decomposition and reaction kinetics study. Polymers 2017, 9, 170. [Google Scholar] [CrossRef] [PubMed] [Green Version]
  8. Hall, J.F. History and bibliography of polymeric insulators for outdoor applications. IEEE Trans. Power Deliv. 1993, 8, 376–385. [Google Scholar] [CrossRef]
  9. Dey, P.; Drinkwater, B.J.; Proud, S.H.R. Developments in insulation for high voltage overhead transmission systems. In Proceedings of the 1969 9th Electrical Insulation Conference, Boston, MA, USA, 8–11 September 1969; pp. 38–43. [Google Scholar]
  10. Hackam, R. Outdoor HV composite polymeric insulators. IEEE Trans. Dielectr. Electr. Insul. 1999, 6, 557–585. [Google Scholar] [CrossRef]
  11. Xidong, L.; Shaowu, W.; Ju, F.; Zhicheng, G. Development of composite insulators in China. IEEE Trans. Dielectr. Electr. Insul. 1999, 6, 586–594. [Google Scholar] [CrossRef]
  12. Okamoto, H.; Ikeda, Y. Arc resistance and application of FRP to arms in overhead power-line towers. IEEE Trans. Power Appar. Syst. 1967, 9, 1098–1102. [Google Scholar] [CrossRef]
  13. Nolasco, J.; Jardini, J.; Riberio, E. Overhead Lines; CIGRE Green Book: Paris, France, 2014; pp. 23–37. [Google Scholar]
  14. Goffinet, J.F.; Gutman, I.; Sidenvall, P. Innovative insulated cross-arm: Requirements, testing and construction. In Proceedings of the 12th International Conference on Live Maintenance (ICOLIM), Strasbourg, France, 26–28 April 2017; pp. 1–7. [Google Scholar]
  15. Rawi, I.M.; Abd Rahman, M.S.; Ab Kadir, M.Z.A.; Izadi, M. Wood and fiberglass crossarm performance against lightning strikes on transmission towers. In Proceedings of the International Conference on Power System, Seoul, Korea, 26–29 June 2017; pp. 1–6. [Google Scholar]
  16. Abd Rahman, M.S.; Ab Kadir, M.Z.A.; Ab-Rahman, M.; Osman, M.; Nor, S.F.M. Lightning impulse strength of 275 kV and 132 kV Tower with composite crossarm. In Proceedings of the 11th Asia-Pacific International Conference on Lightning (APL), Hong Kong, China, 12–14 June 2019; pp. 1–6. [Google Scholar]
  17. Schoene, J.D. Direct and Nearby Lightning Strike Interaction with Test Power Distribution Lines. Ph.D. Thesis, University of Florida, Gainesville, FL, USA, 2007. [Google Scholar]
  18. CIGRE. Guide to Overall Line Design, CIGRE Technical Brochure 638; CIGRE: Paris, France, 2015; pp. 1–106. [Google Scholar]
  19. Tuncer, E.; Sauers, I.; James, D.R.; Ellis, A.R. Electrical insulation characteristics of glass fiber reinforced resins. IEEE Trans. Appl. Supercond. 2019, 19, 2359–2362. [Google Scholar] [CrossRef]
  20. Gao, Y.; Liang, X.; Liu, Y.; Bao, W.; Li, S.; Wu, C. Effect of electrical stress on glass fiber reinforced polymer used in high voltage composite insulator under wet environment. Compos. Sci. Technol. 2018, 155, 151–159. [Google Scholar] [CrossRef]
  21. Jahangiri, T.; Wang, Q.; Bak, C.L.; Da Silva, F.F.; Skouboe, H. Electric stress computations for designing a novel unibody composite cross-arm using finite element method. IEEE Trans. Dielectr. Electr. Insul. 2017, 24, 3567–3577. [Google Scholar] [CrossRef]
  22. Peesapati, V.; Zachariades, C.; Li, Q.; Rowland, S.; Cotton, I.; Allison, F.; Chambers, D.; Rhodes, P. Electric field computation for a 400 kV composite cross-arm. In Proceedings of the 2012 IEEE Annual Report Conference on Electrical Insulation and Dielectric Phenomena, Montreal, QC, Canada, 14–17 October 2012; pp. 790–793. [Google Scholar]
  23. Peesapati, V.; Zachariades, C.; Li, Q.; Rowland, S.; Cotton, I.; Green, P.R.; Allison, F.; Chambers, D. 3D electric field computation of a composite cross-arm. In Proceedings of the 2012 IEEE International Symposium on Electrical Insulation (ISEI 2012), San Juan, Puerto Rico, 10–13 June 2012; pp. 464–468. [Google Scholar]
  24. Yang, X.; Wang, Q.; Wang, H.; Zhang, S.; Peng, Z. Transient electric field computation for composite cross-arm in 750 kV AC transmission line under lightning impulse voltage. IEEE Trans. Dielectr. Electr. Insul. 2016, 23, 1942–1950. [Google Scholar] [CrossRef]
  25. Asyraf, M.R.M.; Ishak, M.R.; Sapuan, S.M.; Yidris, N. Utilization of bracing arms as additional reinforcement in pultruded glass fiber-reinforced polymer composite cross-arms: Creep experimental and numerical analyses. Polymers 2021, 13, 620. [Google Scholar] [CrossRef]
  26. Mohamad, D.; Syamsir, A.; Beddu, S.; Abas, A.; Ng, F.; Razali, M.; Seman, S.A.H.A. Numerical study of composite fiberglass cross arms under statics loading and improvement with sleeve installation. IOP Conf. Ser. Mater. Sci. Eng. 2019, 530, 012027. [Google Scholar] [CrossRef]
  27. Smith, R. Composite defects and their detection. Mater. Sci. Eng. 2009, 3, 103–143. [Google Scholar]
  28. Asim, M.; Zubair Khan, M.; Alam Khan, L.; Umer, M. An integrated approach of quality for polymer composite manufacturing validated and optimized through Taguchi method. Sci. Iran. 2017, 24, 1985–1995. [Google Scholar] [CrossRef] [Green Version]
  29. ASTM D2303: Standard Test Method for Liquid-Contaminant, Inclined Plane Tracking and Erosion of Insulating Materials; ASTM International: West Conshohocken, PA, USA, 2004.
  30. Sarathi, R.; Chandrasekar, S. Diagnostic study of the surface condition of the insulation structure using wavelet transform and neural networks. Electr. Power Syst. Res. 2004, 68, 137–147. [Google Scholar] [CrossRef]
  31. IEC60587: Electrical Insulating Materials Used Under Severe Ambient Conditions—Test Methods for Evaluating Resistance to Tracking and Erosion; IEC: Geneva, Switzerland, 2007.
  32. IEC60060-1: High Voltage Test Techniques—Part 1: General Definition and Test Requirements; IEC: Geneva, Switzerland, 2010; Available online: https://webstore.iec.ch/publication/300 (accessed on 14 July 2021).
  33. IEC60383-2: Insulator for Overhead Lines with a Nominal Voltage Above 1000 V—Part 2: Insulator Strings and Insulator Sets for A.C Systems—Definitions, Test Methods and Acceptance Criteria; IEC: Geneva, Switzerland, 1993; Available online: https://webstore.iec.ch/publication/1952 (accessed on 14 July 2021).
  34. Grzybowski, S.; Disyadej, T. Electrical performance of fiberglass crossarm in distribution and transmission lines. In Proceedings of the IEEE/PES Transmission and Distribution Conference and Exposition, Bogota, Columbia, 21–24 April 2008; pp. 1–5. [Google Scholar]
  35. Grzybowski, S.; Jenkins, E. AC and lightning performance of fiberglass crossarms aged in 115 kV transmission line. IEEE Trans. Power Deliv. 1993, 8, 1914–1920. [Google Scholar] [CrossRef]
  36. Grzybowski, S.; Li, X. Added CFO voltage by the fiberglass distribution line pole. IEEE Trans. Power Deliv. 2005, 20, 958–963. [Google Scholar] [CrossRef]
  37. Lima, G.S.; Gomes, R.M.; Souza, R.E.; De Conti, A.; Silveira, F.H.; Visacro, S.; Souza, W.A. Impulse withstand voltage of single-phase compact distribution line structures considering bare and XLPE-covered cables. Electr. Power Syst. Res. 2017, 153, 88–93. [Google Scholar] [CrossRef]
  38. IEC60243-1: Electric Strength of Insulating Materials—Test Methods—Part 1: Test at Power Frequencies; IEC: Geneva, Switzerland, 2013.
  39. IEC60243-3: Electric Strength of Insulating Materials—Test Methods—Part 3: Additional Requirements for 1.2/50 µs Impulse Test; IEC: Geneva, Switzerland, 2013.
  40. Mohanty, S. Some Studies on Breakdown of Solid Insulations and it’s Modeling using Soft Computing Techniques. Ph.D. Thesis, National Institute of Technology Roukela, Odisha, India, 2010. [Google Scholar]
  41. Lin, W.; Wang, Y.; Aider, Y.; Rostaghi-Chalaki, M.; Yousefpour, K.; Kluss, J.; Wallace, D.; Liu, Y.; Hu, W. Analysis of damage modes of glass fiber composites subjected to simulated lightning strike impulse voltage puncture and direct high voltage AC puncture. J. Compos. Mater. 2020, 54, 4067–4080. [Google Scholar] [CrossRef]
  42. Li, Y.; Xue, T.; Li, R.; Huang, X.; Zeng, L. Influence of a fiberglass layer on the lightning strike damage response of CFRP laminates in the dry and hygrothermal environments. Compos. Struct. 2018, 187, 179–189. [Google Scholar] [CrossRef]
  43. Jones, B.; Waters, R. Air insulation at large spacings. IEEE 1978, 125, 1152–1176. [Google Scholar] [CrossRef]
  44. Ryan, H.M. High Voltage Engineering and Testing; IET: London, UK, 2013. [Google Scholar]
  45. Hileman., A.R. Insulation Coordination for Power Systems; CRC Press: Boca Raton, FL, USA, 1999. [Google Scholar]
  46. Chowdhuri, P.; Mishra, A.K.; Mc Connell, B.W. Volt-time characteristics of short air gaps under nonstandard lightning voltage waves. IEEE Trans. Power Deliv. 1997, 12, 470–476. [Google Scholar] [CrossRef] [Green Version]
  47. Shanmugam, G.; Samajdar, G.; Karakkad, S. Surface Charging and its Influence on Lightning Impulse Flashover Characteristics of Polymeric Insulator. In Proceedings of the 2019 IEEE International Conference on Electrical, Computer and Communication Technologies (ICECCT), Tamil Nadu, India, 20–22 February 2019; pp. 1–5. [Google Scholar]
  48. Liu., L.; Becerra, M. An efficient model to simulate stable glow corona discharges and their transition into streamers. J. Phys. D Appl. Phys. 2017, 5i0, 105204. [Google Scholar] [CrossRef]
Figure 1. The CFO voltages of a solid cylindrical GFRP crossarm [35].
Energies 14 04386 g001
Figure 2. Some of the crossarm samples at different lengths.
Energies 14 04386 g002
Figure 3. GFRP sheets specimens.
Energies 14 04386 g003
Figure 4. Simplified circuit for lightning impulse voltage generation.
Energies 14 04386 g004
Figure 5. Characteristic of generated lightning impulse voltage according to IEC60060-1 [32].
Energies 14 04386 g005
Figure 6. Test setup for lightning impulse test.
Energies 14 04386 g006
Figure 7. Test setup for lightning impulse test.
Energies 14 04386 g007
Figure 8. Simulation model of GFRP.
Energies 14 04386 g008
Figure 9. Adaptive meshing workflow in Ansys Maxwell.
Energies 14 04386 g009
Figure 10. Isometrics view of mesh plot of 100 mm sample model.
Energies 14 04386 g010
Figure 11. Weibull distribution for breakdown voltage of GFRP sheet.
Energies 14 04386 g011
Figure 12. Post-breakdown damages on GFRP surfaces.
Energies 14 04386 g012
Figure 13. CFO voltage at different lengths under dry conditions.
Energies 14 04386 g013
Figure 14. CFO voltage at different lengths under wet conditions.
Energies 14 04386 g014
Figure 15. CFO voltage per unit length under different conditions.
Energies 14 04386 g015
Figure 16. E-field distribution on the outer surface of GFRP crossarm sample (100 mm length) with A, B, C and D refer to measurement line across outer middle, inner middle, outer corner and inner corner surfaces, respectively.
Energies 14 04386 g016
Figure 17. E-field profiles across A, B, C, D of 100 mm sample.
Energies 14 04386 g017
Table 1. Camera settings for capturing flashover discharges.
ParameterDescription
Camera modeManual
Shutter speed6”
ISO200
ApertureF29
White BalanceAuto
Lens typeTelephoto zoom
Table 2. Simulation cases with corresponding total mesh elements.
Length (mm)Voltage Injection (kV)Total Mesh Elements
50−54.6237,364
100−94.5696,471
150−128.6975,808
200−175.51,293,394
250−215.31,674,961
Table 3. Breakdown voltage of GFRP sheet.
SpecimenBreakdown Voltage, Ub (kV)Breakdown Strength (kV/mm)
154.07.7
248.06.9
358.08.3
448.06.9
548.06.9
644.06.3
752.07.4
848.06.9
954.07.7
1052.07.4
Average50.67.2
Std. Dev4.120.54
Table 4. Evaluated CFO voltage under dry conditions.
SpecimenCFO Voltage (kV)Differences (%)
PositiveNegative
5046.2−54.618.2
10085.2−94.510.9
150120.8−128.66.5
200153.8−175.514.1
250186.9−215.315.2
Table 5. Evaluated CFO voltage under wet condition.
Length (mm)CFO Voltage (kV)
PositiveNegative
5035.7−38.0
10064.6−65.7
150109.2−108.7
200133.3−134.7
250151.1−154.0
Table 6. Flashover path comparison.
Length (mm)Flashover Path
DryWet
100 Energies 14 04386 i001 Energies 14 04386 i002
250 Energies 14 04386 i003 Energies 14 04386 i004
Table 7. Maximum E-field on the crossarm surface.
Conditionab
Positive Dry1.51734−0.12692
Negative Dry0.91208−0.06286
Positive Wet1.97658−0.15611
Negative Wet1.09749−0.09681
Table 8. Maximum E-field on the crossarm surface.
Length (mm)Maximum E-Field on Surface (V/m)
502.37 × 10⁶
1002.60 × 106
1502.42 × 106
2002.41 × 106
2502.47 × 106
Publisher’s Note: MDPI stays neutral with regard to jurisdictional claims in published maps and institutional affiliations.

