In the U.S. there is growing support among policymakers and energy regulators for nuclear energy to play a substantial role in decarbonizing the global economic system. There is also recognition that the traditional nuclear deployment model based on field construction of large GW-scale reactors—taking over a decade to license and build, requiring multi-billion-dollar investments, and ultimately selling commodity electrons on the grid—is no longer economically sustainable. As such, considerable interest is now being placed on smaller reactors that can be deployed at a fraction of the cost and time and can serve a variety of users beyond the electric grid. In this paper we focus on micro-reactors, loosely defined as “nuclear reactors that have a thermal power of no more than tens of megawatts” [
1].
The market potential of micro-reactors is vast and underestimated. Commonly emphasized applications include niche markets such as remote communities, mining sites and military bases, all applications in which nuclear would replace extremely expensive electricity supplied by diesel generators [
2,
3,
4]. There are hundreds of such sites worldwide, thus targeting these niche applications is a wise first step toward commercialization of the micro-reactor technology. However, the full economic and environmental benefits of micro-reactors will not be realized unless they can displace fossil fuels in much larger markets and on a much grander scale. Industrial activities, transportation, buildings and agriculture account for over 70% of the world’s total carbon emissions. Micro-reactors can supply electricity and heat to factories, manufacturing facilities, district heating, data centers, seaports and airports, ship propulsion systems, desalination plants, disaster relief efforts and EV recharging stations, to mention a few. They can do so without the massive infrastructure for energy storage and transmission which is typical of the electric grid and fossil fuel distribution networks [
5].
In this paper, we first introduce a special class of micro-reactors that we will call Nuclear Batteries (NB) (
Section 1) and discuss the scope of their potential markets (
Section 2). Then we identify the NB cost targets for electricity and heat in those markets (
Section 3). Finally, we present a parametric study of the NB’s levelized cost of heat and electricity (
Section 4) with the goal of (i) assessing whether those cost targets are within reach of the NB technology, and (ii) identifying its important cost drivers.
1. The Nuclear Battery Concept
A nuclear battery (NB) is defined here as a stand-alone, plug-and-play energy platform combining a micro-reactor and a turbine to supply significant amounts of heat and/or electricity from a very small footprint. It uses a factory-assembled, factory-fueled and road-transportable reactor design with a power output of 1 to 20 MW. It is compact enough to fit within ISO standard shipping containers and be transported to the site of interest, where it can be installed and be made operational in a matter of days to weeks. The NB is a semi-autonomous and remotely monitored system that can operate continuously or on demand for many years without fuel resupply. Once the NB is “exhausted,” it can be replaced with a freshly fueled NB, while the used NB is safely shipped back to a central facility for refueling and refurbishment. As such, there is no need for high-level radioactive waste handling and storage at the user site, but a national waste repository is still required.
The concept of small portable plug-and-play micro-reactors is not new. In the early 1960s the U.S. Army designed, built and tested ML-1, a 500-kW gas-cooled micro-reactor that could be hauled around by truck and provide power in the field in less than a day and for over one effective full power year without refueling [
6]. The Idaho National Laboratory currently defines a nuclear battery as a micro-reactor that is “cost competitive, fabricated, installed, unattended, reliable,” akin to a AAA electrochemical battery. NBs are being designed to operate in either baseload or load-following mode. What makes the NB concept particularly compelling now is the maturation of a suite of technologies that will be used in modern NB designs, from advanced turbomachinery to sensors, from new nuclear materials to additive manufacturing, from machine learning to robotics.
The expected schedule for testing and commercialization of NBs is quite aggressive. For example, NBs for the Department of Defense’s Project Pele are due for initial demonstration in 2023 and field deployment in 2027. Westinghouse’s eVinci nuclear battery is scheduled to undergo nuclear testing at the Idaho National Laboratory in 2024. The KRUSTY/Kilopower NB for space applications, was designed, fabricated and tested by the Los Alamos National Laboratory and NASA in only three years, between 2015 and 2018. This represents a dramatic acceleration with respect to larger-scale reactors, including the so-called Generation IV systems.
Examples of modern NB designs are shown in
Figure 1. None of these systems use traditional light-water-reactor technologies; all of them leverage significant innovations in coolant, fuel and moderator materials. In a common embodiment, the NB features a set of heat pipes that remove heat from a monolithic block-type reactor core in a manner that is insensitive to system orientation (important for mobile applications) and external perturbations. The reactor is encapsulated within a small and robust steel containment vessel, possibly embedded below grade. In general, the NB concept is expected to have an outstanding safety profile stemming from a combination of inherent features like accident-tolerant fuel form, low power density and high thermal capacity in the core, high surface-to-volume ratio to remove the decay heat, and few moving parts. The NB can achieve the three fundamental nuclear safety functions without operator intervention: (i) rapid shut down of the fission chain reaction in the event of an anomalous condition, (ii) adequate cooling of the nuclear fuel during shutdown, and (iii) no uncontrolled release of materials into the biosphere. This approach dramatically reduces by design the possibility of accidents like Three Mile Island, Chernobyl and Fukushima.
Physical security for NBs during operation will come from a combination of design features (e.g., robust fuel and reactor package), layout (e.g., below grade embedment) and remote monitoring and defense. For any autonomous system, cyber-security is also a potential concern. However, the NB’s inherent safety features will be such that even a knowledgeable operator would not be able to damage the nuclear fuel or cause a radioactivity release. For example, it would be physically impossible to cause a runaway reaction (e.g., by manipulating control mechanisms), or use instrumentation and controls to interrupt residual heat removal from the core. While cyber-defense layers certainly must be implemented, they would be aimed primarily at ensuring continuity of service, not preventing a safety-relevant event.
For economic reasons, the NB site must require minimal preparation. Several above- and below-grade layouts are possible, with different economic tradeoffs. For the purpose of this study, we envision excavation of a rectangular hole in the ground for a prefabricated steel/concrete vault which accommodates the NB. The NB reactor will be delivered to the site and lowered into the vault. Above grade there is a small flat area for the skid-mounted power conversion unit and a small, prefabricated building—it could be another ISO container—which serves as an office and storage area for documentation, tools and materials required to perform minor maintenance on the NB. Depending on the nature and location of the site, a security fence may be required, or the NB could be sited directly within an already secure perimeter. Once the NB is exhausted, it will be lifted from the vault and shipped back to the central refueling and service facility. Layout examples for NBs are shown in
Figure 2.
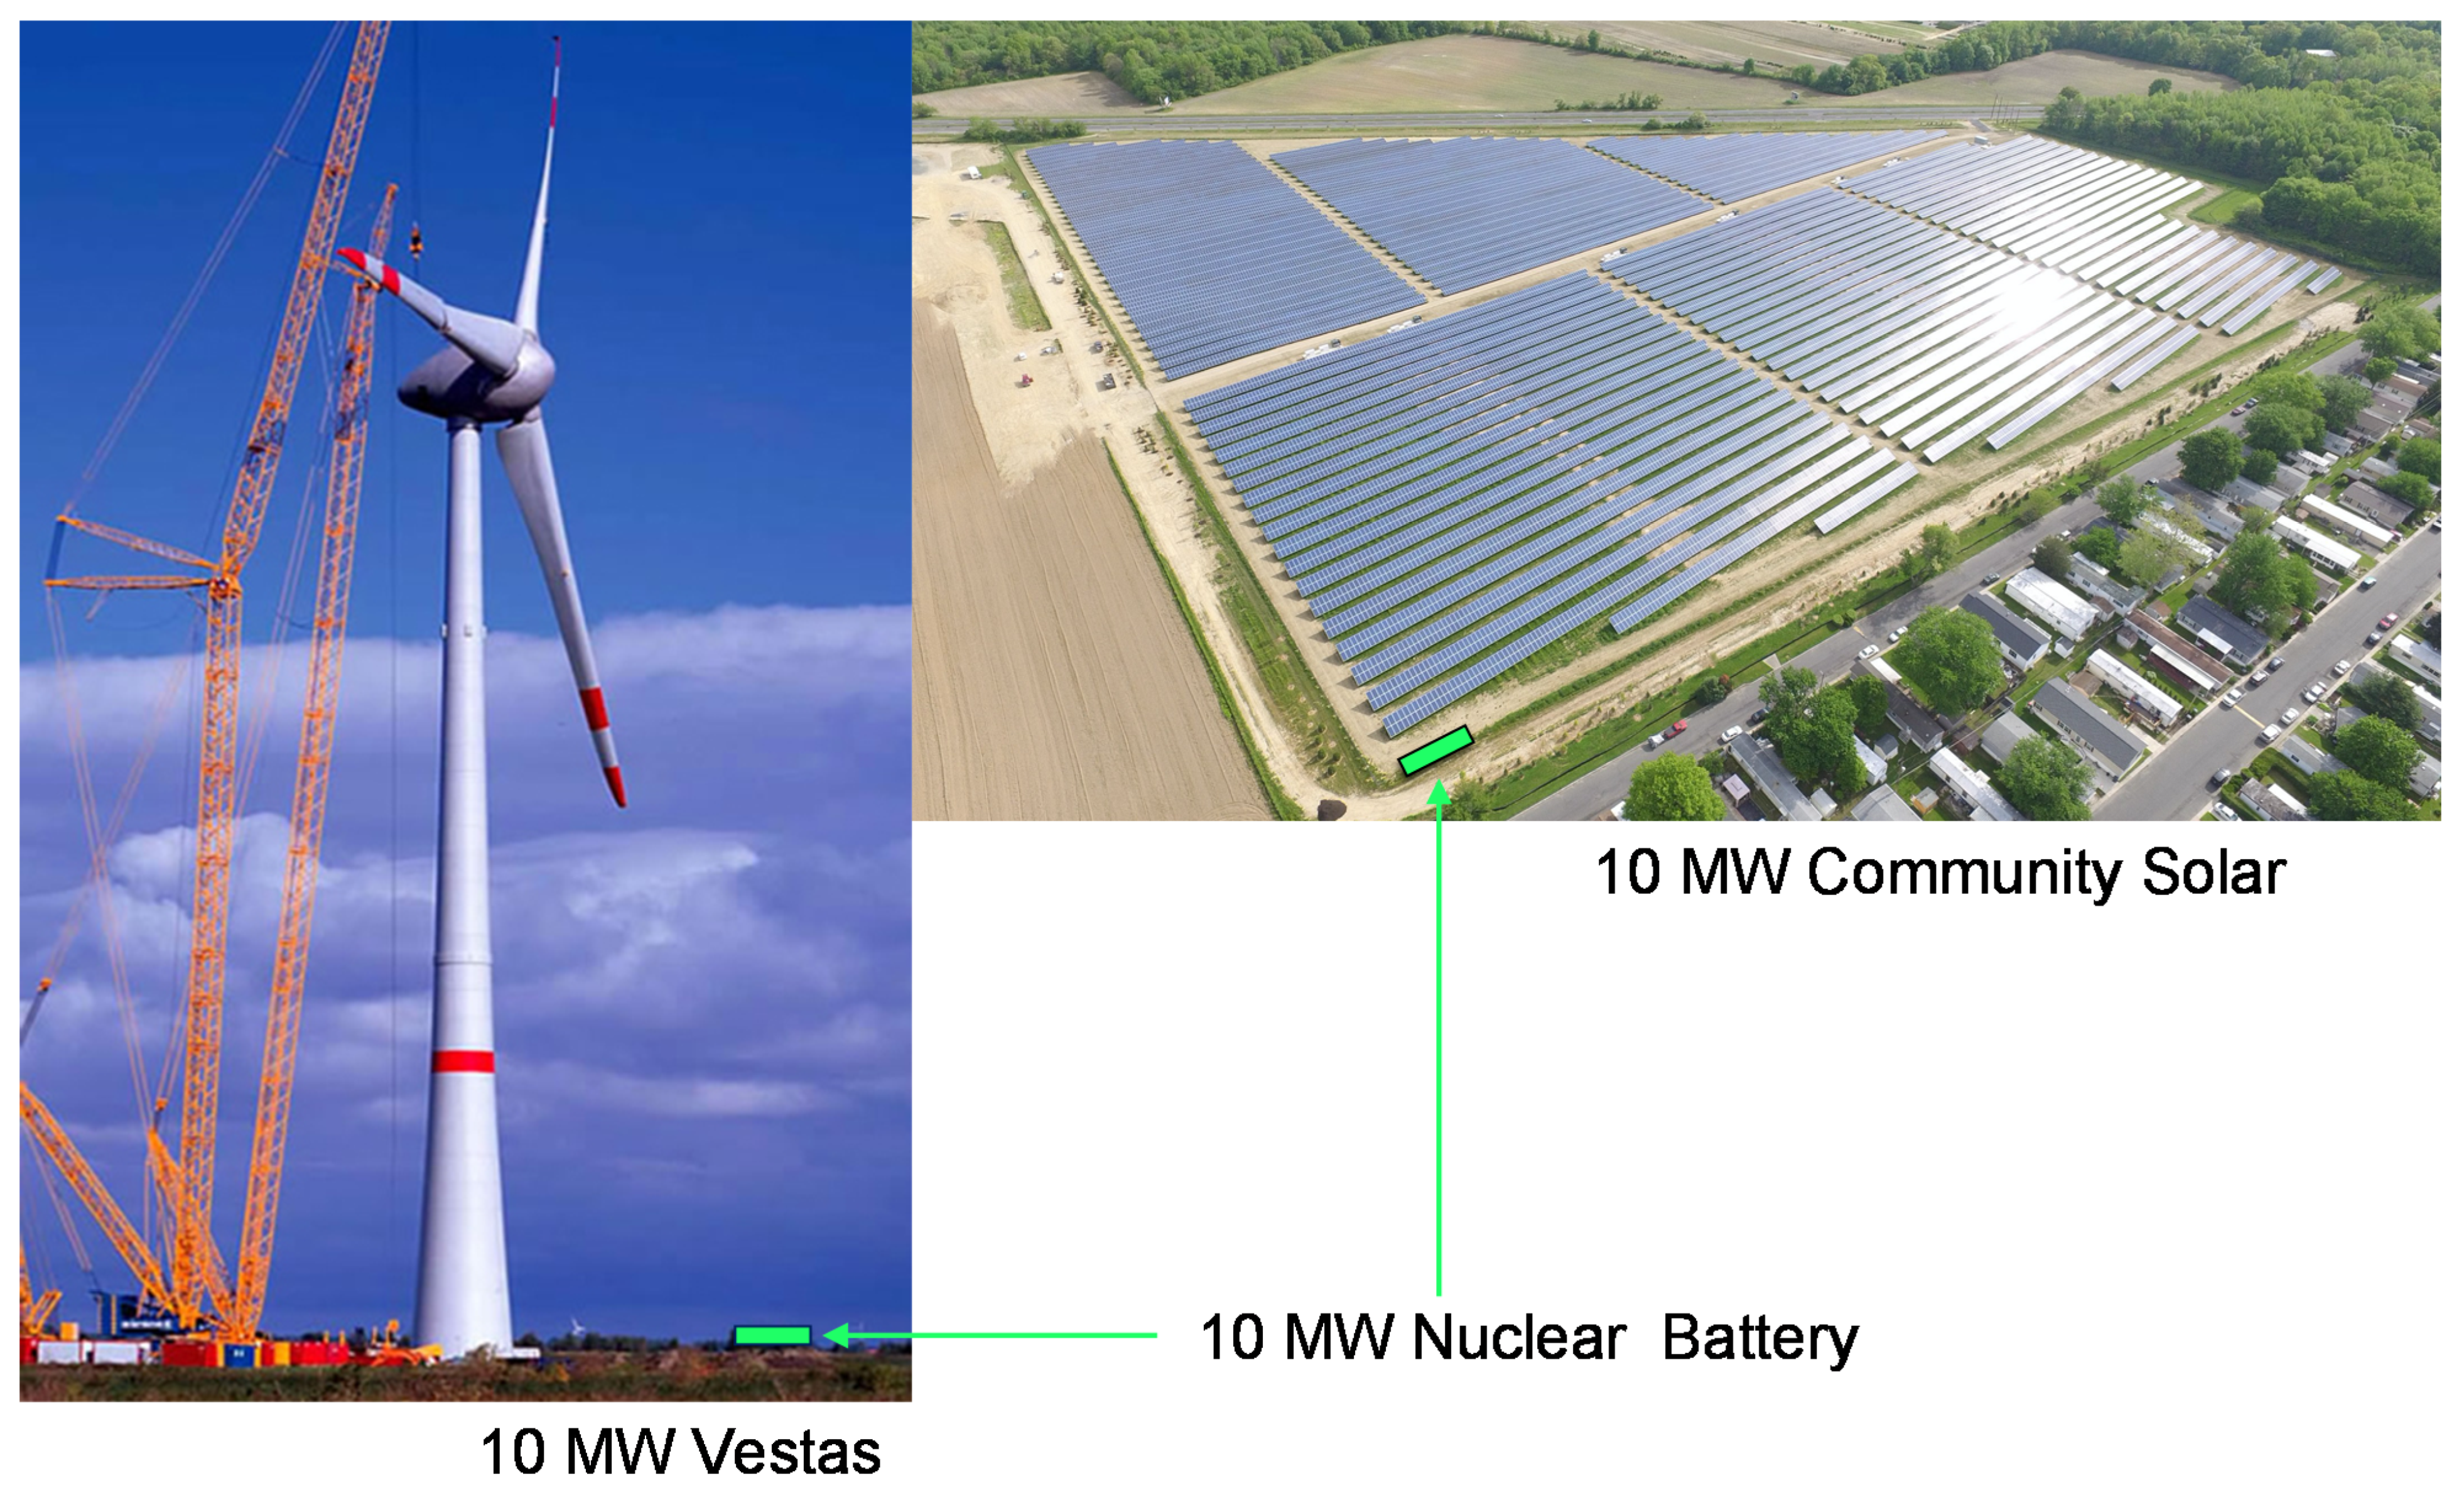
The promise and importance of the NB is most evident in comparison with other low-carbon energy sources, which are generally of much lower power density. As such, NBs require considerably less space than solar and wind farms for the same power produced. For example, we estimate that ten 10-MW NBs, providing a stable energy supply of 100 MW, would occupy roughly 4000 m
2 (including the security area), with an installed power density of 25,000 W/m
2. By comparison, a 100-MW wind farm of 3-MW turbines placed in a square grid has an installed power density of about 2–3 W/m
2 [
11,
12], and thus occupies at least 33,000,000 m
2, often in dual use with agriculture. Offshore wind does not consume land but is subject to other geographic constraints. A notional size comparison between NBs and land-based renewables is shown
Figure 3.
To build a wind farm of 100 MW requires about 20,000 tons of steel, 50,000 tons of concrete as well as 900 tons of plastics used in the blades [
13]. Solar PV farms of similar installed power would require 50% larger total amount of material, albeit less steel than wind [
14]. In contrast, we estimate that ten NBs generating 100 MW would require about 20 tons of low enriched uranium, as well as about 1600 and 4600 tons of steel and concrete, respectively, which include the transportation cask and dry casks for the spent fuel. Moreover, while the capacity factor for a nuclear system is high, typically around 0.9, the capacity factor of wind and solar PV farms is generally low, typically 0.35 and 0.2, respectively, and varying seasonally which requires significant storage capacity to be installed alongside. Therefore, the 10 NBs are actually equivalent to a wind plant of nominal capacity 260 MW or a solar plant of nominal capacity 450 MW, and the aforementioned material requirements for wind and solar need to be scaled up accordingly for a meaningful comparison. Finally, NBs do not need energy storage systems alongside, can operate in short time, can be installed near the users and thus require no transmission expense. This makes them uniquely versatile and flexible to use for a wide variety of markets, as explained in the next section.
2. Prospective Markets for Nuclear Batteries
Nuclear batteries may offer a competitive source of energy for a number of diverse markets. Before turning to those markets, it is useful to focus first on the distinctive features of NBs and how that positions them against alternatives. Five distinct features determine where NBs are most likely to penetrate the market. The first is energy density, for both heat and electricity. The second is dispatchability, i.e., the ability to supply energy on demand. The third is zero emissions, including both carbon and local air pollutants such as particulates, NOx and SOx. The fourth is siting flexibility with minimal geographic constraints. The fifth is suitability for mobile deployment, which might be important in certain applications, for example ship propulsion. The first two features make NBs a direct competitor to fossil fuel-fired technologies, while the third and fourth give it a competitive advantage over them. Although NBs and fossil fuel-fired technologies are all dispatchable, the capital intensity of NBs means that their competitive advantage will be largest in serving baseloads, and smallest where the average capacity factor is low.
Renewables are a source of zero-emissions electricity for many loads and markets. They have supplanted significant quantities of fossil fuel-fired generation where emissions reductions have been prioritized. However, to get to a net-zero energy system will require a much larger penetration of zero-emissions technologies, and renewables are less well suited for some markets. NBs will be competitive against renewables wherever the demand for heat, for energy density, for dispatchability and for siting without geographic constraints are significant.
Table 1 summarizes the comparison of NBs with potential alternatives.
This catalogue of competitive advantages leads us to identify a diverse set of customers most likely to benefit from the NB technology.
Off-grid electricity markets are an obvious choice for first-mover NB customers. These markets typically rely on more expensive fossil fuels such as diesel, and the high cost of fuel delivery adds to unit costs. This raises the cost target a NB must achieve to be competitive against fossil fuel technologies. Success in this market, however, will depend significantly on vendors’ success in making NBs a reliable option. Off-grid markets are often remote, and this impedes timely servicing or unscheduled replacement of whatever technology is installed. Consequently, off-grid markets often invest in duplicate capacity and place a premium on simple, familiar equipment such as diesel generators. They will have to be convinced that NBs can provide comparable reliability, recognizing logistical issues.
NBs also have strong potential as generation sources within microgrids. The value proposition of a microgrid is predicated in large part on the ultra-high reliability and resiliency of service they afford their owners and users. Highly reliable and dispatchable fossil-based generators are used with onsite fuel storage to match the energy-demand risk profile of the application. As a result, fossil generation constitutes over 85% of the capacity built into microgrids as of 2020. Only NBs can provide a highly reliable, high-capacity factor, fuel-secured, carbon-free alternative to fossil that provides resiliency of service and flexibly following the demand of a microgrid. Microgrids will become ubiquitous as certain areas of the electricity grid become more fragile and as transmission and distribution development costs rise over time. As the need to decarbonize continues concurrent with these trends, the need for NBs in microgrids will crystalize.
Heat markets, including industrial process heat and concentrated residential and commercial districts, have been served almost exclusively by a variety of fossil fuels, whether dedicated to the provision of heat or used for cogeneration of heat and electricity (CHP). In recent decades, natural gas (NG)-fired boilers have become the main option for heat users; similarly, NG-fired gas turbines and combined-cycle plants have become the main options for new, large-capacity CHP installations, while micro-turbines began to penetrate the market for very small CHP installations. However, in recent years, tightening carbon emissions goals have already dramatically reduced the outlook for any new CHP capacity in the U.S. and Europe, and have begun to spotlight the need for a zero-emissions option for dedicated heat production, too. This is a market in search of new options like NBs, and NBs will compete here against other new technologies. In the case of large-scale dedicated heat production or large-scale CHP, these may include NG with carbon capture and sequestration (CCS) or green hydrogen. In smaller commercial systems, this may include grid-supplied heat pumps. The same competitive requirements apply to heat applications, i.e., energy density, dispatchability, zero-emissions, and uniquely important for heat, proximity to the end users because of the large penalty associated with long-distance heat transmission. Since NBs can satisfy all these requirements simultaneously, heat markets represent a potentially enormous opportunity for NBs.
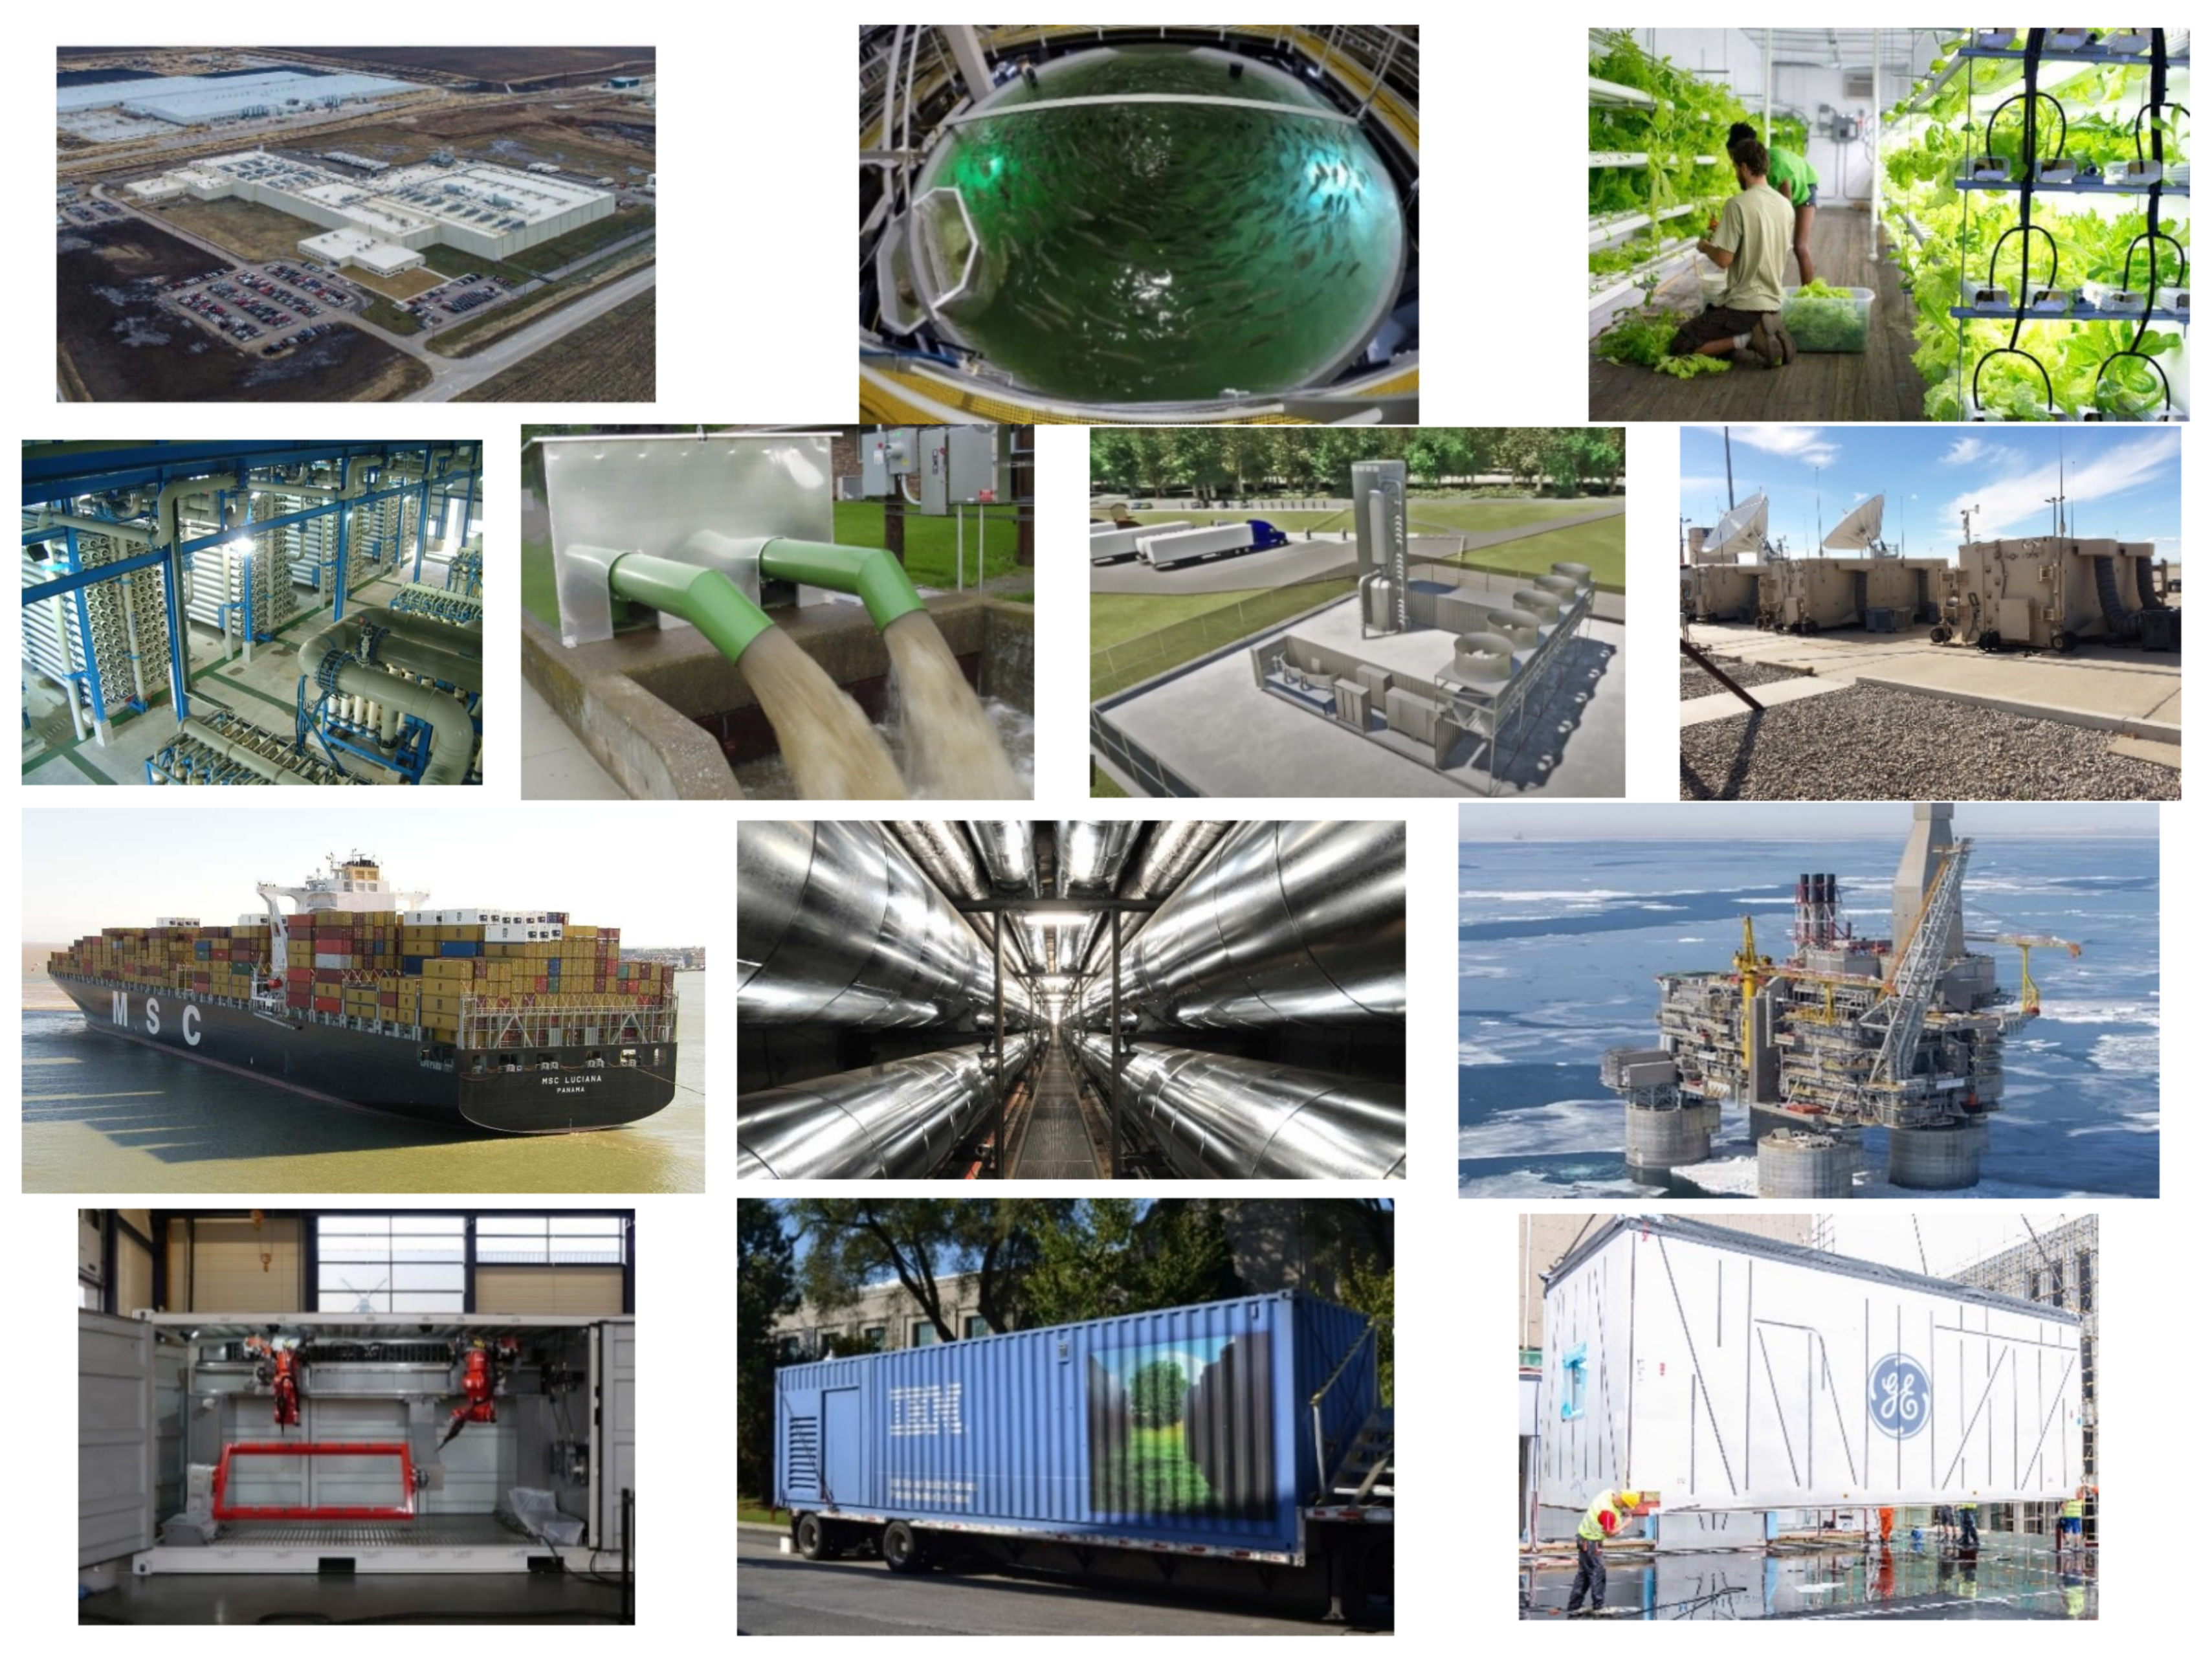
In summary, as compact, clean and dispatchable generators of heat and electricity, NBs can serve many markets and many activities across all sectors of the economy. Some examples are shown in
Figure 4. Co-locating supply (the NB) and demand (the production facilities) maximizes the utilization factor of the energy generators and production facilities simultaneously, and drastically reduces the need for the massive energy transmission and storage infrastructure typical of the traditional power grid and fuel distribution networks.
The vision described here implies a future in which NBs will not be sited solely in isolated communities or remote areas for niche applications, but rather primarily in urban, suburban, industrial and coastal environments, therefore within or in proximity to densely populated areas, and would constitute the backbone of a new, more efficient and cleaner way to produce goods, foods and fuels.
3. Cost Targets for Nuclear Batteries in Large Markets
The cost at which NBs become competitive varies greatly across the diverse array of markets and customers discussed in the previous section. At a higher cost, NBs are limited to a smaller market segment, and as NB costs fall with successive deployments, the scale of the market expands. Their competitiveness would increase further should the price of NG rise or the carbon abatement regulations (e.g., price signal via carbon tax, cap-and-trade or an emission limit) manifest. In order to provide useful targets, here we focus on three benchmarks.
The first benchmark is the cost of NG used to provide direct heat production, inclusive of a cost of carbon. In the U.S. and many regions of the world, the competition for NBs in heat applications will be NG-fired boilers.
Table 2 shows the average prices of NG in the U.S. Most NG boilers are too small for carbon capture and sequestration (CCS). As such, burning NG will result in substantial emissions and, in a carbon-constrained world, will incur a carbon tax. Interestingly, should CCS be an option, its cost for a flue gas with 10% mol. CO
2 concentration and 99% capture efficiency could be up to 100 USD/t
CO2, [
15] including compression, but excluding transport and storage, which might add an extra 4–45 USD/t
CO2 depending on location [
16].
Figure 5 shows the cost of heat from NG as a function of NG price for various values of the carbon tax from 50 to 150 USD/t
CO2. Examination of these plots suggests that the competitive cost target for heat from the NBs should be in the 20–50 USD/MWh (6–15 USD/MMBTU) range.
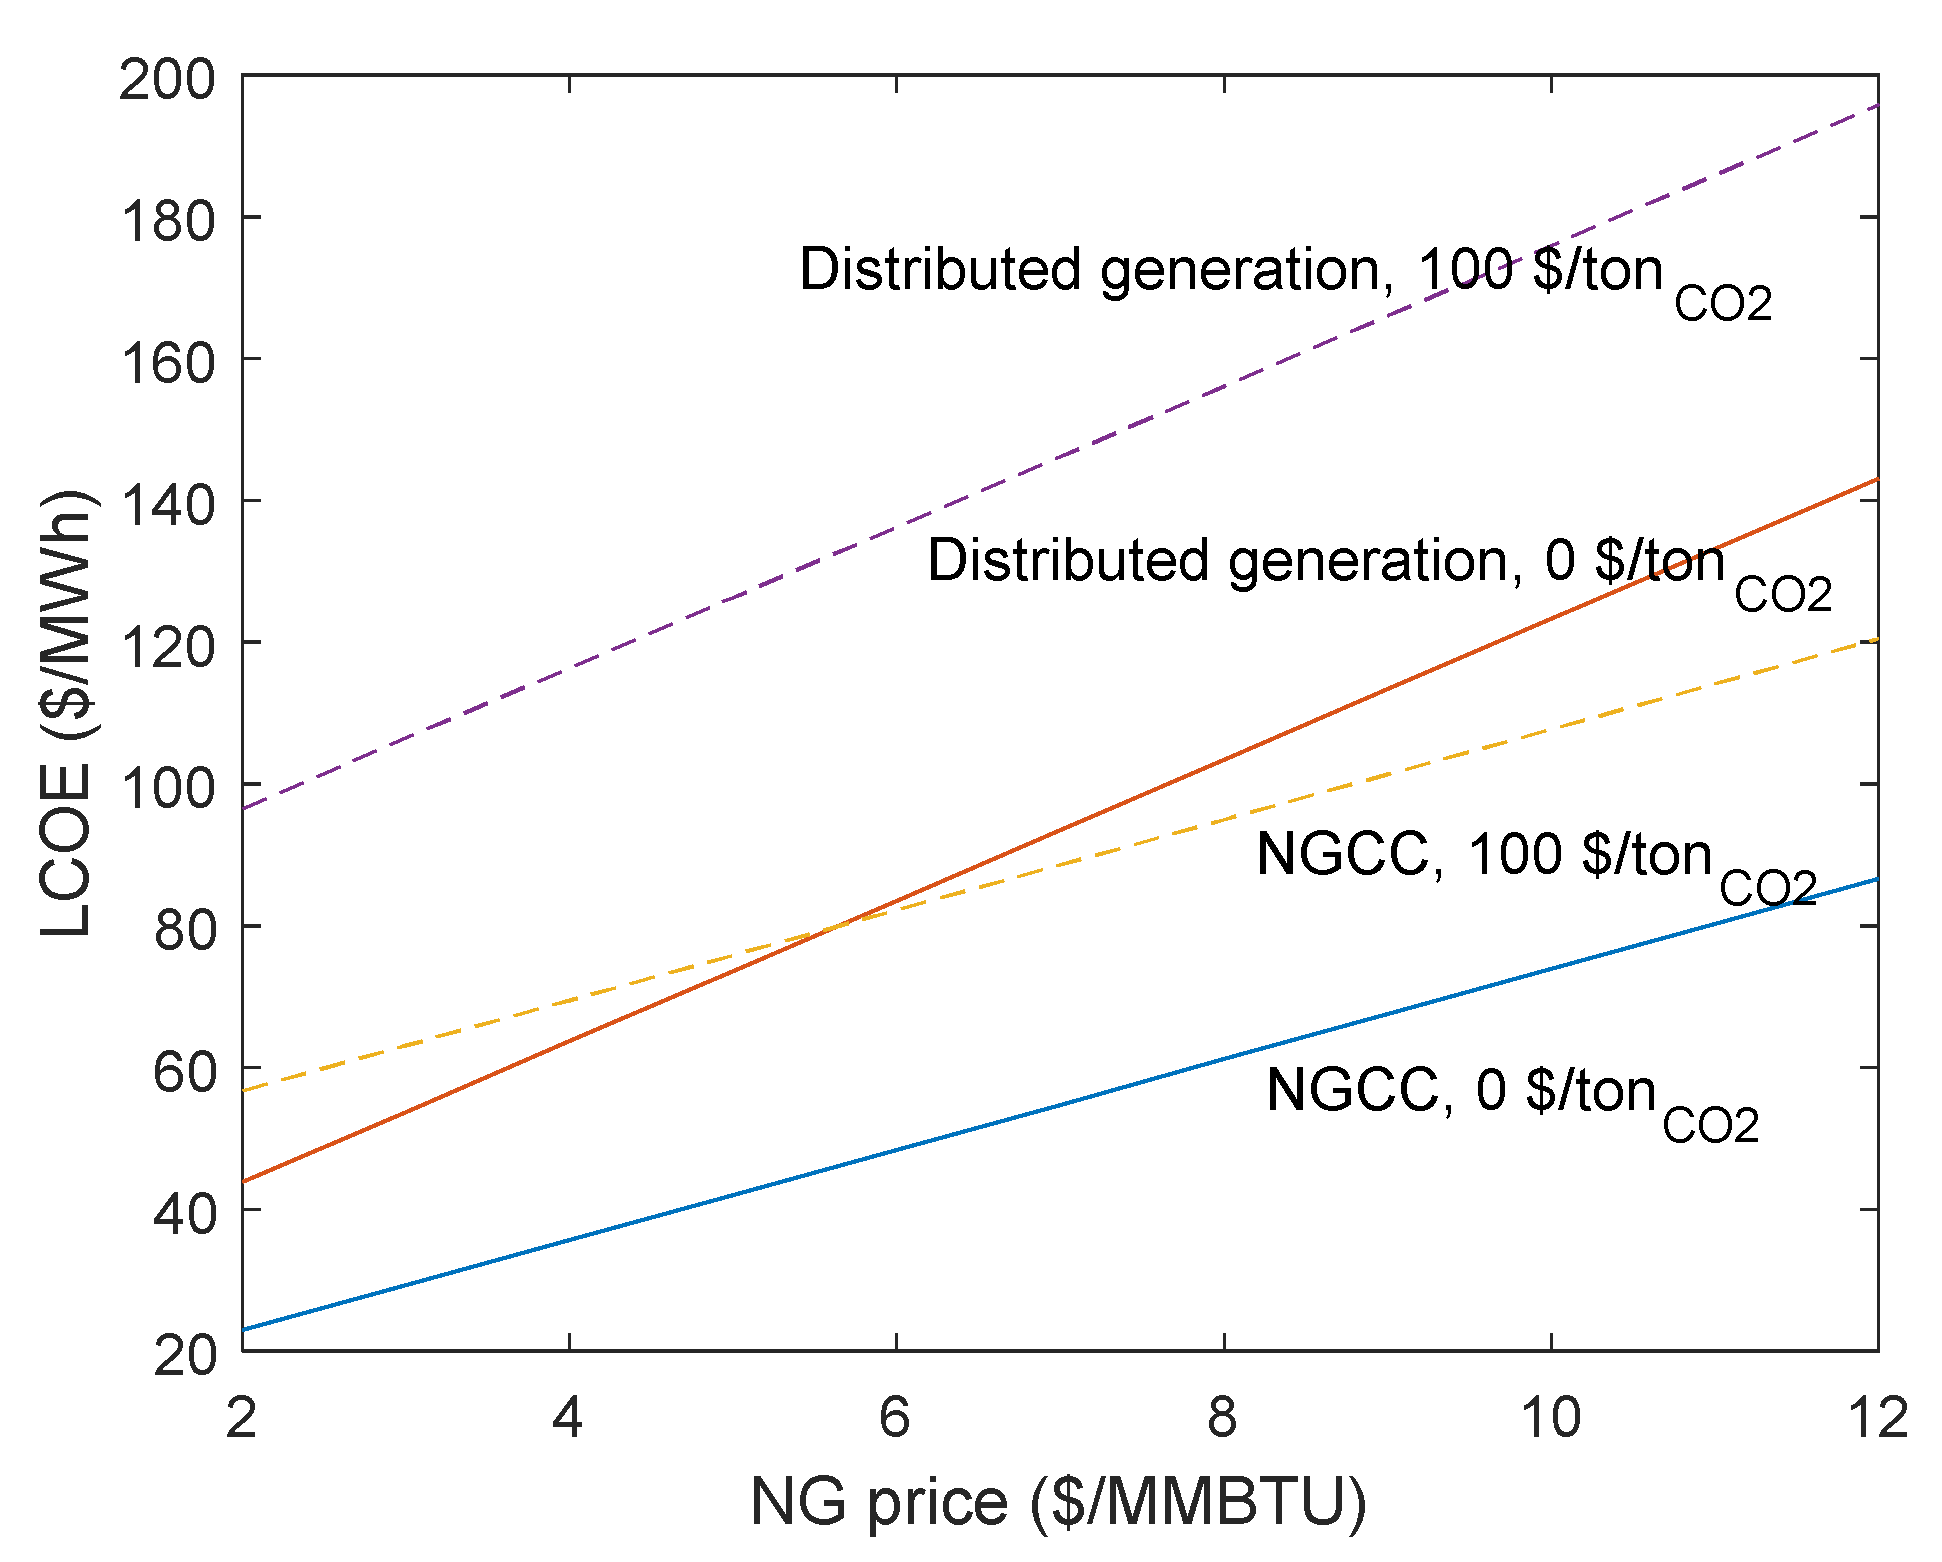
The second benchmark is the cost of dispatchable electricity, whether from a large NG combined-cycle generator (NGCC) or from NG-fired distributed generation, both inclusive of a cost of carbon. We used the assumptions made in the EIA’s 2021 Annual Energy Outlook to calculate the levelized costs of electricity (LCOE) for a NGCC as a function of the NG price and carbon tax. The EIA Outlook modeling also includes a “generic” dispatchable generator operating at baseload. Installation of the dispatchable generator helps avoid transmission investments. The EIA’s modeling shows significant amounts of this dispatchable generation installed. We calculate the LCOE for this NG-fired distributed generator operating baseload as a function of the NG price and carbon tax and treat this as a benchmark for the higher value end of the market where a NB can compete. The results are shown in
Figure 6.
This second benchmark shows that at a natural gas price of 4 USD/MMBTU and a carbon price of 100 USD/tonCO2, the LCOE for baseload generation by an NGCC plant is about 70 USD/MWh and the LCOE for baseload generation by NG-fired distributed generation is about 115 USD/MWh. Therefore, 70–115 USD/MWh can be considered a reasonable cost target range for electricity generation by the NBs.
The third benchmark is the cost of generating hydrogen. We consider two low-carbon production routes to hydrogen that would have the potential to produce at scale within a reasonable time. One route involves the steam methane reforming process with CCS, while the other route is through renewable power coupled with electrolysis of water. Of these two, methane reforming followed by CCS (presumably at >95% capture efficiency) is closest to deployment at scale. Assuming a carbon tax of 100 USD/tCO2 and NG price of 3 USD/MMBTU, the projected cost of hydrogen is about 1 USD/kg, excluding storage and distribution costs. This cost may escalate to about 3 USD/kg or higher if carbon capture efficiency needs to be better than 98%, which may be required to avoid unacceptable increases in level of atmospheric CO2 due to hydrogen production. In contrast, the renewable power plus electrolysis route has more uncertainties given the lack of experience with deployment at scale. For example, it is unclear how to realistically factor in the costs of storing electricity and/or the hydrogen itself needed to cope with the inherent intermittency of renewable power. Assuming a levelized cost of electricity of 50 USD/MWh, the current estimated cost of hydrogen produced from renewables is 4–5 USD/kg, excluding hydrogen distribution costs. It thus seems that the cost of hydrogen obtained from a high-temperature electrolysis process powered by NBs would need to be in the 3–4 USD/kg range to become competitive with these alternative routes.
4. Evaluation of the Cost of Electricity and Heat from Nuclear Batteries
In this analysis, we assume that the NB is shipped with a fueled core, is operated continuously for several years, and then is shipped back to a central facility for refueling and servicing. There is no refueling at the site, but there can be short maintenance outages with an associated loss of generation (accounted for by the capacity factor). This model of deployment, operations and service affects some aspects of the economic analysis that we are about to describe.
The levelized costs of electricity (LCOE) and heat (LCOH) for the NB are equal to the sum of the annualized capital costs, fuel costs and O&M costs divided by the total amount of electricity or heat generated in one year:
Since a nuclear reactor is a heat source, nuclear heat is always cheaper than nuclear electricity, i.e., LCOH < LCOE.
The baseline case assumptions used in the analysis are reported in
Table 3. The three cost components are next discussed one at a time. The cost calculations are performed using the MATLAB script reported in the
Appendix A. Development and regulatory costs are not considered in this analysis.
4.1. Fuel Costs
Since the core power, the discharge burnup, the refueling interval and the capacity factor are fixed, the mass of fuel in the core is also immediately found.
The amount of natural uranium feed and the SWU required per kg of fuel in the core are calculated from the known fuel enrichment (5%), and assuming 0.22% enrichment for the uranium tailings.
The baseline NB is assumed to use uranium dioxide fuel, at twice the fabrication cost compared to a LWR fuel assembly because of the likely differences in pellet dimensions, cladding material and fuel assembly design adopted in the NB.
The costs of natural uranium, uranium conversion, enrichment and fuel fabrication are summed up and levelized over the refueling interval. Since all these fuel costs are incurred at the start of an irradiation cycle, there are carrying charges that must be accounted for using a capital recovery factor at the assumed discount rate.
The cost of spent fuel disposal is assumed to be 1 USD/MWh, consistent with U.S. practice.
4.2. O&M Costs
Given the simplicity of the NB design and the adoption of dry cooling, we do not anticipate major materials costs associated with operations of the NB. Therefore, the O&M costs primarily include the labor charges for staff required to operate, inspect and service the NB and to provide a proper level of security at the site. These charges are very uncertain at the moment; for example, it is unclear whether onsite operators are required at all, or autonomous operation with remote control may be feasible. It is also unclear whether adequate security can be maintained with physical protection and remote surveillance alone or if onsite armed guards will be required. In the base case we assume the total size of the NB staff to be 5 FTEs, effectively equivalent to one person on site 24/7. The fully loaded cost of each FTE is 150 kUSD/year. Note that fairly large and complex NG-fired power plants power plants are now being commissioned to operate with no onsite operators [
18].
Other O&M fixed costs include NRC operating fees, NRC inspections, insurance premiums and property taxes. Using the MIT research reactor as an analogue, we conservatively estimate such costs to be about 0.5 M USD/year.
4.3. Capital Costs
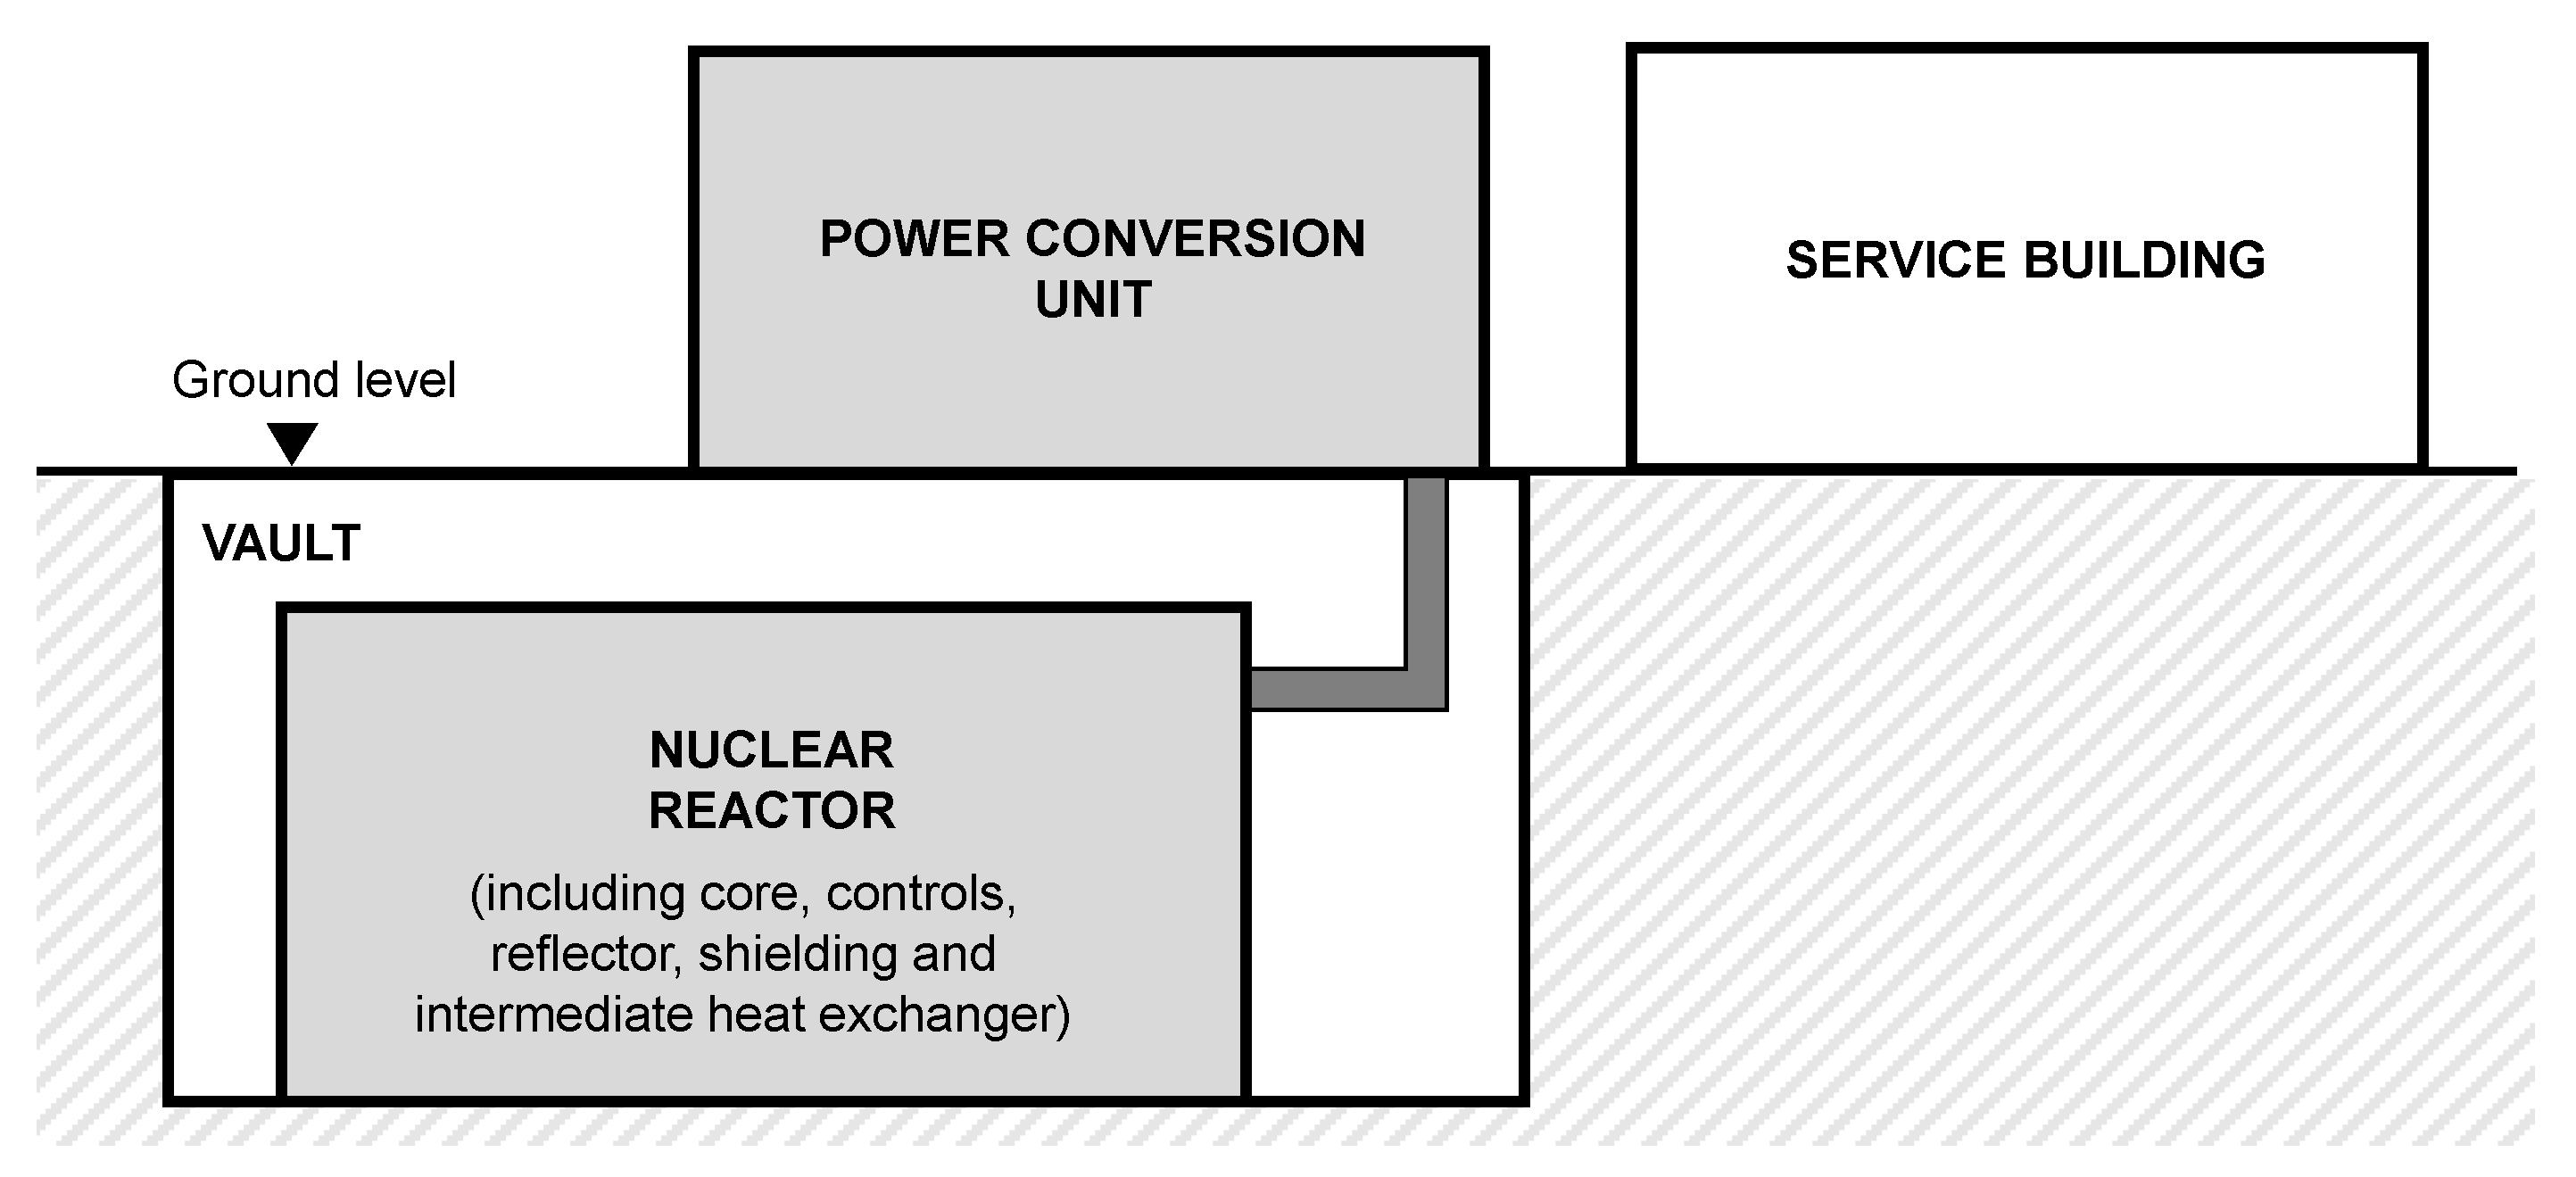
This category includes site preparation, equipment fabrication, transportation, installation and decommissioning costs. To facilitate the description of these costs, we make use of the terminology shown in
Figure 7.
The NB site will require minimal preparation, in part because the NB will be designed with inherent features (e.g., dry cooling, seismic robustness) to fit a large set of sites without modification. We envision excavation of a rectangular hole in the ground for a prefabricated steel/concrete vault, which will accommodate the nuclear reactor. Above grade there is a small flat area for the power conversion unit, permanent plant equipment (all delivered on their individual skids) and a small, prefabricated service building for security and staffing which will also serve as office and storage area for documentation, tools and materials required to perform minor maintenance on the NB. Depending on the nature and location of the site, a dedicated fence around the plant may be required.
The fabrication cost of the NB, including its power conversion unit (but excluding the fuel), is highly uncertain. At this stage of NB maturity, there are multiple designs being considered for development. Each will have differing core designs, power conversion units, market focus and operational considerations. To evaluate the potential costs of the NB, we choose a baseline design concept employing a solid core with heat pipes and an air-breathing Brayton power conversion unit.
For guidance on process and to assure the reasonableness of our cost projections, we rely on the Standard Classification for Cost Estimate Classification System, ASTM E-2516 classifications and guidance for methodology and definitions. Based on the design maturity, the estimating process used is the “Analogy” method for this Class 5 or concept screening estimating effort. However, the analogy method is problematic in estimating the micro-reactor costs because there is limited data upon which to define and leverage any analogy. The closest analogue is probably a large jet engine, GE-90, which is a delicate and complex machine generating about 80 MW peak mechanical power at takeoff, which costs 28 M USD or 350 USD/kW. While the GE-90 engine is larger and more powerful than our NB, as engines become smaller and less powerful, cost per MW increases. We therefore use 500 USD/kW as a conservative analogy.
To develop our cost projections, we leverage actual costs of a GE-90 jet engine with adjustments, or estimates, to account for differences between the analogue of the baseline and any unique systems. While a large jet engine such as the GE-90 engine powering the Boeing 777 is different in almost every way from our NB, its manufacturing system complexities, tolerances and demands are extensive and pertinent to the NB.
We do anticipate that the assembly, testing and materials for jet engines are consistent with the manufacturing requirements anticipated for a NB. The turbine rotating components are different from a NB, meaning that the tolerances, assembly requirements, internal temperatures and instrumentation provide a valid comparison if and only if components such as pressure vessels, heat exchangers, shielding, heat pipes, moderators and coolants are separately estimated. Our estimates make allowances for those unique features.
The expectation is that such a micro-reactor could benefit greatly from high-volume fabrication in factories, however that has not been demonstrated in a nuclear manufacturing environment. To achieve the production rates upon which our fabrication cost estimates are founded, we rely on knowledgeable fabricators and a mature supply chain. There remain risks in the fabrication and supply chain based on the current state of the nuclear industry resulting from the cost and schedule overruns experienced by recent large-scale reactor projects in the US. However, the basic concept of the NB minimizes those risks by maximizing the commercial-grade content of the equipment, and fully leveraging factory manufacturing, learning and automation. With development, we believe that efficiencies comparable to other industries can be realized. The unique features of our NB estimates are based on preliminary design information, vendor quotes and recognized estimating standards where applicable.
The nuclear reactor will be delivered to the site in one piece and lowered into the vault. The cost of transportation for the reactor, the vault, the power conversion unit and the service building will depend on their weight and means of access to the site (road, rail, jetty, etc.). Once the fuel is exhausted, the reactor will be lifted from the vault and shipped back to a central facility for refueling. The cost of the return shipment will be higher than the initial delivery because of the presence of spent fuel. Technically, this shipment should be an entirely straightforward activity. Since 1971 there have been at least 25,000 cargoes of used fuel transported, covering many millions of kilometers on both land and sea, including sea voyages transporting more than 4000 casks, each of about 100 tons. In the U.S. there have been over 3000 shipments of commercially generated spent nuclear fuel without causing any radiological releases to the environment or harm to the public [
19].
Table 4 provides the summary detail for our capital cost projections. Our estimates include appropriate contingencies for each of the cost categories based on the granularity of estimate available to us at this stage of NB maturity. Those contingencies vary from 10% on components that have current quotes or estimates to 40% for those that have only limited design detail. Excluding development and regulatory design/approval costs and FOAK costs, we arrive at a prediction of roughly 30 M USD for NOAK capital costs and carry 3000 USD/kW (10 MWe NB) for our base case LCOE and LCOH calculations.
Some of the above capital costs are incurred only once (e.g., the fabrication costs, the site preparation, the vault, the service building, etc.), while others are incurred in each irradiation cycle (e.g., ship the reactor to/from the site). For simplicity, we roll them all up into a single initial cost (once again, 30 M USD per NB in the base case), and level it over the 20-year economic life of the NB using the appropriate capital recovery factor. The cost of decommissioning is assumed to be half of the initial capital cost and is incurred at the end of the NB lifetime, so it is levelized using a sinking fund factor.
5. Results
For the baseline case assumptions in
Table 3, the LCOE and LCOH are 85 USD/MWh and 30 USD/MWh (or 8.7 USD/MMBTU), respectively. This is encouraging because such figures are well within the acceptable cost ranges discussed in
Section 3. However, since the uncertainties in the many assumptions made are substantial, we must perform a sensitivity analysis. Therefore, eight input parameters are varied (one at a time) within the following broad intervals:
Electric power: 1 to 20 MW
Fuel enrichment: 5% to 20%
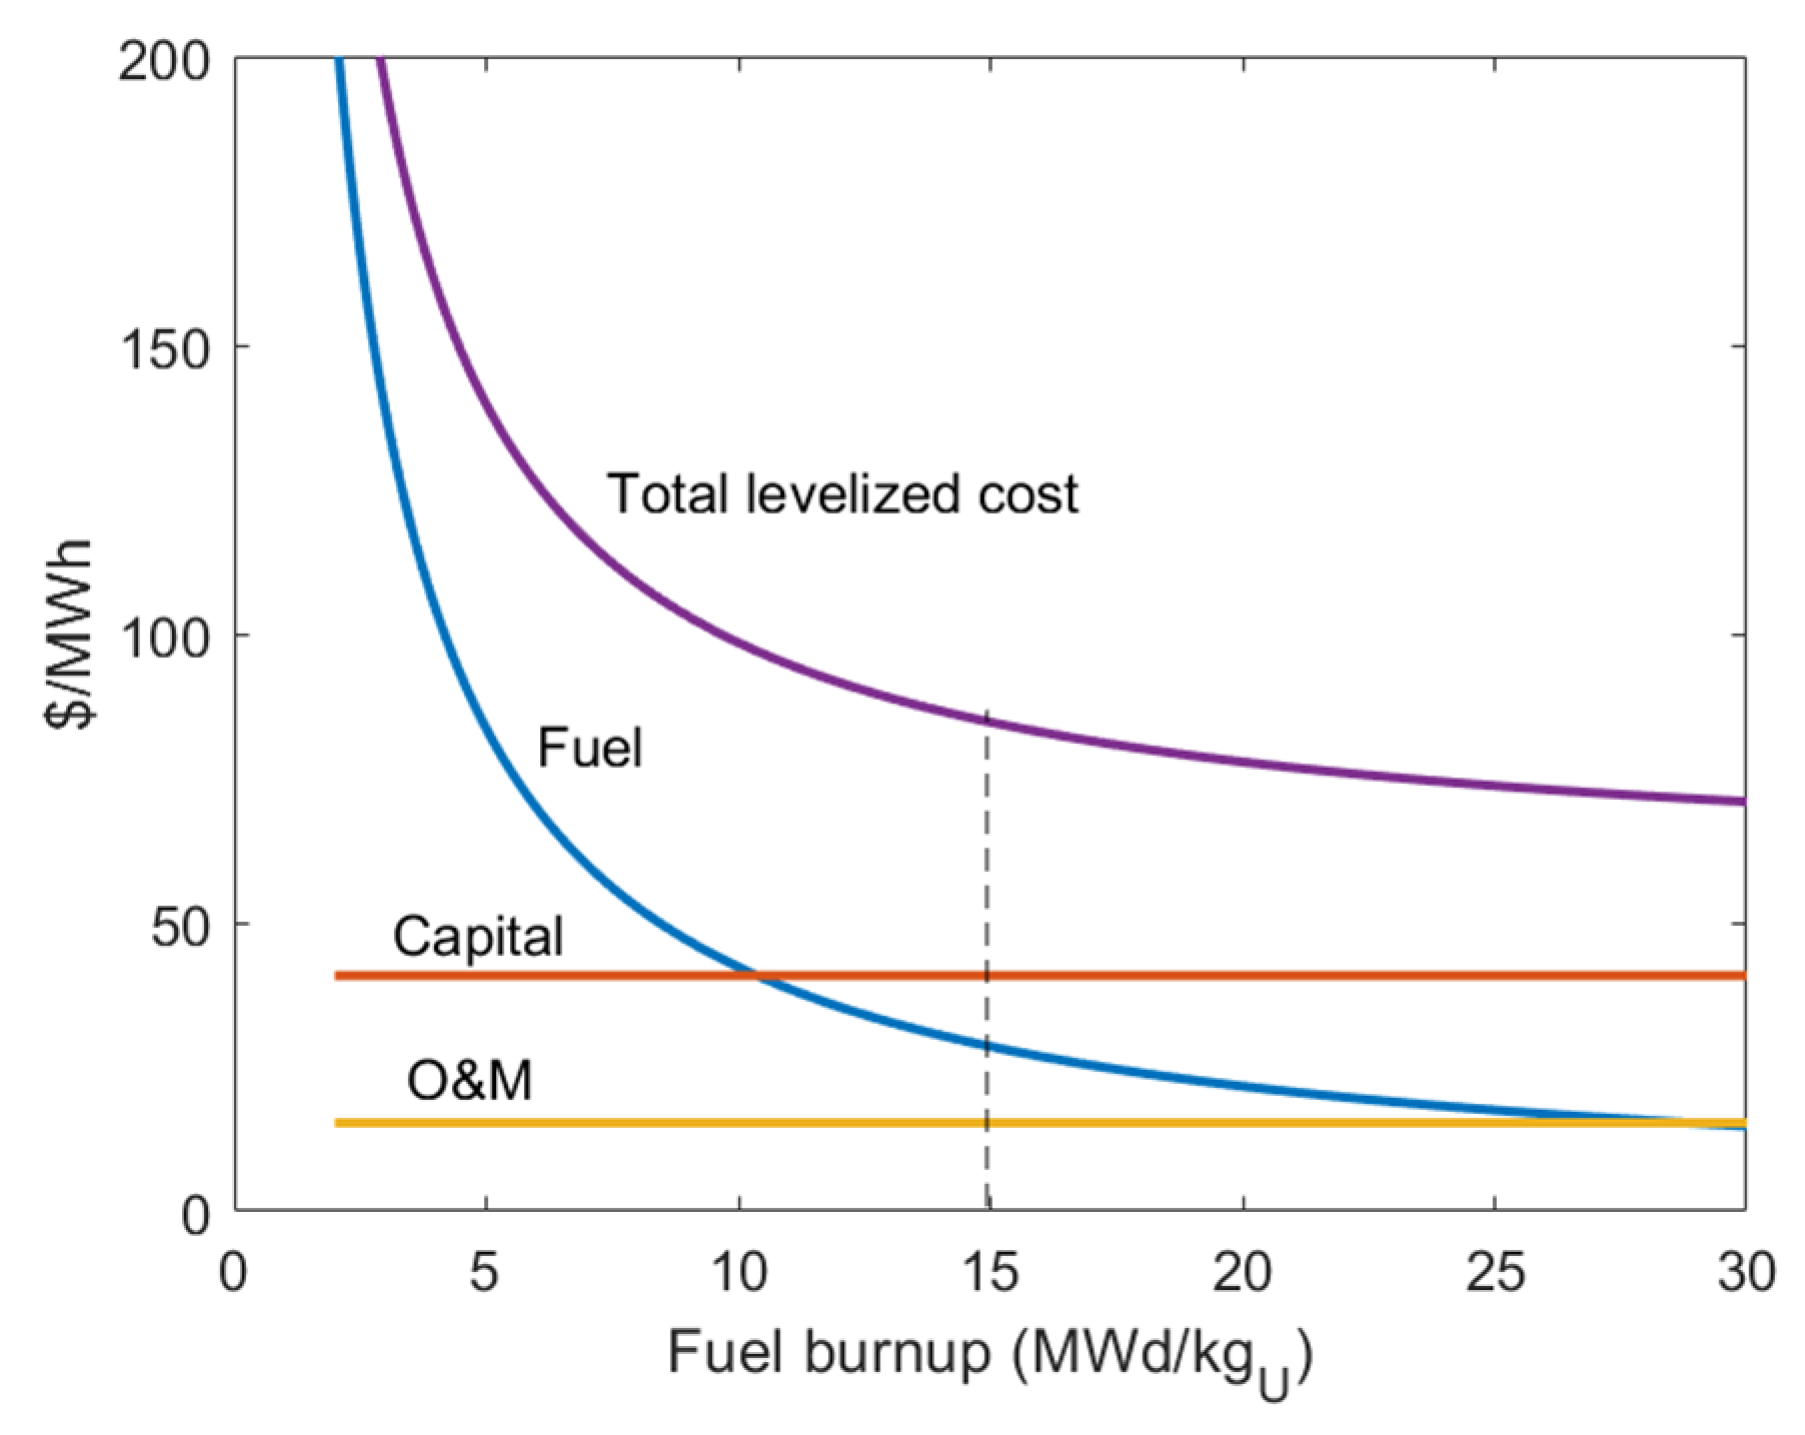
Discharge burnup: 2 to 30 MWd/kgU. Discharge burnup generally increases with enrichment, and the nature of that relationship depends strongly on the reactor design of interest. For simplicity here we treat the two quantities as independent to cover the full design space.
Refueling interval: 3 to 10 years
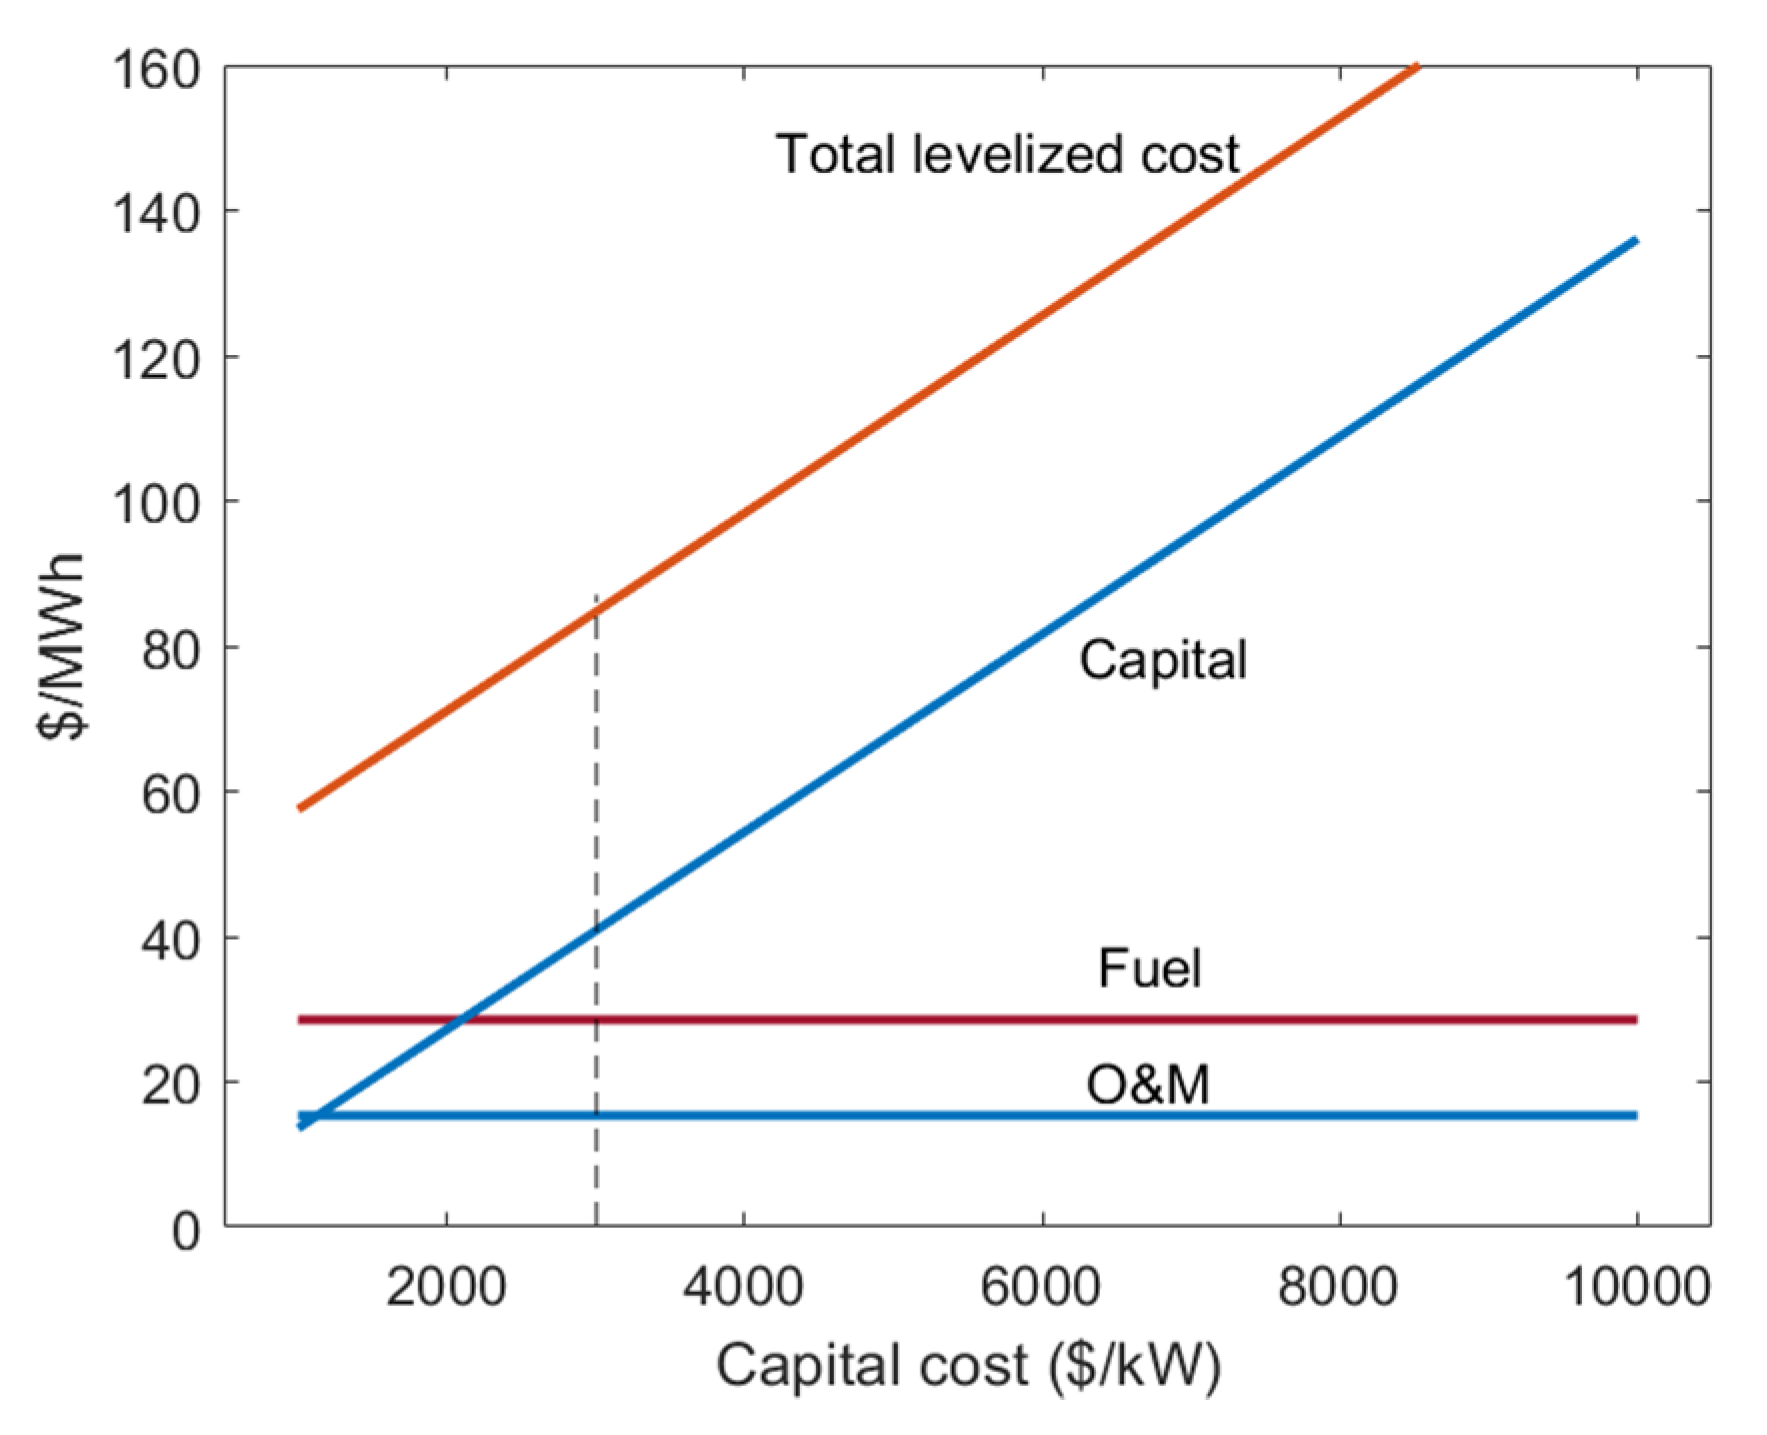
NB capital cost (excluding fuel): 1000 to 10,000 USD/kW
# of FTEs for O&M: 2 to 15
Discount rate: 2 to 15%/year
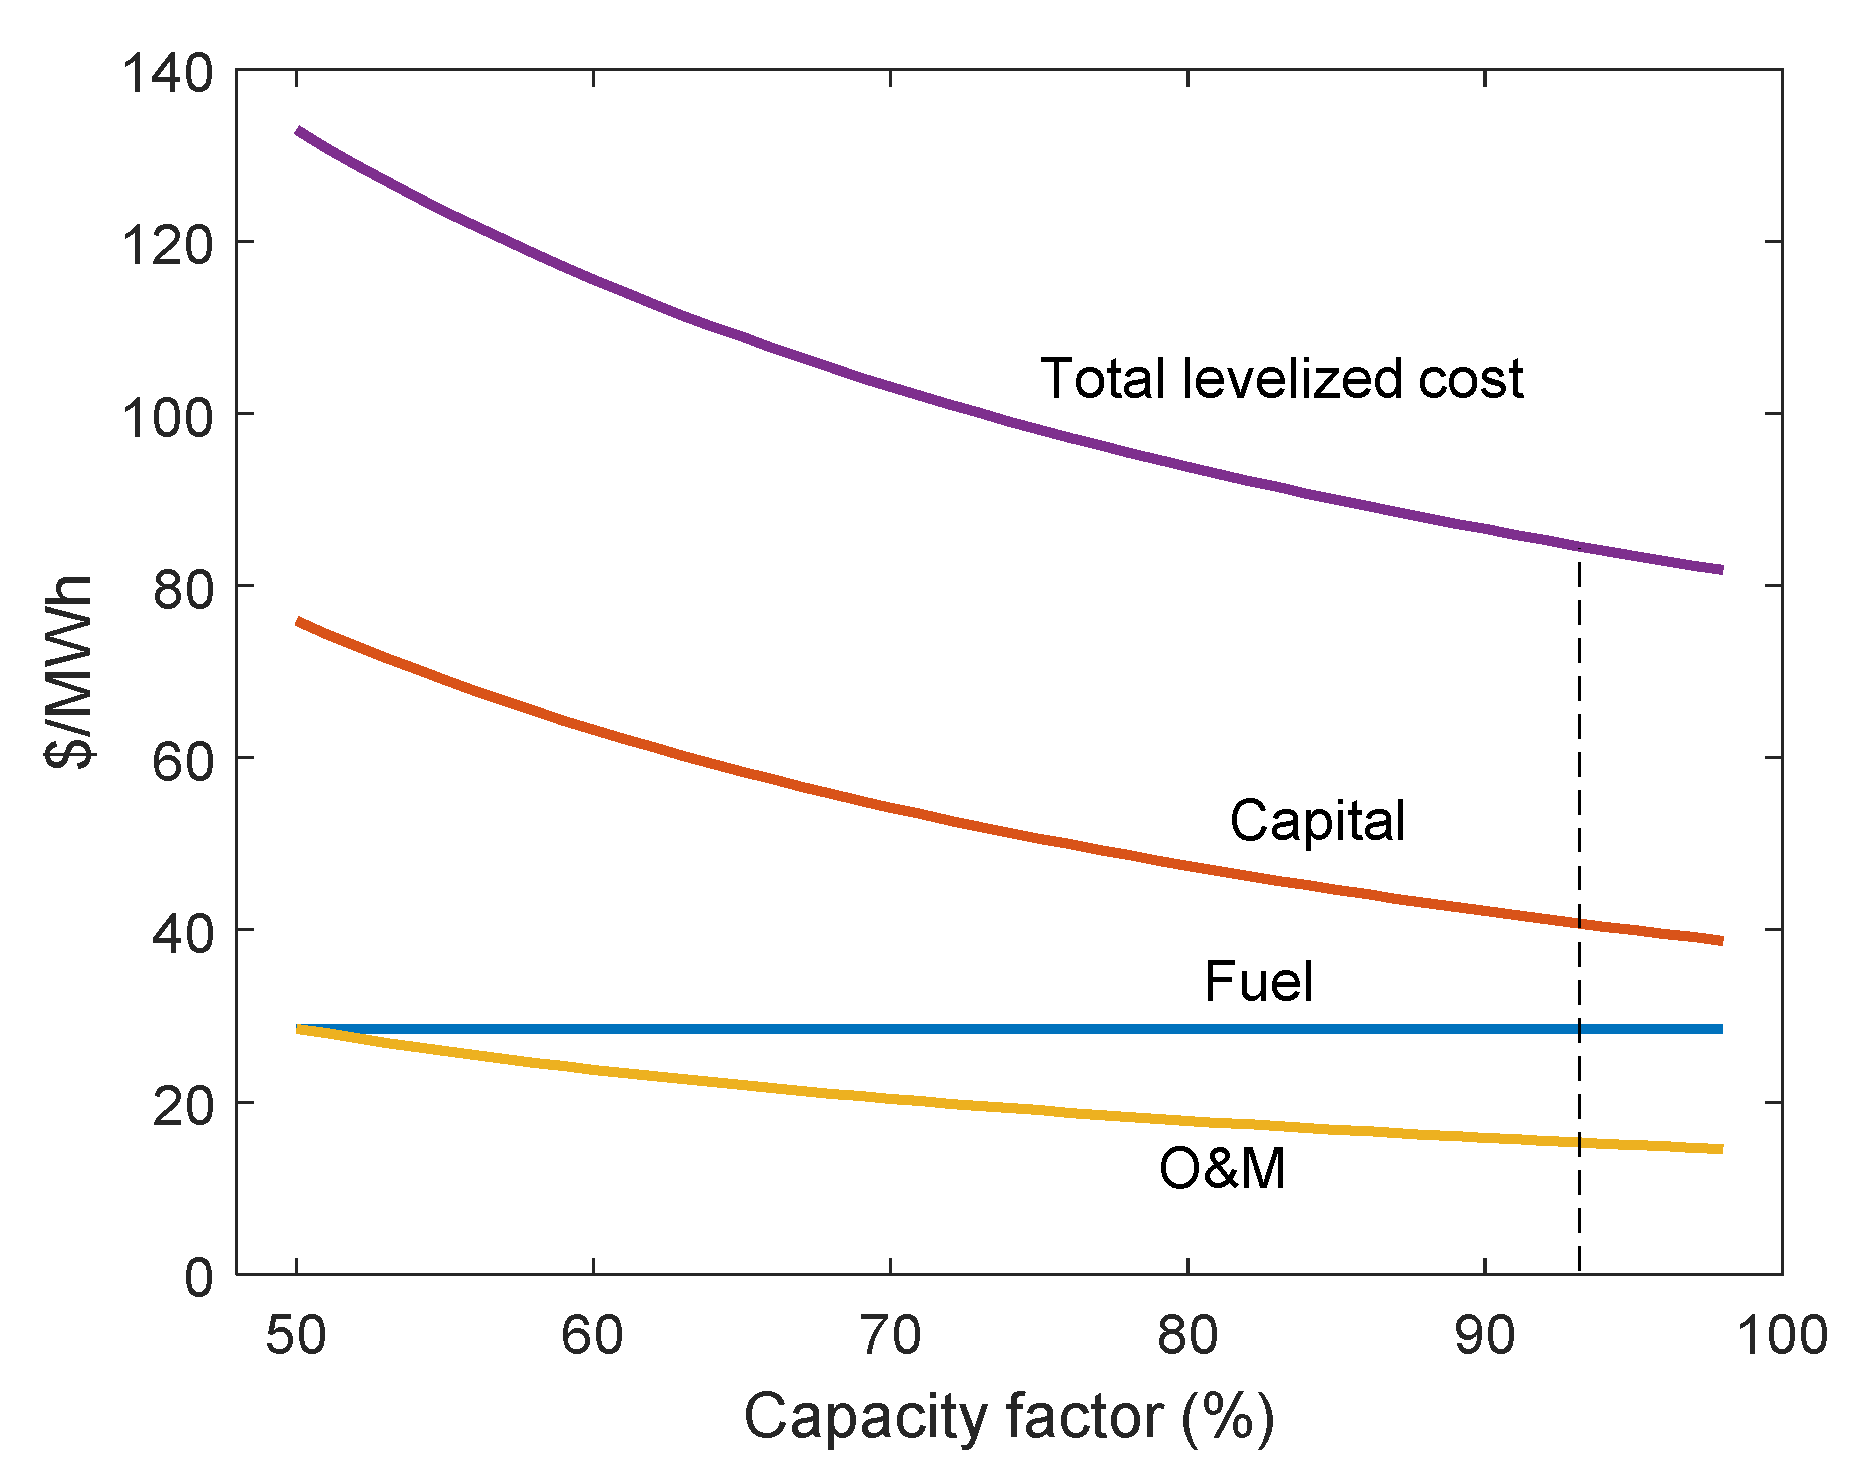
Capacity factor: 50% to 98%. The lower end of this range might be typical of a site that does not require heat and/or electricity 24/7.
The results for the LCOE are shown in
Figure 8,
Figure 9,
Figure 10,
Figure 11,
Figure 12,
Figure 13,
Figure 14 and
Figure 15. The results for LCOH are qualitatively identical because LCOH = LCOE × thermal efficiency. Briefly, the effect of electric power on LCOE is quite dramatic, whether the total capital cost is fixed (no scaling) or the unit cost is fixed (linear scaling), as shown in
Figure 8a,b, respectively. Maximizing the electric power is clearly beneficial to the NB economics.
The fuel cost tends to be relatively high in micro-reactors (e.g., relative to LWRs), and it increases substantially with increasing fuel enrichment and decreasing fuel burnup, as shown in
Figure 9 and
Figure 10, respectively.
Figure 11 suggests that long refueling intervals do not reduce cost, in fact they increase it slightly because of the interest paid on the fuel. Moreover, the mass of fuel in the core and therefore the core dimensions are inversely proportional to refueling interval, for given core power and discharge burnup, so it is likely that long refueling intervals will result in substantially larger and thus costlier reactors.
The cost of NB electricity increases strongly with increasing NB capital cost (
Figure 12), as expected, but to a lesser degree with increasing number of FTEs (
Figure 13).
Figure 14 shows that the discount rate strongly affects the capital costs and moderately the fuel costs. Lastly, the effect of capacity factor is shown in
Figure 15, confirming the importance of running the NB continuously and reliably for good economics.
We conclude the sensitivity analysis by noting that design choices matter when it comes to cost, and the cost of a small reactor can easily escalate to a level that will make it non-competitive in large markets. To illustrate this point, we calculated the LCOE of a notional micro-reactor design with economically unfavorable characteristics, i.e., low electric power (2 MW), high capital cost (7000 USD/kW), expensive fuel fabrication (10,000 USD/kg
U), relatively high enrichment (15%), intermediate burnup (50 MWd/kg
U), long refueling interval (20 years) and relatively high number of employees (15 FTEs, equivalent to three people onsite 24/7). The results are shown in
Figure 16: all three cost components are significantly higher, and the bottom line is an unattractive LCOE of nearly 335 USD/MWh vs. 85 USD/MWh for the baseline case. To be fair, microreactors can be competitive in certain niche markets even at >300 USD/MWh, but certainly not in the large markets this study is focused on.
6. Conclusions
If nuclear is to play a meaningful role in the decarbonization of the U.S. and global economy, its development and deployment paradigms have to evolve towards smaller, simpler, more flexible and affordable reactors. In this paper we focused on nuclear batteries, a new class of compact micro-reactors that are factory-fabricated, transportable, plug-and-play and operating autonomously. If they can be demonstrated and commercially deployed well within the end of the decade, as is currently planned, NBs appear to be ideally positioned to provide heat and electricity to myriad of energy users across all sectors of the economy. The NB success in these large markets will depend crucially on their economic competitiveness with alternatives. Here we determined the generic NB cost targets for the markets of interest to be 20–50 USD/MWht (6–15 USD/MMBTU) and 70–115 USD/MWhe for heat and electricity, respectively. Then we performed a bottom-up parametric analysis of the levelized cost of heat and electricity from NBs; this analysis suggests that the cost targets are within reach of the NBs if (i) the reactor power is maximized within the NB constraints (e.g., road transportability, passive decay heat removal), (ii) staff is in the 0.5–1.5 FTE/MW range, (iii) fuel enrichment is <10% and fuel burnup is >10 MWd/kgU, (iv) NB capital cost is <5000 USD/kW, and (v) discount rate is <10%/year. We found no cost incentive for very long refueling intervals (>10 years). Lastly, we showed that the cost of a small reactor can easily escalate if its design parameters are not consistent with the above guidelines.


