Article

Energy Consumption Analysis for Vehicle Production through a Material Flow Approach

by
Fernando Enzo Kenta Sato
1,2 and
Toshihiko Nakata
2,*
1
Cyclical Resource Promotion Division, Honda Motor Co., Ltd., Wako 351-0114, Japan
2
Department of Management Science and Technology, Graduate School of Engineering, Tohoku University, Sendai 980-8579, Japan
*
Author to whom correspondence should be addressed.
Energies 2020, 13(9), 2396; https://doi.org/10.3390/en13092396
Submission received: 10 April 2020 / Revised: 30 April 2020 / Accepted: 7 May 2020 / Published: 11 May 2020
(This article belongs to the Collection Energy Use Efficiency)

Abstract

:
The aim of this study is to comprehensively evaluate the energy consumption in the automotive industry, clarifying the effect of its productive processes. For this propose, the material flow of the vehicles has been elaborated, from mining to vehicle assembly. Initially, processes where each type of material was used, and the relationship between them, were clarified. Subsequently, material flow was elaborated, while considering materials input in each process. Consequently, the consumption of energy resources (i.e., oil, natural gas, coal, and electricity) was calculated. Open data were utilized, and the effects on the Japanese vehicle market were analyzed as a case study. Our results indicate that the energy that is required for vehicle production is 41.8 MJ/kg per vehicle, where mining and material production processes represent 68% of the total consumption. Moreover, 5.23 kg of raw materials and energy resources are required to produce 1 kg of vehicle. Finally, this study proposed values of energy consumption per mass of part produced, which can be used to facilitate future material and energy analysis for the automotive industry. Those values can be adopted and modified as necessary, allowing for possible changes in future premises to be incorporated.

1. Introduction

Climate change is considered to be one of the major social drawbacks of the last decades. To combat it, the Paris Agreement on climate change was established in December 2015, for which 195 nations have unified its environmental goals and agreed to maintain a global temperature increase well below 2 °C [1]. In this sense, different strategies and studies regarding the efficient use of energy are continuously conducted by governmental as well as private entities, demonstrating a global conscience and strong necessity to change the current high energy and resource consumption of society.
The transportation sector accounts for 25% of global energy consumption [2], and it is one of the most challenging sectors for fulfilling the proposed goals. Therefore, several studies centered on the fuel consumption of the vehicle have been conducted over the past few decades. New technologies, such as alternative propulsion methods (hybrid electric vehicles, battery electric vehicles, plug-in hybrid electric vehicles, and fuel cell vehicles) and lightweight materials, have also been developed.
A widely known method to assess the environmental effect of a vehicle is through its life cycle, and previous studies estimate that the production phase constitutes 7–22%, and the use phase 78–93%, of the energy consumption and CO2 emission of a vehicle’s life cycle [3,4], whereas the end-of-life vehicle (ELV) phase is considered to be almost negligible. Thus, improving the energy efficiency of the use phase of the vehicle was prioritized and the production and ELV phases have usually been considered less important. However, comprehensively understanding the environmental impact of the transportation sector is also indispensable for correctly evaluating the impact of both phases [5].
Nemry et al. [3] evaluated possible environmental advantages of the transportation sector in Europe, O’Reilly et al. [6] proposed a lightweigh optimization method, Sato et al. [5,7] evaluated the environmental impact of the ELV phase, Lane [8], and Vinoles-Cebolla et al. [9], Messagie et al. [10], and Yang et al [11] evaluated the environmental impact of electric vehicles, all using life-cycle assessment (LCA). However, even those studies included the effect of the production phase, basing its analysis on external energy consumption or CO2 emission constant coefficients; in some cases, even the precedence of the data used for the calculations were clarified. Those coefficients are usually presented as an approximation of the energy that is required to produce a vehicle part and defined per unit of mass of the material that composes it. However, they are usually close values and, in this sense, premises considered, the processes included in their calculation did not make the level of accuracy of the proposed values transparent [12,13,14,15]. It is worth mentioning that the International Organization for Standardization [16,17] specifies the necessity of clarifing the sytem boundary and also lists data-quality requirements to ensure the transparency of the LCA.
This study aims to comprehensively evaluate the energy consumption in the automotive industry, clarifying the effect of its productive processes. This study focuses on developing a process-by-process breakdown analysis and elaborates the material flow of vehicle production, from raw material mining to vehicle assembly. Moreover, the results obtained for energy and material consumption have been assessed per unit of produced vehicle as well as per mass of product. This approach is based on open data, and the effects on the Japanese vehicle market were analyzed as a case study.
The results presented in this study allow for a comprehensive understanding of the production phase of the vehicle and proposed values of energy consumption that can be used for upcoming vehicle life-cycle studies, contributing to the improvement of future vehicle production and recycling assessments. Moreover, those values can be adopted and modified, depending on necessity, allowing for possible changes in premises to be incorporated.

2. Methodology

Figure 1 shows the boundary of this study, where material and energy consumption from raw-material mining to vehicle assembly were considered. Moreover, this study considered the seven main materials (i.e., steel, iron, plastic, glass, rubber, aluminum, copper) that represent 85–96% of a vehicle’s mass in the analysis [4,18,19,20].
Initially, processes where each type of material used is clarified and material flow elaborated, considering materials, were input. Consequently, energy consumption by energy resource (i.e., oil, natural gas, coal) and electricity were calculated in each phase of the flow. Finally, the results were analyzed and compared for discussion to create an in-depth understanding of the industry.

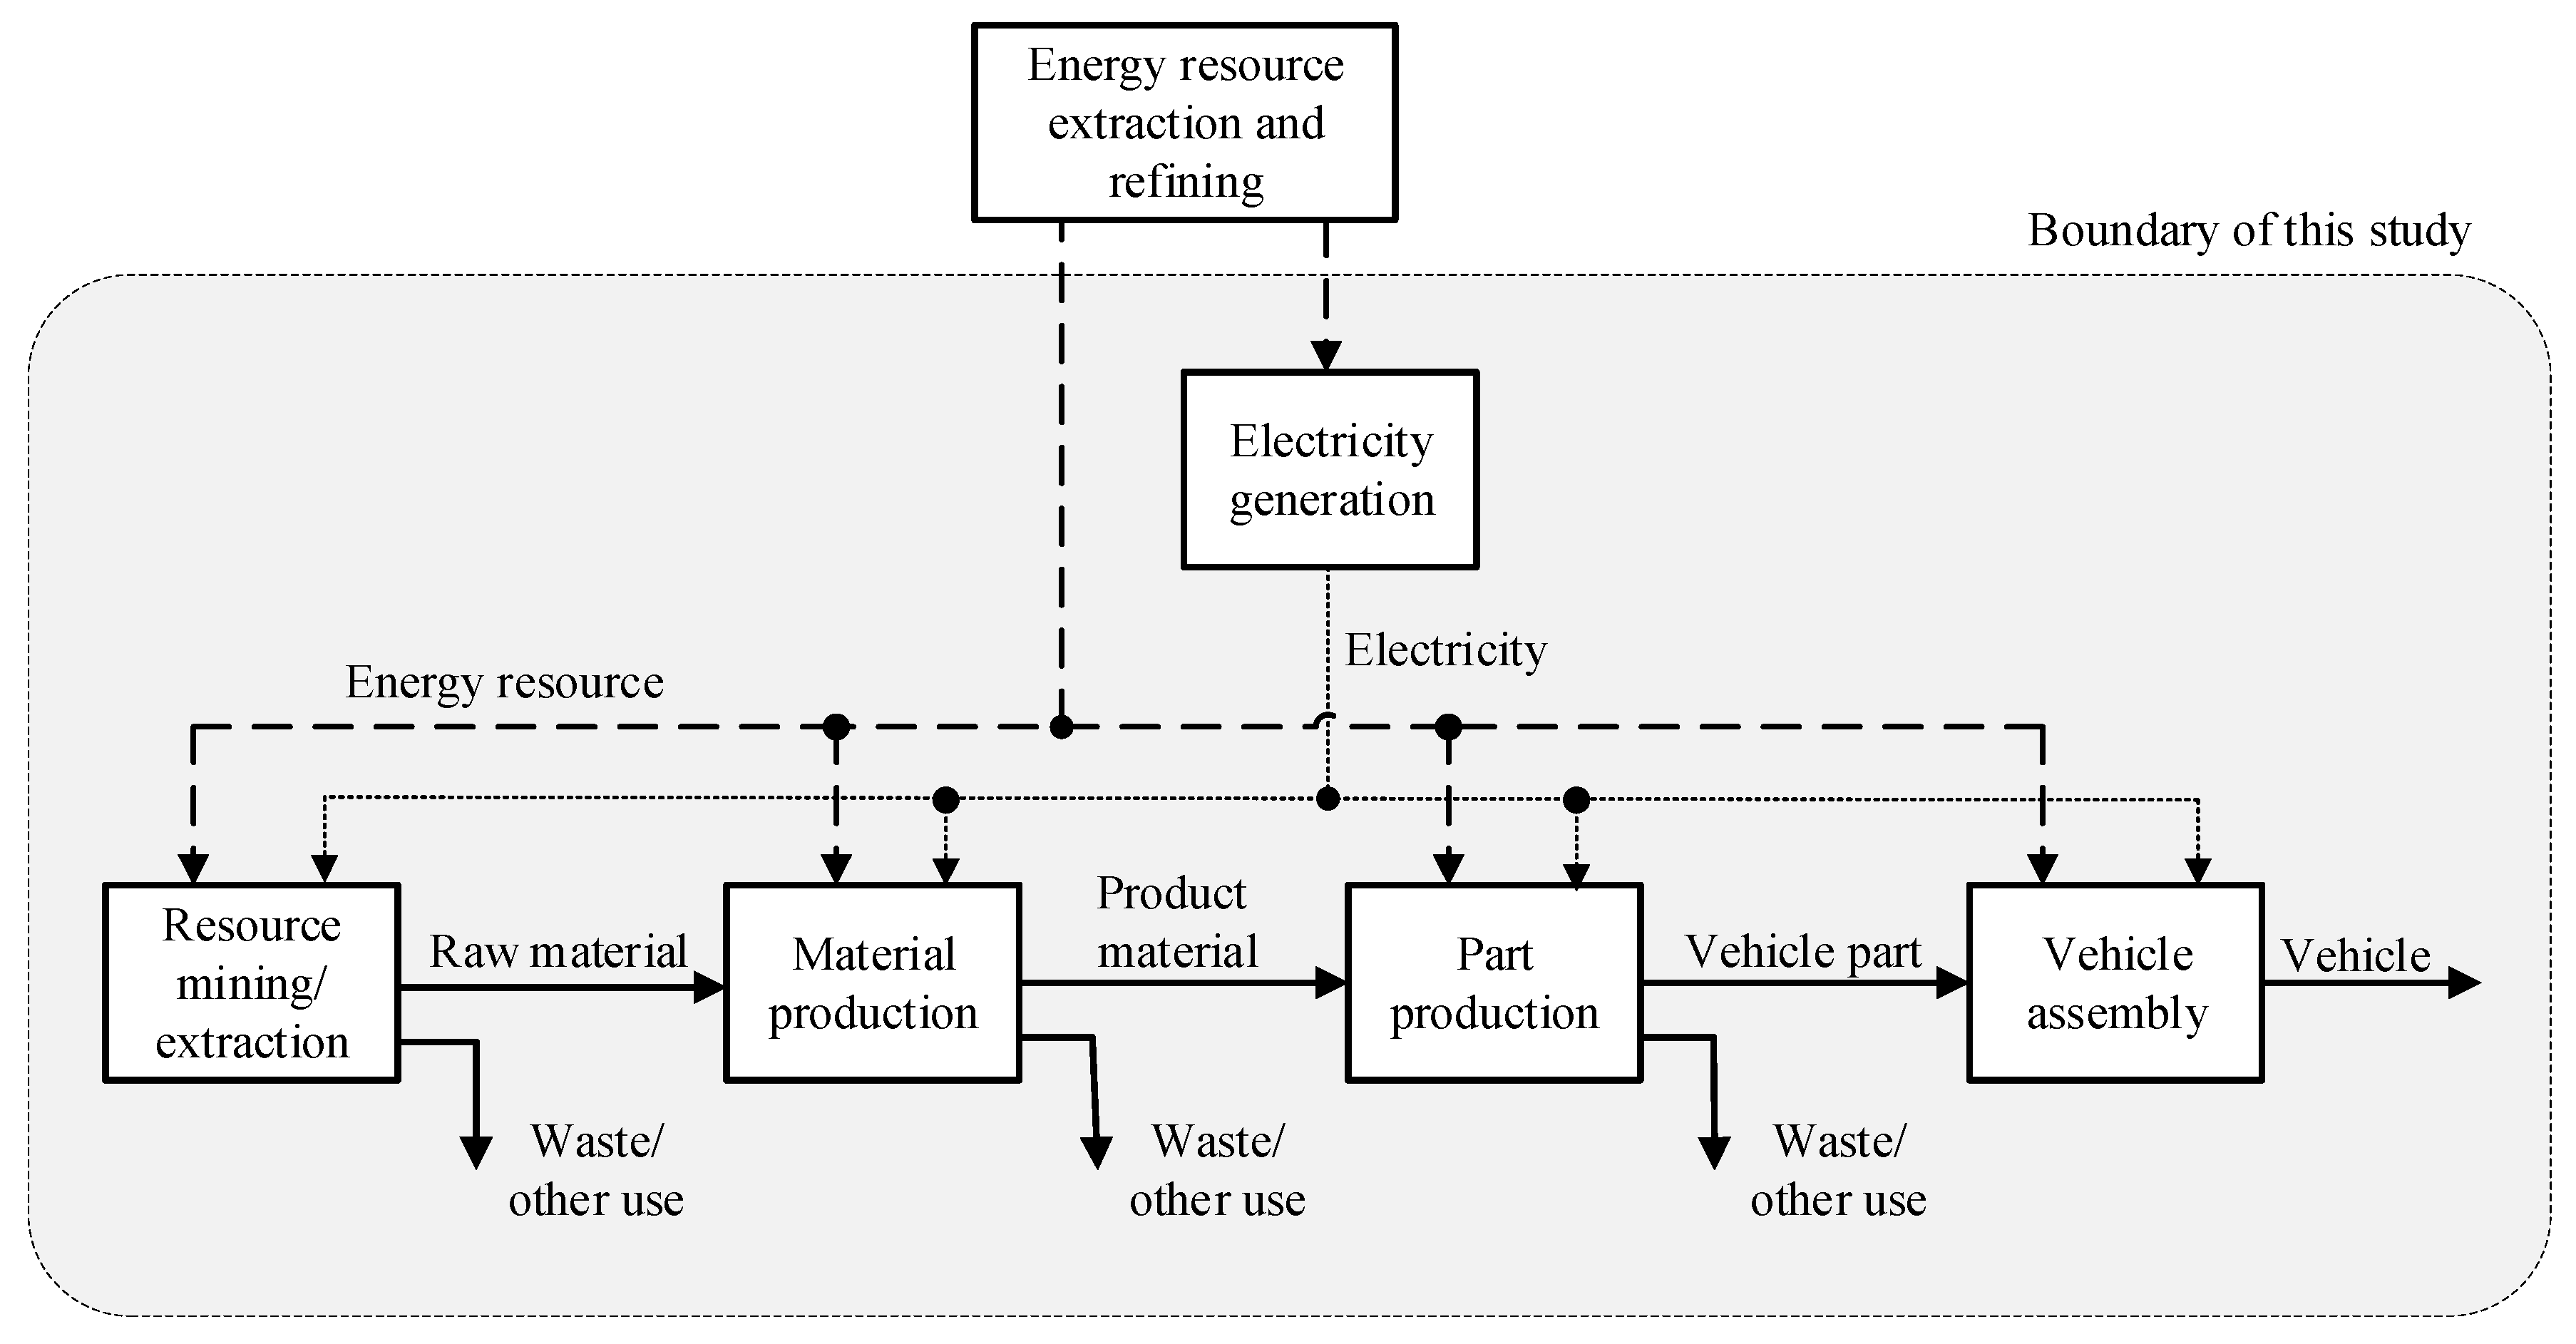
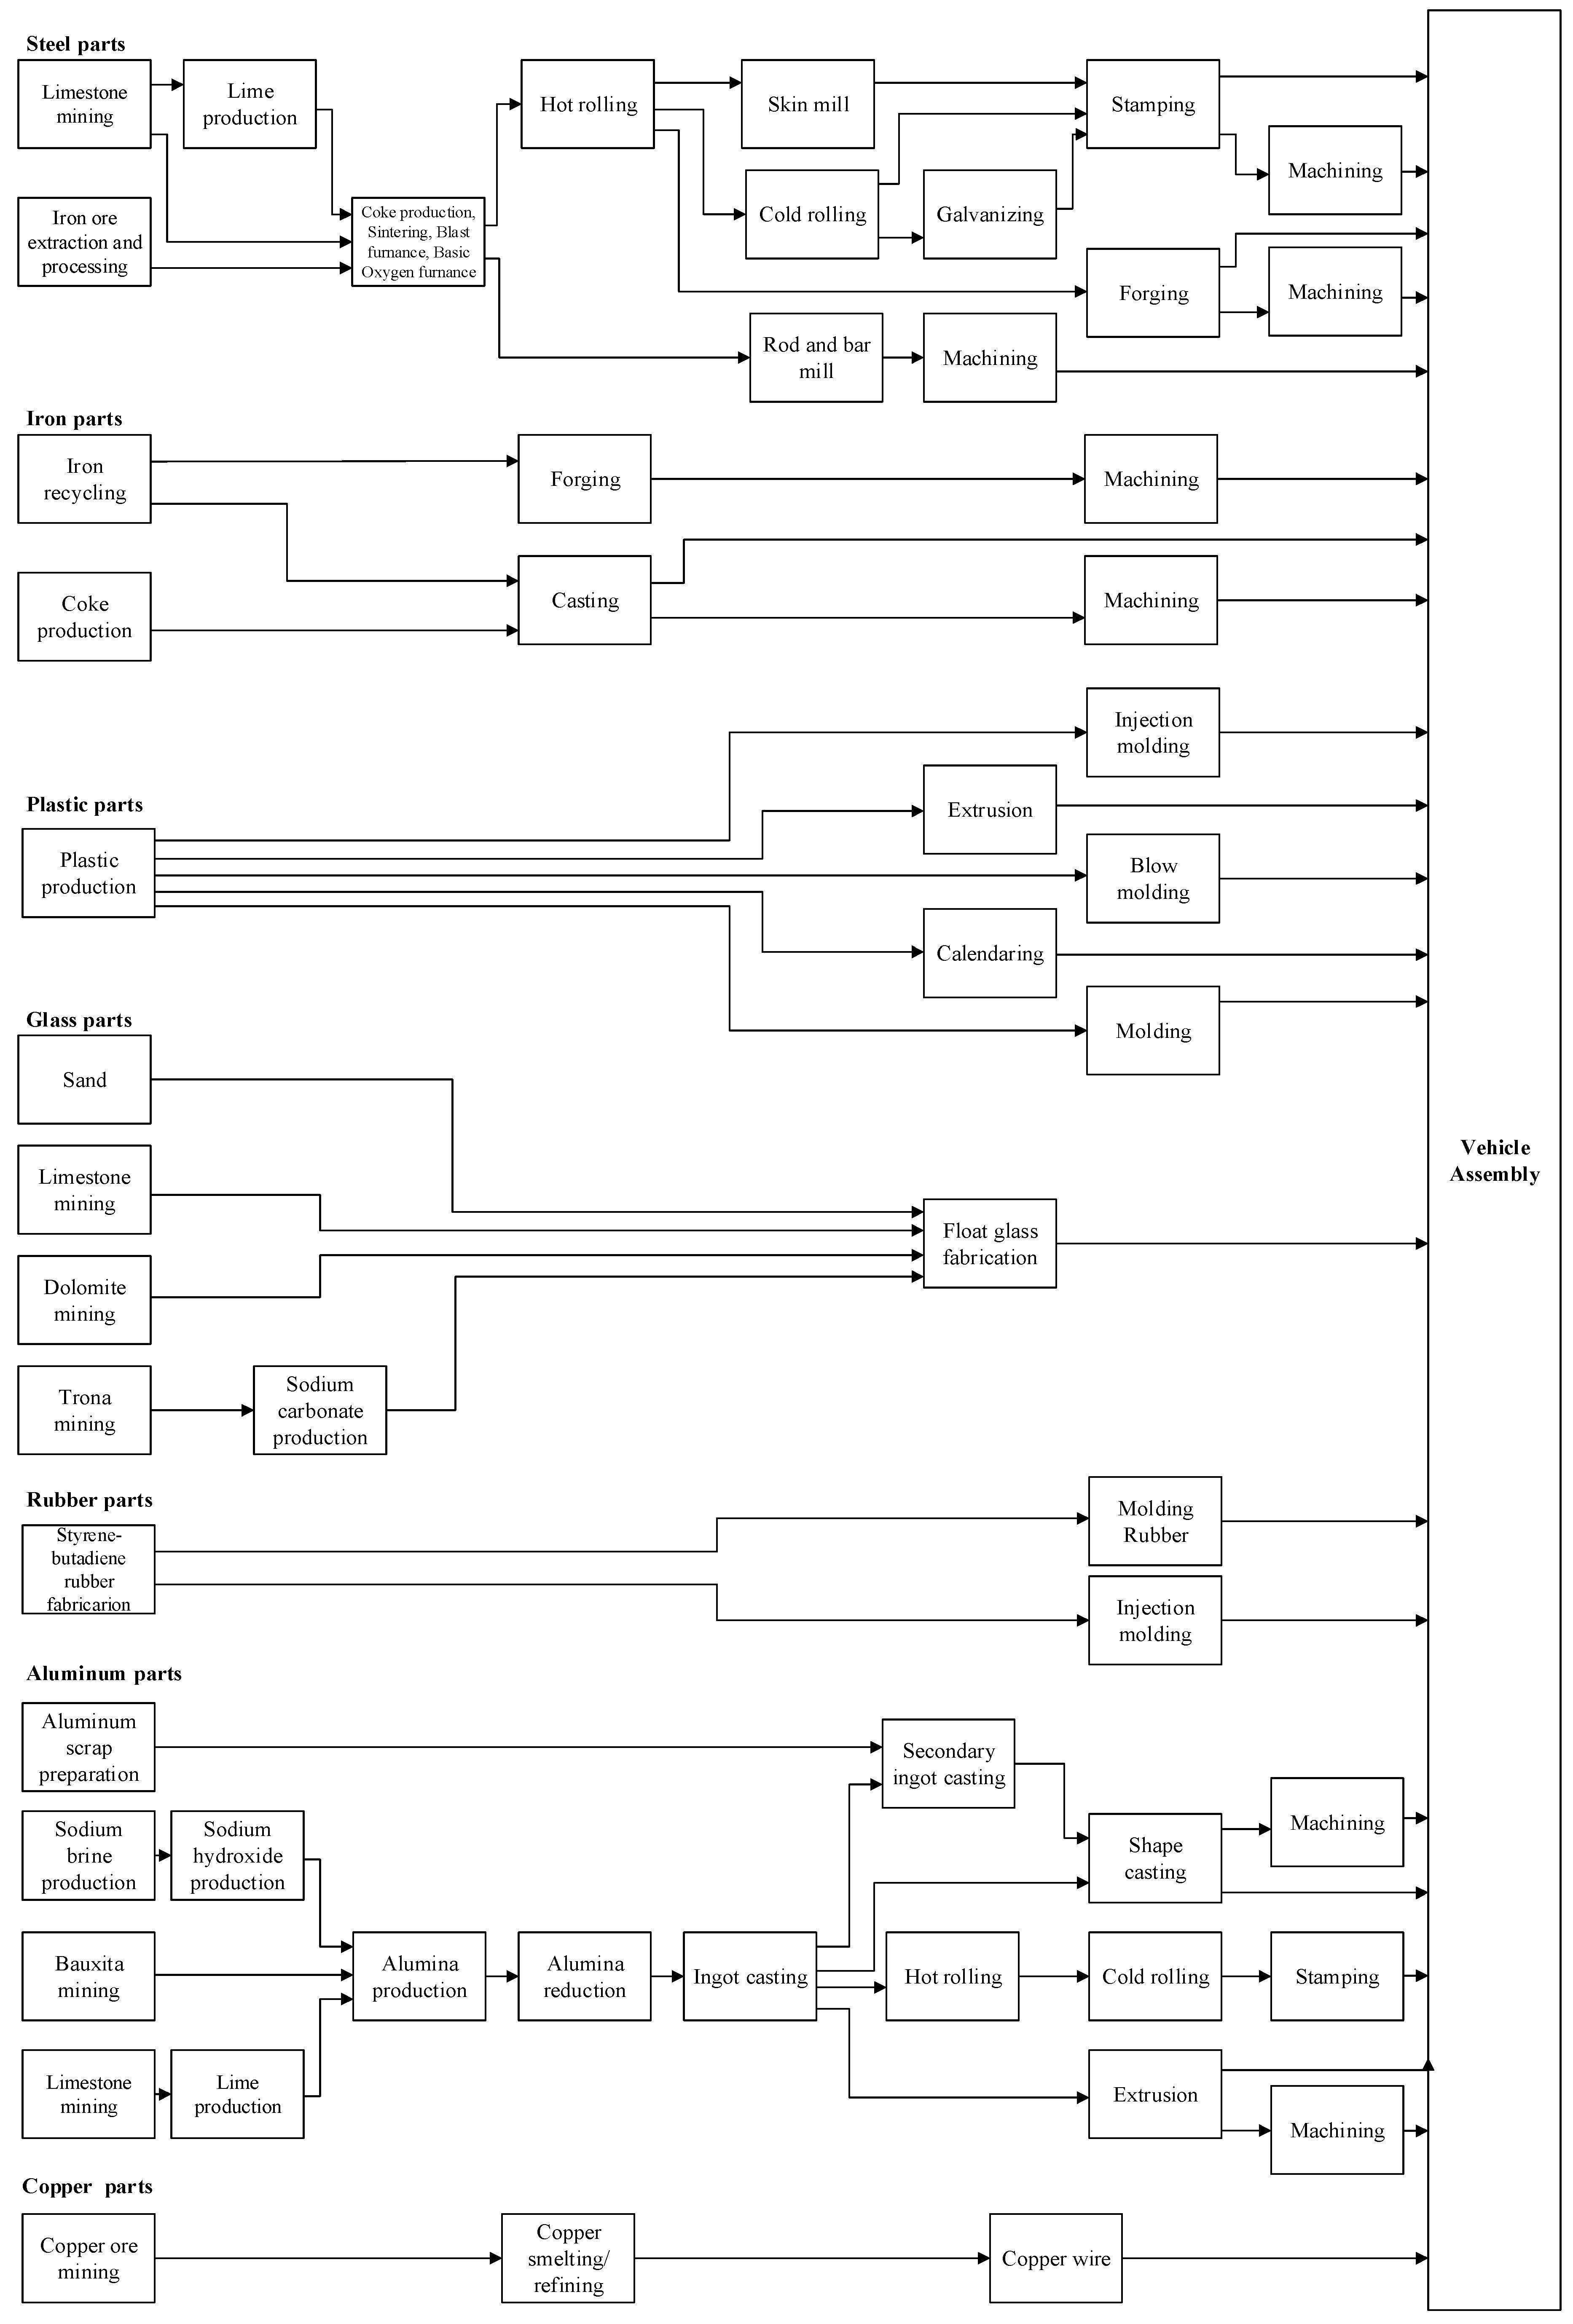
2.1. Material Flow Elaboration

Firstly, the part production processes were analyzed, and Figure 2 was elaborated based on previous studies [5,18,19] while considering the material composition of a generic vehicle (Honda Accord, Internal combustion engine vehicle, 2011 [18]). Here, the mass percent of the material composition of the vehicle and the principal part production process they are subjected are clarified. The mass of the vehicle parts made by determined processes can be calculated through Equation (1):
G m , i = G v e h * G R m * G R m , i ,  
where G m , i is the mass of vehicle parts made by material m and formed through productive process i, G v e h is the mass of the vehicle, adopted as 1481 kg [18], G R m is the mass ratio of material m of a vehicle, and G R m , i is the mass ratio of material m of a vehicle that is subjected to part production process i.
Moreover, the material that is consumed in each analyzed part of the production process is calculated through Equation (2):
G M C m , i = G m , i * M C m , i ,  
where G M C m , i is mass of material m consumed in productive process i,   M C m , i is the mass of material m consumed in production process i per mass of product (process output), as shown in Table 1.
It is worth mentioning that 6.2% of the stamped and 54.7% of the forged steel parts; 95.8% of the casted and 100% of the forged iron parts; and, 91.4% of the casted and 3.4% of the extruded aluminum parts were also subjected to a machining process [19].
Secondly, the material flow of the material production processes was analyzed. Figure 3 was elaborated based on Sullivan et al. [19], GREET Excel Model Platform [21], Greet 2018 Net software [22], Ophardt [23], and Keoleian et al. [24], Brunham et al. [25]. The left side of the figure indicates the upstream of the productive supply chain (mining), where its output (raw material) is subjected to material productive processes before entering part production processes and it is finally assembled as a part of a vehicle in the assembly plant. This flow is quantified when considering both equations proposed above and through the following ones. The materials used to produce parts could be supplied by different material production processes, as indicated by Equation (3). Moreover, different quantities of raw materials are required to produce each material, as indicated by Equation (4).
G M C m , i = j G M P m , j ,  
G M C n , j = G M P m , j * M C n , j ,  
where G M P m , j is mass of material m produced in productive process j,   G M C n , j is mass of material n consumed in productive process j, and M C n , j is the mass of material n consumed in productive process j per mass material produced (process output), as shown in Table 1.
In the same way, the flow is extended upstream to cover all of the productive processes of the materials. Pressed steel parts are produced by hot rolling, cold rolling, and galvanized steel sheets. The first one represents 21.1%, the second one 19.1%, and the last one 59.8% of the final product mass [21]. Moreover, casted aluminum and iron parts, such as engine blocks, engine/exhaust components, and brake rotors, were used for its production recycled material. Here, it is considered that 85% of casted aluminum parts and the total of casted iron parts contain recycled materials.
Finally, the material flow of the vehicle-assembly phase was elaborated, when considering that the body of each vehicle is produced through the welding and painting of pressed steel parts. Subsequently, the rest of the supplied parts were added to it in the line, before a final verification of the entire vehicle to ensure its quality and functionality.

2.2. Energy Consumption Analysis

The energy consumption for vehicle production was calculated while considering the product (output) of each productive process. Equation (5) represents the consumption in the part production processes, and Equation (6) represents types of consumption, from resource mining to material production.
E C P m , i = G m , i * e E C P e , i ,  
E C M n , j = G M P n , j * e E C M e , j ,  
where E C P m , i is the energy that is consumed in the part production process i to produce vehicle parts made by material m, E C M n , j is the energy consumed in the mining or material production process j to produce material n, E C P e , i is the energy resource or electricity e consumed in the part production process i per mass of part (process output) ,   E C M e , j is the energy resource or electricity e consumed in the mining or material production process j per mass of product (process output), as shown in Table 1.
The total energy consumption to produce a determinate part can be calculated as the sum of the energy that is consumed by each productive stage, from material mining to part production, as shown in Equation (7).
T E C P m , i = E C P m , i + j E C M n , j ,  
where T E C P m , i is the total energy consumed to produce parts made from material m and formed by productive process i.
Finally, the effect of the vehicle assembly plant was added, per unit of vehicle, based on energy consumption data of Sullivan et al. in order to calculate the total energy consumption required to produce a vehicle [19].

3. Results and Discussions

3.1. Results of the Energy and Material Consumption Analysis

Figure 4 shows the material flow for vehicle production elaborated in this study. Here, materials that are necessary for the production of vehicle parts, as well as energy consumed in its production processes, are represented. The mass of oil was considered to be 22.6 g/MJ, natural gas 27.5 g/MJ, and coal 34.4 g/MJ [26,27]. Moreover, the mass of the electricity was estimated as 56.2 g/MJ, when considering the Japanese grid mix, which is generated through oil (19.2%), natural gas (37.5%), coal (32.8%), and others (10.3%) [28]. The efficiency of the generation facilities was considered to be between 42% and 60%, depending on the energy resource utilized in transformation [28]. Plastics and rubbers were made by raw material that were derived from crude oil, and those feedstocks are also represented in the figure as energy resources.
The proposed flow emphasizes the necessity of a considerable amount of resources and material for the production of a vehicle. As raw material, copper ore is the most consumed, due to its low concentration of copper material, followed by iron ore and bauxite. On the other hand, energy resources are mostly consumed in the production of steel and aluminum parts. Figure 5 summarizes those values, where it can be observed that more than 7762 kg of raw material and energy resources is consumed in order to produce a vehicle of 1,481 kg. This means that 5.23 kg of resources are necessary to produce 1 kg of vehicle. Here, copper ore has the highest percentage values, with 2.29 kg of raw material per kg of vehicle (3391 kg per vehicle), followed by energy resources, with 1.46 kg of them being consumed per kg of vehicle (2165 kg per vehicle). The values presented in Figure 5 are also included in Figure 4, where the total raw material and energy resources on the left side of the figure are transformed in stages to a final vehicle on the right.
Figure 6 summarizes the results related to energy consumption. The total energy consumed to produce a vehicle was calculated as 62 GJ (41.8 MJ/kg of vehicle). Figure 6a shows that steel parts are the most representative, encompassing 35% of the total. Moreover, even copper parts consume a high quantity of raw material; due to the low concentration of copper on its ore, the energy that is required in its production processes is not as high as could be expected. It can be observed from Figure 6b that natural gas is the highest consumed energy resource in vehicle production, and Figure 6d shows that its consumption is almost equally distributed in aluminum, steel, and plastic parts production, as well as in vehicle assembly. Finally, Figure 6c shows that the energy that is consumed in the production phase of a vehicle is dominated by the mining and material production processes, which represent 68% of total consumption, followed by the part production processes, at 19%, and vehicle assembly, at 13%.
Figure 7 shows the energy consumption of each productive process of vehicle production. The figure is divided into mining-material production, part production, and vehicle assembly processes. It can be seen that 82% of the total coal is consumed in the steel production processes, 28% electricity in the alumina reduction process, and 26% natural gas in the plastic fabrication processes, showing a demand concentration of determinate resources in specific facilities.
Finally, the first chart of Figure 8 shows the energy that is required to produce each type of vehicle part per kg of material; those constants have generally been defined in previous studies as embodied energy [5,15]. The proposed energy consumption values could vary widely by part, despite being produced by the same material. More conspicuous are the parts that are made by steel, where the energy that is required to produce forged products doubles that needed to elaborate the stamped ones. Moreover, aluminum parts are the most energy-intensive parts. Figure 8 shows the energy that is required to produce each type of part per unit of vehicle. It can be seen that the stamped steel parts consume the major volume of energy (23%) necessary for the production of vehicles, followed by cast and machined aluminum products (13%).

3.2. Energy and Material Consumption for the Entire Japanese Market

Three representative aspects were considered to estimate the total energy consumption for the Japanese automotive industry: the average mass of a passenger car in Japan (1354 kg/vehicle) [29], the number of passenger cars produced annually in the country (9,729,594 vehicles) [30], and the energy that is required for the production of a vehicle (41.8 MJ/kg of vehicle) calculated in this study. It has been calculated, though the product of the above values, that the energy consumption that is related to the automotive industry is 0.55 EJ per year in Japan. Moreover, Figure 9a compares the obtained consumption values and the total energy consumption for different sectors. It can be seen that the energy consumption of the automotive industry represents 15% of the energy consumption of the Japanese industy. This also indicates that strategic decision- or policy-making through a comprehensive analysis of this phase could generate national-level energy benefits, emphasizing the importance of the approach that was proposed in this study. The energy consumption of the automotive industry is included in the “transportation equipment” sub-sector of industrial demand; however, in contrast to the values that are presented in this study, the material production processes are not included. In the referenced report [31], those values are distributed in the respective material production sub-sectors (i.e., material production processes of steel parts are included in the iron and steel sub-sector, material production processes of plastic parts are included in the chemistry sub-sector, etc.).
On the other hand, the materials and resources consumed in the industry were calculated as 69 million tons per year, representing more than 9.4% of the annual imported resources of Japan, as shown in Figure 9b.

3.3. Primary Assumptions and Limitations

Firstly, the energy required for energy resource extraction and refining, as well as the water consumption in each productive process, have not been included in this study. Water is usually consumed for refrigeration, and the internal reuse of it is a standard operation in the industry. Moreover, thermal energy has been considered to be an internal process of each facility, which is produced by the input energy resources that are listed in the study.
Secondly, this approach bases its calculation on internal combustion engine vehicles (ICEV), which represent more than 63% of vehicle sales in Japan. Moreover, hybrid vehicles represent 31% of the total sales. Future studies will extend this approach to electric vehicles (EV), which are even more energy-intensive products than our base scenario. On the other hand, the material composition of the vehicle varies depending on the model and the year of production. Thus, final energy and material consumption values per vehicle can vary moderately, but they are also actualized when considering the energy that is required per unit of mass, as shown in Figure 8.
Thirdly, even this approach estimated the total energy consumption of the automotive industry when considering the Japanese market as a case study; not all the productive processes are carried in domestic facilities. Nonetheless, the main conclusions of this study will not change.
Finally, our analysis was centered on the seven principal materials. Miscellaneous materials are expected to vary widely, depending on the analyzed vehicle model (i.e., leader in the case of high-spec vehicle seats, electric and audio equipment, wood in high-end vehicles, and others).

3.4. Comparison with Results of Previous Studies

In this section, simple comparisons with previous studies are proposed in order to evaluate the obtained energy consumption values. Our results were compared with the values calculated in previous life-cycle approaches that were conducted by Nemry et al. [3] and Schweimer et al. [33]. The first study is a report for the European Union, which analyzed the potential ways of reducing the life-cycle impact of the transportation sector in Europe. Here, the results of the material and part production processes were included, but the analysis was based on external data. The second study analyzed 1999-year Golf A4 vehicles, centering the analysis on the assembly phase. Here, inventory data of Volkswagen plants were analyzed in detail, including material and energy inputs. However, it did not expand, to the same degree, on the materials and part production processes.
A rough simulation of energy consumption in the use and ELV phase of the studied vehicle was proposed. The energy that is consumed in the use phase can be calculated when considering the fuel economy of the vehicle, as shown in Equation (8).
E U = F E * d * δ g a s * H H V g a s
where E U is energy consumed in the use phase, F E is fuel economy, e.g., of Honda Accord 2011, 9.046 l/100 km [34],   d is the total traveled distance, 100,000 km,   H H V g a s is the higher heating value of gasoline, 46.4 MJ/kg [35], and   δ g a s is the density of gasoline, 0.75 kg/l [35].
The energy that is consumed in the disposal process of the ELV is calculated while using Equation (9).
E E L V = E D * G v e h
where E E L V is energy consumed in the ELV disposal process and E D is disposal energy, 0.602 MJ/kg [36].
The first column of Table 2 shows the life-cycle values that were proposed in this study. The second and third columns compare the obtained results with previous approaches, demonstrating the compatibility between them. It is also worth mentioning that the energy consumption per mass of vehicle in the production phase is slightly lower when compared to previous studies. This can be explained by the fact that the decrease in energy consumption due to the use of recycled materials is included, and that the effects of miscellaneous materials and fluids are not included in our approach.

3.5. Application of the Results

This study presents a whole picture of the energy and material consumption of the automotive industry, allowing for automakers, part makers as well as researchers, and government bodies to comprehensively understand the production phase of the vehicle. Here, productive processes that have the highest effect in the industry can be identified. Efforts could focus on improving the efficiency of those energy-intensive facilities and processes to elevate the energy efficiency of the industry.
Energy-consumption results tha are obtained from this approach are divided into productive processes, but also per energy resources required for each of them. In this sense, future studies could focus on proposing optimal energy supply systems for the industry. The potential for changing the electricity consumed from the grid to renewable energy could be exploited to improve the environmental aspects of the sector.
This approach also allows researchers and the automotive industry to easily calculate the total energy impact of vehicle production, contributing to upcoming vehicle life-cycle studies and material and energy analysis of the automotive industry. When compared to constant embodied energy values proposed by previous studies, the values presented in this approach not only focus on the automotive industry but also clarify the material flow and processes that are considered in it. This allows for an easy recalculation and adjustment of the values, depending on the changes or differences in production technologies. Moreover, understanding the material flow of the industry enables new approaches for the industry, such as the environmental evaluation of closed-loop recycling, which can identify the process where recyclable material comes back for reprocessing.
Finally, evaluating the automotive industry through a material flow approach also allows one to assess the environmental impact of material required in mining and resource-extraction processes (i.e., the devastation of mining sites, disruption of natural habitats, groundwater contamination, and landscape changes at the extraction site [37]). Moreover, the proposed approach can be applied in risk-evaluation analysis of materials that are supplied to the automotive industry.

4. Conclusions

This study presents a whole picture of the automotive industry in terms of energy and material consumption, allowing for us to comprehensively understand the production phase of the vehicle. For this study, the material flow of the automotive industry has been elaborated. The main conclusions are listed below.
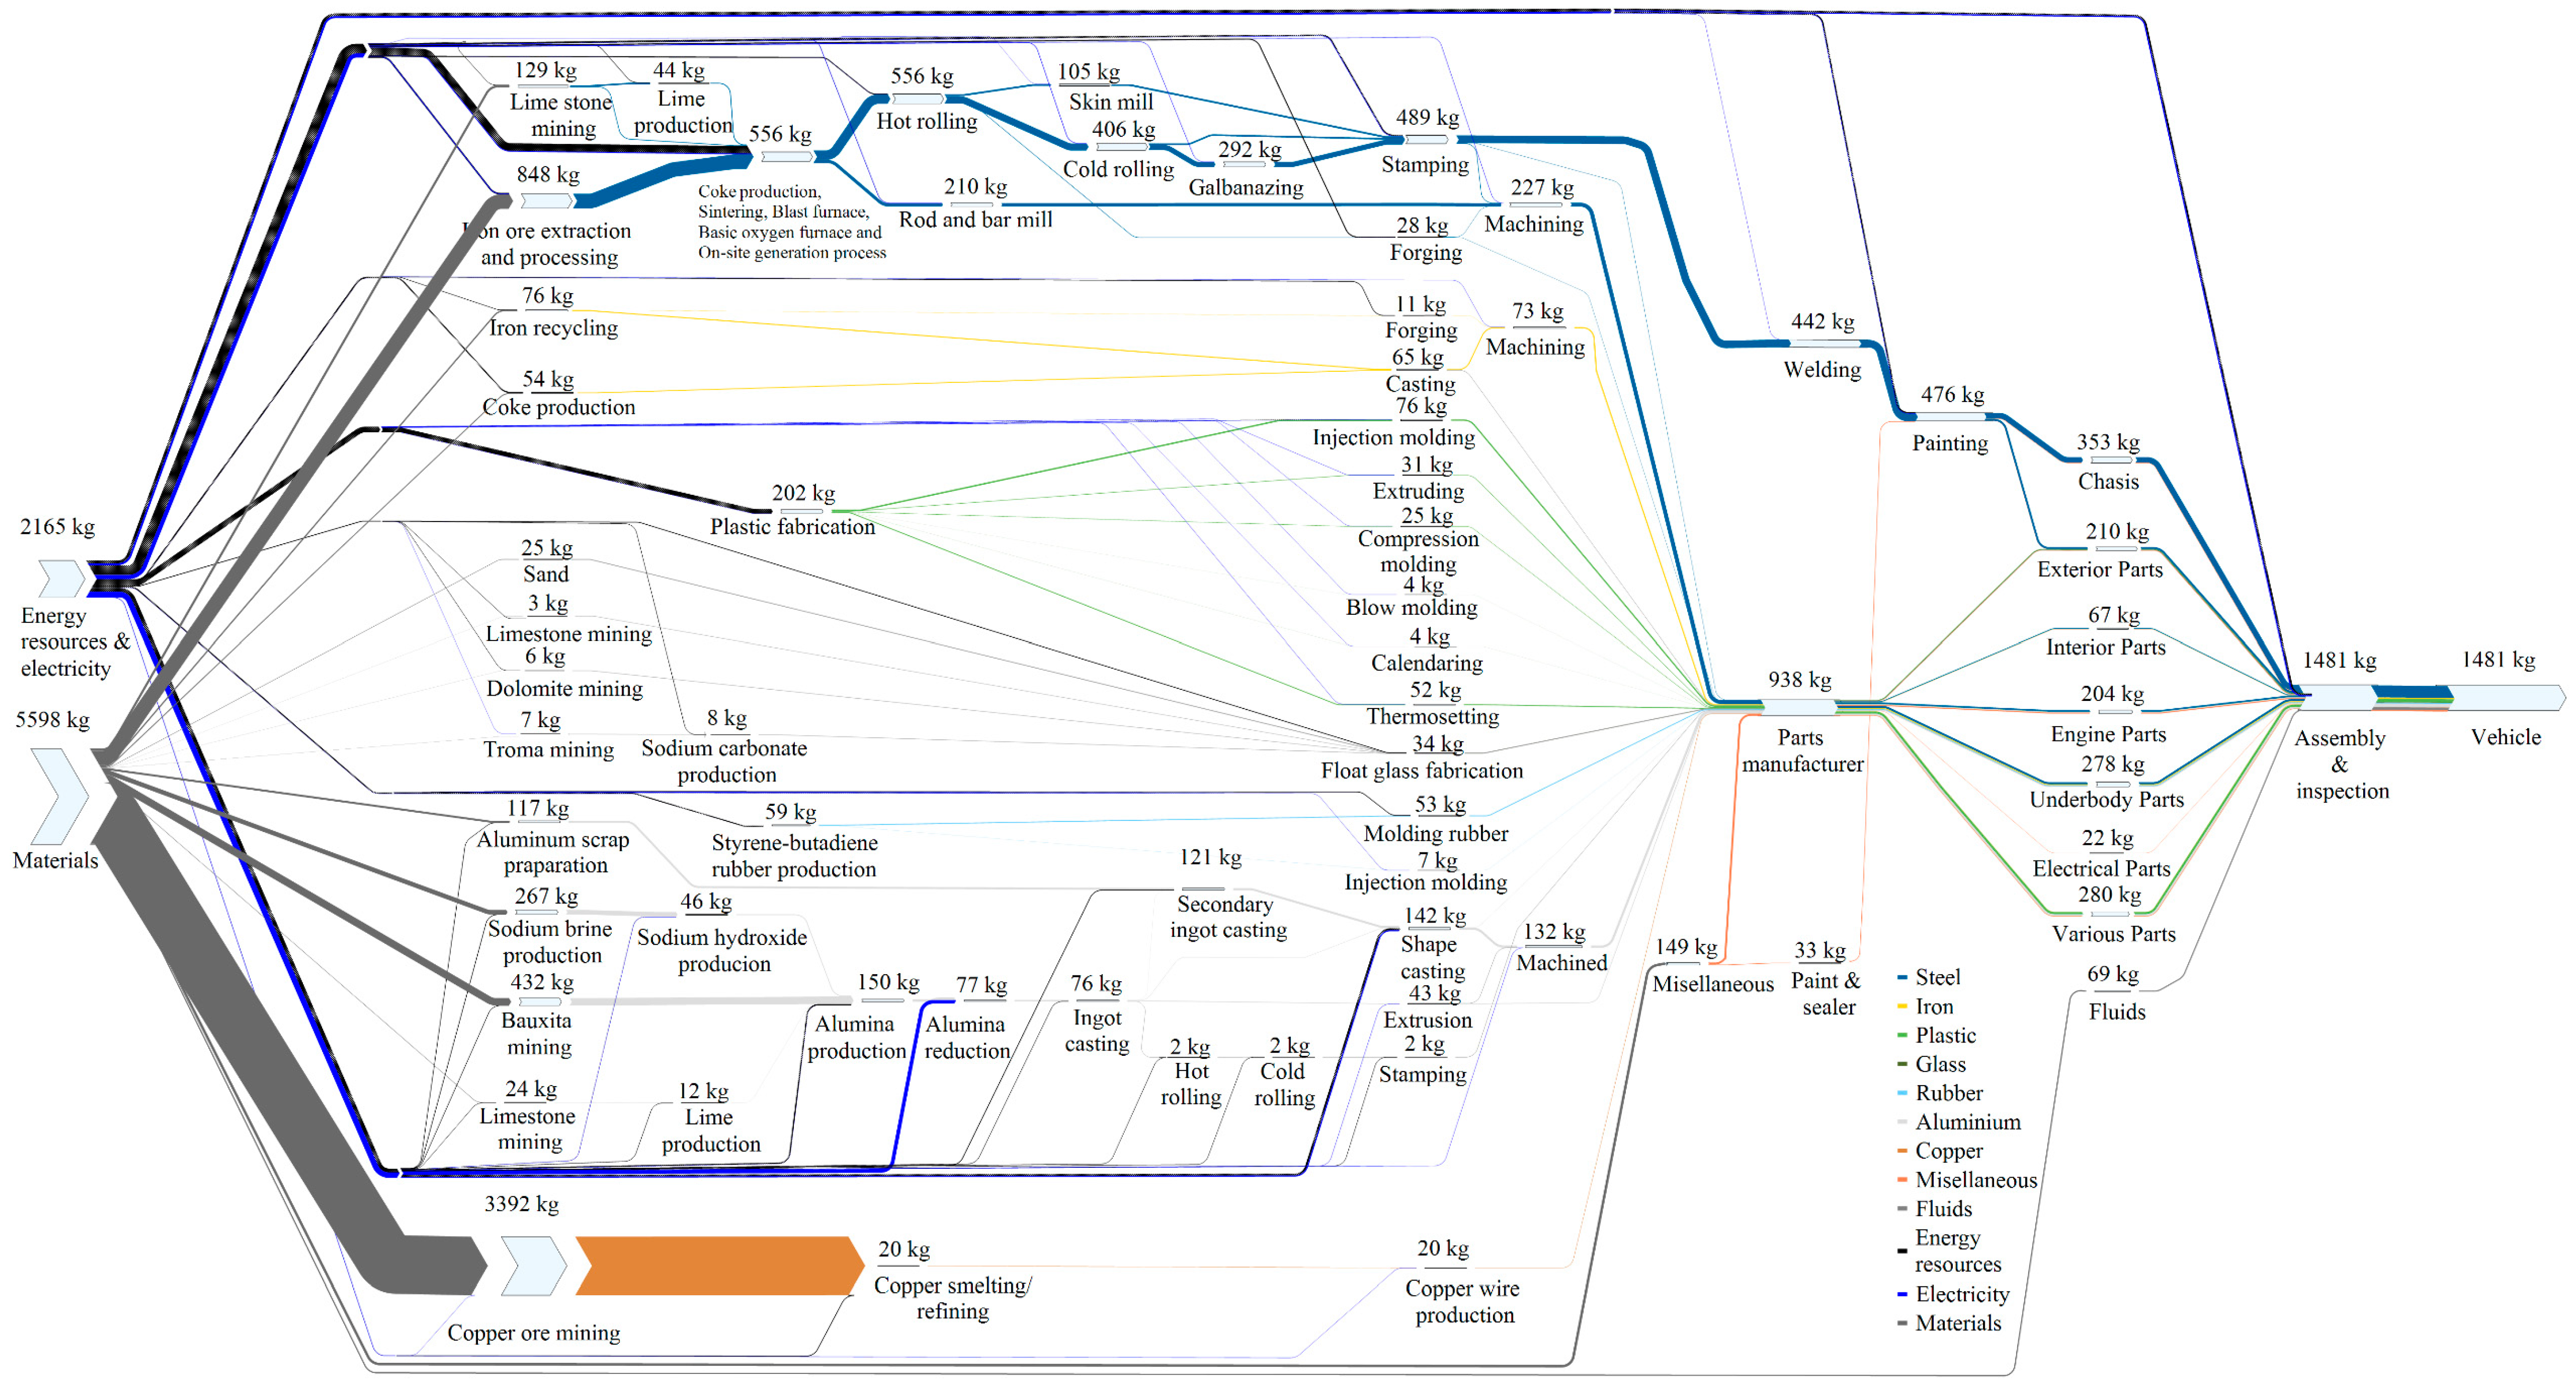
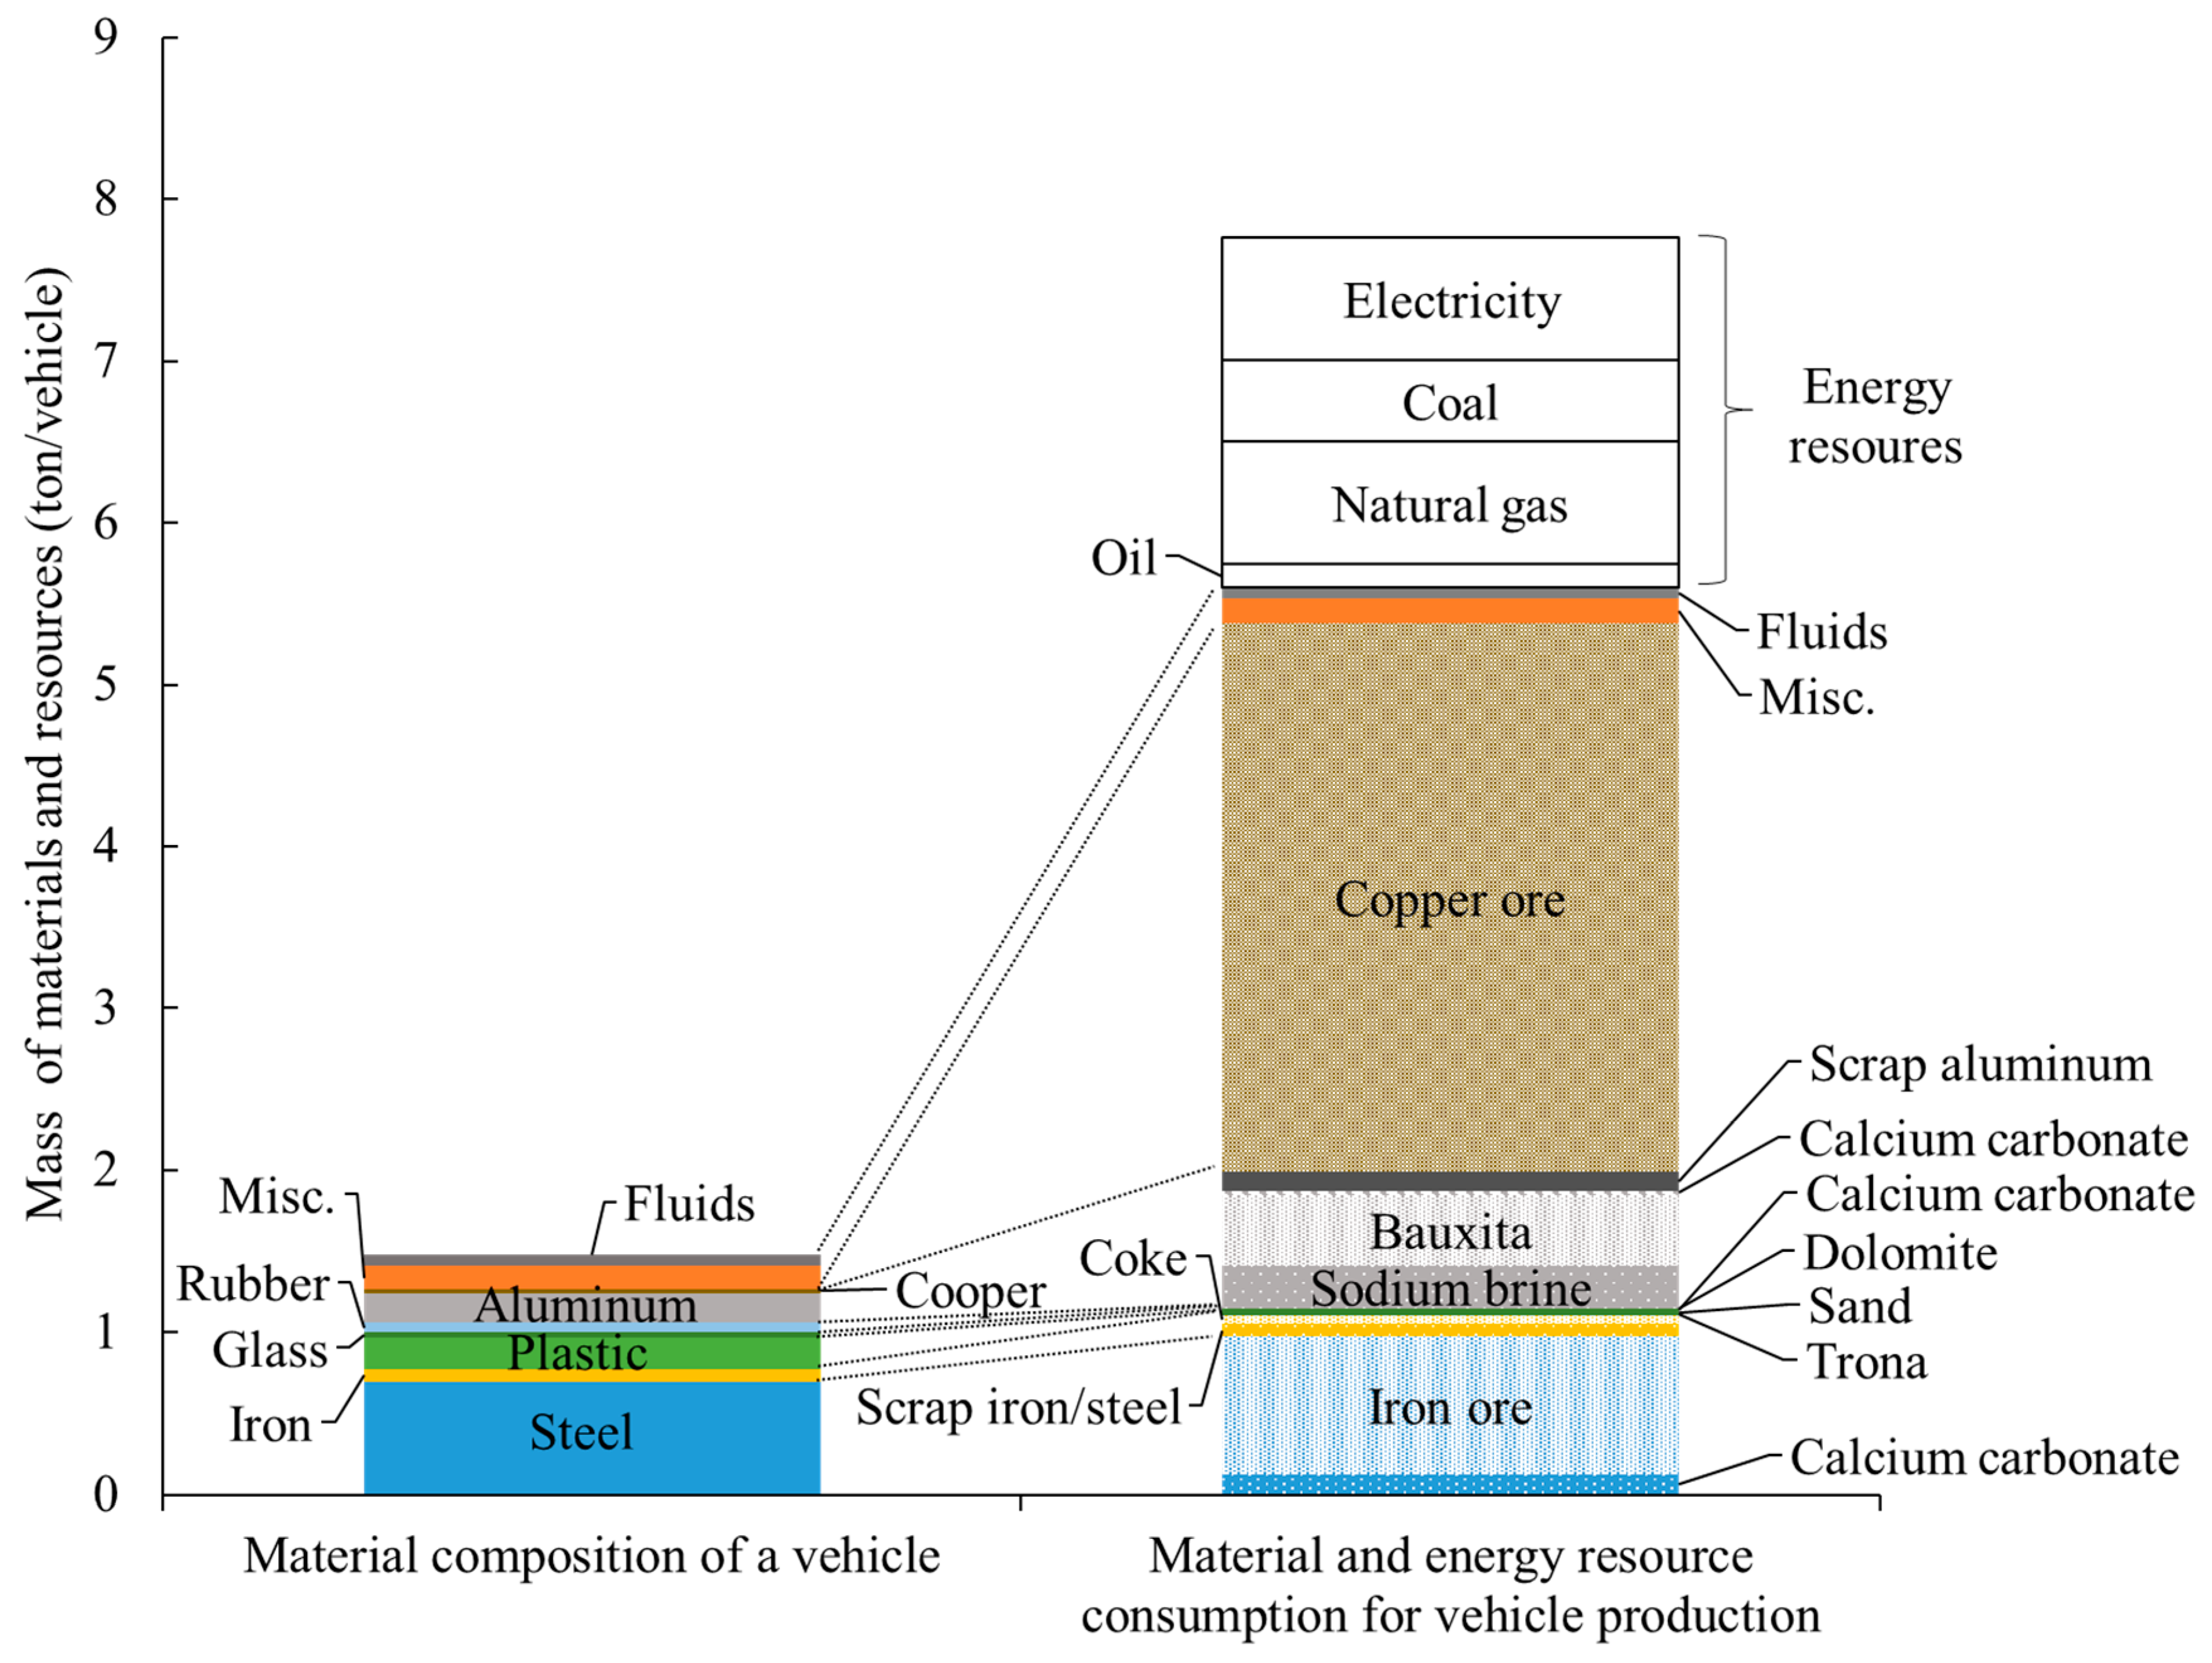
  • It has been calculated that for the production of 1 kg of vehicle, at least 5.23 kg of raw materials and energy resources are required. Copper ore has the highest percentage value of 2.29 kg/kg of vehicle, followed by energy resources, with 1.46 kg/kg of vehicle.
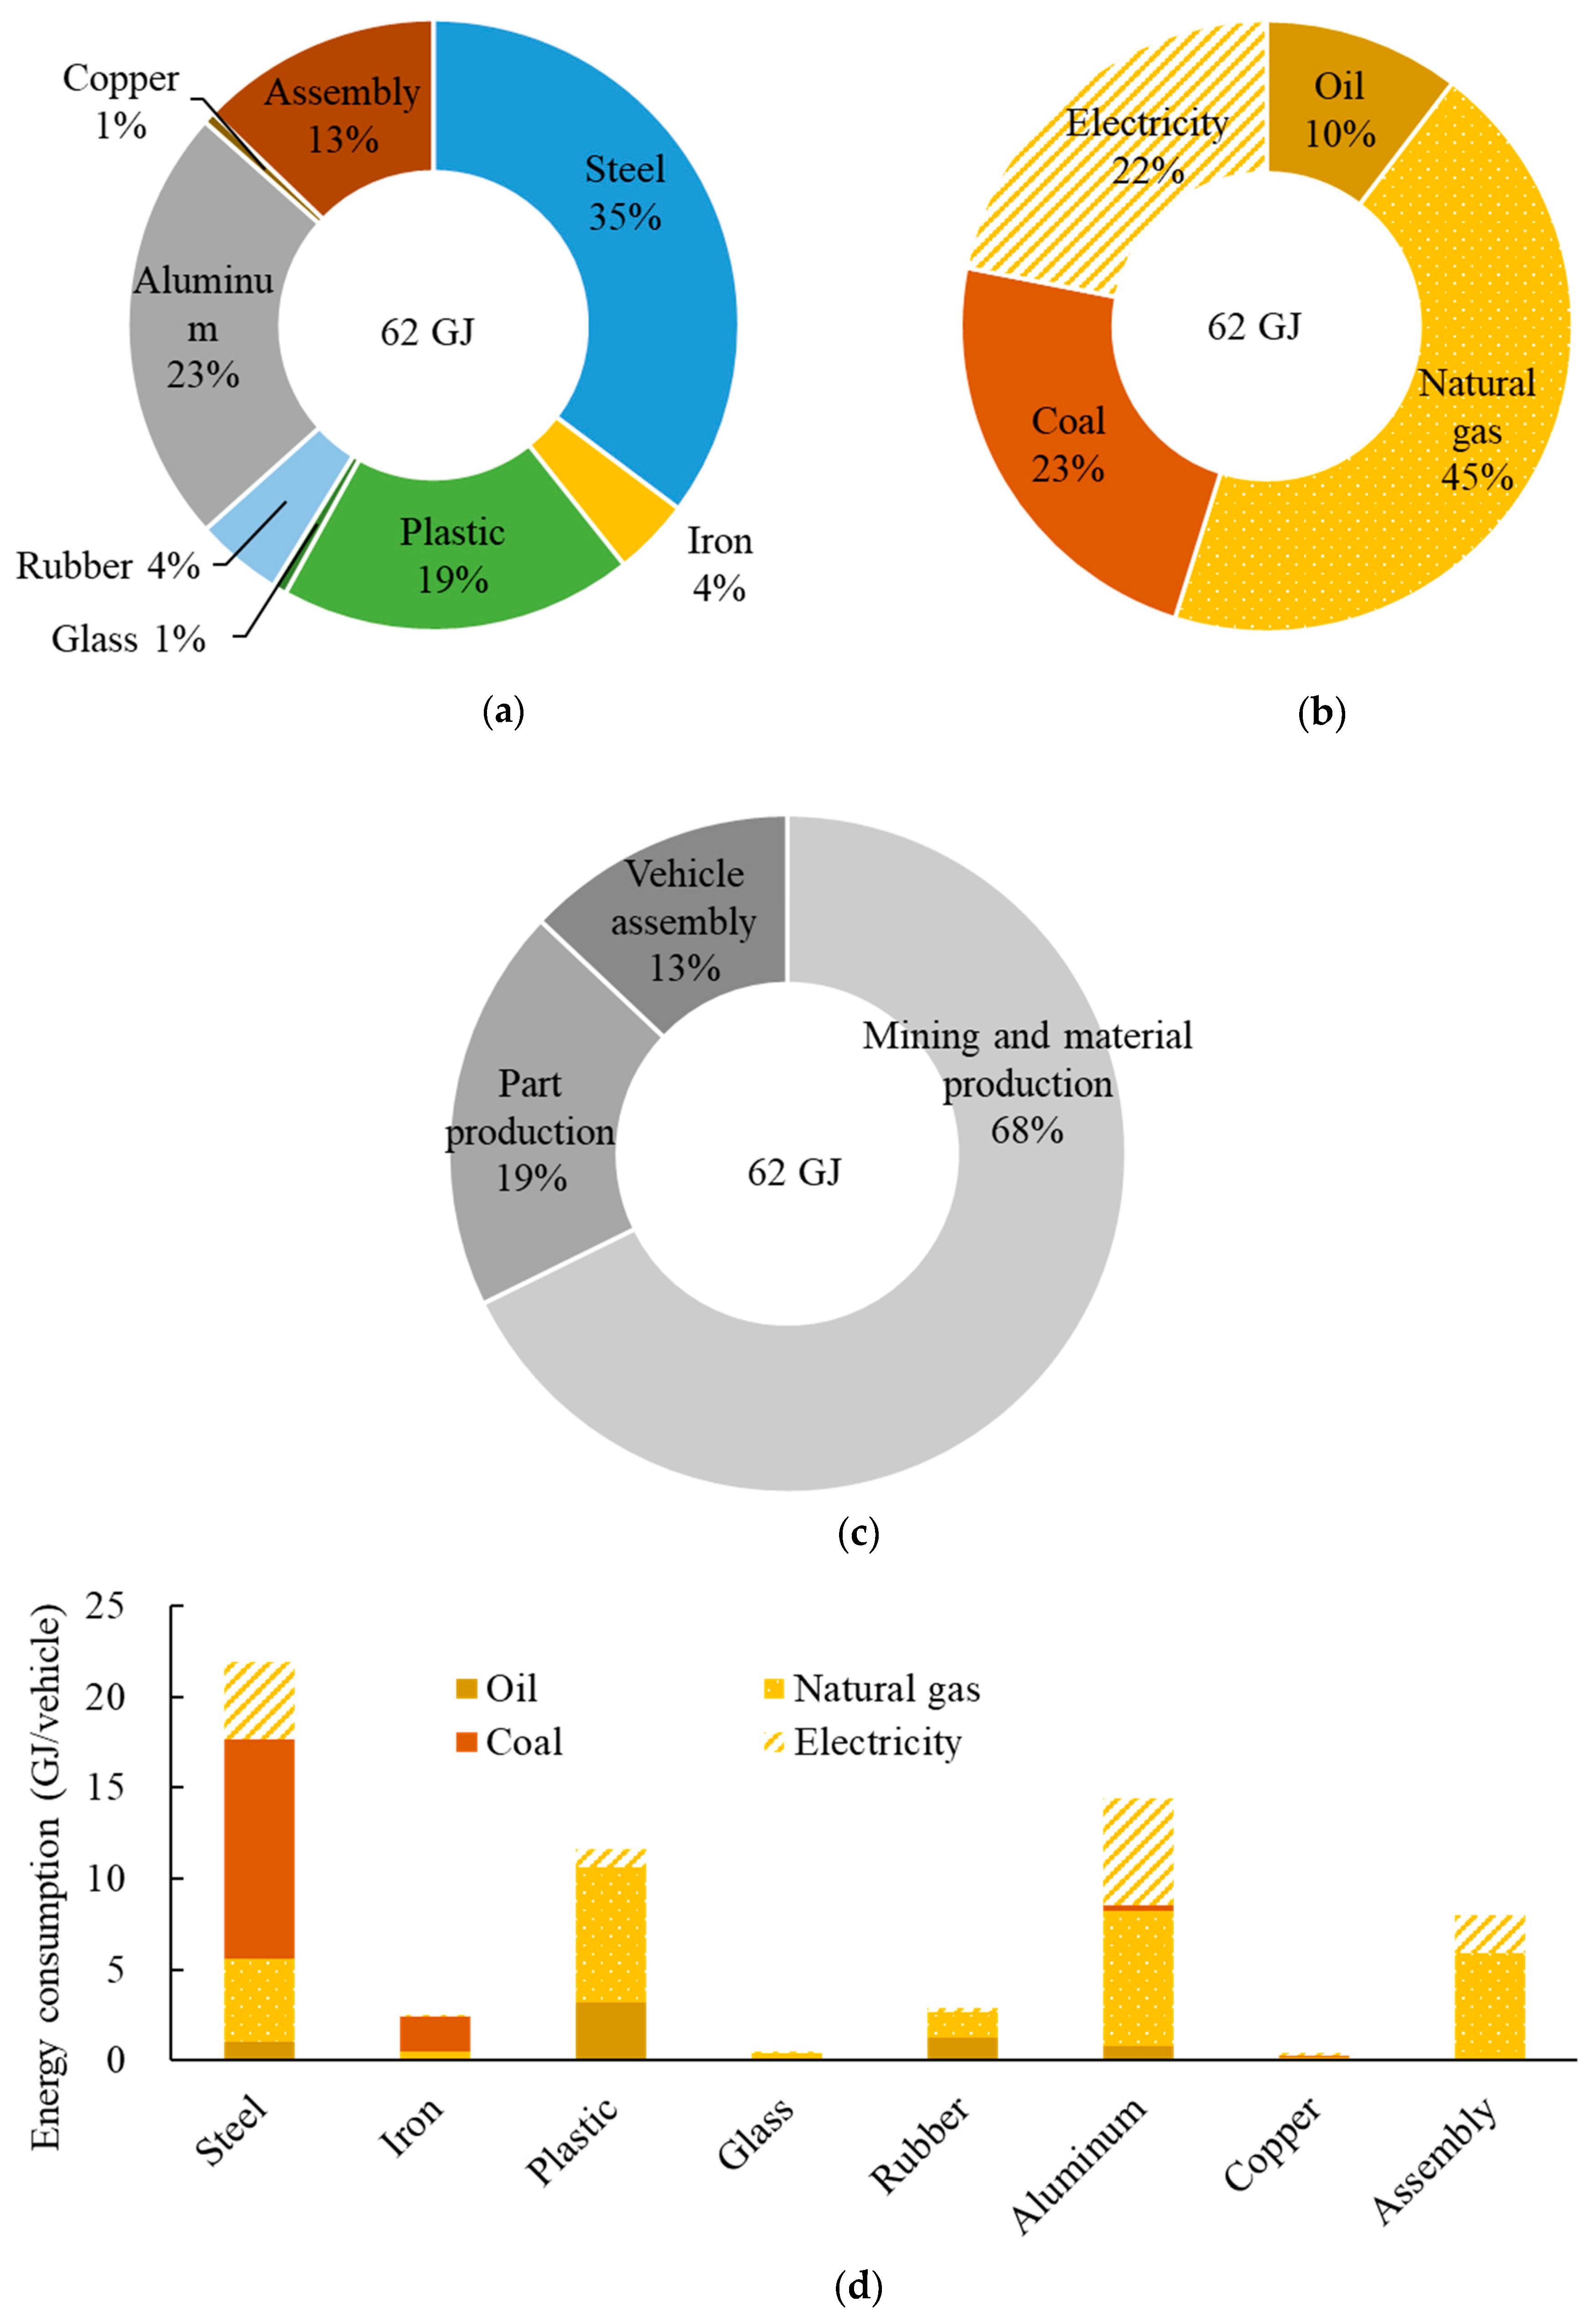
  • Energy consumption for the production of a vehicle was calculated as 62 GJ (41.8 MJ/kg of vehicle). Mining and material production processes dominate consumption, representing 68% of the total, followed by the part production processes, at 19%, and vehicle assembly, at 13%.
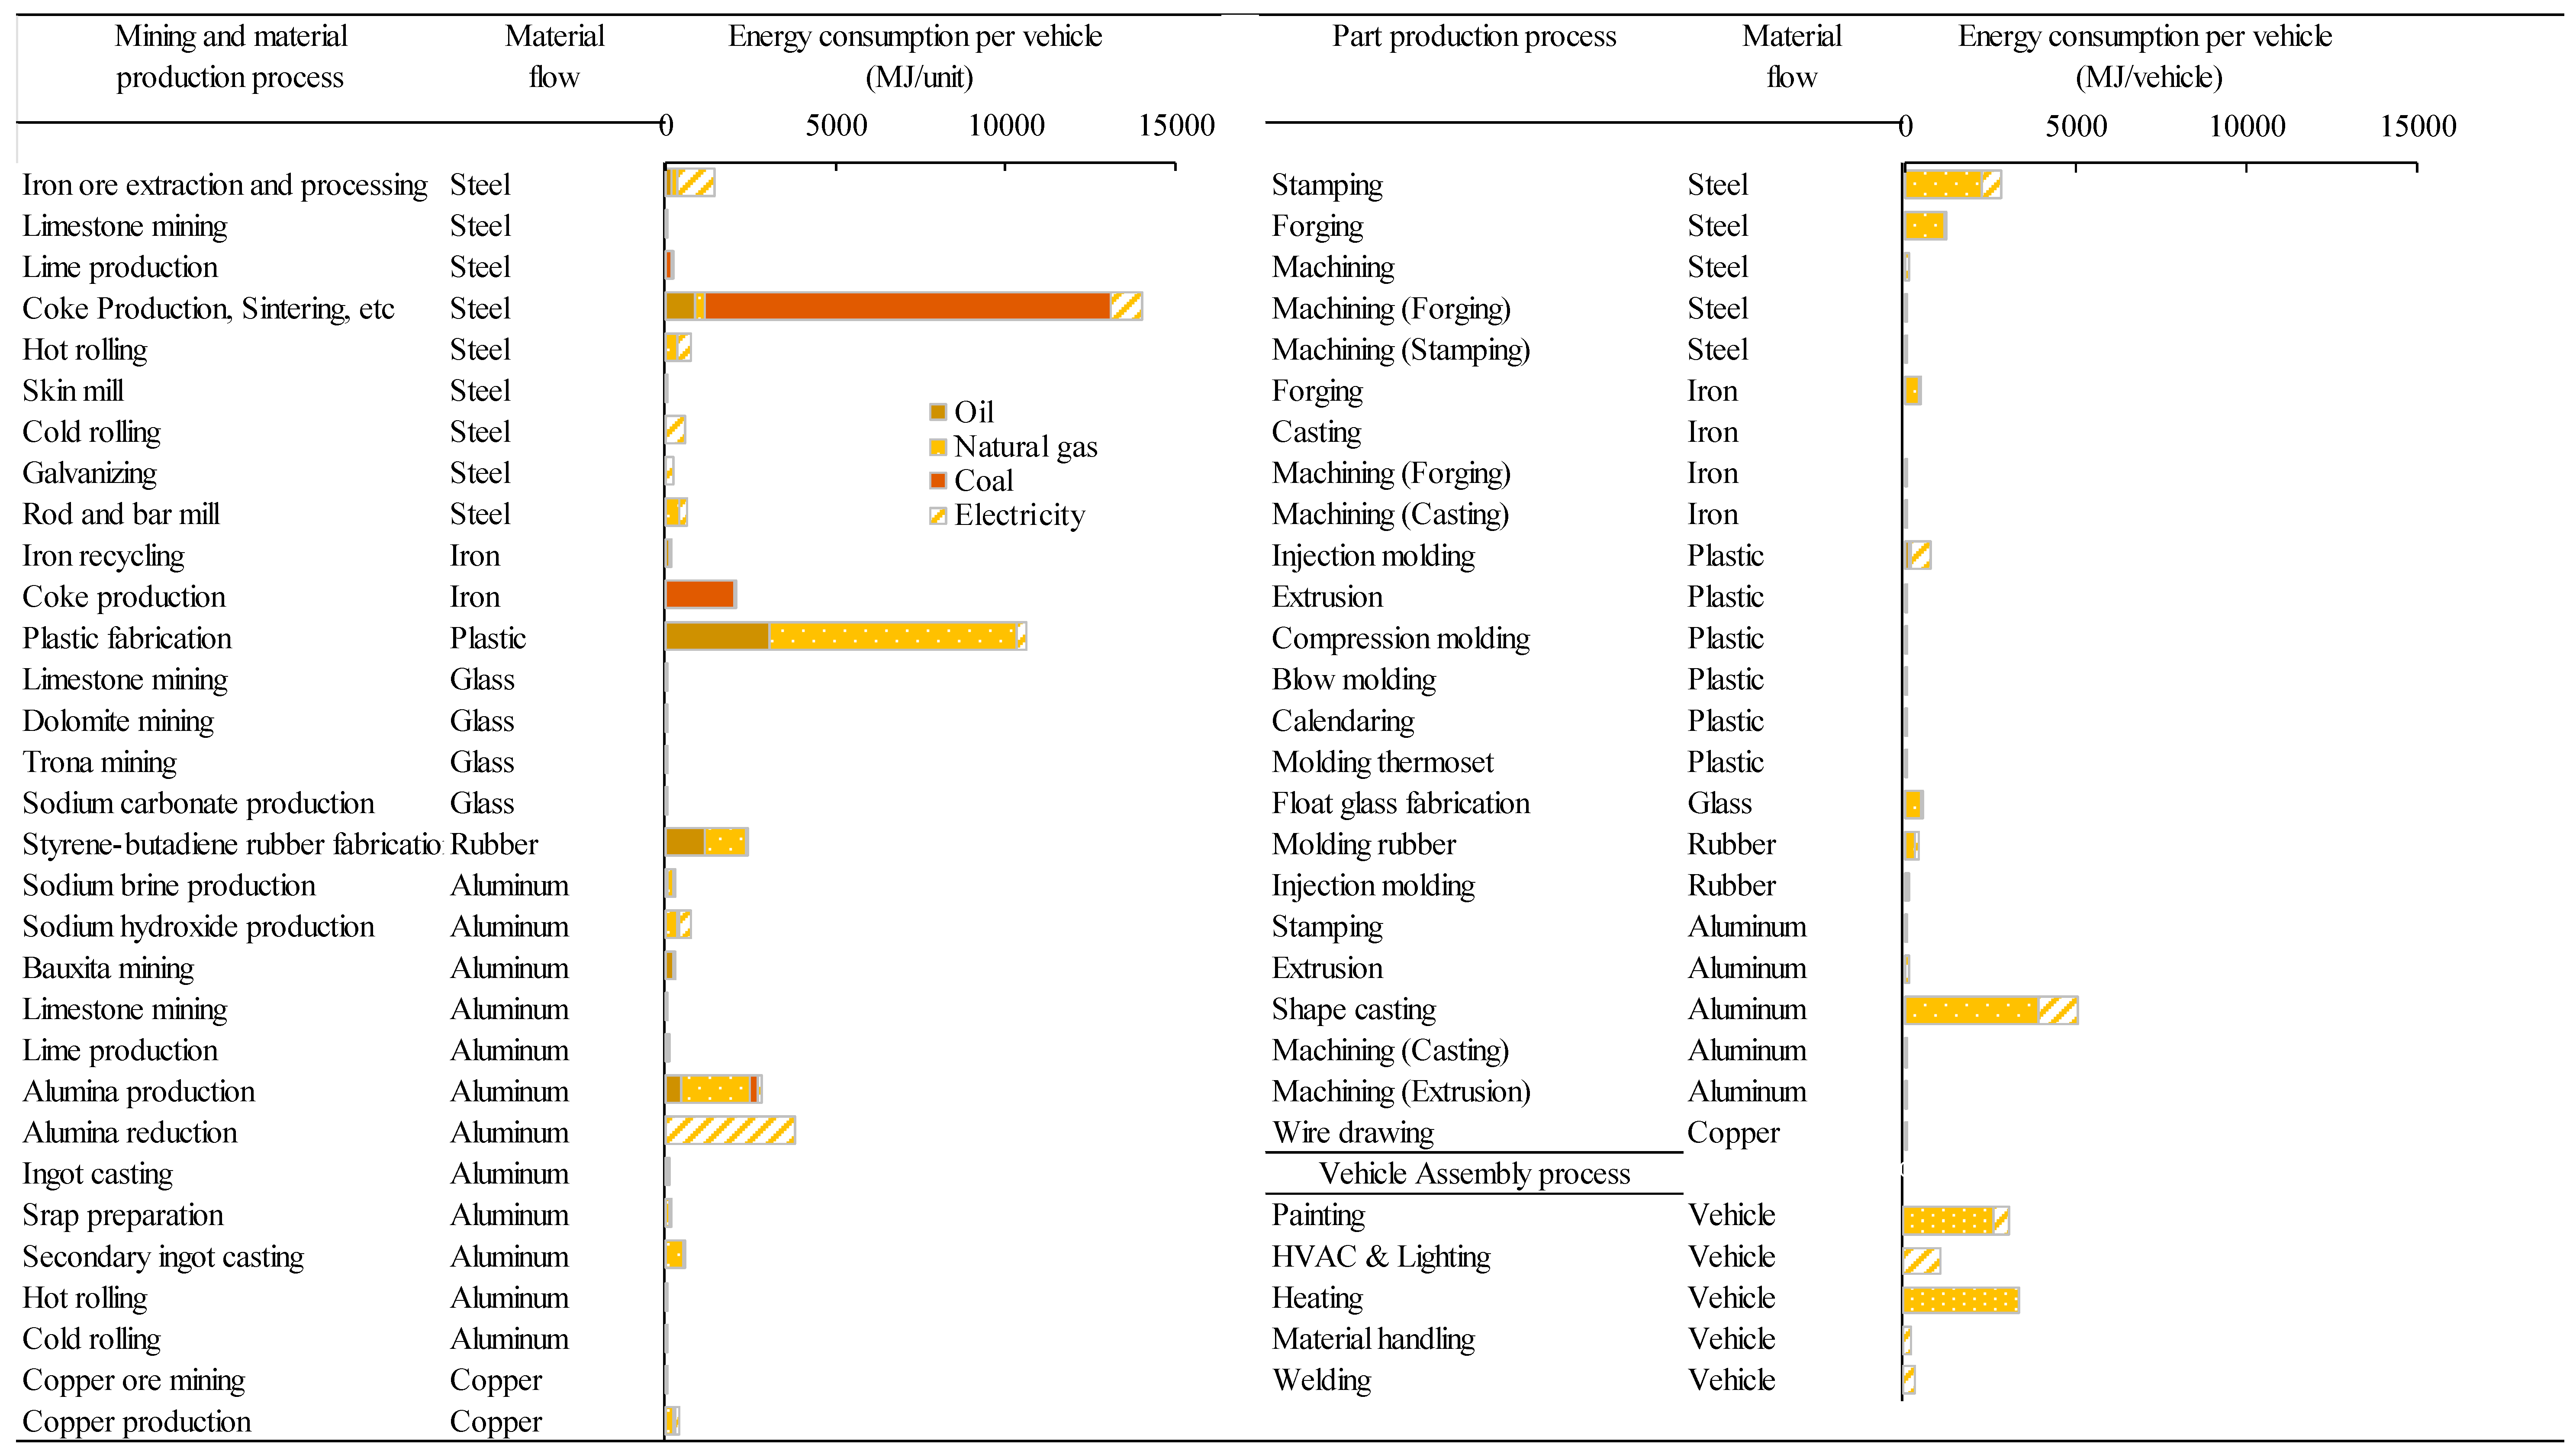
  • Natural gas is the most consumed energy resource, representing 44% of the total energy consumption for the automotive industry. This consumption is centered on the plastic fabrication processes, for which 26% of this resource is required. Moreover, 82% of the total coal is consumed in the steel production processes, and 28% of the electricity in the alumina reduction process, showing a demand concentration of determinate resources in specific facilities.
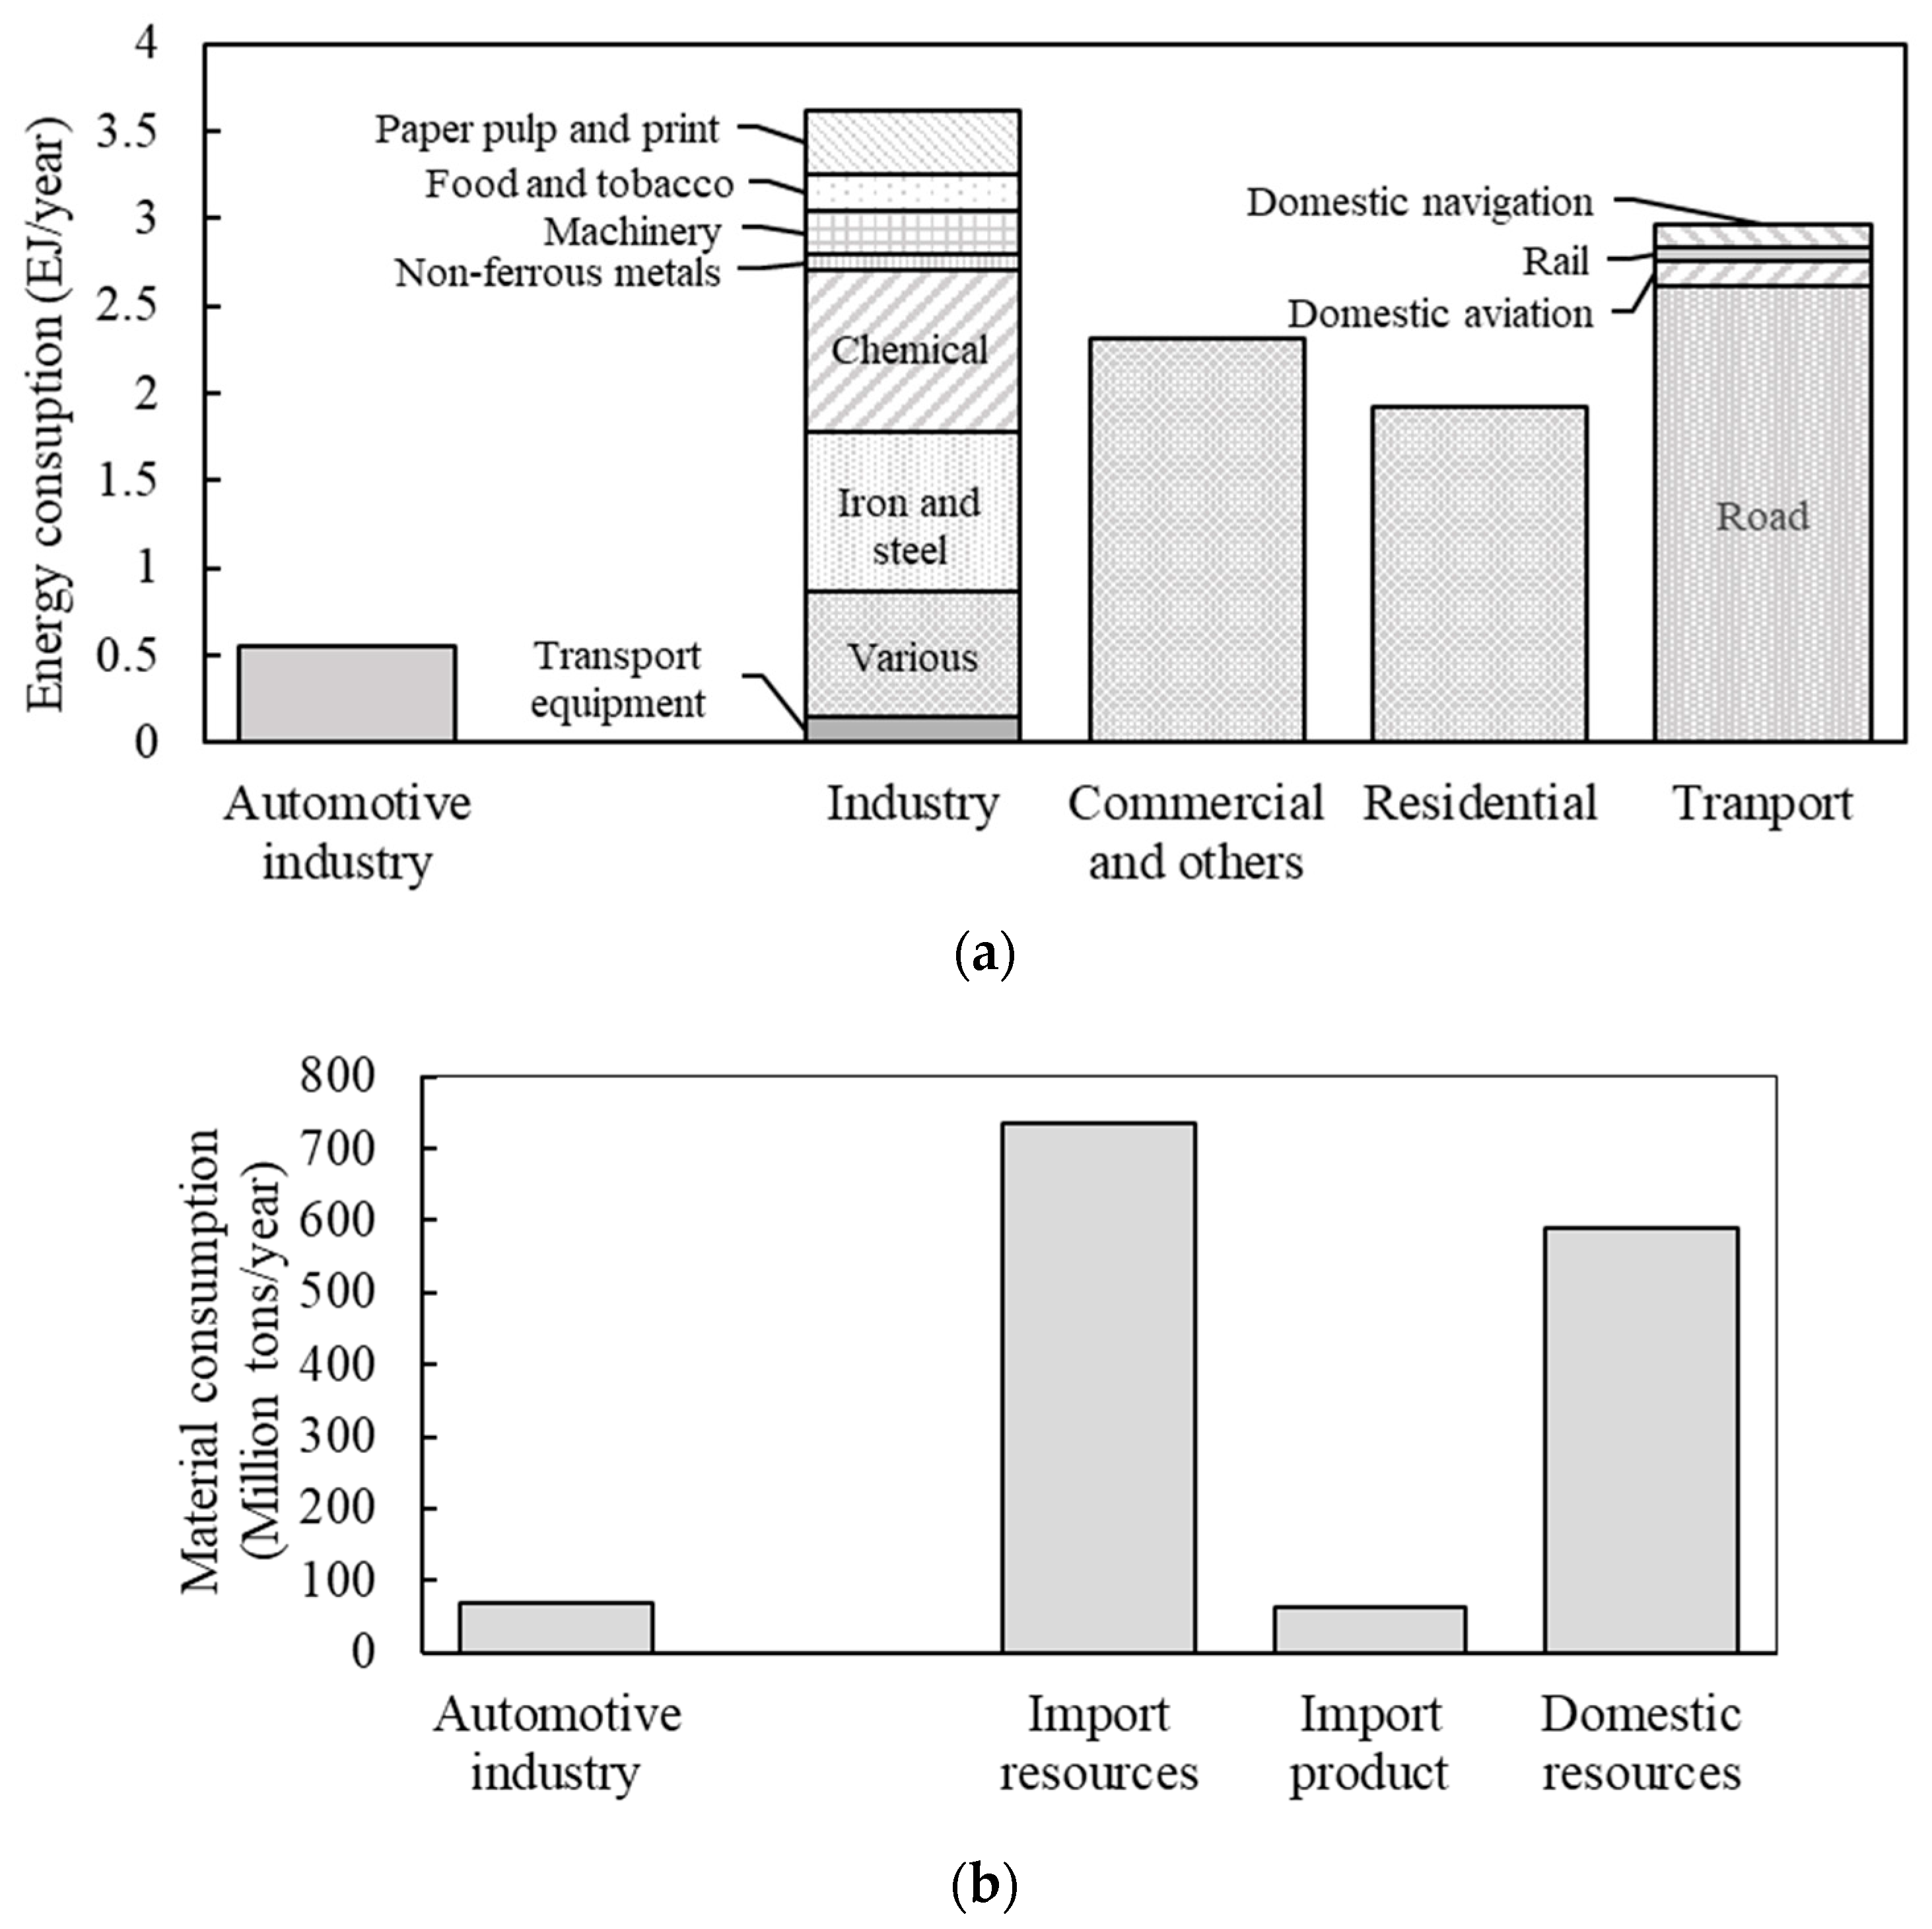
  • The energy consumption that is related to the automotive industry is 0.55 EJ per year in Japan, representing 15% of the industrial energy consumption of the country. Moreover, the materials and resources consumed in the industry were calculated as 69 million tons per year, representing more than 9.4% of the annual imported resources for Japan.
Finally, this study proposed values of energy consumption per mass of part that can be used for upcoming material and energy analysis of the automotive industry. Moreover, these values can be adopted and modified, depending on the necessity, allowing for possible changes in premises to be reflected.

Author Contributions

Conceptualization, F.E.K.S.; methodology, F.E.K.S.; formal analysis, F.E.K.S.; investigation, F.E.K.S.; writing—review and editing, F.E.K.S. and T.N.; supervision, T.N. All authors have read and agreed to the published version of the manuscript.

Funding

This research received no external funding.

Conflicts of Interest

The authors declare no conflict of interest.

References

  1. United Nations. United Nations Framework Convention on Climate Change. Historic Paris Agreement on Climate Change: 195 Nations Set Path to Keep Temperature Rise Well Below 2 Degrees Celsius, Announcement/13 December 2015. Available online: https://unfccc.int/news/finale-cop21 (accessed on 30 September 2018).
  2. U.S. Energy Information Administration. International energy outlook 2016. DOE/EIA-0484(2016); 2016. Available online: https://www.eia.gov/outlooks/ieo/pdf/0484(2016).pdf (accessed on 30 September 2018).
  3. Nemry, F.; Leduc, G.; Mongelli, I.; Uihlein, A. Environmental Improvement of Passenger Cars (IMPRO-Car); EUR—Scientific and Technical Research Reports; OPOCE: Brussels, Belgium, 2008. [Google Scholar]
  4. Kobayashi, O. Car Life Cycle Inventory Assessment. SAE Technical Paper 971199; SAE: Warrendale, PA, USA, 1997. [Google Scholar]
  5. Sato, F.E.K.; Furubayashi, T.; Nakata, T. Application of energy and CO2 reduction assessments for end-of-life vehicles recycling in Japan. Appl. Energy 2019, 237, 77–794. [Google Scholar] [CrossRef]
  6. O’reilly, C.J.; Göransson, P.; Funazaki, A.; Suzuki, T.; Edlund, S.; Gunnarsson, C.; Ludow, J.; Cerin, P.; Cameron, C.J.; Wennhage, P.; et al. Life cycle energy optimisation: A proposed methodology for integrating environmental considerations early in the vehicle engineering design. J. Clean. Prod. 2016, 135, 750–759. [Google Scholar] [CrossRef]
  7. Sato, F.E.K.; Furubayashi, T.; Nakata, T. Energy and CO2 benefit assess- ment of reused vehicle parts through a material flow approach. Int. J. Automot. Eng. 2019, 9, 91–98. [Google Scholar] [CrossRef] [Green Version]
  8. Lane, B. Life Cycle Assessment of Vehicle Fuels and Technologies. London: Eco- Lane Transport Consultancy and London Borough of Camden. 2006. Available online: http://ww.seeds4green.org/sites/default/files/Camden_LCA_Report_FINAL_10_03_2006.pdf (accessed on 12 February 2020).
  9. Vinoles-Cebolla, R.; Bastante-Ceca, M.J.; Capuz-Rizo, S.F. An integrated method to calculate an automobile’s emissions throughout its life cycle. Energy 2015, 83, 125–136. [Google Scholar] [CrossRef]
  10. Messagie, M.; Boureima, F.; Matheys, J.; Sergeant, N.; Timmermans, J.-M.; Macharis, C.; Van Mierlo, J. Environmental performance of a battery electric vehicle: A descriptive Life Cycle Assessment approach. World Electr. Veh. J. 2010, 4, 782–786. [Google Scholar] [CrossRef] [Green Version]
  11. Yang, Z.; Wang, B.; Kui, J. Life cycle assessment of fuel cell, electric and internal combustion engine vehicles under different fuel scenarios and driving mileages in China. Energy 2020, 198, 117365. [Google Scholar] [CrossRef]
  12. Nishimura, K.; Hondo, H.; Uchiyama, Y. Comparative analysis of embodied liabilities using an inter-industrial process model: Gasoline- vs. electro-powered vehicles. Appl. Energy 2011, 69, 307–320. [Google Scholar] [CrossRef]
  13. Rydh, C.J.; Sun, M. Life cycle inventory data for materials grouped according to environmental and materials properties. J. Clean. Prod. 2005, 13, 1258–1268. [Google Scholar] [CrossRef]
  14. Nishimura, K.; Hondo, H.; Uchiyama, Y. Estimating the embodied carbon emissions from the material content. Energy Convers. Manag 1997, 38, 589–594. [Google Scholar] [CrossRef]
  15. Das, S.; Curlee, R.T.; Rizy, C.G.; Schexnayder, S.M. Automobile recycling in the United States: Energy impacts and waste generation. Resour. Conserv. Recycl. 1995, 14, 265–284. [Google Scholar] [CrossRef]
  16. International Organization for Standardization. Environmental Management—Life Cycle Assessment—Principles and Framework. ISO 14040; International Organization for Standardization: Geneva, Switzerland, 2006. [Google Scholar]
  17. International Organization for Standardization. Environmental Management—Life Cycle Assessment—Requirements and Guidelines. ISO 14044; International Organization for Standardization: Geneva, Switzerland, 2006. [Google Scholar]
  18. Singh, H. Mass Reduction for Light-Duty Vehicles for Model Years 2017–2025; U.S. Department of Transportation and the National Highway Traffic Safety Administration; Report No. DOT HS 811 666; 2012. Available online: https://www.nhtsa.gov/corporate-average-fuel-economy/research-supporting-2017-2025-cafe-final-rule (accessed on 6 September 2016).
  19. Sullivan, J.L.; Burnham, A.; Wang, M. Energy-Consumption and Carbon-Emission Analysis of Vehicle and Component Manufacturing. Argonne National Laboratory ANL/ESD/10-6; 2010. Available online: https://publications.anl.gov/anlpubs/2010/10/68288.pdf (accessed on 12 February 2020).
  20. Ahmed, E. Advances Composite Materials for Automotive Applications, Structural Integrity and Crashworthiness, Chapter 3; Wiley: Hoboken, NJ, USA, 2014. [Google Scholar]
  21. GREET Excel Model Platform, 2019. GREET2 Model. Argonne National Laboratory. Available online: https://greet.es.anl.gov/greet.models (accessed on 17 December 2019).
  22. GREET 2018 Net software v1.3.0.13395, 2018. Greet Life Cycle Model 2018Argonne. Argonne National Laboratory. Available online: https://greet.es.anl.gov (accessed on 28 October 2018).
  23. Ophardt, C.E. Asarco mining Operations in Arizona Mission Mine, Tucson. Virtual Chembook. Elmhurst College. 2003. Available online: http://chemistry.elmhurst.edu/vchembook/330copper.html (accessed on 12 February 2020).
  24. Keoleian, G.; Miller, S.; De Kleine, R.; Fang, A.; Mosley, J. Life Cycle Material Update for Greet Model. University of Michigan, Center for Sustainable System Report No. CSS12-12. , 2012. Available online: http://css.umich.edu/sites/default/files/css_doc/CSS12-12.pdf (accessed on 12 February 2020).
  25. Brunham, A.; Wang, M.; Wu, Y. Development an Application of Greet 2.7—The Transportation Vehicle-Cycle Model; Argonee National Laboratory ANL/ESD/06-5; U.S. Department of Energy Office of Scientific and Technical Information: Oak Ridge, TN, USA, 2006.
  26. University of California. Fuel Energy Conversion Factors. 2020. Available online: http://w.astro.berkeley.edu/~wright/ (accessed on 16 February 2020).
  27. The Canadian Natural Gas Vehicle Alliance. Comparing Natural Gas to Diesel. Energy Content. 2014. Available online: http://cngva.org/wp-content/uploads/2017/12/Energy-Content-Factsheet-FINAL-EN.pdf (accessed on 31 March 2020).
  28. Takita, Y.; Furubayashi, T.; Nakata, T. Development and analysis of an energy flow considering renewable energy potential, 2015. Trans. JSME 2015, 81, 15–00164. [Google Scholar]
  29. MOE. Ministry of the Environment, Government of Japan. Change in Size (Weight) of Passenger Cars (for Private/Business Use). 2015. Available online: www.env.go.jp/doc/toukei/data/2015_6.17.xls (accessed on 12 February 2020).
  30. Japan Automobile Manufacturers Association. Active Matrix Database System, Passenger Car Production 2018. Available online: http://jamaserv.jama.or.jp/newdb/index.html (accessed on 12 February 2020).
  31. International Energy Agency. IEA Sankey Diagram, Japan Balance. 2017. Available online: https://www.iea.org/sankey/#?c=Japan&s=Final%20consumption (accessed on 3 March 2020).
  32. Amemiya, T. Current State and Trend of Waste and Recycling in Japan. Int. J. Earth Environ. Sci. 2018, 3, 155. [Google Scholar] [CrossRef] [PubMed]
  33. Schweimer, G.W.; Levin, M. Life Cycle Inventory for the Golf A4. Research, Environment and Transport; Volkswagen, A.G., Ed.; Wolfsburg and Center of Environmental Systems Research; University of Kasse: Kassel, Germany, 2000; Available online: http://www.wz.uw.edu.pl/pracownicyFiles/id10927-volkswagen-life-cycle-inventory.pdf (accessed on 22 April 2020).
  34. U.S. Environmental Protection Agency. The Official U.S. Government Source for Fuel Economy Information, 2011 Honda Accord 2.4L, 4cyl, Manual 5-spd. 2017. Available online: http://www.fueleconomy.gov/feg/Find.do?action=sbs&id=30684 (accessed on 3 August 2017).
  35. Demirel, Y. Energy: Production, Conversion, Storage, Conservation, and Coupling; Springer Science & Business Media: Berlin, Germany, 2012; Volume 69. [Google Scholar]
  36. Schuckert, M.; Saur, K.; Florin, H.; Eyerer, P.; Beddies, H. Life cycle analysis: Getting the total picture on vehicle engineering alternatives. Automot. Eng. 1996, 104, 49–52. [Google Scholar]
  37. European Environment Agency. Environmental Signals 2000, 16. Developments in Indicators: Total Material Requirement (TMR). 2016. Available online: https://www.eea.europa.eu/publications/signals-2000/page017.html (accessed on 17 February 2020).
Figure 1. Analysis boundary of the vehicle production supply chain.
Energies 13 02396 g001
Figure 2. Material composition of a vehicle and its principal part production process.
Energies 13 02396 g002
Figure 3. Production flow for a vehicle.
Energies 13 02396 g003
Figure 4. Material flow for vehicle production.
Energies 13 02396 g004
Figure 5. Mass of materials and resources consumed in automobile production.
Energies 13 02396 g005
Figure 6. Energy consumption in vehicle production:(a) by material; (b) by energy resource; (c) by productive phase; (d) by material and energy resource.
Energies 13 02396 g006
Figure 7. Energy consumption in each productive process.
Energies 13 02396 g007
Figure 8. Energy required for the production of each type of vehicle part.
Energies 13 02396 g008
Figure 9. Effect of the automotive industry on Japanese energy and material consumption: (a) energy consumption [31]; (b) material consumption [32]
Energies 13 02396 g009
Table 1. Material and energy consumption of each production process.
FlowProcessMaterial Consumption Per Mass of Process Output (Kg/Kg)Energy Consumption Per Mass Of Process Output (MJ/kg)
MaterialAmoutRef.OilNatural GasCoalElectriCityInternal Process *Ref.
SteelIron ore extraction and processing 0.206 0.186 1.327 (e)
Limestone mining 0.019 0.004 (b)
Lime productionCalcium carbonate2.072(b)0.119 0.244 3.489 0.221 (b)
Coke Production, Sintering, Blast Furnace, Basic Oxygen Furnace and On-site Generation processeLime0.060(b)1.192 0.356 16.258 1.256 −1.477 (b)
Calcium carbonate0.050(b)
Iron ore1.150(b)
Hot rollingSlab1.031(a) 0.665 0.743 1.399 (e)
Skin millHot rolled strip1.015(a) 0.044 0.035 (e)
Cold rollingHot rolled strip1.054(a) 1.477 0.622 (e)
GalvanizingRolled sheet1.000(a) 0.734 1.364 (e)
StampingRolled sheet1.000(a) 4.545 1.208 (e)
Rod and bar millBillet1.000(a) 2.275 1.137 (e)
ForgingBillet1.000(f) 40.404 1.357 (c)
MachiningBar, rod, others1.000(a) 0.628 (c)
IronIron recycling 1.314 0.099 (a)
Coke production 37.314 0.398 −4.472 (e)
ForgingScrap iron/steel1.000(b) 34.415 1.248 (a)
CastingScrap iron/steel1.000(b) (a), (b)
Coke0.840(a)
MachiningIron1.000(b) 0.570 (a)
PlasticPlastic fabrication 15.136 36.007 1.275 (e), (f) **
Injection moldingPellets1.139(a)1.207 0.858 7.546 (c)
ExtrusionPellets1.002(a)0.692 0.039 1.944 (c)
Compression moldingPellets1.000(a) 1.501 (c)
Blow moldingPellets1.000(a) 6.152 (c)
CalendaringPellets1.155(a)0.239 0.156 1.822 (c)
Molding thermoset Resin1.000(a) 1.501 (c)
GlassLimestone mining 0.019 0.004 (b)
Dolomite mining 0.158 0.010 (b)
Trona mining 0.206 1.327 (f) ***
Sodium carbonate production Trona0.907(b)0.442 4.220 (b)
Float glass fabricationSand0.721(a) 13.143 0.875 (c)
Calcium carbonate0.099(a)
Dolomite0.183(a)
Sodium carbonate0.232(a)
RubberStyrene-butadiene rubber fabrication 19.771 19.771 0.395 (b)
Molding rubberStyrene-butadiene1.000(a) 5.265 2.365 (c)
Injection moldingStyrene-butadiene1.031(a)8.150 4.950 (c)
AluminumSodium brine production 0.116 0.717 0.232 (b)
Sodium hydroxide production Sodium brine5.830(b)0.002 8.141 0.663 6.978 (b)
Bauxita mining 0.592 0.017 (a)
Limestone mining 0.019 0.004 (b)
Lime productionCalcium carbonate2.072(b)0.119 0.244 3.489 0.221 (b)
Alumina productionBauxita2.881(b)3.105 13.624 1.412 0.677 (a)
Sodiun hydroxide0.306(a)
Lime0.078(a)
Alumina reductionAlumina1.935(b) 49.354 (a)
Ingot castingAluminium1.020(b)0.146 0.695 0.221 (a)
Srap preparationAluminium scrap1.010(b) 0.791 0.369 (b)
Secondary ingot castingAluminium scrap0.970(b) 4.347 0.359 (b)
Aluminium0.080(b)
Hot rolling Aluminum ingot1.035(b) 3.457 0.371 (a)
Cold rollingAluminum ingot1.000(b) 1.993 1.195 (a)
StampingRolled sheet1.000(a) 4.545 1.208 (c)
Extrusion Aluminum ingot1.000(f)0.692 0.039 1.944 (c)
Shape castingAluminum ingot1.000(f) 27.495 8.046 (c)
MachiningAluminium1.000(a) 0.628 (c)
CopperCopper ore mining 0.006 0.007 (e), (f), (d)
Copper productionCopper ore169.586(d)1.452 9.075 3.448 6.897 (e)
Wire drawingCopper1.000(b)0.887 0.021 1.711 (e)
Refereces: * Blast furnace and coke oven gas; not considered
(a) GREET Excel model platform [21](d) Ophardt, 2003 [23] in the energy consumption calculation
(b) GREET 2018 Net software [22] (e) Keoleian, 2012 [24]** Considered values of Polypropilene
(c) Sullivan, 2010 [19](f) Author estimation*** Considered same as Iron ore mining
Table 2. Comparison of vehicle life cycle energy consumption.
Energy Consumption Values Proposed in Our ApproachEnergy Consumption Values from Nemry et al. [3]Energy Consumption Values from Schweimer et al. [33]
MJ/kg of vehiclePercentageMJ/kg of vehiclePercentageMJ/kg of vehiclePercentage
Production41.816.4%539%8126%
Use21383.4%55791%22673%
ELV 0.60.2%00%--
Total255.4100%610100%307100%

