Article

An Optimal Slip Ratio-Based Revised Regenerative Braking Control Strategy of Range-Extended Electric Vehicle

State Key Laboratory of Automotive Simulation and Control, School of Automotive Engineering, Jilin University, Changchun 130022, China
*
Author to whom correspondence should be addressed.
Energies 2020, 13(6), 1526; https://doi.org/10.3390/en13061526
Submission received: 2 February 2020 / Revised: 17 March 2020 / Accepted: 20 March 2020 / Published: 24 March 2020

Abstract

:
The energy recovered with regenerative braking system can greatly improve energy efficiency of range-extended electric vehicle (R-EEV). Nevertheless, maximizing braking energy recovery while maintaining braking performance remains a challenging issue, and it is also difficult to reduce the adverse effects of regenerative current on battery capacity loss rate (Qloss,%) to extend its service life. To solve this problem, a revised regenerative braking control strategy (RRBCS) with the rate and shape of regenerative braking current considerations is proposed. Firstly, the initial regenerative braking control strategy (IRBCS) is researched in this paper. Then, the battery capacity loss model is established by using battery capacity test results. Eventually, RRBCS is obtained based on IRBCS to optimize and modify the allocation logic of braking work-point. The simulation results show that compared with IRBCS, the regenerative braking energy is slightly reduced by 16.6% and Qloss,% is reduced by 79.2%. It means that the RRBCS can reduce Qloss,% at the expense of small braking energy recovery loss. As expected, RRBCS has a positive effect on prolonging the battery service life while ensuring braking safety while maximizing recovery energy. This result can be used to develop regenerative braking control system to improve comprehensive performance levels.

Graphical Abstract

1. Introduction

With increasingly prominent energy and environmental issues, electric vehicles have developed rapidly in recent years due to their advantages of low pollution-free emission. However, due to the low energy density of battery, short driving range and long charging time, the marketing of battery electric vehicles (BEV) is greatly limited [1,2]. Range-extended electric vehicles (R-EEVs) add auxiliary power units, it can solve the range anxiety from consumers by increasing driving range. In addition, a R-EEV has a certain commercial competitiveness in the future market [3]. The regenerative braking system (RBS) provides an effective way to greatly improve overall electrical performance of R-EEVs [4,5]. Thereby, the regenerative braking control strategy (RBCS) is worthwhile research, and is receiving a good deal of attention.
The existing research has focused on RBCS in order to achieve better capacity of the regenerative braking energy. Literature [6] has analyzed the braking force distribution strategy and studied the energy saving potential. Different control strategies are studied to achieve the goals of regeneration efficiency and braking safety in [7,8,9]. Similar researches also include Literature [10,11,12,13], which develop braking torque allocating method to achieve improved braking performance and energy regeneration. In terms of the currently available approaches, it is mainly focused on how to coordinate the regenerative braking torque and mechanical friction to maximize the braking energy recovery while ensuring the braking efficiency. It should be noted that the impact of regenerative braking current (RCC) on battery health should also be given sufficient attention and research.
The other focus is optimization and the analysis of braking torque distributions strategies under extreme adhesion conditions or an emergency braking process. A revised control strategy is presented with the front wheel slip ratio consideration in [14] to prevent a front wheel lock-up and maximize the regenerative braking efficiency under low tire–road friction conditions. Literature [15] proposed an efficient RBCS based on the modified nonlinear model predictive control method to ensure braking safety. In addition, a study team [16] built a high-precision predictive model based on the off-line optimization data of the combined model to solve the poor real-time problem of the optimization. The artificial neural network-based control mechanism was utilized to optimize the switching scheme of the vehicular braking force distribution was proposed [17].
The previous studies have focused more on the braking efficiency and maximization of regenerative energy, but the impact of RCC on battery service life is not considered sufficiently. It means there is still much room for optimization of RBCS. Therefore, a revised regenerative braking control strategy (RRBCS) is proposed in this paper. The strategy based on optimal slip ratio (OSR) to ensure braking performance while maximizing braking energy recovery and reducing battery capacity loss rate (Qloss,%). The rest of this paper is organized as follows:
In Section 2, the initial regenerative braking control strategy (IRBCS) is given, and the distribution of the front and rear slip ratios and allocation logic of the braking work-point are introduced. A simulation model is built in Section 3, and the tire–road adhesion coefficient recognition module (TACRM) and double fuzzy logic controller (DFLC) are verified by simulation test. In Section 4, battery capacity loss module (BCLM) is established. The BCLM uses test results of battery life decay test. Eventually, RRCBS is proposed. In Section 5, the effectiveness and feasibility of the proposed RRBCS are validated by test under the world light vehicle test procedure (WLTP). This is followed by the conclusion in the final section.

2. IRBCS Based on OSR

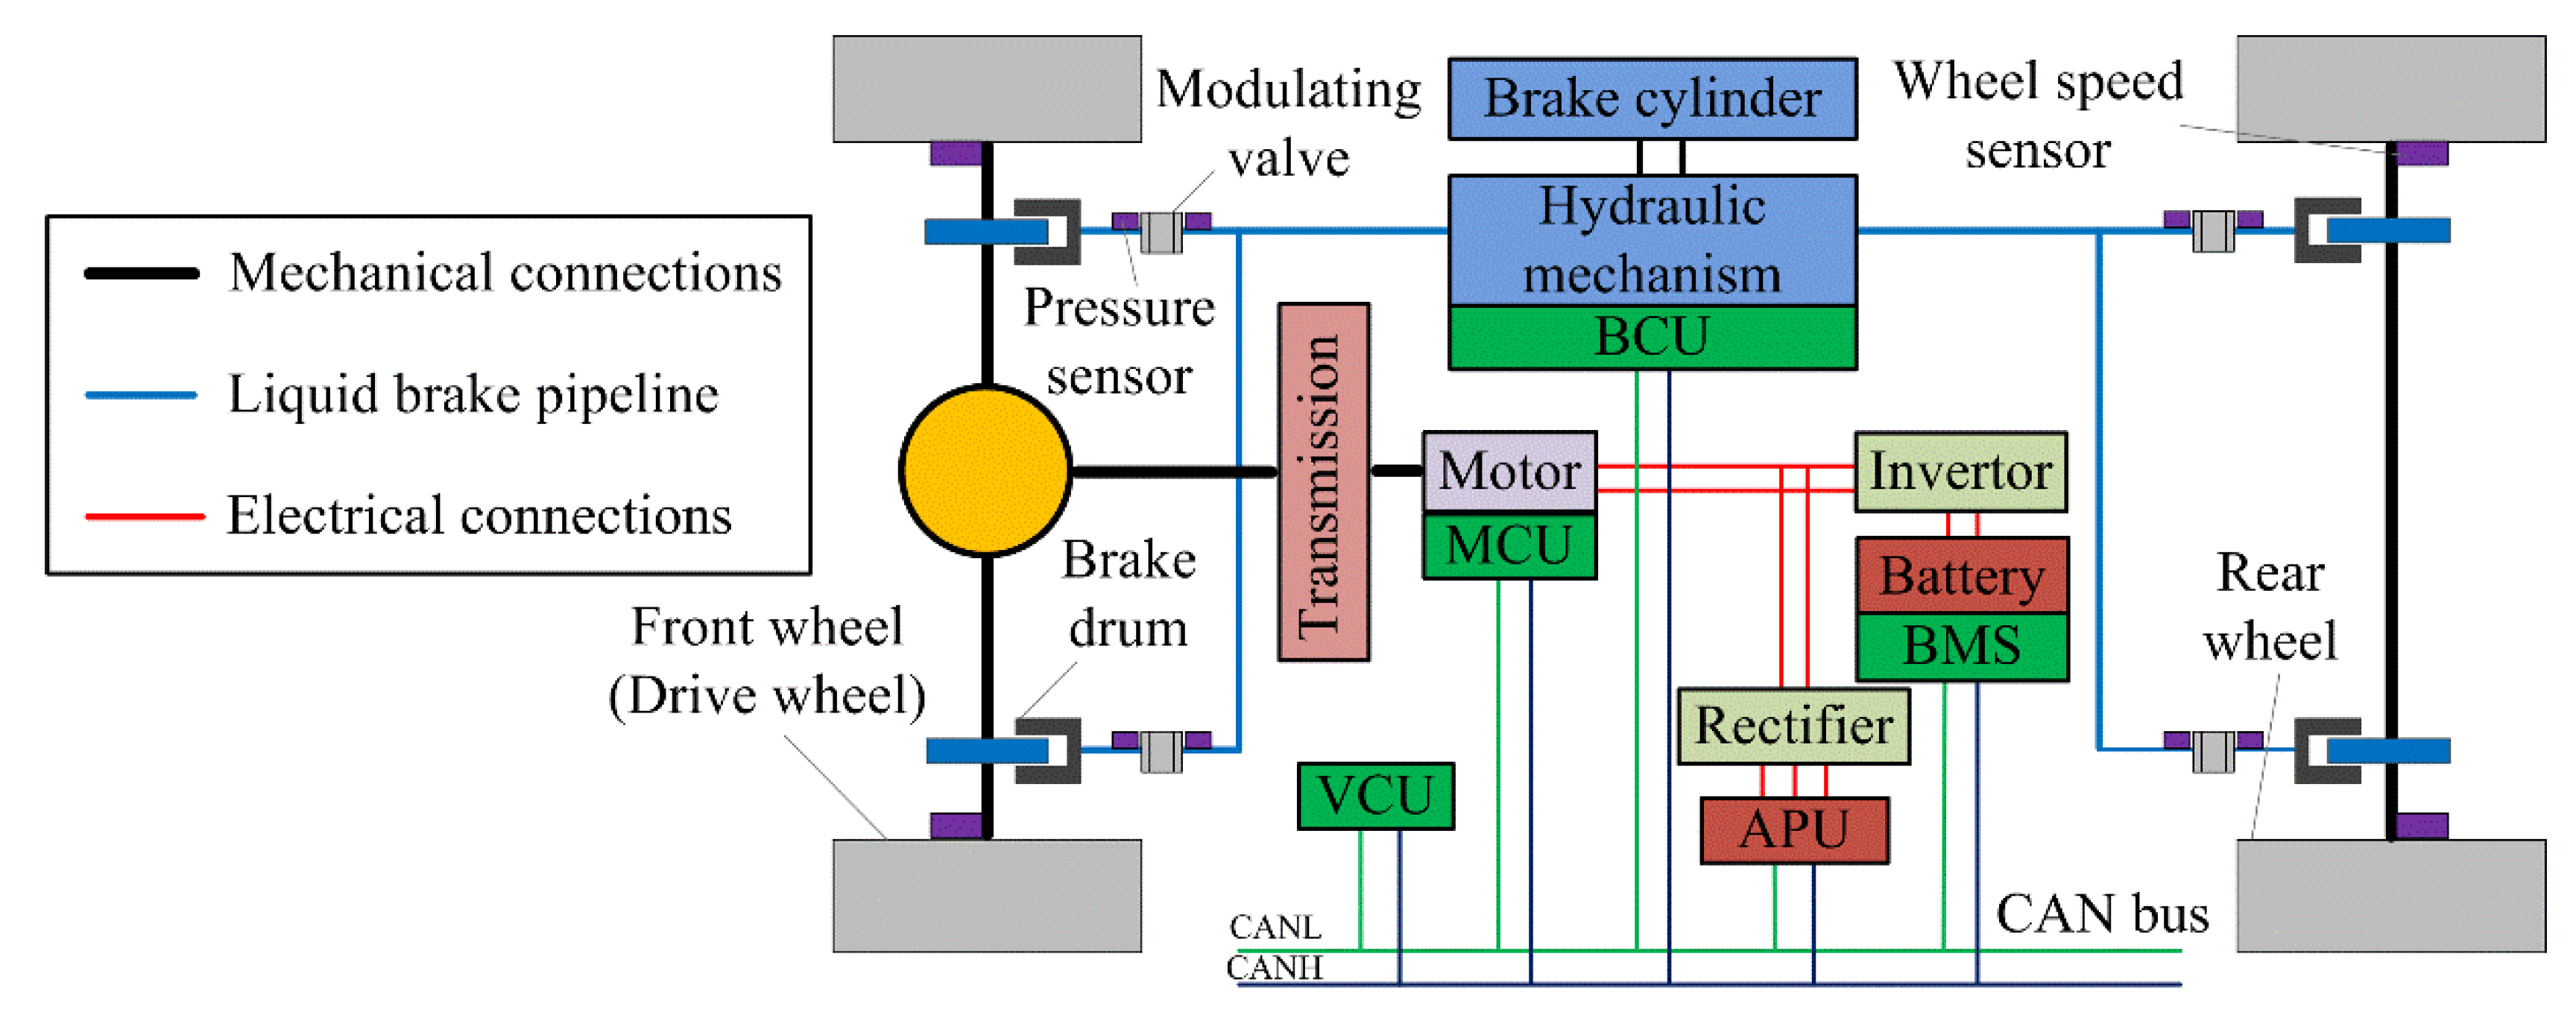
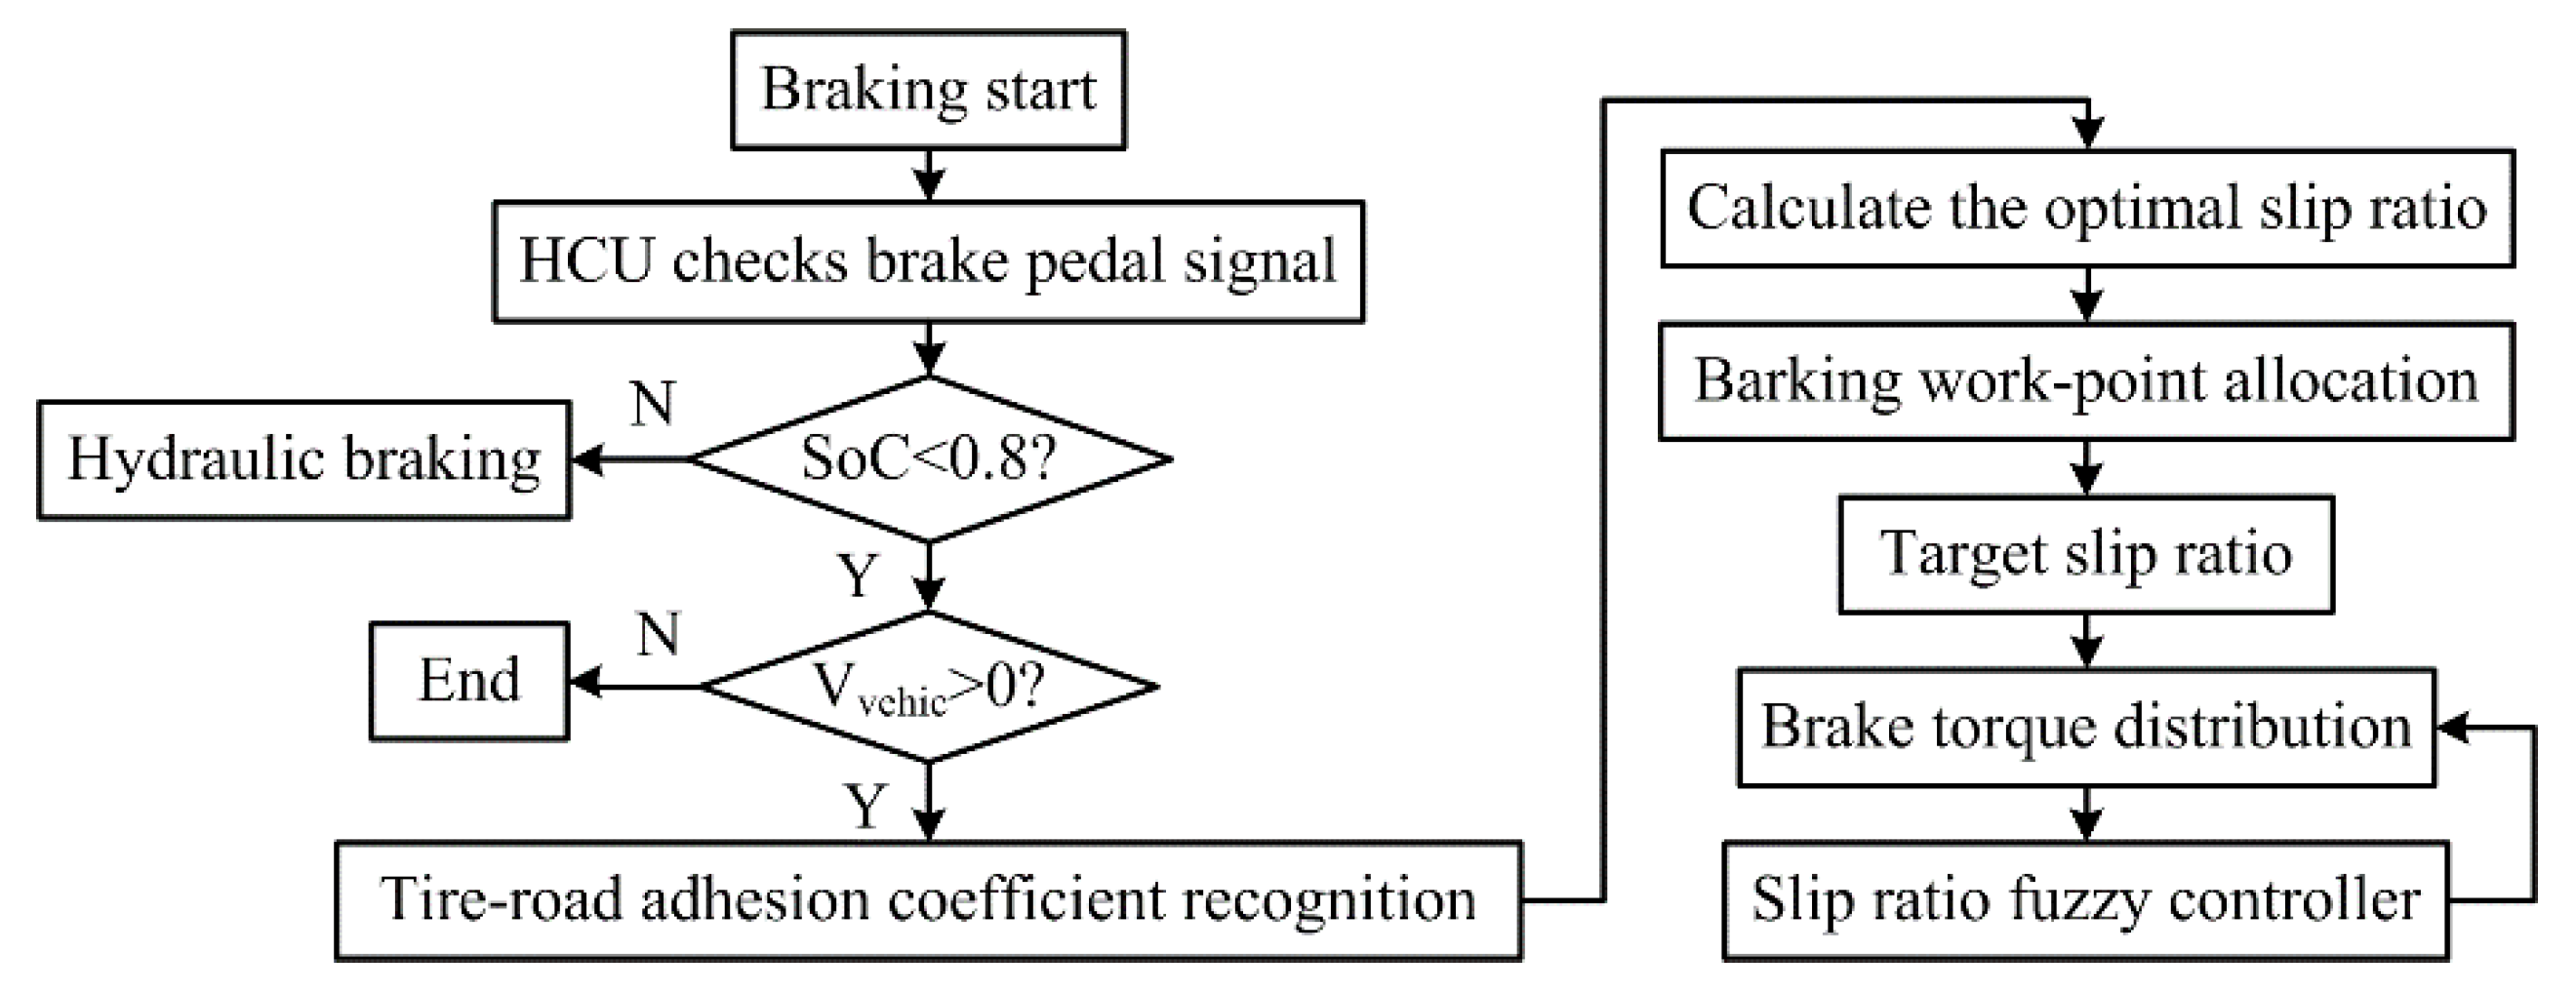
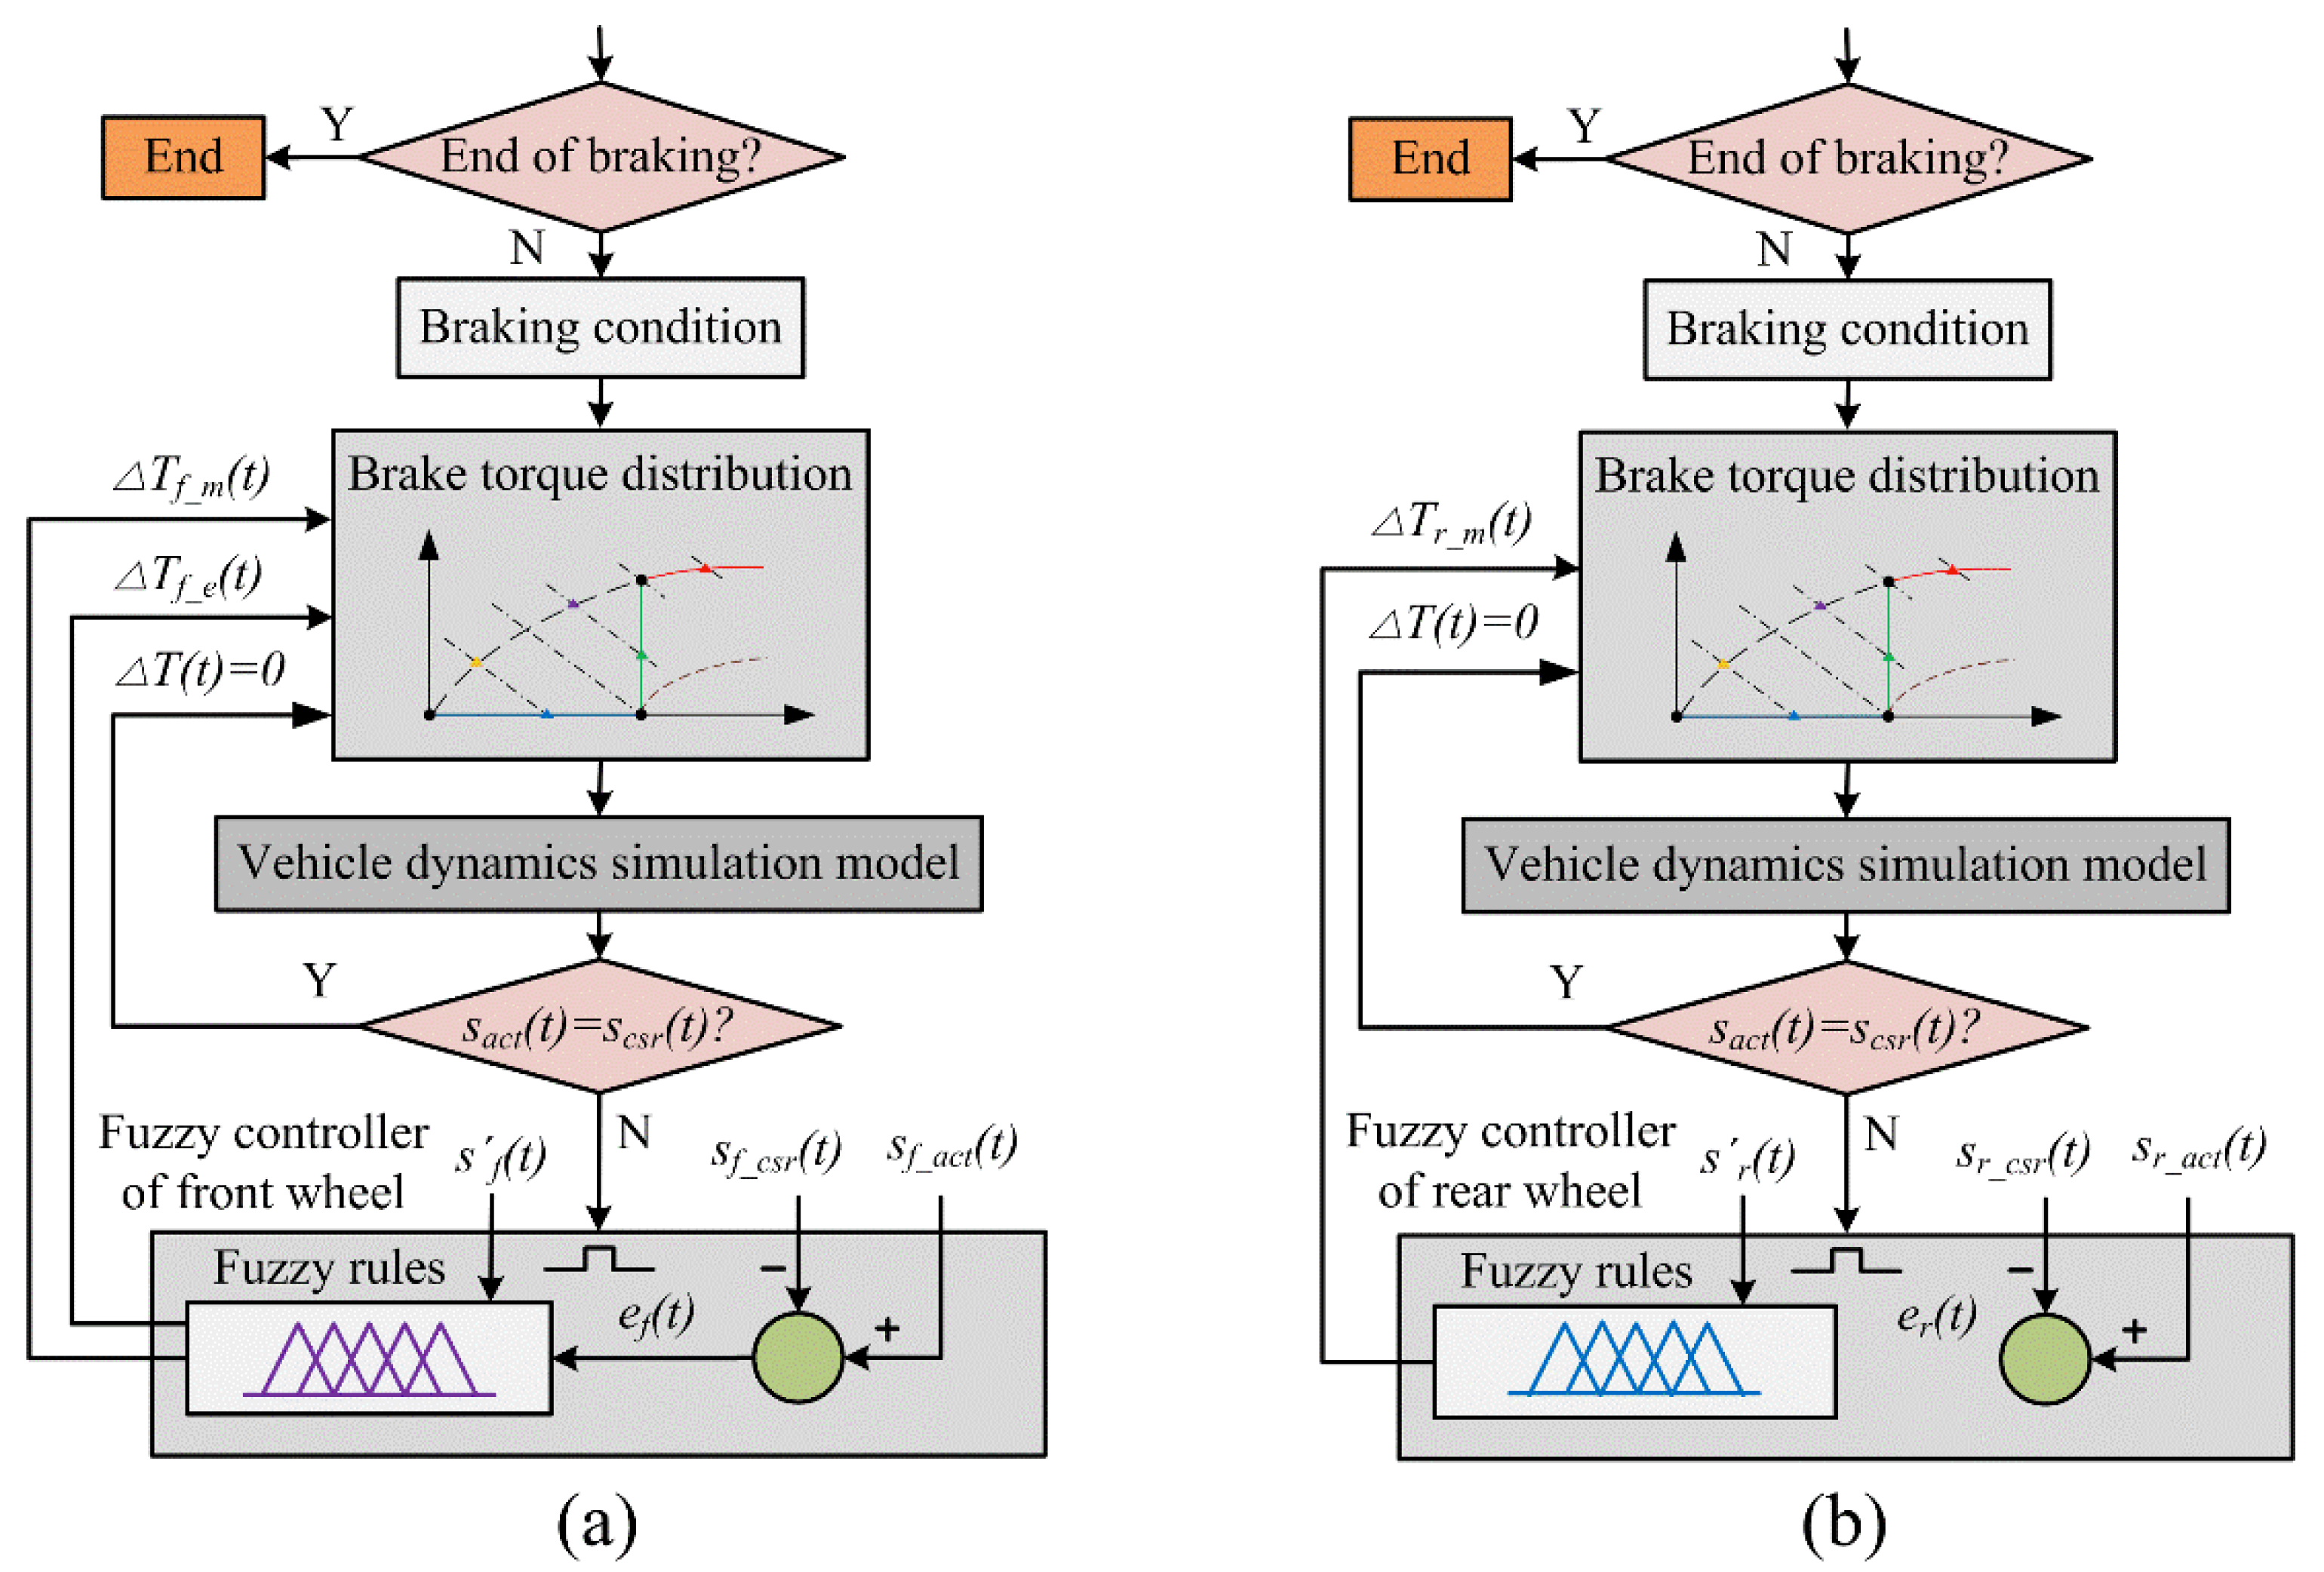
2.1. Control Principle Overview of IRBCS

The research object is a medium-sized R-EEV. As shown in Figure 1, the R-EEV is driven by the front axle. The regenerative braking system consists of two systems: hydraulic braking system and an electric braking system. Four wheels are equipped with regulating valves, so each wheel can be controlled independently by braking controller.
The optimal control of braking efficiency and energy recovery cannot be guaranteed with fixed slip ratio on different tire–road adhesion conditions. Through monitoring and identification of tire–road adhesion conditions in real time, the OSR is output as the control target value to ensure braking performance [18,19]. Process of IRBCS based on OSR is shown in Figure 2.
When braking starts, hydraulic brake control unit judges the battery state of charge (SoC). If SoC ≥0.8, it means battery energy is high, the RBS is not carried out and the wheels are braked by hydraulic braking system. If SoC<0.8 and Vvehic>0, the RBS start to work and braking torque distributed between front wheels with regenerative braking torque and rear wheels with hydraulic braking torque provided by the motor. If the regenerative braking torque can provide sufficient required braking torque, the front wheel braking torque is all provided by the regenerative braking torque. If the regenerative braking torque cannot provide sufficient required braking torque, the front wheel braking torque is provided by the regenerative braking torque and the hydraulic braking torque.

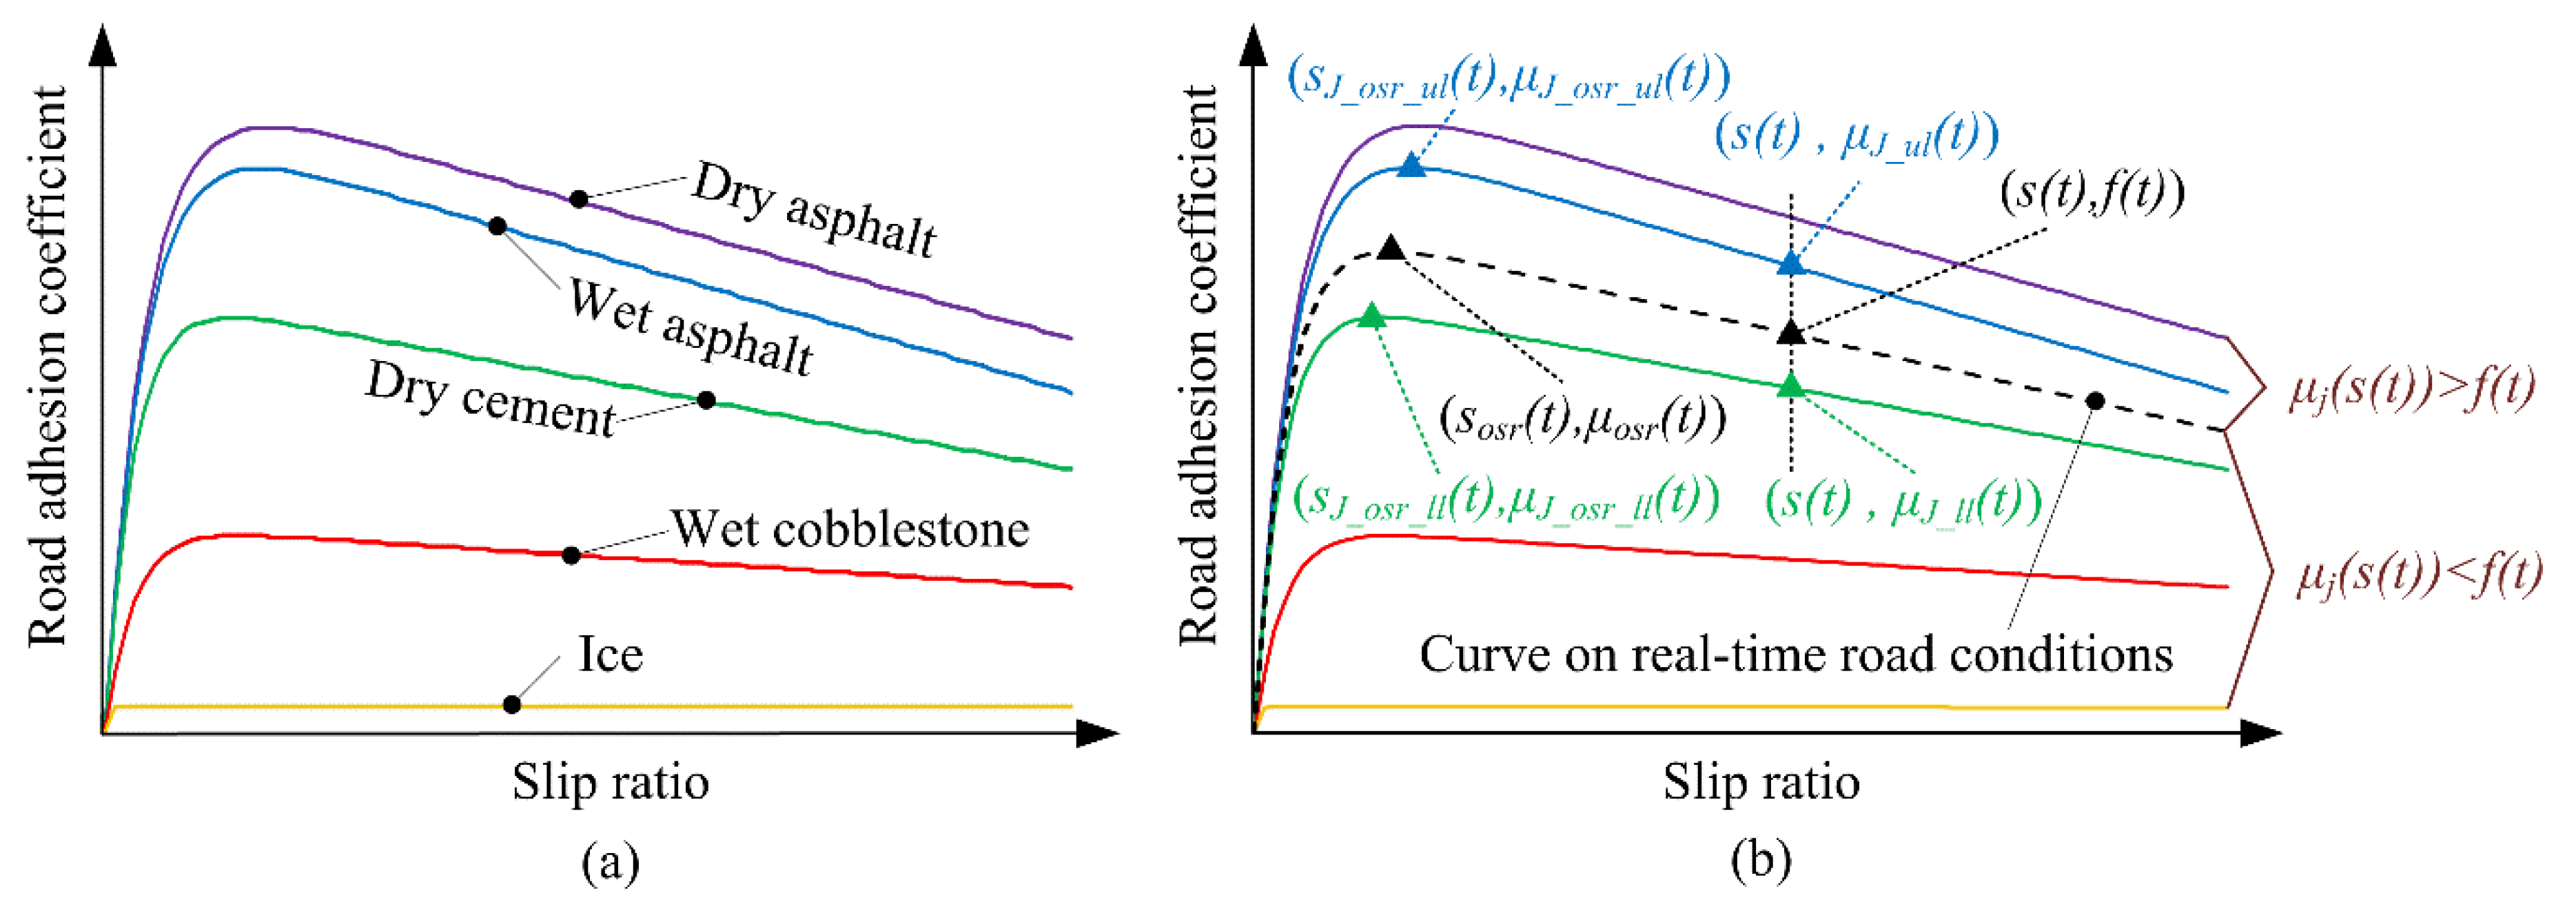
2.2. Tire–Road Adhesion Coefficient Recognition Module (TACRM)

Through TACRM, the tire–road adhesion coefficient (TAC) is estimated in real time and the real-time optimal slip ratio (sosr (t)) and real-time tire–road adhesion coefficient (μosr (t)) are outputted. Several mature tire–road models based on empirical and analytical can be selected [13]. A braking force distribution strategy is proposed in [19] based on the estimation of the tire–road friction coefficient using a fuzzy logic estimation approach. In this paper, the empirical model ‘Burckhardt tire model’ is selected because of its suitability for tire behavior simulation, as shown in Figure 3a and Table 1. The equation of the ‘Burckhardt tire model’ is expressed as follows:
μ ( s ) = C 1 ( 1 e C 2 s ) C 3 s
As shown in Figure 3b, the peak tire–road adhesion coefficient on j-th road (μj(s(t))) can be calculated by substituting the real-time slip ratio (s(t)). The utilization adhesion coefficient (f(t)) is calculated as follows:
f ( t ) = F x _ a d h e s i o n F z _ v e r t i c a l
where Fx_adhesion is the wheel longitudinal adhesion force; Fz_vertical is the wheel vertical force.
When μj(s(t))>f(t), the upper limit value of TAC J_ul(t)) is calculated as follows:
μ J _ u l ( t ) = min [ μ j ( s ( t ) ) ]
When μj(s(t))f(t), the lower limit value of TAC J_ll(t)) is calculated as follows:
μ J _ l l ( t ) = max [ μ j ( s ( t ) ) ]
The upper and lower limit values of OSR (sJ_osr_ul(t), sJ_osr_ll(t)), upper and lower limit value of real-time tire–road adhesion coefficient (μJ_osr_ul(t), μJ_osr_ll(t)) on the j-th road are obtained using a look-up table. Then, the distribution proportion coefficient (kr) is defined as follows:
k r = μ J _ o s r _ u l ( t ) f ( t ) μ J _ o s r _ u l ( t ) μ J _ o s r _ l l ( t )
Real-time optimal slip ratio (sosr(t)) and corresponded adhesion coefficient (μosr(t)) can be obtained as follows:
s o s r ( t ) = s J _ o s r _ u l ( t ) + k r s J _ o s r _ u l ( t ) k r s J _ o s r _ l l ( t )
μ o s r ( t ) = μ J _ o s r _ u l ( t ) k r μ J _ o s r _ u l ( t ) + k r μ J _ o s r _ l l ( t )

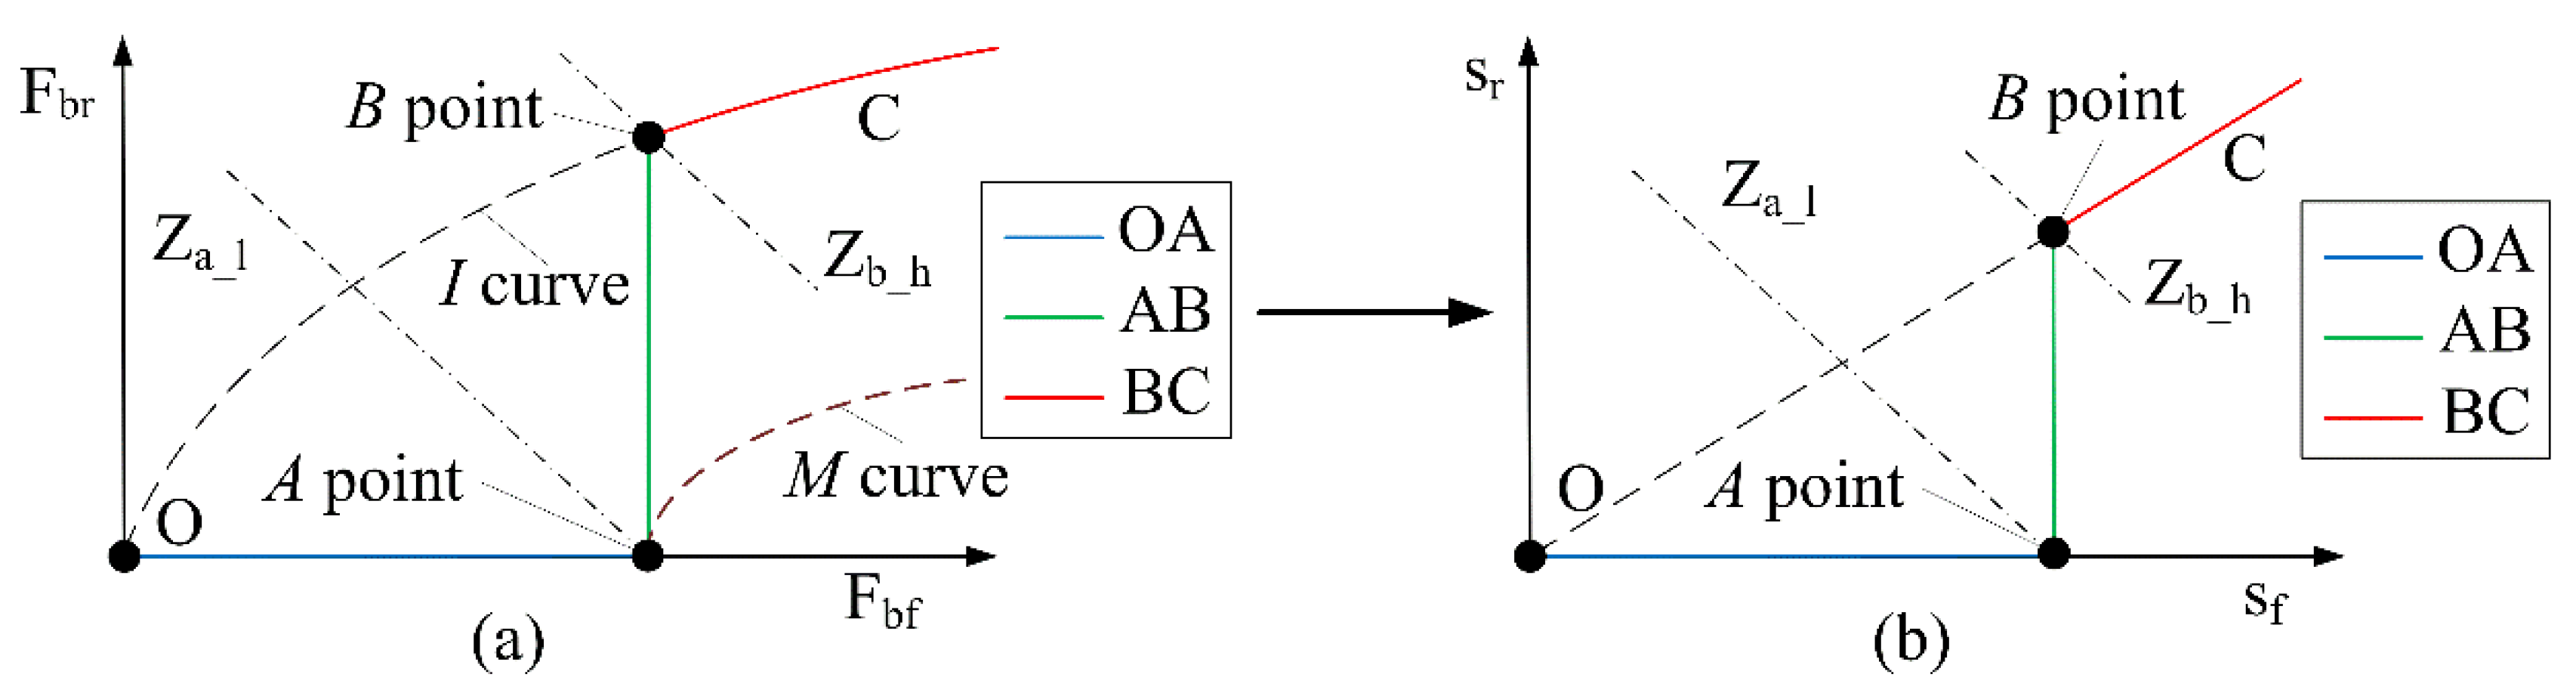
2.3. Distribution of Front and Rear Slip Ratio

The braking working point is located on the ideal braking force distribution curve (I curve). Making the best use of the tire–road adhesion conditions can maximize the braking safety [20]. It is certain that the Economic Commission of Europe Regulation 13 needs to be considered for the braking force allocation to ensure braking safety in design process of RBCS. As shown in Figure 4a, the left intersection of the ECE regulation line (M curve) and the front wheel braking force axis (x-axis) is the maximum braking force value of working point A, which is also limited by the motor maximum torque (Tmot_max). It can ensure that all the braking working points obtained in RBCS are above the M curve to ensure braking safety.
When the braking working point is at point A, the braking strength is defined as the threshold of the low braking intensity (Za_1), and it is calculated as follows:
Z a _ l = W T max _ m o t i m g R
where m is the total mass of vehicle; R is the wheelbase; i is the transmission ratio.
W is the correction factor with the tire–road adhesion condition consideration, and it is calculated as follows:
W = { 0 , 0 μ max μ w _ l   ( μ max μ w _ l ) ( μ w _ h μ w _ l ) , μ w _ l μ max μ w _ h 1 ,   μ w _ h μ max
where μw_h is the threshold value of the high TAC; μw_l is the threshold value of the low TAC; μmax is the peak tire–road adhesion coefficient (PTAC).
When the required braking strength (Zreq) is less than Za_l, the front wheel braking torque is provided by the regenerative braking torque totally. If the regenerative braking torque provides insufficient required braking torque, the motor remains at the maximum torque, and the insufficient braking force would be compensated by the hydraulic braking system until reaching point B on I curve. As shown in Figure 4a, When the braking working point is at point B, the braking strength is defined as the threshold of the high braking intensity (Zb_h), which is calculated as follows:
Z b _ h = m f 2 + 4 Z a _ l h g / l m f 2 h g / l
where mf is the front axle mass distribution coefficient; hg is the centroid height.
If Zreq> Zb_h, the front and rear wheel braking force distribution is performed according to the I curve, that is, the BC segment coincides with the I curve.
The ideal braking force distribution control is realized by controlling the front and rear slip ratio under braking process [6]. As shown in Figure 4b, the relationship between braking force and the slip ratio is derived according to the braking dynamics theory. The distribution values of front wheel slip rate slip ratio (sf) and rear wheel slip rate slip ratio (sr) in three braking stages are described as follows:
(1)
OA stage: full regenerative braking
s f = μ f 1 [ Z a _ l m f + Z r e q h g / l ] , s r = 0
(2)
AB stage: hydraulic braking compensation
s f = μ f 1 [ Z a _ l m f + Z r e q h g / l ] , s r = μ r 1 [ Z r e q Z a _ l m f Z r e q h g / l ]
(3)
BC stage: coordination braking on the I curve
s f = μ f 1 [ Z r e q ] , s r = μ r 1 [ Z r e q ]

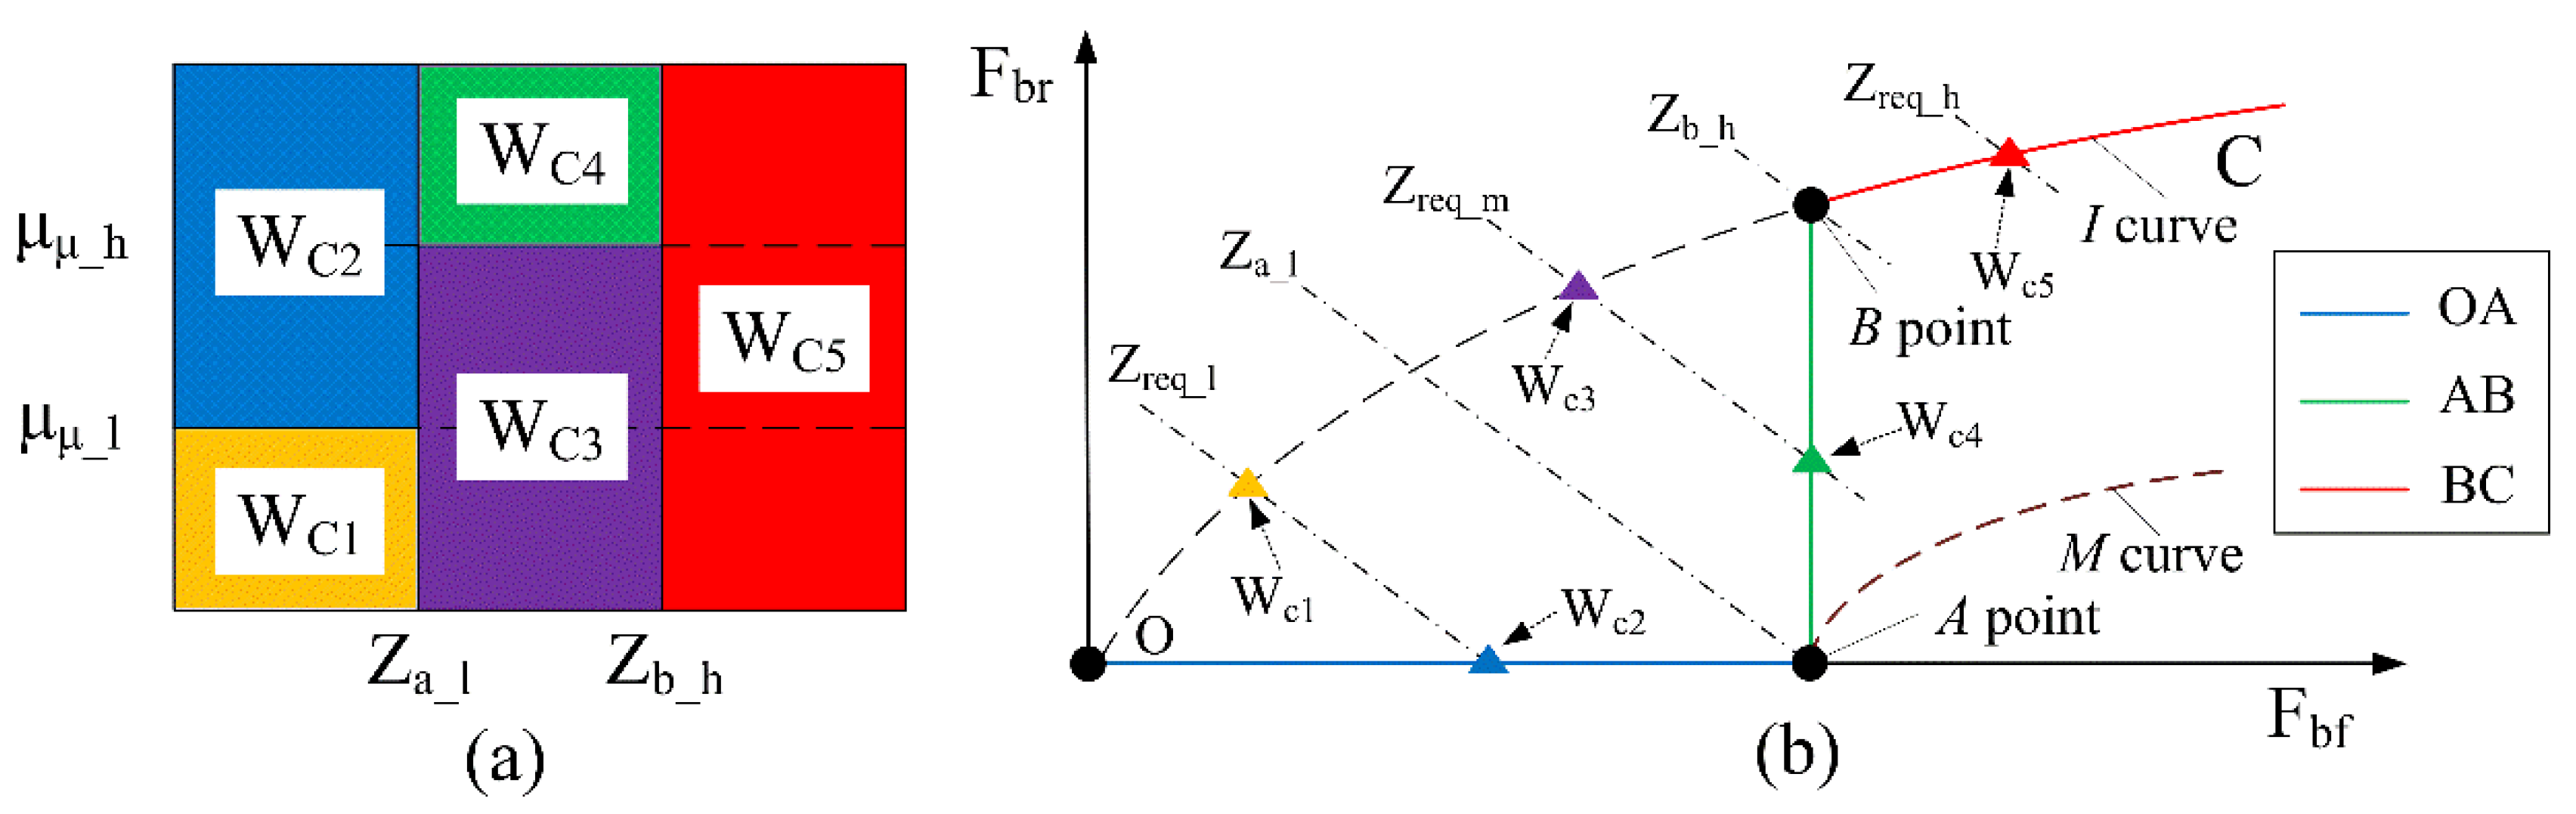
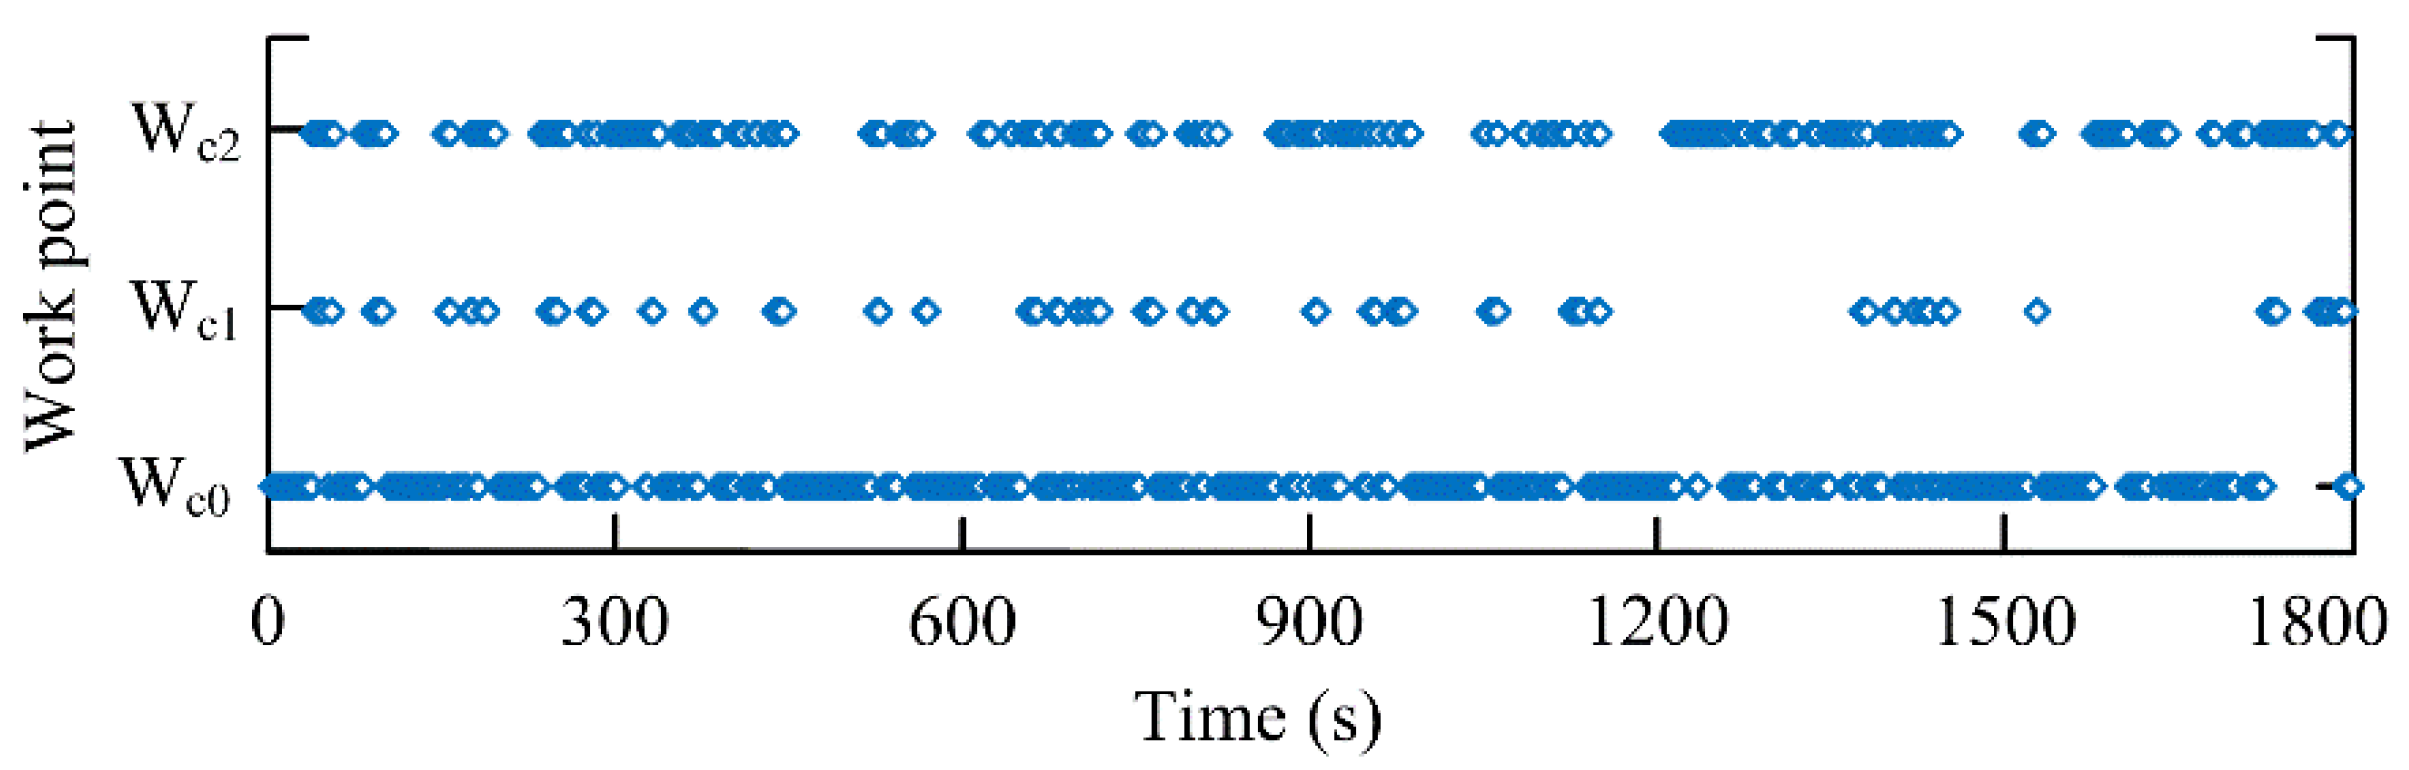
2.4. Allocation of Braking Work-Point

The allocation logic of braking work-point is a major part of IRBCS, and it determines the efficiency of IRBCS. The braking work-point in IRBCS is divided into five types in this paper, as shown in Figure 5.
As shown in Figure 5a, μμ_h and μμ_l are the high tire–road adhesion threshold value and the low tire–road adhesion threshold value, respectively. The allocation logic of braking work-point in IRBCS is as follows: (1) Mild braking (Zreq_l< Za_l): when the PTAC is small(μmax<μμ_l), such as ice road, the wheel has the risk of locking and slipping in braking process. Therefore, the braking work-point should follow the I curve on work-point 1 (WC1) to ensure the braking efficiency. If the PTAC is better (μmax>μμ_l), the braking work-point should follow the “OA” curve on work-point 2 (WC2). The front wheel braking torque is provided by the motor and the rear wheel hydraulic force is 0. (2) Moderate braking (Zb_h>Zreq_m>Za_l), when the PTAC is not high enough (μmax<μμ_h), there is also a risk of locking slip due to the significant braking strength. Therefore, the braking work-point should follow the I curve on work-point 3 (WC3) to ensure the braking efficiency. If the PTAC is high (μmax>μμ_h), the braking work-point should follow the “AB” curve on work-point 4 (WC4) to achieve good braking efficiency while maximizing braking energy recovery. (3) In the emergency braking condition (Zreq_h>Zb_h), there is a risk of locking slip due to the significant braking strength. Therefore, the braking work-point should follow the I curve on work-point 5 (WC5) to ensure the braking efficiency. The rear wheel braking torque is provided by hydraulic braking system. The motor provides its maximum regenerative torque applied at the front wheels.

3. Verification and Discussion of IRBCS in Simulation Environment

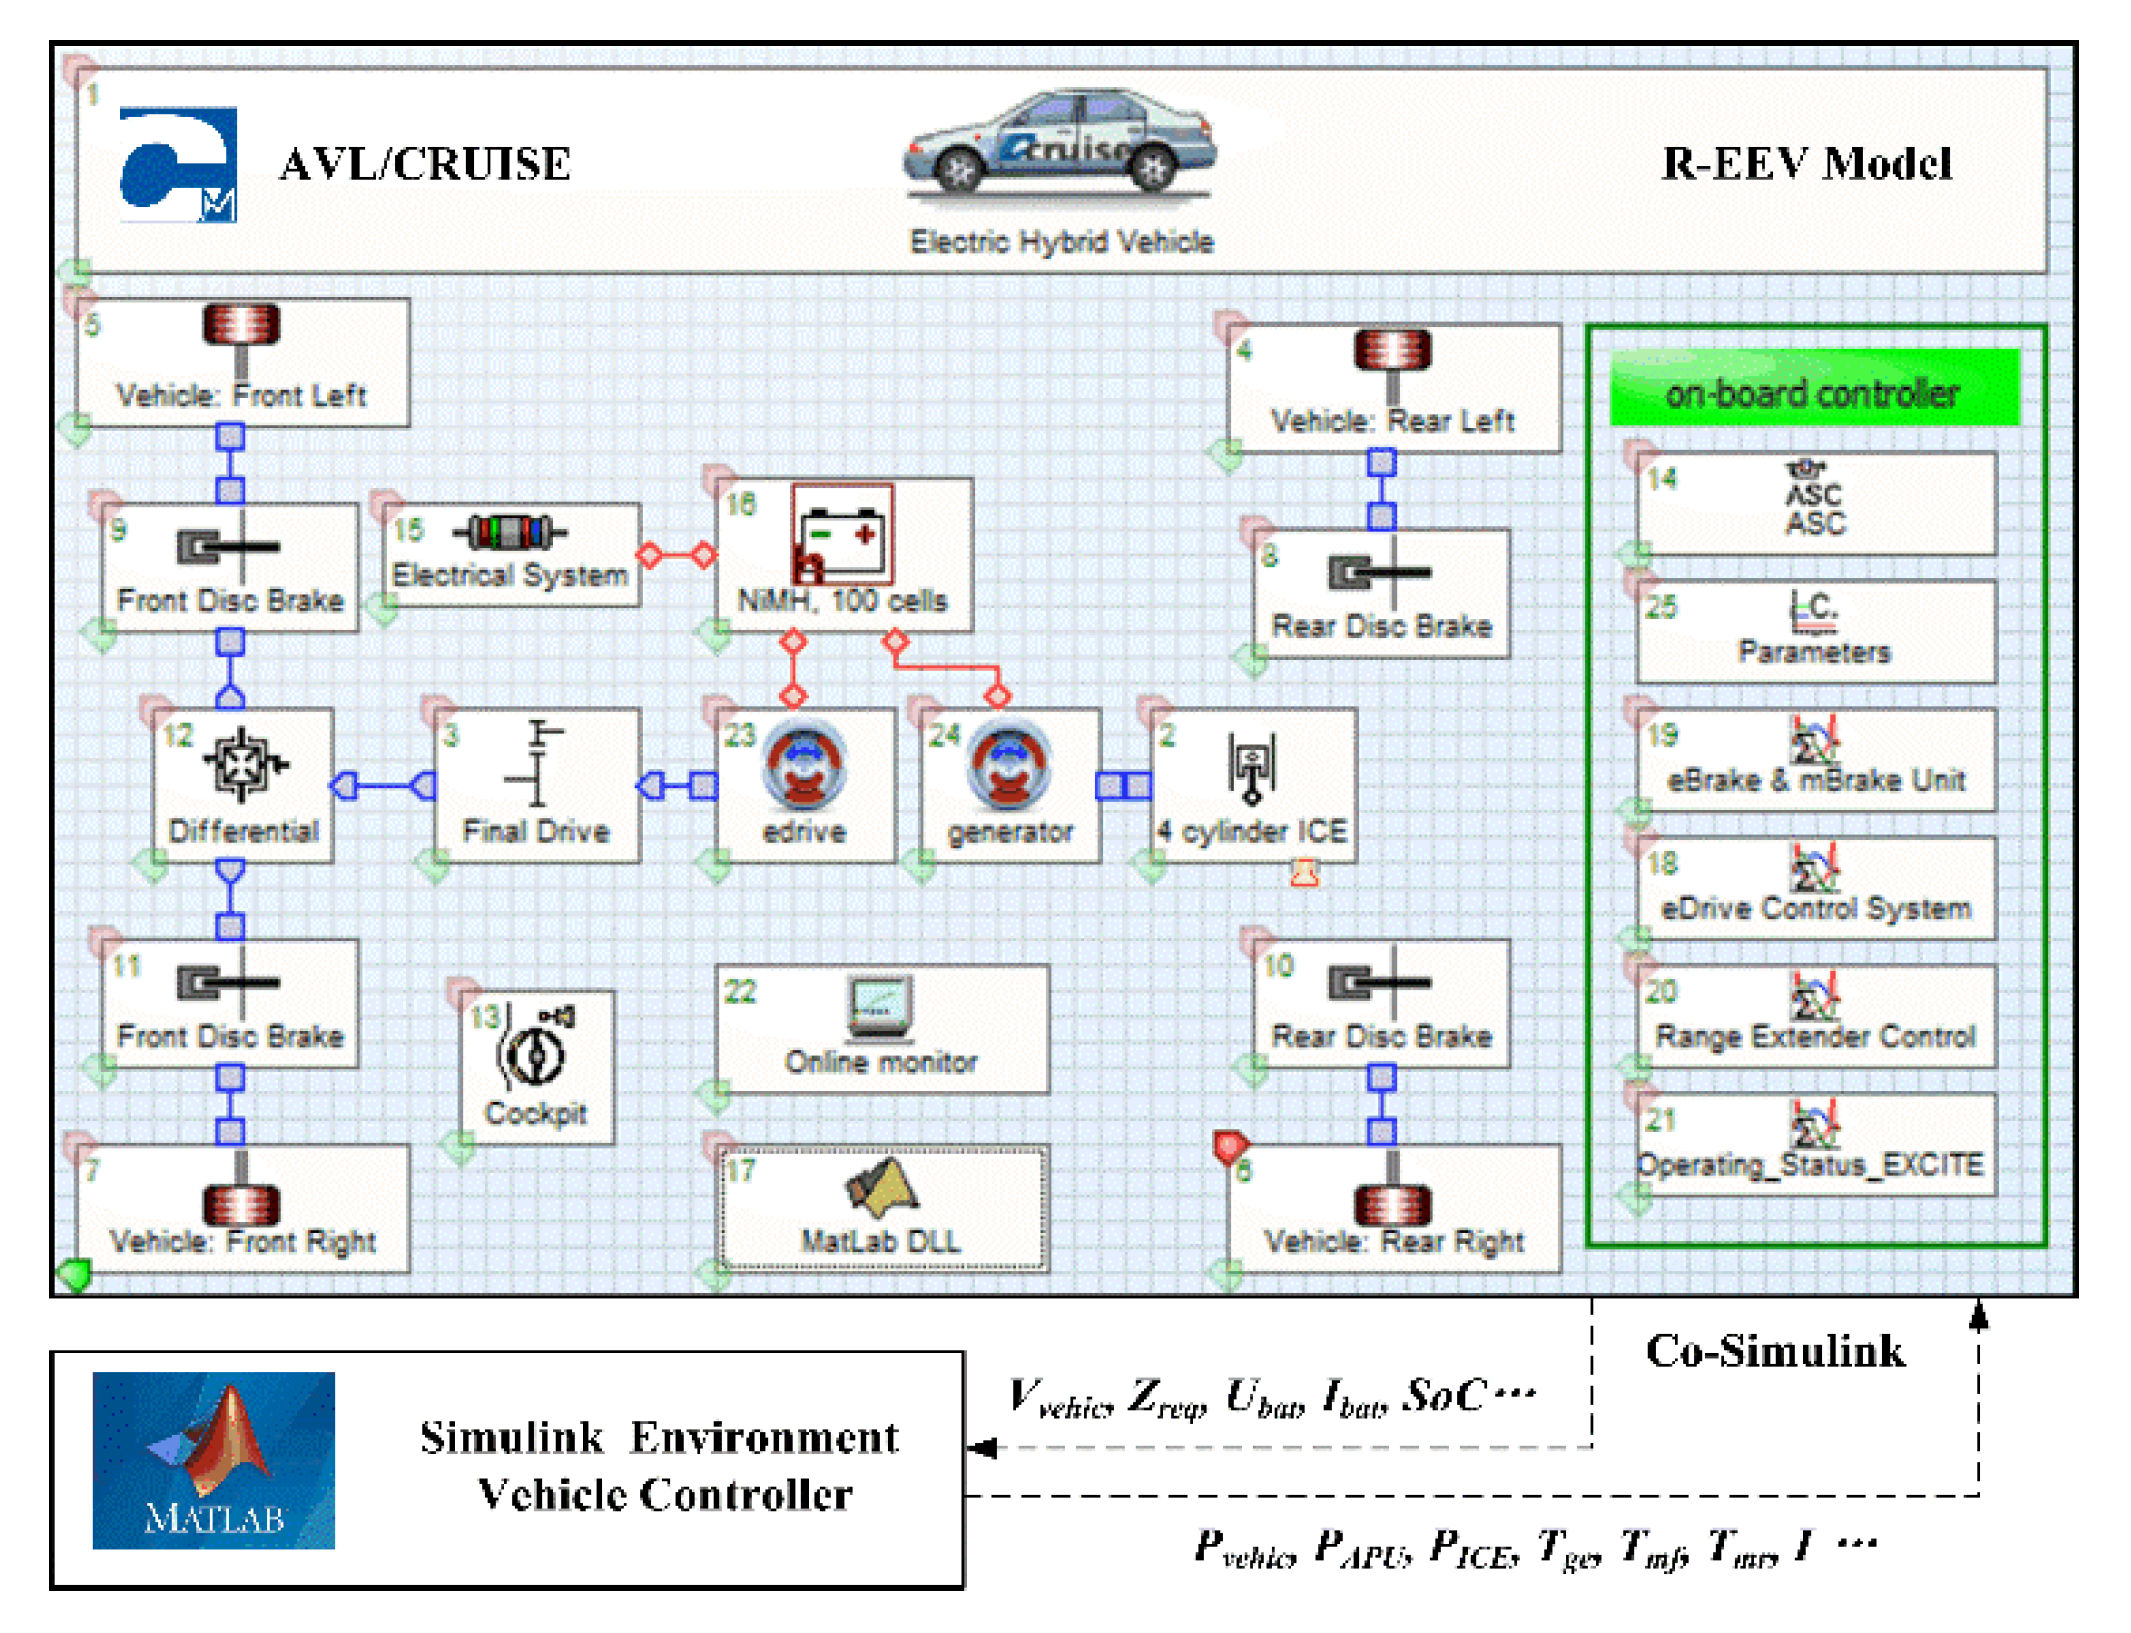
3.1. Simulation Model of R-EEV

In this section, simulation experiments are performed in MATLAB/Simulink and AVL/Cruise software (version 2014, AVL List GmbH, Austria) to evaluate the control effect of IRBCS. As shown in Figure 6, the vehicle dynamics model of R-EEV, including regenerative braking system is established in Cruise software. The vehicle performance simulation calculations are performed in Cruise software. The IRBCS control strategy is performed on the Simulink software through the API function software provided by Cruise. Signals such as traction and braking, battery SoC and Vvehic are transmitted between Cruise and Simulink. The main parameters used in the simulation are shown in Table 2.

3.2. Verification of TACRM

The TACRM proposed is verified by simulation test in this section. A co-simulation test is carried out based on the braking system model of R-EEV in simulation environment. In simulations, the initial braking speed is set at 80 km/h, and four tire–road conditions were set with PTAC of 0.6, 0.45, 0.2, and 0.1, respectively, as shown in Figure 7. The braking strength increases from 0 to 0.7 quickly to simulate emergency braking conditions, and it stabilizes at 0.5 until the vehicle speed is 0. The estimated value of the PTAC will be output in real time through the TACRM. The effectiveness and accuracy of the TACRM can be seen by comparing with the preset value of PTAC.
The interpolation calculation method is used to estimate the tire–road adhesion condition in the four types of tire–roads, and it can effectively and accurately estimate the PTAC in real time.

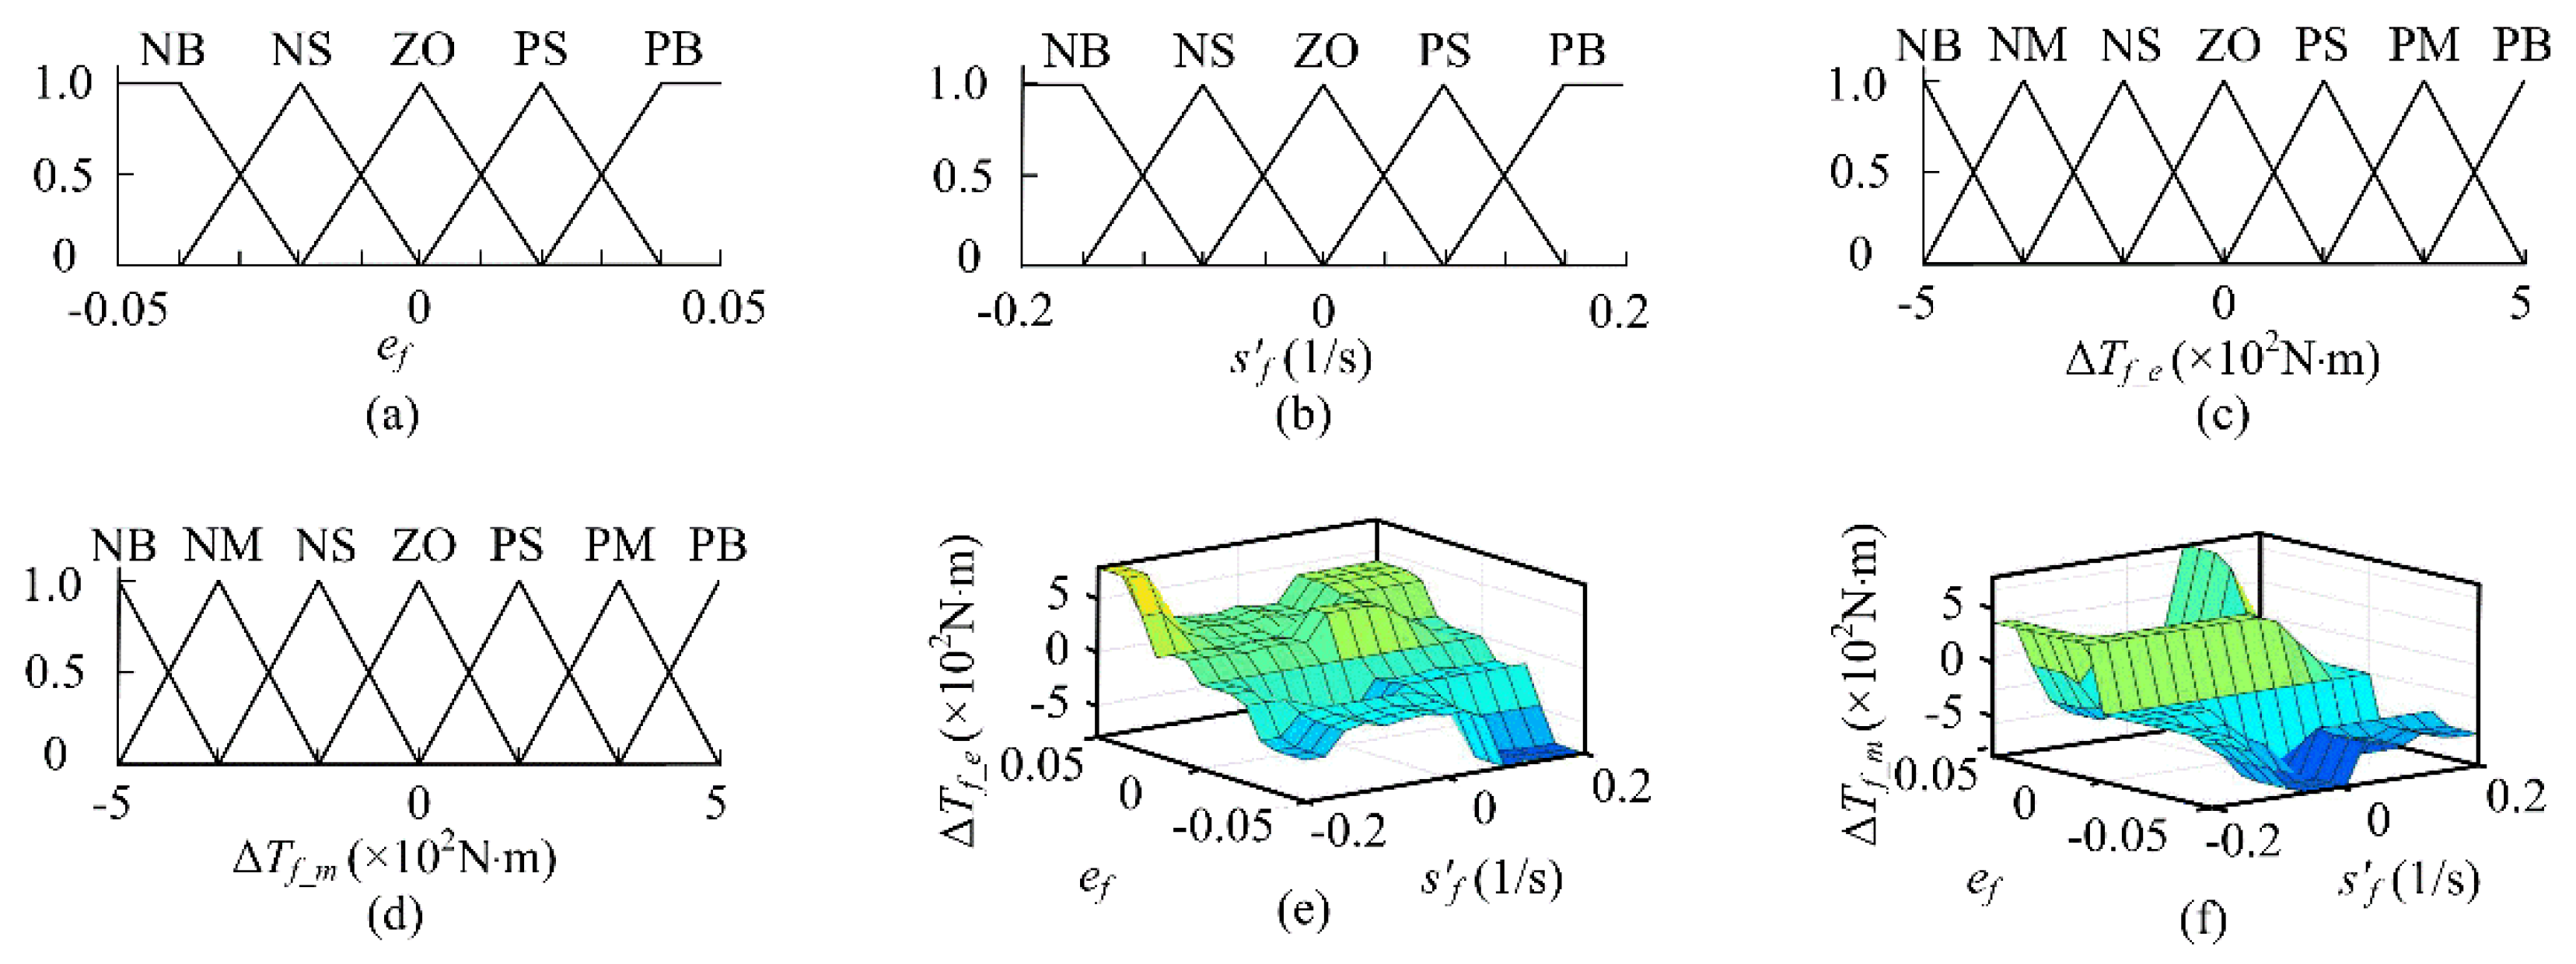
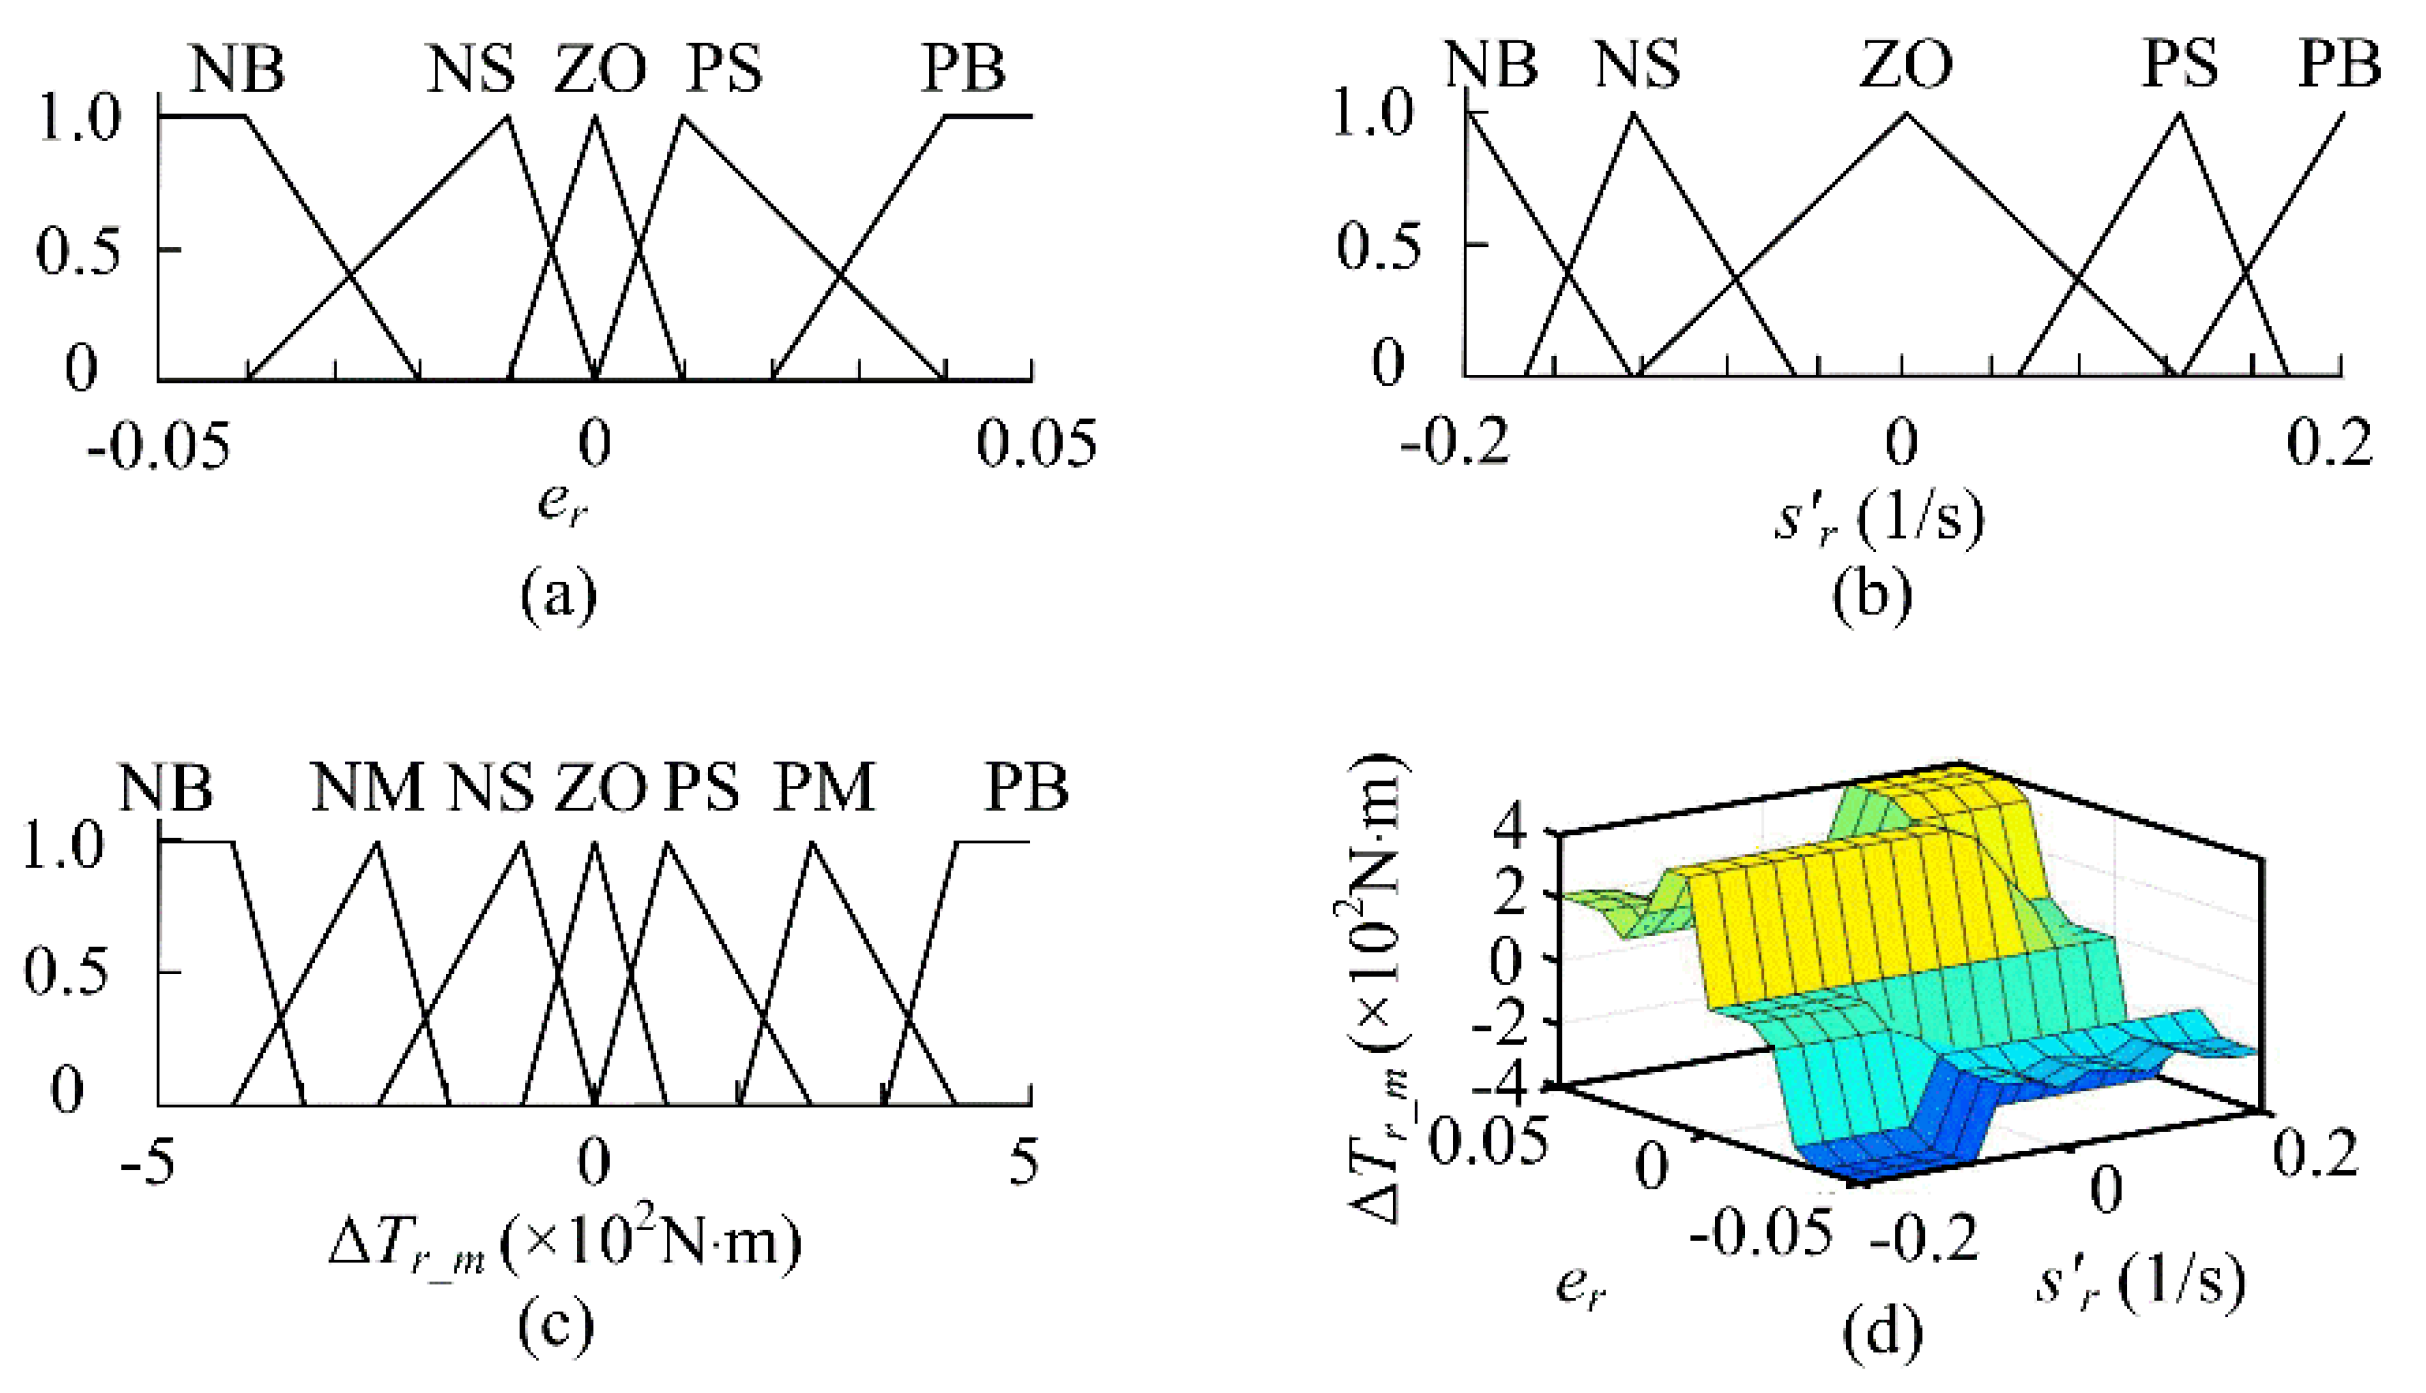
3.3. OSR Control Method By DFLC

The braking force distribution of the front and rear wheels is different. The membership function of the fuzzy controller and the formulation of the fuzzy rules are also different, which will affect the target slip ratio control result. Considering the difference of braking torque between front and rear wheels, the DFLC for front and rear wheels is designed to ensure OSR tracking control target values effectively, which is different from the fuzzy controllers in [9,13,21,22,23,24,25]. The requirement slip ratio (sreq(t)) can be obtained from the requirement braking strength calculation and real-time OSR (sosr(t)) can be outputted. The determination process of the real-time OSR control target (scsr(t)) of the control system is as follows: If sreq(t) <sosr(t), scsr(t) = sreq(t). Otherwise, scsr(t) = sosr(t). As shown in Figure 8, the double fuzzy logic controller is designed in this section.
The Mamdani method is used to perform the fuzzy logic calculation in this paper. Triangular shapes are selected for the membership functions of the inputs and outputs and five fuzzy sets are selected. As shown in Figure 9, in the fuzzy logic controller of front wheels, two inputs are the difference between the real slip ratio and the target slip ratio (ef(t)) and slip ratio change rate (s′f(t)). ef(t) ∈ (−0.05, 0.05), s′f(t) ∈ (−0.2, 0.2). The input universe is divided into 5 membership functions, which are negative large (NB), negative small (NS), zero (ZO), positive small (PS), positive large (PB). The outputs are the regenerative braking force adjustment value (ΔTf _e(t)) and the hydraulic braking force adjustment value (ΔTf_m (t)). ΔTf_m (t) ∈ (−500, 500), ΔTf _e(t) ∈ (−500, 500). The output universe is divided into 7 membership functions, which are negative large (NB), negative medium (NM), negative small (NS), zero (ZO), positive small (PS), positive medium (PM), and positive large (PB).
The fuzzy rules are the key part of the fuzzy controller. Taking the front wheel fuzzy controller as an example, its design principles are as follows: (1) When ef (t)<0: If s′f (t)>0, it means that sact(t) has approached scsr(t), and ΔTf should be PS or ZO. If s′f (t) = 0, it means that sact(t) is relatively small relative to scsr(t). There is no risk of slipping during braking due to the slip ratio is small, ΔTf should be PS or PM. if s′f (t)>0, it means that sact(t) has deviated greatly from scsr(t). In order to eliminate the target deviation as soon as possible, ΔTf is PB. (2) When ef (t) = 0: if s′f (t) ≤0, it means that sact(t) is closer to scsr(t), ΔTf should be PS or ZO. If s′f (t)>0, it means that sact(t) becomes larger, and the front wheel has the risk of slipping. ΔTf should be NS or NM. (3) When ef (t)>0: If s′f (t)>0, it means that sact(t) has deviated seriously from scsr(t), and the wheel has the risk of slipping. ΔTf should be NB or NM to reduce the slip ratio as soon as possible. If s′f (t) = 0, it means that sact(t) s relatively large relative to scsr(t). ΔTf should be NM or NS. If s′f (t)>0, it means that sact(t) is closer to scsr(t). ΔTf should be NS or ZO. The fuzzy control rules base of front wheel fuzzy controller is shown in Table 3.
As shown in Figure 10, in the fuzzy controller of rear wheels, two inputs are the difference between the real slip ratio and the target slip ratio (er(t)) and slip ratio change rate (s′r(t)). er(t) ∈ (−0.05, 0.05), s′r(t) ∈ (−0.2, 0.2). The output is the hydraulic braking force adjustment value of rear wheel ΔTr_m(t). ΔTr_m (t) ∈ (−500, 500). The selection and definition of the membership function are different with the front wheel fuzzy controller obviously. The possibility of sudden changes in rear wheel braking torque and the risk of overshoot fluctuations should be considered. The principles are roughly the same in the formulation of fuzzy rules. Compared with the front wheel controller, the selection of fuzzy rules should be softer.
The fuzzy control rules base of rear wheel fuzzy controller after repeated design adjustments is shown in Table 4.
Defuzzification is an important step in fuzzy inference system. There are many methods of defuzzification. The most common used methods are the maximum membership method, the center of gravity method, and the weighted average method. The weighted average method is selected in fuzzy controller for defuzzification, which is widely used in industrial control. The off-line calculation method is adopted to ensure the control accuracy and calculation speed, and the corresponding relationship between the observed value and the actual control value can be calculated using following equation:
X = i = 1 n ω i X i i = 1 n ω i
where X is the final value; n is the number of elements, ωi is the membership.

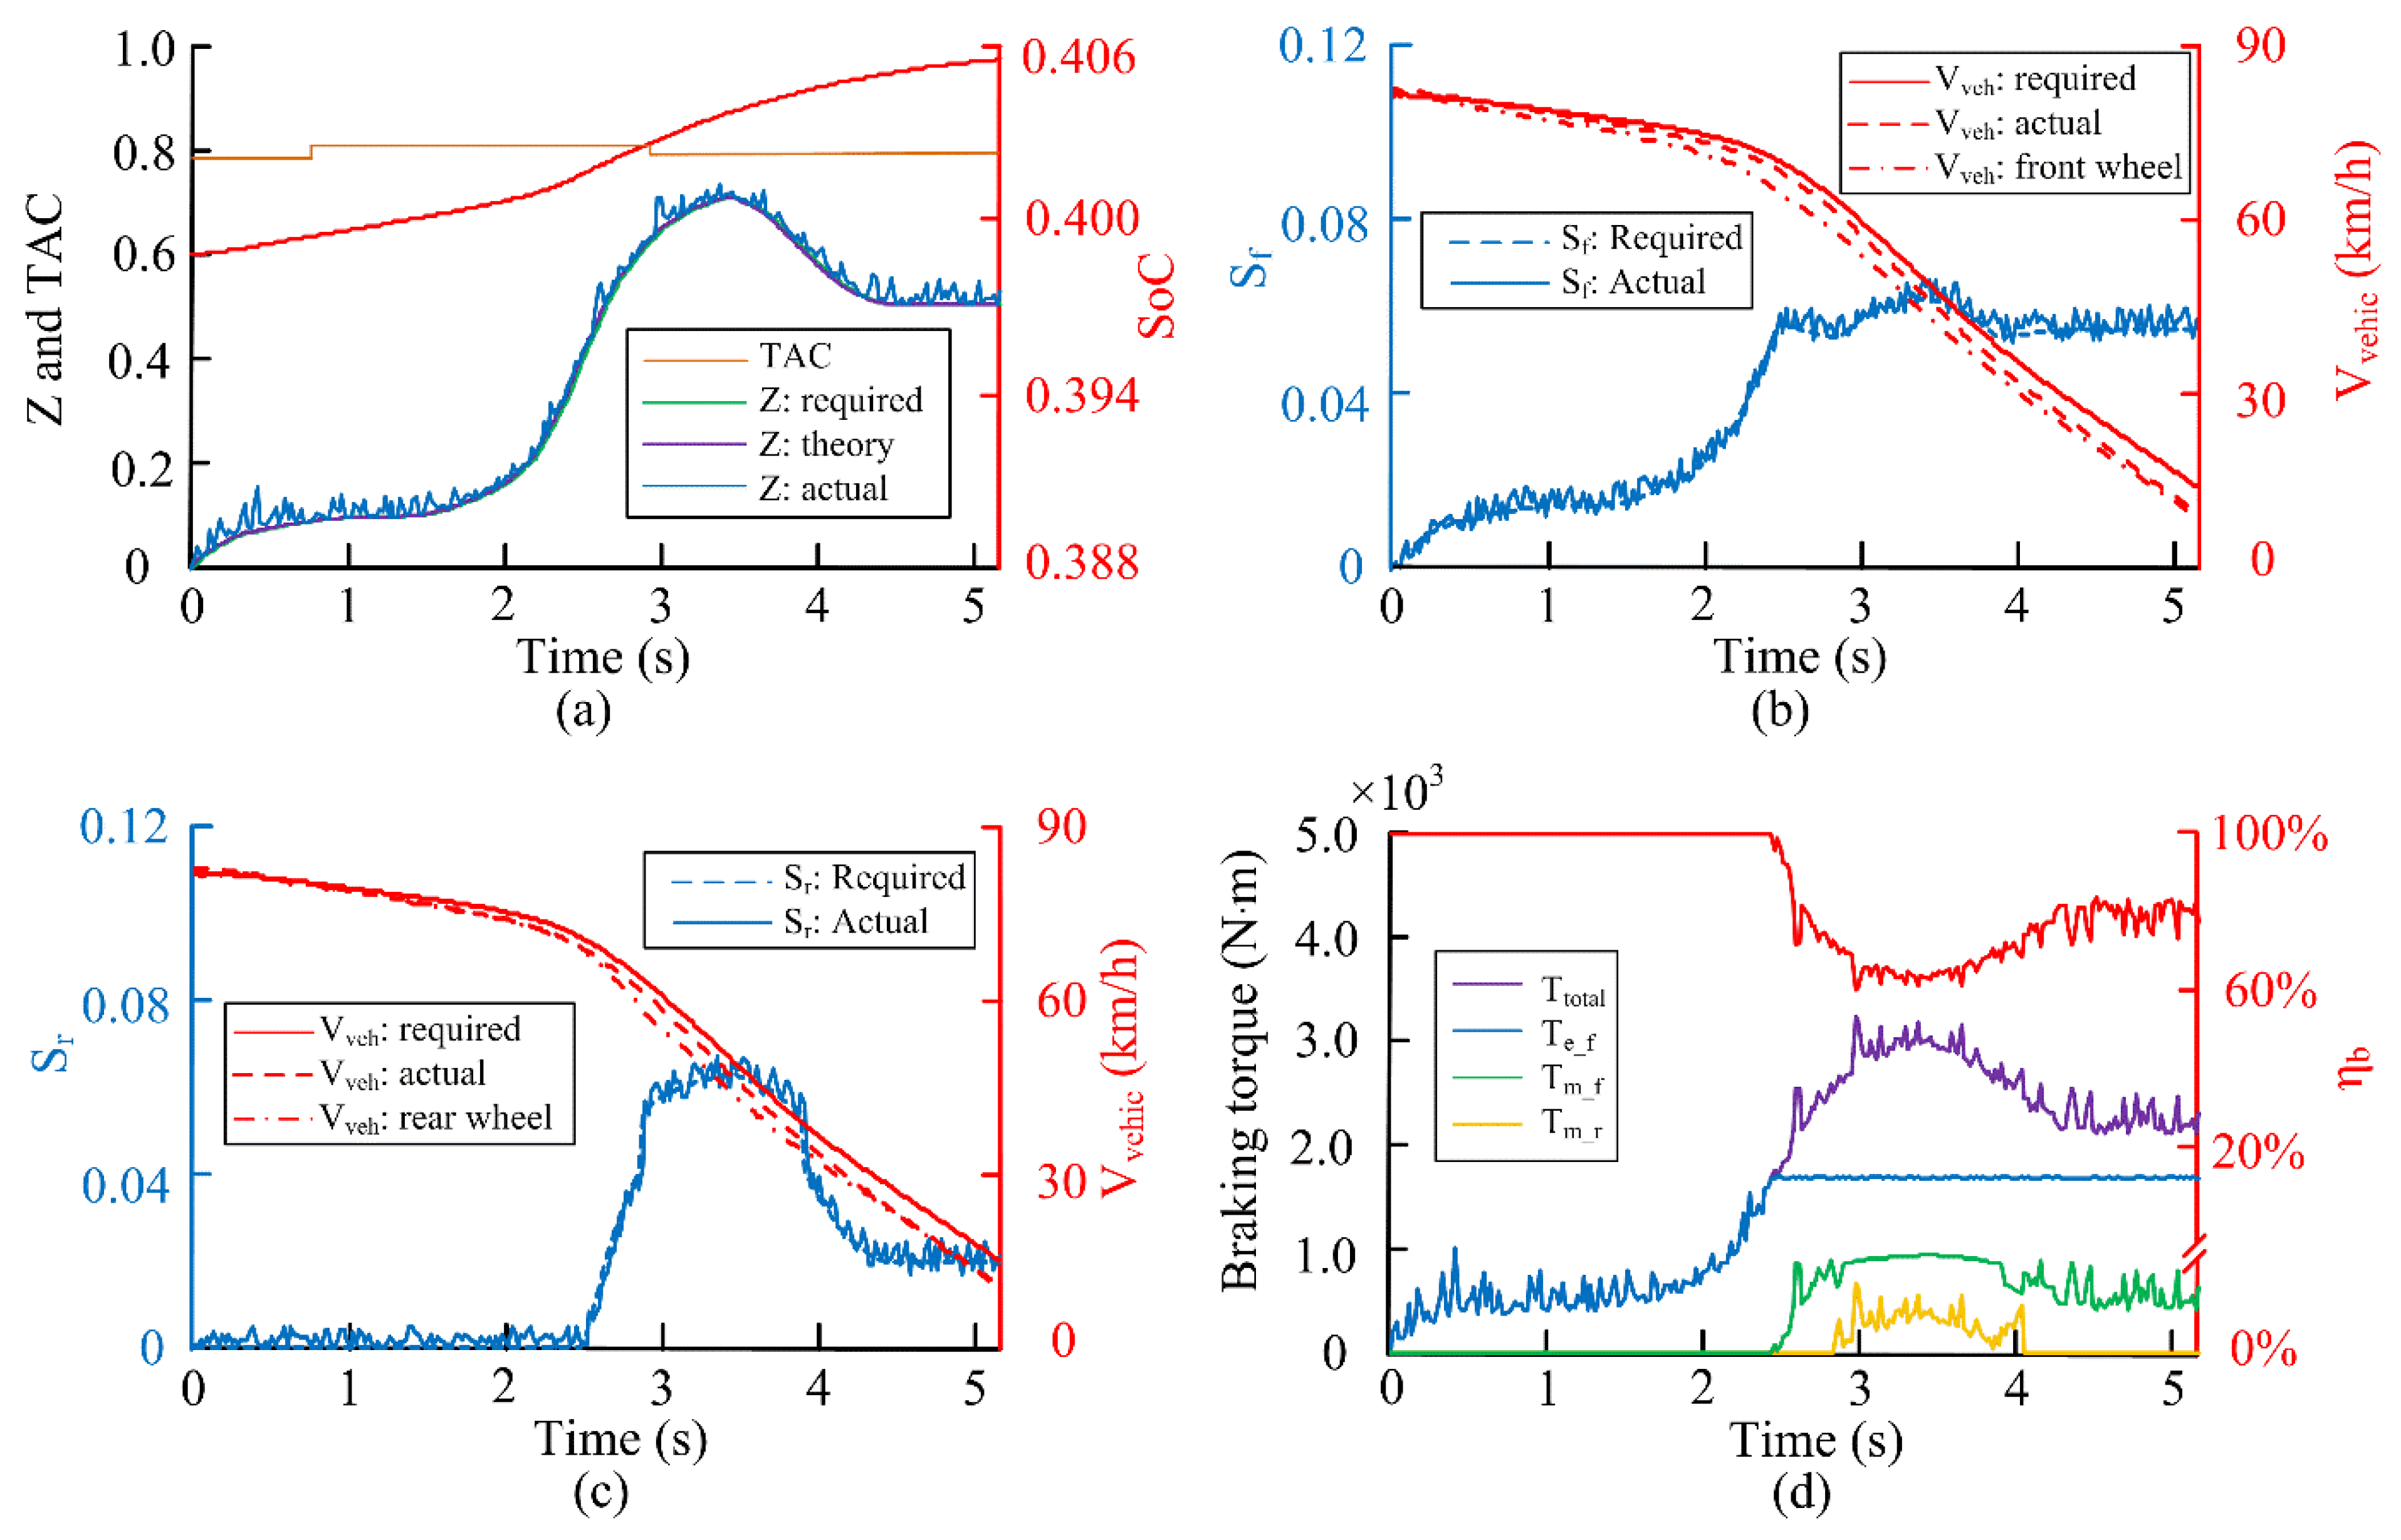
3.4. Simulation Analysis of IRBCS

Based on the simulation model of the regenerative braking system, the braking performance was tested to verify the effectiveness of IRBCS and detect the control effect of the DFLC on the target slip ratio. In simulations, three different roads are set up, namely dry asphalt surface (μmax_h = 0.8), dry cement surface (μmax_m = 0.6) and wet cobblestone surface (μmax_l = 0.35). The initial braking speed is set at 80 km/h. The braking strength increases from 0 to 0.2 and then increases to 0.7 to simulate emergency braking conditions, and it stabilizes at 0.5 until the Vvehic = 0. Two evaluation indexes are used to evaluate the energy recovery performance of IRBCS. Evaluation parameter of regenerative braking efficiency (ηb) and energy recovery ratio (Cb_cyc) can be calculated using following equation:
η b = F f _ e F t o t a l × 100 %
C b _ c y c = E r e g e n _ o f f E r e g e n _ o n E r e g e n _ o f f × 100 %
where Ff_e is the regenerative braking force; Ftotal is the total demand force; Eregen_on is the energy consumed with RBS under the single braking test; Eregen_off is the energy consumed without RBS under the single braking test.
Cb_cyc can be expressed as the contribution rate of regenerative braking to the reduction of energy consumption. In order to make the simulation more realistic, the research uses the use of real-like sensor signals affected by errors. During the simulation process, the effects of errors are simulated by adding noise signals.

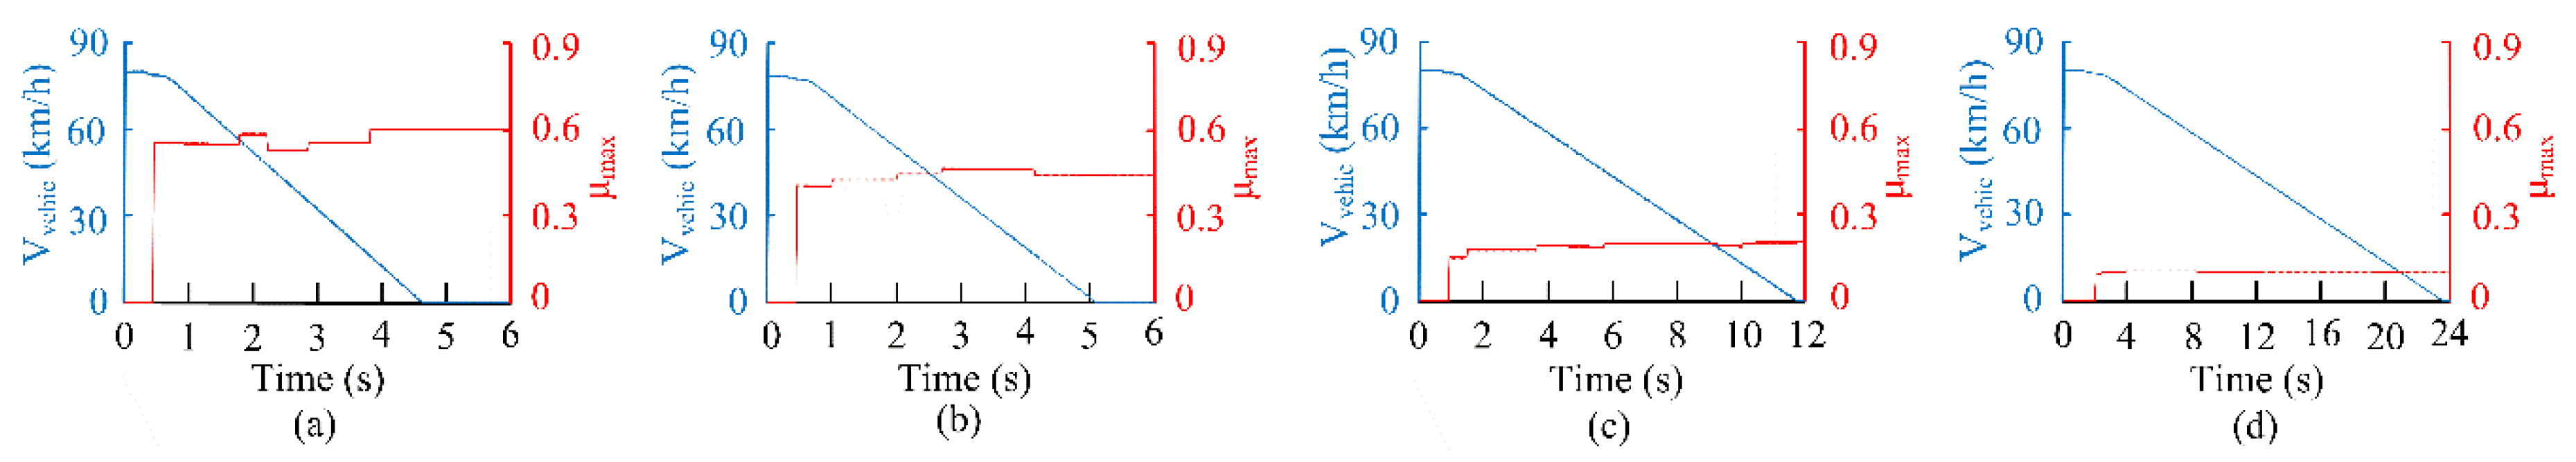
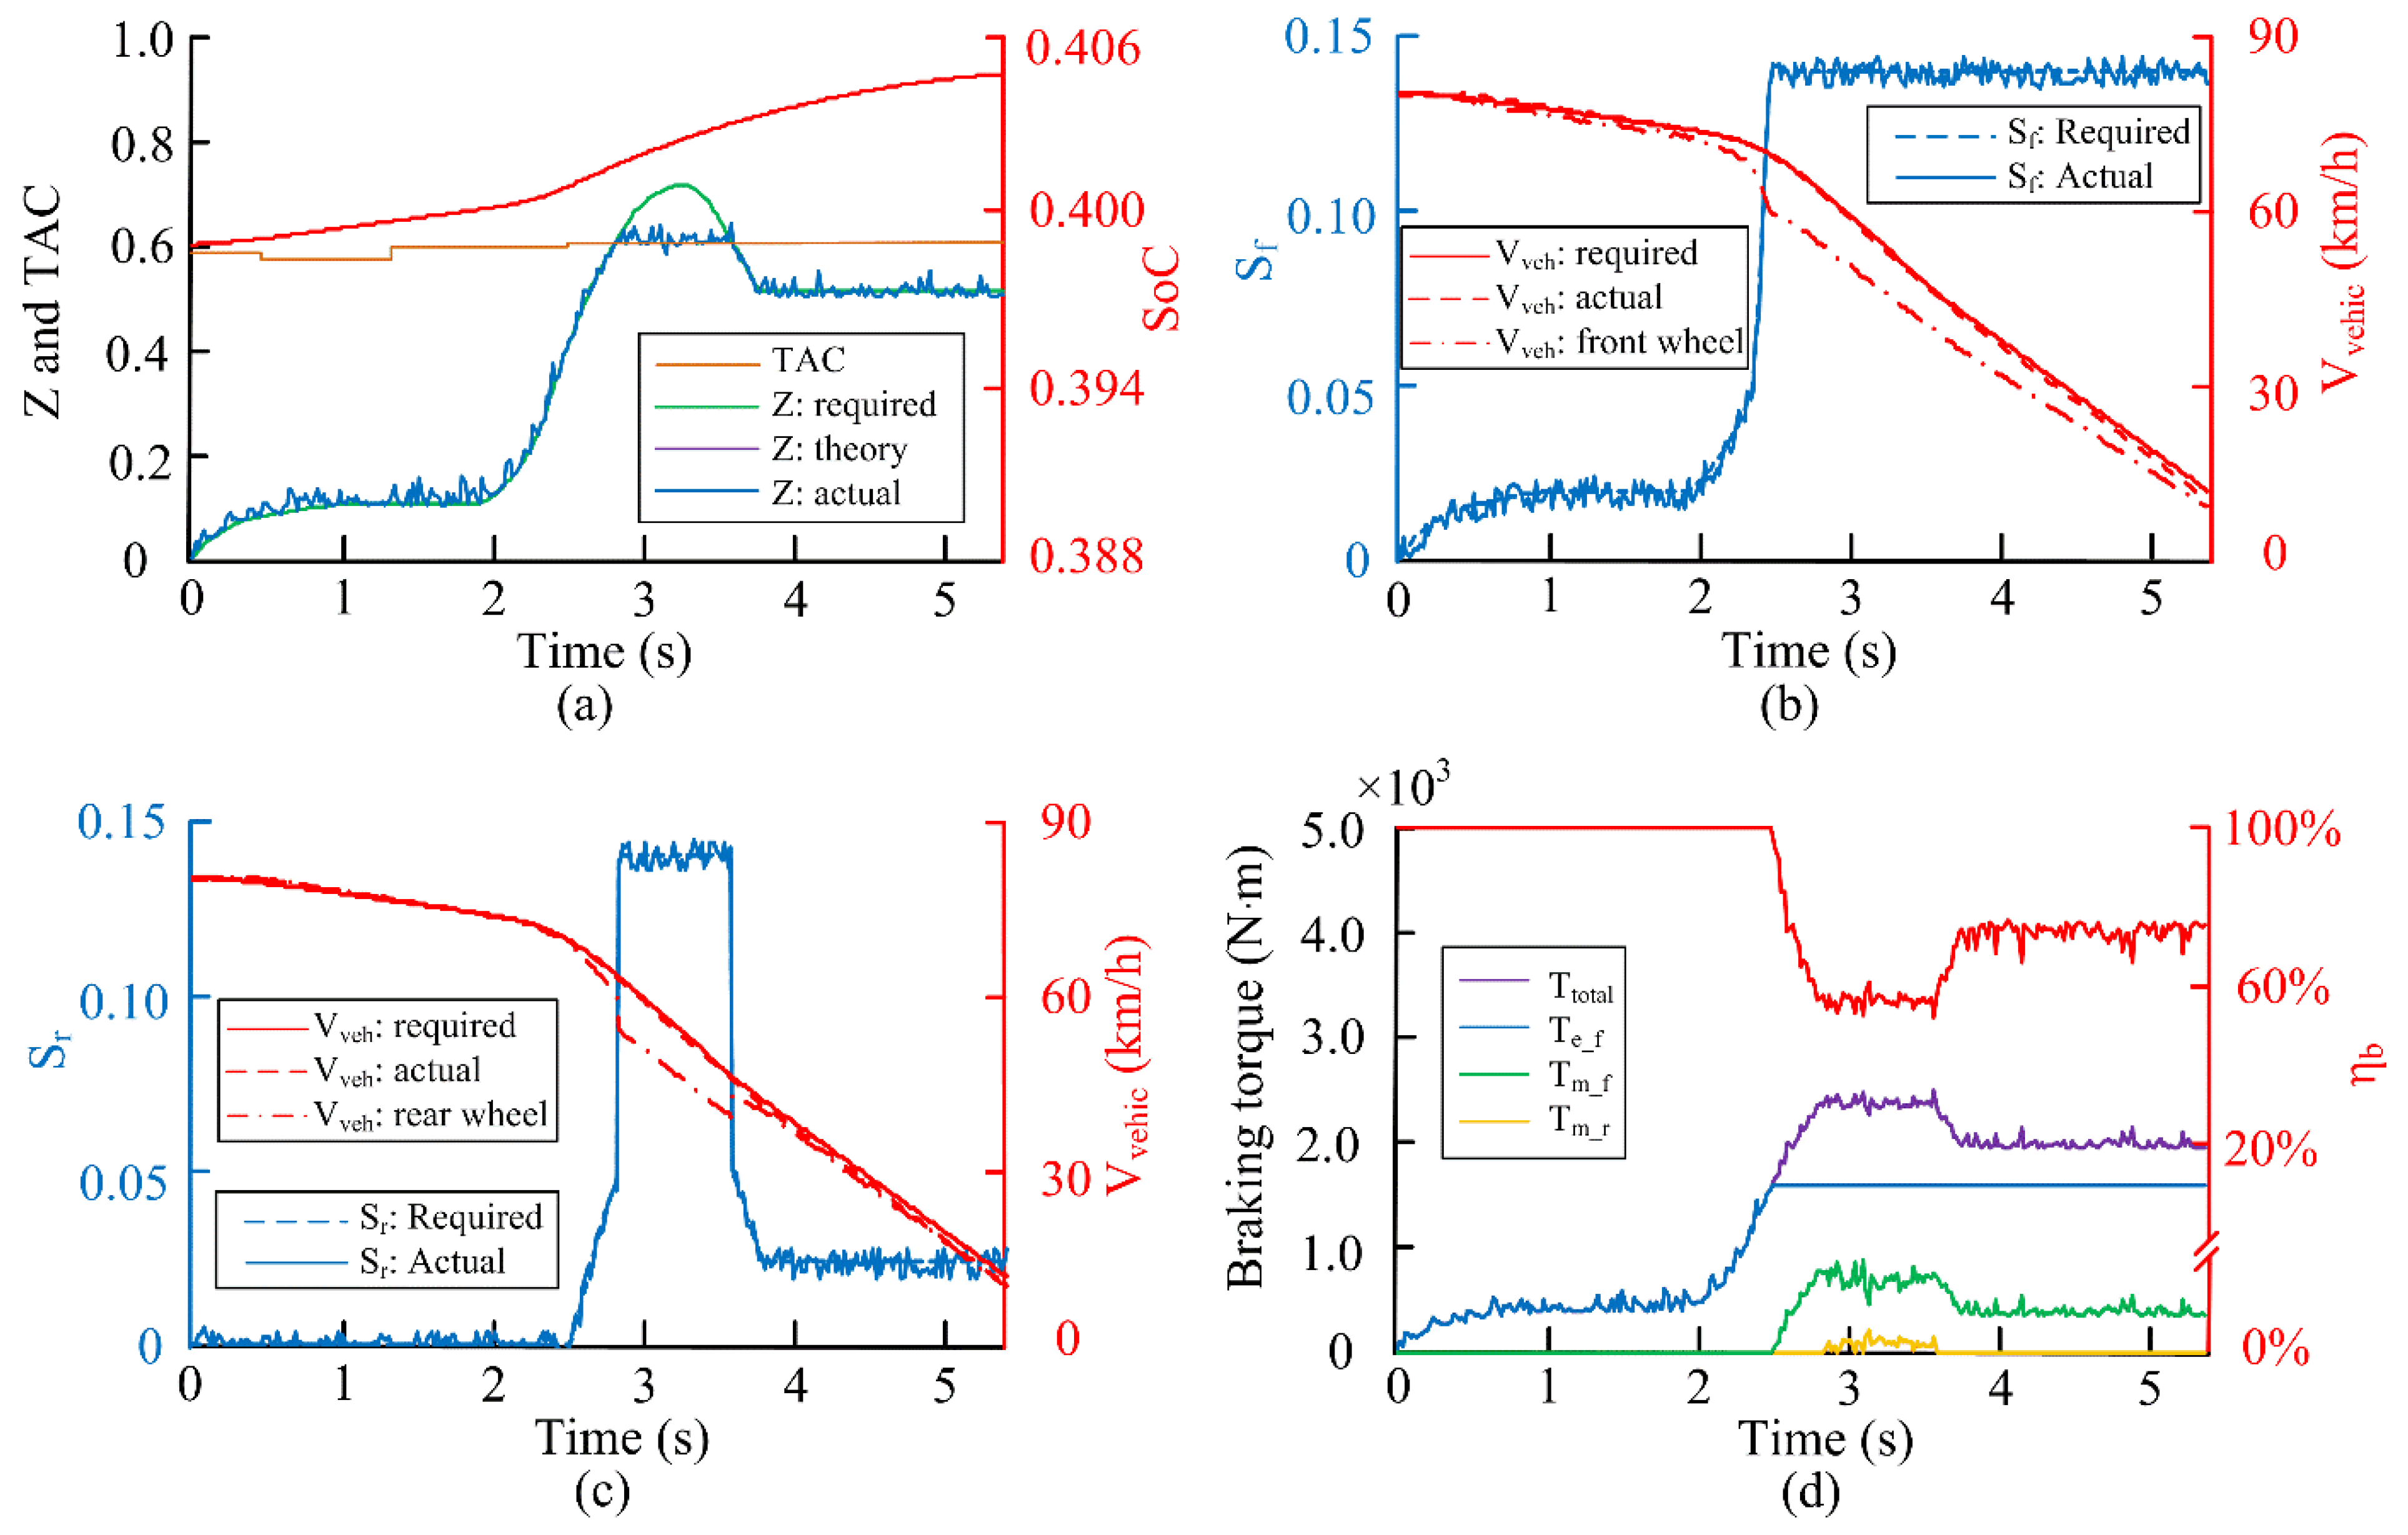
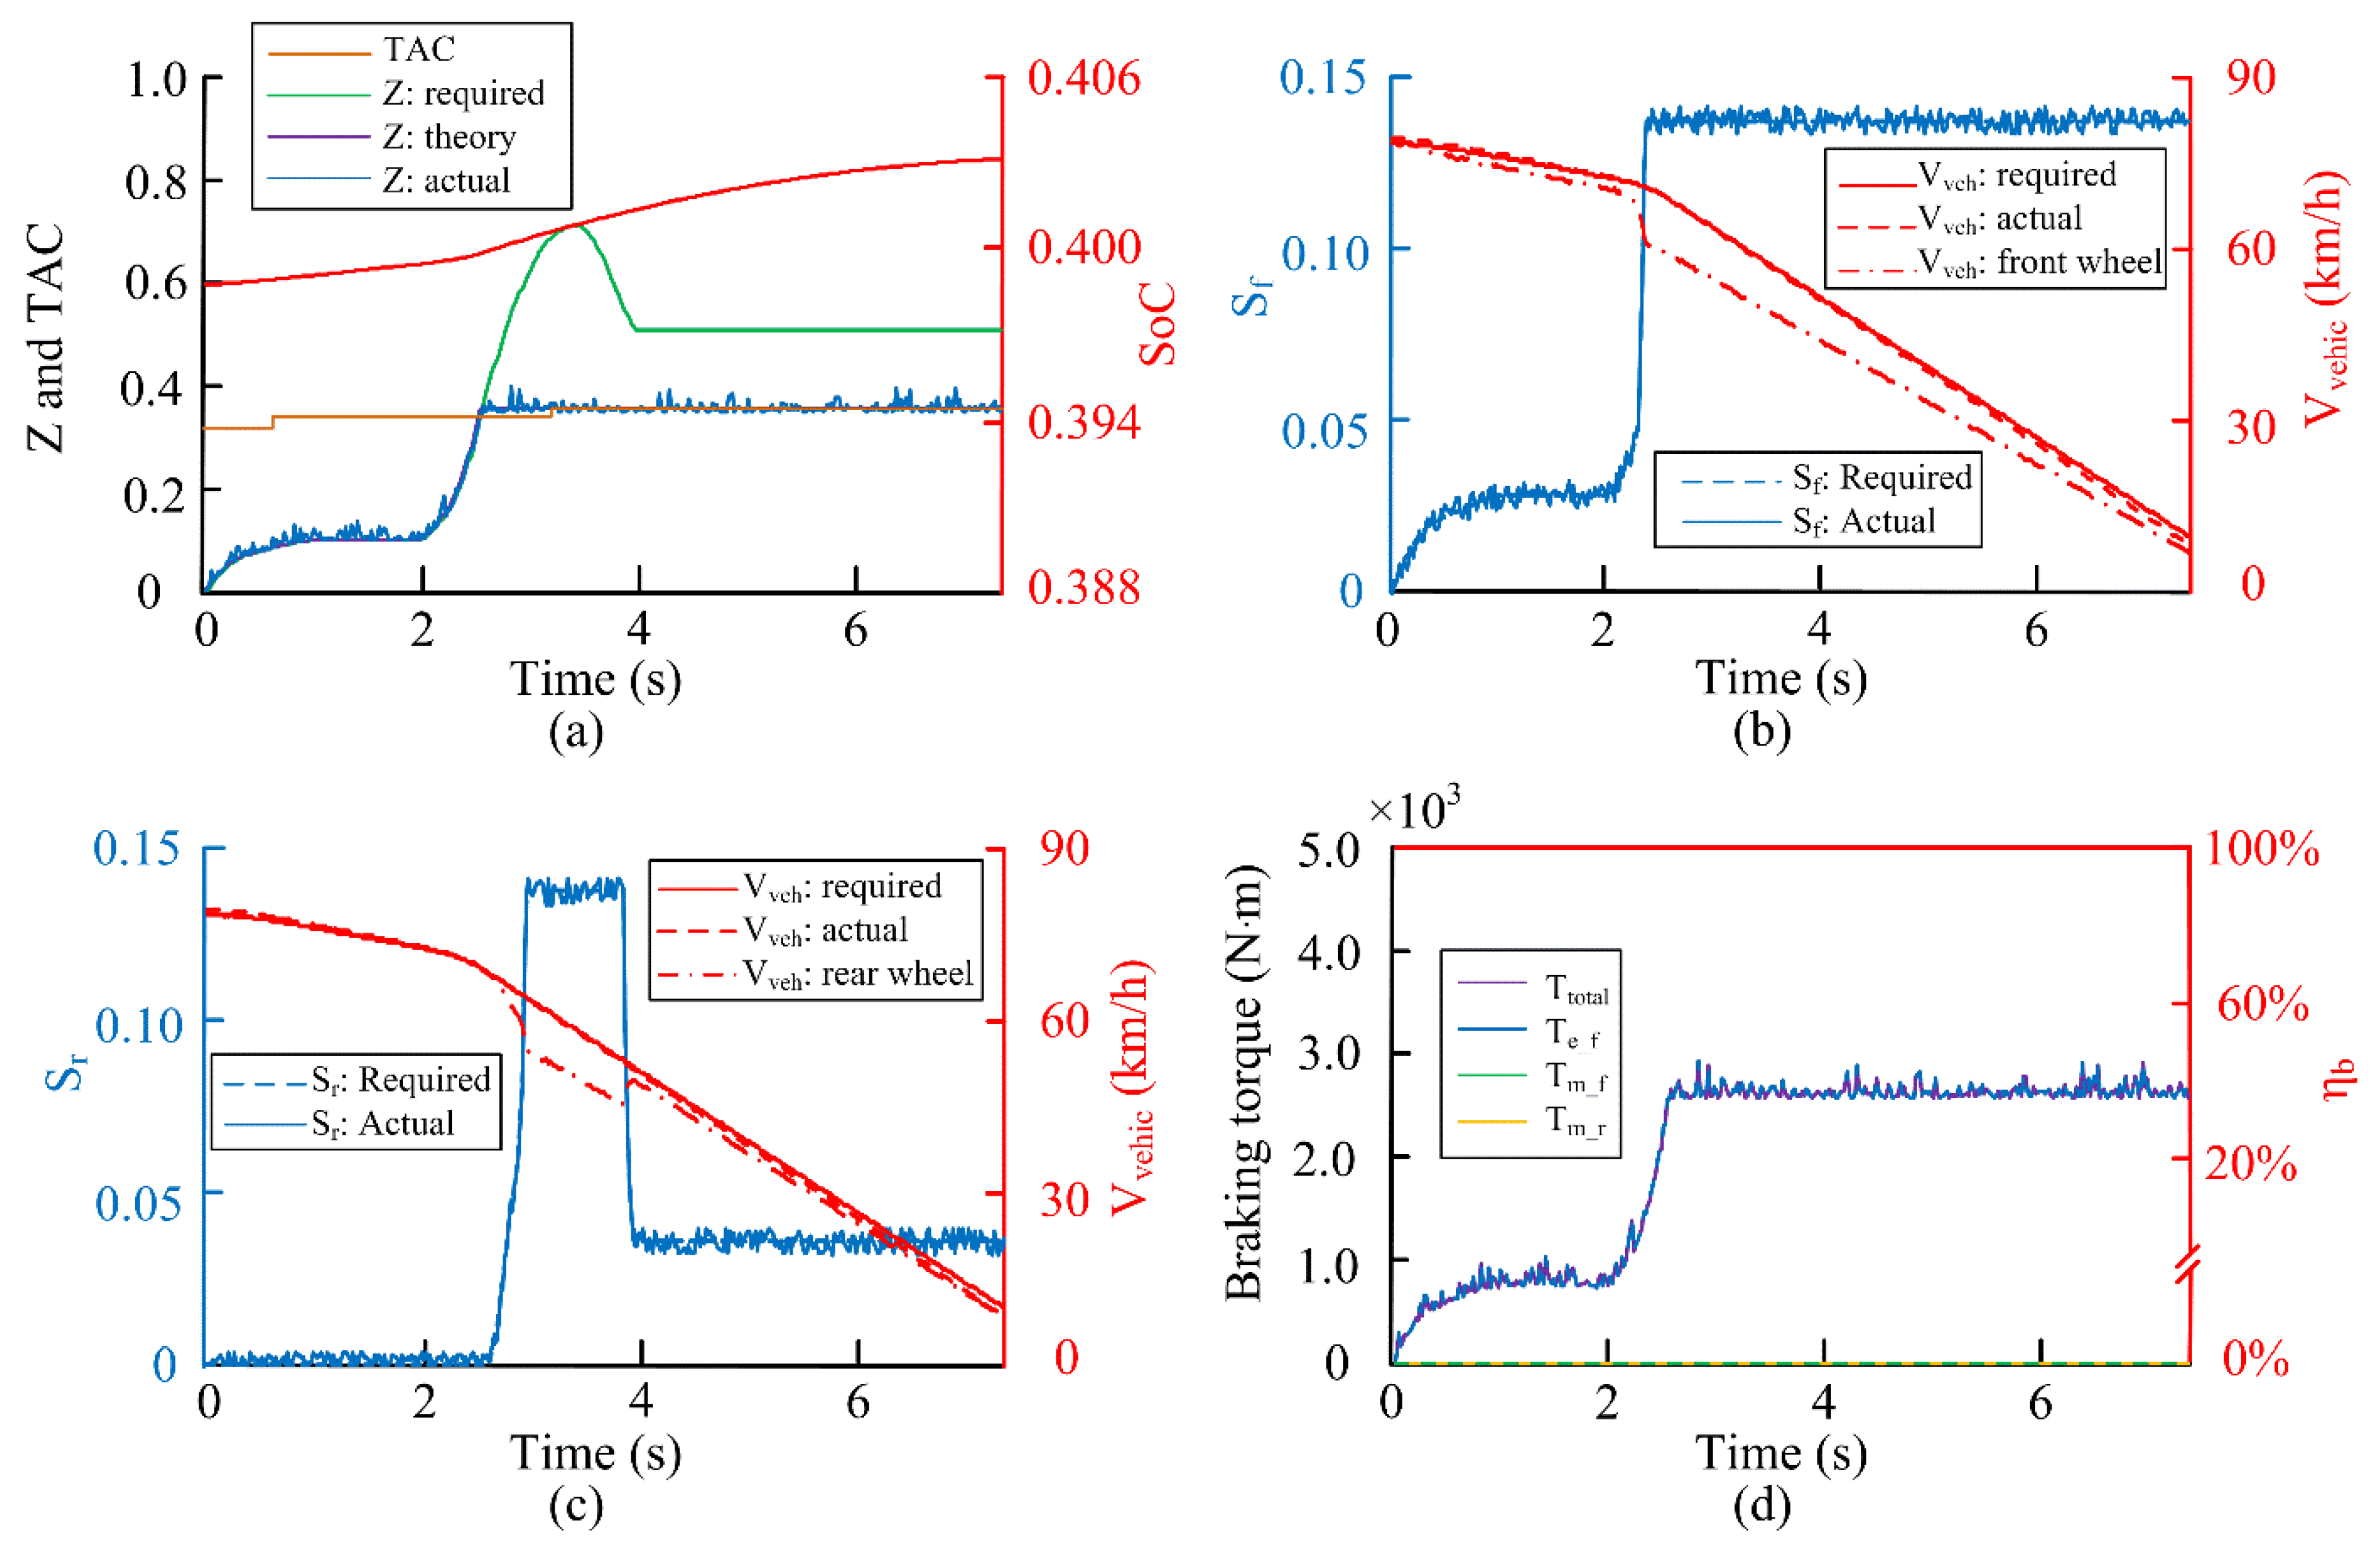
3.4.1. High Tire–Road Adhesion Condition

As shown in the Figure 11a, IRBCS tries to stop the car and the actual braking strength (Zact) can reach the required braking strength (Zreq). The battery SoC increases from 0.4 to 0.4053, and Cb-cyc is about 61.325%. The speed and slip ratio of front and rear wheel with IRBCS are shown in Figure 11b,c, respectively.
We can see that the IRBCS keeps the slip ratio at the optimal value. The actual slip ratio sact(t) responses in time with no overshooting, and the fluctuation is small. It means that the DFLC designed in IRBCS can achieve good follow-up of the OSR. The actual vehicle speed overlaps with the desired vehicle speed. The difference between the vehicle speed and the wheel speed is very small. Figure 11d shows that the regenerative braking efficiency and the variations of the braking torque include hydraulic braking torque and regenerative braking torque, the hydraulic braking torque and regenerative braking torque can cooperate well under IRBCS. Initially, the braking torque is all provided by the regenerative braking system and ηb is 1 from 0s to 2.4s to increase regenerative braking energy. When the braking demand is increased with braking torque demand value exceeding the maximum motor torque Tmot_max, the hydraulic braking torque participates in the braking process and ηb∈[0.65, 0.81]; it shows that a large regenerative braking efficiency can still be achieved.

3.4.2. Medium Tire–Road Adhesion Condition

Similar analysis with the previous Section 3.4.1 is as follows: Zact can reach the required braking strength well on medium PTAC, the SoC is increased from 0.4 to 0.4049, and Cb-cyc is about 56.677%. IRBCS keeps the slip ratio at the optimal value, as shown in Figure 12b,c. Figure 12d shows that variations of the braking torque limiting the follow-up of the target braking intensity when Zreq>0.6 after 3 –3.8 s with μmax_h reaching the upper limitation. The target slip ratio is equal to the ground best and provides the maximum braking strength. During the braking process, ηb is in the range of 0.58 to 1; it shows that a large regenerative braking efficiency can still be achieved.

3.4.3. Low Tire–road Adhesion Condition

As shown in the Figure 13a, Zact can reach the required braking strength well on low adhesion coefficient condition, the SoC is increased from 0.4 to 0.4031, and Cb-cyc is about 32.841%. IRBCS keeps the slip ratio at the optimal value, as shown in Figure 13b,c. Figure 13d shows that variations of the braking torque limiting the follow-up of the target braking intensity when Zreq>0.35 after 2.2 s with μmax_l reaching the upper limitation. The control target slip ratio is equal to the ground best and provides the maximum braking strength. During the braking process, ηb is always 1. Under the premise of ensuring the braking efficiency, the braking energy is recovered to the greatest extent, and the control system has excellent performance.
In summary: as the braking control intervenes, the wheel speed decreases smoothly, and the slip ratio maintains the ideal value while in deceleration process. As shown in Figure 11, Figure 12 and Figure 13, the wheels actual slip ratio can achieve a good tracking of the target slip ratio on various TAC conditions. It means that the IRBCS can prevent the wheel from locking to ensure braking safety. By using the proposed IRBCS, the accumulated Cb_cyc on the three types of roads are 61.325%, 56.677%, 32.841%, respectively. Thereby, tire–road adhesion is fully utilized and the regenerative braking performance of R-EEV is assured, testifying the effectiveness and adaption of the developed control strategy.

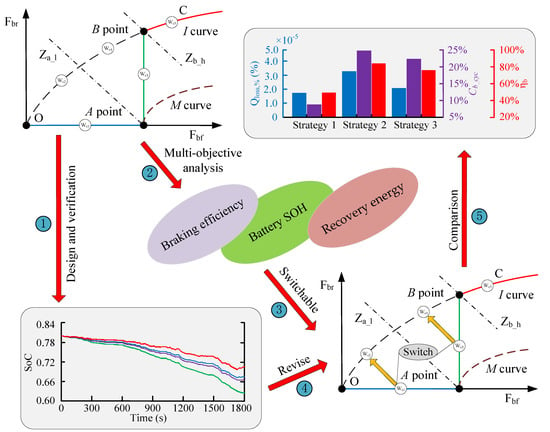
4. Revised Regenerative Braking Control Strategy (RRBCS)

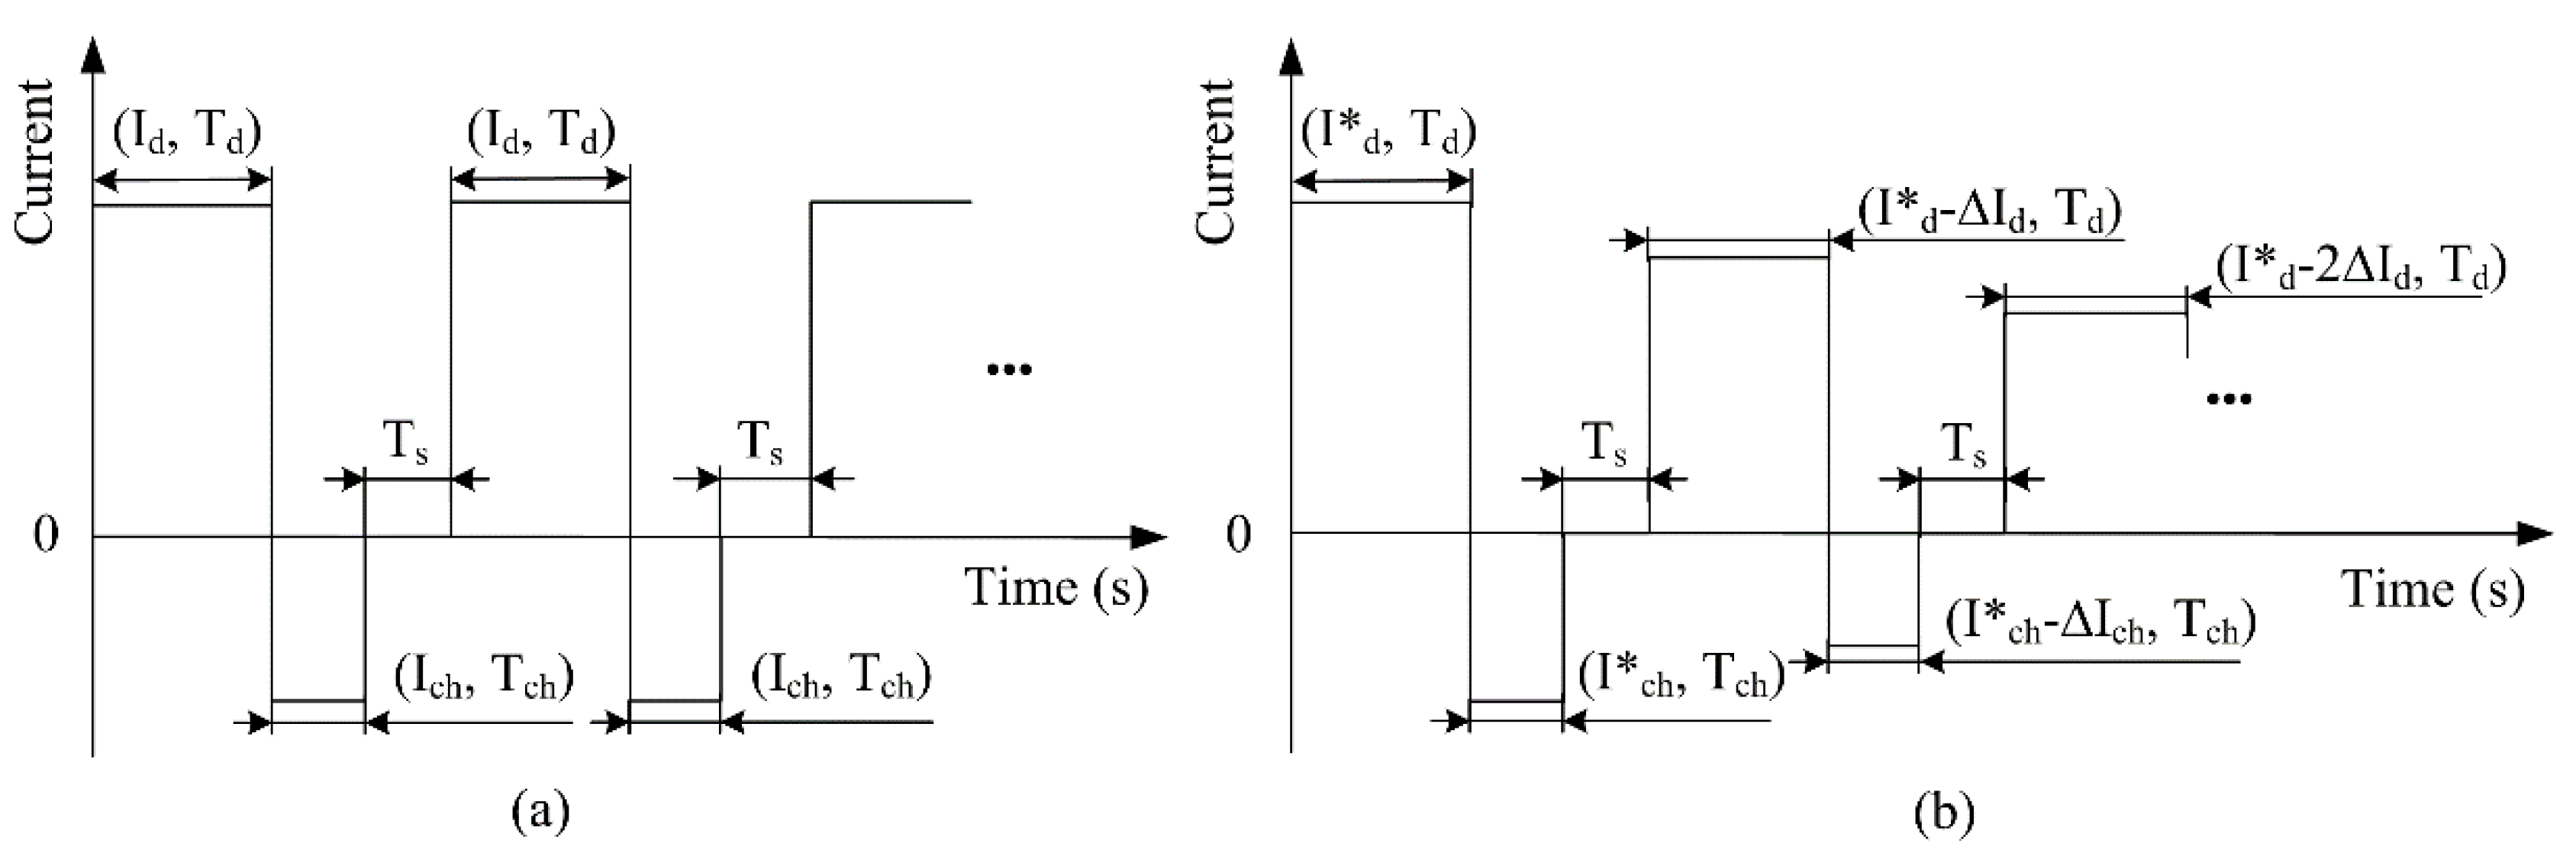
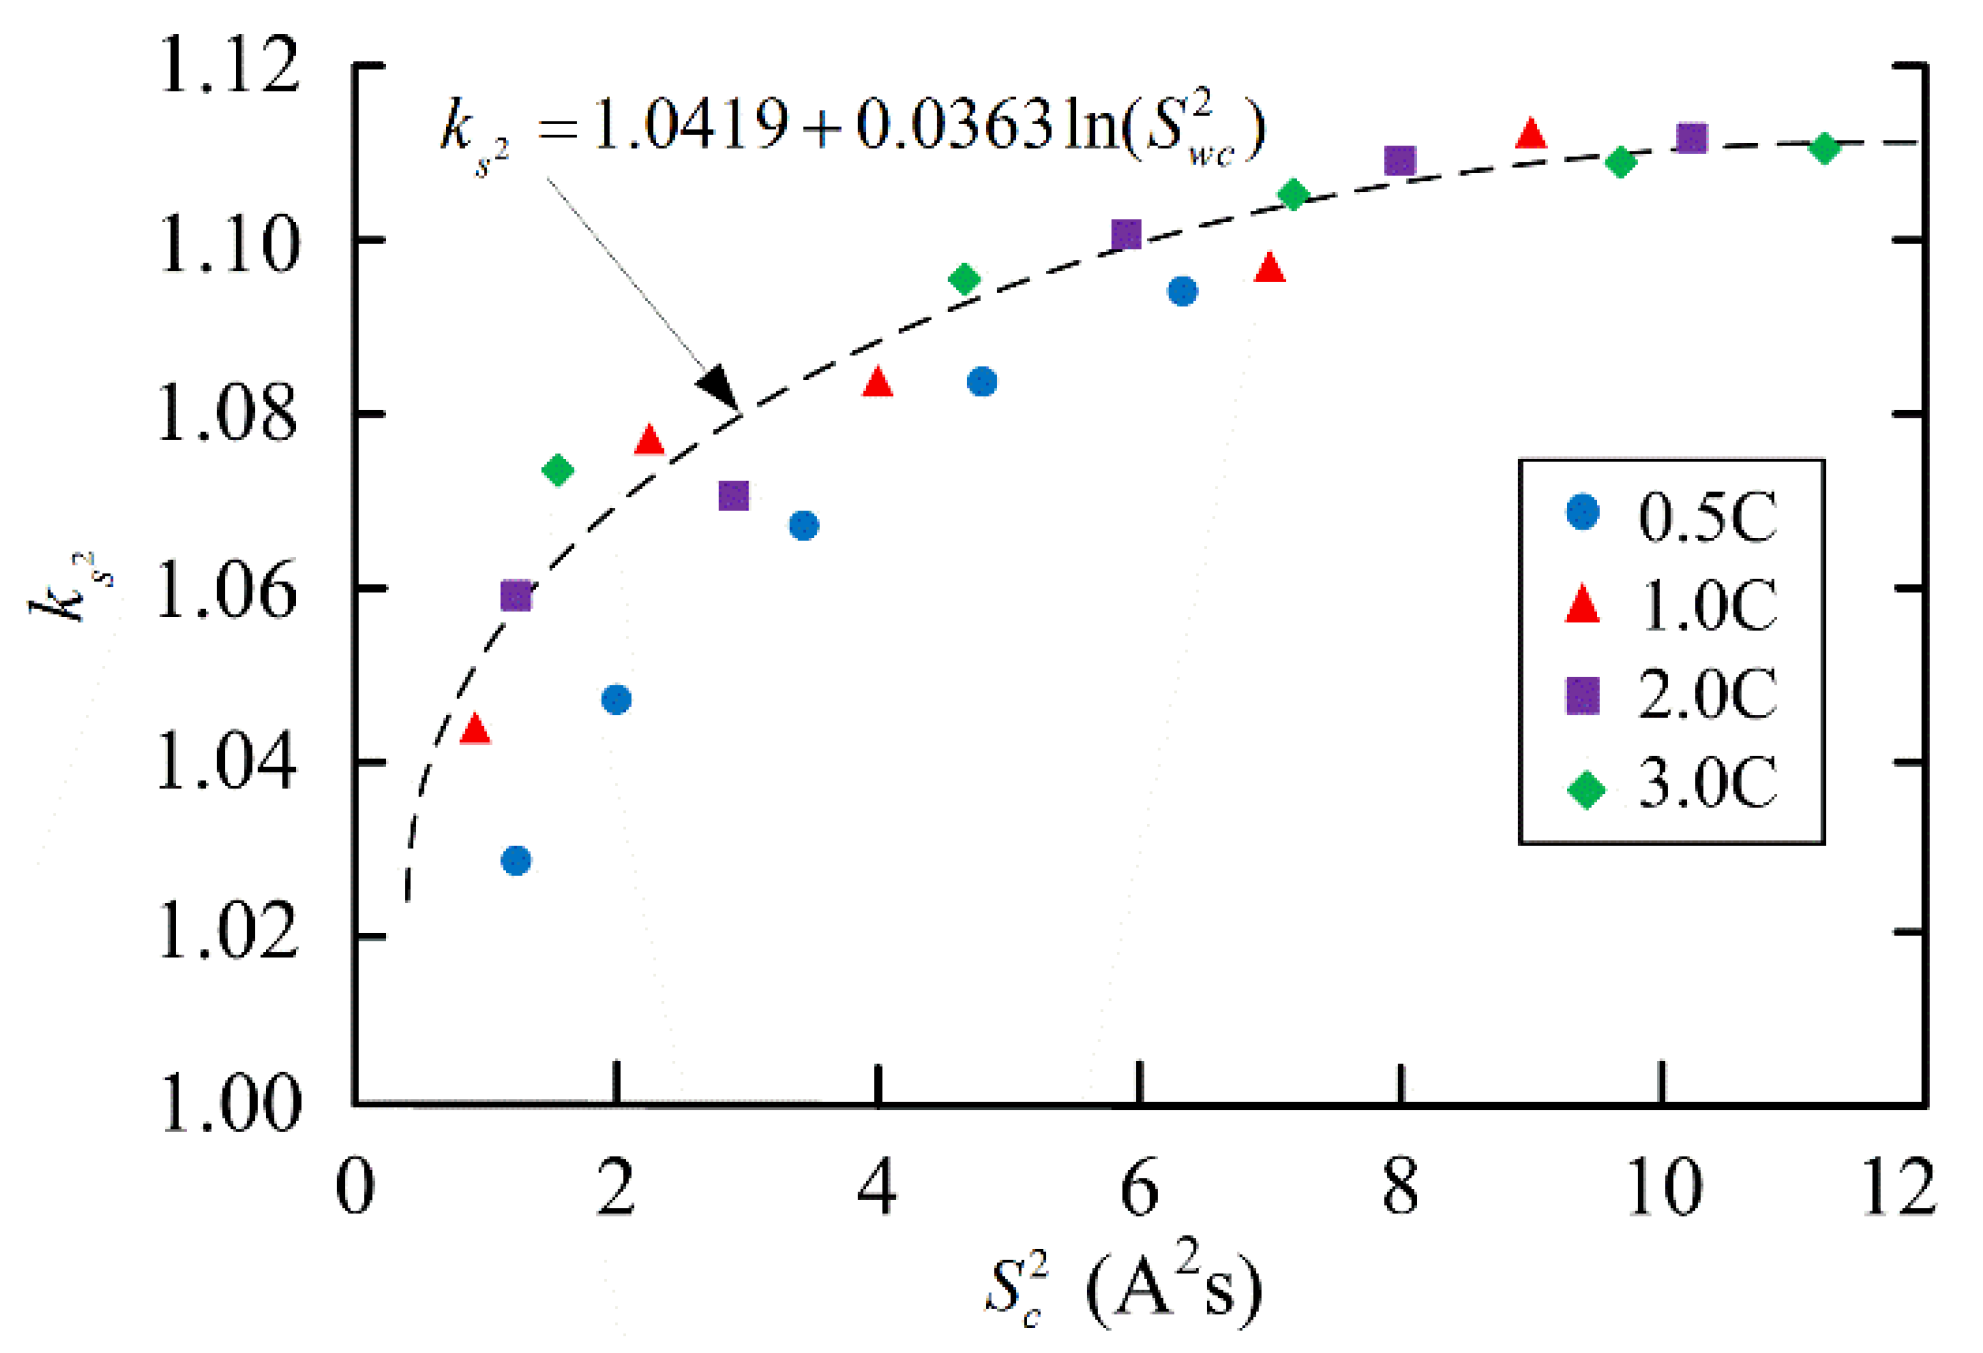
4.1. Battery Capacity Loss Model (BCLM)

Relevant research shows that the better charging capacity and the better health state of the battery can be obtained by controlling the charging current profiles [26]. In this paper, the Li-ion cylindrical batteries with model M18650 have been selected to study the impact of charging profiles on battery performance. The battery storage systems were subjected to repeat operations of charging and discharging profiles, and the rate and shape of RCC indubitably affected the charging time and the aging rate of a battery. In this section, we reveal the relationship and establish the coupling relationship model between the battery current (I(t)) and the battery capacity loss rate (Qloss,%). The battery model and the measurements of battery capacity fading are proposed in [26,27,28]. Under a comprehensive driving cycle, the BCLM can be established as follows:
Q l o s s , % = α × N c y c × D O D × A h c e l l
α = B 1 × exp ( B 2 C n ) = B 1 × exp ( B 2 I ( t ) A h c e l l )
Q l o s s , % = 0 T c y c B 1 × B 2 × I ( t ) × exp ( B 2 I ( t ) A h c e l l ) × N c y c × D O D d t
where α is the capacity attenuation coefficient; DOD is the depth of discharge; Ahcell is the cumulative capacity of the battery; B1 and B2 are fitting parameters, which can be calculated through the least square method; Cn is the charging rate; I(t) is the battery current; Tcyc is the total cycle time.
It is difficult to evaluate the impact of discharge profiles on battery performance, because most discharge conditions are multifarious based on the load itself [26], and it is necessary to correct the original equation of BCLM with rate and current shape characteristic index. In order to evaluate the capacity fading of the cells during their service life, multi-stage constant current–constant voltage with a negative pulse (MCC-CVNP) is selected to simulate the battery current shape during operation, and the reference performance test was carried out regularly (every 1700 cycles). As shown in Figure 14, six cases have been selected in this paper to investigate the impact of the battery current curve on the lithium-ion battery:
Case 1 (CC-CVNP): constant current discharging at current rate Id for Td and constant current charging at current rate Ich for Tch, followed by rest time Ts were applied.
Cases 2–6 (CC-CVNP): initial constant current discharging at current rate I *d for Td and initial constant current charging at current rate I *ch for Tch, followed by rest time Ts were applied. Each pulse decreases in sequence of ΔId.
Under the same discharge rate Cn, the parameters of six cases are designed as follows:
( T d + T c h + T s ) × A h c e l l × C n = 0 T d I d ( t ) d t 0 T c h I c h ( t ) d t      = i = 0 n ( 0 T d ( I d ( t ) i × Δ I d ) i = 0 n ( 0 T c h ( I c h ( t ) i × Δ I c h )
where ΔId is the decrement of discharging current; ΔIch is the decrement of charging current.
As shown in Figure 14b, each pulse decreases in sequence of ΔId. The reduced current value becomes equal difference series size relationship, which increases in sequence (ΔId, 2ΔId, 3ΔId…). The relationship between ΔId, ΔIch, I *d, and I *ch needs to satisfy the Equation (20) to ensure that maintain the same charging rate under the shape of pulse current.
Sc2 is defined to characterize the fluctuation of current shape under cycle condition and is calculated as follows:
S c 2 = 0 T c y c ( I ( t ) C n A h c e l l ) 2 d t
The related research results reveal that the dynamic discharging–charging profile has a significant impact on reducing the capacity fade of the lithium-ion battery cells compared with the static profile [26]. Therefore, case 1 is selected as reference scheme because of their minimum Sc2 in this paper, and ks2 is defined as follows:
k s 2 = Q l o s s , % Q l o s s , %
To characterize the fluctuation of current shape under cycle condition, Swc2(t) can be calculated as follows:
S w c 2 = ( I ( t ) I w c ) 2 × Δ t
Commercial lithium-ion M18650 cells has been used to study the battery capacity loss rate Qloss,%. Table 5 shows the electrical parameters of battery cells.
Six cases of the applied charging process are shown in Table 6.
The same test procedure can be performed in the case of Cn = 1.0C, Cn = 2.0C and Cn = 3.0C. The relationship of correction factor ks2(t) and Swc2(t) can be computed and concluded as shown in Figure 15.
According to Equation (21) and Equation (22), Correction factor ks2 can be calculated as follows:
k s 2 = C 1 + C 2 ln ( S w c 2 )
By fitting the experimental data, the following can be acquired: C1 = 1.0419 and C2 = 0.0363. Equation (23) can be calculated as follows:
k s 2 = 1.0419 + 0.0363 ln ( S w c 2 )
Finally, according to the above analysis of the relationship between ks2 and Swc2, the BCLM with current curve shape considerations under the cycle condition is obtained as follows:
Q l o s s , % = 0 T c y c B 1 × B 2 × I ( t ) × exp ( B 2 I ( t ) A h c e l l ) × k s 2 ( t ) × N c y c × D O D d t = 0 T c y c 0.495457 × I ( t ) × exp ( 0.3785 I ( t ) A h c e l l ) × [ 1.0419 + 0.0363 ln ( S w c 2 ) ] d t

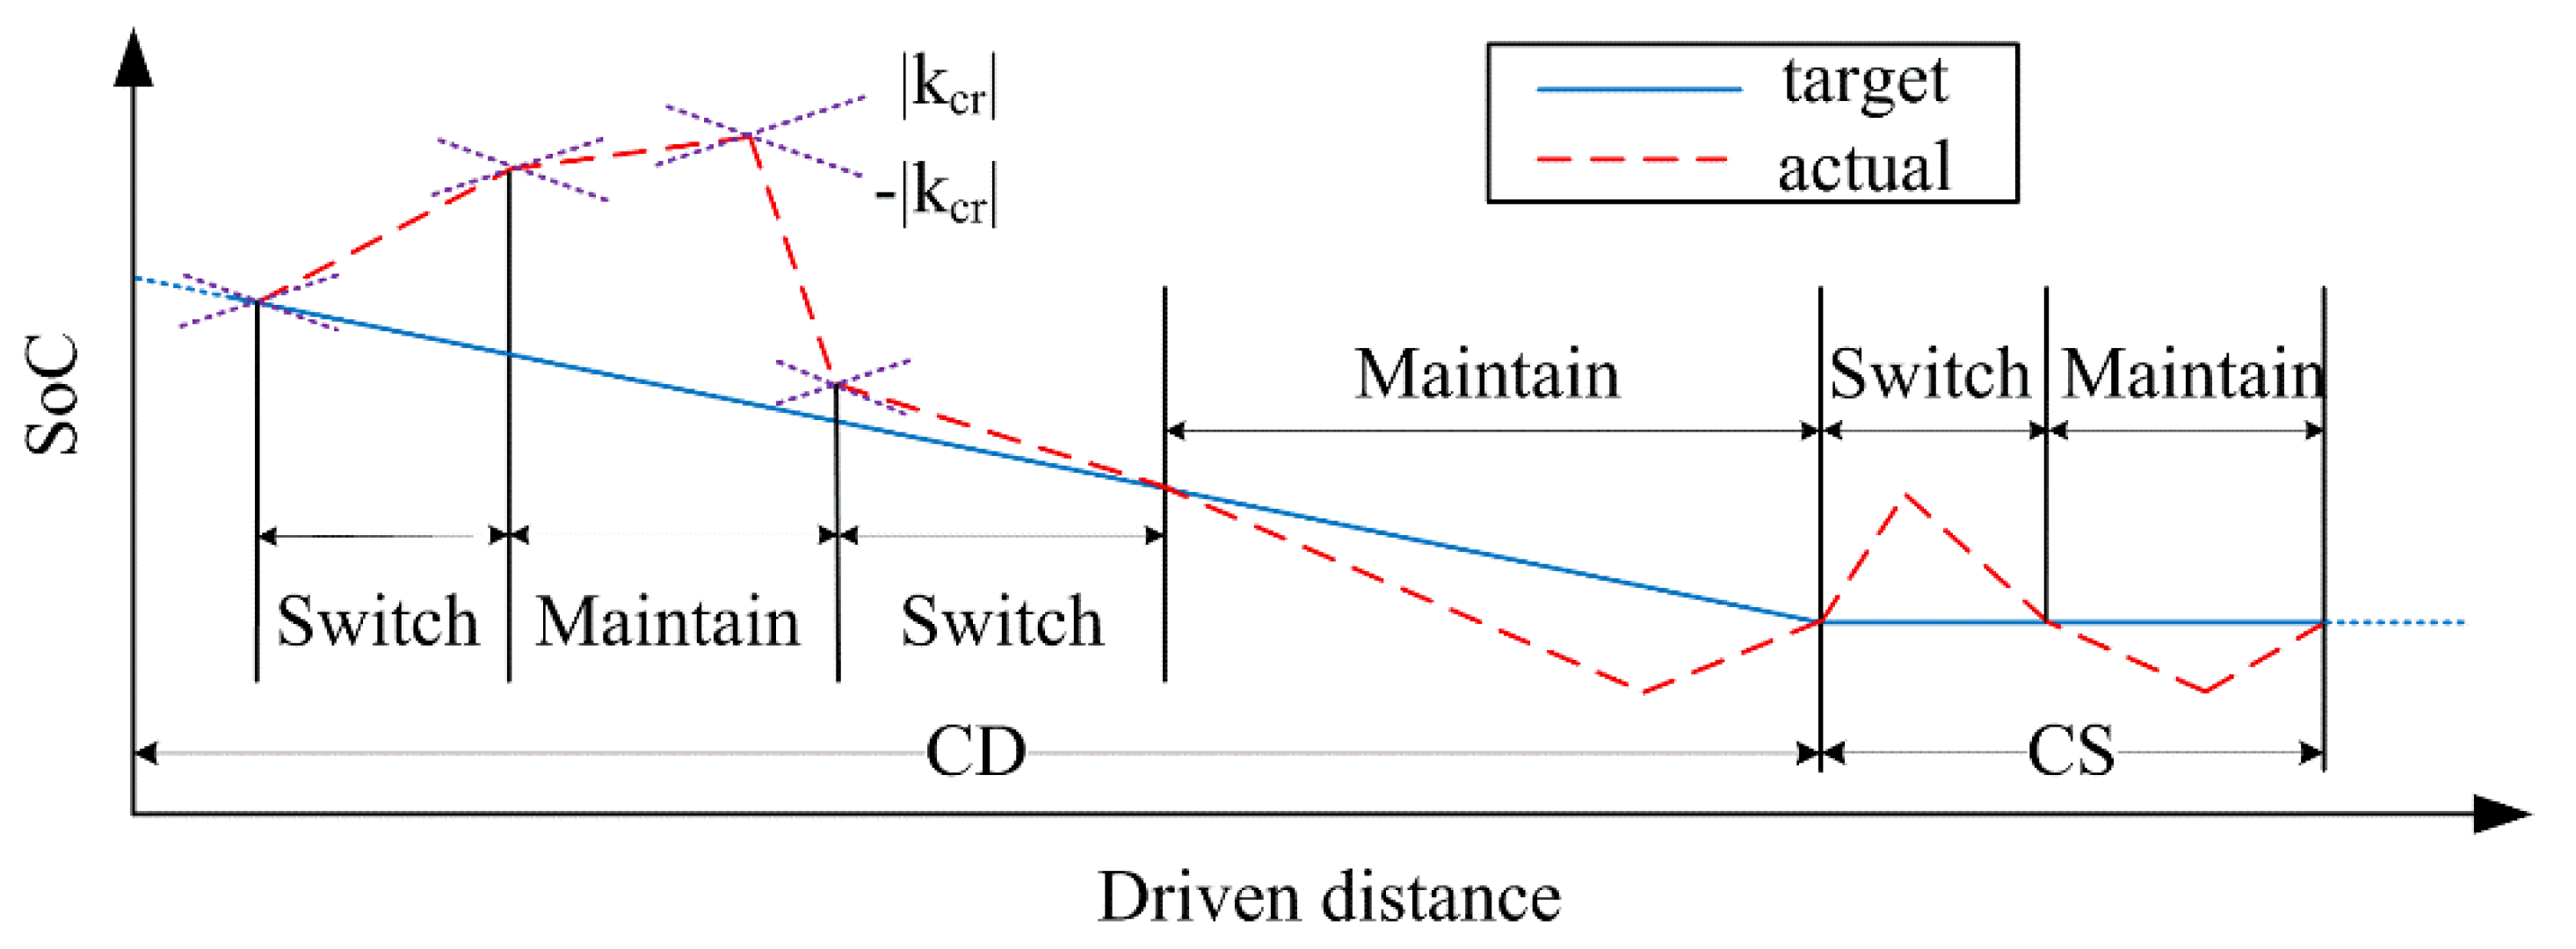
4.2. Regenerative Braking Work-Point Switching

The goal of R-EEV’s regenerative braking control strategy is to ensure comprehensive regenerative braking performance and the OSR-based RRCCS is proposed. The shape and rate of the RCC characterize the details of the battery being charged and discharged during vehicle operation, which can be seen in the battery SoC. In order to control the shape and rate of the battery RCC and reduce the adverse effect of RCC on battery life. The operating point switching mechanism in RRBCS is to conservatively adjust the operating point by referring to the battery SoC characteristics. Through the "conservative braking mode", the actual SoC will be close to the pre-set value to make full use of the power of the battery pack, while protecting the battery health. As shown in Figure 16, the switching of the braking working point is adjusted in real time according to the vehicle state. WC1 is switched to WC2, and WC4 is switched to WC3.
The reference index for braking work-point switching logic is calculated as follows:
k S o C = ( S o C ( k + 1 ) S o C ( k ) ) Δ t 1
k c r = ζ 0 k 0 = ζ 0 ( S o C 0 ( k + 1 ) S o C 0 ( k ) ) Δ t 1
where kSoC is the SoC change rate; kcr is the change rate discrimination value; SoC (k) and SoC0 (k) are the battery real time SoC and the SoC controls target value at the k instant; SoC (k + 1)) and SoC0 (k+1) are the battery real time SoC and the SoC controls target value at the k+1 instant; k0 and k0_CD are the SoC control target change rate and preset value in charge depletion, and the k0_CS is the SoC preset value in charge sustaining with the value assigned is 0. ζ0 is a correction coefficient and the value assigned to the study is 0.5.
The details are explained as follows: (1) In charge depletion (CD), when the SoC>0, if the ksoc is positive and greater than the discrimination value kcr, it means that the SoC has a greater increasing trend and the possibility of deviation from the SoC0, "conservative braking mode" should be adopted. (2) If kSoC is negative and |kSoC| <|kcr|, it means that the SoC has a trend of approaching the SoC0, but the "fallback" is slow. At this time, a "conservative braking mode" should be adopted. (3) In charge sustaining (CS), when SoC> 0, it means that the difference between SoC and SoC0 is too large. There is a risk of increasing the deviation of the recovered braking energy at this time; thus, the “conservative braking method” should be adopted.

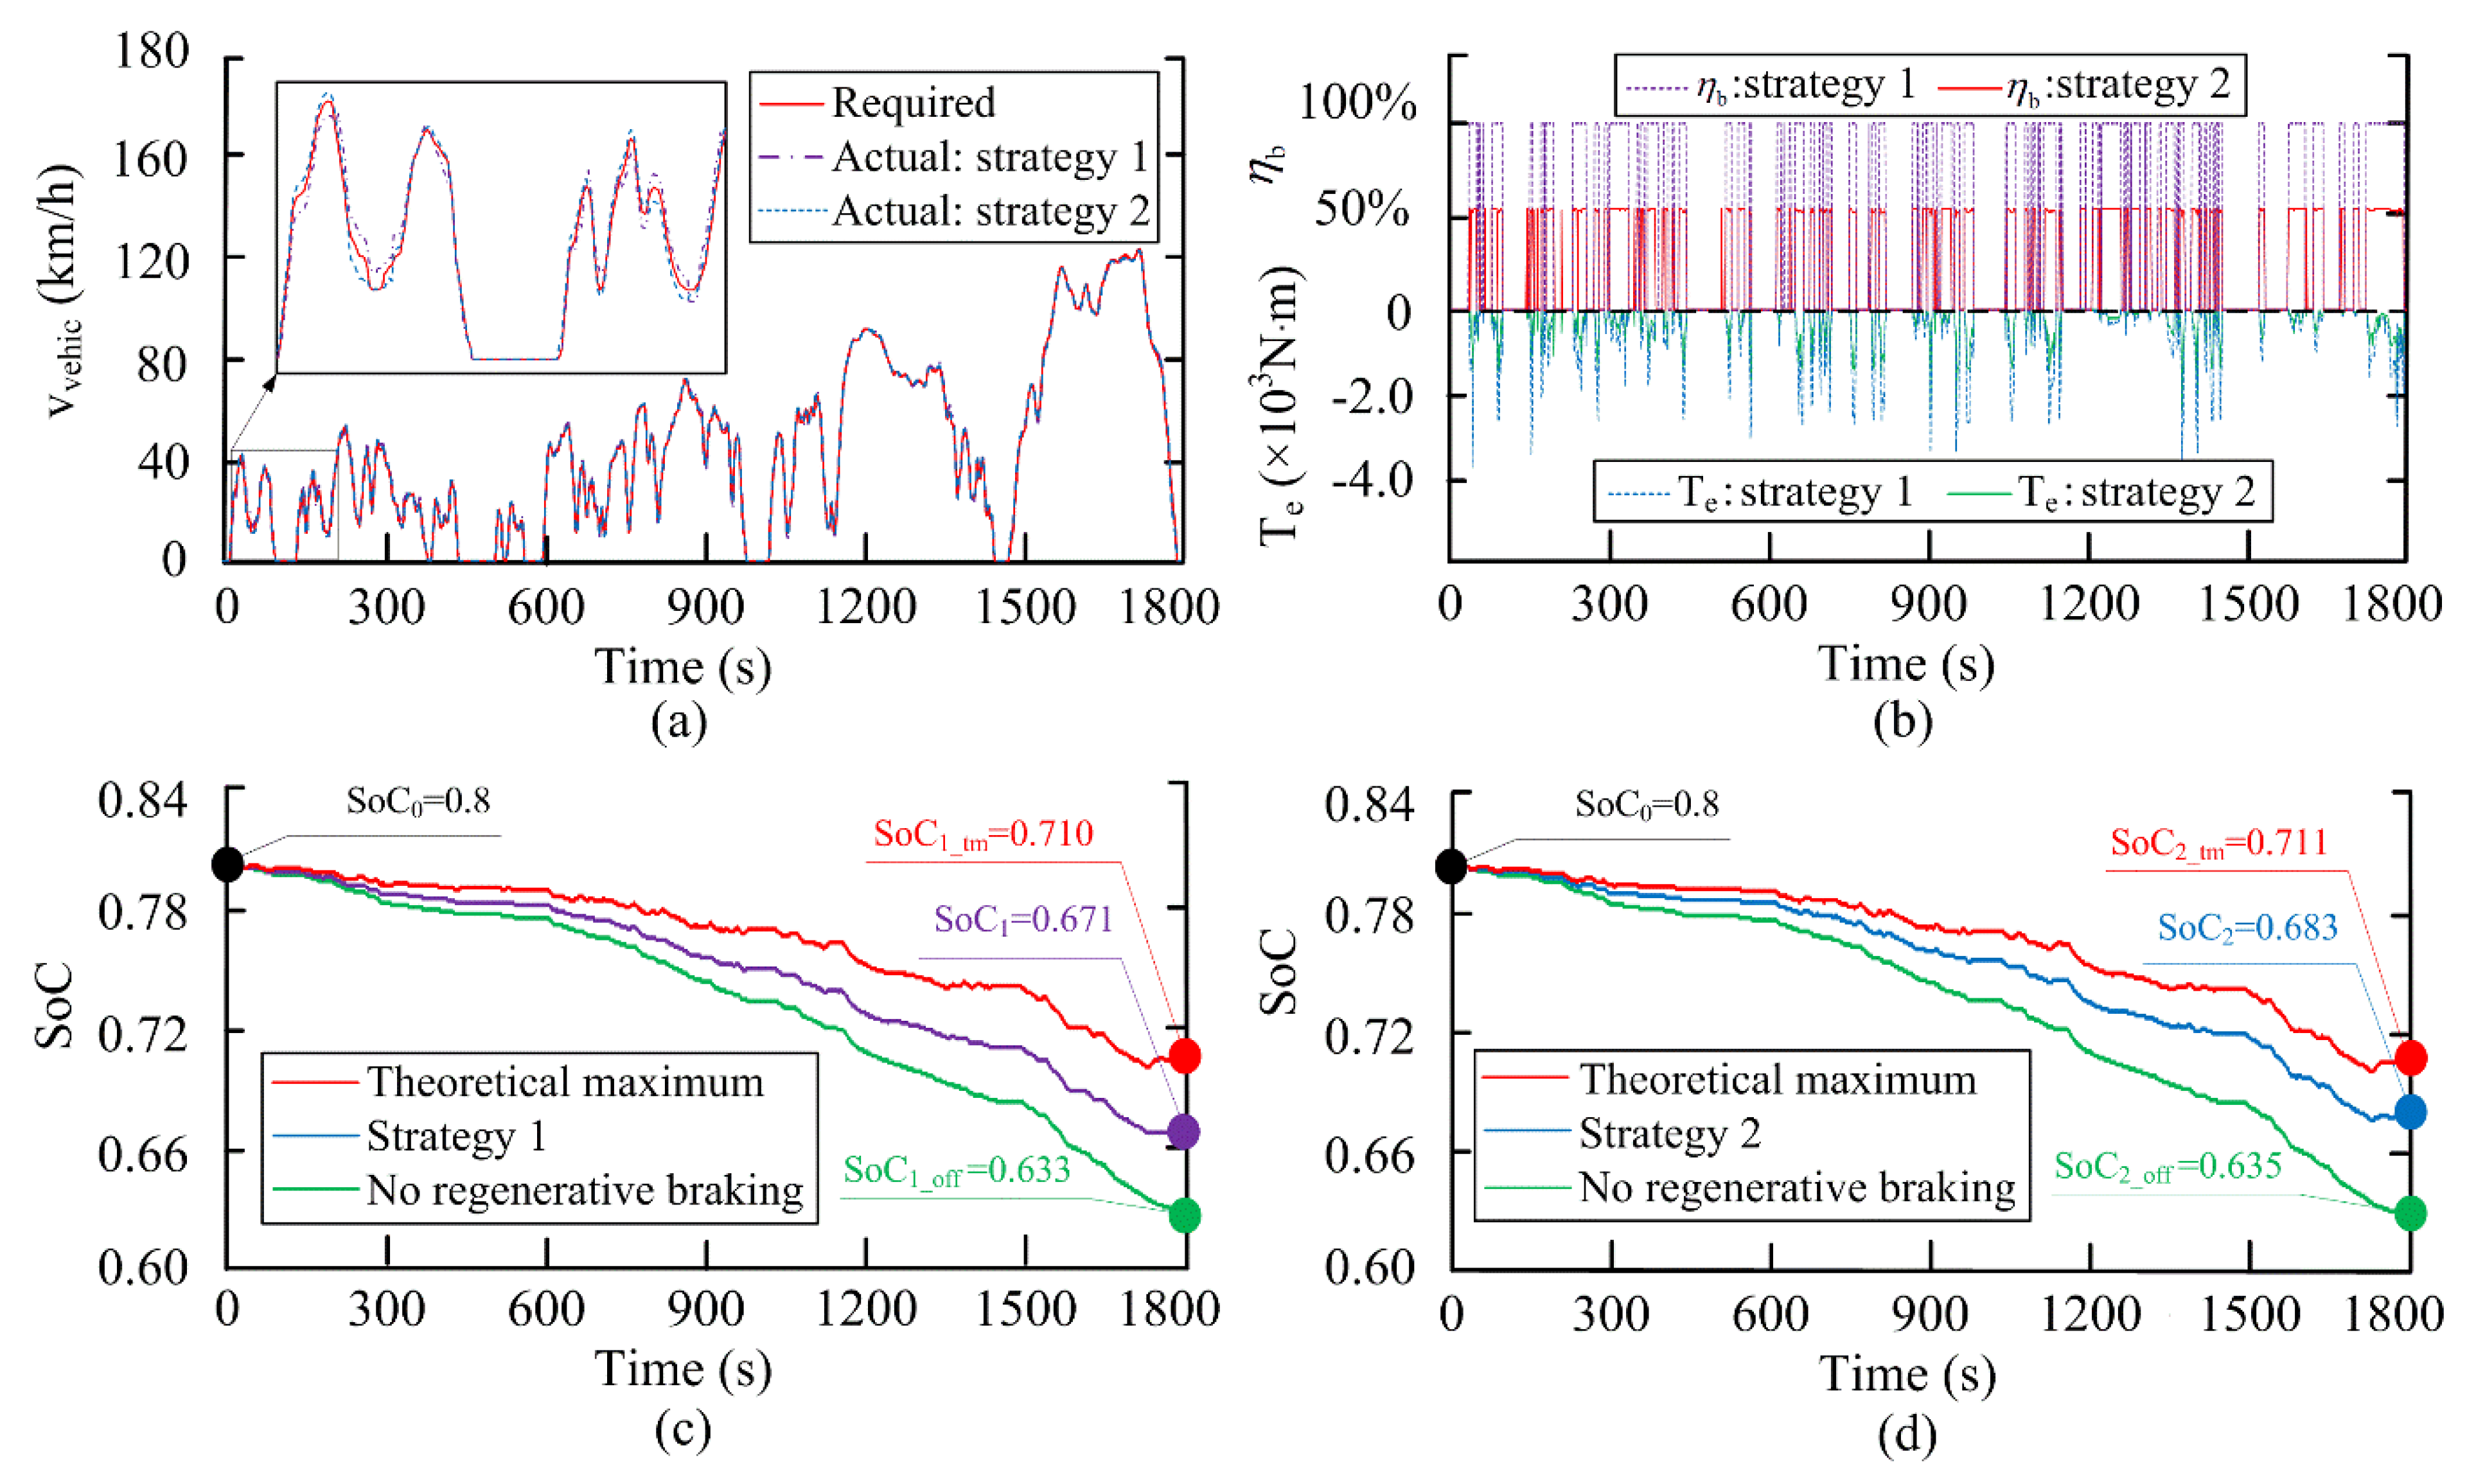
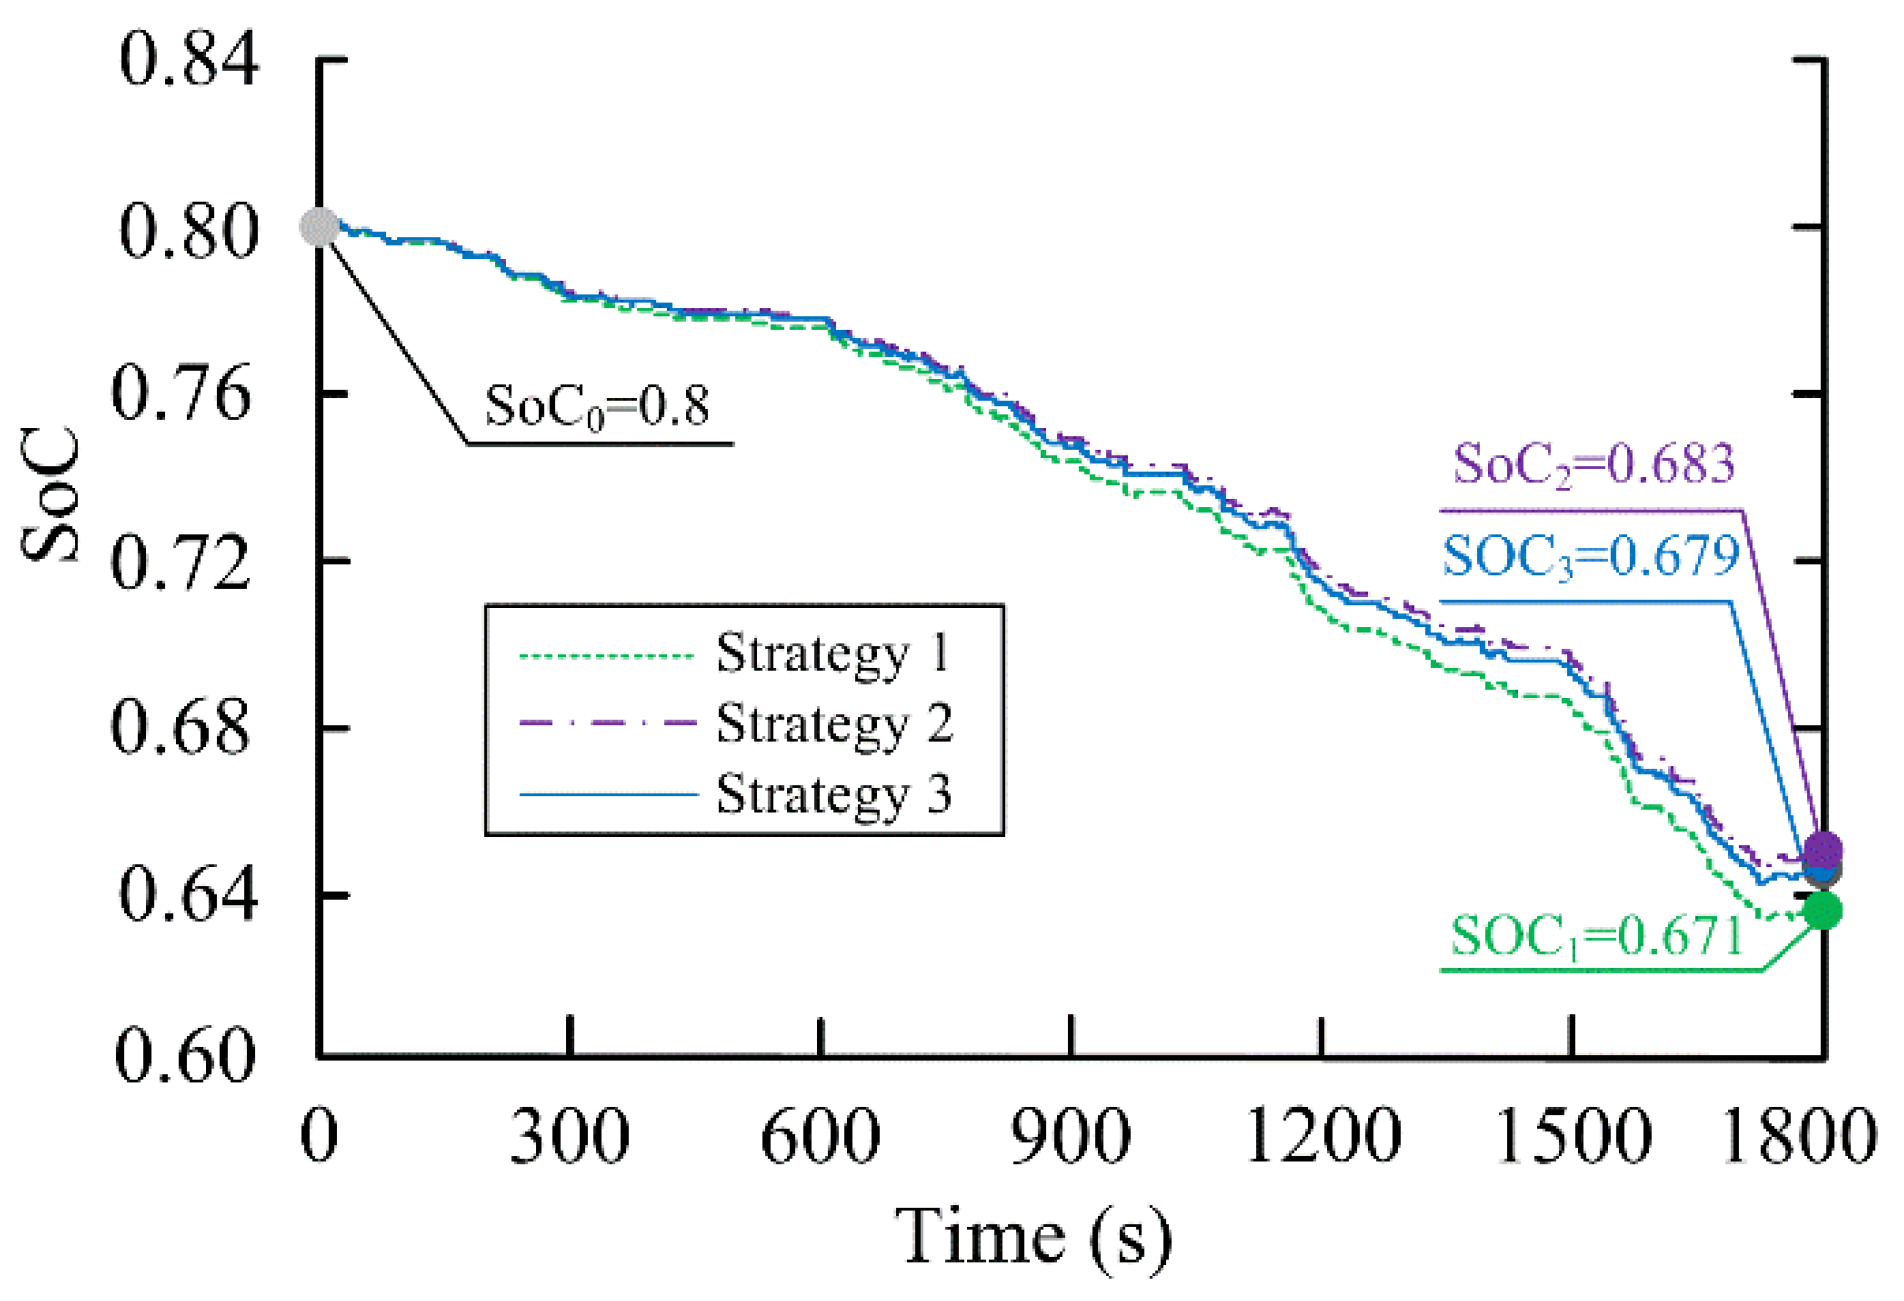
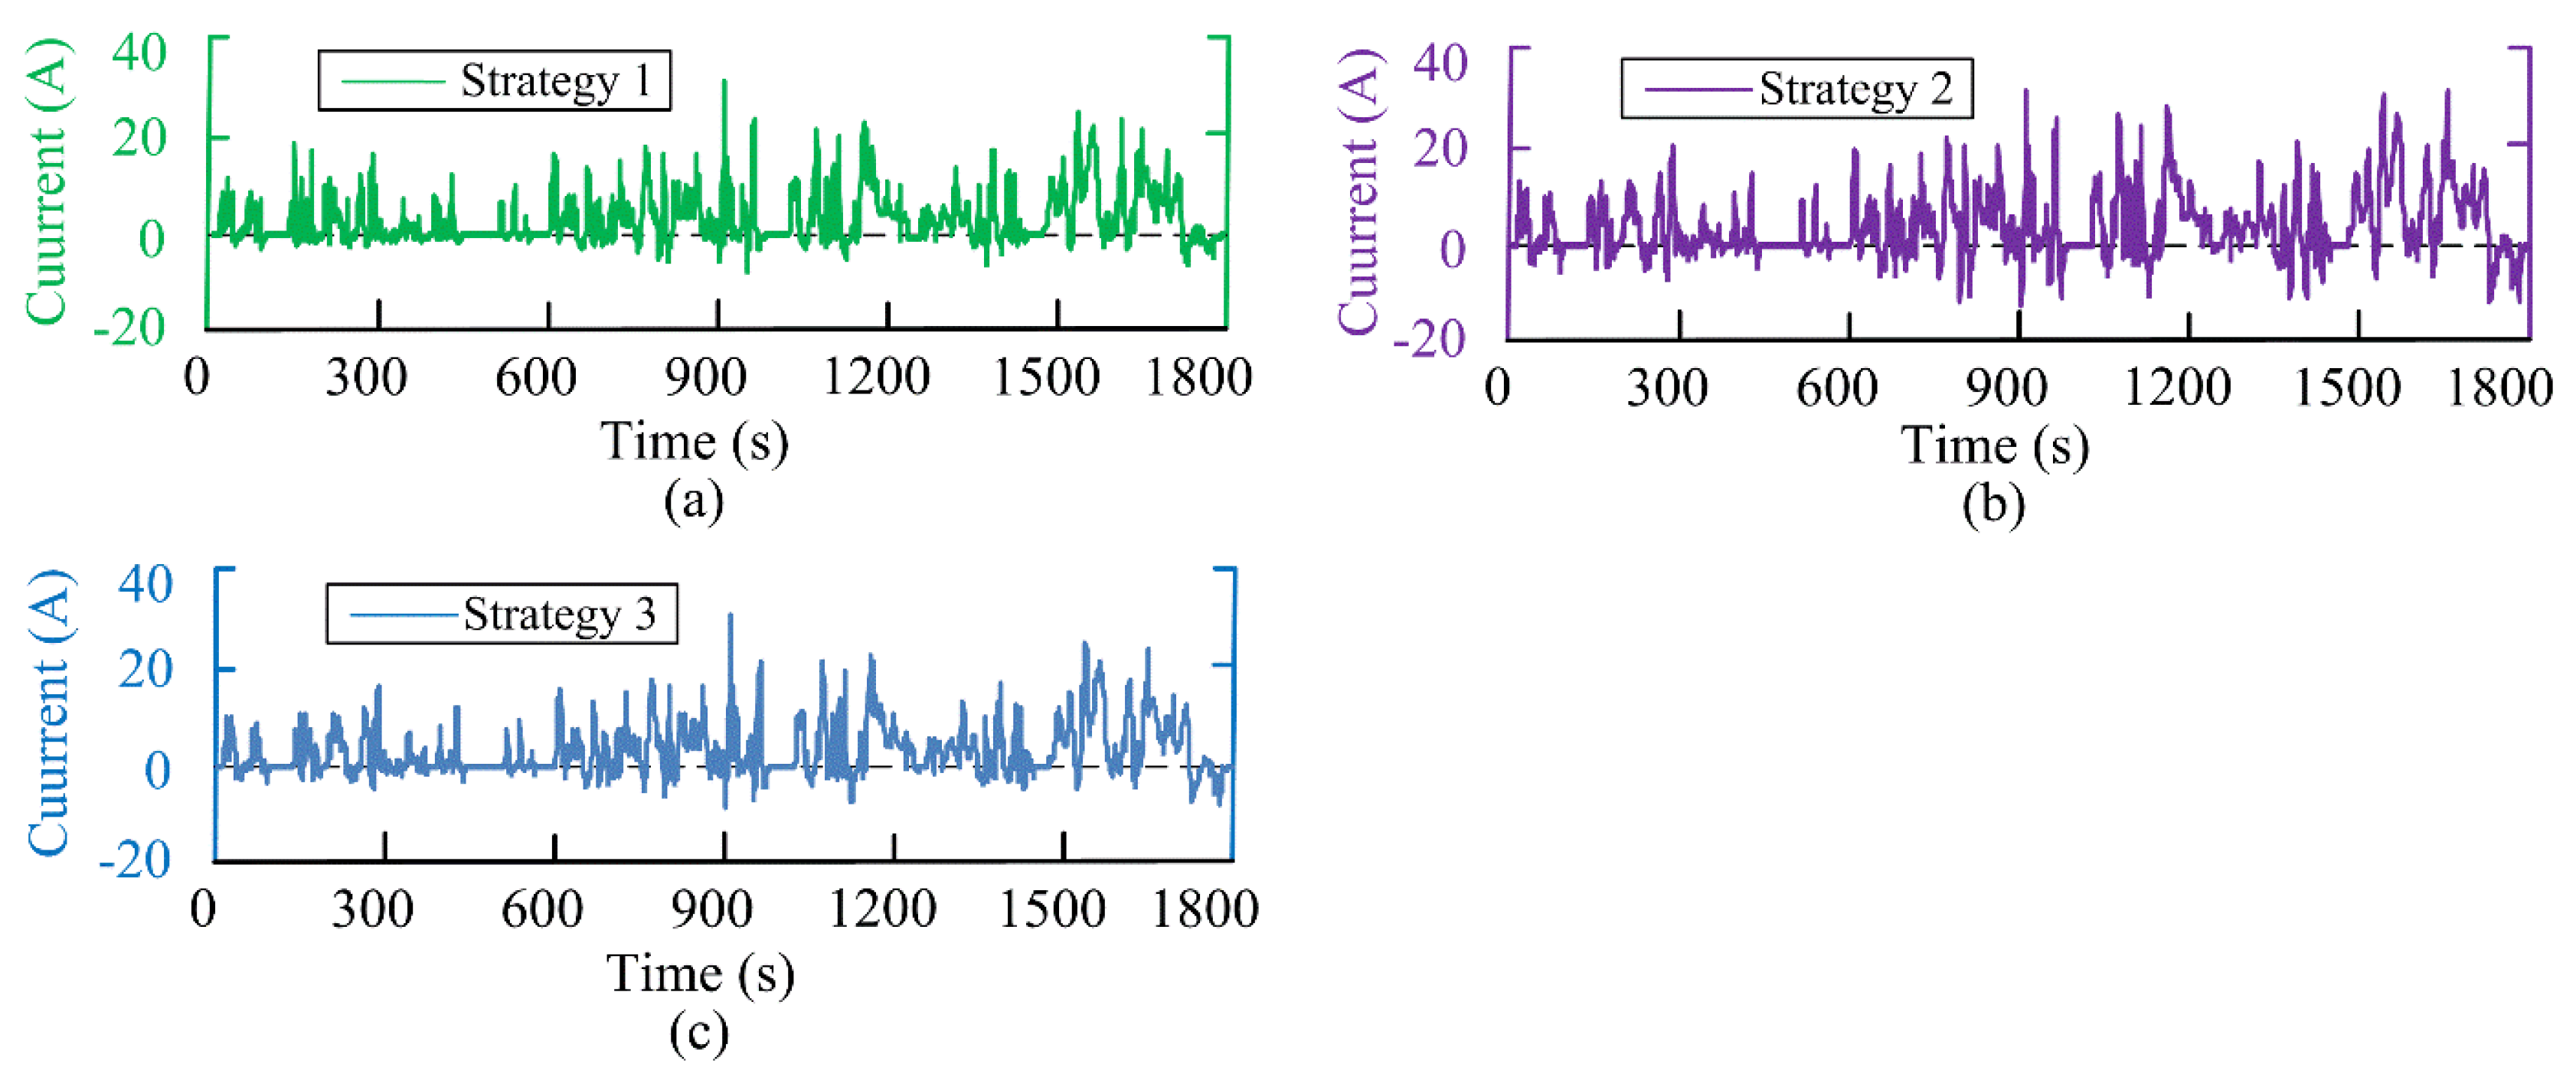
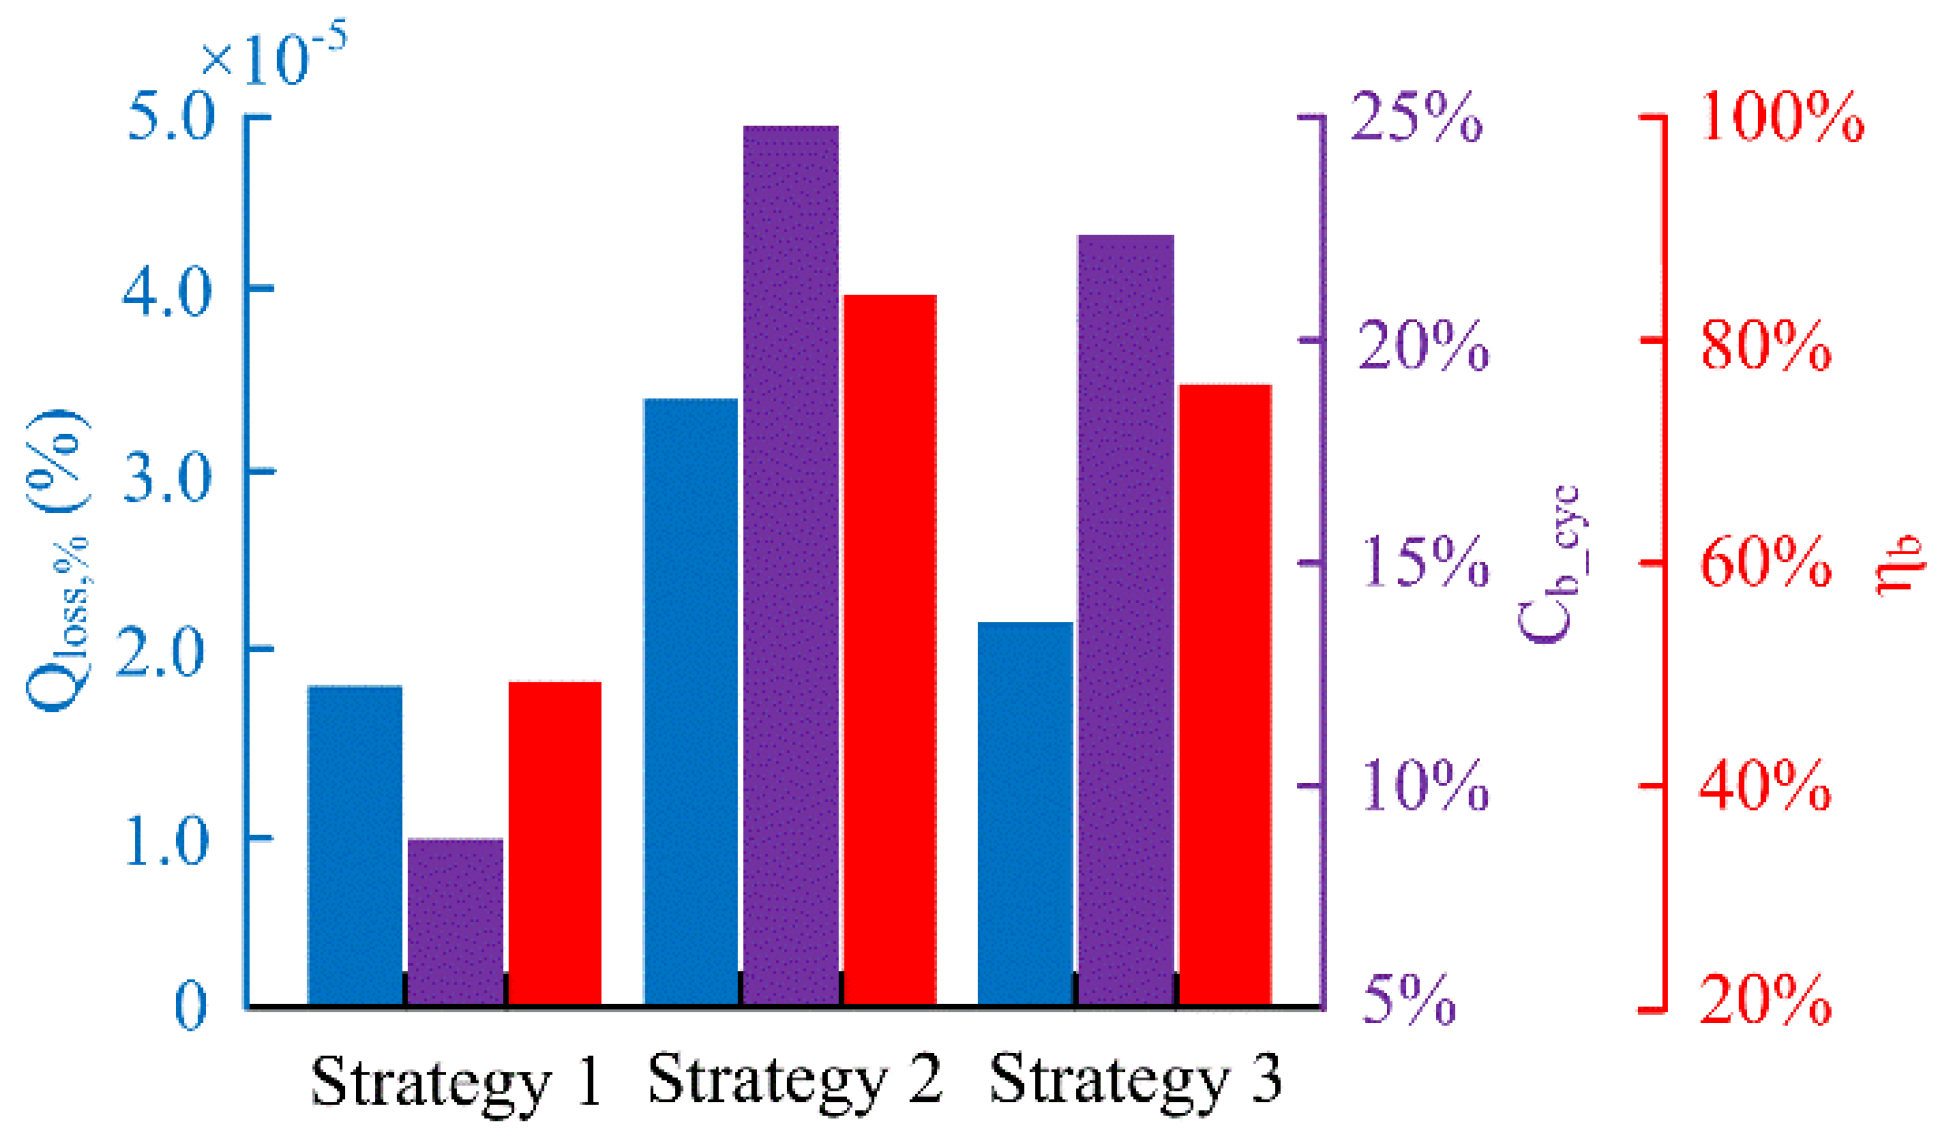
5. Comparison and Analysis of Three Control Strategies

The world light vehicle test procedure (WLTP) is close to actual driving behavior. In this paper, the WLTP driving cycle is adopted to carry out the tests for studying the comprehensive braking performance of R-EEV. Under the WLTP driving cycle, the vehicle braking intensity Zreq ∈ [0, 0.15], it means that the regenerative braking work-point is WC1 or WC2. In addition, no braking work condition is defined as the work-point 0 (WC0).
Control strategy 1 (the best-braking-performance strategy) is adopted to guarantee the best braking performance. The regenerative braking work-point is always WC1 in Control strategy 1. Control strategy 2 (the maximum-regeneration-efficiency strategy) is the IRBCS proposed mentioned before. The regenerative braking work-point is WC2 in Control strategy 2 to maximize the use of the regenerative braking torque and achieve the maximum regeneration efficiency theoretically. Control strategy 3 (the switchable-work-point strategy) is RRBCS through adding "conservative condition" based on IRBCS. The regenerative braking work-point can be switched from WC2 to WC1 in Control strategy 3 to balance the recovery energy and battery capacity loss rate. Comparative simulations are carried out among three control strategies, as shown in Figure 17. It should be noted that the braking energy recovery will be limited by the motor maximum torque. The motor torque is assumed to provide sufficient required braking torque, and the braking energy is recovered at all braking strengths in theory. This braking recovery is defined as the theoretical maximum regenerative braking to illustrate the contribution of the developed strategy to energy recovery.
As depicted in Figure 17a, the vehicle speed can be in good agreement with the target speed under the control strategy 1 and the control strategy 2. It indicated that the IRBCS proposed in this paper can effectively ensure braking efficiency and braking safety. Figure 17b shows that the regenerative braking efficiency of strategy 1 has decreased from 100% to about 56.7%, and the regenerative braking efficiency of strategy 2 has always been 100%. As shown in Figure 17c,d, after a WLTP driving cycle, battery SoC drops from the initial value of 0.8 to 0.671 and 0.683, respectively. The energy recovery ratio Cb-cyc of strategy 1 is above 13.6%. In particular, the energy recovery ratio Cb-cyc even reaches 24.8% for strategy 2, which is a relatively high level. In addition, there are about 37% of the regenerative braking work-points switched from Wc2 to Wc1 in strategy 3 during the driving cycle; it means that some of the braking recovery energy will not be fully utilized, as shown in Figure 18.
The battery SoC and current curve in the three braking modes based on the WLTP cycle is shown in Figure 19 and Figure 20.
Through the SoC comparison of the three strategies, it is not hard to discover that the IRBCS (strategy 2) and RRBCS (strategy 3) possess a more superior economy and reduces electricity consumption as much as possible.
Compared with Control strategy 2, the change of energy recovery ratio ΔCb_cyc and the change of battery capacity loss rate ΔQloss,% are calculated as follows:
Δ C b _ c y c = C b _ c y c i C b _ c y c 2 C b _ c y c 2 C b _ c y c 1 × 100 %
Δ Q l o s s , % = Q l o s s , % i Q l o s s , % 2 Q l o s s , % 2 Q l o s s , % 1 × 100 %
where Cib_cyc is the energy recovery ratio Cb_cyc of control strategy i (I = 1, 2, 3); Qiloss,% is the battery capacity loss rate Qloss,% of control strategy i (i = 1, 2, 3).
The comparison results of regenerative braking performance among the three strategies are listed in Table 7.
As depicted in Figure 21, regenerative braking efficiency ηb under three control strategies are 49.59%, 84.43% and 76.51%, respectively. The energy recovery ratio Cb_cyc under three control strategies are 8.5%, 24.8% and 22.1%, respectively.
The Cb_cyc slightly reduced by 16.6% and the Qloss,% reduced by 79.2%. It infers that the strategy 3 can improve battery life to a certain extent with less loss of braking energy recovery. This means that strategy 3 balances the regenerative braking energy and the battery capacity attenuation as much as possible. The mitigation effect of the strategy 3 on the battery capacity loss should be more clearly presented, especially during the entire battery life. Therefore, the results of Qloss,% after 1000–10,000 times under WLTP driving cycles are shown in Table 8.
As shown in Table 8, the battery Qloss,% gradually increases with the number of WLTP driving cycles. After 10,000 WLTP driving cycles, Qloss,% under control strategy 1 is 19.64%. By comparison, Qloss,% under control strategy 2 and control strategy 3 are 36.52% and 24.97%, respectively. It can indicate that the proposed control strategy 3 avoids the negative impact of the large braking feedback of strategy 2 on battery life and inherits the battery friendliness of control strategy 1. Therefore, the proposed control strategy 3, namely the switchable-work-point strategy, has better comprehensive braking performance, which can provide a feasible reference for regenerative braking control strategy development.

6. Conclusions

In this paper, a RRBCS with the rate and shape of battery current consideration is proposed to balance the comprehensive regenerative braking performance and battery service life. The test results validate the effectiveness and feasibility of the proposed control strategy. Firstly, The IRBCS based on OSR is introduced, and the aim anti-lock control braking torque based on OSR is provided to improve braking performance while maximizing braking energy recovery. It has been shown that, as expected, IRBCS can achieve good follow-up control of the target slip ratio by DFLC. During the control process, the actual slip ratio responds quickly without overshooting. At the same time, under the three types of tire–road adhesion conditions, IRBCS can maximize the braking energy regenerative efficiency while guaranteeing good braking efficiency with the energy regenerative ratio is 82.46%, 86.43% and 100%, respectively. Moreover, three different braking energy recovery strategies, namely the best-braking-performance strategy (Control strategy 1), the maximum-regeneration-efficiency strategy (Control strategy 2, IRBCS), and the switchable-work-point strategy (Control strategy 3, RRCBS) are implemented and analyzed during WLTP driving cycle. The experimental results indicate the effectiveness and adaptability of the RRBCS. About 37% of work-points are switched from Wc2 to WC1 under strategy 3, with regenerative brake efficiency slightly reduced by 16.6% and the decline in the battery’s capacity reduced by 79.2%, it infers that the RRBCS can reduce Qloss,% to extend its service life significantly with less loss of braking energy recovery. The research methods and conclusions proposed in this paper can provide a powerful reference for regenerative braking control strategy design of R-EEVs.

Author Contributions

Y.L. managed the project; Y.F. conceptualized the scheme; H.L. conceived the control method, completed the modeling, performed the simulation experiments, and finished the manuscript; X.L. collected the data and reviewed the paper. All authors have read and agreed to the published version of the manuscript.

Funding

This research was funded by 1. [Project of The National Key Research and Development Program of China] grant number [2016YFB0101402-21]; 2. [Science and Technology Project of Qingdao] grant number [18-1-2-17-zhc]; 3. [Science and Technology Planning Project of Jilin Province] grant number [20180520071JH].

Conflicts of Interest

The authors declare no conflicts of interest.

References

  1. Du, J.; Ouyang, D. Progress of Chinese electric vehicles industrialization in 2015: A review. Appl. Energy 2016, 188, 529–546. [Google Scholar] [CrossRef]
  2. Ma, H.; Balthasar, F.; Tait, N.; Riera-Palou, X.; Harrison, A. A new comparison between the life cycle greenhouse gas emissions of battery electric vehicles and internal combustion vehicles. Energy Policy 2012, 44, 160–173. [Google Scholar] [CrossRef]
  3. Chen, B.; Wu, Y.; Tsai, H. Design and analysis of power management strategy for range extended electric vehicle using dynamic programming. Appl. Energy 2014, 113, 1764–1774. [Google Scholar] [CrossRef]
  4. Qiu, C.; Wang, G. New evaluation methodology of regenerative braking contribution to energy efficiency improvement of electric vehicles. Energy Convers. Manag. 2016, 119, 389–398. [Google Scholar] [CrossRef]
  5. Shi, Q.; Zhang, X.; Chen, F. Multi-lookup table based regenerative braking strategy of plug-in hybrid electric vehicle. Appl. Mech. Mater. 2010, 44, 1509–1513. [Google Scholar] [CrossRef]
  6. Ko, J.; Ko, S.; Kim, I.; Hyun, D.; Kim, H. Cooperative control for regenerative braking and friction braking to increase energy recovery without wheel lock. Int. J. Autom. Technol. 2014, 15, 253–262. [Google Scholar] [CrossRef]
  7. Guo, J.; Jian, X.; Lin, G. Performance evaluation of an anti-lock braking system for electric vehicle with a fuzzy sliding mode controller. Energies 2014, 7, 6459–6476. [Google Scholar] [CrossRef] [Green Version]
  8. Kumar, C.N.; Subramanian, S.C. Cooperative control of regenerative braking and friction braking for a hybrid electric vehicle. Proc. Inst. Mech. Eng. J. Automob. Eng. 2015, 230, 103–116. [Google Scholar] [CrossRef]
  9. Zhang, J.; Lv, C.; Gou, J.; Kong, D. Cooperative control of regenerative braking and hydraulic braking of an electrified passenger car. J. Automob. Eng. 2012, 226, 1289–1302. [Google Scholar] [CrossRef]
  10. Qiu, C.; Wang, G.; Meng, M.; Shen, Y. A novel control strategy of regenerative braking system for electric vehicles under safety critical driving situations. Energy 2018, 149, 329–340. [Google Scholar] [CrossRef]
  11. Yin, G.; Jin, X. Cooperative Control of Regenerative Braking and Antilock Braking for a Hybrid Electric Vehicle. Math. Probl. Eng. 2013, 4, 1–9. [Google Scholar] [CrossRef] [Green Version]
  12. Wei, Z.; Xu, J.; Halim, D. Braking force control strategy for electric vehicles with load variation and wheel slip considerations. IET Electr. Syst. Transp. 2017, 7, 41–47. [Google Scholar] [CrossRef]
  13. Li, L.; Zhang, Y.; Yang, C. Model predictive control-based efficient energy recovery control strategy for regenerative braking system of hybrid electric bus. Energy Convers. Manag. 2016, 111, 299–314. [Google Scholar] [CrossRef]
  14. Guo, H.; He, H.; Sun, F. A Combined Cooperative Braking Model with a Predictive Control Strategy in an Electric Vehicle. Energies 2013, 6, 6455–6475. [Google Scholar] [CrossRef]
  15. Kunagone, K.; Werachet, K.N. Performance Evaluation of Regenerative Braking System Based on a HESS in Extended Range BEV. J. Electr. Eng. Technol. 2018, 13, 1965–1977. [Google Scholar]
  16. Hoseinnezhad, R.; Bab-Hadiashar, A. Efficient antilock braking by direct maximization of tire–road frictions. IEEE Trans. Ind. Electron. 2011, 58, 3593–3600. [Google Scholar] [CrossRef]
  17. Deepak, P.; Efstathios, V.; Cao, D.P.; Tamas, D. Optimal μ-Estimation-Based Regenerative Braking Strategy for an AWD HEV. IEEE Trans. Transp. Electrif. 2017, 3, 249–258. [Google Scholar]
  18. Zhu, Q.; Wang, Q.F.; Chen, Q.H. Component sizing for compound hybrid excavators. Proc. Inst. Mech. Eng. J. Automob. Eng. 2015, 230, 969–982. [Google Scholar] [CrossRef]
  19. Wu, J.; Wang, X.; Li, L.; Qin, C.; Du, Y. Hierarchical control strategy with battery aging consideration for hybrid electric vehicle regenerative braking control. Energy 2018, 145, 301–312. [Google Scholar] [CrossRef]
  20. Maia, R.; Silva, M.; Araújo, R.; Nunes, U. Electrical vehicle modeling: A fuzzy logic model for regenerative braking. Expert Syst. Appl. 2015, 42, 8504–8519. [Google Scholar] [CrossRef]
  21. Topalov, A.V.; Oniz, Y.; Kayacan, E.; Kaynak, O. Neuro-fuzzy control of antilock braking system using sliding mode incremental learning algorithm. Neurocomputing 2011, 74, 1883–1893. [Google Scholar] [CrossRef]
  22. Roumila, Z.; Rekioua, D.; Rekioua, T. Energy management based fuzzy logic controller of hybrid system wind/photovoltaic/diesel with storage battery. Int. J. Hydrog. Energy 2017, 42, 19525–19535. [Google Scholar] [CrossRef]
  23. Abdel-Monem, M.; Trad, K.; Omar, N.; Hegazy, O.; Peter, V.D.B.; Van Mierlo, J. Influence analysis of static and dynamic fast-charging current profiles on ageing performance of commercial lithium-ion batteries. Energy 2017, 120, 179–191. [Google Scholar] [CrossRef]
  24. Kevin, L.; Gering, A.; Sergiy, V.; Sazhin, A. Investigation of path dependence in commercial lithium-ion cells chosen for plug-in hybrid vehicle duty cycle protocols. J. Power Sources 2011, 196, 3395–3403. [Google Scholar]
  25. Aksjonov, A.; Vodovozov, V.; Augsburg, K.; Petlenkov, E. Design of regenerative anti-lock braking system controller for 4 in-wheel-motor drive electric vehicle with road surface estimation. Int. J. Automot. Technol. 2018, 19, 727–742. [Google Scholar] [CrossRef] [Green Version]
  26. Li, J.; Jin, X.; Xiong, R. Multi-objective optimization study of energy management strategy and economic analysis for a range-extended electric bus. Energy Policy 2017, 194, 798–807. [Google Scholar] [CrossRef]
  27. Jiang, Y.; Jiang, J.; Zhang, C.; Zhang, W.; Gao, Y.; Guo, Q. Recognition of battery aging variations for LiFePO4 batteries in 2nd use applications combining incremental capacity analysis and statistical approaches. J. Power Sources 2017, 360, 180–188. [Google Scholar] [CrossRef]
  28. Wang, J.; Purewal, J.; Liu, P.; Hicks-Garner, J.; Soukazian, S.; Sherman, E. Degradation of lithium ion batteries employing graphite negatives and nickel–cobalt–manganese oxide+ spinel manganese oxide positives: Part 1, aging mechanisms and life estimation. J. Power Sources 2014, 269, 937–948. [Google Scholar] [CrossRef]
Figure 1. Structure of range-extended electric vehicle with regenerative braking system.
Energies 13 01526 g001
Figure 2. Process of regenerative braking control strategy based on optimal slip ratio.
Energies 13 01526 g002
Figure 3. Slip ratio and friction adhesion coefficient relationship in Burckhardt tire model: (a) five typical roads; (b) identification of parameters used in tire–road adhesion coefficient recognition module.
Energies 13 01526 g003
Figure 4. Coordinate system conversion: (a) braking force; (b) slip ratio.
Energies 13 01526 g004
Figure 5. Allocation logic of braking work-point in initial regenerative braking control strategy: (a) area schematic; (b) logic schematic.
Energies 13 01526 g005
Figure 6. Simulation platform of the R-EEV.
Energies 13 01526 g006
Figure 7. Simulation result of TACRM: (a) μmax = 0.6; (b) μmax = 0.45; (c) μmax = 0.2; (d) μmax = 0.1.
Energies 13 01526 g007
Figure 8. Diagram of optimal slip ratio control process: (a) fuzzy controller of front wheel; (b) fuzzy controller of rear wheel.
Energies 13 01526 g008
Figure 9. Membership functions and output surface of the front wheel fuzzy controller: (a) ef (t); (b) s′f (t); (c) ΔTf _e(t); (d) ΔTf_m (t); (e) ΔTf _e(t); (f) ΔTf_m (t).
Energies 13 01526 g009
Figure 10. Membership functions and output surface of the rear wheel fuzzy controller: (a) er (t); (b) s′r (t); (c) ΔTr _m(t); (d) ΔTr_m (t).
Energies 13 01526 g010
Figure 11. Simulation result of the RBCS under high tire–road adhesion condition (μmax = 0.8): (a) braking strength, TAC and SoC; (b) front wheel slip rate and speed; (c) rear wheel slip rate and speed; (d) braking torque.
Energies 13 01526 g011
Figure 12. Simulation result of the RBCS under medium tire–road adhesion condition (μmax = 0.6): (a) braking strength, TAC and SoC; (b) front wheel slip rate and speed; (c) rear wheel slip rate and speed; (d) braking torque.
Energies 13 01526 g012
Figure 13. Simulation result of the RBCS under low tire–road adhesion condition (μmax = 0.35): (a) braking strength, TAC and SoC; (b) front wheel slip rate and speed; (c) rear wheel slip rate and speed; (d) braking torque.
Energies 13 01526 g013
Figure 14. Example of the current profiles of six cases: (a) case 1; (b) case 2 to case 6.
Energies 13 01526 g014
Figure 15. Function relationship of correction factor ks2 and Swc2.
Energies 13 01526 g015
Figure 16. Schematic diagram of braking work-point switching logic.
Energies 13 01526 g016
Figure 17. Simulation results of control strategy 1 and control strategy 2.
Energies 13 01526 g017
Figure 18. Work-point switching situation of strategy 3.
Energies 13 01526 g018
Figure 19. Variation of the battery SoC with three control strategies.
Energies 13 01526 g019
Figure 20. Variation of the current with three control strategies.
Energies 13 01526 g020
Figure 21. Bar chart of regenerative braking performance with three control strategies.
Energies 13 01526 g021
Table 1. Burckhardt tire mode parameters.
RoadC1C2C3
Dry asphalt1.2823.990.52
Wet asphalt1.19725.170.54
Dry cement0.85733.820.35
Wet cobblestone0.433.710.12
Ice0.05306.390.001
Table 2. Vehicle main parameters used in simulation.
ParameterValueParameterValue
Full load weight (kg)1700Brake pedal leverage ratio3.5
Wheelbase (mm) 2865Diameter of pedal travel simulator (mm)15
Battery capacity (kWh)20Distance from front axle to centroid (mm)1352
Initial SoC (state of charge)0.8Distance from rear axle to centroid (mm)1513
Centroid height (mm)500Diameter of front wheel cylinder (mm)56.95
Drag area (m2)1.66Diameter of rear wheel cylinder (mm)33.82
Correction coefficient of rotating mass1.1Diameter of master cylinder (mm)18
Mechanical efficiency0.96Effective radius of front brake rotor (mm)0.235
Transmission reduction ratio4.2Effective radius of rear brake rotor (mm)0.227
Table 3. The fuzzy control rules base of front wheel fuzzy controller.
s′f (t)NBNSZOPSPB
ef (t)NBPBPMPSZOZO
NSPBPSZOZONS
ZOPMPSZONSNM
PSPSZONSNMNB
PBZOZONMNBNB
Table 4. The fuzzy control rules base of rear wheel fuzzy controller.
s′r (t)NBNSZOPSPB
er (t)NBPMPMPSZOZO
NSPMPSZOZONS
ZOPSZOZONSNM
PSPSZONSNMNM
PBZOZONSNMNB
Table 5. Electrical parameters of battery cells.
Electrical ParametersValueElectrical ParametersValue
Typical capacity (Ah)3.65End-of-charge voltage (V)4.20±0.05
Minimum capacity (Ah)3.60End-of-discharge voltage (V)3.00
Nominal voltage (V)3.7Energy density (Wh/kg)150
Table 6. Six cases of the applied discharging process of Cn = 0.5C.
Cn = 1CId
(A)
Td
(s)
Ich
(A)
Tch
(s)
I *d
(A)
I *ch
(A)
ΔId
(A)
ΔIch
(A)
Ts
(s)
fp
Case 128121420.521
Case 212230150.20.10.521
Case 312232160.40.20.521
Case 412234170.60.30.521
Case 512236180.80.40.521
Case 612238191.00.50.521
Table 7. Comparative results regenerative braking performance with three control strategies.
Control StrategyCb_cyc (%)ηb (%)Qloss,% (%)ΔCb_cyc (%)ΔQloss,% (%)
Strategy 18.549.590.00176−100−100
Strategy 224.884.430.0032500
Strategy 322.176.510.00207−16.6−79.2
Table 8. Comparative results of Qloss,% on three control strategies.
Cycles10002000500010000
Strategy 11.773.8910.2719.64
Strategy 23.297.2419.0836.52
Strategy 32.254.9513.0524.97

