Coal Demand and Environmental Regulations: A Case Study of the Polish Power Sector


Abstract
:1. Introduction
- Directive 2003/87/EC of the European Parliament and of the Council [21], establishing a scheme for greenhouse gas emission allowance trading within the Community (the so-called ETS Directive), and Directive 2009/29/EC of the European Parliament and of the Council [25], improving and extending the emission allowance trading scheme of the Community;
- Directive 2010/75/EU of the European Parliament and of the Council [19] on industrial emissions (the so-called IED), which replaced, inter alia, Directive 2008/1/EC of the European Parliament and of the Council [26], concerning integrated pollution prevention and control (the so-called IPPC Directive), and Directive 2001/80/EC of the European Parliament and of the Council [27] on the limitation of emissions of certain pollutants into the air from large combustion plants (the so-called LCP Directive);
- Directive (EU) 2018/2001 of the European Parliament and of the Council [28], replacing Directive 2009/28/EC of the European Parliament and of the Council on the promotion of the use of energy from renewable sources (the so-called RES Directive);
- Directive (EU) 2018/2002 of the European Parliament and of the Council [29], amending Directive 2012/27/EU on energy efficiency.
2. Literature Review
3. Methodology and Data
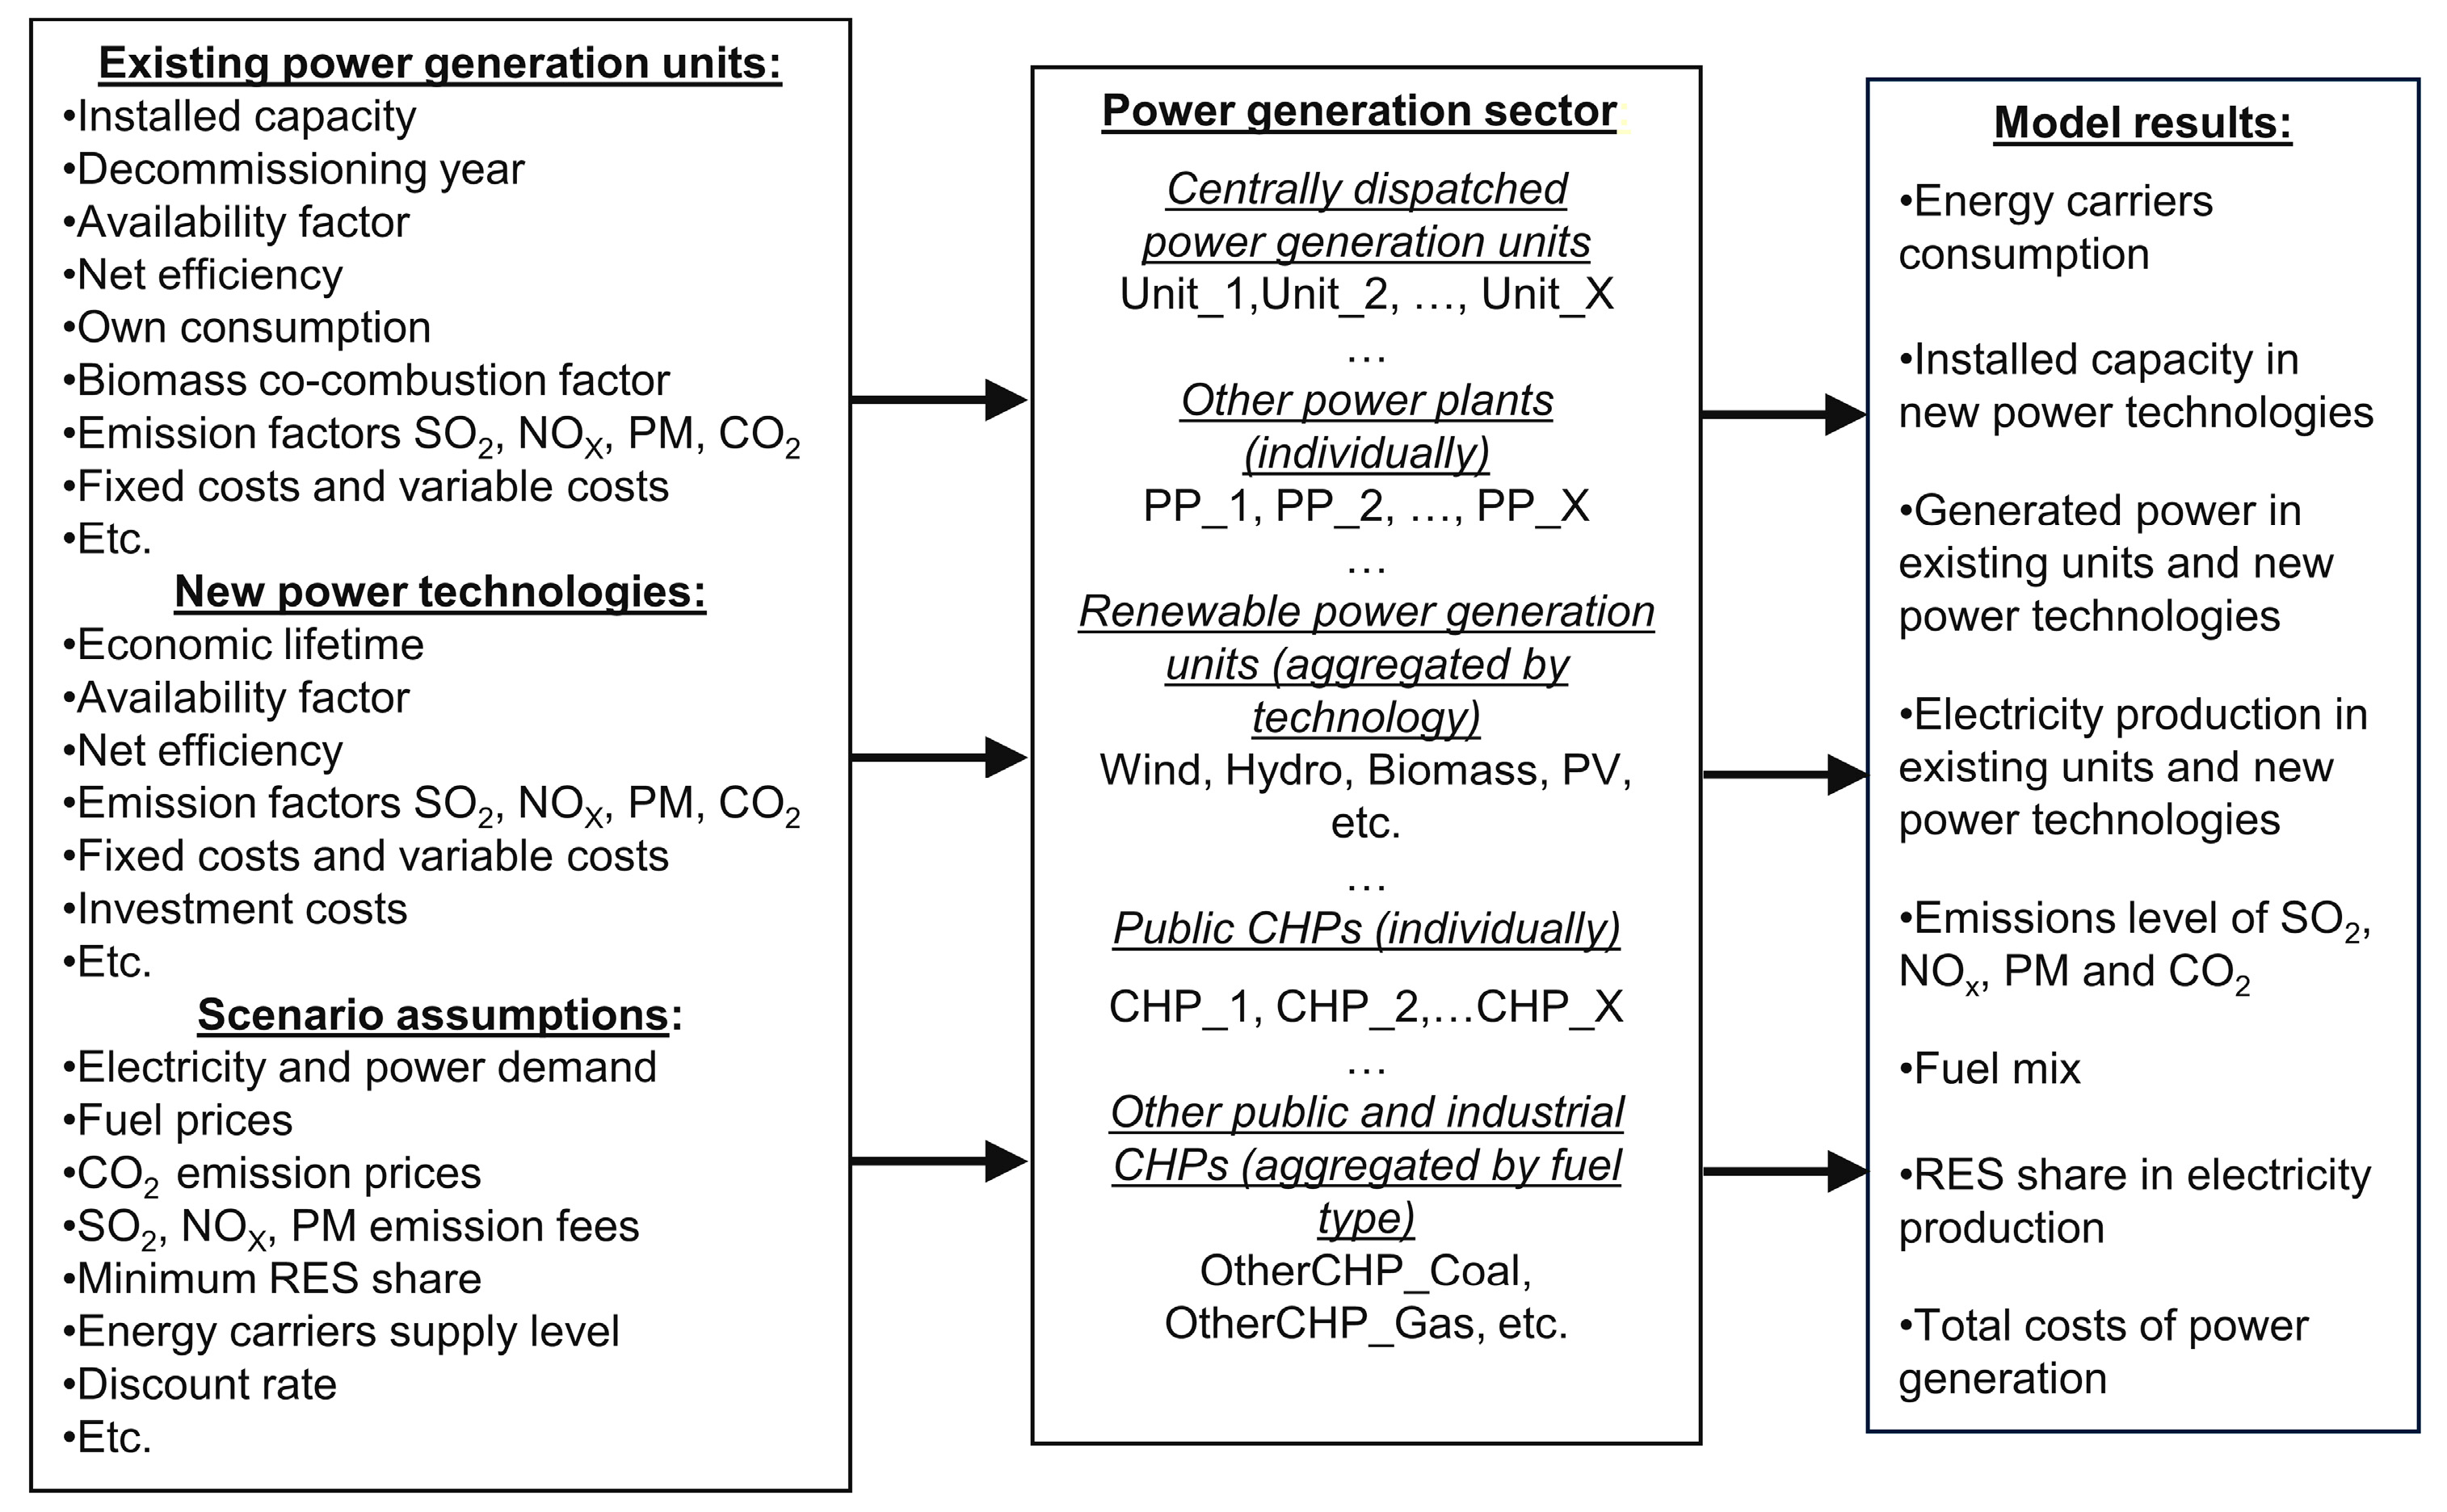
3.1. The Concept of Mathematical Model
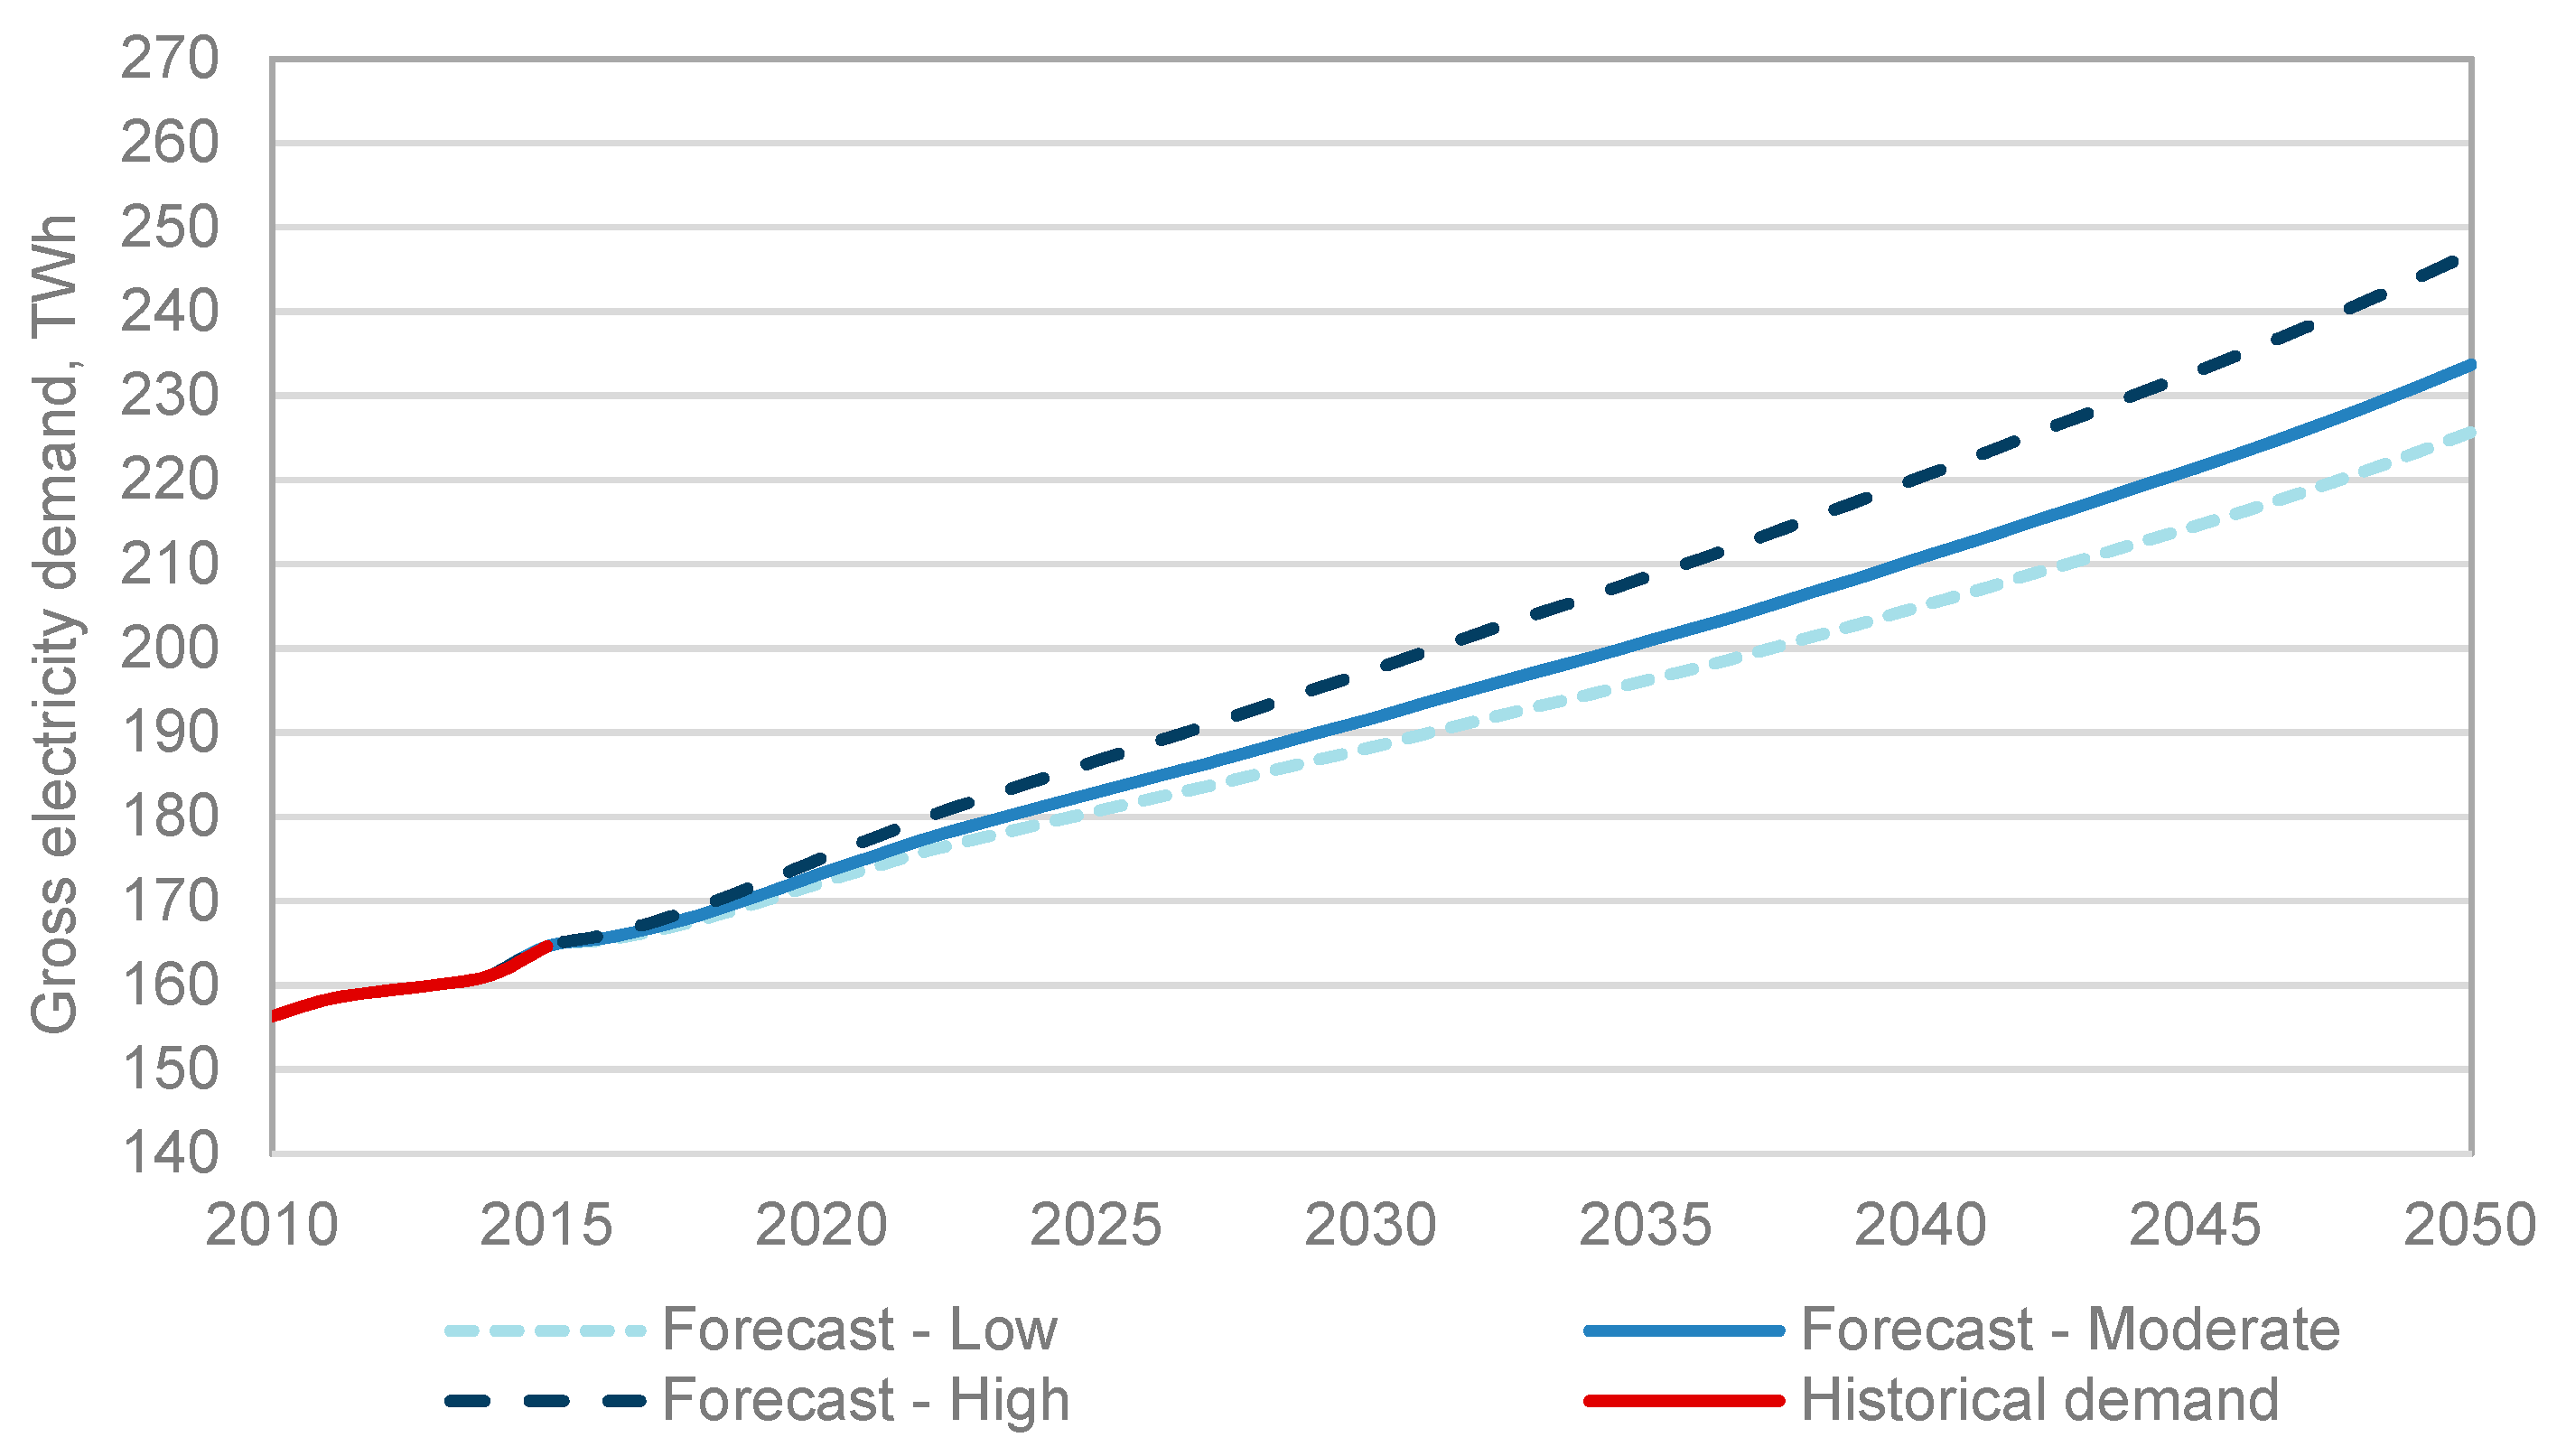
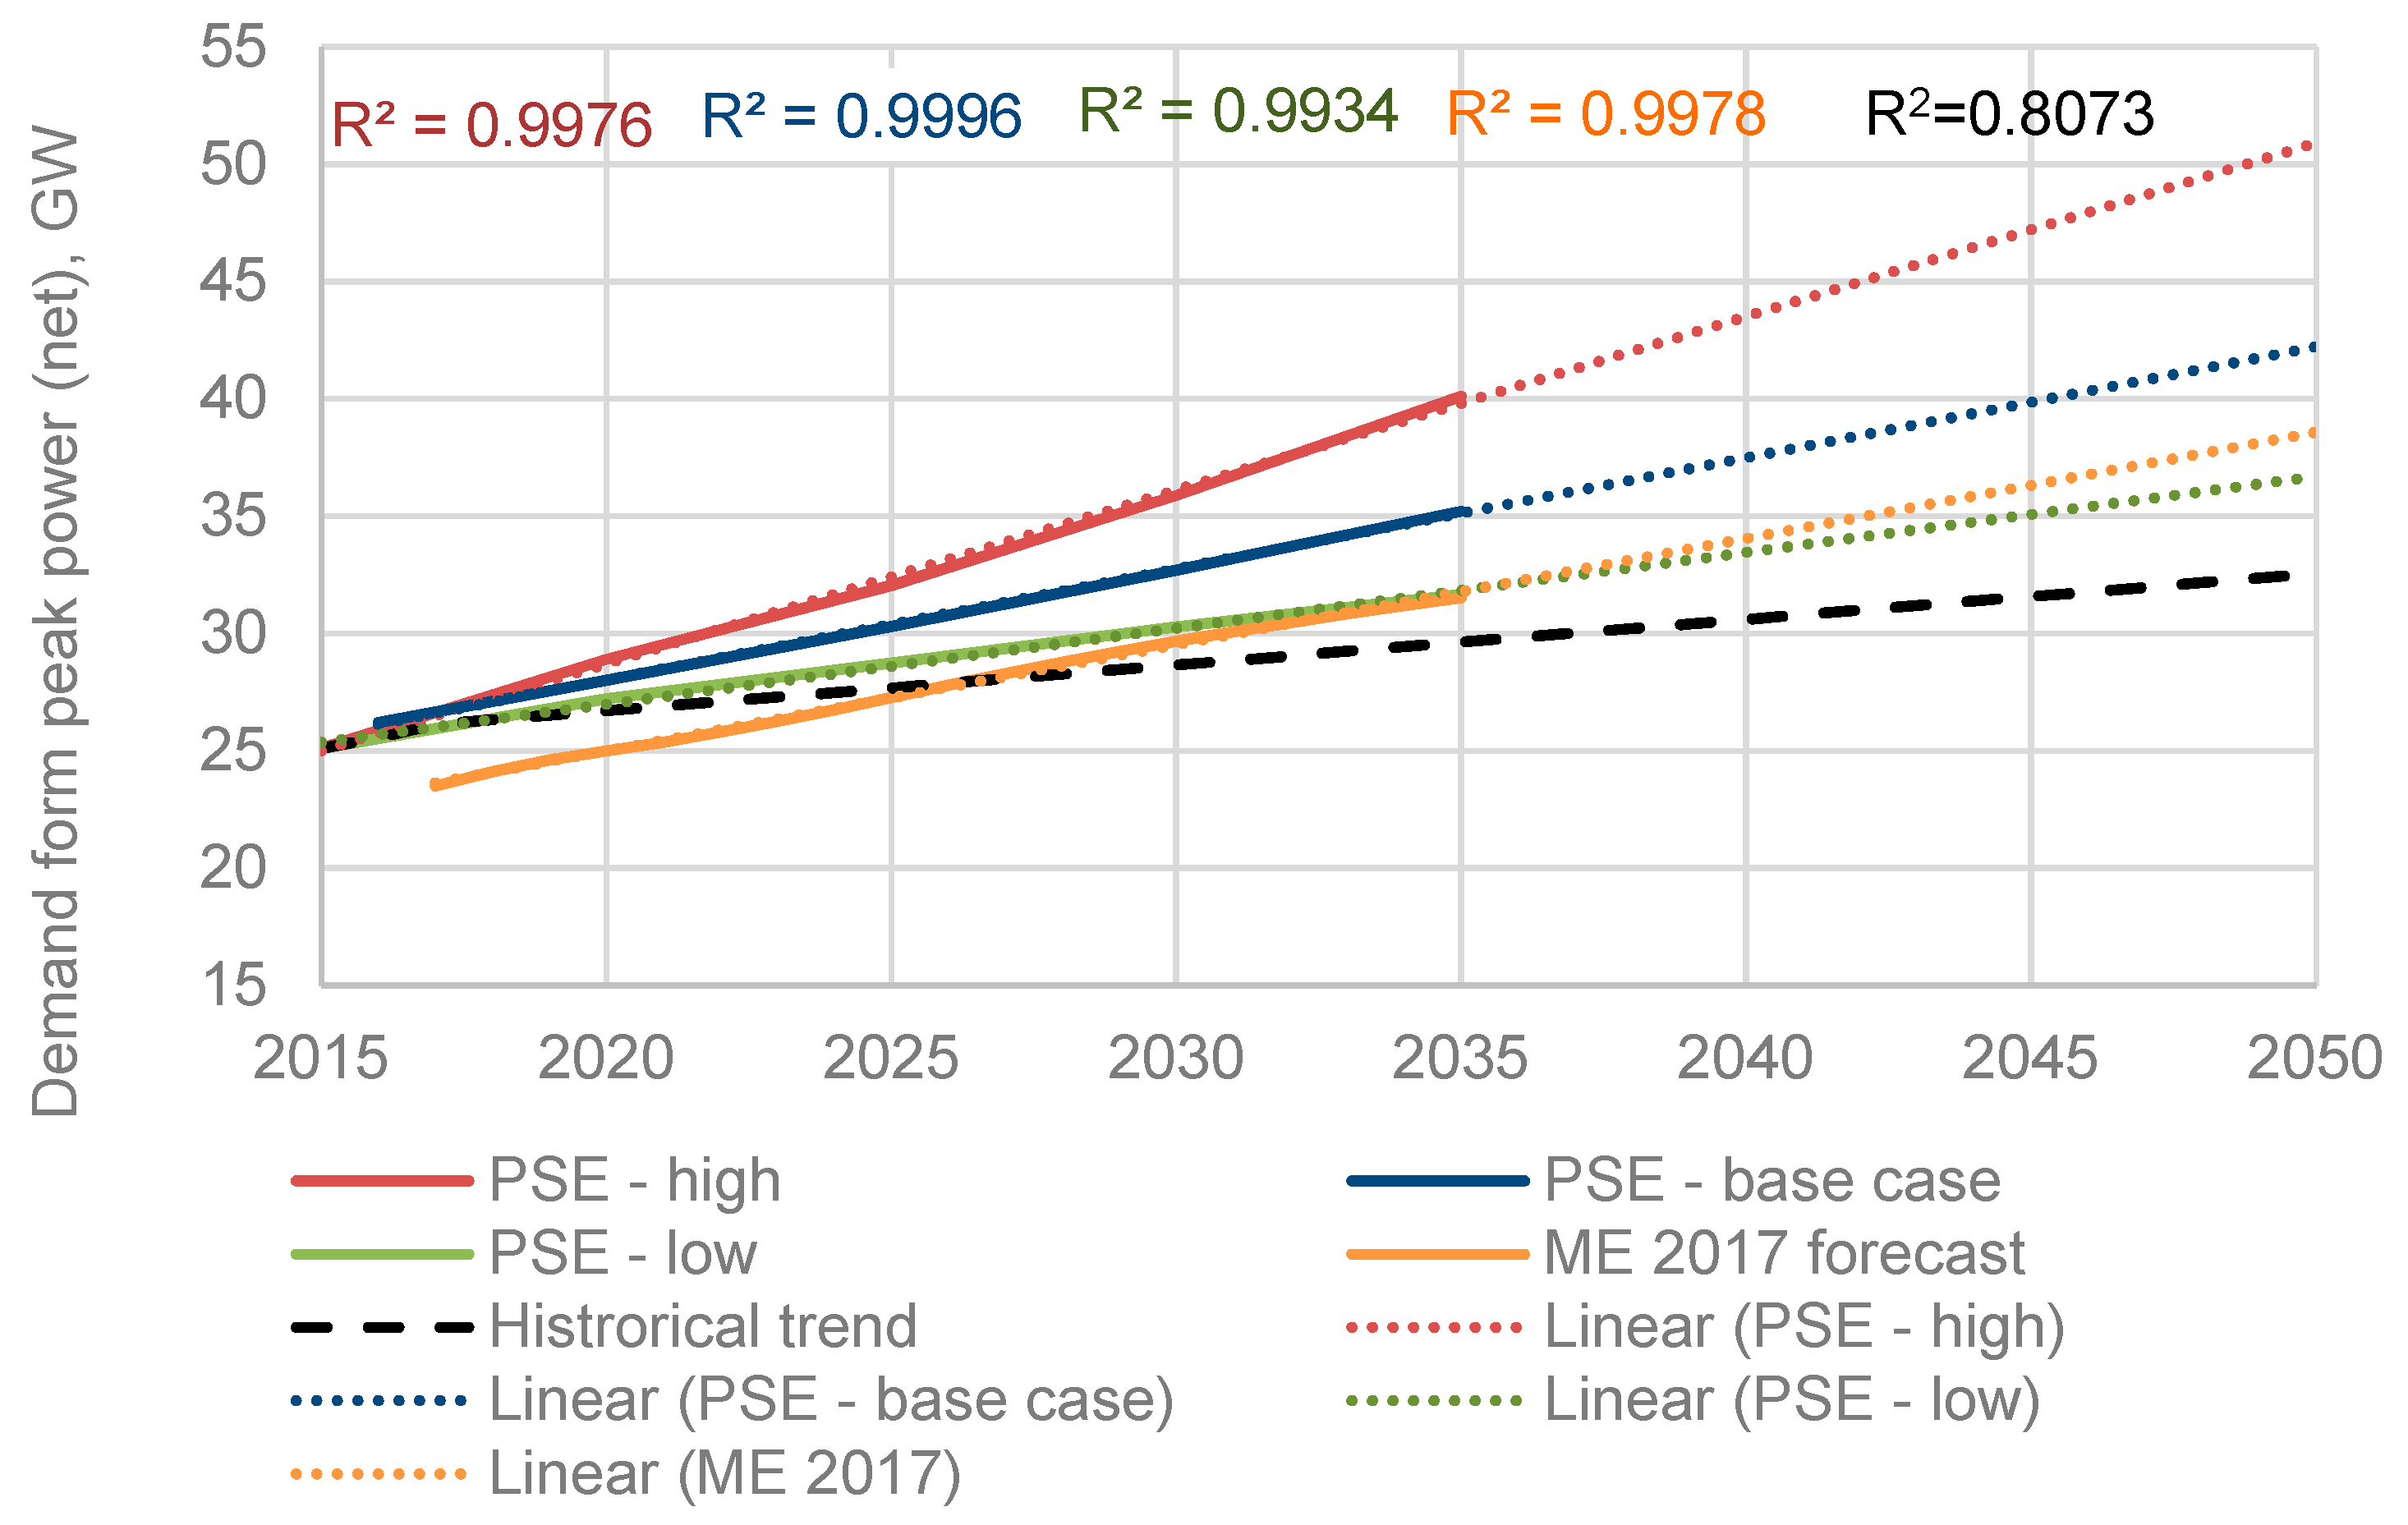
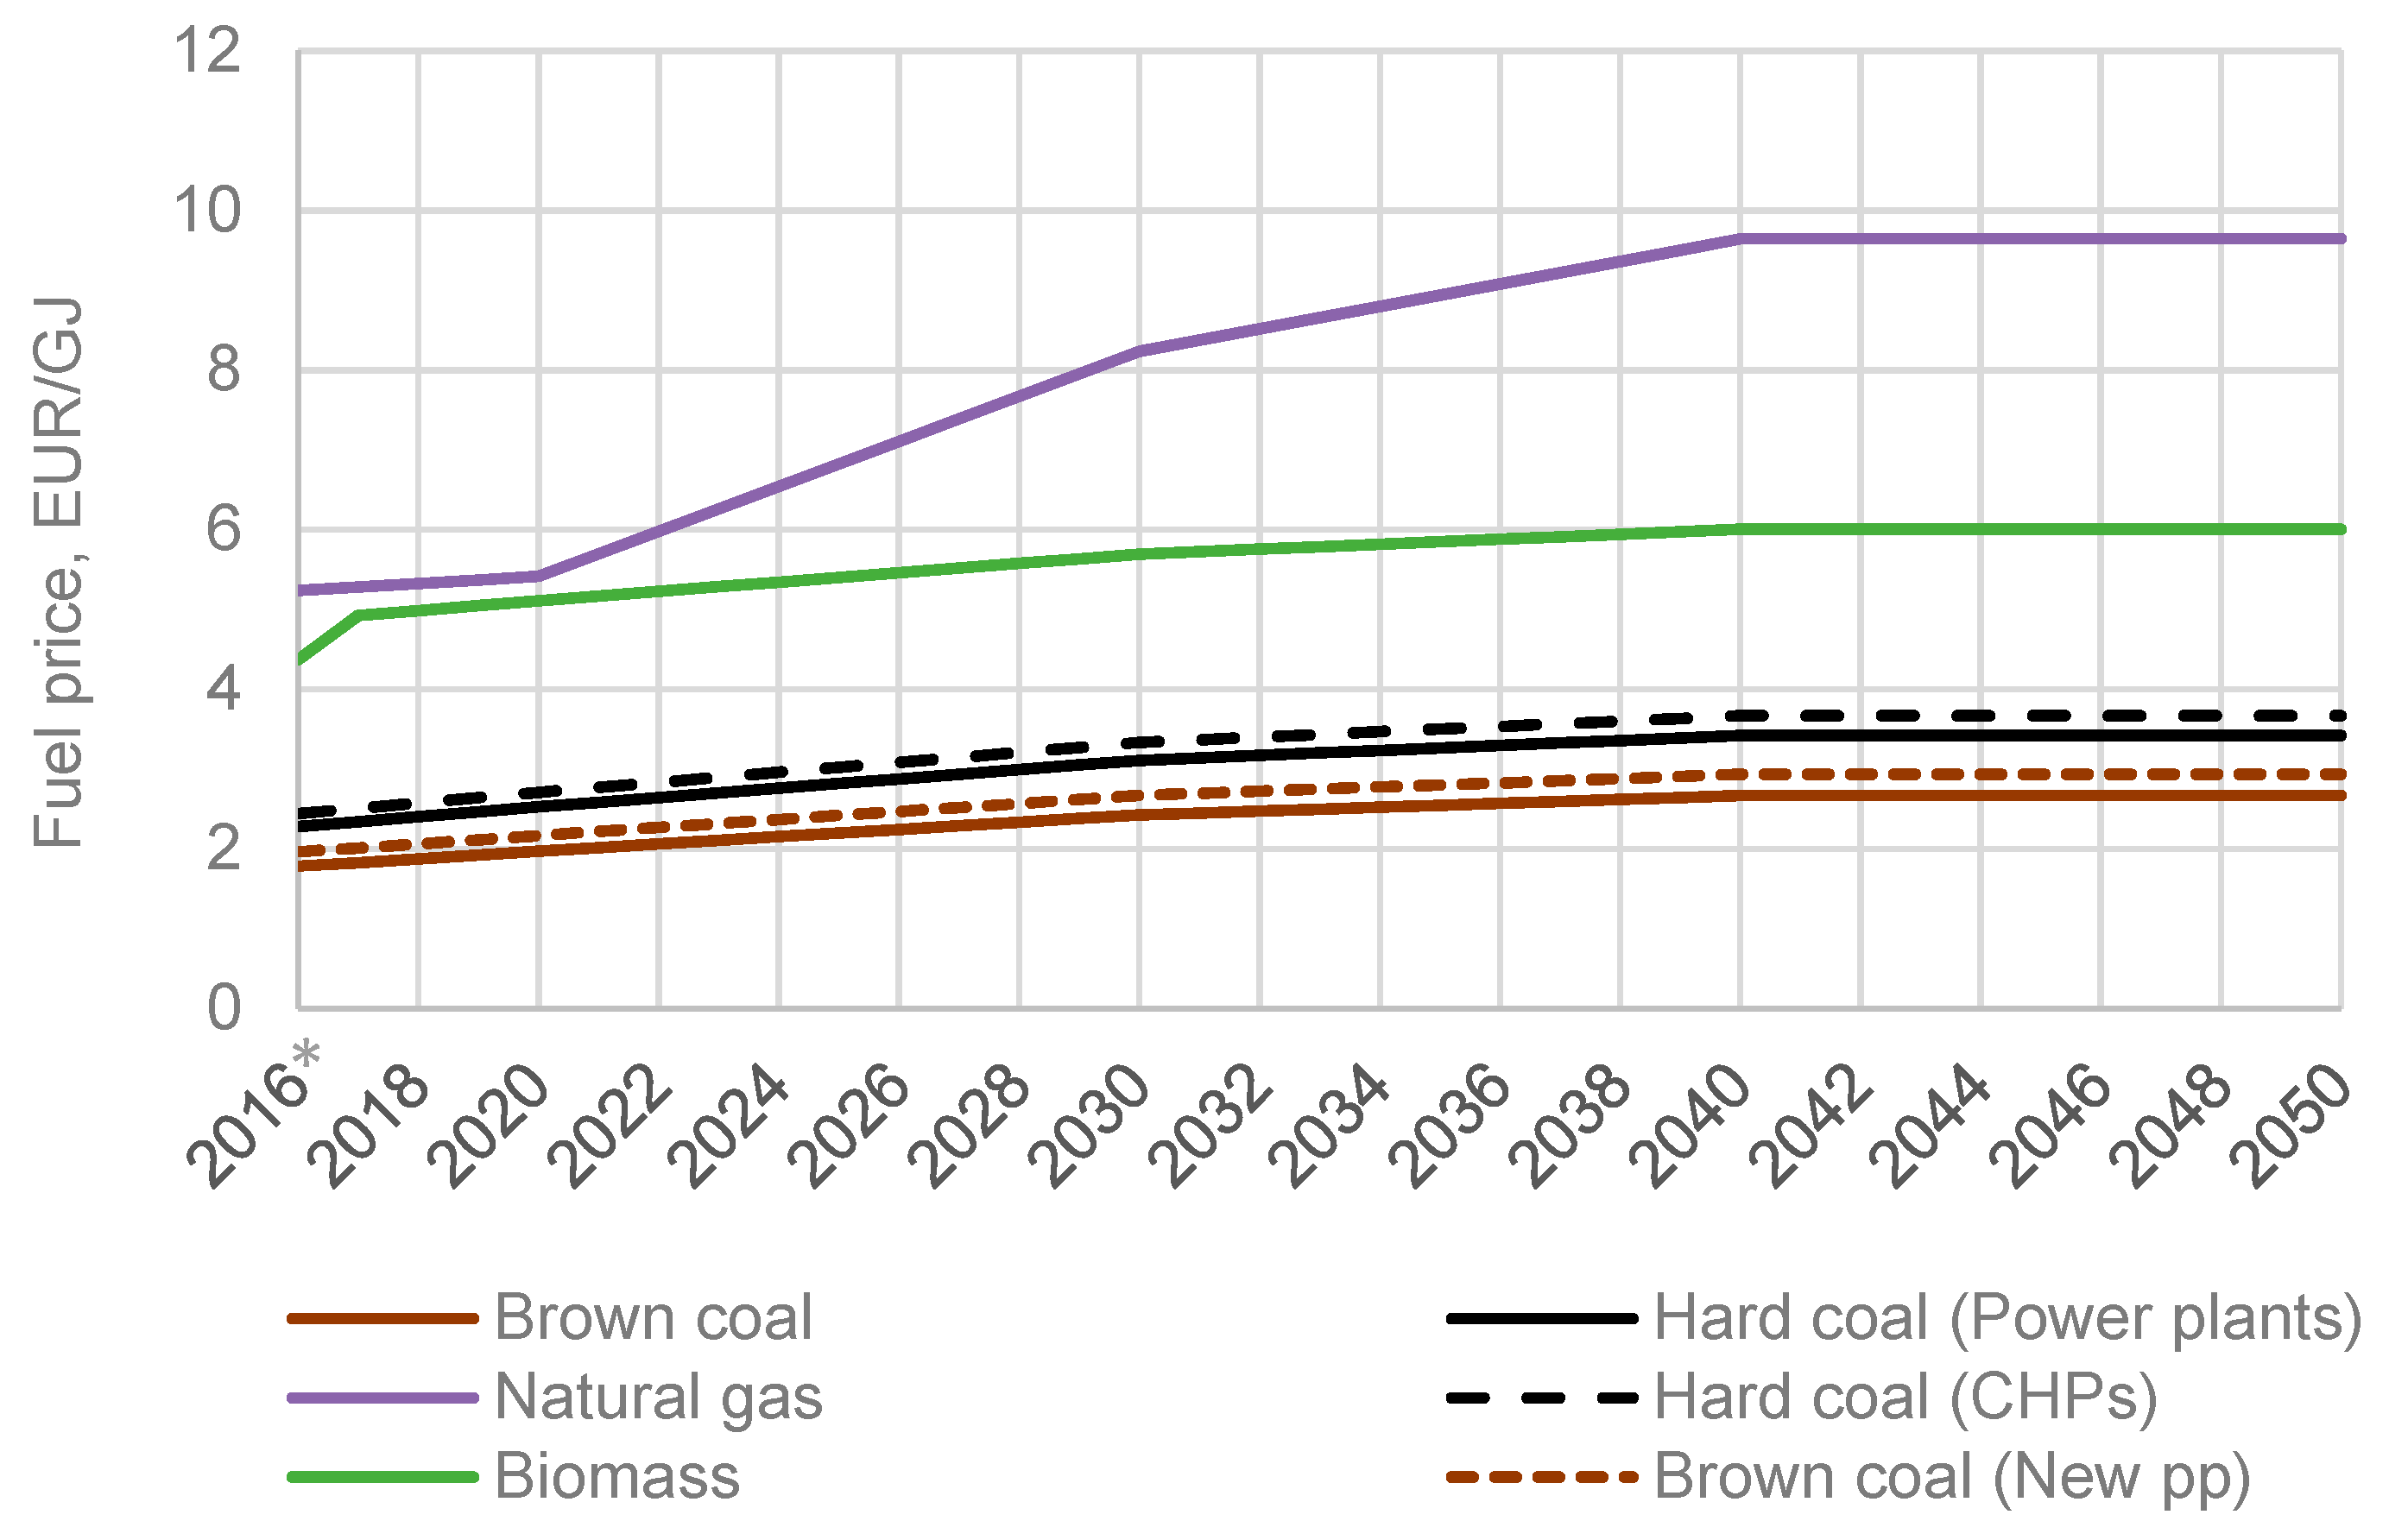
3.2. Data Assumptions
3.3. Research Scenarios
4. Results and Discussion
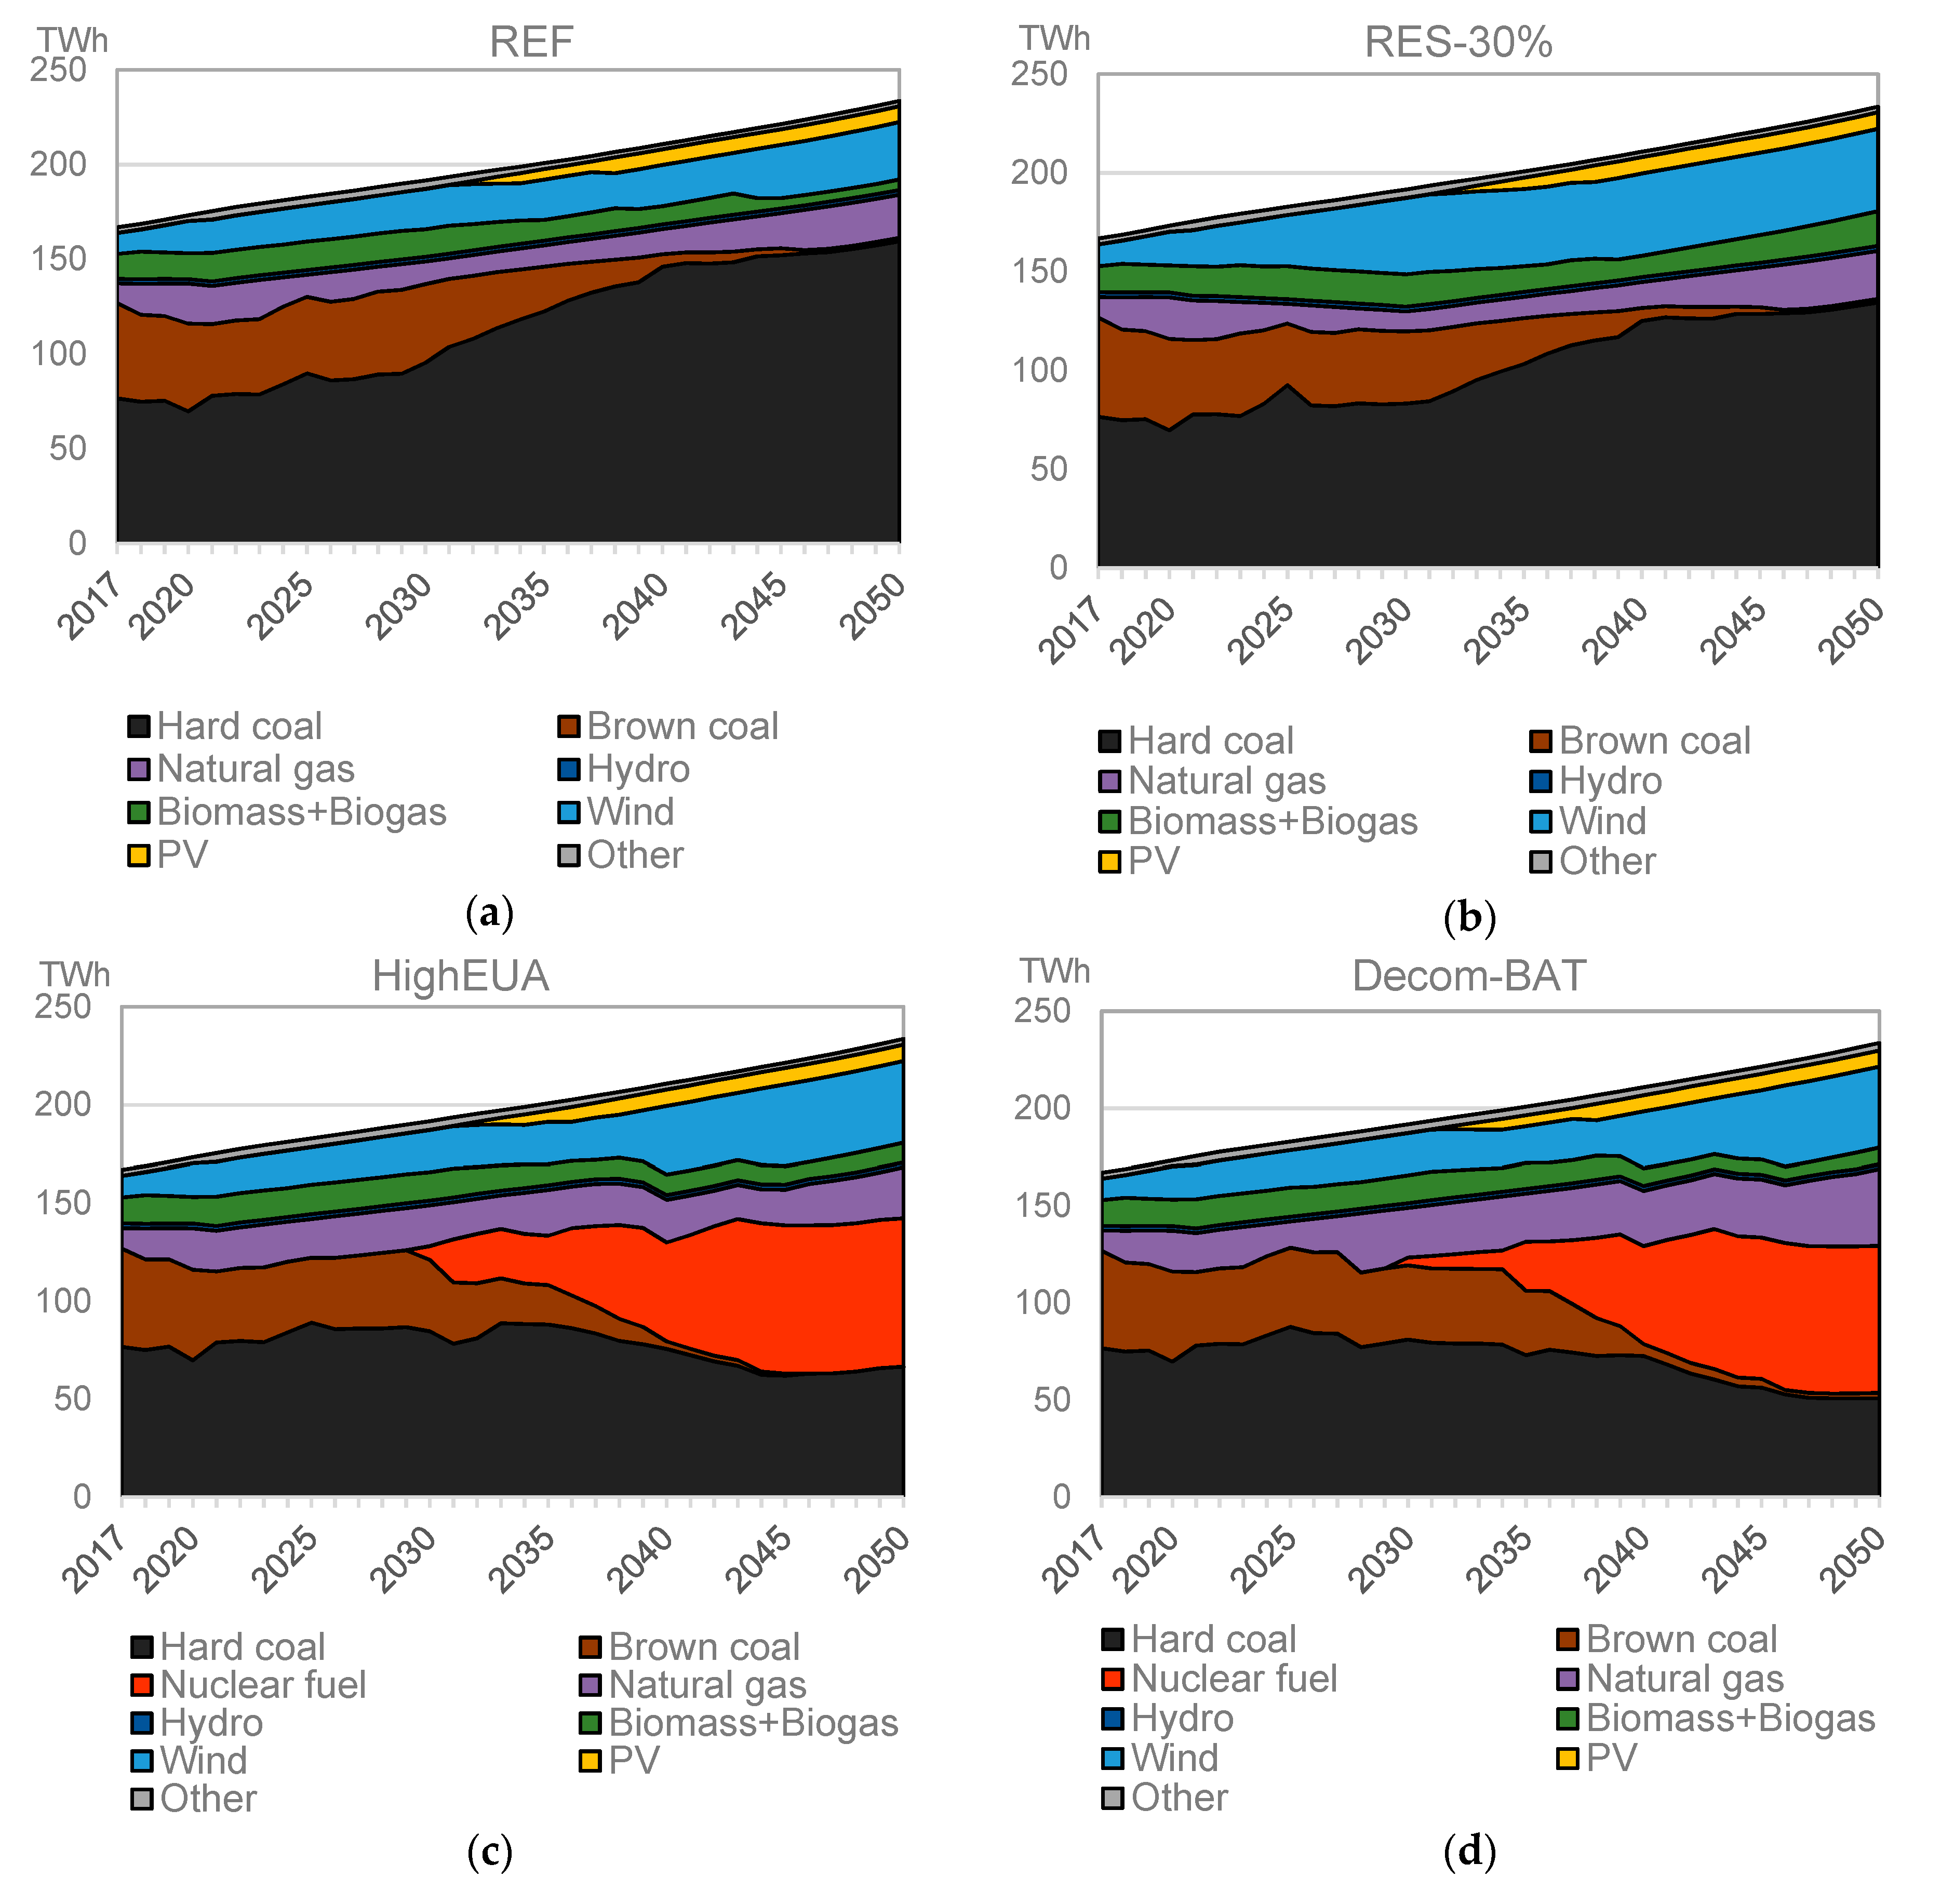
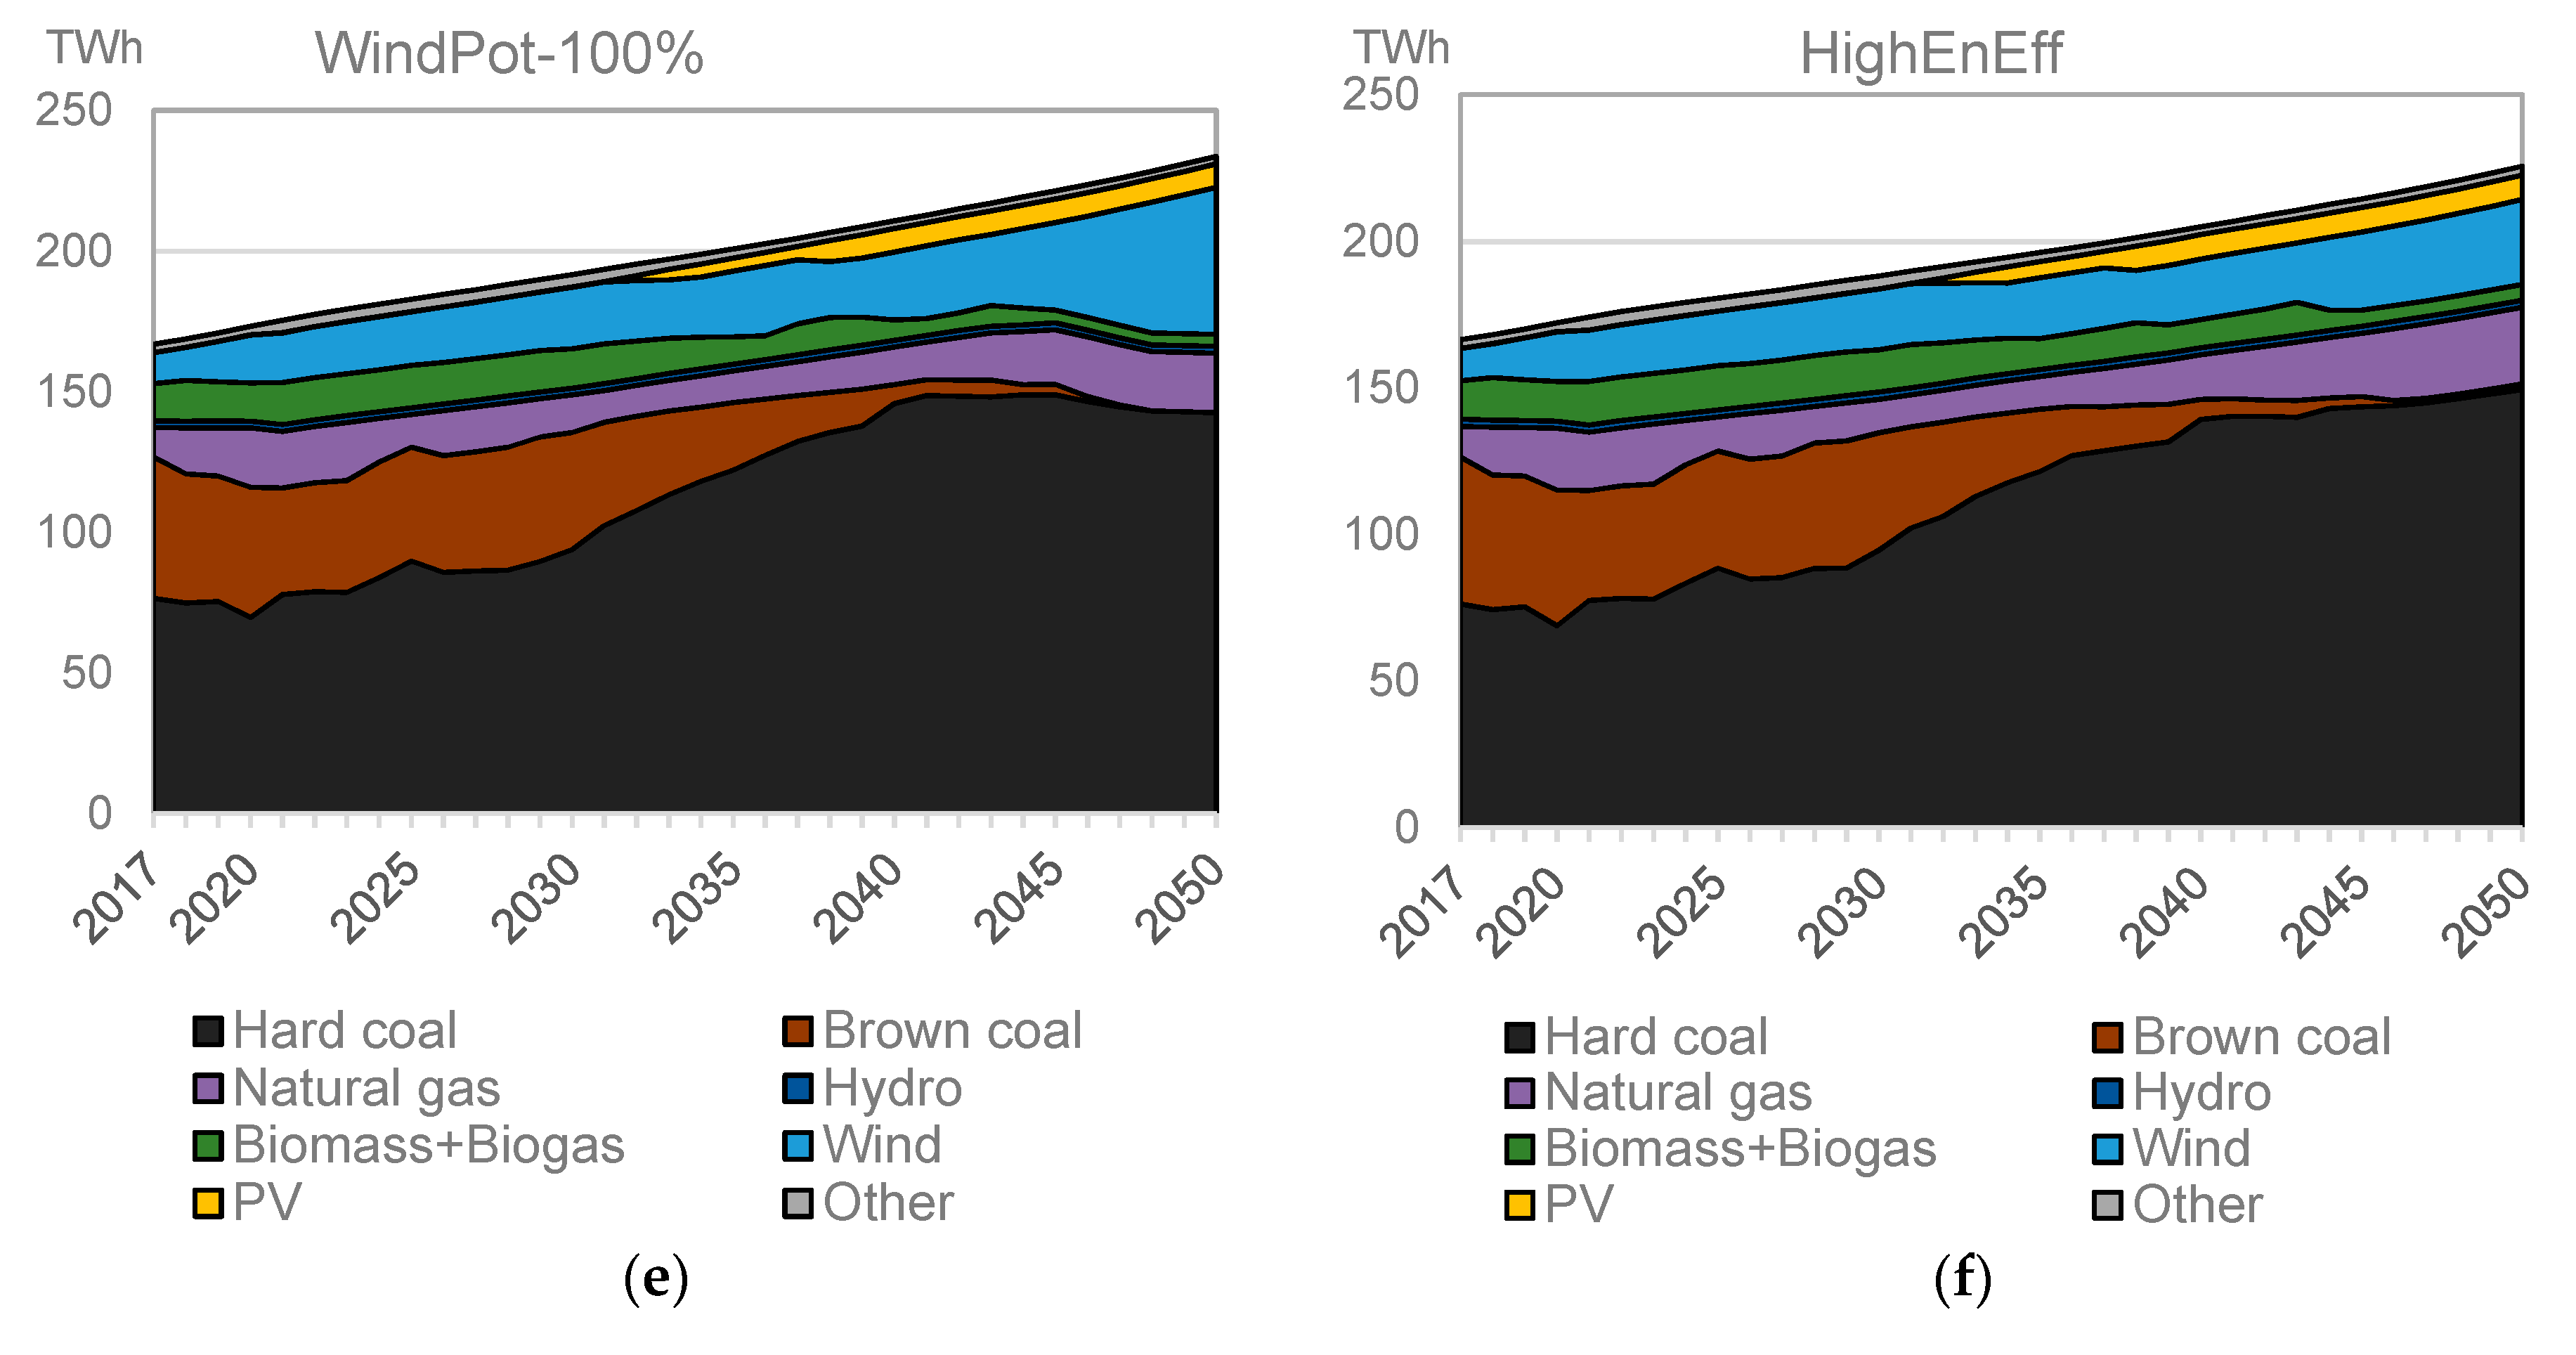
4.1. Fuel Mix in Electricity Production
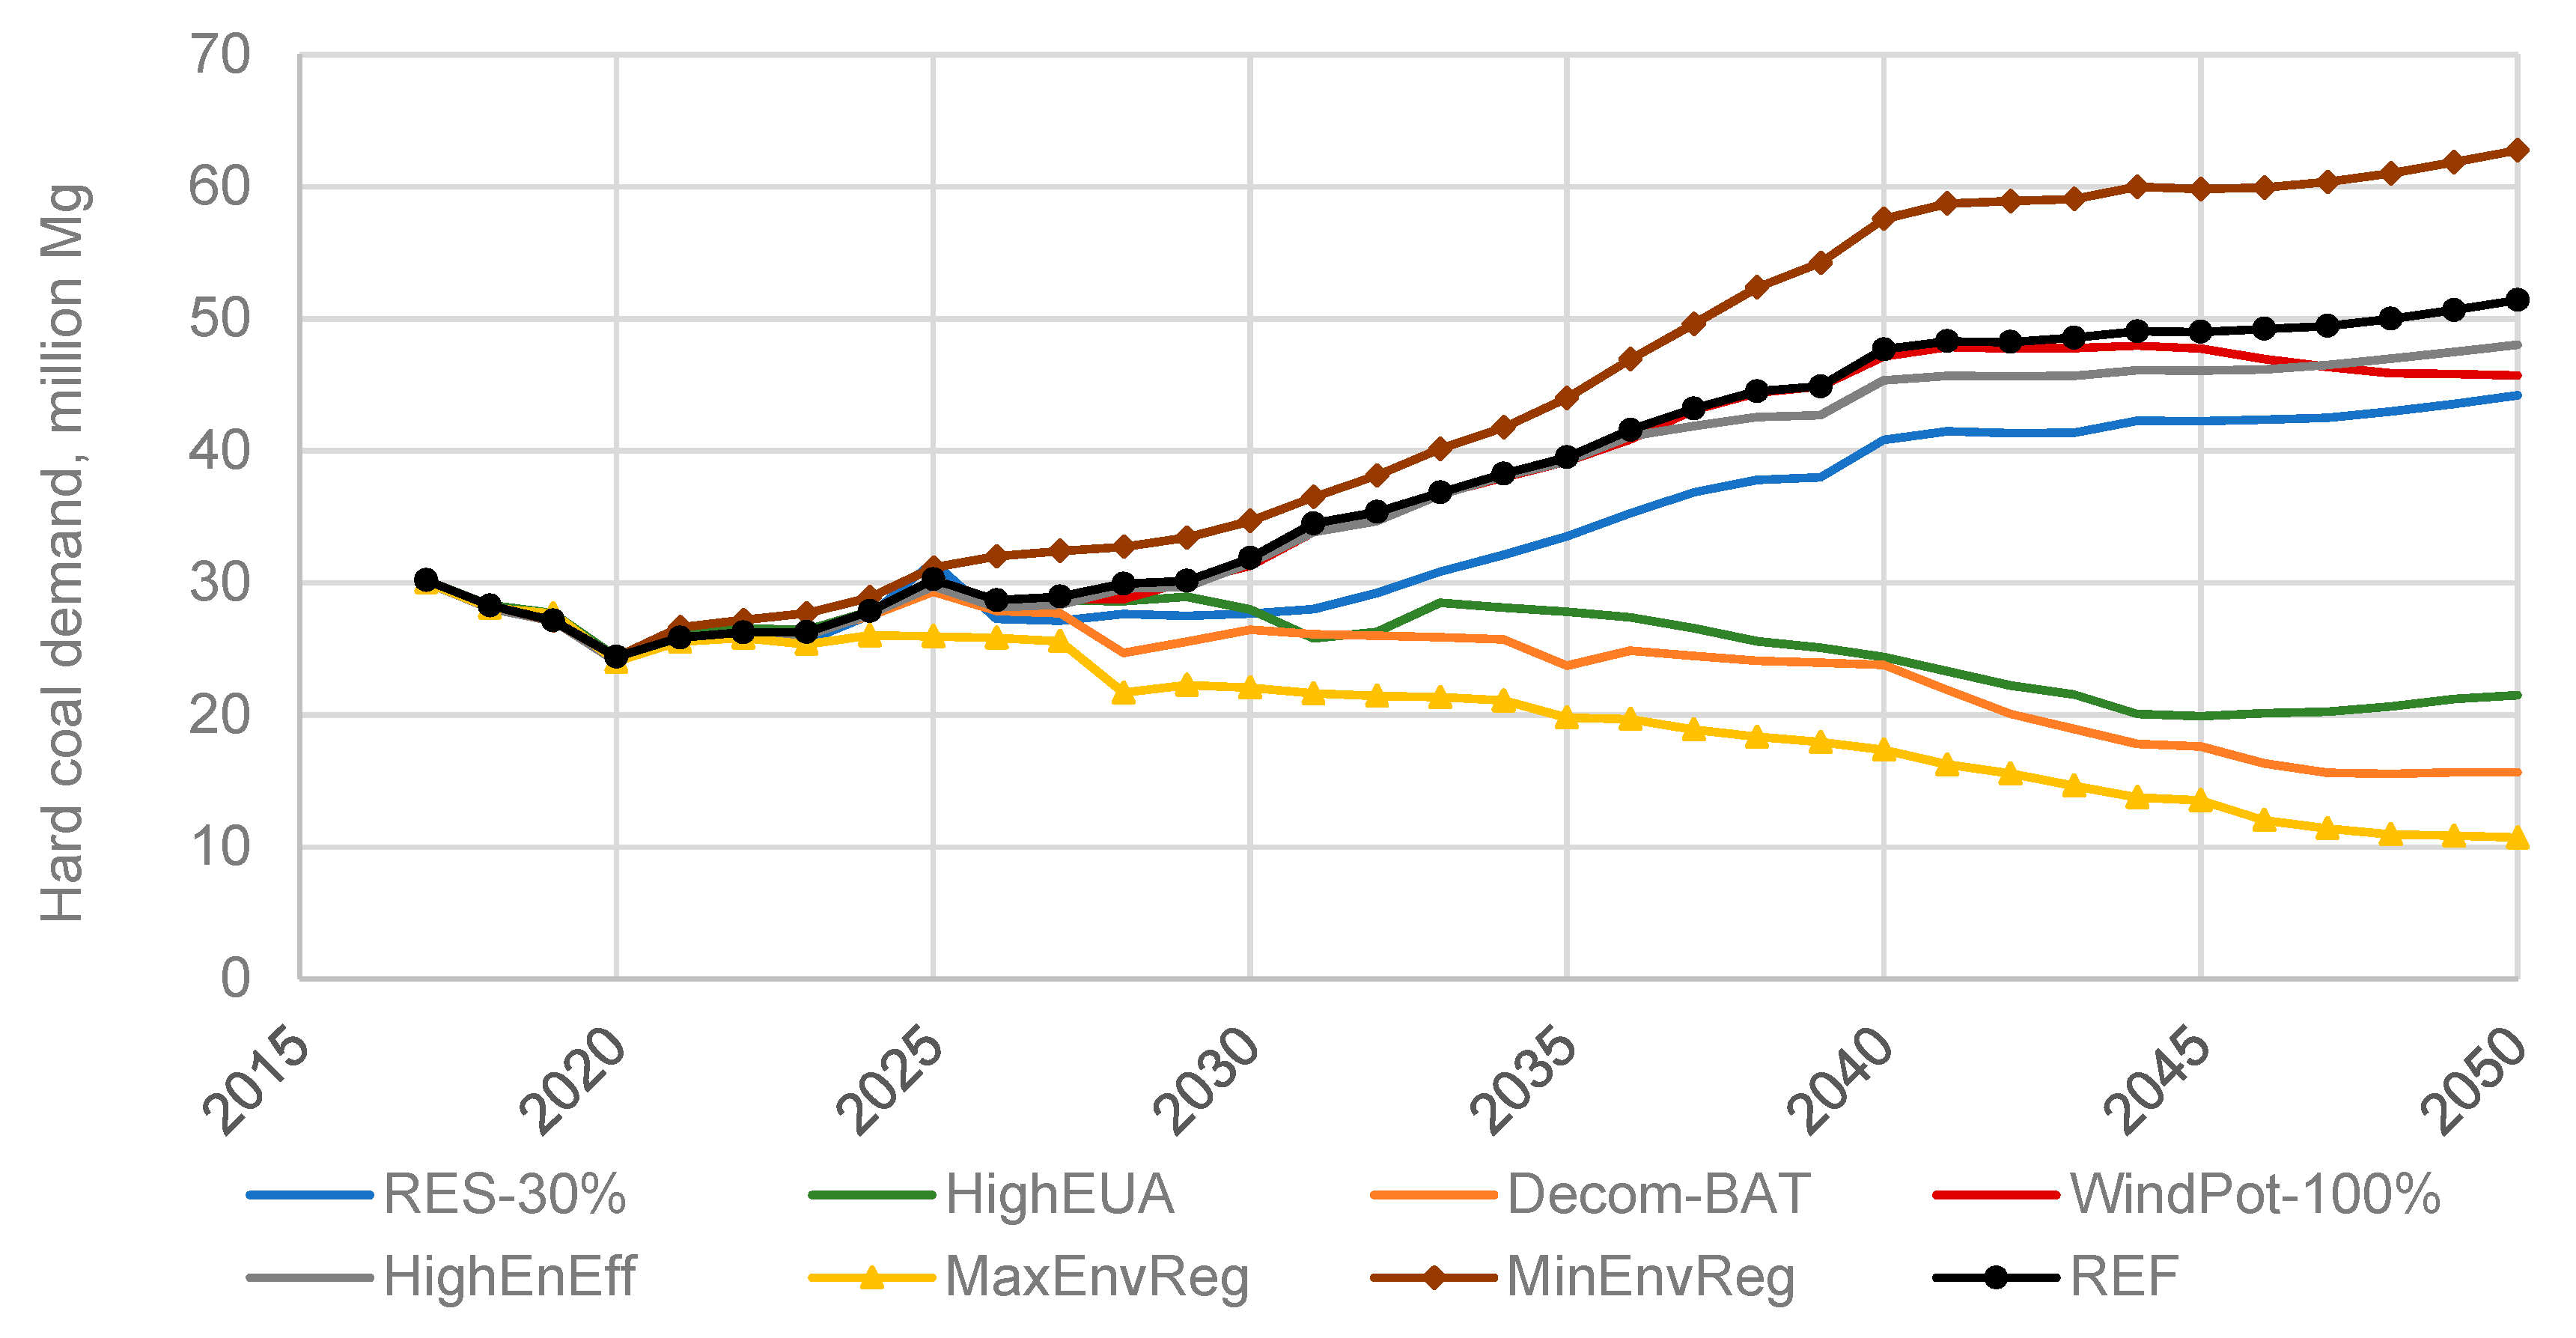
4.2. Demand for Hard Coal
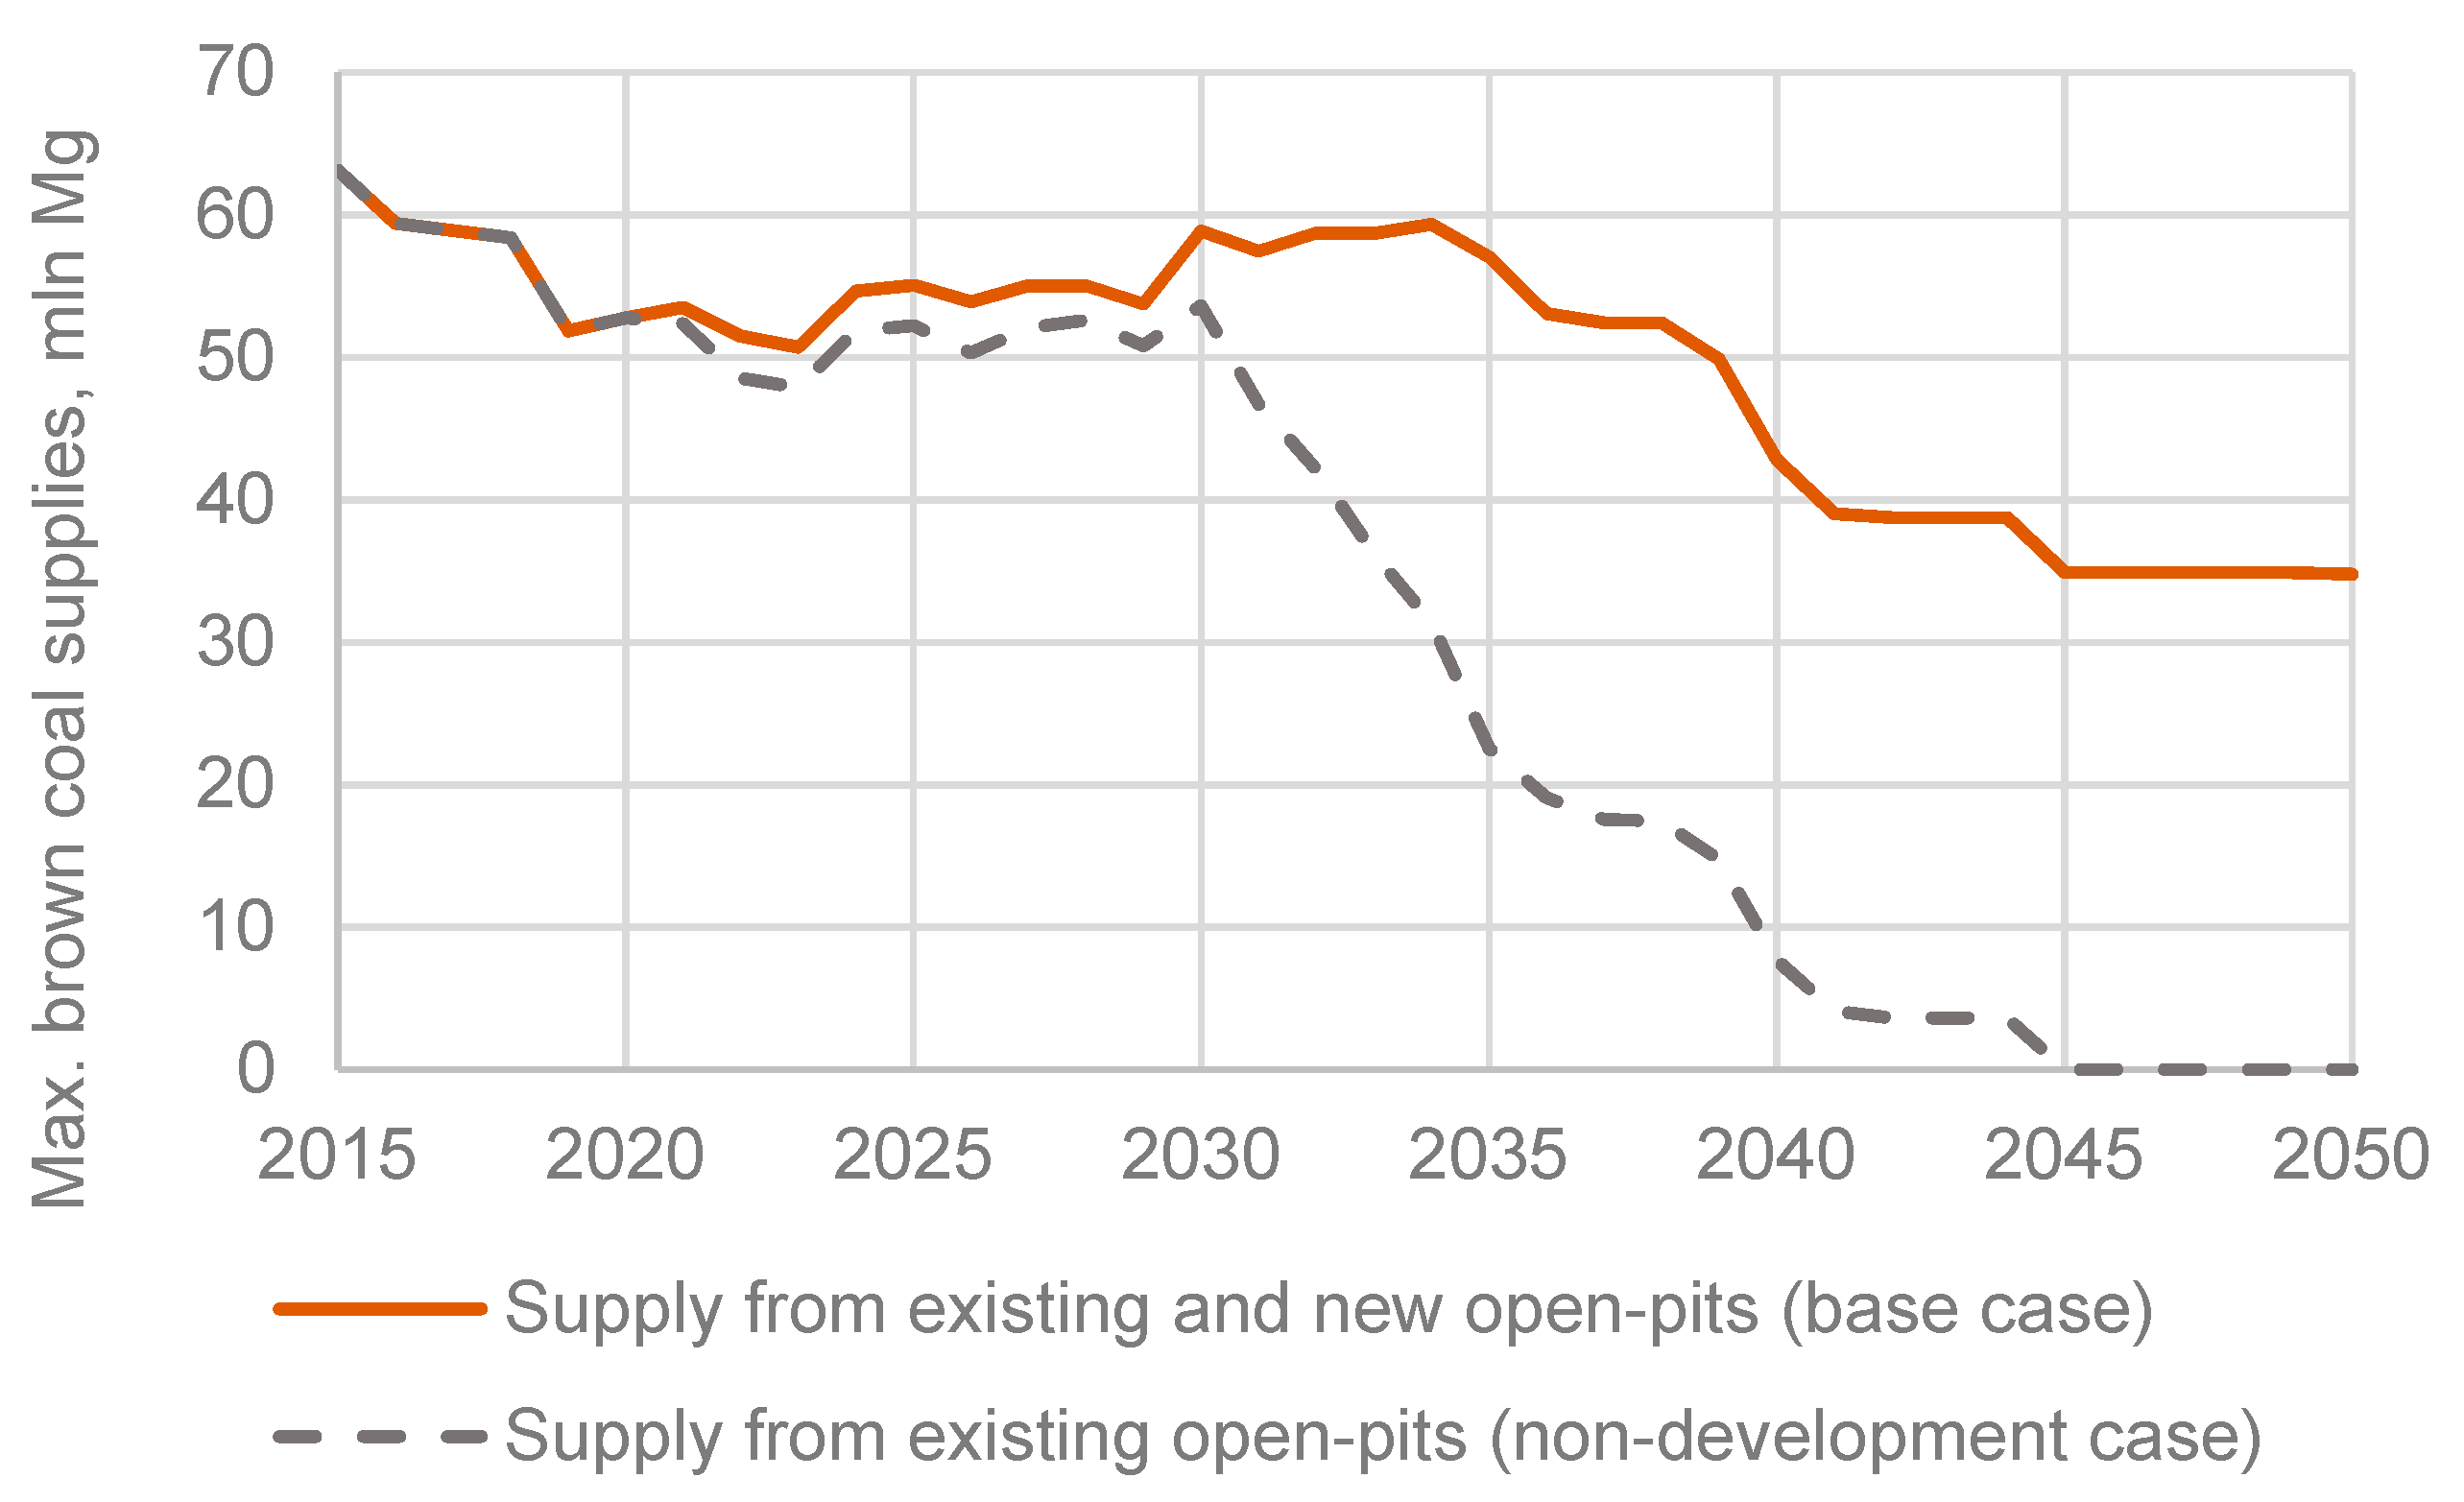
4.3. Demand for Brown Coal
5. Conclusions and Recommendations
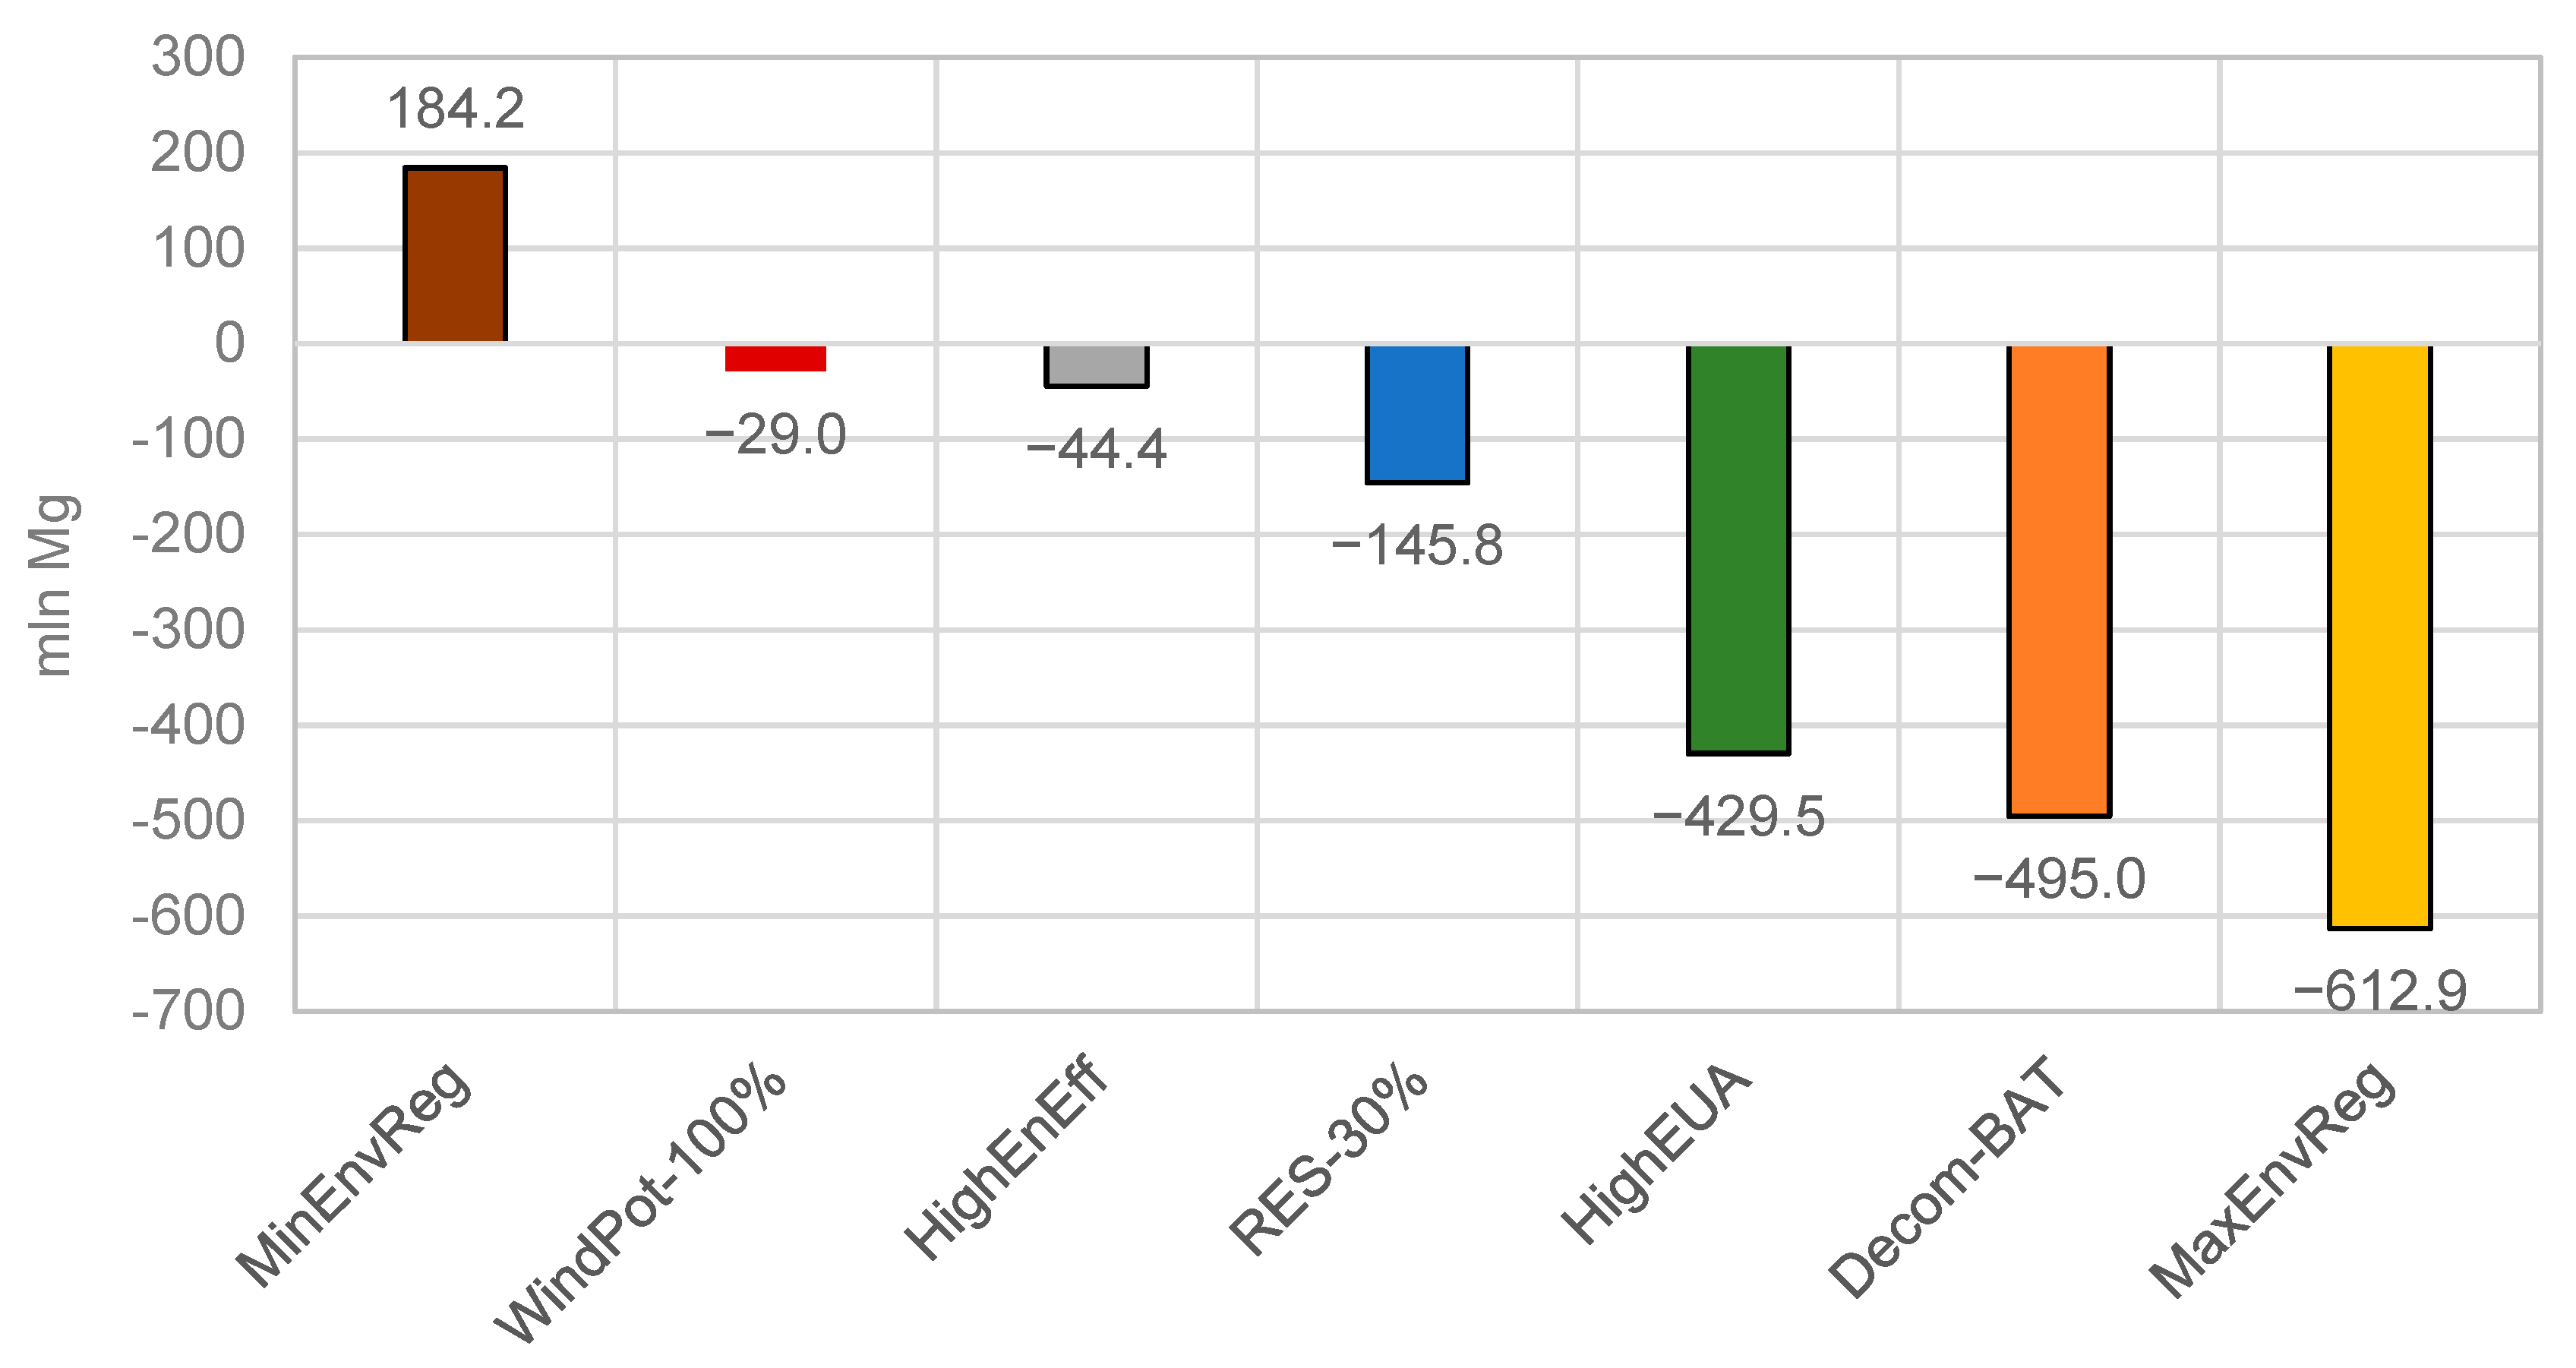
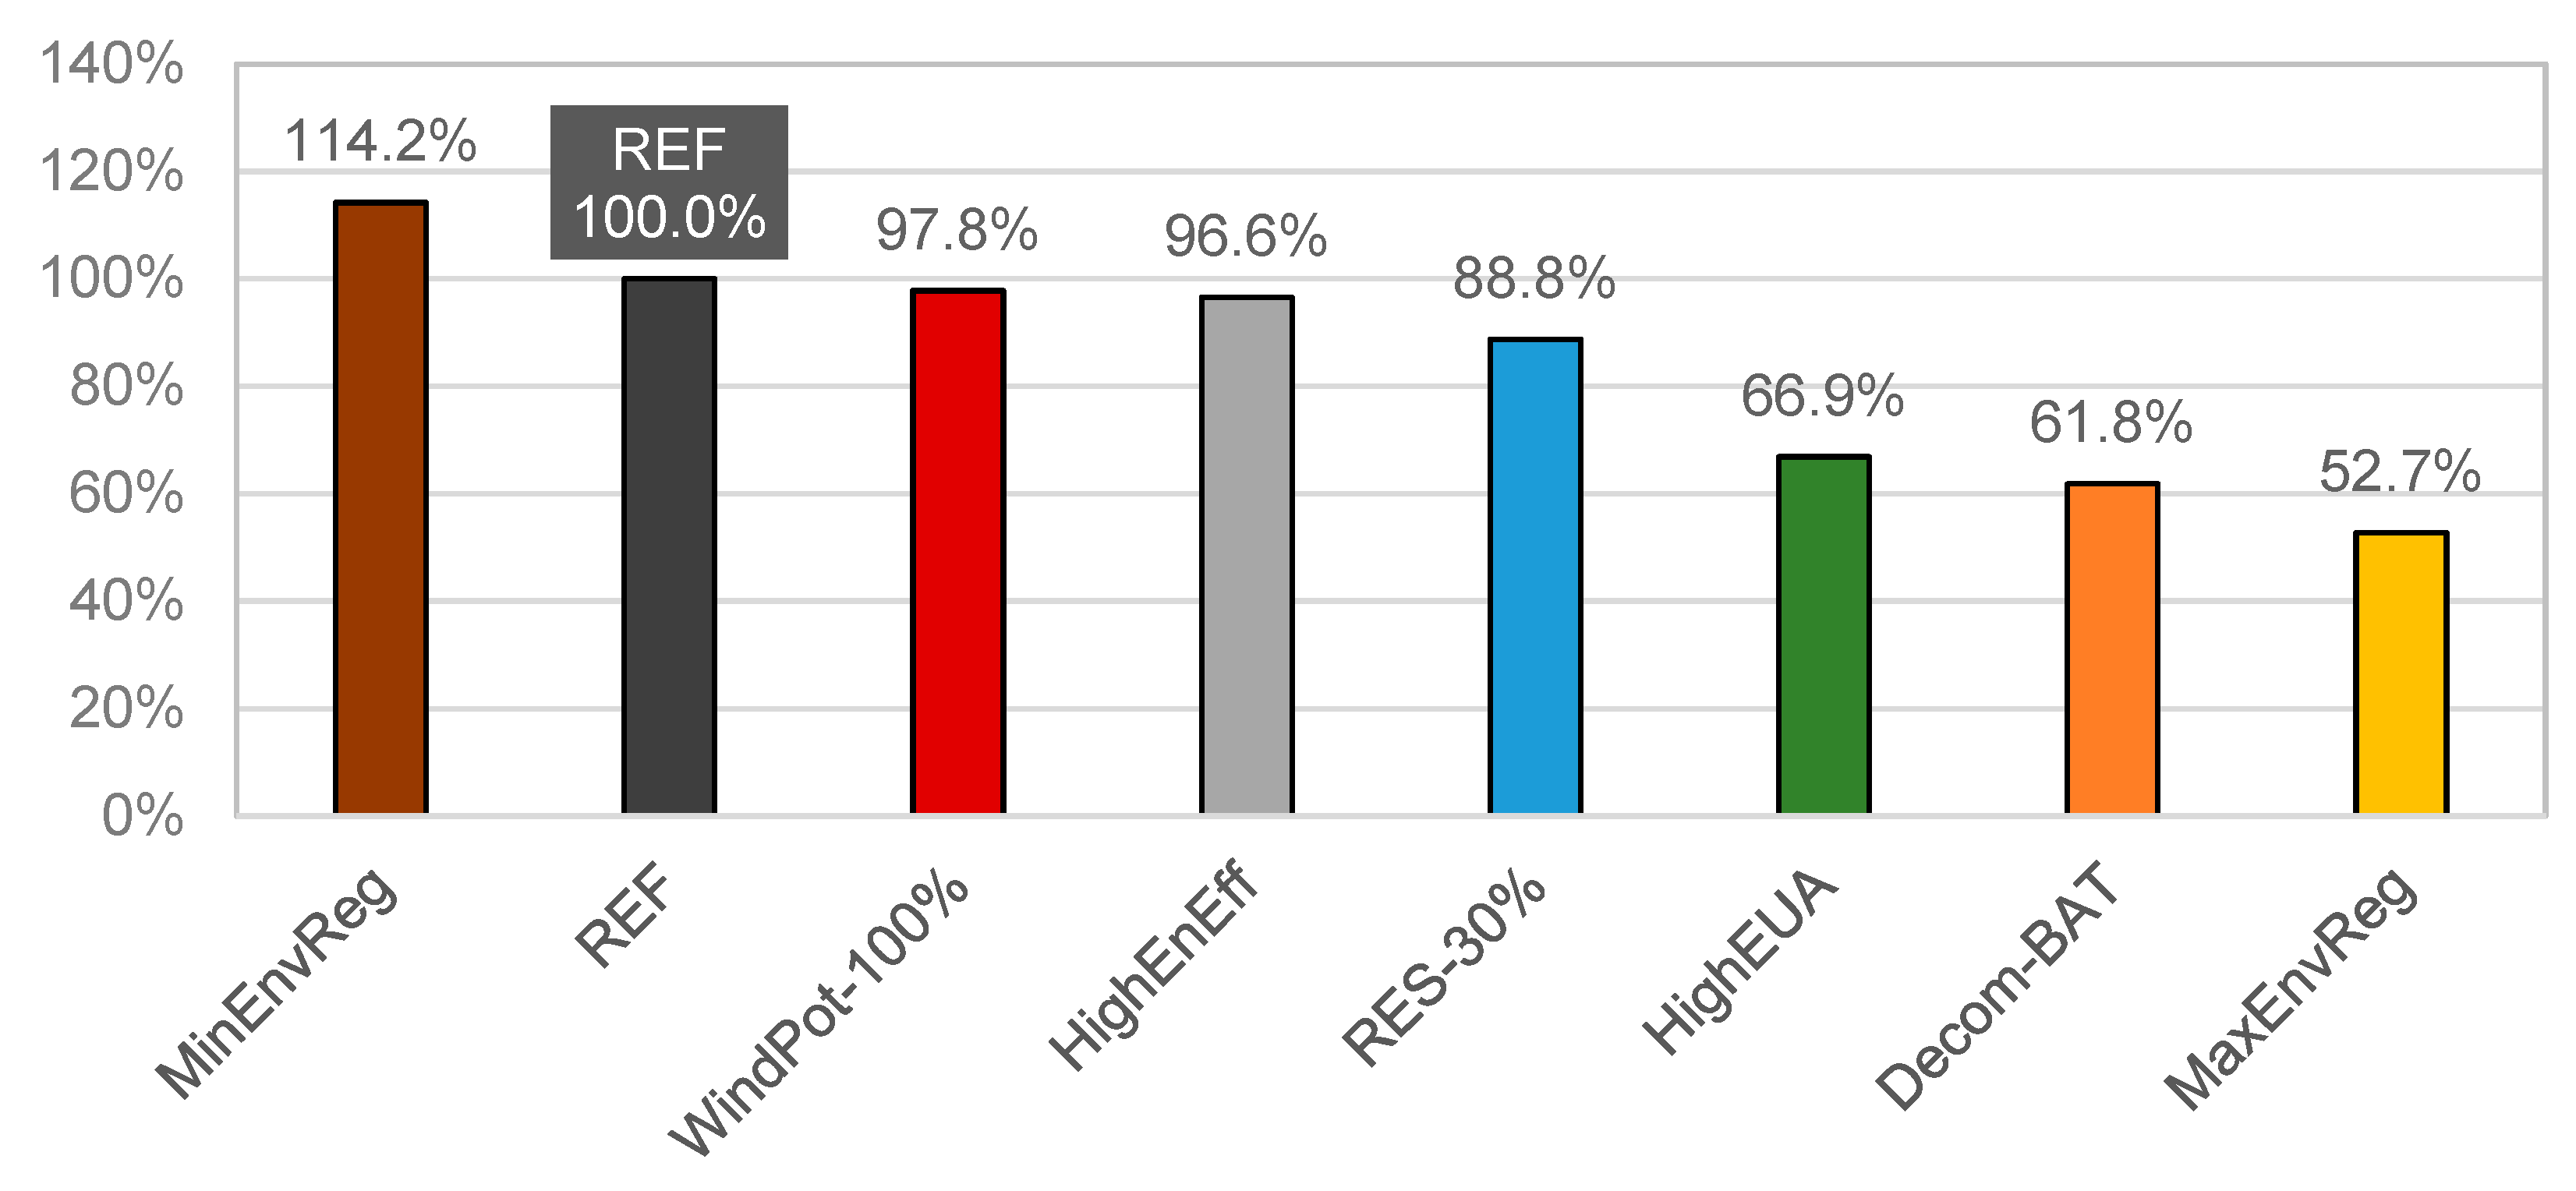
- The largest quantitative impact on the demand for hard coal in the public power sector is observed in the case of implementing environmental regulations reflected in the HighEUA scenario (high prices of carbon dioxide emission allowances), the Decom-BAT scenario (high level of decommissioning of existing generating units due to more stringent emission standards and the inability to build new capacities not equipped with CCS/CCU installations), and the MaxEnvReg scenario. In the first case, the demand for hard coal in the entire time horizon of the analysis (2017–2050) is lower than in the REF scenario by 429.5 million Mg, in the second case by 495.0 million Mg, while, in the MaxEnvReg scenario, the decrease is 612.9 million Mg. In all of the above scenarios, there is a significant technological change in the power system, namely, the development of nuclear power. The consequence of the scenario assumptions is also a small (HighEUA) or zero (Decom-BAT, MaxEnvReg) increase in new hard coal-based capacities.
- The functioning of individually considered environmental regulations assumed in the other research scenarios (RES-30%, WindPot-100%, and HighEnEff) does not result in a drastic technological change, and thus the demand for hard coal is closer to the level achieved in the reference scenario. Nevertheless, over the whole of the time horizon, the volume of this demand is lower by 145.8 million Mg (RES-30%), 44.4 million Mg (HighEnEff), and 29.0 million Mg (WindPot-100%). The only scenario in which the demand for hard coal is higher than in the REF scenario (by about 14.2%–184.2 million Mg) is the MinEnvReg scenario, which assumes minimal co-existence of environmental regulations.
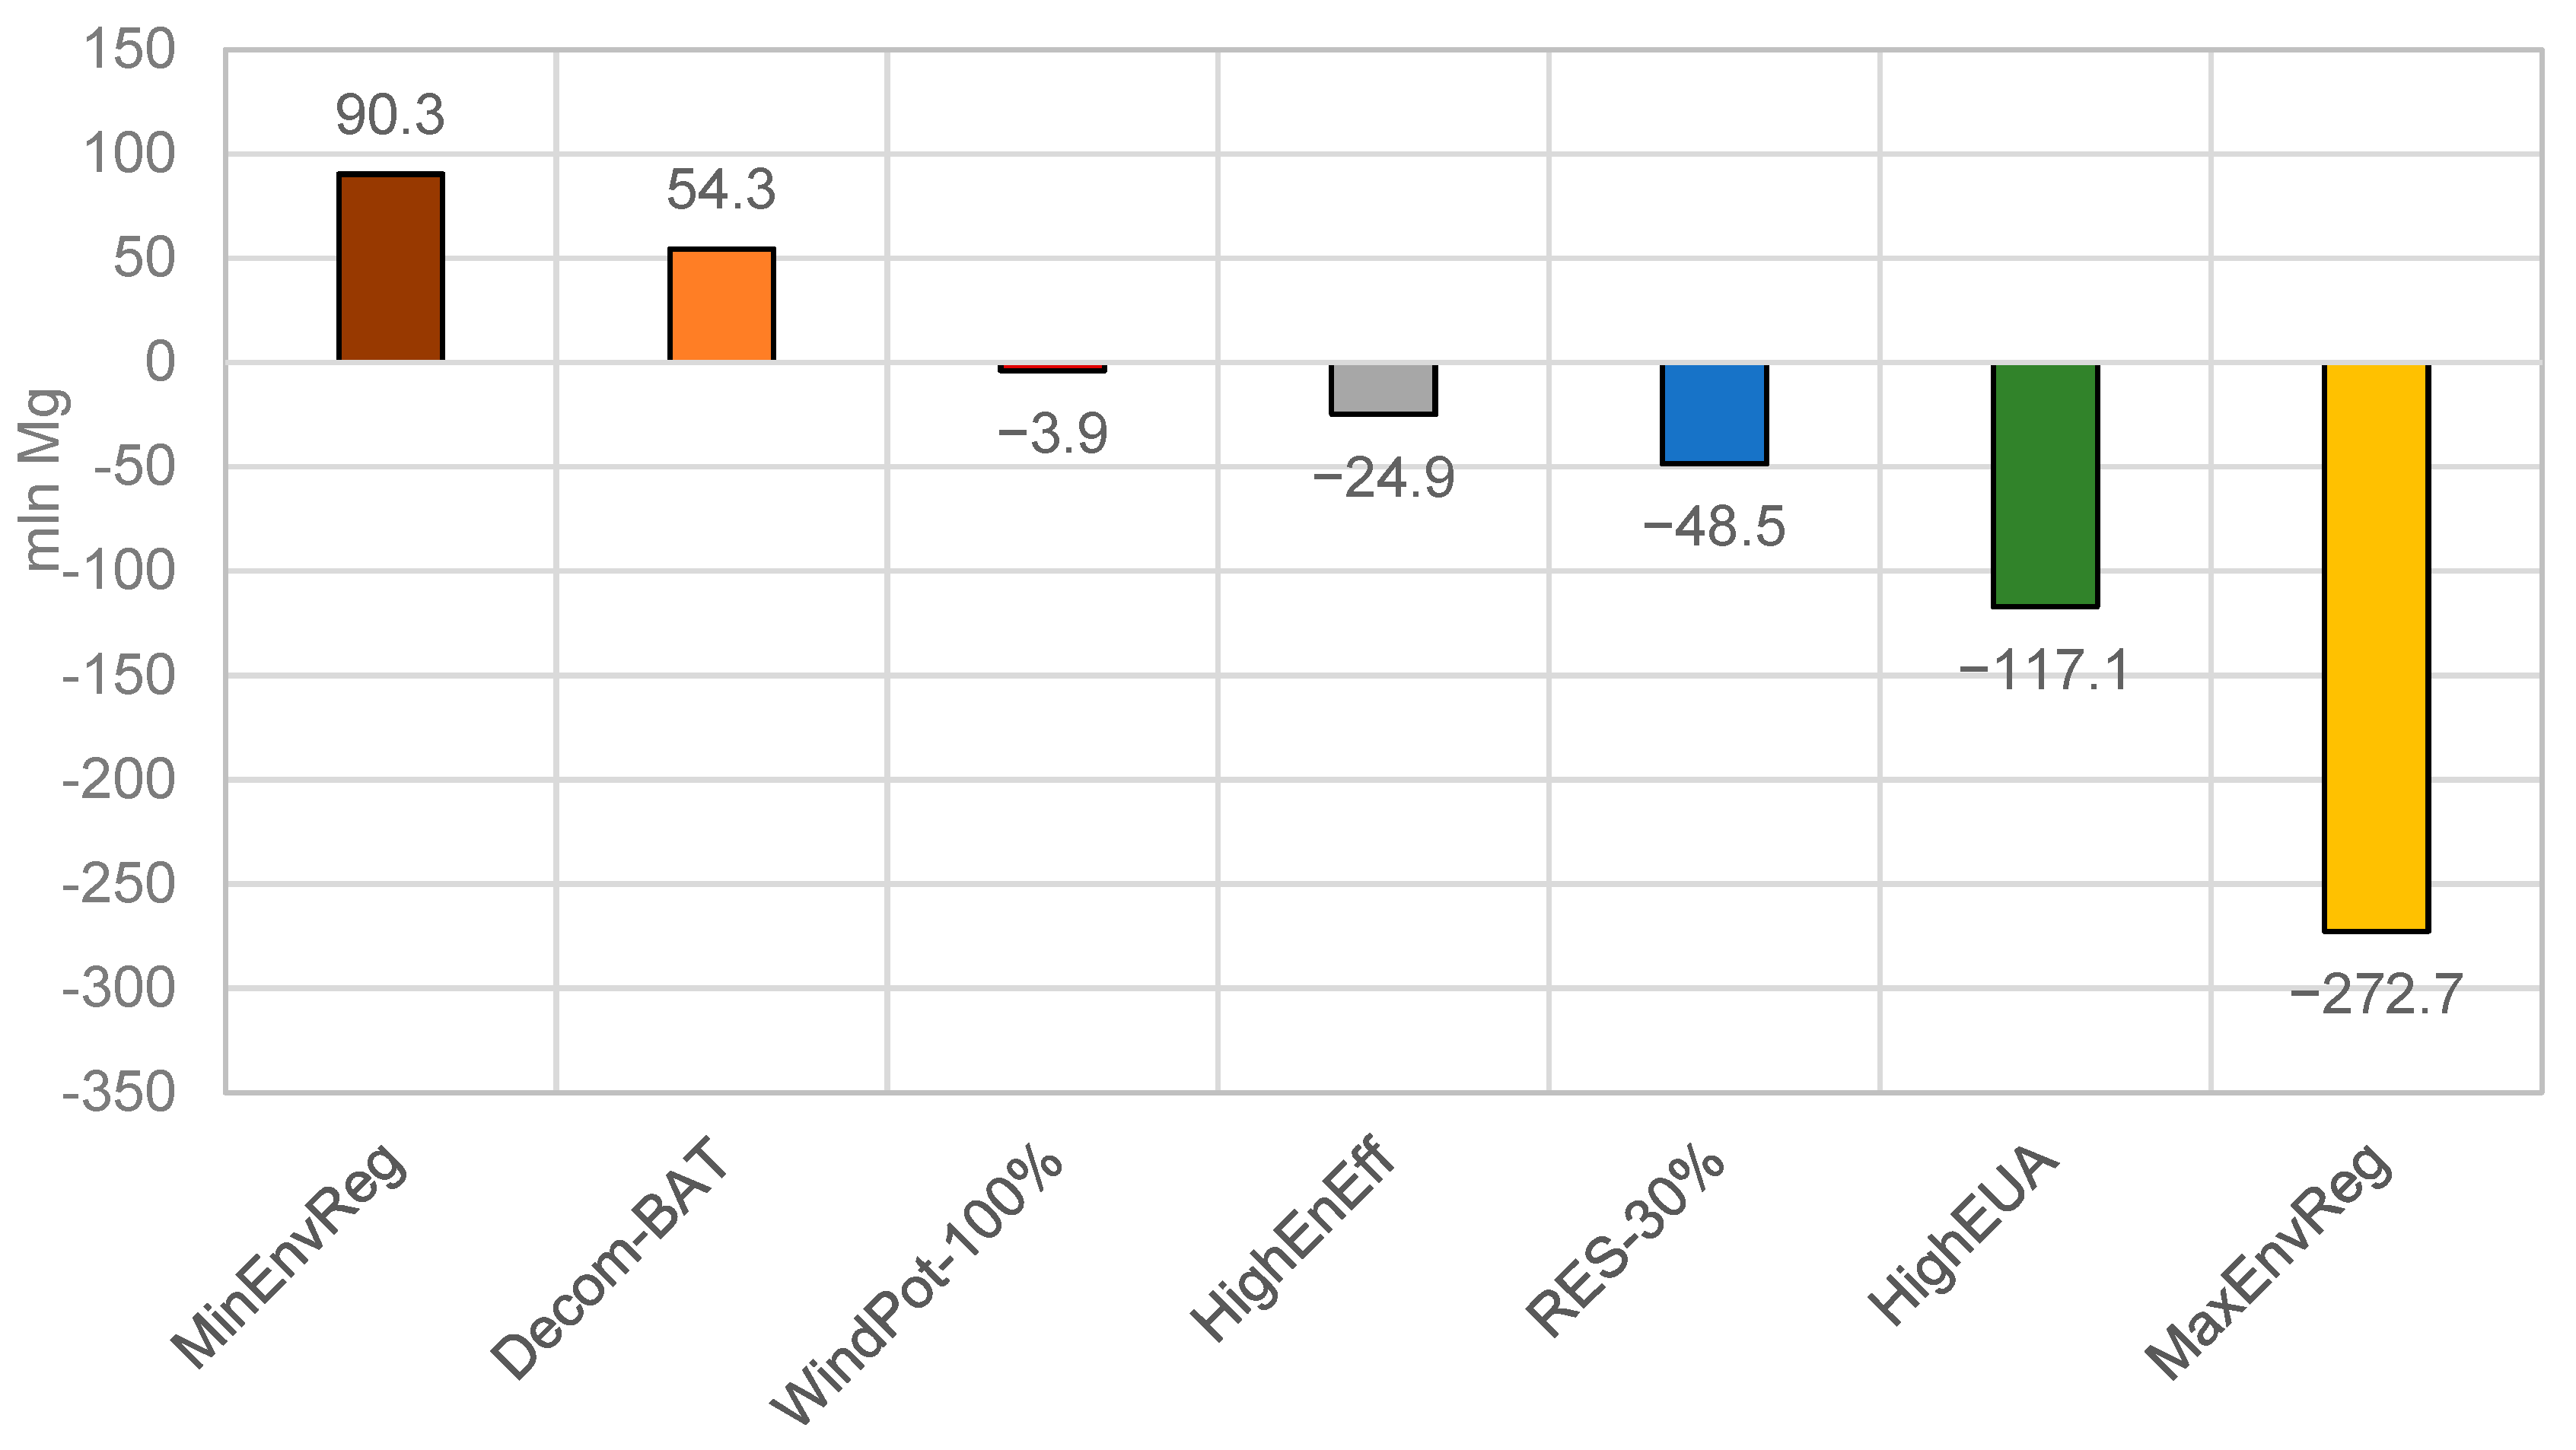
- The long-term prospects for brown coal demand are similar in all scenarios. In the absence of new brown coal-based capacities, brown coal consumption drops practically to zero in 2050. However, the intensity of the use of existing power plants varies, which affects the overall level of demand. The biggest differences with respect to the REF scenario (without taking into account the MinEnvReg and MaxEnvReg extreme scenarios) occur, like with hard coal, in the HighEUA and Decom-BAT scenarios. However, the operation of the greenhouse gas emission trading system in a situation of high carbon prices results in a demand reduced by 117.1 million Mg, while the extensive decommissioning of generation capacity (mainly 200 MW hard coal-fired units) translates into increased demand for brown coal by 54.3 million Mg.
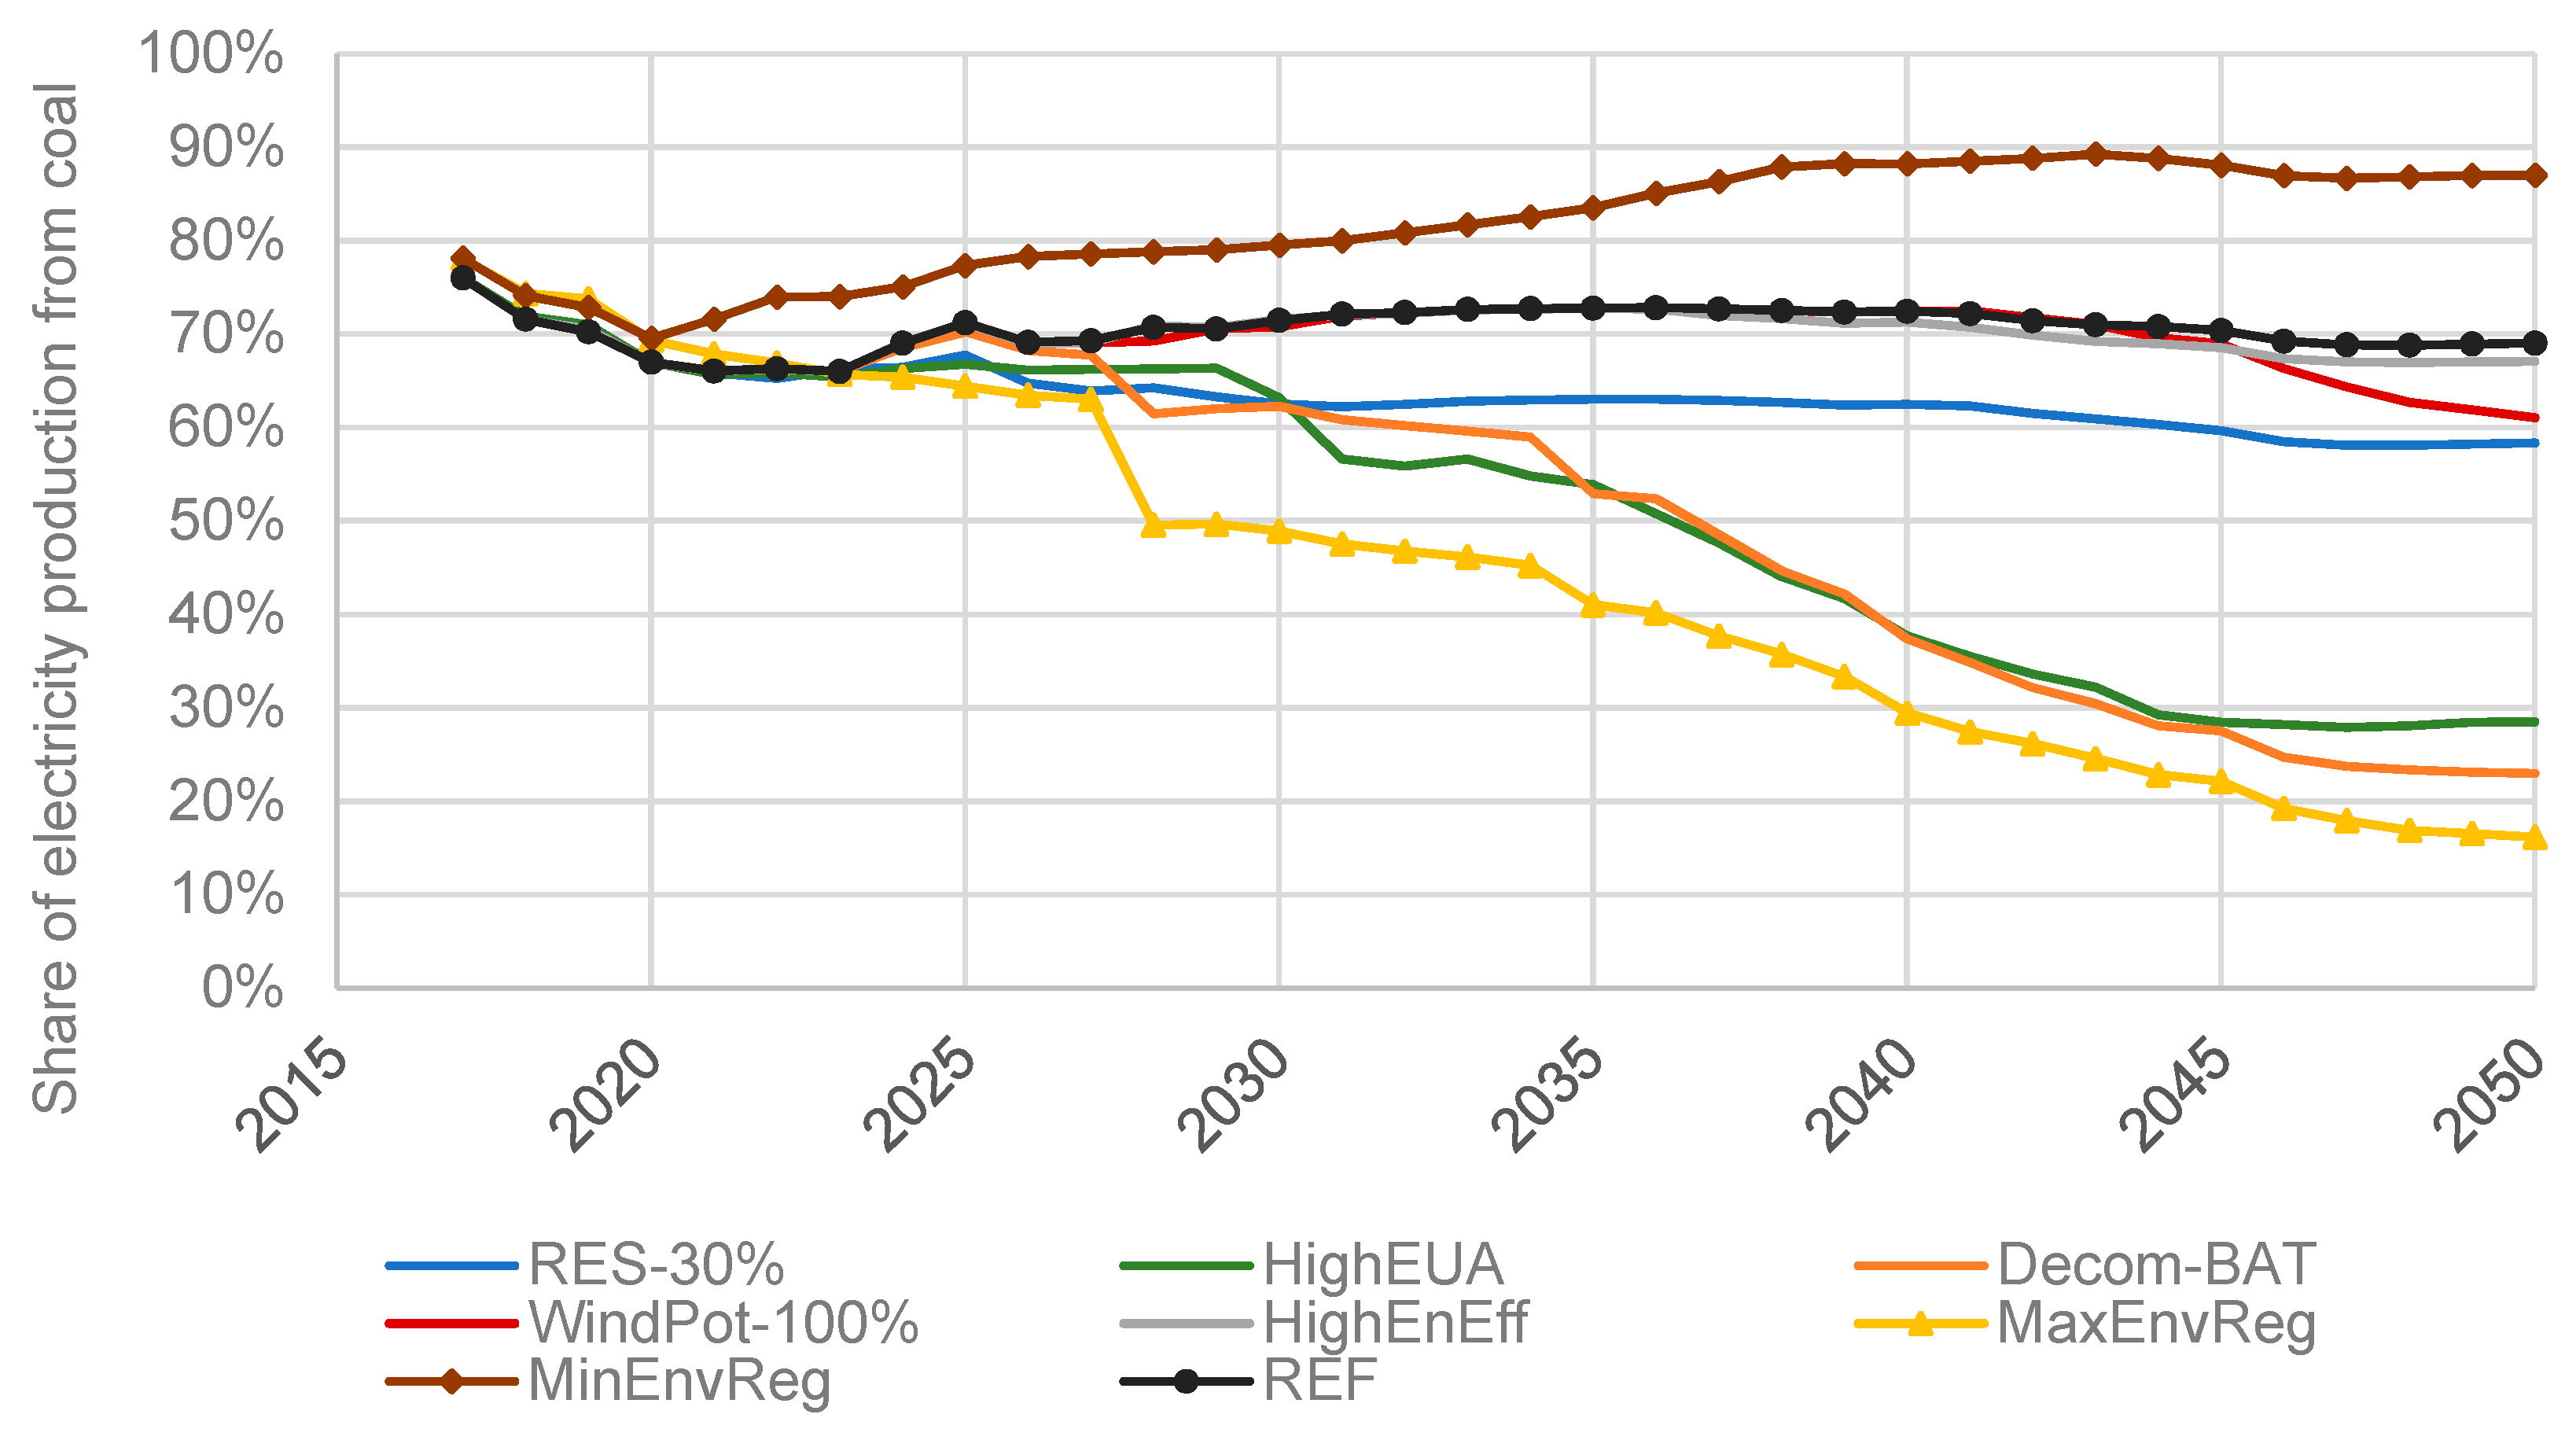
- Over the entire period covered by the analysis, the share of coal utilization in the electricity production fuel mix changes. The largest changes take place in the HighEUA and Decom-BAT scenarios, where the share of hard and brown coal falls to 28.5% and 23.5% in 2050, respectively. In other scenarios (RES-30%, HighEnEff, and WindPot-100%), the share of coal is much larger and ranges from 58.6% to 69.5% in 2050, and this share of electricity is generated almost entirely from hard coal since brown coal has a maximum share of 0.8%.
Author Contributions
Funding
Acknowledgments
Conflicts of Interest
References
- Nilsson, M. Red light for Green Paper: The EU policy on energy efficiency. Energy Policy 2007, 35, 540–547. [Google Scholar] [CrossRef]
- Fouquet, D.; Johansson, T.B. European renewable energy policy at crossroads-Focus on electricity support mechanisms. Energy Policy 2008, 36, 4079–4092. [Google Scholar] [CrossRef]
- Abdmouleh, Z.; Alammari, R.A.M.; Gastli, A. Review of policies encouraging renewable energy integration & best practices. Renew. Sustain. Energy Rev. 2015, 45, 249–262. [Google Scholar]
- Gorecki, P.K.; Lyons, S.; Tol, R.S.J. EU climate change policy 2013–2020: Using the Clean Development Mechanism more effectively in the non-EU-ETS Sector. Energy Policy 2010, 38, 7466–7475. [Google Scholar] [CrossRef]
- Ruester, S.; Schwenen, S.; Finger, M.; Glachant, J.M. A post-2020 EU energy technology policy: Revisiting the strategic energy technology plan. Energy Policy 2014, 66, 209–217. [Google Scholar] [CrossRef] [Green Version]
- Heidrich, O.; Reckien, D.; Olazabal, M.; Foley, A.; Salvia, M.; de Gregorio Hurtado, S.; Orru, H.; Flacke, J.; Geneletti, D.; Pietrapertosa, F.; et al. National climate policies across Europe and their impacts on cities strategies. J. Environ. Manag. 2016, 168, 36–45. [Google Scholar] [CrossRef] [Green Version]
- European Commission. Energy Roadmap 2050; European Commission: Brussel, Belgium, 2011; Volume 14. [Google Scholar]
- European Commission. A policy Framework for Climate and Energy in the Period from 2020 to 2030; European Commission: Brussel, Belgium, 2014. [Google Scholar]
- Drummond, P.; Pye, S.; McGlade, C.; Mathieu, C.; Jurić, Ž.; Matosović, M.; Deane, P. Decarbonizing the EU Energy System. In Europe’s Energy Transition: Insights for Policy Making; Elsevier: Amsterdam, The Netherlands, 2017; pp. 55–65. ISBN 9780128098066. [Google Scholar]
- Gerbaulet, C.; von Hirschhausen, C.; Kemfert, C.; Lorenz, C.; Oei, P.Y. European electricity sector decarbonization under different levels of foresight. Renew. Energy 2019, 141, 973–987. [Google Scholar] [CrossRef]
- Capros, P.; Paroussos, L.; Fragkos, P.; Tsani, S.; Boitier, B.; Wagner, F.; Busch, S.; Resch, G.; Blesl, M.; Bollen, J. Description of models and scenarios used to assess European decarbonisation pathways. Energy Strateg. Rev. 2014, 2, 220–230. [Google Scholar] [CrossRef]
- Mokrzycki, E. Role of hard coal and brown coal in Polish energy sector. Gospod. Surowcami Miner. 2002, 18, 33–58. [Google Scholar]
- Kamiński, J.; Kudełko, M. The prospects for hard coal as a fuel for the Polish power sector. Energy Policy 2010, 38, 7939–7950. [Google Scholar] [CrossRef]
- Kiuila, O. Decarbonisation perspectives for the Polish economy. Energy Policy 2018, 118, 69–76. [Google Scholar] [CrossRef]
- Gurgul, H.; Lach, Ł. The role of coal consumption in the economic growth of the Polish economy in transition. Energy Policy 2011, 39, 2088–2099. [Google Scholar] [CrossRef] [Green Version]
- Manowska, A.; Osadnik, K.T.; Wyganowska, M. Economic and social aspects of restructuring Polish coal mining: Focusing on Poland and the EU. Resour. Policy 2017, 52, 192–200. [Google Scholar] [CrossRef]
- Antosiewicz, M.; Nikas, A.; Szpor, A.; Witajewski-Baltvilks, J.; Doukas, H. Pathways for the transition of the Polish power sector and associated risks. Environ. Innov. Soc. Transit. 2019. [Google Scholar] [CrossRef]
- ARE SA Statystyka Elektroenergetyki Polskiej 2016; Agencja Rynku Energii S.A.: Warszawa, Poland, 2017; ISBN 1232-2415.
- The European Parliament and the Council of the European Union. European Council Directive 2010/75/EU Industrial Emissions. Off. J. Eur. Union 2010, L334, 17–119. [Google Scholar]
- Lecomte, T.; Ferreria de la Fuente, J.F.; Neuwahl, F.; Canova, M.; Pinasseau, A.; Jankov, I.; Brinkmann, T.; Roudier, S.; Delgado Sancho, L. Best Available Techniques (BAT) Reference Document for Large Combustion Plants; European Commission JRC Science for Policy Report; Publications Office of the European Union: Luxembourg, 2017. [Google Scholar] [CrossRef]
- The European Parliament and the Council of the European Union. European Parliament Directive 2003/87/EC of the European Parliament and of the Council of 13 October 2003 Establishing a Scheme for Greenhouse Gas Emission Allowance Trading Within the Community and Amending Council Directive 96/61/EC. Off. J. Eur. Union 2003, L275, 32–47. [Google Scholar]
- Bonenti, F.; Oggioni, G.; Allevi, E.; Marangoni, G. Evaluating the EU ETS impacts on profits, investments and prices of the Italian electricity market. Energy Policy 2013, 59, 242–256. [Google Scholar] [CrossRef]
- The European Parliament and the Council of the European Union. European Parliament Directive 2009/28/EC of the European Parliament and of the Council of 23 April 2009. Off. J. Eur. Union 2009, 140, 16–62. [Google Scholar]
- Carlini, E.M.; Schroeder, R.; Birkebæk, J.M.; Massaro, F. EU transition in power sector: How RES affects the design and operations of transmission power systems. Electr. Power Syst. Res. 2019, 169, 74–91. [Google Scholar] [CrossRef]
- The European Parliament and the Council of the European Union. European Council Directive 2009/29/EC of the European Parliament and of the Council of 23 April 2009 amending Directive 2003/87/EC so as to improve and extend the greenhouse gas emission allowance trading scheme of the Community. Off. J. Eur. Union 2009, 140, 63–87. [Google Scholar]
- The European Parliament and the Council of the European Union. European Parliament and Council Directive 2008/1/EC of the Parliament and the Council of 15 January 2008 concerning integrated pollution prevention and control (Codified version). Off. J. Eur. Union 2008, L24, 8–29. [Google Scholar]
- The European Parliament and the Council of the European Union. European Commission Directive 2001/80/EC of the European Parliament and of the Council of 23 October 2001 on the limitation of emissions of certain pollutants into the air from large combustion plants. Off. J. Eur. Union 2001, 27, 1–21. [Google Scholar]
- The European Parliament and the Council of the European Union. European Council Directive (EU) 2018/2001 of the European Parliament and of the Council of 11 December 2018 on the promotion of the use of energy from renewable sources. Off. J. Eur. Union 2018, 328, 82–109. [Google Scholar]
- The European Parliament and the Council of the European Union European Parliament. Council of the European Union Directive (EU) 2018/2002 of the European Parliament and of the Council of 11 December 2018 amending Directive 2012/27/EU on energy efficiency. Off. J. Eur. Union 2018, 328, 210–230. [Google Scholar]
- Bazmi, A.A.; Zahedi, G. Sustainable energy systems: Role of optimization modeling techniques in power generation and supply—A review. Renew. Sustain. Energy Rev. 2011, 15, 3480–3500. [Google Scholar] [CrossRef]
- Koltsaklis, N.E.; Dagoumas, A.S. State-of-the-art generation expansion planning: A review. Appl. Energy 2018, 230, 563–589. [Google Scholar] [CrossRef]
- Laurikka, H.; Koljonen, T. Emissions trading and investment decisions in the power sector—A case study in Finland. Energy Policy 2006, 34, 1063–1074. [Google Scholar] [CrossRef]
- Fan, L.; Hobbs, B.F.; Norman, C.S. Risk aversion and CO2 regulatory uncertainty in power generation investment: Policy and modeling implications. J. Environ. Econ. Manag. 2010, 60, 193–208. [Google Scholar] [CrossRef] [Green Version]
- Rocha, P.; Das, T.K.; Nanduri, V.; Botterud, A. Impact of CO2 cap-and-trade programs on restructured power markets with generation capacity investments. Int. J. Electr. Power Energy Syst. 2015, 71, 195–208. [Google Scholar] [CrossRef]
- Dagoumas, A.S.; Koltsaklis, N.E. Review of models for integrating renewable energy in the generation expansion planning. Appl. Energy 2019, 242, 1573–1587. [Google Scholar] [CrossRef]
- Lund, H.; Mathiesen, B.V. Energy system analysis of 100% renewable energy systems-The case of Denmark in years 2030 and 2050. Energy 2009, 34, 524–531. [Google Scholar] [CrossRef]
- Child, M.; Breyer, C. The Role of Energy Storage Solutions in a 100% Renewable Finnish Energy System. In Proceedings of the Energy Procedia, Düsseldorf, Germany, 15–17 March 2016; Elsevier Ltd.: Amsterdam, The Netherlands, 2016; Volume 99, pp. 25–34. [Google Scholar]
- Jacobson, M.Z.; Delucchi, M.A.; Bauer, Z.A.F.; Goodman, S.C.; Chapman, W.E.; Cameron, M.A.; Bozonnat, C.; Chobadi, L.; Clonts, H.A.; Enevoldsen, P.; et al. 100% Clean and Renewable Wind, Water, and Sunlight All-Sector Energy Roadmaps for 139 Countries of the World. Joule 2017, 1, 108–121. [Google Scholar] [CrossRef] [Green Version]
- Child, M.; Kemfert, C.; Bogdanov, D.; Breyer, C. Flexible electricity generation, grid exchange and storage for the transition to a 100% renewable energy system in Europe. Renew. Energy 2019, 139, 80–101. [Google Scholar] [CrossRef]
- Lehtilä, A.; Pirilä, P. Reducing energy related emissions: Using an energy systems optimization model to support policy planning in Finland. Energy Policy 1996, 24, 805–819. [Google Scholar] [CrossRef]
- Wene, C.O. Exploring and Mapping: A Comparison of the IRA-MARKAL and CEC-EFOM Technical Energy System Models and the ANL Electric Utility Model; Upton: New York, NY, USA, 1989. [Google Scholar]
- Grohnheit, P.E. Economic interpretation of the EFOM model. Energy Econ. 1991, 13, 143–152. [Google Scholar] [CrossRef]
- Khella, A. Energy planning policies with environmental considerations. Energy Policy 1997, 25, 105–115. [Google Scholar] [CrossRef]
- Cormio, C.; Dicorato, M.; Minoia, A.; Trovato, M. A regional energy planning methodology including renewable energy sources and environmental constraints. Renew. Sustain. Energy Rev. 2003, 7, 99–130. [Google Scholar] [CrossRef]
- Böhringer, C.; Löschel, A.; Moslener, U.; Rutherford, T.F. EU climate policy up to 2020: An economic impact assessment. Energy Econ. 2009, 31, S295–S305. [Google Scholar] [CrossRef] [Green Version]
- Capros, P.; Mantzos, L.; Parousos, L.; Tasios, N.; Klaassen, G.; Van Ierland, T. Analysis of the EU policy package on climate change and renewables. Energy Policy 2011. [Google Scholar] [CrossRef]
- Capros, P.; Mantzos, L.; Papandreou, V.; Tasios, N. European Energy and Transport—Trends to 2030—Update; Office for Official Publications of the European Communities: Luxembourg, 2008; ISBN 9789279076206. [Google Scholar]
- E3Mlab. The Primes Model—Version Used for the 2010 Scenarios for The European Commission Including New Sub-Models; E3Mlab: Laxenburg, Austria, 2011. [Google Scholar]
- Mirzaesmaeeli, H.; Elkamel, A.; Douglas, P.L.; Croiset, E.; Gupta, M. A multi-period optimization model for energy planning with CO2 emission consideration. J. Environ. Manag. 2010, 91, 1063–1070. [Google Scholar] [CrossRef] [Green Version]
- Oliveira, C.; Antunes, C.H. A multi-objective multi-sectoral economy-energy-environment model: Application to Portugal. Energy 2011, 36, 2856–2866. [Google Scholar] [CrossRef]
- Chiodi, A.; Gargiulo, M.; Rogan, F.; Deane, J.P.; Lavigne, D.; Rout, U.K.; Gallachóir, B.P.Ó. Modelling the impacts of challenging 2050 European climate mitigation targets on Ireland’s energy system. Energy Policy 2013, 53, 169–189. [Google Scholar] [CrossRef]
- Loulou, R.; Remme, U.; Kanudia, A.; Lehtila, A.; Goldstein, G. Documentation for the TIMES Model. Energy Technol. Syst. Anal. Program. 2005, 1–78. [Google Scholar]
- European Union. The Pan European TIMES Model for RES2020 Model Description and Definitions of Scenarios; European Union: Brussels, Belgium, 2008. [Google Scholar]
- Chiodi, A.; Gargiulo, M.; Deane, J.P.; Lavigne, D.; Rout, U.K.; Gallachóir, B.P.Ó. Modelling the impacts of challenging 2020 non-ETS GHG emissions reduction targets on Ireland’s energy system. Energy Policy 2013, 62, 1438–1452. [Google Scholar] [CrossRef]
- Suwala, W. Modelling adaptation of the coal industry to sustainability conditions. Energy 2008, 33, 1015–1026. [Google Scholar] [CrossRef]
- Kamiński, J. The impact of liberalisation of the electricity market on the hard coal mining sector in Poland. Energy Policy 2009, 37, 925–939. [Google Scholar] [CrossRef]
- Kamiński, J. Market power in a coal-based power generation sector: The case of Poland. Energy 2011, 36, 6634–6644. [Google Scholar] [CrossRef]
- Kamiński, J. A blocked takeover in the Polish power sector: A model-based analysis. Energy Policy 2014, 66, 42–52. [Google Scholar] [CrossRef]
- Gawlik, L.; Szurlej, A.; Wyrwa, A. The impact of the long-term EU target for renewables on the structure of electricity production in Poland. Energy 2015, 92, 172–178. [Google Scholar] [CrossRef]
- Kudełko, M. Efektywność alokacyjna przy występowaniu kosztów zewnętrznych—Model równowagi cząstkowej krajowego sektora energetycznego. Wprowadzenie. Polityka Energ. Energy Policy J. 2005, 8, 41–61. [Google Scholar]
- Pluta, M.; Wyrwa, A.; Mirowski, T.; Zyśk, J. Wyniki wstępnych badań nad długookresowym rozwojem krajowego systemu wytwarzania energii elektrycznej w Polsce. Polityka Energ. Energy Policy J. 2012, 15, 85–96. [Google Scholar]
- Kamiński, J.; Saługa, P. Pozyskanie surowców energetycznych na potrzeby wytwarzania energii elektrycznej—Koncepcja budowy modelu matematycznego. Gospod. Surowcami Miner. Miner. Resour. Manag. 2014, 30, 39–52. [Google Scholar]
- Krzemień, J.; Jaskólski, M. Badania modelowe struktury krajowego systemu energetycznego w świetle zapisów Dyrektywy 2009/28/WE. Polityka Energ. Energy Policy J. 2015, 18, 27–44. [Google Scholar]
- Szczerbowski, R. Modelowanie systemów energetycznych—charakterystyka wybranych modeli. Polityka Energ. Energy Policy J. 2014, 17, 147–156. [Google Scholar]
- Szurlej, A.; Mirowski, T.; Kamiński, J. Analiza zmian struktury wytwarzania energii elektrycznej w kontekście założeń polityki energetycznej. Rynek Energii 2013, 104, 3–10. [Google Scholar]
- Wierzbowski, M.; Olek, B.; Łyzwa, W. Optymalizacja krajowego miksu energetycznego W kontekscie polityki energetycznej. Rynek Energii 2014, 114, 23–31. [Google Scholar]
- Bunn, D.W.; Larsen, E.R. Systems Modelling for Energy Policy; Wiley: Chichester, UK, 1997. [Google Scholar]
- Labys, W.C. Modeling Mineral and Energy Markets; Springer: New York, NY, USA, 1999. [Google Scholar]
- Gutenbaum, J. Modelowanie Matematyczne Systemów; Akademicka Oficyna Wydawnicza EXIT: Warszawa, Poland, 2003. [Google Scholar]
- Soroudi, A. Power System Optimization Modeling in GAMS; Springer International Publishing: Berlin, Germany, 2017; ISBN 9783319623504. [Google Scholar]
- Sierksma, G. Linear and Integer Programming: Theory and Practice; Marcel Dekker: New York, NY, USA, 2002; ISBN 9781482294712. [Google Scholar]
- Winston, W. Operations Research: Applications and Algorithms; Thomson, Brooks/Cole: Belmont, NC, USA, 2004; ISBN 2003105883. [Google Scholar]
- Sinha, S.M. Mathematical Programming: Theory and Methods; Elsevier: Amsterdam, The Netherlands; Springer: Berlin, Germay, 2005. [Google Scholar]
- Weber, C. Uncertainty in the Electric Power Industry: Methods and Models for Decision Support; Springer: Berlin, Germany, 2005. [Google Scholar]
- Kamiński, J. Modelowanie systemów energetycznych: Ogólna metodyka postępowania przy budowie modeli. Polityka Energ. Energy Policy J. 2010, 13, 219–225. [Google Scholar]
- Kamiński, J. Siła Rynkowa w Krajowym Sektorze Wytwarzania Energii Elektrycznej—Zagadnienia Wybrane; Wydawnictwo IGSMiE PAN: Kraków, Poland, 2013; ISBN 0934412979. [Google Scholar]
- Suwala, W. Modelowanie Systemów Paliwowo-Energetycznych; Wydawnictwo IGSMiE PAN: Kraków, Poland, 2011. [Google Scholar]
- Sioshansi, R.; Conejo, A.J. Optimization in Engineering: Models and Algorithms; Springer International Publishing: Berlin, Germany, 2017; Volume 120, ISBN 9783319567679. [Google Scholar]
- Jankowski, B. Modelowanie Rozwoju Krajowego Systemu Energetycznego z Uwzględnieniem Wymagań Stablizacji i Redukcji Emisji Dwutlenku Węgla w Polsce; IPPT PAN: Warszawa, Poland, 1997. [Google Scholar]
- Van Beeck, N.M.J.P. Classification of Energy Models. FEW Research Memorandum Vol. 777; Operations Research: Tilburg, The Netherlands, 1999. [Google Scholar]
- Ommen, T.; Markussen, W.B.; Elmegaard, B. Comparison of linear, mixed integer and non-linear programming methods in energy system dispatch modelling. Energy 2014, 74, 109–118. [Google Scholar] [CrossRef]
- Kamiński, J.; Kaszyński, P. Wybrane problemy implementacji zapotrzebowania na moc w matematycznych modelach systemów energetycznych. Polityka Energ. Energy Policy J. 2011, 14, 155–165. [Google Scholar]
- Kamiński, J.; Kaszyński, P.; Malec, M. Reprezentacja zapotrzebowania na moc w długoterminowych modelach systemów paliwowo-energetycznych. Rynek Energii 2015, 118, 3–9. [Google Scholar]
- McDonald, A.; Schrattenholzer, L. Learning rates for energy technologies. Energy Policy 2001, 29, 255–261. [Google Scholar] [CrossRef] [Green Version]
- Barreto, L. Technological Learning in Energy Optimisation Models and Deployment of Emerging Technologies; ETH Zurich: Zurich, Switzerland, 2001. [Google Scholar]
- Jamasb, T. Technical change theory and learning curves: Patterns of progress in electricity generation technologies. Energy J. 2007, 28, 51–71. [Google Scholar] [CrossRef] [Green Version]
- Jamasb, T.; Köhler, J. Learning Curves for Energy Technology and Policy Analysis: A Critical Assessment. Univ. Camb. Camb. Work. Papers Econ. 2007. [Google Scholar] [CrossRef]
- Barreto, L.; Kypreos, S. Multi-regional technological learning in the energy-systems MARKAL model. Int. J. Glob. Energy Issues 2002, 17, 189–213. [Google Scholar] [CrossRef]
- Neij, L. Cost development of future technologies for power generation-A study based on experience curves and complementary bottom-up assessments. Energy Policy 2008, 36, 2200–2211. [Google Scholar] [CrossRef]
- Wiesenthal, T.; Dowling, P.; Morbee, J.; Thiel, C.; Schade, B.; Russ, P.; Simoes, S.; Peteves, S.; Schoots, K.; Londo, M. Technology Learning Curves for Energy Policy; European Commission Joint Research Centre; Publications Office of the European Union: Luxembourg, 2012; ISBN 9789279256769. [Google Scholar]
- Drożdż, W. Economic conditions of the development of electromobility in Poland at the background of selected countries. Eur. J. Serv. Manag. 2018, 28, 133–140. [Google Scholar]
- Ministry of Energy. Ocena Skutków Regulacji Projektu Ustawy o Rynku Mocy; Ministry of Energy: Warszawa, Poland, 2017.
- Polskie Sieci Elektroenergetyczne-Polish Transmission System Operator. Prognoza Pokrycia Zapotrzebowania Szczytowego na Moc w Latach 2016–2035; Departament Rozwoju Systemu, Polskie Sieci Elektroenergetyczne S.A.: Konstancin-Jeziorna, Poland, 2016. [Google Scholar]
- Agencja Rynku Energii S.A. Sytuacja Techniczno-Ekonomiczna Sektora Elektroenergetycznego; Agencja Rynku Energii S.A.: Warszawa, Poland, 2017. [Google Scholar]
- International Energy Agency. World Energy Outlook 2016; International Energy Agency: Paris, France, 2016. [Google Scholar]
- Ministry of Energy. Program dla sektora górnictwa węgla kamiennego w Polsce; Ministry of Energy: Warszawa, Poland, 2018.
- EnergSys&Polish Electricity Association. Ocena Zasobów Odnawialnych Źródeł Energii Możliwych Technicznie i Ekonomicznie do Wykorzystania w Celu Produkcji Energii Elektrycznej; EnergSys: Warszawa, Poland, 2008. [Google Scholar]
- Gawlik, L.; Grudziński, Z.; Kamiński, J.; Kaszyński, P.; Kryzia, D.; Lorenz, U.; Mirowski, T.; Mokrzycki, E.; Olkuski, T.; Ozga-Blaschke, U.; et al. Węgiel dla Polskiej Energetyki w Perspektywie 2050 Roku—Analizy Scenariuszowe; Gawlik, L., Ed.; Górnicza Izba Przemysłowo-Handlowa: Katowice, Poland, 2013. [Google Scholar]
- McKinsey&Company. Rozwój Morskiej Energetyki Wiatrowej w Polsce; McKinsey&Company: New York, NY, USA, 2016. [Google Scholar]
- The Polish Sejm. Ustawa z Dnia 20 Maja 2016 r. o Inwestycjach w Zakresie Elektrowni Wiatrowych; Dz.U. 2016 poz. 961: Warszawa, Poland, 2016.


| Scenario | REF 1 | HighEUA 2 | RES-30% 3 | WindPot-100% 4 |
|---|---|---|---|---|
| Energy efficiency/demand for electricity | Moderate electricity demand forecast | REF * | REF | REF |
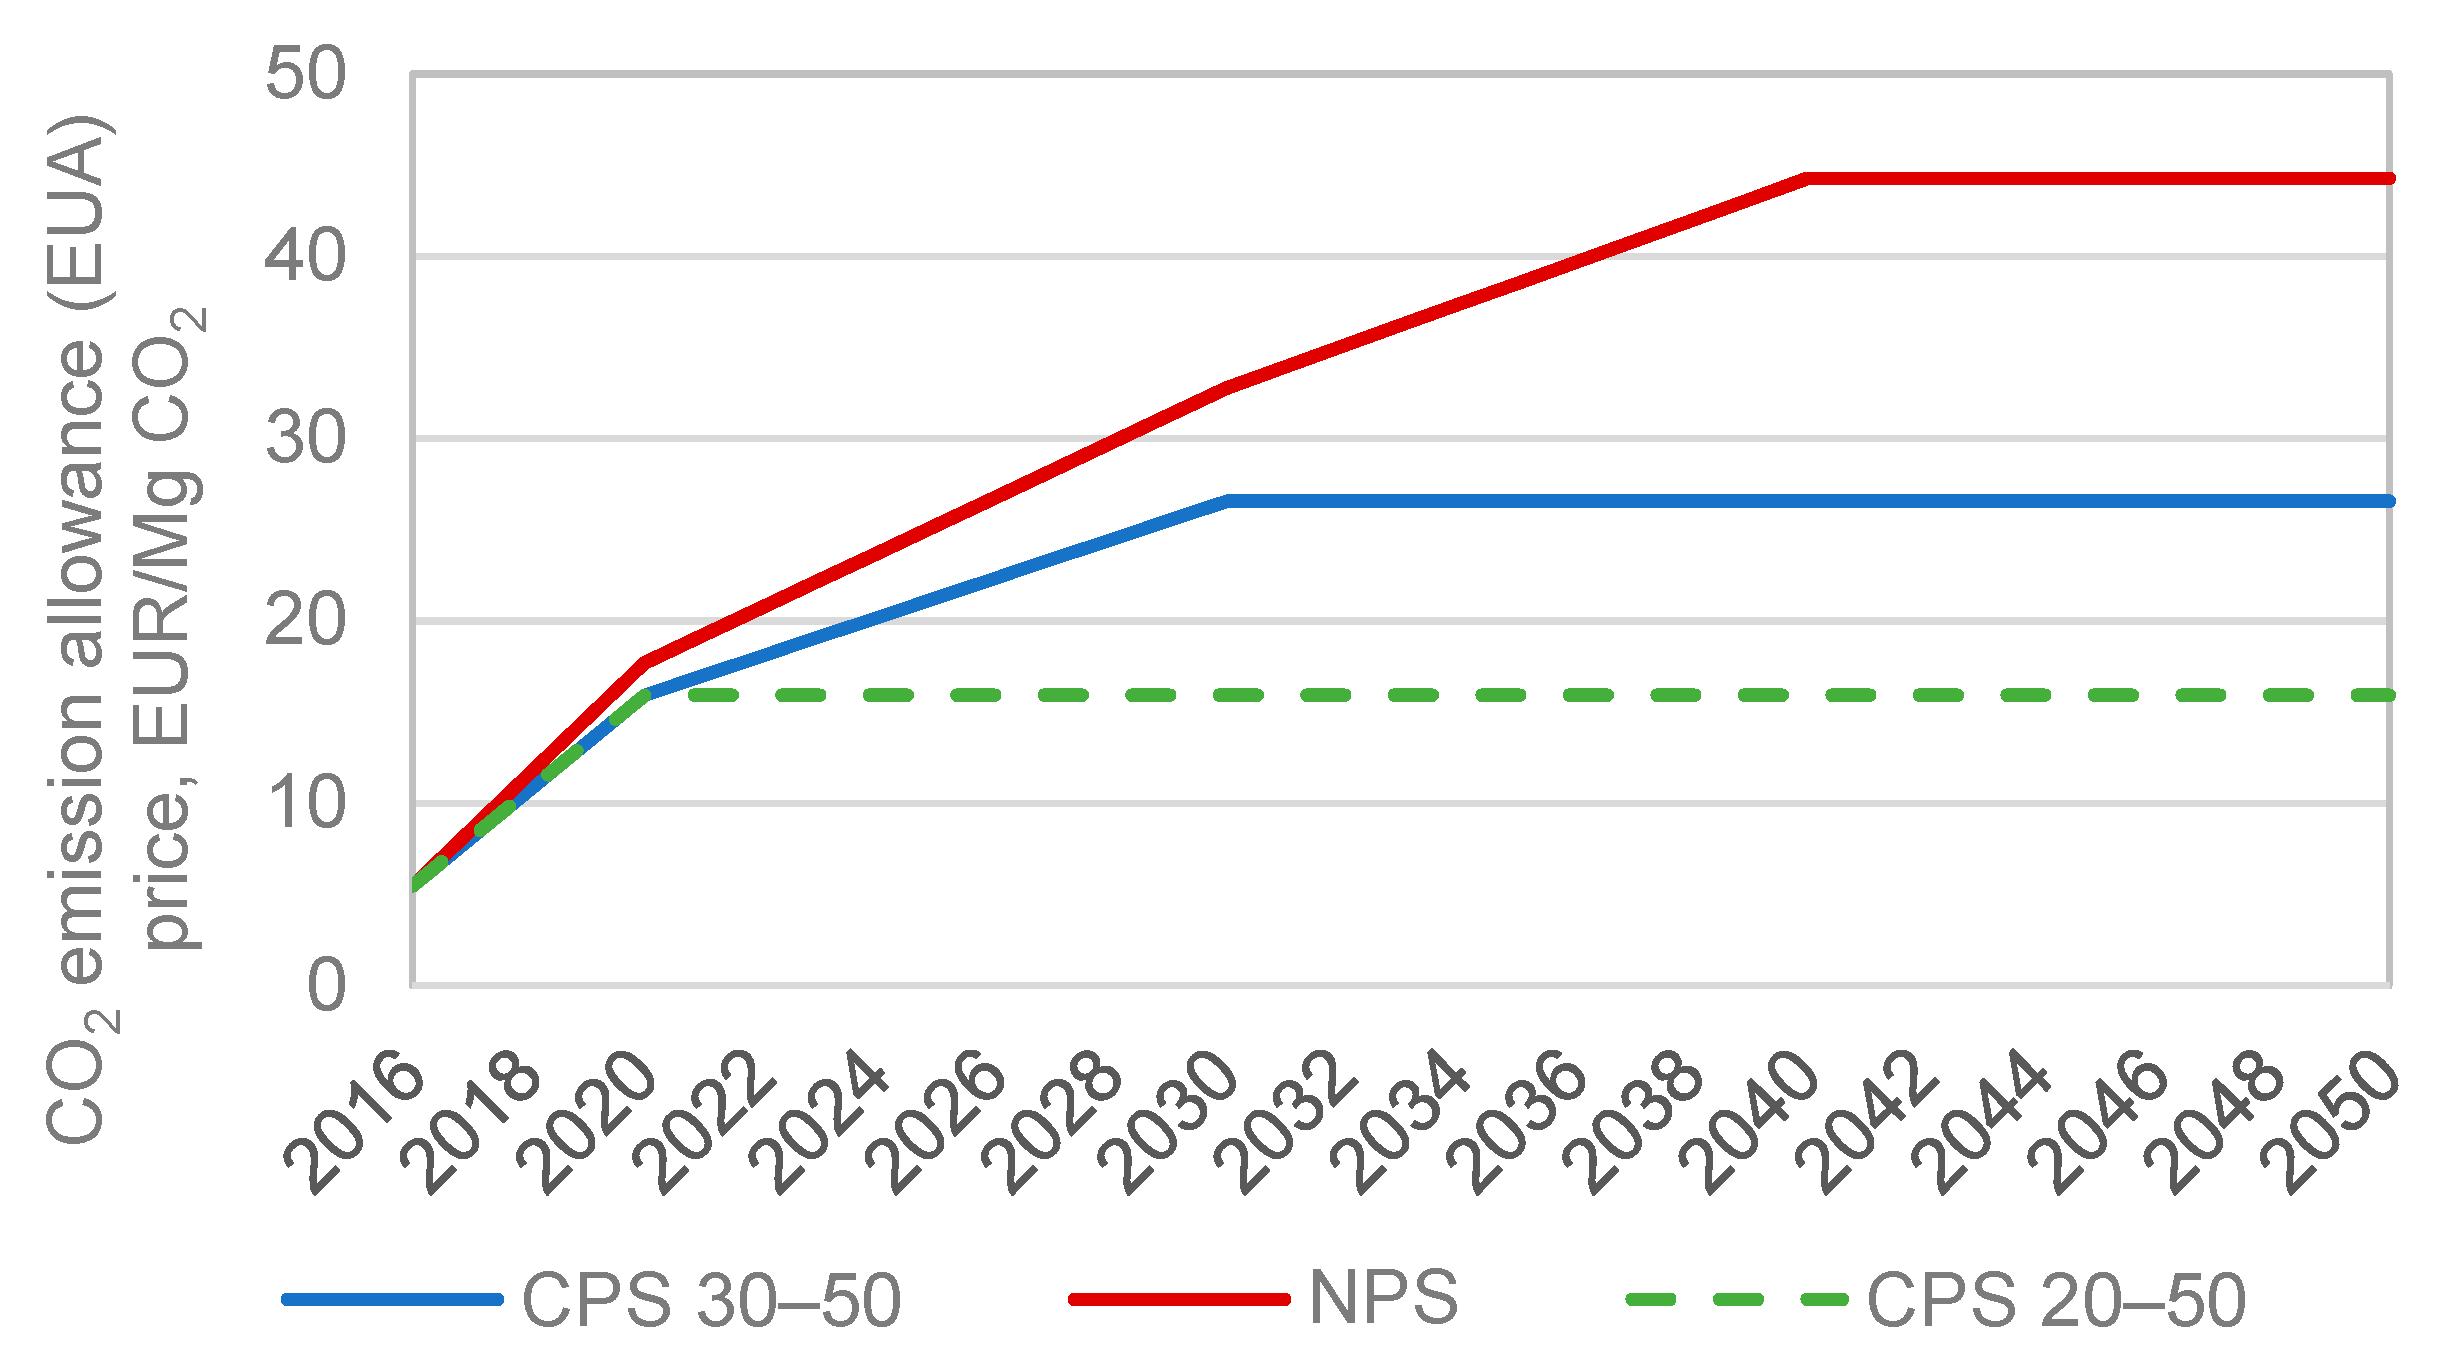
| CO2 emission allowance prices | Reference path (CPS 30–50) | High prices path–NPS | REF | REF |
| National RES target | Maintaining 20% RES share in electricity prod. 2021–2050 | REF | Increase in the minimum RES share in electricity generation to 30% in 2030 (to be maintained by 2050) | REF |
| Wind energy potential | Available wind energy potential limited to 30% | REF | REF | 100% of available wind energy potential |
| Pollutant emission standards (IED+BAT)/decommissioning of generating units | Adjustment of the existing 200 MW, 360 MW, 500 MW, and 1000 MW units to the requirements of the IED and BAT conclusions-reference level of decommissioning | REF | REF | REF |
| Scenario | REF | Decom-BAT 1 | HighEnEff 2 | MaxEnvReg 3 | MinEnvReg 4 |
|---|---|---|---|---|---|
| Energy efficiency/demand for electricity | Moderate electricity demand forecast | REF * | A faster pace in improving energy efficiency-low electricity demand forecast | High electricity demand forecast | Low electricity demand forecast |
| CO2 emission allowance prices | Reference path (CPS 30–50) | REF | REF | Low prices path–CPS 20–50 | High prices path–NPS |
| National RES target | Maintaining 20% RES share in electricity prod. 2021–2050 | REF | REF | Lack of min. RES share after 2020 | Increase in the minimum RES share in electricity generation to 30% in 2030 (to be maintained by 2050) |
| Wind energy potential | Available wind energy potential limited to 30% | REF | REF | REF | 100% of available wind energy potential |
| Pollutant emission standards (IED+BAT)/decommissioning of generating units | Adjustment of the existing 200 MW, 360 MW, 500 MW, and 1000 MW units to the requirements of the IED and BAT conclusions-reference level of decommissioning | High level of decommissioning in the system (200 MW units); only available units are those with CCS/CCU | REF | REF | High level of decommissioning in the system (200 MW units); only available units are those with CCS/CCU |
| Scenario | Fuel | 2020 | 2030 | 2040 | 2050 | Sum 2017–2050 |
|---|---|---|---|---|---|---|
| REF | Hard Coal | 69.8 | 95.4 | 146.1 | 159.5 | 3926.6 |
| Brown Coal | 46.3 | 41.6 | 6.5 | 1.8 | 850.1 | |
| RES-30% | Hard Coal | 0 | −12.1 | −21.0 | −25.0 | −11.8% |
| Brown Coal | 0 | −5.1 | 0 | 0.1 | −5.1% | |
| HighEUA | Hard Coal | 0 | −10.8 | −70.6 | −92.9 | −33.3% |
| Brown Coal | 0 | −5.1 | −2.6 | −1.8 | −12.2% | |
| Decom-BAT | Hard Coal | 0 | −14.2 | −73.4 | −108.6 | −38.1% |
| Brown Coal | 0 | −3.4 | −0.5 | 1.0 | 6.5% | |
| WindPot-100% | Hard Coal | 0 | −1.4 | −0.3 | −16.9 | −1.8% |
| Brown Coal | 0 | 0.1 | 0.2 | −1.8 | −0.5% | |
| HighEnEff | Hard Coal | −0.9 | −0.8 | −6.8 | −10.0 | −3.2% |
| Brown Coal | 0 | −1.5 | 0.3 | 0 | −2.6% | |
| MaxEnvReg | Hard Coal | 3.3 | −20.7 | −87.8 | −123.0 | −43.4% |
| Brown Coal | 0 | −24.1 | −4.5 | −1.8 | −27.8% | |
| MinEnvReg | Hard Coal | 5.6 | 15.8 | 41.4 | 53.7 | 22.6% |
| Brown Coal | 0 | 4.2 | 0.3 | −0.2 | 12.9% |
| Scenario, mln Mg | 2017–2020 | 2021–2025 | 2026–2030 | 2031–2035 | 2036–2040 | 2041–2045 | 2046–2050 | Total | Difference% |
|---|---|---|---|---|---|---|---|---|---|
| REF | 110.0 | 136.5 | 149.6 | 184.5 | 221.9 | 243.1 | 250.7 | 1296.3 | 100% |
| RES-30% | 110.0 | 136.4 | 137.3 | 153.8 | 188.8 | 208.7 | 215.6 | 1150.6 | −11.2% |
| HighEUA | 110.6 | 137.0 | 142.7 | 136.6 | 129.1 | 107.1 | 103.7 | 866.8 | −33.1% |
| Decom-BAT | 110.0 | 135.2 | 132.3 | 127.5 | 121.2 | 96.4 | 78.8 | 801.4 | −38.2% |
| WindPot-100% | 110.0 | 136.5 | 147.5 | 183.1 | 220.4 | 239.1 | 230.7 | 1267.4 | −2.2% |
| HighEnEff | 109.2 | 135.0 | 147.3 | 182.5 | 213.6 | 229.2 | 235.1 | 1252.0 | −3.4% |
| MaxEnvReg | 109.9 | 128.7 | 117.5 | 105.3 | 92.3 | 73.8 | 56.0 | 683.4 | −47.3% |
| MinEnvReg | 110.0 | 141.6 | 165.3 | 200.5 | 260.7 | 296.5 | 305.9 | 1480.5 | 14.2% |
| Scenario, mln Mg | 2017–2020 | 2021–2025 | 2026–2030 | 2031–2035 | 2036–2040 | 2041–2045 | 2046–2050 | Total | Difference% |
|---|---|---|---|---|---|---|---|---|---|
| REF | 214.1 | 222.0 | 239.2 | 164.4 | 75.8 | 25.8 | 9.6 | 950.9 | 100% |
| RES-30% | 214.1 | 208.5 | 207.5 | 161.2 | 75.2 | 25.9 | 10.0 | 902.4 | −5.1% |
| HighEUA | 214.7 | 202.5 | 210.3 | 135.0 | 58.8 | 12.5 | 0 | 833.7 | −12.3% |
| Decom-BAT | 214.1 | 222.0 | 220.7 | 206.0 | 102.6 | 26.1 | 13.7 | 1005.2 | 5.7% |
| WindPot-100% | 214.1 | 222.0 | 239.1 | 166.1 | 76.7 | 26.2 | 2.7 | 947.0 | −0.4% |
| HighEnEff | 214.1 | 219.2 | 233.7 | 153.0 | 71.1 | 25.7 | 9.2 | 926.0 | −2.6% |
| MaxEnvReg | 214.7 | 195.2 | 128.8 | 86.9 | 45.2 | 7.4 | 0 | 678.2 | −28.7% |
| MinEnvReg | 214.1 | 252.4 | 260.6 | 186.6 | 92.0 | 25.8 | 9.6 | 1041.2 | 9.5% |
© 2020 by the authors. Licensee MDPI, Basel, Switzerland. This article is an open access article distributed under the terms and conditions of the Creative Commons Attribution (CC BY) license (http://creativecommons.org/licenses/by/4.0/).
Share and Cite
Kaszyński, P.; Kamiński, J. Coal Demand and Environmental Regulations: A Case Study of the Polish Power Sector. Energies 2020, 13, 1521. https://doi.org/10.3390/en13061521
Kaszyński P, Kamiński J. Coal Demand and Environmental Regulations: A Case Study of the Polish Power Sector. Energies. 2020; 13(6):1521. https://doi.org/10.3390/en13061521
Chicago/Turabian StyleKaszyński, Przemysław, and Jacek Kamiński. 2020. "Coal Demand and Environmental Regulations: A Case Study of the Polish Power Sector" Energies 13, no. 6: 1521. https://doi.org/10.3390/en13061521