Article

Numerical Simulation of Sulfur Deposit with Particle Release

1
State Key Laboratory of Shale Oil and Gas Enrichment Mechanisms and Effective Development, Beijing 100083 China
2
Sinopec Petroleum Exploration and Production Research Institute, Beijing 100083, China
3
State Key Laboratory of Petroleum Resources and Prospecting, China University of Petroleum - Beijing, Beijing 102249, China
4
Department of Oil-Gas Field Development Engineering, College of Petroleum Engineering, China University of Petroleum - Beijing, Beijing 102249, China
*
Author to whom correspondence should be addressed.
Energies 2020, 13(6), 1522; https://doi.org/10.3390/en13061522
Submission received: 11 December 2019 / Revised: 24 February 2020 / Accepted: 6 March 2020 / Published: 23 March 2020

Abstract

:
Sulfur deposition commonly occurs during the development of a high-sulfur gas reservoirs. Due to the high gas flow velocity near the wellbore, some of the deposited sulfur particles re-enter the pores and continue to migrate driven by the high-speed gas flow. The current mathematical model for sulfur deposition ignores the viscosity between particles, rising flow caused by turbulence, and the corresponding research on the release ratio of particles. In order to solve the above problems, firstly, the viscous force and rising force caused by turbulence disturbance are introduced, and the critical release velocity of sulfur particles is derived. Then, a release model of sulfur particles that consider the critical release velocity and release ratio is proposed by combining the probability theory with the hydrodynamics theory. Notably, based on the experimental data, the deposition ratio of sulfur particles and the damage coefficient in the sulfur damage model are determined. Finally, a comprehensive particle migration model considering the deposition and release of sulfur particles is established. The model is then applied to the actual gas wells with visible sulfur deposition that target the Da-wan gas reservoir, and the results show that the model correctly reflects flow transport during the process of sulfur deposition in porous media. In addition, through the numerical simulation experiments, it was found that considering the release of sulfur particles reduces the saturation of sulfur particles within a specific range around the well and improve the reservoir permeability in this range. From the perspective of gas production rate, the release of sulfur particles has a limited effect on the gas production rate, which is mainly due to the sulfur particle release being limited, having only a 5 m range near the wellbore area, and thus the amount of gas flow from the unaffected area is basically unchanged.

1. Introduction

A high-sulfur gas reservoir contains abundant H2S and often a variety of sulfides bearing special gas reservoirs. Sulfur dissolved in acid gas produced from high-sulfur gas reservoirs may either precipitate as a liquid or solid as the pressure in the well and the reservoir decreases. When the formation temperature is higher than the solidification point of sulfur (115.4–119 °C), liquid sulfur is formed. When the formation temperature is lower than the solidification point of sulfur, solid sulfur particles form and may block pores in the formation, reducing the permeability of the reservoir. This can potentially cause shutdown of the productive gas wells. In order to prevent or delay the adverse effects caused by solid sulfur deposition and provide reasonable development strategies for high-sulfur gas reservoirs, it is necessary to have a clear understanding of the principles of the porous media flow within these reservoirs and establish a valid mathematical model.
With the increasing understanding of the mechanisms of sulfur deposition, various models have emerged in recent years, but are generally divided into three categories: (1) those that establish an analytical model for sulfur deposition through various assumptions (Kuo, 1972, Hyne, 1983, 1988, Roberts, 1997) [1,2,3], with the model depending on whether the assumptions are close to the actual situation; and (2)those based on black oil by replacing the elemental sulfur for the oil phase, The amount of sulfur is adjusted by the proportion of condensate gas, while the permeability of condensate oil is set to zero. A typical model is proposed by Bruce E. Robert to predict sulfur deposition based on the measured data of several high-sulfur gas wells in Alberta and other gas fields in Canada [3]; Gu used a similar method to simulate the liquid sulfur deposition process [4,5]. Currently, most scholars use the Roberts model to study sulfur deposition. The most significant disadvantage of this model is that it merely regards sulfur precipitation from acid gas as deposition in a static environment and ignores the sulfur migration mechanism in acid gas (3). The third model describes sulfur particle migration based on a particle migration model. Jamal and abou-Kassem studied the influence of fluid velocity on sulfur deposition through core flooding experiments and proposed the concept of critical sulfur carrying velocity [6]. Ali proposed a sulfur adsorption model in his numerical model [7]. Zhang Yong and Zeng Ping described the force characteristics of sulfur particles from the viewpoint of micro-dynamics [8,9], and determined the effect of hydrodynamics on sulfur particles on the pore surface, to propose a sulfur particle release model. Zeng Ping’s particle release model considered the release of particles as mainly affected by four forces: hydrodynamics, gravity, van der Waals force, and pore wall double electron layer repulsion force. Shield [10] also proposed a particle release model without considering the viscous force based on the assumption of cohesionless particles. However, according to Sagan [11] and Bagnold [12], it is believed that fine sand particles are difficult to release, due to viscous force. Iverson [13] and White [14] have also confirmed the above viewpoint through wind tunnel experiments and determined that the viscous force is essential for sand particles down to 1 μm. Therefore, the viscous force cannot be ignored when calculating the release of sulfur particles in reservoirs. In addition, it is difficult for the lifting force caused by the high-speed shear of stable gas flow to lift fine particles in a pore space. Fletcher and others directly observed through experiments that the release of fine particles is often accompanied by unstable air flow disturbance, rather than stable air flow sheerness [15]. Therefore, the expression of hydrodynamic shear force in the widely used starting model of sulfur particles cannot technically be applied.
In this paper, the influence of viscosity and turbulence disturbance on the release of sulfur particles are added to existing sulfur particle release models, to create a new comprehensive deposition model. Based on experimental data, the deposition velocity of sulfur particles, the release velocity of the particles, and the degree of damage to the particles on the reservoir were determined. This model accurately reflects sulfur particle deposition when compared to wellbore data from the Da-wan gas reservoir in the Puguang gas field, China, and the changes in production over time.

2. Sulfur Deposition Model

2.1. Comprehensive Mathematical Model Considering Sulfur Deposition

Underlying assumptions of the comprehensive mathematical model of sulfur deposition:
(1).
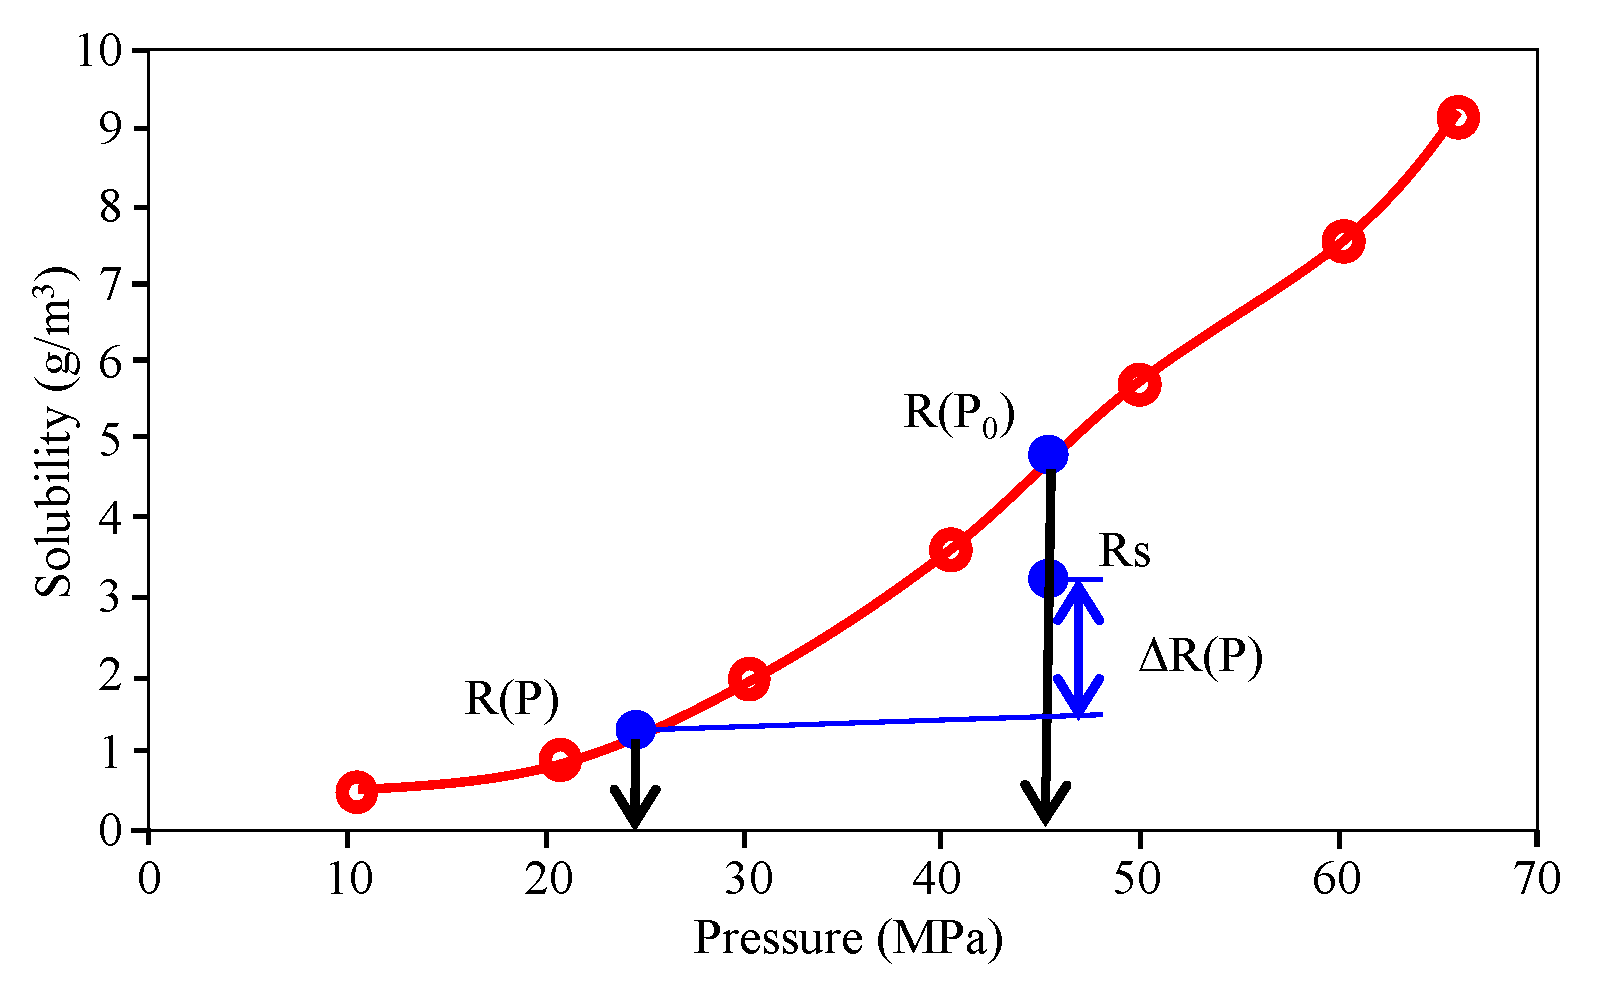
Elemental sulfur precipitated from acid gas in the form of solid sulfur particles.
(2).
The gas reservoir is considered as an isothermal system during the entire production process.
(3).
The solid sulfur particles flow with the acid gas. When the sulfur particles move, the migration speed of the sulfur particles is the same as that of the gas flow.
(4).
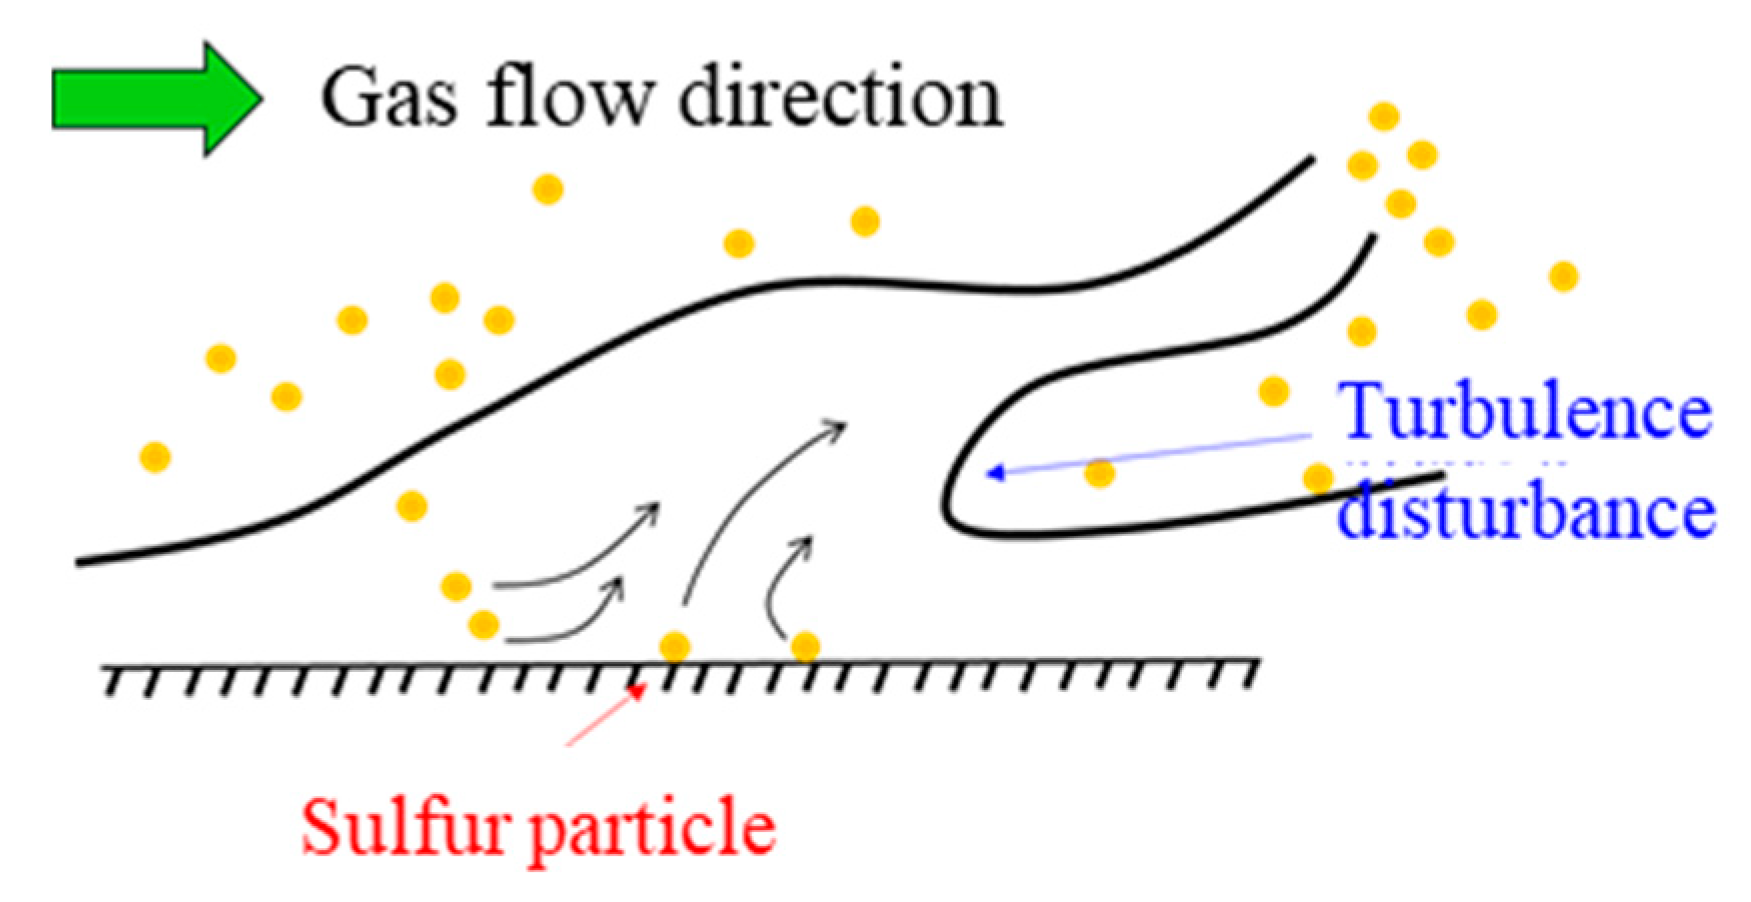
The deposition of sulfur particles and the release of sulfur particles driven by high-speed air flow are two main mechanisms in the process of gas carrying sulfur.
The sulfur migration model is mainly composed of two parts: a gas phase model, as shown in Equation (1); and a sulfur particle migration model, as shown in Equation (2). In the process of numerical simulation, the gas phase model is used to calculate the pressure distribution and gas flow rate, and then used to calculate the suspended particle concentration in the porous media based on the particle migration model. In addition, the three mechanisms of sulfur particle movement, including precipitation, deposition, and release, are mainly considered in this model. The amount of sulfur particles caused by each mechanism is added into the sulfur migration model as a source–sink term.
Gas phase model:
div ( k k r g B g μ g g r a d p ) = ( ϕ ρ g S g ) t
Solid particle migration model:
div ( u g C s ) + q C s + q deposit + q release = ( ϕ S g C s ) t
where qCS in Equation (2) is the amount of precipitated sulfur particles. Sulfur precipitation is mainly related to the initial sulfur content in the acid gas and the solubility of sulfur under different temperature and pressure conditions. The amount of precipitated sulfur can be calculated using Equation (3) and the change in sulfur content (ΔR) in the acid gas can be calculated by the solubility curve, which is measured by experiments:
q C s = Δ R P V ( 1 S w )
where ΔR represents the change in sulfur content in the acid gas, and PV represents the pore volume. Generally, as shown in Figure 1, when the initial formation pressure is P0, the initial sulfur concentration is RS, and the solubility of sulfur corresponding to the initial formation pressure is R (P0). Generally, RS is lesser than R (P0), so the acid gas is considered sulfur saturated at P0, and there will be no sulfur precipitation. During production, the pressure of a reservoir drops from the original pressure P0 to pressure P, and the solubility of the sulfur in the gas decreases to R (P). When RS is greater than R (P), the acid gas is now supersaturated; sulfur precipitates out of solution due to this decrease in pressure P until a concentration of R(P) is reached. This value is ΔR as calculated by Equation (3); that is to say, under the pressure P, the acid gas cannot dissolve the sulfur with a concentration of RS; a part of the sulfur element needs to be separated out until the sulfur concentration in the acid gas drops to R (P) in the above process; the change in concentration of the sulfur element in the acid gas is ΔR; and the mount of the separated sulfur is calculated using Equation (4).
qdeposit in Equation (4) indicates the deposition amount of sulfur particles in porous media. The characterization of the deposition amount is shown in Equation (4). Adep is the deposition rate of the sulfur particles:
q d e p o s i t = A dep C s P V S g
In the process of numerical simulation, the deposition and amount of release sulfur particles were recorded at each time step, and then the real deposition of sulfur particles was calculated at each time using Equation (5). The sulfur saturation at each time is obtained by dividing the accumulated sulfur particle volume by the pore volume (Equation (6)). According to the research of Gruesbeck [16], the relationship between sulfur saturation and reservoir permeability is exponential [16], and the reservoir damage model is shown in Equation (7), which was used to characterize the damage caused by the deposited sulfur particles to reservoir permeability.
V s u l f u r = ( q d e p o s i t q r e l e a s e ) ρ s u l f u r
S s = V s u l f u r P V
K r = K 0 e a S s

2.2. Sulfur Particle Release Model

Particle release is when the gas velocity in the pore is high enough to cause disturbance on the pore surface so that sulfur particles that have been deposited on the pore surface may release and flow with the gas in the system. According to Sagan [11] and Bagnold [12], fine sand particles are difficult to release mainly due to the viscous force. Iverson [13] and White [14] also confirmed the above viewpoint through wind tunnel experiments. For fine particles such as sulfur, the release is mainly caused by turbulence disturbance [15], as shown in Figure 2. The upwelling caused by turbulence brings the deposited sulfur particles into the pores and flows with the gas through the system until they are deposited once again.
There are three forces that primarily affect sulfur particle release: (1) the viscous force between particles; (2) the upwelling force caused by turbulence; and (3) the resultant force of gravity and the buoyancy of the sulfur particles. According to Phillips [17], the viscosity between the fine particles is directly proportional to the particle radius, as shown in Equation (8):
F a = a c π 2 ρ s ε d
where Fa is the viscosity between particles; ac is the coefficient; ρs is the density of sulfur, in kg/m3; ε is the adhesion parameter, in cm3/S2; and d is particle diameter, in μm, in which the adhesion parameter is closely related to the material of particles. In this paper, the adhesion parameter of the sulfur particles is taken as ε = 1.75 cm3/s2 by referring to the adhesion parameter of sediment [18]. According to the theory of Dou [19], the drag force caused by the turbulence disturbance of the gas flow can be expressed as follows:
F b = λ y π 4 d 2 ρ u 2 2
where Fb is the rising force caused by the turbulence disturbance, ρ is the air flow density, u is the air flow speed, and λy is the coefficient. Besides the viscous force and turbulence disturbance, there are also gravity and buoyancy that affect sulfur particle release. The expression of the resultant force of gravity and buoyancy is as follows:
F g = ( ρ s ρ g ) g π 6 d 3
when the combined force of gravity and viscosity is equal to the uplift drag force, and sulfur particles begin to release from the pore surface. When the gas velocity reaches uc, sulfur particles may be released from the pore surface, and the expression of the critical velocity is shown in Equation (11):
u c = a 1 ( ρ s ρ g ) g d ρ + a 2 ε d
According to experimental data, Dou [19] have set coefficients a1 and a2 in Equation (11) as 3.6 and 2, respectively. A new particle release model for sulfur particles is established after the critical flow rate uc is calculated:
q r e l e a s e = { 0 , u < u c A r C s d P V ( 1 S w ) , u > u c
For the new sulfur particle release model, when the gas velocity is less than the critical flow rate uc, the rising force caused by turbulence disturbance is not enough to lift the deposited sulfur particles, and the release possibility of sulfur particles is zero. When the gas rate is greater than or equal to the critical flow rate uc, the rising force caused by turbulence disturbance is enough to lift the sulfur particles causing them to enter the pore space with the flow of acid gas. Ar in Equation (12) is used to describe the release rate of sulfur particles. The release possibility Ar of sulfur particles is actually a probability of particle release; Ar is related to the velocity of gas flow, and a higher velocity equates to a higher probability of particle release from the pore surface. Even if the gas flow rate is greater than the critical flow rate, the particles may still not release. The main reason for this phenomenon is complex and diverse as there are a variety of factors affecting the release of particles, including the roughness of the pore surface, the location of particles (such as being buried in the particle layer, or protruding on the surface of the particle layer), and many others. These influencing factors cannot be accurately known or characterized for every situation. Based on the above reasons, the probability model is best to describe the particle release.
According to the probability model proposed by Dou [19], the release of particles can be generally divided into three categories: (1) motionless, (2) small amount of motion, and (3) universal motion [19]. The motionless particles are particles with virtually no movement except for some protruding sulfur particles on the pore surface that may occasionally shake. A small amount of motion consists of a small amount of sulfur particles on the pore surface that start to move with the flow of the gas, yet the majority of the particles stay in place. Universal motion consists of sulfur particles that are fully released from the pore surface. The probability of each type of movement is given in the model. The calculation of the probability is determined by comparison with experimental data. It can be seen from Equation (13) that the probability of particle release is different when the gas velocity is in a different range: uc1and uc2 were used to distinguish the different velocity ranges. According to Dou’s literature, the relationship between uc1, uc2 and critical velocity uc are able to be determined from Equation (14). The equation of ucn is as follows in Equation (14):
A r { p [ u ( 0 , u c 1 ) ] = 0.00135 ,   motionless p [ u ( u c 1 , u c 2 ) ] = 0.0277 ,   small   amount   of   motion   p [ u ( u c 2 , ) ] = 0.159 ,   universal   motion
u c n = m u c , n = 1 , 2
The value of m is different under different conditions, as shown in Equation (15):
m { 1 , for u c 1 2 , for u c 2
The model described in this study mainly focuses on the effect of gas velocity on solid particle migration. Due to the limitation of experiment conditions, the model ignores the influence of other factors like pore throat structure, gelation nucleation [20,21], mineral composition [22], etc. Only few articles have been dedicated to the accurate description of suspension, adsorption, deposition, and release of particles in porous media. A study of the migration characteristics of sulfur particles from the micro dynamics aspect is therefore merited.

2.3. Determination of Parameters
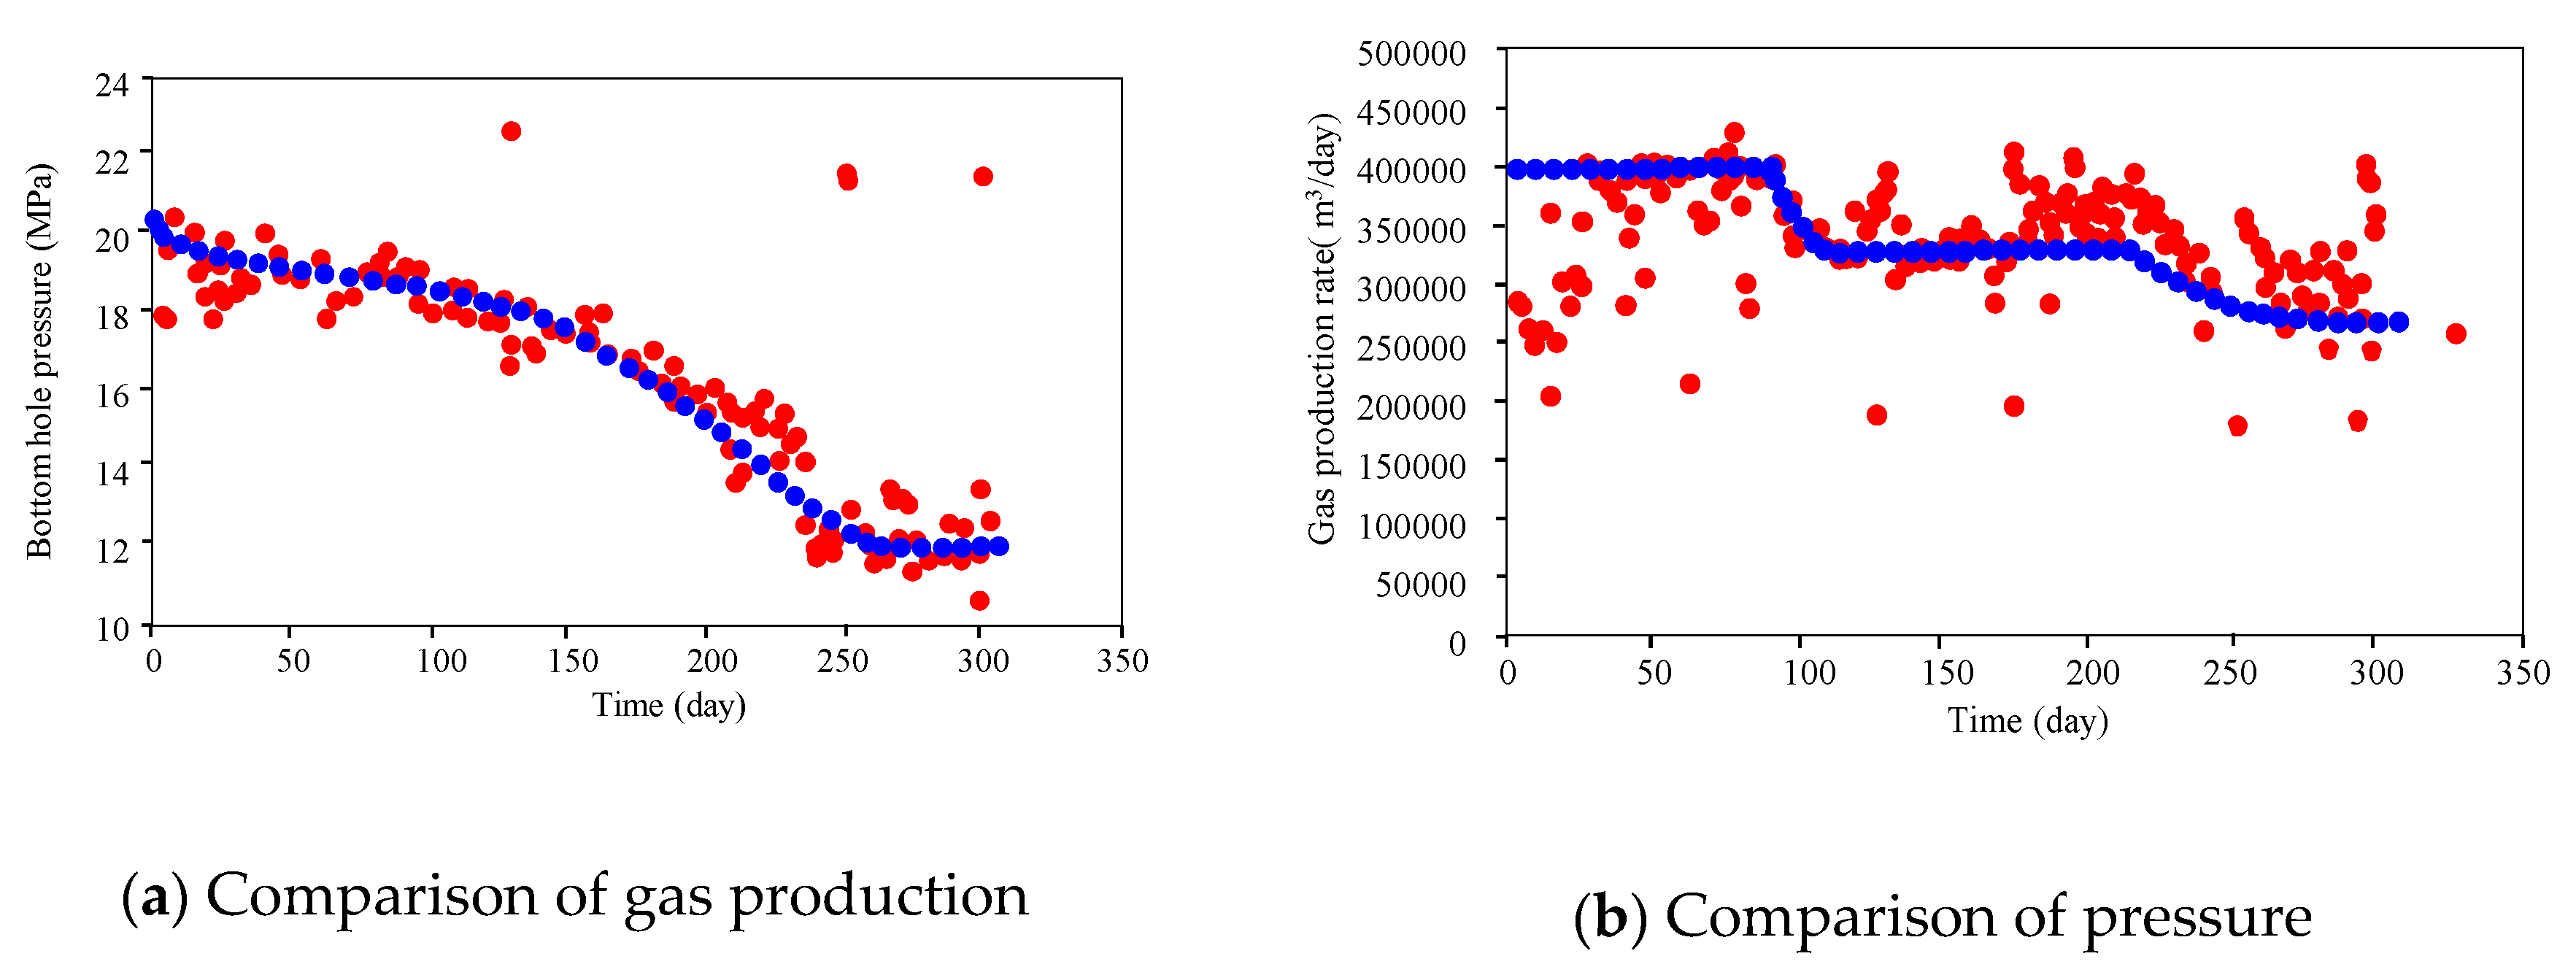
First, the deposition rate of the sulfur particles needed to be determined. The throat pore model was built using ICEM software to simulate the deposition rate of the sulfur particles when gas flow through the throat. In the simulation process, the gas phase was the continuous phase, and the solid sulfur particles were in discrete spherical form in the flowing gas. The Euler Lagrange equation in the software was used to simulate the gas–solid two-phase flow. The purpose of the numerical experiment was to study the deposition ratio at different mass flow rates of 2 × 10⁻¹¹ kg/s, 4 × 10⁻¹¹ kg/s, 6 × 10⁻¹¹/s, and 8 × 10⁻¹¹ kg/s. Sulfur particles with radii of 0.1 μm, 0.2 μm, 0.5 μm, 1 μm, and 2 μm were simulated for each mass flow rate. The simulation results are shown in Figure 3. The mass velocity of particles had little impact on the deposition ratio of the particles, but the deposition ratio increased with the increase in particle diameter. In the end, the research on sulfur particles by Zhang Guangdong [23] indicated that the average diameter of the sulfur particles is typically 0.5 μm, so the deposition ratio is set to 15% in the simulation process, the average rate for 0.5 μm particles.
In order to measure the damage caused by the deposited solid sulfur to the reservoir, a weighing experiment was designed to measure the change in sulfur saturation at different permeabilities of the reservoir. The permeability of rocks under different sulfur saturations were measured in the lab using core samples. The main experimental steps were as follows. First, a clean core from a sulfur gas reservoir was obtained: a sample with a length of 4 cm and diameter of 2.5 cm was cut from the core. A sulfur solution consisting of CS2 with a sulfur concentration of 0.3% was injected into the core at various pressures to simulate five sulfur saturation levels from 0.00% to 0.06%. Once the outlet liquid flow was stable, the core sample was dried and weighed at each pressure before continuing to the next pressure step. The gas measurement method was then used to calculate the permeability under different sulfur saturation levels of the core. This data was then entered into Equation (7) to determine the degree of damage to the reservoir. A total of five sulfur injection operations were performed on the core. The relationship between the measured permeability and sulfur saturation is shown in Figure 4. According the experimental data and Equation (7), the damage parameter for the model was 8.806.

3. Model Validation

In order to verify the proposed model accuracy, the Da-wan gas reservoir was chosen as an analog for testing. The formation temperature of the Da-wan gas reservoir is 90–110 °C, which is in the range of a solid sulfur deposition. A well with a 300-day production history in the Da-wan gas reservoir that was accompanied with significant wellbore sulfur precipitation and evident production decline was selected. After 90 days of constant production at 400,000 m3/day, production began to decline until the rate was reduced to 350,000 m3/day. After a period of continuous production, the well began to decline once again. The model simulated the gas production and bottom-hole pressure of the production well with the basic parameters used for the numerical simulation shown in Table 1. The model results are compared to the measured well data in Figure 5. Both the production rate and bottom-hole pressure generally agree, indicating that the model and parameters used in the model are reasonable

4. Influence of Solid Sulfur Particle Release on Gas Well Production

4.1. Establishment of Single Well Numerical Model

In order to study the effect of sulfur particle deposition on production wells, a numerical simulation for a single well model was created using the above model. The grid number of this model was 51 × 51 × 2 with a grid size of 2 m × 2 m × 5 m. According to the existing reservoir characteristics of the Da-wan gas reservoir, the porosity was set to 0.15, the permeability to 1 mD, the gas saturation was 0.6181, and the comprehensive compressibility 1.82 × 10⁻⁴ 1/MPa. The measured solubility curve of the Da-wan gas reservoir of Figure 1 was used. The initial formation pressure was 35 MPa, and the production well proration was set to produce at a constant rate of 500,000 m3/day until the bottom hole pressure decrease to 30 MPa. When the production well was unable to produce at a constant rate, the production well proration was changed to maintain a constant bottom hole pressure of 30 MPa.

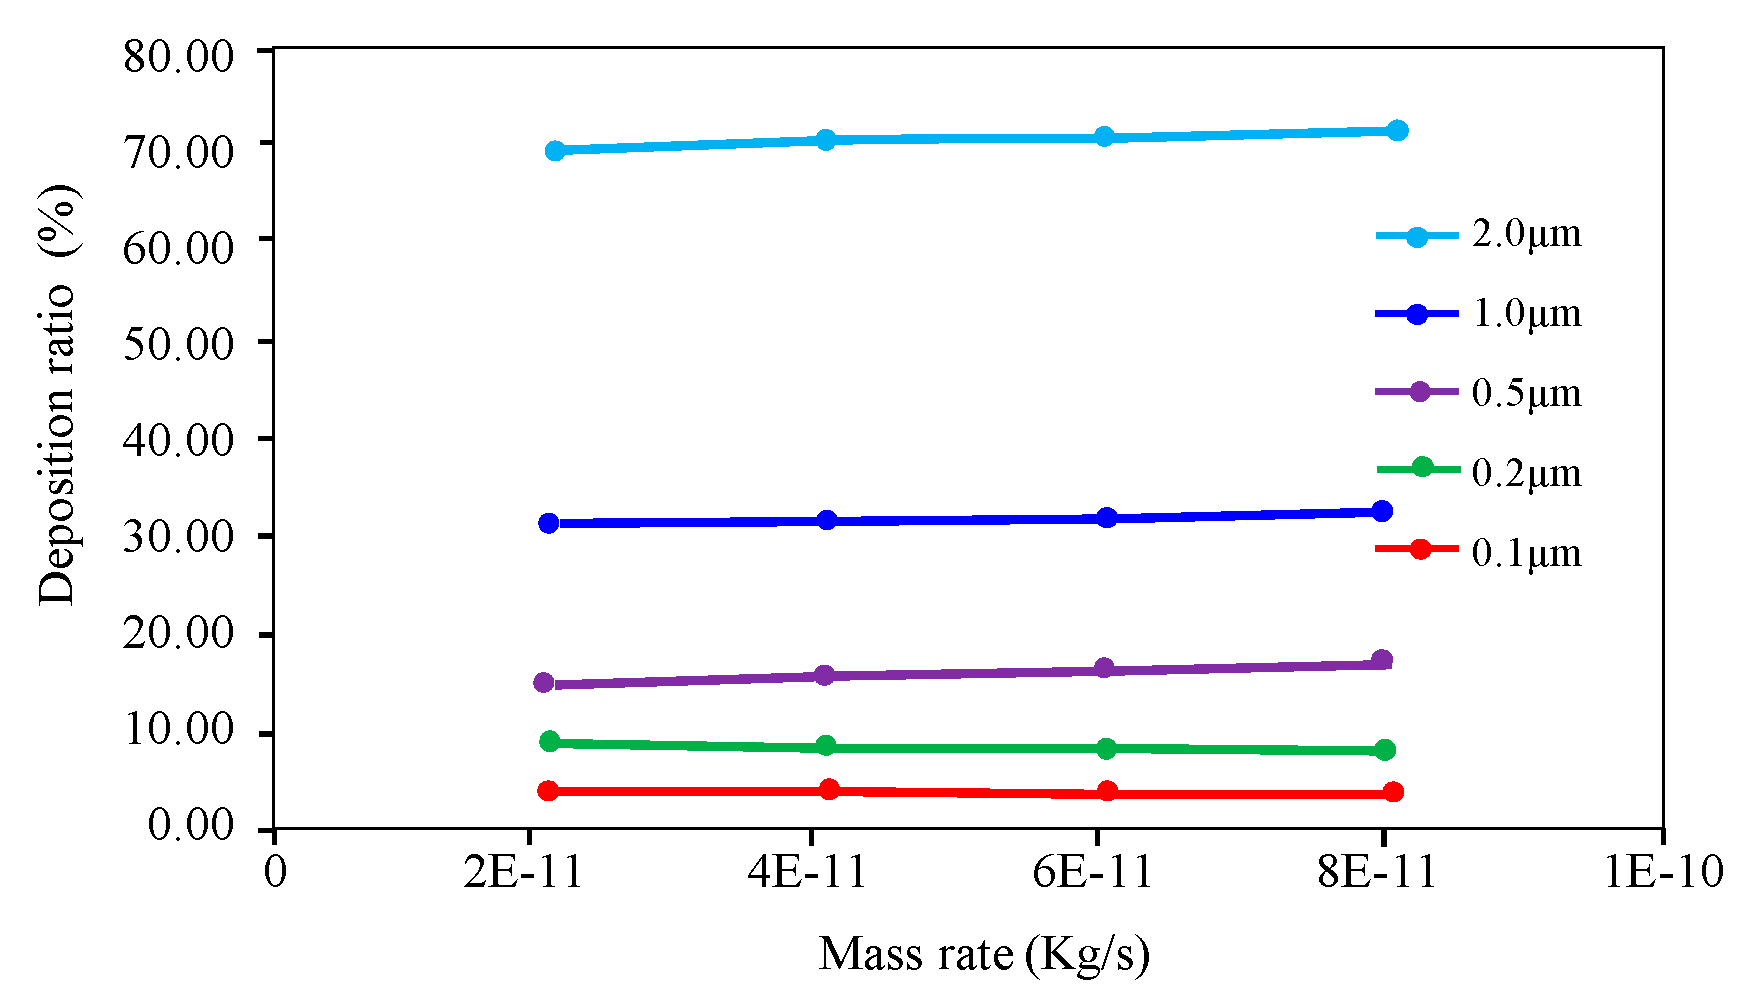
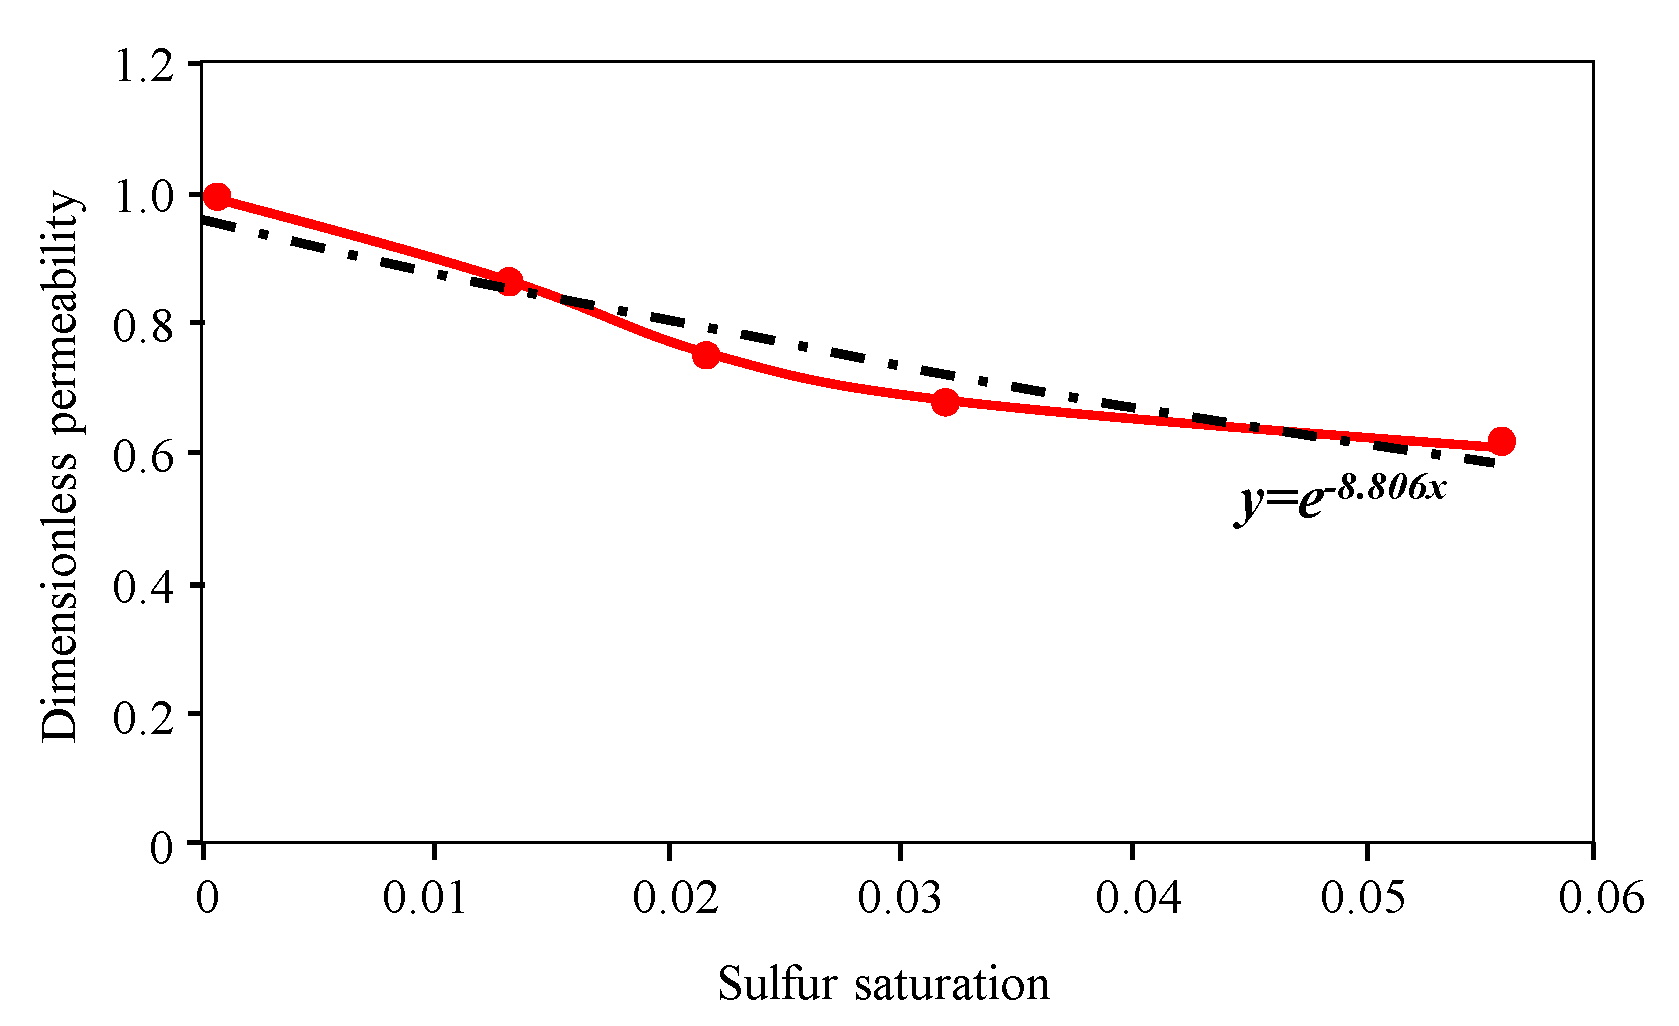
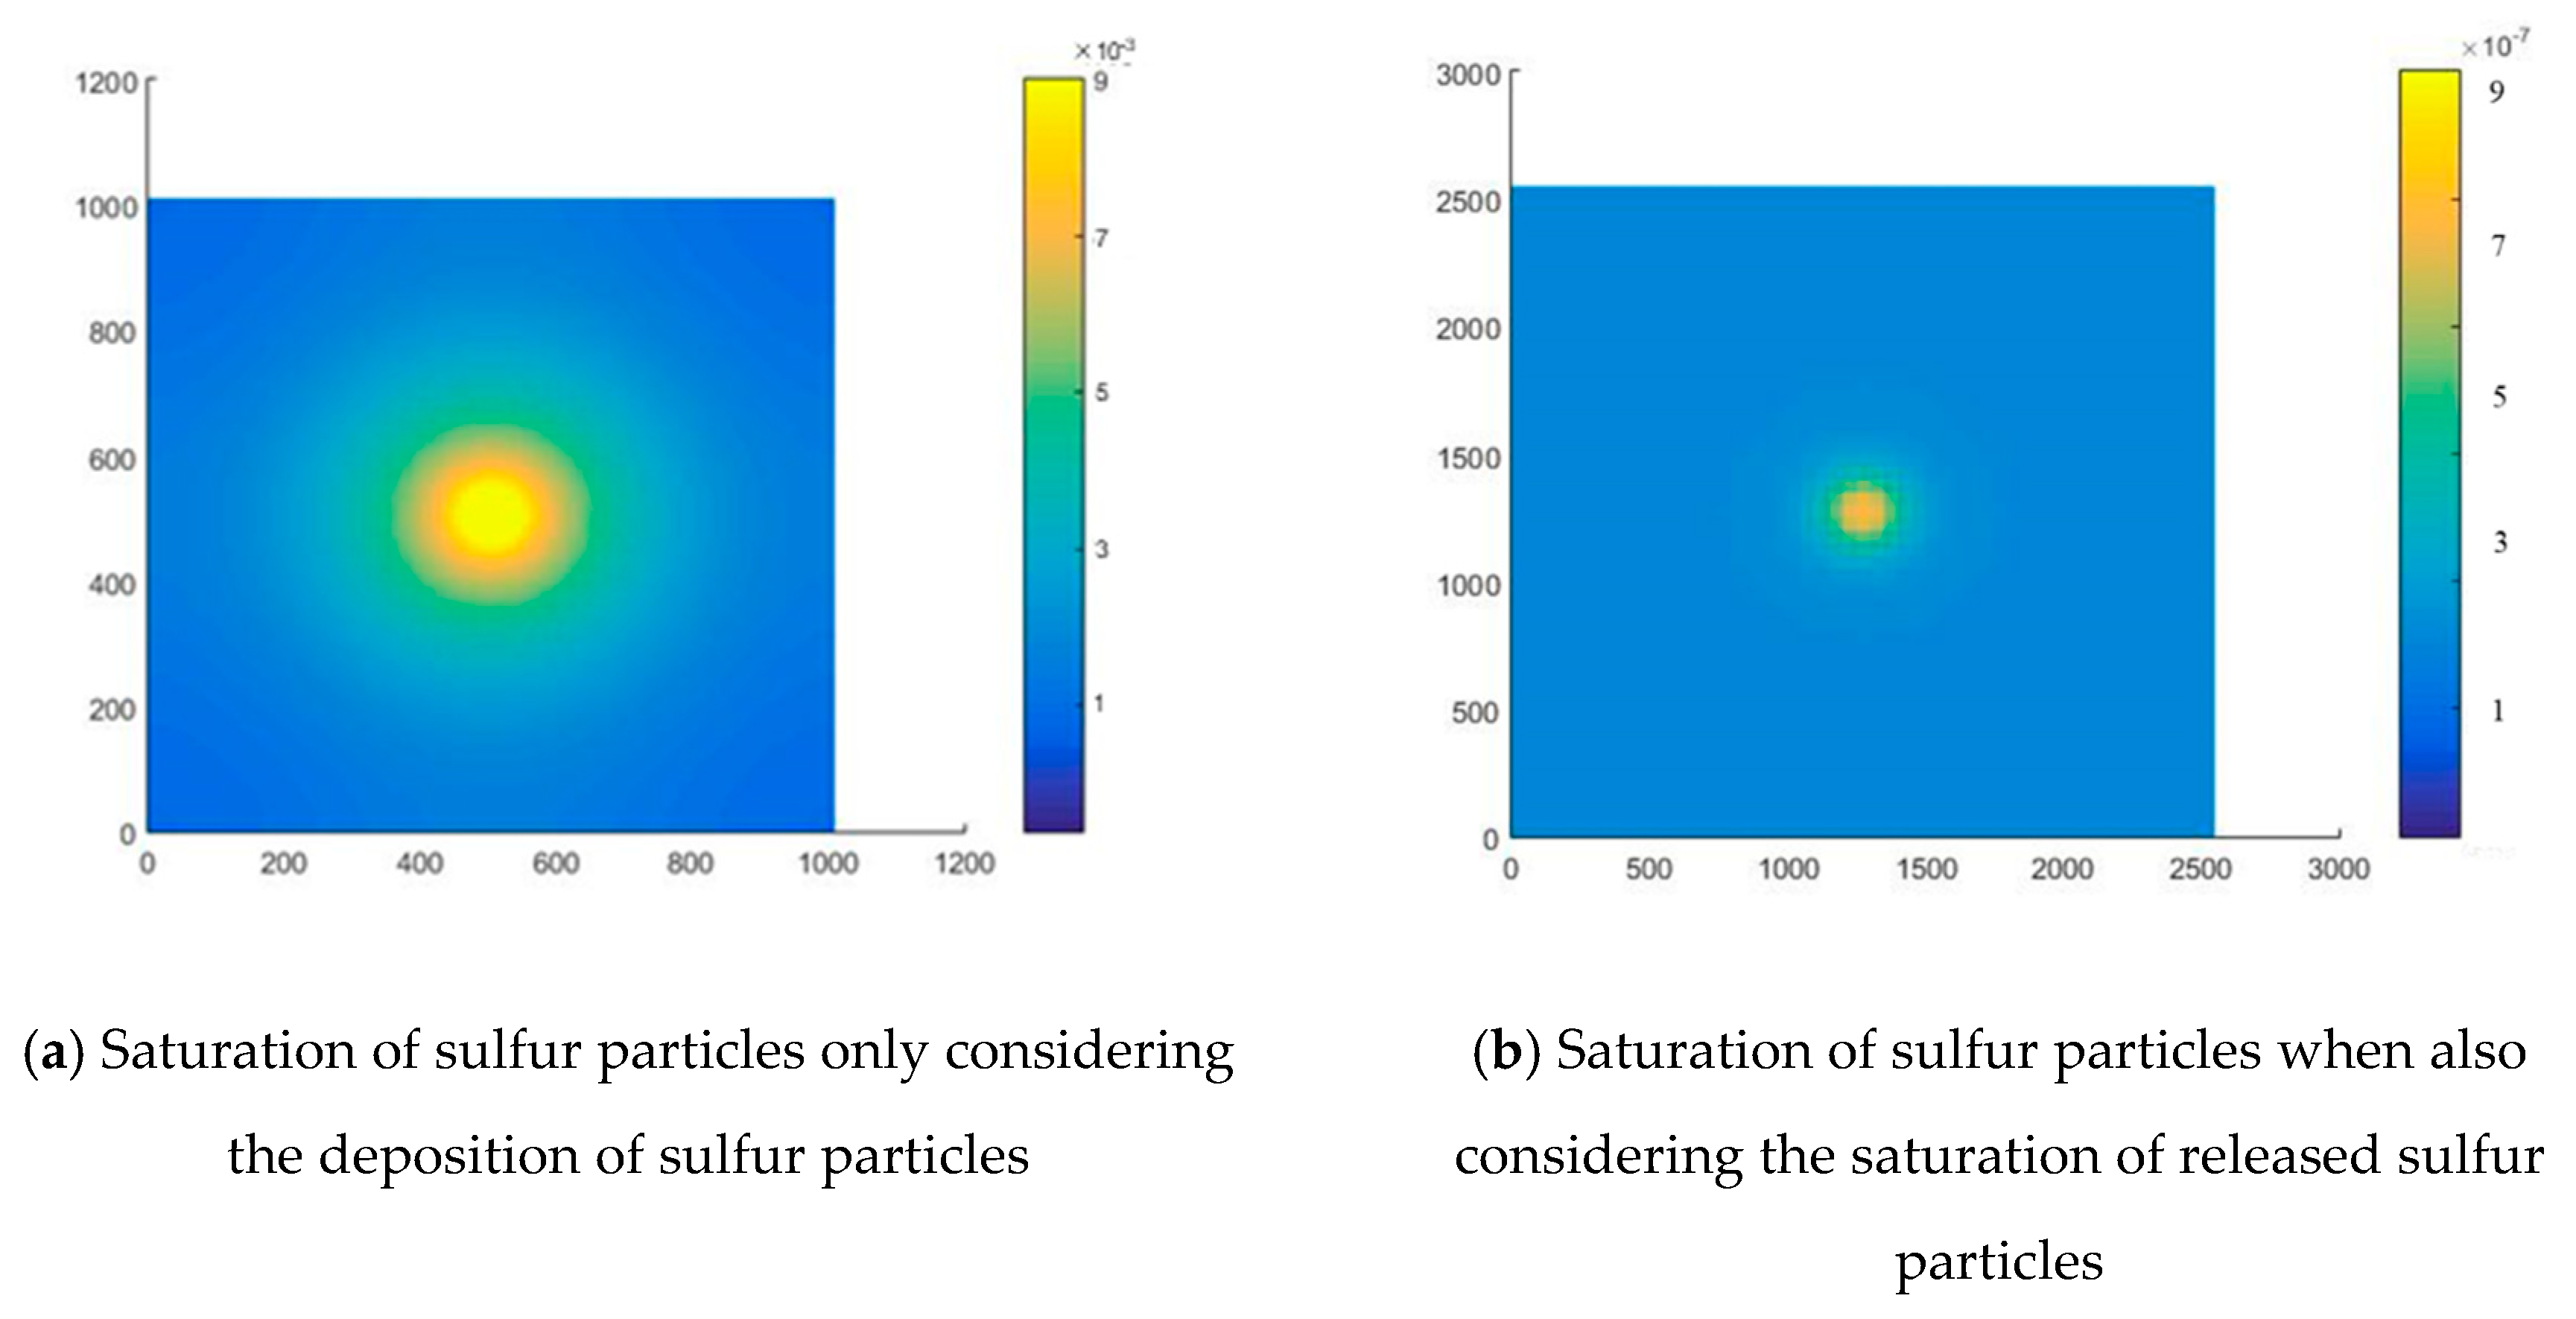
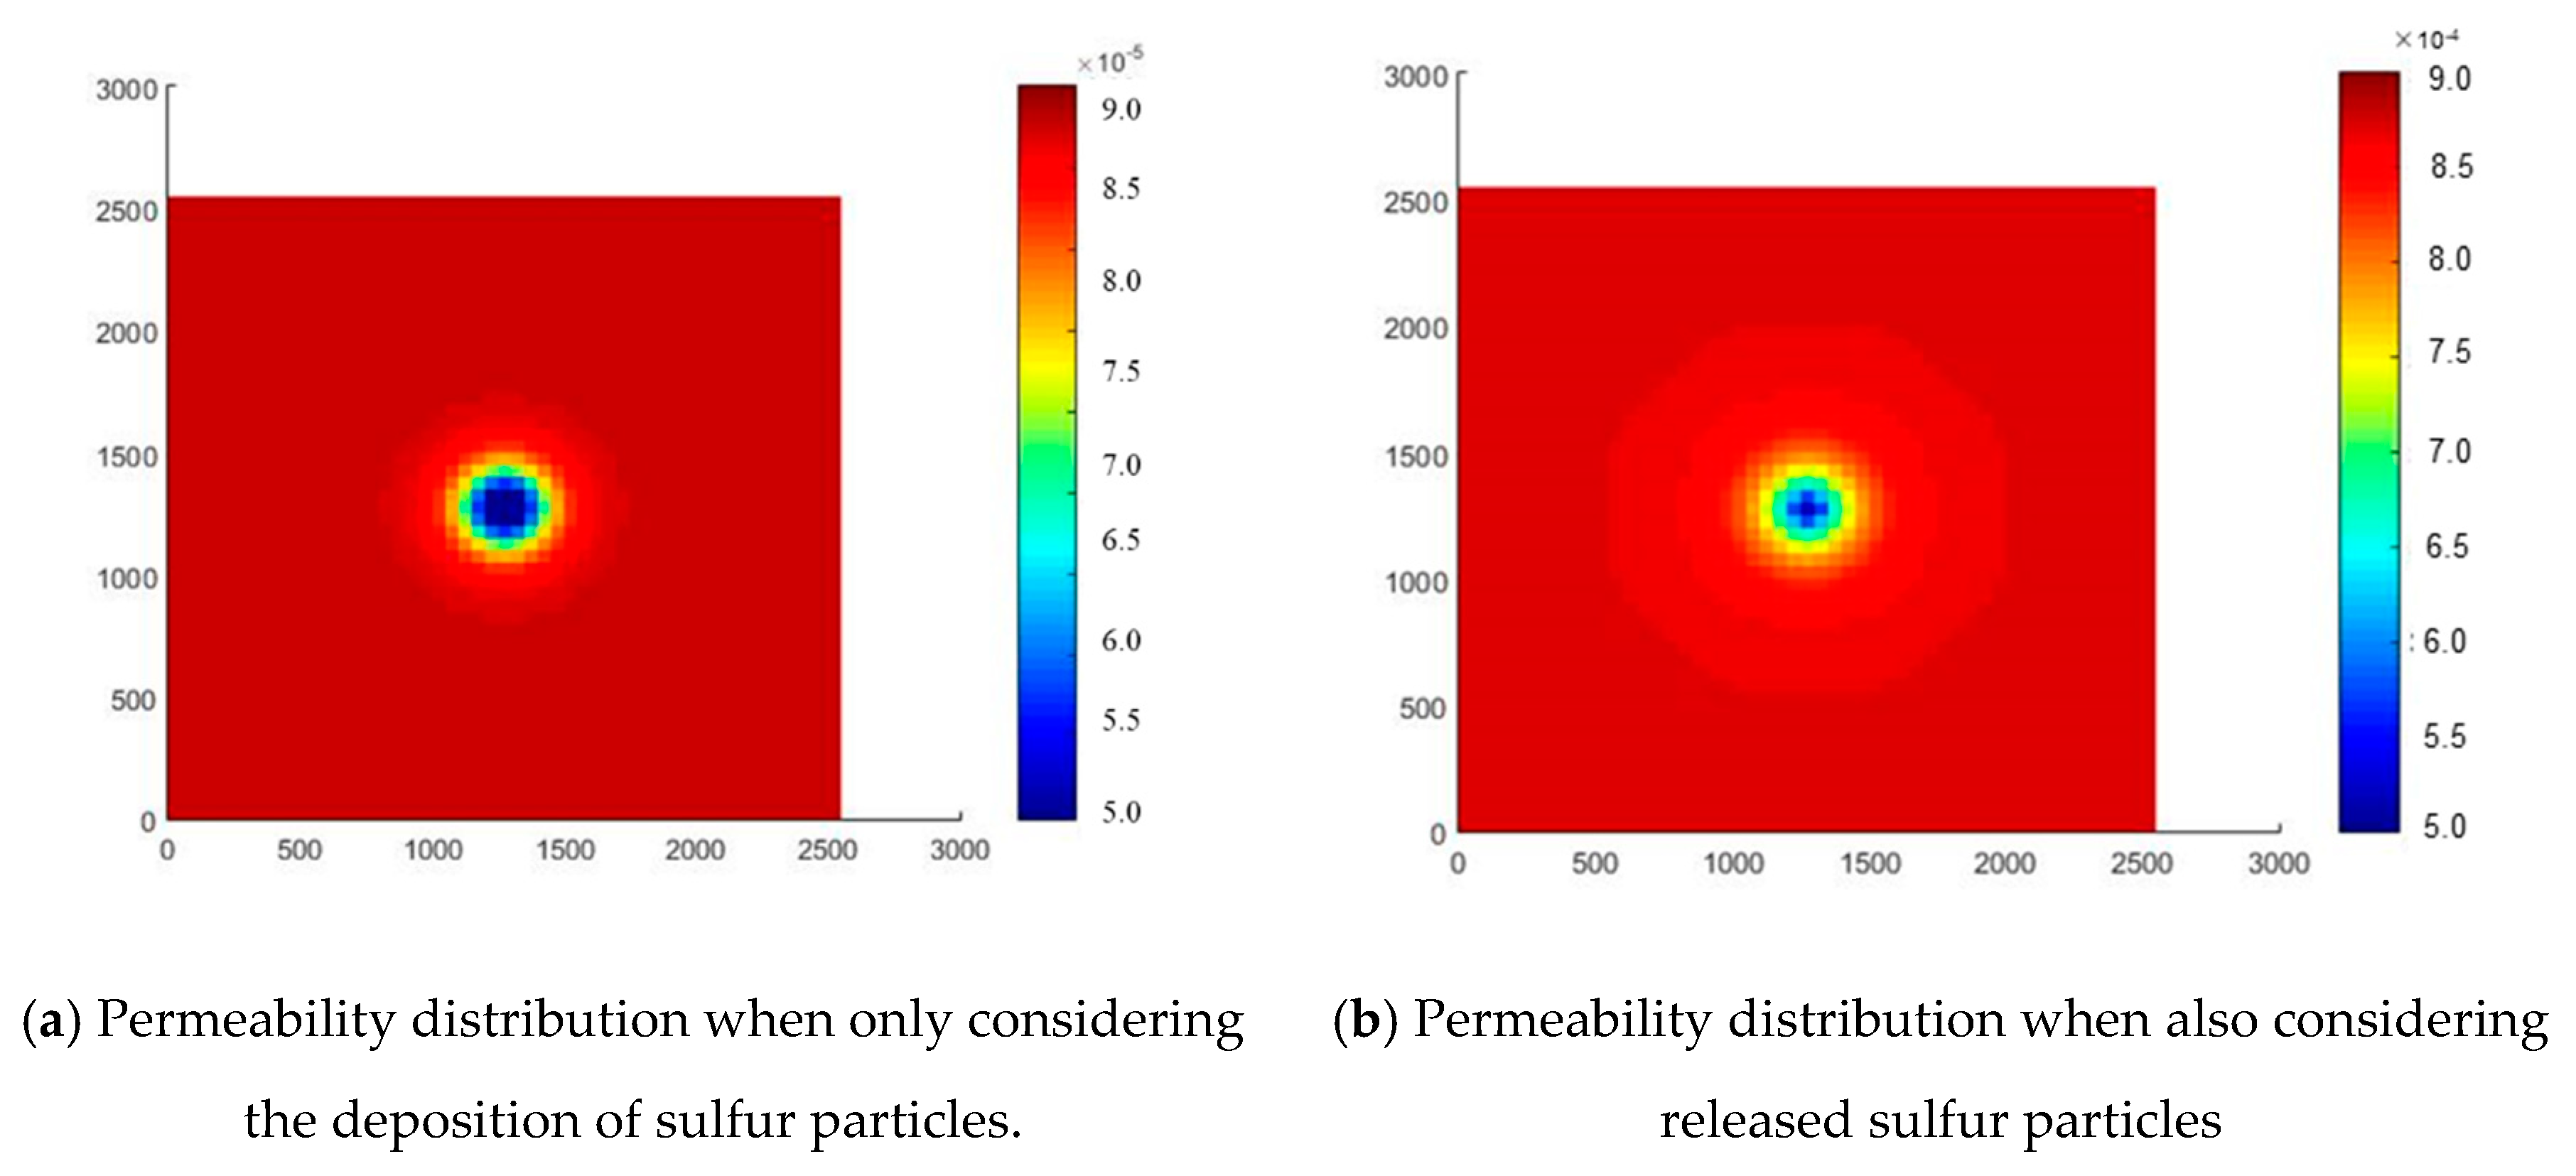
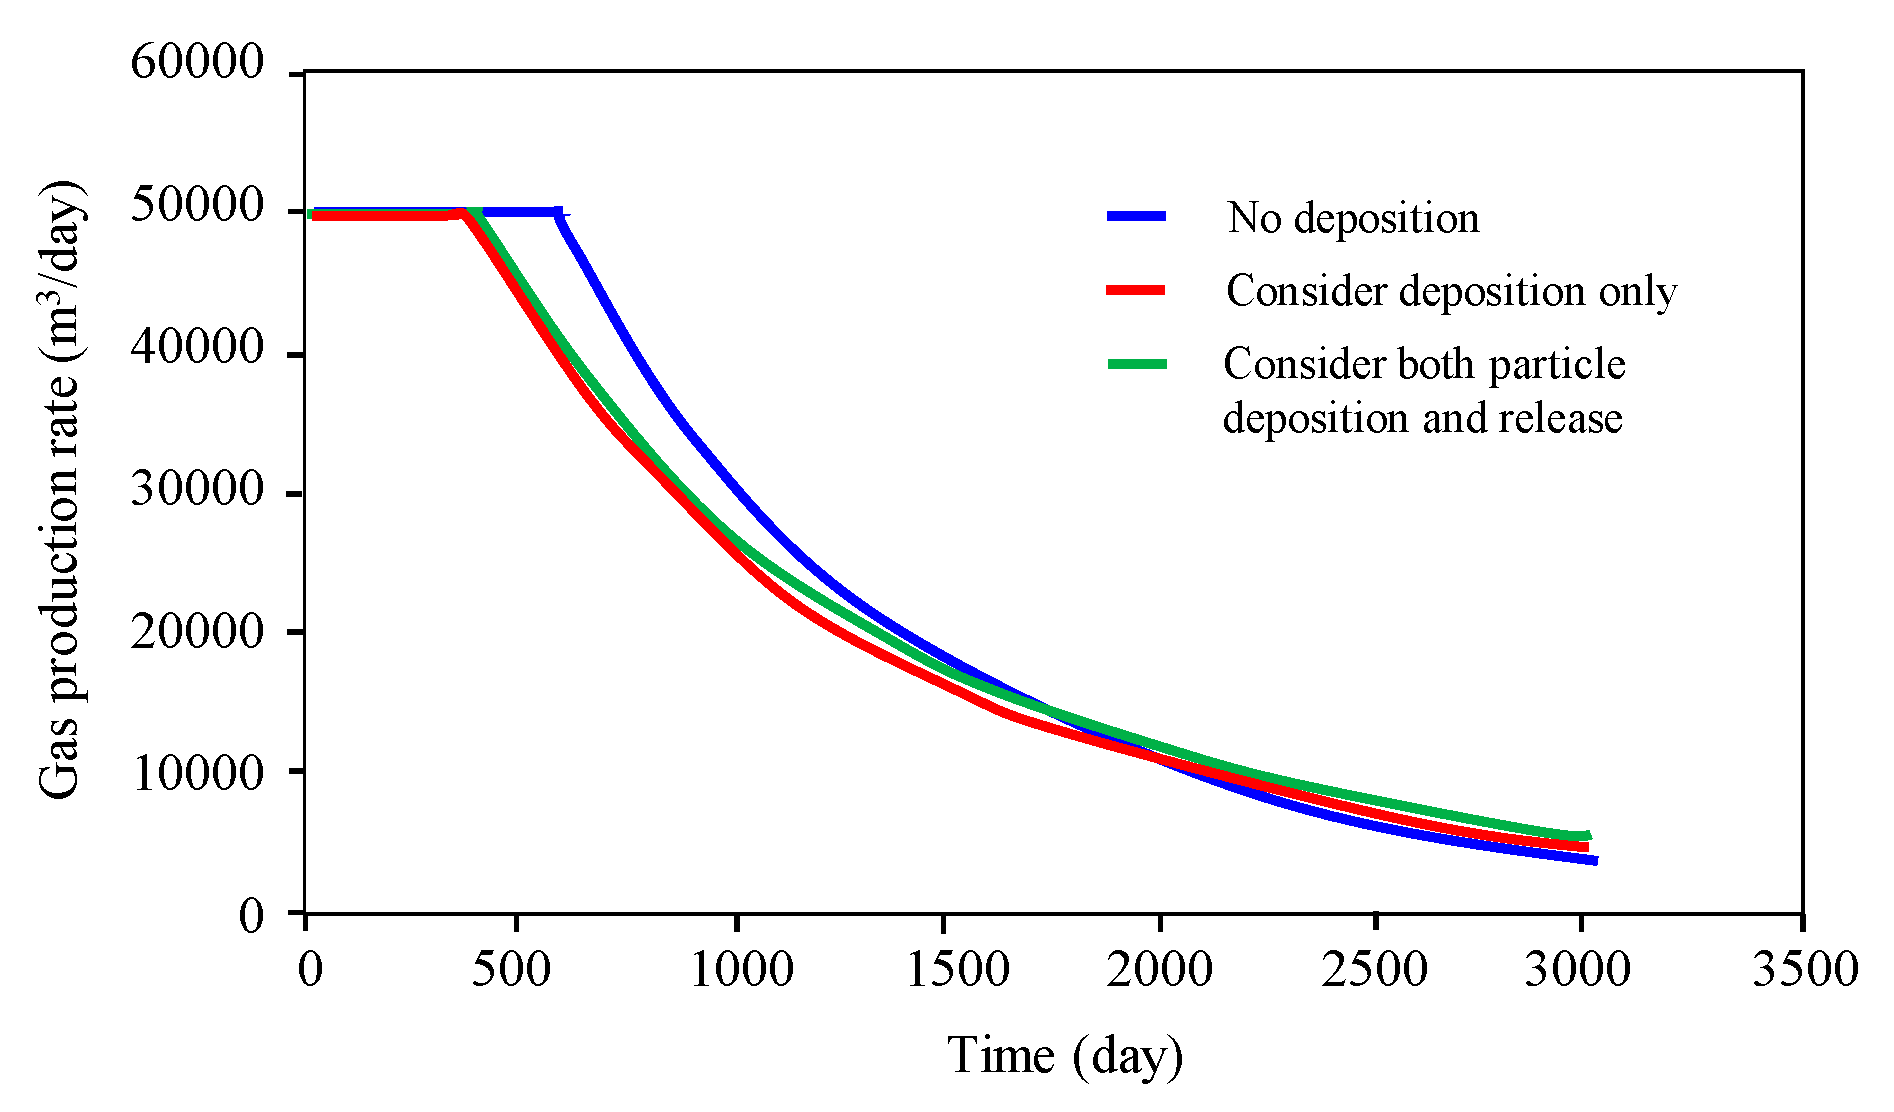
4.2. Influnce of Sulfur Particle Deposition and Release on the Distribution of Sulfur and Gas Well Production

From the distribution diagram of sulfur saturation in Figure 6, if only considering the deposition of sulfur particles, sulfur deposition mainly occurred within the 20 m surrounding the wellbore. When considering both sulfur deposition and particle release, the distribution of sulfur saturation decreased compared to the situation that had not considered the particle release. This decreased saturation indicates that a large amount of deposited sulfur particles are released near the wellbore by the gas flowing through the system. Overall formation damage caused by sulfur deposition is estimated to be less when considering released sulfur particles in the model.
From the permeability distribution diagram (Figure 7a), when only considering the deposition of sulfur particles, the damage of the reservoir was mainly concentrated in an area within 20 m near the wellbore. When considering particle release (Figure 7b), the permeability in the area 20 m near the wellbore was dramatically improved, and the damage to the reservoir is mainly concentrated in the 5 m range near the wellbore. The original damaged area ranging from 5 m to 15 m had been greatly improved, and improvement near the area 5 m near the wellbore was not noticeable. The main reason for this phenomenon is that the suspended sulfur particles and the released sulfur particles were deposited along with gas flow gathering near the wellbore. Although there were a large number of particles released within 5 m of the wellbore, there were also particles gathered and deposited near the 5 m wellbore area at the same time.
Based on Figure 8, sulfur deposition affects production in three aspects: ① the stable production period shortens; ② the decline period increases; and ③ the decline rate increases. Once the release of sulfur particles is considered, the gas production rate slightly increased and the decline period and stable production period are almost the same as when considering deposition only.
Based on Figure 9, accumulative production was about 70 million m3 for this well when the sulfur deposition was not considered, and 66 million m3 after considering the sulfur deposition only. When considering both the sulfur particle deposition and release, the cumulative gas production changed to 67.5 million m3; and only 1.5 million m3 more gas was produced within the 3000 days of production. It is concluded that the sulfur particle release mechanism has little impact on the improvement of gas production and though the release of sulfur particles will slow down the damage to the reservoir for a certain period, the impact area is minimal, only within 5 m around the wellbore. There is almost no impact beyond the nearby wellbore area, as the gas flow from the undamaged area has not changed. The improvement of the gas production rate is also limited.

5. Conclusion

1. In this paper, a sulfur particle release model was proposed. In the model, the viscous force between the particles and the rising force caused by turbulence disturbance were mainly considered. The critical rate of sulfur particle release and the rate of release sulfur particles were calculated using this model.
2. The deposition rate of the sulfur particles with different diameters was simulated using numerical simulation. The results show that the mass velocity of the gas flow has little effect on the deposition velocity of sulfur particles, but that a larger diameter of the sulfur particles results in a faster deposition velocity.
3. The reservoir damage experiment of the sulfur fixation deposits verified the accuracy of the reservoir damage model, and the coefficient of damage parameter of the sulfur fixation deposit in the Da-wan gas reservoir in the Puguang area is 0.806.
4. Through the comparison of numerical simulation experiments, considering the release of sulfur particles affected the distribution of the sulfur particles around the well. Near the well zone, sulfur saturation was relatively low, and at a certain distance from the well center, the highest sulfur saturation gradually reduced with distance when considering sulfur particle release.

Author Contributions

Conceptualization, Z.X., and S.G.; Writing—Original Draft Preparation, Z.X.; Validation, D.Z. and B.S.; Writing—Review & Editing, L.X. All authors have read and agreed to the published version of the manuscript.

Funding

This paper is supported by the National Science and Technology Major Project of China (Grant No. 2016ZX05037003-003), Sinopec’s “Shitiaolong” special project “numerical simulation technology research of high sulfur gas reservoir” (Special topic No. 18062-2), Sinopec’s foundation & perspective project (Grant No. P18086-5) and Science Foundation of China University of Petroleum—Beijing (Grant No. 2462018QZDX13).

Conflicts of Interest

The authors declare no conflict of interest.

Nomenclature

AdepParticle Deposit ratio, dimensionlessqCsVolume of precipitated sulfur particles, m3
ArParticle release ratio, dimensionlessqdepositVolume of deposited sulfur particles, m3
B g gas formation volume factor, m3/m3qreleaseVolume of released sulfur particles, m3
CsSuspended particle concentration, mg/gRSulfur concentration in acid gas, mg/g
divdivergenceRsInitial sulfur concentration in acid gas, mg/g
dParticle diameter, µmpgas phase pressure, MPa
gradgradientP0Initial pressure, MPa
tTime, dayPBHPBottom hole pressure, MPa
gGravitational acceleration, m/s2PVPore volume, m3
ugGas velocity of particle, m/dayqproduction rate of horizontal well at wellhead dominated by a line source production, m3/d
ucCritical velocity of particle, m/dayFaViscous force, N
kpermeability of matrix, mdFbRising force caused by turbulence disturbance, N
krgrelative permeability to gas, dimensionlessFgJoin force of gravity and buoyancy, N
SgSaturation of gas phase, dimensionlessTFormation temperature, °C

Greeks symbols

Φ porosity, m3/m3 μ fluid viscosity, mPa·s
ρ density, kg/m3 differential operator
difference calculationεAdhesion parameters
λRising force coefficient, dimensionless

Subscripts

Csprecipice sulfur ggas
depositdeposited sulfurssulfur
releaseReleased sulfurccritical
yVertical direction

References

  1. Kuo, C.H. On the Production of Hydrogen Sulfide-Sulfur Mixtures from Deep Formations. J. Pet. Technol. 1972, 24, 1–142. [Google Scholar] [CrossRef]
  2. Hyne, J.B. Controlling Sulfur Deposition in Sour Gas Wells. J. World Oil 1983, 197, 35. [Google Scholar]
  3. Hands, N.; Oz, B.; Roberts, B.; Davis, P.; Minchau, M. Advances in the Prediction and Management of Elemental Sulfur Deposition Associated with Sour Gas Production from Fractured Carbonate Reservoirs. In Proceedings of the SPE Annual Technical Conference and Exhibition, San Antonio, TX, USA, 29 September–2 October 2002. [Google Scholar]
  4. Gu, S.; Shi, Z.; Hu, X.; Shi, Y.; Qin, S.; Guo, X. An experimental study on gas-liquid sulfur two-phase flow in ultradeep high-sulfur gas reservoirs. Natrual Gas Ind. 2018, 38, 70–75. [Google Scholar]
  5. Shaohua, G.; Zhiliang, S.; Yunqing, S.; Xiangyang, H.; Fang, C. Numerical simulation for ultra-deep sour gas reservoirs with liquid sulfur condensate. Oil Gas Geol. 2017, 38, 1208–1216. [Google Scholar]
  6. Abou-Kassem, J.H. Experimental and numerical modeling of sulfur plugging in carbonate reservoirs. J. Pet. Sci. Eng. 2000, 26, 91–103. [Google Scholar] [CrossRef]
  7. Al-Awadhy, F.; Kocabas, I.; Abou-Kassem, J.H.; Islam, M.R. Experimental and Numerical Modeling of Sulfur Plugging in Carbonate Oil Reservoirs. Energy Sources 2005, 27, 3–18. [Google Scholar] [CrossRef]
  8. Ali, M.A.; Islam, M.R. The Effect of Asphaltene Precipitation on Carbonate-Rock Permeability: An Experimental and Numerical Approach. SPE Prod. Facil. 1998, 13, 178–183. [Google Scholar] [CrossRef]
  9. Ping, Z. Prediction and Application of Elemental Sulfur Deposition in High Sulfur Gas Reservoir. Master’s Thesis, Southwest Petroleum University, Chengdu, China, 2004. [Google Scholar]
  10. Yong, Z. Numerical Simulation of the Sulfur Particle Migration and Deposition in Gas Reservoirs with High H2S Content. Ph.D. Thesis, Southwest Petroleum University, Chengdu, China, 2006. [Google Scholar]
  11. Sagan, C.; Bagnold, R.A. Fluid transport on Earth and Aeolian transport on Mars. Icarus 1975, 26, 209–218. [Google Scholar] [CrossRef]
  12. Bagnold, R.A. The movement of a cohesionless granular bed by fluid flow over it. Br. J. Appl. Phys. 1951, 2, 29–34. [Google Scholar] [CrossRef]
  13. Iversen, J.D.; White, B.R. Saltation threshold on Earth, Mars and Venus. Sedimentology 1982, 29, 111–119. [Google Scholar] [CrossRef]
  14. White, B.R. Two-phase measurement of saltating turbulent boundary layer flow. Int. J. Multiph. Flow 1982, 5, 459–473. [Google Scholar] [CrossRef]
  15. Fletcher, B. The incipient motion of granular materials. J. Phys. D Appl. Phys. 1976, 9, 2471. [Google Scholar] [CrossRef]
  16. Gruesbeck, C.; Collins, R.E. Entrainment and Deposition of Fine Particles in Porous Media. Soc. Pet. Eng. J. 1982, 22, 847–856. [Google Scholar] [CrossRef]
  17. Cleaver, J.W.; Yates, B. Mechanism of detachment of colloidal particles from a flat substrate in a turbulent flow. J. Colloid Interface Sci. 1973, 44, 464–474. [Google Scholar] [CrossRef]
  18. Phillips, M. A force balance model for particle entrainment into a fluid stream. J. Phys. D Appl. Phys. 1980, 13, 221–233. [Google Scholar] [CrossRef]
  19. Guoren, D. Incipient Motion of coarse and Fine sediment. In Proceedings of the 2001 Annual Meeting of China Water Conservancy Society, Nanjing, China, 30 June 2001. [Google Scholar]
  20. Wang, Z.; Bai, Y.; Zhang, H.; Liu, Y. Investigation on gelation nucleation kinetics of waxy crude oil emulsions by their thermal behavior. J. Pet. Sci. Eng. 2019, 18, 106–230. [Google Scholar] [CrossRef]
  21. Wang, Z.; Lin, X.; Yu, T.; Zhou, N.; Zhong, H.; Zhu, J. Formation and rupture mechanisms of visco-elastic interfacial films in polymer-stabilized emulsions. J. Dispers. Sci. Technol. 2019, 40, 612–626. [Google Scholar] [CrossRef]
  22. Zhong, H.; Yang, T.; Yin, H.; Lu, J.; Zhang, K.; Fu, C. Role of alkali type in chemical loss and ASP-flooding enhanced oil recovery in sandstone formations. SPE Reserv. Eval. Eng. 2019. [Google Scholar] [CrossRef]
  23. Zhang, G. Study on Features of Phase Behaviors and Seepage Mechanism in High Sour Gas Reservoir—Take Samples from Changxing Gas Reservoir in Yuanba as Study Objects. Ph.D. Thesis, Chengdu University of Technology, Chengdu, China, 2014. [Google Scholar]
Figure 1. Sulfur solubility curve.
Energies 13 01522 g001
Figure 2. Sulfur release due to turbulence in a gas system.
Energies 13 01522 g002
Figure 3. Deposition rate of sulfur particles with different diameters at different gas mass flow rates.
Energies 13 01522 g003
Figure 4. Sulfur saturation compared to dimensionless permeability used to calculate the reservoir damage.
Energies 13 01522 g004
Figure 5. Comparison of the calculated data and observed well data.
Energies 13 01522 g005
Figure 6. Comparison of deposited sulfur saturation across the simulated reservoir.
Energies 13 01522 g006
Figure 7. Comparison of permeability across the simulated reservoir.
Energies 13 01522 g007
Figure 8. Gas production rate.
Energies 13 01522 g008
Figure 9. Accumulated gas production.
Energies 13 01522 g009
Table 1. Basic parameters in numerical simulation.
ParameterValueParameterValue
Rs0.9 g/m3P038 MPa
k1 mDPw25 MPa
φ0.2uc0.03 m/s
ρg0.92 Kg/sm3qg5.0 × 105 m3/day
ρs2200 Kg/m3T100 °C

