Article

Simulation of the Fast Pyrolysis of Coffee Ground in a Tilted-Slide Reactor

1
Department of Clean Fuel & Power Generation, Korea Institute of Machinery & Materials, 156 Gajeongbuk-ro, Yuseong-gu, Daejeon 34103, Korea
2
Environment & Energy Mechanical Engineering, University of Science and Technology, 217 Gajeong-ro, Yuseong-gu, Daejeon 34113, Korea
*
Author to whom correspondence should be addressed.
Energies 2020, 13(24), 6605; https://doi.org/10.3390/en13246605
Submission received: 12 November 2020 / Revised: 9 December 2020 / Accepted: 10 December 2020 / Published: 14 December 2020
(This article belongs to the Collection Renewable Energy and Energy Storage Systems)

Abstract

:
The fast pyrolysis of coffee ground for bio-crude oil production was simulated in a tilted-slide reactor. The biochemical composition was derived by an extended biomass characterization method based on the elemental analysis. The simulation was performed in a steady-state and a Lagrangian multiphase model was adopted to describe the transport of sand and biomass particles together with a multistep kinetic mechanism for fast pyrolysis. When the secondary tar cracking reactions were not considered the volatile yield increased monotonically with temperature. The inclusion of secondary reactions could improve the prediction of volatile yield which turn to decrease at higher temperature. It was found that not only the maximum volatile yield but also the corresponding reactor temperature agreed well with the experimental results. At the temperature higher than 550 °C the trend of volatile yield is similar to that of experiment while it is larger at lower reactor temperature. The individual species yields were compared at various reactor temperatures and the pyrolysis processes were analyzed by tracking the reference components when they were decomposed along the distance. It was found that the reactor temperature should be above 500 °C for effective pyrolysis of all reference components of coffee ground.

1. Introduction

Utilizing biomass as a renewable energy source has been widely studied to cope with the global warming issue and the depletion of fossil fuels. Although direct combustion of biomass in a solid form is the simplest application method as an energy source, converting biomass into a liquid fuel has advantages in storage and transportation due to the increase of energy density. Fast pyrolysis is a thermochemical process to convert biomass into liquid fuel [1,2,3,4] and this liquid product is commonly named as bio-oil or bio-crude oil. In the fast pyrolysis process, biomass is quickly decomposed into gas and solid phase in oxygen-free environment and the bio-crude oil can be obtained by quenching the gas-phase product. The optimum condition for the maximum bio-crude oil yield is known to be around 500 °C. There have been developed various pyrolysis reactors [5,6,7,8,9] and fluidized bed reactors have been widely adopted ranging from lab scale to commercial scale. For the efficient design, scale-up and optimization of the pyrolysis reactor, it is important to understand the fast pyrolysis process in detail. There have been numerical studies on the fast pyrolysis in bubbling fluidized bed reactors [10,11,12,13,14,15,16], entrained flow reactors [17,18,19] and spouted bed reactors [20,21,22]. The pyrolysis kinetics also have been developed extensively including the biomass characterization method [23,24,25,26,27].
Recently, a tilted-slide reactor has been developed for efficient process of fast pyrolysis [9,28,29]. In this reactor, hot sand descends from the top of the tilted reactor where the biomass is supplied separately. The biomass is transported downward together with the sand by the gravity force and is pyrolyzed during this decent. Because no fluidization gas is required in this reactor, the plant size and operation cost can be reduced in comparison with fluidized bed reactors. Various kinds of biomass feedstock have been tested in the tilted-slide reactor including sawdust, coffee ground and palm kernel shell [9,28,29,30].
The numerical study of a tilted-slide reactor has been also performed for the fast pyrolysis of sawdust biomass in a previous study [31]. The biomass composition has been characterized to specify the ratio of cellulose, hemicellulose and lignin as reference components based on the elemental composition and a multistep kinetic mechanism developed by Ranzi et al. [23,24,25,26,27] has been adopted for the pyrolysis simulation. The particle behaviors of sand and sawdust have been tracked and the chemical process of sawdust pyrolysis has been analyzed in detail. It was observed that the bio-crude oil yield increased monotonically with temperature which was different from the experimental results due to the absence of the secondary tar cracking reactions in the simulation. It is known that the secondary gas-phase reactions for tar cracking becomes important at high temperatures [24,25,32] and the noncondensable gases are increased from the volatile decomposition. Their effects have been accounted for in an indirect way with 1-D simulation using the reactor outlet composition due to the complexity of the gas-phase kinetics which could be hardly applied in the 3-D reactor simulation directly.
In this study, the fast pyrolysis of coffee ground in a tilted-slide reactor was investigated by numerical simulation. There is a growing attention to utilizing coffee ground as a new biomass resource due to its increase of consumption worldwide [33]. The experimental study on the fast pyrolysis of coffee ground in a tilted-slide reactor has shown that the maximum oil yield was 59% at the temperature of 550 °C with the feeding rate of 17.7 kg/h [29]. The prediction of product yields was focused on in this study at various reactor temperatures. As a first step for the simulation, the biochemical composition of coffee ground was specified by adopting an extended biomass characterization method [26] to include the extractives which was not negligible in coffee ground differing from sawdust biomass. To improve the prediction of the bio-crude oil yield at various reaction temperature without much computational cost, the detailed secondary gas-phase reactions were simplified and then were imposed in the 3-D reactor simulation directly. The product yields were compared with the experimental results at various reactor temperatures and the species distribution and the behaviors of pyrolyzing particles were also analyzed in detail.

2. Numerical Simulation

2.1. Characterization of the Coffee Ground Composition

For modeling the thermal degradation of biomass particle, it is important to determine the biomass composition because biomass consists of various species which show different pyrolyzing pathways. The major components which constitute biomass are generally cellulose, hemicellulose and lignin. Extractive species, protein and ash can be other minor components. But detailed information of biochemical composition which can provide the relative amount of these components is not commonly available because there still remain difficulties and uncertainties in current measurement techniques. To overcome this problem, an alternative approach has been suggested by Ranzi et al. [23] to derive the biomass composition in an indirect way based on the C/H/O atomic balance of biomass. In the previous study on the sawdust pyrolysis in a tilted-slide reactor [31], five reference components have been adopted to represent cellulose, hemicellulose and three different types of lignins. 
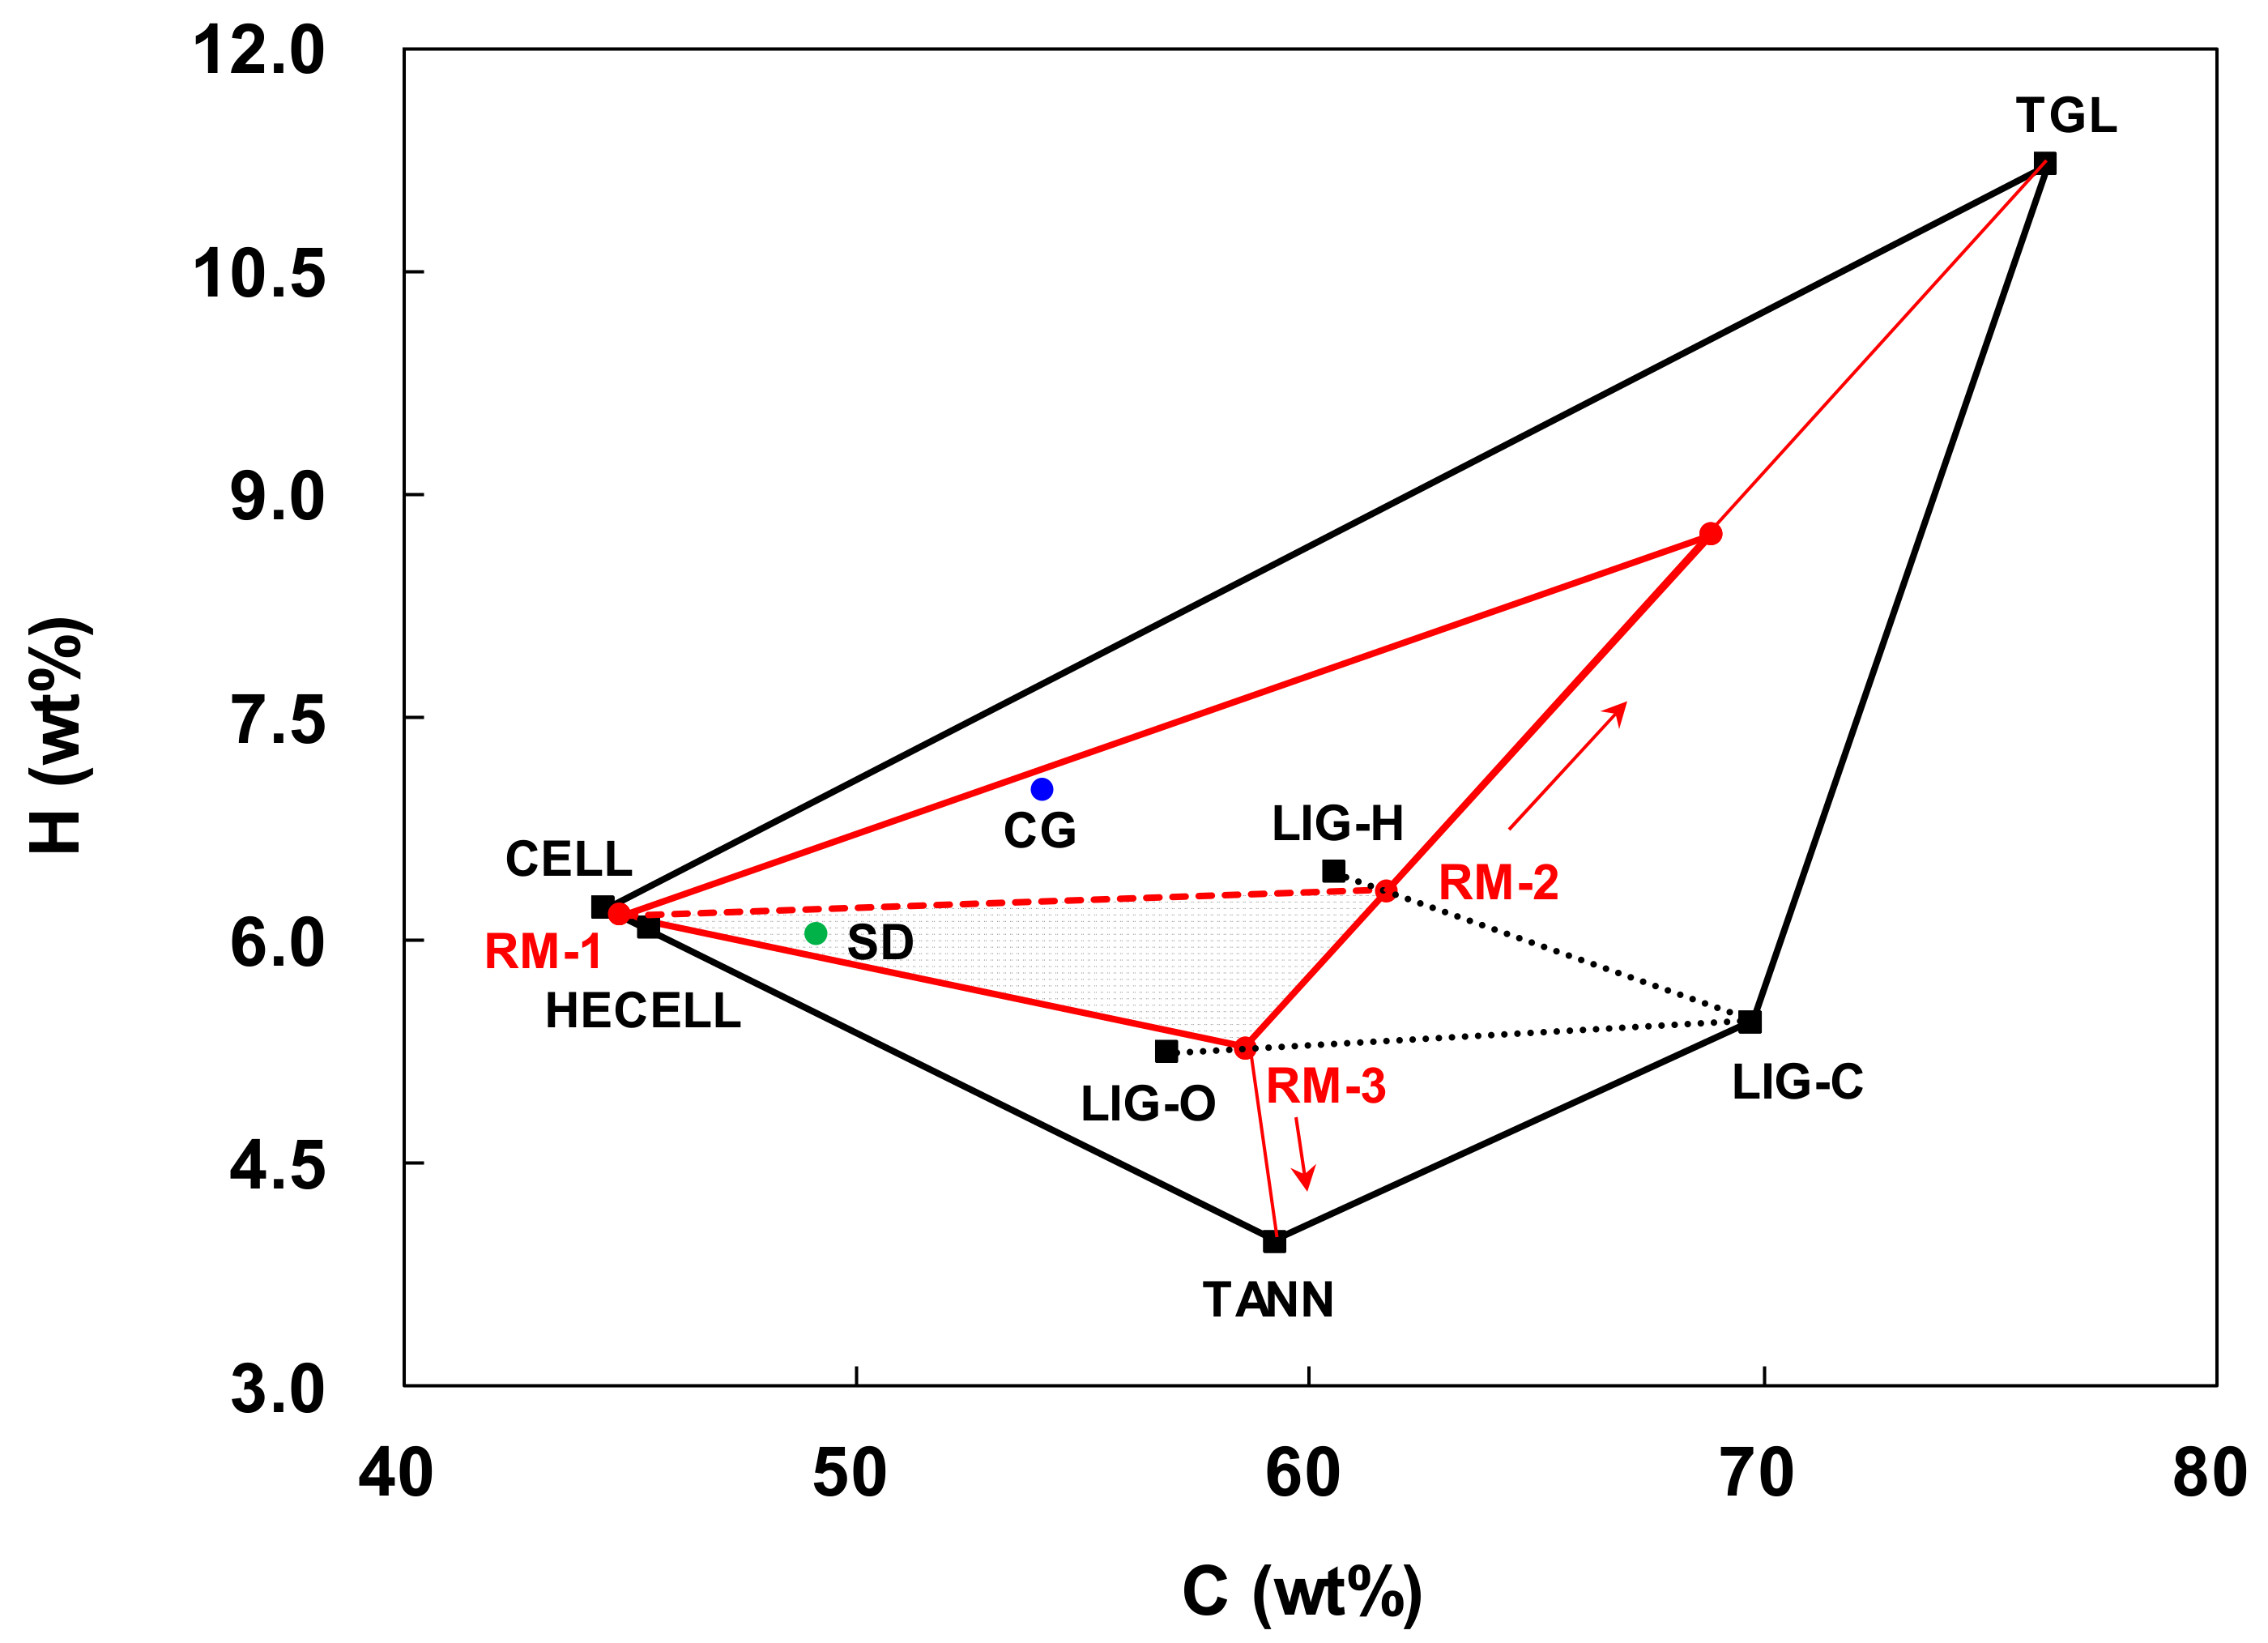
Figure 1 shows these reference species in the H/C diagram. The reference components CELL represent the cellulose monomer (C6H10O5). The hemicellulose is represented as a reference component HECELL which is approximated to be a xylose monomer (C5H8O4). Because lignin has a complex chemical structure, three reference components of LIG-C (C15H14O4), LIG-H (C22H28O9) and LIG-O (C20H22O10) were adopted which are richer in C, H and O, respectively. The three reference mixtures, RM-1, RM-2 and RM-3 are specified to reduce the degree of freedom in the biomass characterization. These reference mixtures are defined by the splitting parameters, α, β and γ. The mixture RM-1 is composed of 60% CELL and 40% HECELL in molar ratio where α is defined to be 0.6. RM-2 and RM-3 are composed of 80% LIG-H and 20% LIG-C (β = 0.8) and 80% LIG-O and 20% LIG-C (γ = 0.8), respectively. These reference mixtures RM-1, RM-2 and RM-3 form the vertices of the dark-shadowed triangle of Figure 1. When the elemental composition of biomass is placed inside this triangle, its biochemical composition can be derived from a linear combination of RM-1, RM-2 and RM-3. The sawdust biomass in the previous study falls within the triangle as represented to be ‘SD’ in Figure 1 and the five reference components are sufficient for biomass characterization.
The coffee grounds have been collected from coffee shops in Seoul, South Korea. The moisture content of collected coffee ground was higher than 50 wt% and it should be dried prior to fast pyrolysis. The coffee ground was dried in a rotary dryer to lower its moisture content down to less than 10 wt%. We note that the drying process only evaporates the water in coffee ground without changing its chemical structure and the drying pretreatment could only affect the water content in bio-crude oil. Table 1 shows the result of proximate analysis for coffee ground. The proximate analysis was performed using a thermogravimetric analyzer (LECO TGA 701). Because the moisture and ash contents are not negligible in coffee ground, their effects were included in the simulation which will be discussed later in detail. Table 2 shows the elemental composition of coffee ground. The elemental composition was measured by an elemental analyzer (Flash EA 1112 series). For the biomass characterization, the C/H/O ratios were normalized to make their sum to be 100% in dry and ash-free basis. The elemental composition of coffee ground indicated by ‘CG’ in Figure 1 falls outside the dark-shadowed triangle formed by RM-1, RM-2 and RM-3. It can be known that coffee ground has larger C and H contents in comparison with sawdust and it cannot be represented by the five reference species (CELL, HECELL, LIG-C, LIG-H and LIG-O). It is known that several kinds of softwoods, grass plants and seeds are relatively rich in extractive species and the area of biomass characterization needs to be extended by introducing new reference components [26]. Because there is a great variety of the extractive species, a couple of lumped species were introduced for simplification depending on their water solubility, that is, hydrophobic and hydrophilic extractives. For hydrophobic extractives, triglycerides which have large amount of linoleic acid are most common. Based on this, a reference component named TGL (C57H100O7) with large C and H content was selected [26] as marked in Figure 1. For hydrophilic species, phenolic compounds are typical which can be represented by tannin species. The component named TANN (C15H12O7) with a small H amount was selected [26] as indicated in Figure 1.
The biomass characterization can be extended significantly by introducing new species of TGL and TANN. The inclusion of TGL in RM-2 can cover the biomass richer in hydrogen, while the biomass with lower hydrogen content can be characterized by the inclusion of TANN in RM-3. The new splitting parameter δ defines the molar ratio of lignins (LIG-H and LIG-C) in RM-2, which also means that the molar ratio of TGL in RM-2 is 1- δ. Another splitting parameter ε defines the molar ratio of lignins (LIG-O and LIG-C) in RM-3 which means that the molar ratio of TANN in RM-3 is 1- ε. Because coffee ground is richer in carbon and hydrogen, it is enough to migrate the vertex RM-2 in the direction of TGL, while the location of RM-3 need not to be modified. The splitting parameters α/β/γ/δ/ε = 0.6/0.8/0.8/0.7/1 can successfully extend the characterization region to light-shadowed area to cover coffee ground as shown in Figure 1. The biochemical composition is then derived as shown in Table 3 by adding moisture and ash which were determined from the proximate analysis.

2.2. Simulation Method

The fast pyrolysis of coffee ground had been performed in a tilted-slide reactor [
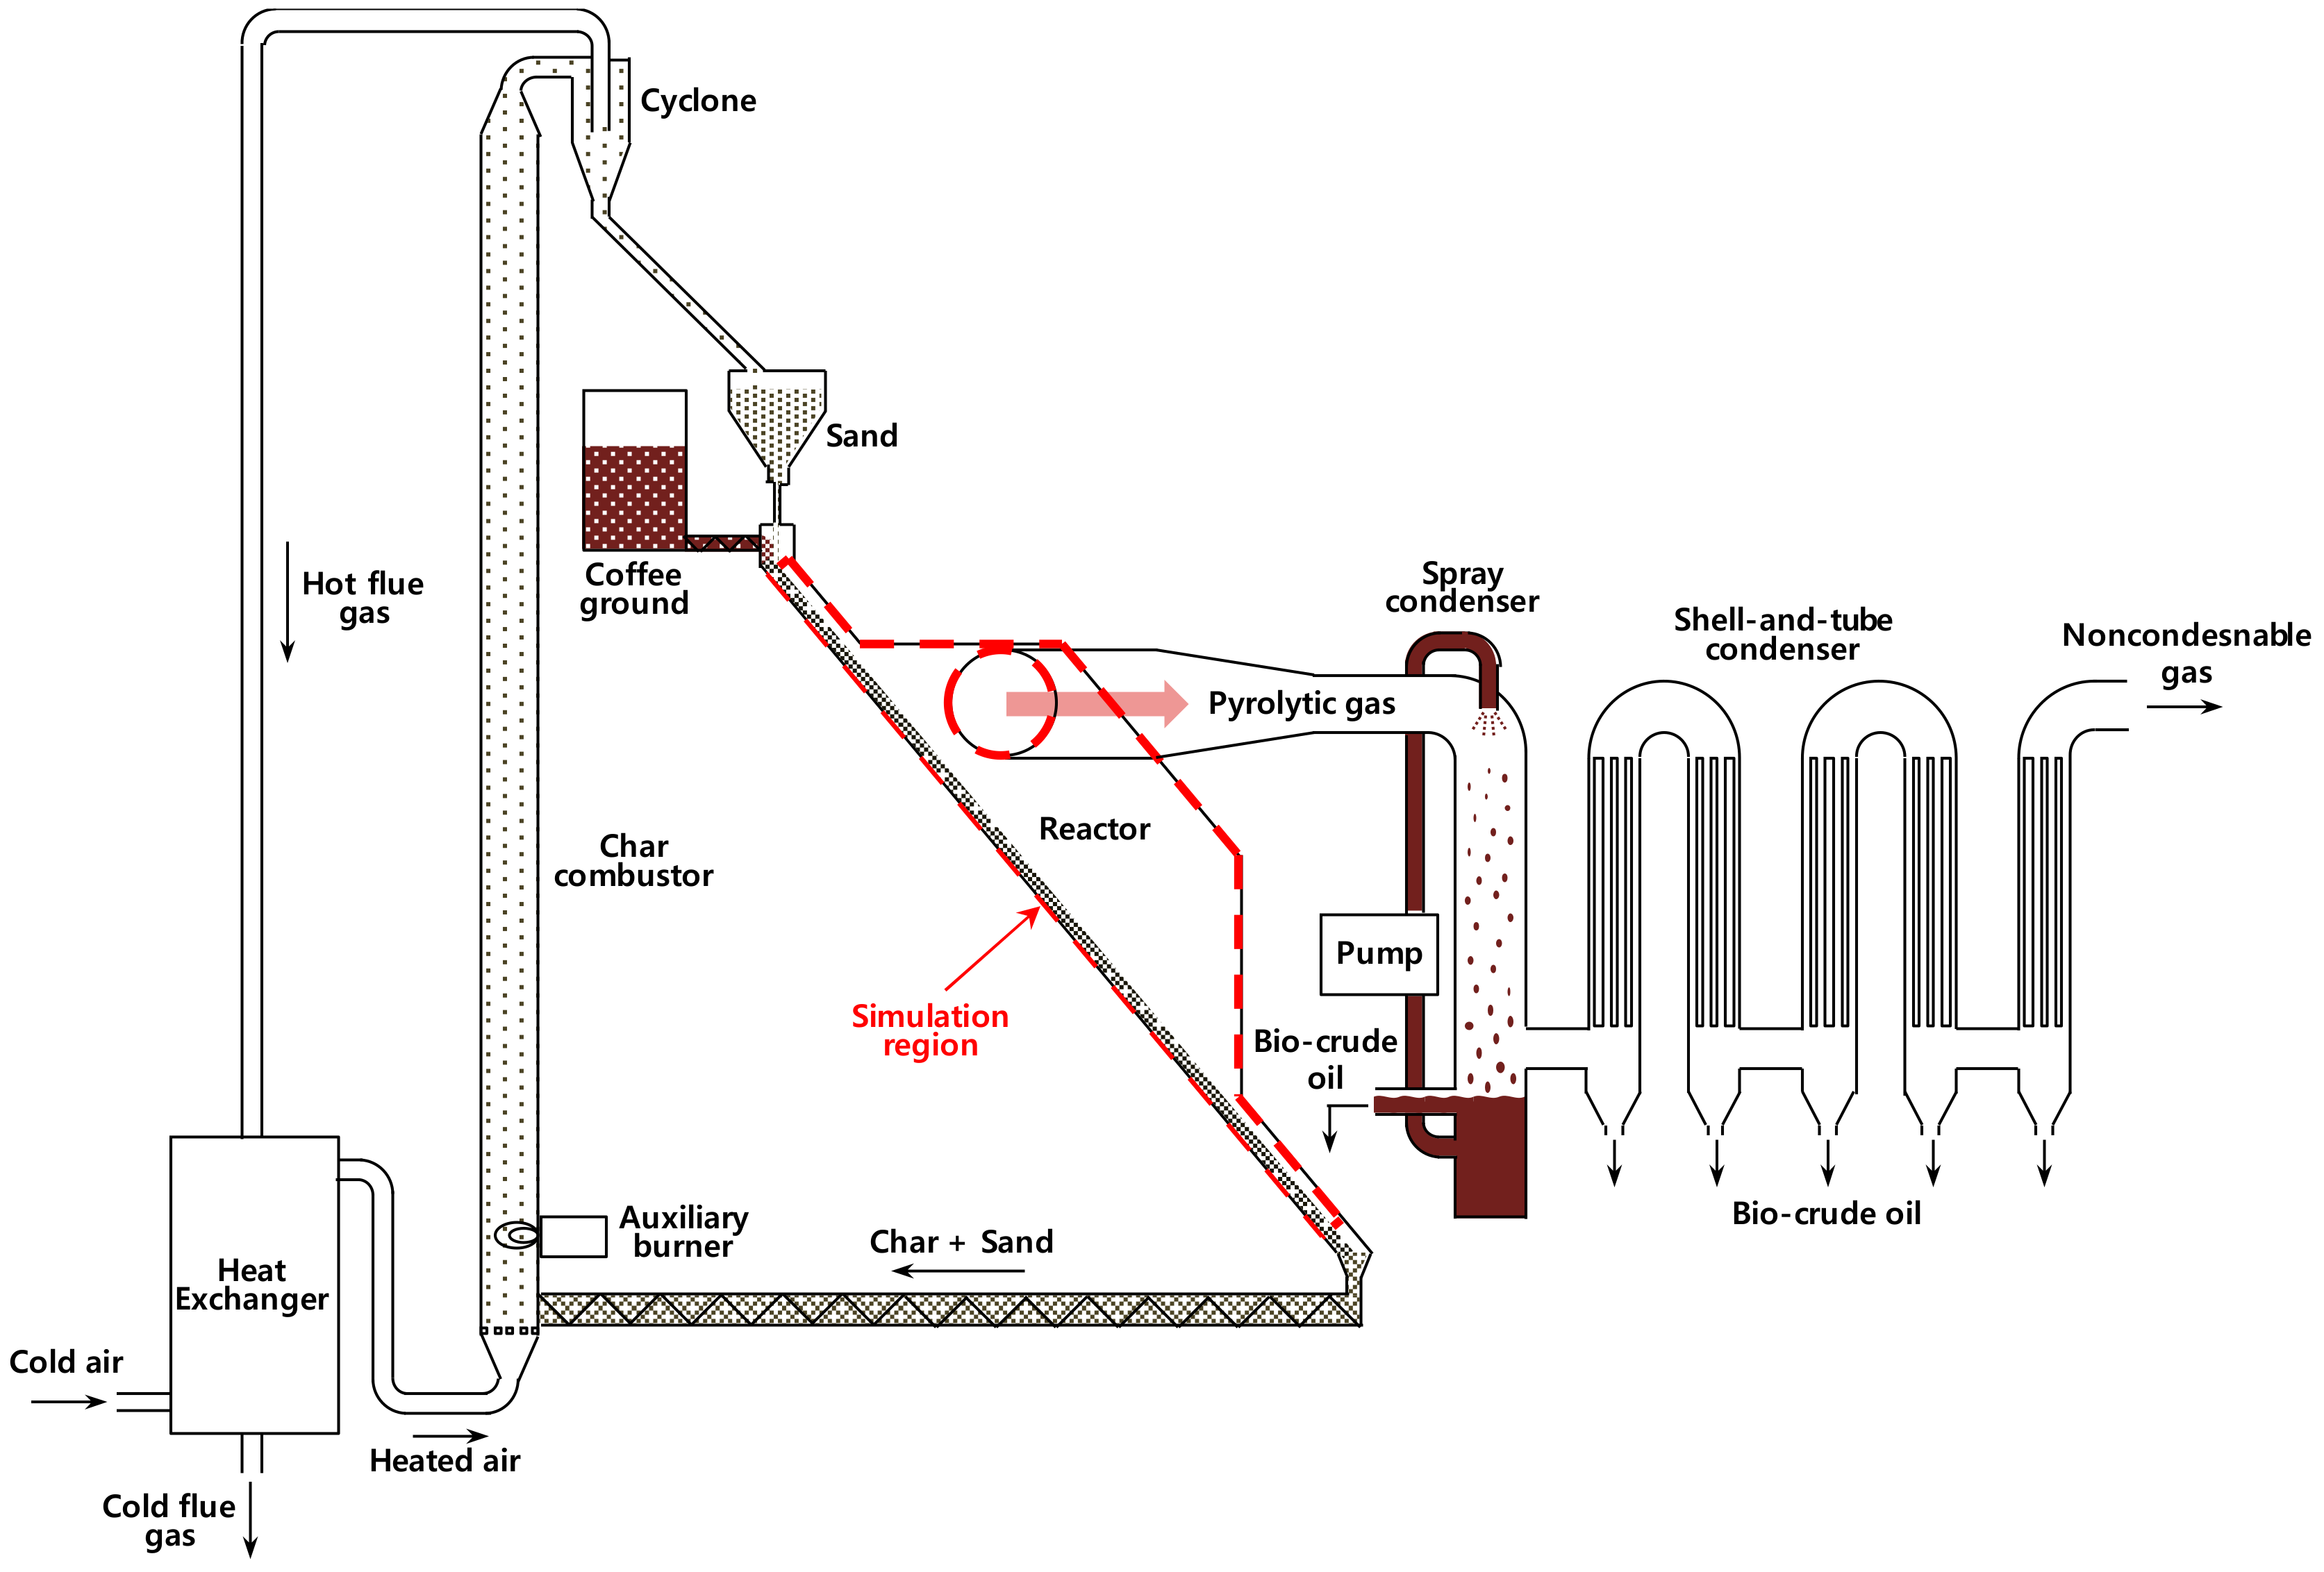
29]. The schematic diagram of the reactor system is shown in 
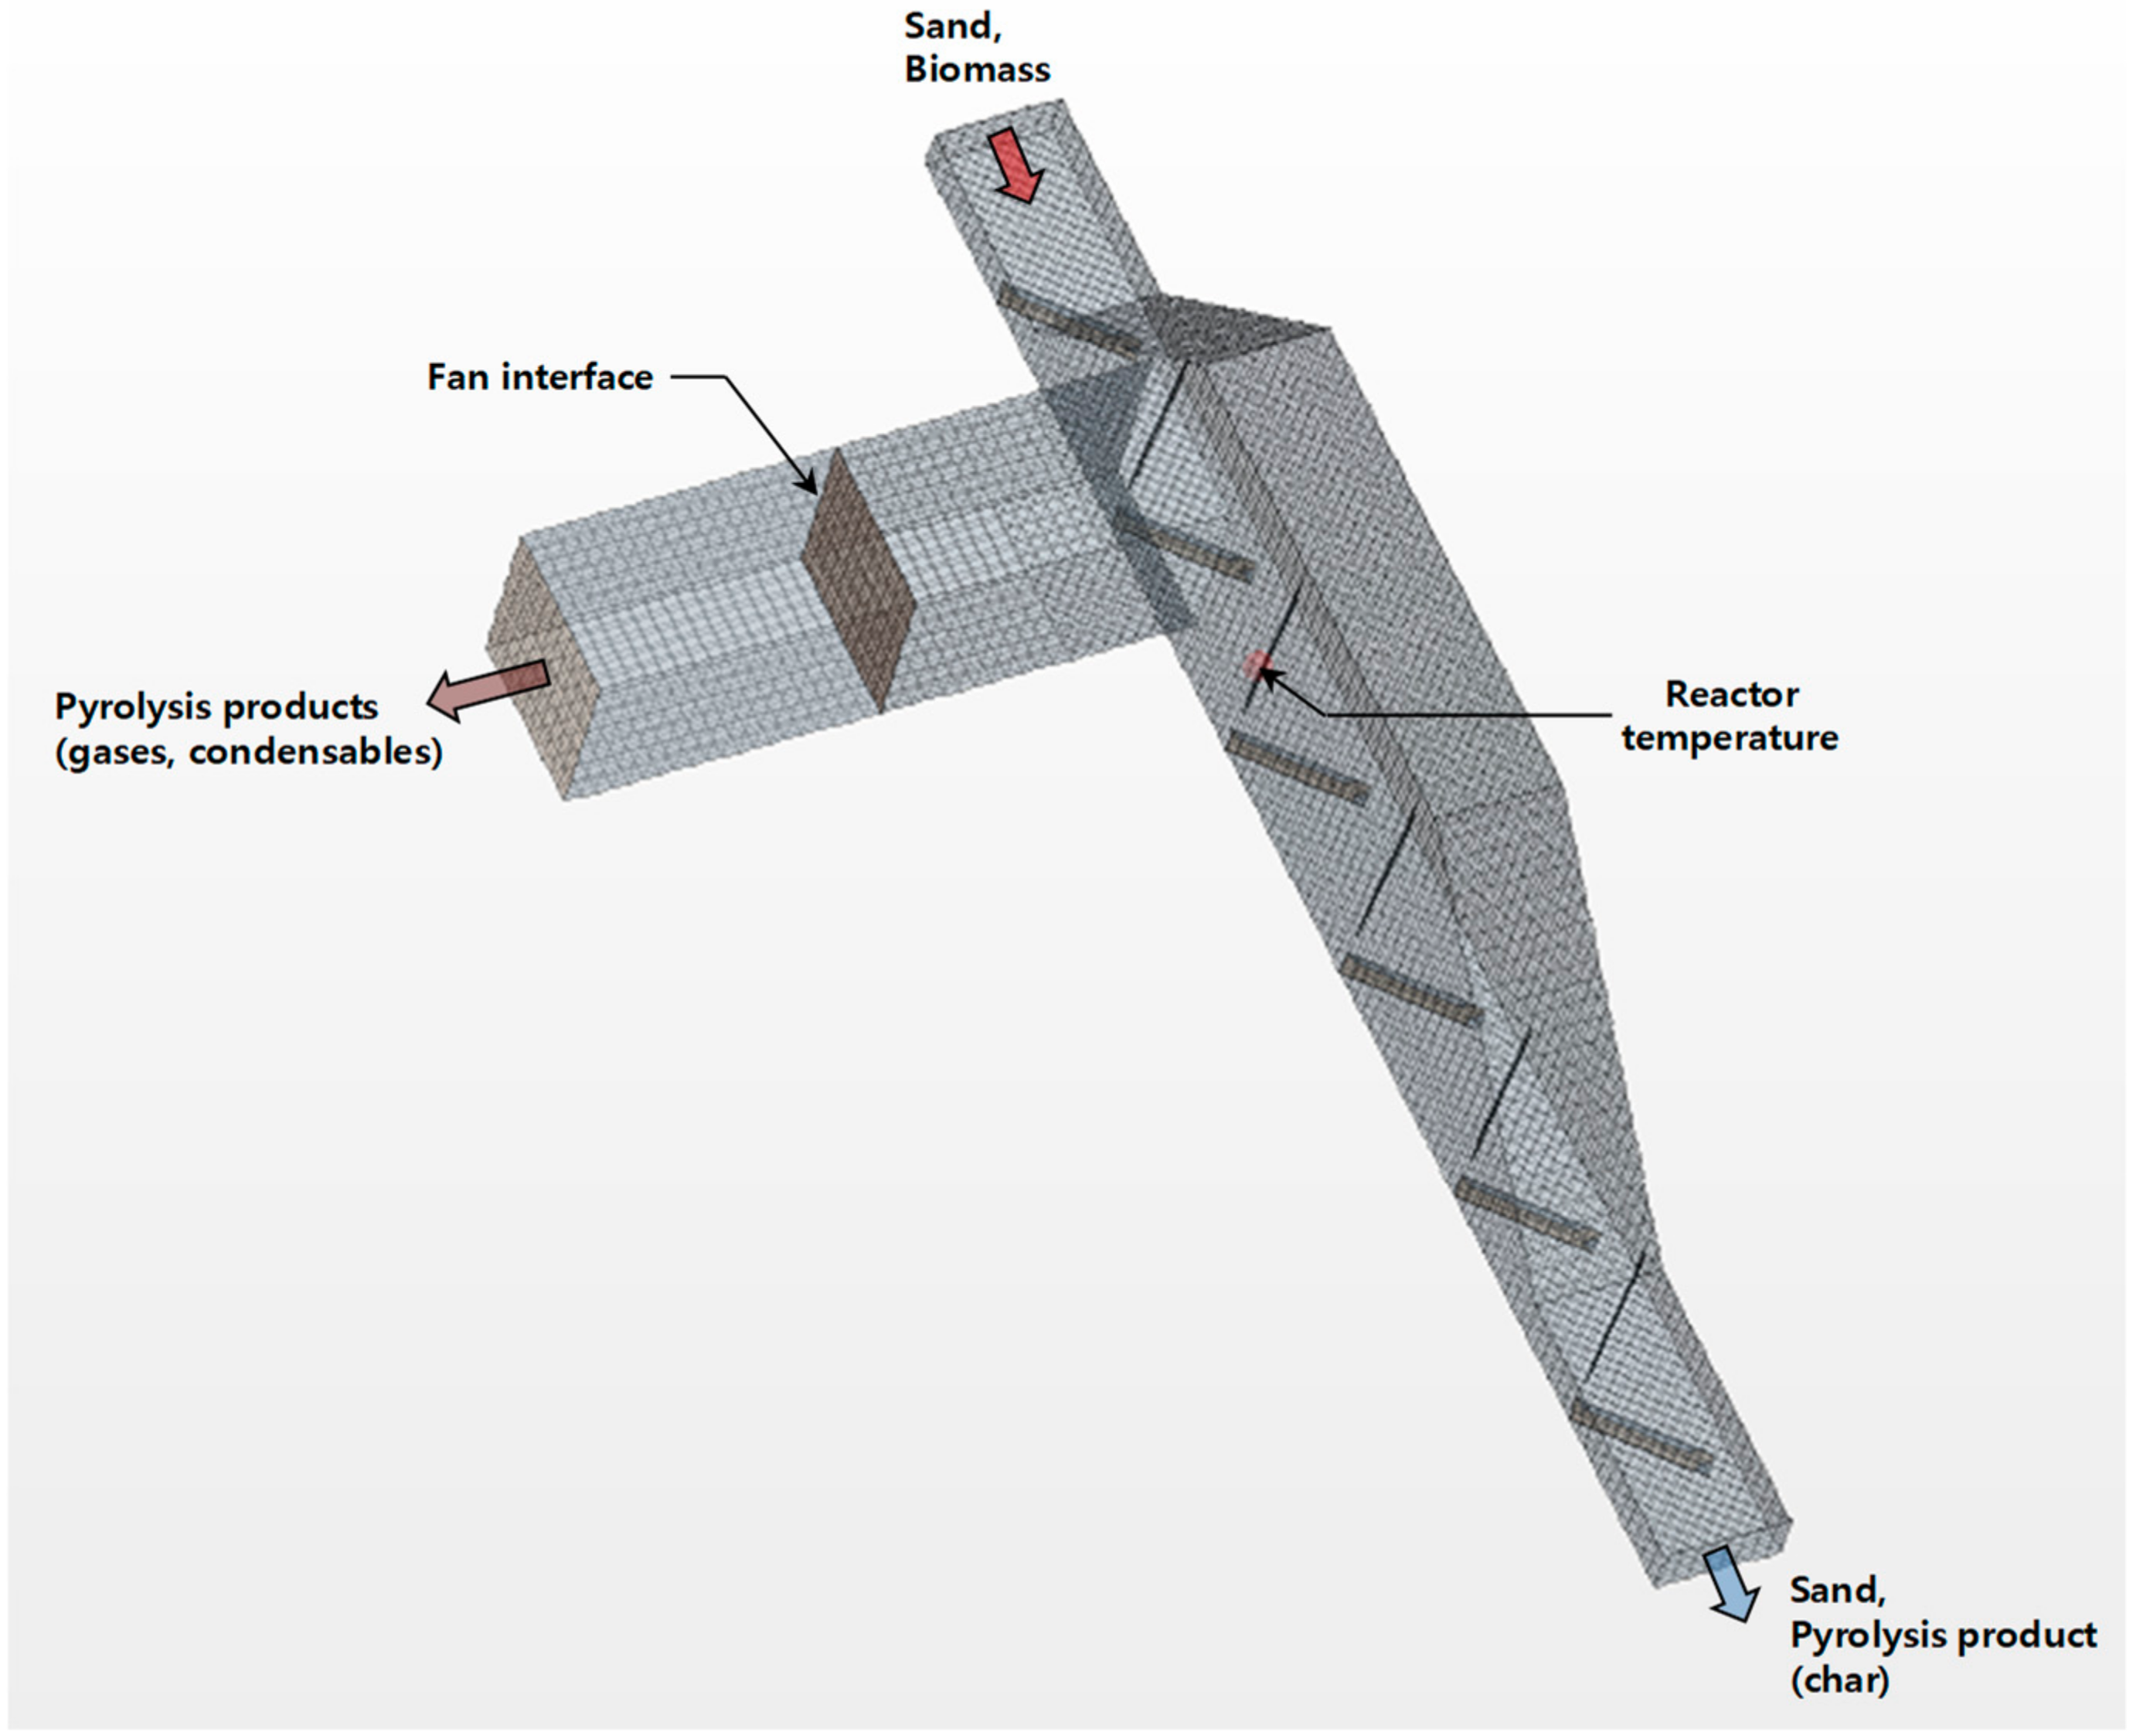
Figure 2. The biomass is supplied via a screw conveyor into the top of the tilted reactor. The heated sand is also supplied to the top of the reactor as a heat transfer medium for fast pyrolysis. The biomass is pyrolyzed while it is transported down together with hot sand and their movements are guided baffles installed on the reactor floor. The pyrolysis products are gaseous species and residual char. The gaseous products are composed of condensable volatiles and noncondensable gases, which pass though the condensers where the volatiles are condensed into bio-crude oil. The solid residue is biochar and it is conveyed with sand from the reactor bottom to the circulating fluidized bed combustor where the biochar is burned to heat up the sand. In the tilted-slide reactor, the oxygen-free condition for the fast pyrolysis can be maintained due to the sand filled in the sand hopper above the reactor and that filled in the screw conveyer below the reactor. In this study, as the simulation region the tilted reactor is focused on and the condensation of volatile was not accounted for. Therefore, it is assumed that the yield of bio-crude oil is equivalent to that of volatile. The simulation is carried out using a commercial computational fluid dynamics software (STAR-CCM+ v9.06). The geometry for the simulation is shown in Figure 3 together with the trimmer mesh with rectangular cuboid shape. The meshes were composed of 40,113 cells. During the experiment, the reactor is operated at a slightly negative pressure condition by the induced draft fan to prevent a leak of pyrolytic gas from the reactor. The effect of induced draft fan is implemented by introducing a fan interface as indicated in Figure 3. The fan performance curve provided by the fan manufacturer is applied to the simulation and the fan rotation rate is specified at 286 rpm which corresponds to 5 Hz of the inverter to control the fan rotation rate in the experiment.
The governing equations of continuity, momentum, energy and species equations were discretized by finite volume method and the segregated approach was used to solve the flow equations. The details of governing equations and solving procedure are described in previous study [31] and STAR-CCM+ user guide [34]. To simulate the behaviors of sand and biomass particles, a Lagrangian multiphase model is adopted. The densities of sand and coffee ground were 2650 and 1145 kg/m3, respectively. The specific heat of sand is evaluated by a polynomial as a function of temperature to be c p = 318.3 + 1.612 T 5.634 × 10 4 T 2 . The specific heats of coffee ground and biochar are treated separately, which are calculated to be c p = 919.3 + 0.087 T 6.723 × 10 3 T 2 2.063 × 10 6 T 3 and c p = 1989 + 14.87 T 2.445 × 10 2 T 2 + 1.847 × 10 5 T 3 5.195 × 10 9 T 4 , respectively. The residence time of sand particle was measured to be 4.5s at the atmospheric condition. In the simulation, the normal and tangential restitution coefficients of particles are selected to be 0.8 by trial and error to have a similar residence time.
The fluid-particle heat transfer is calculated using the Nusselt number with the expression from Gunn as follows [35]:
Nu p = 7 10 e + 5 e 2 1 + 0.7 Re p 0.2 Pr 1 / 3 + 1.33 2.4 e + 1.2 e 2 Re p 0.7 Pr 1 / 3 ,
where e is the volume fraction of gas-phase. It is known that this expression is more suitable for a wide range of particle volume fractions. The particle-particle heat transfer is not accounted for in this study. The fluid-particle heat transfer coefficient h was evaluated as follows:
h = Nu p · λ D p ,
where λ and D p are the thermal conductivity of gas-phase and the particle diameter, respectively.
The kinetics of coffee ground pyrolysis are described by a lumped kinetic model [27] simplified from detailed kinetics of cellulose, hemicellulose and lignin decomposition [36,37,38,39]. The reactions and their kinetic parameters have been progressively extended and updated based on the experimental data [27] and the model predictions adopting the pyrolysis kinetics have been verified in various reactor configurations including a drop tube reactor [23], a fixed-bed reactor [24], a fluidized bed reactor [15,24,32], a conical spouted bed reactor [32] operating in various fast pyrolysis conditions such as heating rates, reaction temperatures and gas and solid residence times. It has been shown that the maximum product yields as wells as the yield trends with temperature could be reasonably predicted.
It was assumed that each reference component decomposes through first-order reactions independently. The kinetic model includes 22 solid species and 28 gas species which constitute 25 reactions. The solid and gaseous species are listed in Table 4 and Table 5, respectively. The kinetic parameters are summarized in Table 6.
It is known that the ash content in the biomass can decrease the bio-crude oil yield by catalytic effect [27]. The major ash effect is the reduction of levoglucosan and xylan in favor of decomposition and dehydration products along with a char increase. The experimental data obtained in the VTT’s pyrolyzer [40] showed that higher ash content leads to lower oil yield with higher water content. The decrease of oil yield as a function of ash content becomes almost negligible as the ash content are larger than 4 wt% [40]. To account for the ash effect, the simplified approach [27] was adopted and the kinetic parameters of a few selected reactions have been modified to maintain a flexible and simple mechanism. The reduction of levoglucosan and xylan along with char increase were taken into account by introducing a global ash factor as follows [27]:
AF = tan h ash / 2 .
It was assumed that catalytic effect is already completed for ash content of 5 wt% [27] and the ash factor (AF) was defined as Equation (3) where the value of AF ranges from zero to asymptotically 1. In this study, the ash content is 2.77% in coffee ground which leads to the ash factor of 0.882. The activation energies of active cellulose decomposition ( E 2 ) and charification reaction ( E 4 ) are modified using AF as follows:
E 2 = 19100 600 × AF 0.5 = 18871   cal / mol
E 4 = 31000 1000 × AF 0.5 = 30618   cal / mol .
The activation energies of the decomposition of hemicellulose intermediate (HCE1) are modified as follows:
E 6 = 11000 1000 × AF 0.5 = 10618   cal / mol
E 7 = 3000 1000 × AF 0.5 = 2618   cal / mol .
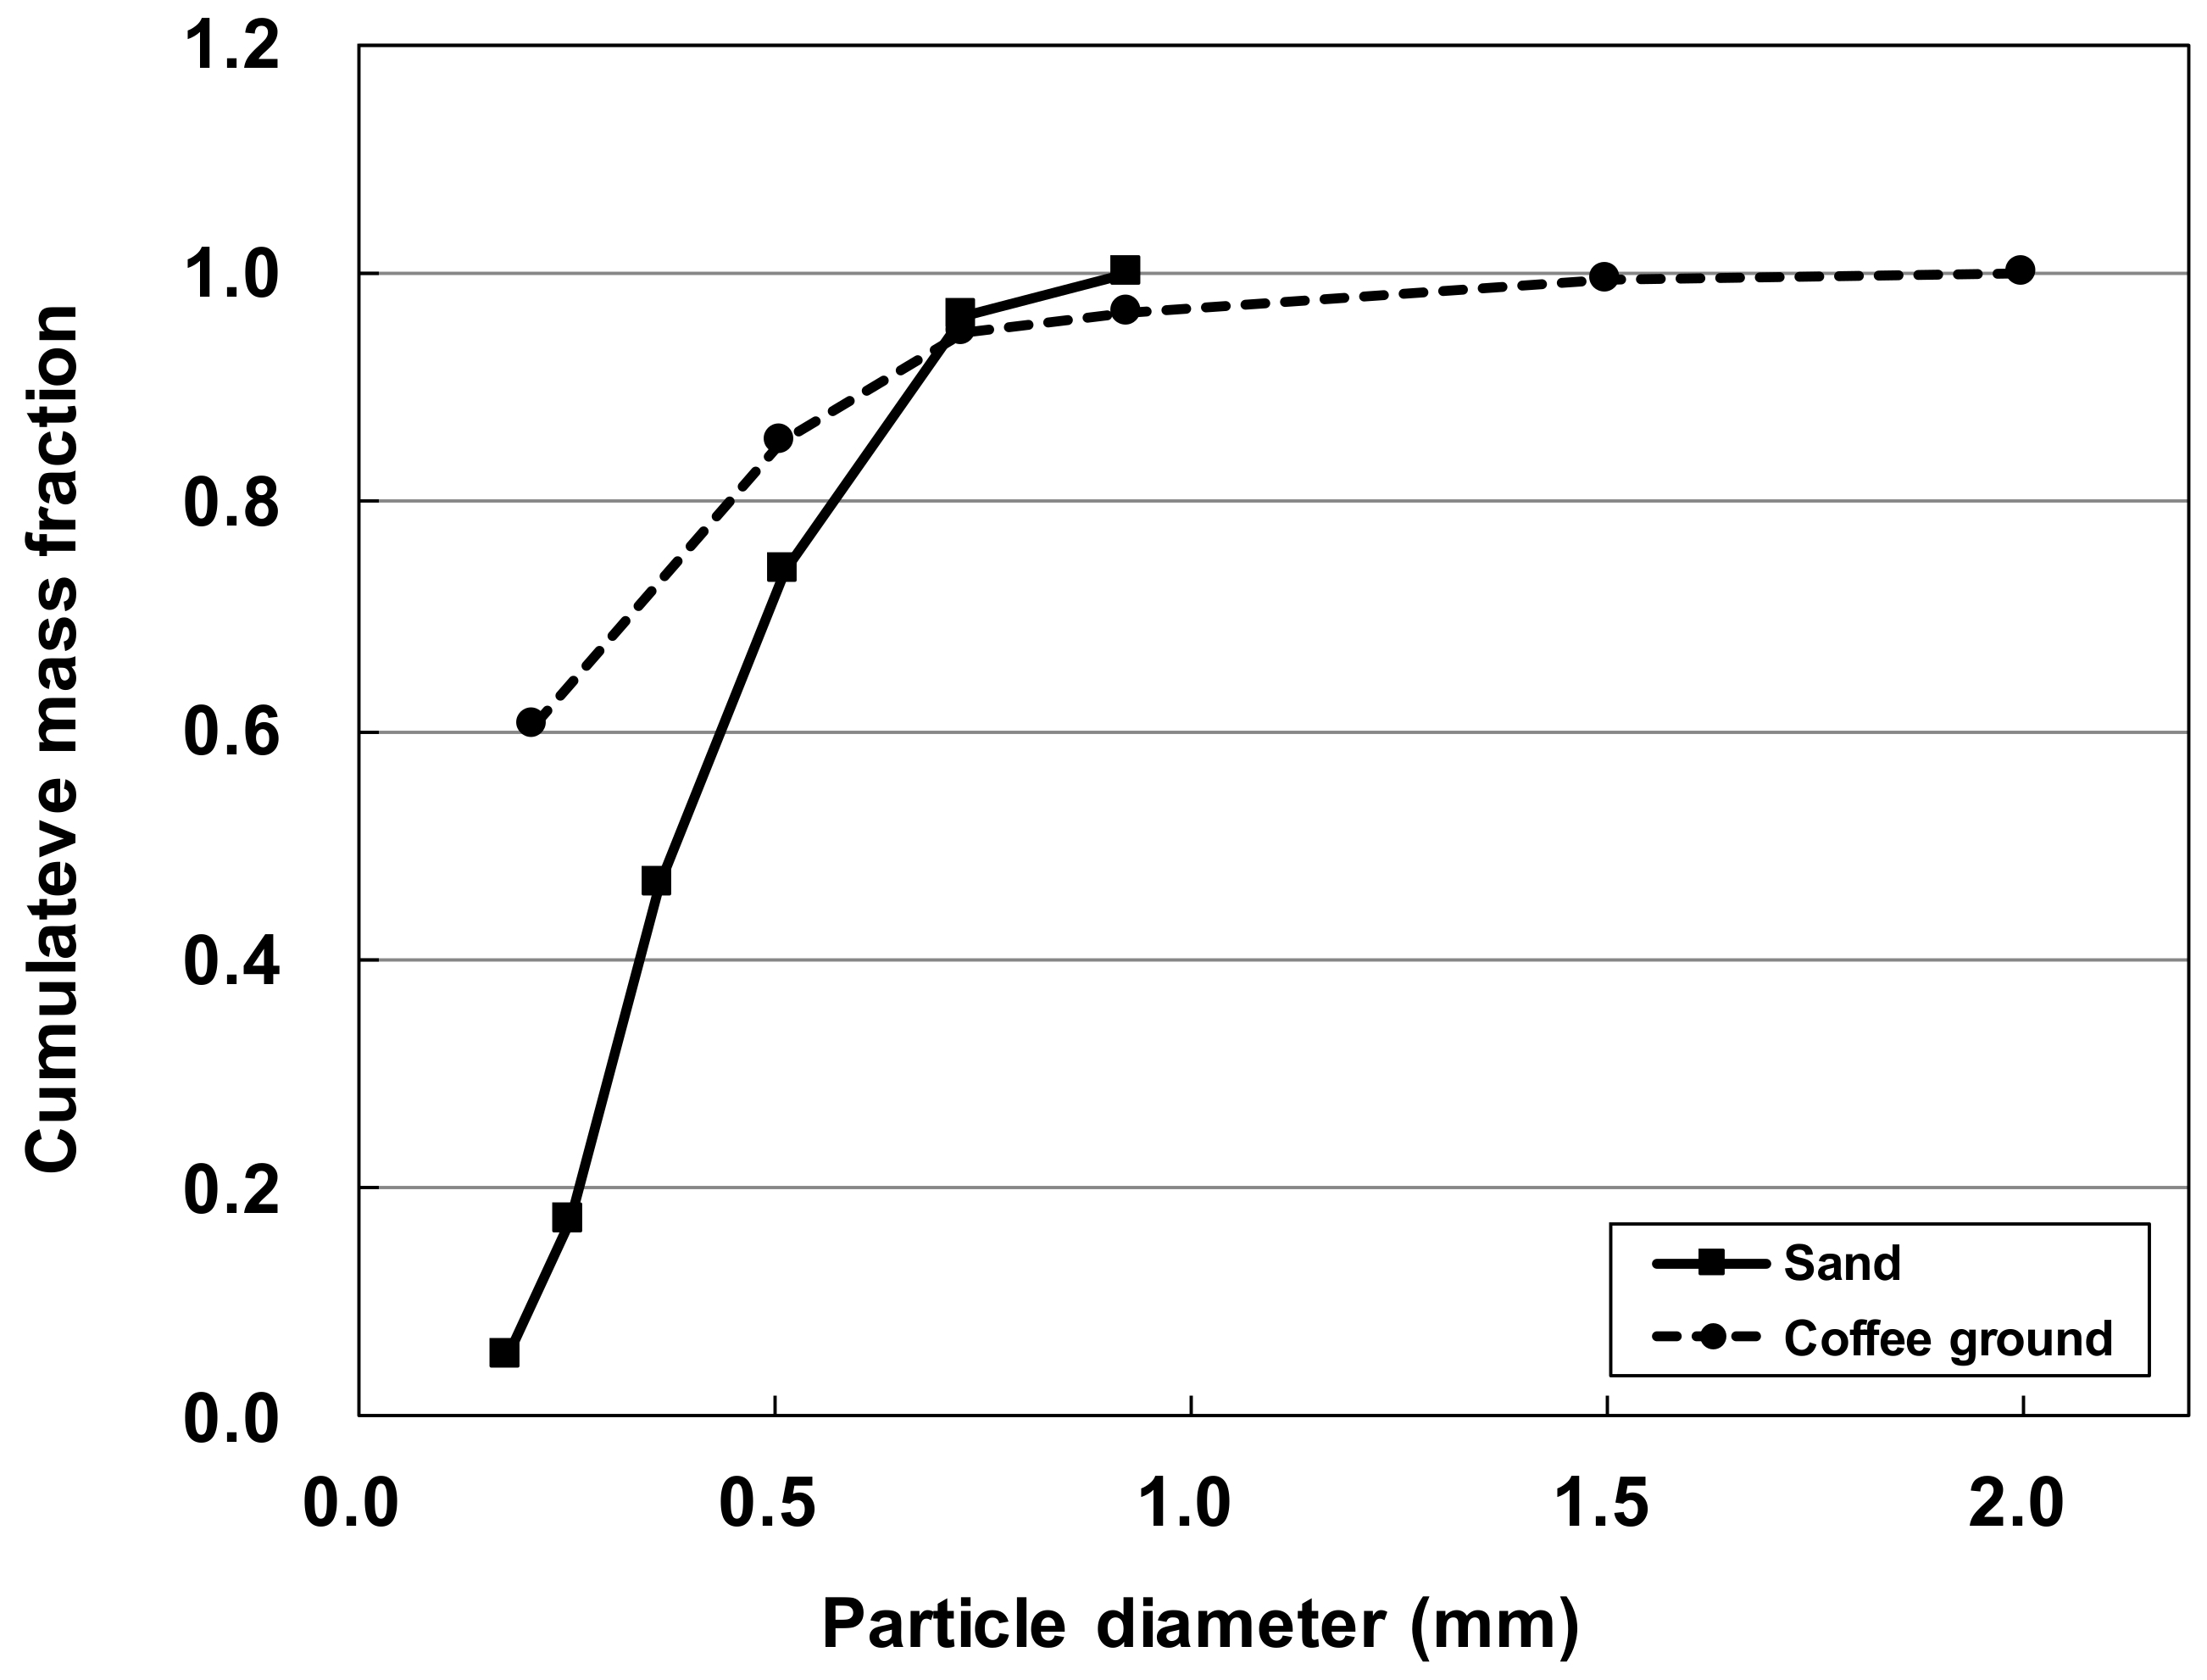
The feeding rate of coffee ground is 17.7 kg/h and the sand flow rate is 662.6 kg/h. For computational efficiency, instead of tracking individual particles a parcel stream is adopted as a group of particles of same velocity. Per injection points of sand and coffee ground, the numbers of parcel streams are set at 100. The temperature distribution inside the particle is assumed to be uniform. The particle size distributions of sand and coffee ground are shown in Figure 4 as cumulative distribution functions (CDF).
The simulation of the fast pyrolysis in a tilted-slide reactor is performed at various temperatures in a steady-state. The temperatures of injecting sands are 500, 550, 600, 650 °C whereas the biomass temperature entering the reactor is 25 °C. The “reactor temperature” is determined at a specified location in the reactor as indicated in Figure 3, which corresponds to the thermocouple position in the experiment. The reactor temperatures will be used in the comparison with the experimental results and further analysis.

3. Results and Discussion

3.1. Overall Product Yields

The yields of volatile, noncondensable gas and char in the simulation are evaluated as follows:
Volatile   yield   %   =   Mass   flow   rate   of   volatiles   out   of   gas   outlet   kg / s Biomass   feeding   rate   at   injector   kg / s × 100
Noncondensable   gas   yield   %   =   Mass   flow   rate   of   noncondensable   out   of   gas   outlet   kg / s Biomass   feeding   rate   at   injector   kg / s × 100
Char   yield   %   =   Mass   flow   rate   of   solid   residue   out   of   reactor   bottom   and   of   gas   outlet   kg / s Biomass   feeding   rate   at   injector   kg / s × 100 .
The product yields at various reactor temperatures are compared in Figure 5. The bio-crude yield from experiment [29] is also shown, which is denoted by ‘Volatile (Experiment).’ When only particle devolatilization is considered without secondary gas-phase reactions, the volatile yield increases continuously with increasing temperature as indicated by black dotted line in Figure 5. In practice, the volatile species from the fast pyrolysis can be further decomposed into smaller molecules which are typically noncondensable gases. In the previous study [31], the effect of the secondary tar cracking reactions has been considered in an indirect way because it is impractical to impose a comprehensive gas-phase chemistry to 3-D simulation directly. Using the surface averaged mass fractions at the gas outlet, a 1-D simulation was performed for a plug flow reactor [41] adopting the detailed gas-phase chemistry [32]. Because the detailed gas-phase reactions [32] consist of 507 species and 20239 reactions and it is not practical to impose them directly to the reactor simulation. But if it is possible to build up a simple kinetic mechanism which can reasonably predict tar cracking, it could be applied to the 3-D reactor simulation directly.
As a first step for establishing simplified kinetics, a calculation of plug flow reactor is performed starting from the mean composition at the reactor outlet at the reactor temperature of 563 °C to t = 5 s by using detailed gas-phase kinetics [32] similarly to the previous study [31]. When comparing the results from the 3-D reactor simulation without gas-phase reactions to 1-D plug flow reactor adopting detailed kinetics, the mass fractions of volatiles such as levoglucosan (C6H10O5), xylofuranose (C5H8O4) and methyl linoleate (C19H34O2) and so forth, are quite larger than the results in plug flow reactor (pfr), while the mass fractions of noncondensable gases (H2, CO, CO2, CH4 and C2H4) are smaller. This result indicates that considerable amounts of volatile species are decomposed into lighter noncondensable gases by the secondary reactions. Based on this result, a simplified kinetics for secondary tar cracking are established following the methodology of Blondeau and Jeanmart [42], Mellen et al. [43] and Anca-Couce et al. [44] based on the global kinetic constants suggested by Park et al. [45]. The reactions listed in Table 7 share an identical activation energy ( E = 108,000   J / mol ). We note that carbon (C) is added as a product to some of the reactions for atomic balance. A preliminary test using the same pre-exponential factor ( A = 4.28 × 10 6   s 1 ) from Park et al. [45] for all reactions highly overpredict the reaction rate of tar cracking, leading to much smaller bio-crude oil yield. Therefore, the pre-exponential factors are adjusted to have a similar tar cracking trend with that calculated by the detailed chemistry in a 1-D plug flow reactor configuration. The adjusted pre-exponential factors in Table 7 are generally A = 1.2 × 10 5   s 1 . We note that larger values are adopted for reactions 11 and 21 because the value of A = 1.2 × 10 5   s 1 highly overpredict the mass fractions C3H6O2 and C19H34O2. As shown in Figure 6, the differences in mass fractions from detailed and simplified kinetics are not significant and the simplified kinetics could be feasible to the reactor simulation. We note that although these simplified reactions are hypothetical and they have not been validated experimentally, it might be suggested that considering these reactions could improve the prediction of the bio-crude oil yield in the 3-D simulation without much computational cost.
The product yields imposing the simplified secondary reactions are indicated by solid lines in Figure 5. We note that the reactor temperatures become smaller by about 10 °C due to the presence of the gas-phase reactions. When the secondary reactions are implemented, the volatile yields decrease while the noncondensable gas yield increase particularly at higher temperature in comparison with the results without secondary reactions. The volatile yield shows the maximum value of 59% at the reactor temperature of 554 °C, which agrees well with the experimental result. Also, the decreasing trend of volatile yield at higher temperature was almost identical with the experiment. Therefore, it can be said that the fast pyrolysis of coffee ground in a tilted-slide reactor could be predicted successfully at the temperatures higher than 550 °C. At lower temperatures the volatile yields were overpredicted and this might be due to the assumption of isothermal particle in this study. With this assumption, the center temperature of biomass particle rises as quickly as its surface temperature and the heating rate of biomass could be overpredicted especially at lower temperatures to promote the fast pyrolysis leading to higher volatile yield. The char yield varied little with the secondary reactions.

3.2. Characteristics of Temperature, Pressure and Species Distributions

The movements of sand and biomass particles are tracked after they were injected from the top of the reactor as shown in Figure 7a–c at the reactor temperature of 554 °C. The sand was injected at 600 °C and its temperature decreases while supplying the heat for fast pyrolysis. The temperature of coffee ground quickly increases up to the pyrolysis temperature while it is transported downward. The biomass heating rate was approximated to be 1000 °C/s which is within the range of fast pyrolysis conditions. The residence time of the biomass particle in the reactor is generally 5 s as shown in Figure 7c. The flow of the pyrolytic gas is visualized as streamlines in Figure 7d. The gas firstly rises from the reactor floor and recirculates along the reactor ceiling and then exits from the reactor. The secondary gas-phase reaction occurs during this procedure which decomposes volatiles into light gas species. The residence time of pyrolytic gas inside the reactor cannot be readily derived because the gas flow direction is not one-way differing from the fluidized-bed reactor as shown in Figure 7d. Alternatively, the vapor residence time can be approximated by comparing the mass fractions of volatile and gas at the reactor outlet with those of 1-D plug flow reactor (pfr). The solid lines in Figure S1 of the Supplementary Material show the evolution of the mass fractions of total volatile and gas species in pfr adopting the simplified secondary reactions. The initial composition was obtained from the surface averaged mass fractions at the gas outlet in the 3-D reactor simulation without secondary reactions. It can be observed that the volatile fraction decreases with time while the gas fraction increases due to the conversion of volatile to gas by tar cracking. The dotted lines in Figure S1 indicate the total volatile and gas fractions at the gas outlet in the 3-D reaction with secondary reactions. We note that the reactor simulation is performed in a steady-state and the time variable is not applied to the values. It can be found that the mass fractions of volatile and gas coincide with those of pfr calculation when the time in pfr is nearly 5 s. Based on this result, the elapsed time for the secondary reactions can be approximated to be 5 s which could be equivalent to the gas residence time.
Figure 8 shows the gas temperature, pressure and mass fraction distributions on the vertical plane section at the reactor temperature of 554 °C. The temperature in Figure 8a descends in downward direction similarly to the sand temperature in Figure 7a. The surface averaged temperature at the reactor bottom is calculated to be 540 °C and this value is 14 °C smaller than the reactor temperature of 554 °C. In the experiment [29], the reactor temperature was controlled to be 520, 550 and 580 °C. During the experiment, the sand inlet and outlet temperatures can be varied depending on the operating conditions such as the slit opening area in the sand hopper and the sand level at the reactor bottom. On average, the sand inlet temperature is measured to be 30~40 °C higher than the reactor temperature and the bottom temperature is 10~20 °C smaller than the reactor temperature. In the simulation the sand inlet temperature is 48 °C higher than the reactor temperature and the reactor temperature is 16 °C higher than the reactor temperature. The temperature prediction could be considered in a reasonable range.
There can be shown a locally low temperature region near the location of gas outlet, which had not been observed in the previous study [31]. We note that the effect of the induced draft fan for the pyrolytic gas was accounted for in this study and this effect could result in the different temperature distribution in comparison with the previous study. The average pressure in the reactor is about −16 Pa as shown in Figure 8b. We note that the reactor pressure had been maintained at about −10 ~ −20 Pa in the experiment and the pressure could be predicted reasonably in the simulation.
The major pyrolysis products from cellulose (CELL), hemicellulose (HECELL), lignins (LIG-C, LIG-H, LIG-O) and extractive (TGL) are levoglucosan (C6H10O5), xylofuranose (C5H8O4), 3-(4-hydroxy-3,5-dimethoxyphenyl)acrylaldehyde (C11H12O4) and methyl linoleate (C19H34O2), respectively. The mass fraction distributions of these species are shown Figure 8c–f at the reactor temperature of 554 °C. The maximum mass fractions of C6H10O5 and C5H8O4 are located on upper side of the reactor, while the maximum value of C11H12O4 is near the reactor bottom. This result indicates a slower degradation of lignin than the cases of cellulose and hemicellulose, which had been exhibited by a thermogravimetric analysis [46]. The mass fraction of C19H34O2 is concentrated near the reactor top and this indicates a fast decomposition of extractive species in coffee ground at this temperature. The yields of individual pyrolysis products will be discussed in next subsection together with the pyrolysis progress inside the tilted-slide reactor.

3.3. Species Yields and Pyrolysis Progress in the Tilted-Slide Reactor

Figure 9 shows the yields of individual products from the fast pyrolysis of coffee ground in the tilted-slide reactor. For each species, the yields at various reactor temperatures are compared. The yields of noncondensable gases are shown in a separate subfigure. We note that the sum of the individual volatile or noncondensable gas yields in Figure 9 corresponds to the overall volatile or noncondensable gas yield in Figure 5. The C6H10O5 yield shows largest value in all pyrolysis products. This result is related to the largest mass fraction of cellulose in coffee ground as shown in Table 3. Focusing on the effect of reactor temperature, the C6H10O5 yield is maximum at 554 °C which corresponds to the maximum volatile yield and most of other volatile species also have similar trend with reactor temperature. The yield of individual noncondensable gas increase with reactor temperature and CO yields are largest.
Figure 10 shows the surface-integrated mass flow rates of pyrolyzed coffee ground particles on a cross-sections perpendicular to the reactor floor. The cross-sections are evenly arranged at 0.25m intervals from the top of the reactor. The mass flow rates at 0 m and 2.55 m are biomass feeding rate at the injector (17.7 kg/h) and outflow rate of solid residue at the reactor bottom, respectively. As the biomass particles descend along the reactor floor, they lose their mass while producing pyrolytic gas. At higher reactor temperature, the particle mass flow diminishes faster and the outflow rate at the bottom decreases resulting in a smaller char yield as shown in Figure 5.
Because the biomass components (cellulose, hemicellulose, lignin and extractive) have different kinetics of decomposition, so their devolatilization behaviors are also different. Figure 11 shows the decomposition behavior of each component at various reactor temperatures. At the lowest temperature of 454 °C, cellulose decreases almost linearly along the distance. The decompositions of hemicellulose and total lignin are relatively faster in the upper half of the reactor and then are slowed down in lower half of the reactor. But for each lignin component, LIGC is pyrolyzed rather slower than LIGH and LIGO. Triglyceride (TGL) is hardly decomposed and only small amount of it is decomposed near the reactor bottom. As the reactor temperature is increased to 499 °C, the trend of cellulose pyrolysis begins to be similar to those of hemicellulose and total lignin and the decompositions of TGL and LIGC becomes faster. At higher temperatures of 554 and 599 °C, the pyrolysis characteristics of the biomass components resemble each other as shown in Figure 11c–d. Also, the pyrolysis of TGL is more activated and most of TGL is decomposed down to the reactor bottom. Therefore, it can be known that for an effective TGL pyrolysis the reactor temperature should be above 500 °C.

4. Conclusions

The fast pyrolysis of coffee ground in a tilted-slide reactor was simulated by a Lagrangian multiphase model. The biochemical composition of coffee ground was derived from the elemental analysis and the extended characterization method was adopted to account for the extractives in coffee ground. The volatile yields at various reactor temperatures were compared with those of experimental results. In the simulation without secondary gas-phase reaction, the volatile yield increased monotonically with reactor temperature while it turned to decrease at higher temperature in the experiment. The inclusion of secondary tar cracking reactions effectively decomposed the volatile species into light gas species, resulting in a decrease of volatile yield at high temperature. The maximum volatile yield in the simulation was 59% at the reactor temperature of 554 °C and this agreed well with the experimental results. Although the volatile yield in the simulation at lower temperature was larger than the experiment, the decreasing trend of volatile yield at high temperatures could be predicted well by inclusion of secondary tar cracking reactions. The spatial distributions of major volatile components indicated different pyrolysis behavior of each biomass component and the decomposition of each component was tracked along the distance from the reactor top to bottom. It was shown that triglyceride and lignin rich in carbon decomposed slower than other components at relatively lower temperatures. At the reactor temperatures above 500 °C, their trend became similar to those of other components. It should be stressed that simplified secondary gas-phase reactions and the catalytic effect of ash were established in hypothetical manners and have not been validated experimentally. Nevertheless, we note that these strong simplifications have been adopted as an effective approach to reflect the experimental findings in the simulation and it might be expected that this aspect could be considered in a practical engineering point of view. Considering that various pyrolysis products are included in the simulation, the individual species might be compared with the measured concentration in a future study and it could be used for the improvement of the pyrolysis kinetics. Also, the simulation results are expected to be used as base design data for scaling up the pyrolysis plant.

Supplementary Materials

The following are available online at https://www.mdpi.com/1996-1073/13/24/6605/s1, Figure S1: Mass fractions of total volatile and gas species in 1-D plug flow reactor (pfr) in comparison with the mass fractions at the gas outlet in the 3-D reactor simulation with secondary reactions.

Author Contributions

Conceptualization, Y.S.C. and S.K.C.; methodology, S.K.C.; investigation, S.K.C.; data curation, Y.W.J. and S.Y.H.; writing—original draft preparation, S.K.C.; visualization, Q.V.N.; supervision, Y.S.C.; project administration, Y.S.C. All authors have read and agreed to the published version of the manuscript.

Funding

This work was supported by the “Development of Rooftop WISE Farm Technologies Utilizing Building Energy” project (NK225B) of the Korea Institute of Machinery and Materials under the auspices of the Korea government (MSIT), Republic of Korea. This work was also supported by the National Research Council of Science & Technology (NST) grant by the Korea government (MSIT) No. CAP-16-05-KIMM. The authors gratefully acknowledge this support.

Conflicts of Interest

The authors declare no conflict of interest.

References

  1. Bridgwater, A.V.; Meier, D.; Radlein, D. An overview of fast pyrolysis of biomass. Org. Geochem. 1999, 30, 1479–1493. [Google Scholar] [CrossRef]
  2. Mohan, D.; Pittman, C.U.; Steele, P.H. Pyrolysis of wood/biomass for bio-oil: A critical review. Energy Fuels 2006, 20, 848–889. [Google Scholar] [CrossRef]
  3. Lu, Q.; Li, W.Z.; Zhu, X.F. Overview of fuel properties of biomass fast pyrolysis oils. Energy Convers. Manag. 2009, 50, 1376–1383. [Google Scholar] [CrossRef]
  4. Bridgwater, A.V. Review of fast pyrolysis of biomass and product upgrading. Biomass Bioenergy 2012, 38, 68–94. [Google Scholar] [CrossRef]
  5. Bok, J.P.; Choi, H.S.; Choi, J.W.; Choi, Y.S. Fast pyrolysis of Miscanthus sinensis in fluidized bed reactors: Characteristics of product yields and biocrude oil quality. Energy 2013, 60, 44–52. [Google Scholar] [CrossRef]
  6. Wagenaar, B.M.; Prins, W.; van Swaaij, W.P.M. Pyrolysis of biomass in the rotating cone reactor: Modelling and experimental justification. Chem. Eng. Sci. 1994, 49, 5109–5126. [Google Scholar] [CrossRef] [Green Version]
  7. Fernandez-Akarregi, A.R.; Makibar, J.; Lopez, G.; Amutio, M.; Olazar, M. Design and operation of a conical spouted bed reactor pilot plant (25 kg/h) for biomass fast pyrolysis. Fuel Process. Technol. 2013, 112, 48–56. [Google Scholar] [CrossRef]
  8. Ingram, L.; Mohan, D.; Bricka, M.; Steele, P.; Strobel, D.; Mitchell, B.; Mohammad, J.; Cantrell, K.; Pittman, C.U., Jr. Pyrolysis of Wood and Bark in an Auger Reactor: Physical Properties and Chemical Analysis of the Produced Bio-oils Pyrolysis of Wood and Bark in an Auger Reactor: Physical Properties and Chemical Analysis of the Produced Bio-oils. Energy Fuels 2008, 22, 614–625. [Google Scholar] [CrossRef]
  9. Choi, Y.S.; Choi, S.K.; Jeong, Y.W. Development of a tilted-slide reactor for the fast pyrolysis of biomass. Environ. Prog. Sustain. Energy 2014, 33. [Google Scholar] [CrossRef]
  10. Lathouwers, D.; Bellan, J. Modeling of dense gas-solid reactive mixtures applied to biomass pyrolysis in a fluidized bed. Int. J. Multiph. Flow 2001, 27, 2155–2187. [Google Scholar] [CrossRef]
  11. Lathouwers, D.; Bellan, J. Yield Optimization and Scaling of Fluidized Beds for Tar Production from Biomass. Energy Fuels 2001, 15, 1247–1262. [Google Scholar] [CrossRef]
  12. Xue, Q.; Heindel, T.J.; Fox, R.O. A CFD model for biomass fast pyrolysis in fluidized-bed reactors. Chem. Eng. Sci. 2011, 66, 2440–2452. [Google Scholar] [CrossRef]
  13. Xue, Q.; Dalluge, D.; Heindel, T.J.; Fox, R.O.; Brown, R.C. Experimental validation and CFD modeling study of biomass fast pyrolysis in fluidized-bed reactors. Fuel 2012, 97, 757–769. [Google Scholar] [CrossRef]
  14. Ranganathan, P.; Gu, S. Bioresource Technology Computational fluid dynamics modelling of biomass fast pyrolysis in fluidised bed reactors, focusing different kinetic schemes. Bioresour. Technol. 2016, 213, 333–341. [Google Scholar] [CrossRef] [PubMed] [Green Version]
  15. Brandão, F.L.; Verissimo, G.L.; Leite, M.A.H.; Leiroz, A.J.K.; Cruz, M.E. Computational Study of Sugarcane Bagasse Pyrolysis Modeling in a Bubbling Fluidized Bed Reactor. Energy Fuels 2018, 32, 1711–1723. [Google Scholar] [CrossRef]
  16. Sia, S.Q.; Wang, W.C. Numerical simulations of fluidized bed fast pyrolysis of biomass through computational fluid dynamics. Renew. Energy 2020, 155, 248–256. [Google Scholar] [CrossRef]
  17. Shuangning, X.; Zhihe, L.; Baoming, L.; Weiming, Y.; Xueyuan, B. Devolatilization characteristics of biomass at flash heating rate. Fuel 2006, 85, 664–670. [Google Scholar] [CrossRef]
  18. Sun, S.; Tian, H.; Zhao, Y.; Sun, R.; Zhou, H. Experimental and numerical study of biomass flash pyrolysis in an entrained flow reactor. Bioresour. Technol. 2010, 101, 3678–3684. [Google Scholar] [CrossRef]
  19. Richter, A.; Vascellari, M.; Nikrityuk, P.A.; Hasse, C. Detailed analysis of reacting particles in an entrained-flow gasifier. Fuel Process. Technol. 2016, 144, 95–108. [Google Scholar] [CrossRef]
  20. Lopez, G.; Alvarez, J.; Amutio, M.; Hooshdaran, B.; Cortazar, M.; Haghshenasfard, M.; Hosseini, S.H.; Olazar, M. Kinetic modeling and experimental validation of biomass fast pyrolysis in a conical spouted bed reactor. Chem. Eng. J. 2019, 373, 677–686. [Google Scholar] [CrossRef]
  21. Park, H.C.; Choi, H.S. Fast pyrolysis of biomass in a spouted bed reactor: Hydrodynamics, heat transfer and chemical reaction. Renew. Energy 2019, 143, 1268–1284. [Google Scholar] [CrossRef]
  22. Moliner, C.; Marchelli, F.; Spanachi, N.; Martinez-Felipe, A.; Bosio, B.; Arato, E. CFD simulation of a spouted bed: Comparison between the Discrete Element Method (DEM) and the Two Fluid Model (TFM). Chem. Eng. J. 2019, 377, 120466. [Google Scholar] [CrossRef] [Green Version]
  23. Ranzi, E.; Cuoci, A.; Faravelli, T.; Frassoldati, A.; Migliavacca, G.; Pierucci, S.; Sommariva, S. Chemical kinetics of biomass pyrolysis. Energy Fuels 2008, 22, 4292–4300. [Google Scholar] [CrossRef]
  24. Calonaci, M.; Grana, R.; Barker Hemings, E.; Bozzano, G.; Dente, M.; Ranzi, E. Comprehensive kinetic modeling study of bio-oil formation from fast pyrolysis of biomass. Energy Fuels 2010, 24, 5727–5734. [Google Scholar] [CrossRef]
  25. Corbetta, M.; Frassoldati, A.; Bennadji, H.; Smith, K.; Serapiglia, M.J.; Gauthier, G.; Melkior, T.; Ranzi, E.; Fisher, E.M. Pyrolysis of centimeter-scale woody biomass particles: Kinetic modeling and experimental validation. Energy Fuels 2014, 28, 3884–3898. [Google Scholar] [CrossRef]
  26. Debiagi, P.E.A.; Pecchi, C.; Gentile, G.; Frassoldati, A.; Cuoci, A.; Faravelli, T.; Ranzi, E. Extractives Extend the Applicability of Multistep Kinetic Scheme of Biomass Pyrolysis. Energy Fuels 2015, 29, 6544–6555. [Google Scholar] [CrossRef]
  27. Ranzi, E.; Debiagi, P.E.A.; Frassoldati, A. Mathematical Modeling of Fast Biomass Pyrolysis and Bio-Oil Formation. Note I: Kinetic Mechanism of Biomass Pyrolysis. ACS Sustain. Chem. Eng. 2017, 5, 2867–2881. [Google Scholar] [CrossRef]
  28. Bok, J.P.; Choi, Y.S.; Choi, S.K.; Jeong, Y.W. Fast pyrolysis of Douglas fir by using tilted-slide reactor andcharacteristics of biocrude-oil fractions. Renew. Energy 2014, 65, 7–13. [Google Scholar] [CrossRef]
  29. Choi, Y.S.; Choi, S.K.; Kim, S.J.; Jeong, Y.W.; Soysa, R.; Rahman, T. Fast pyrolysis of coffee ground in a tilted-slide reactor and characteristics of biocrude oil. Environ. Prog. Sustain. Energy 2017, 36, 655–661. [Google Scholar] [CrossRef]
  30. Choi, Y.; Choi, S.; Kim, S.; Han, S.; Jeong, Y. Effect of Biomass Particle Size on the Fast Pyrolysis Characteristics of Palm Kernel Shell to Produce Biocrude-oil. New Renew. Energy 2017, 13, 55–63. [Google Scholar] [CrossRef]
  31. Choi, S.K.; Choi, Y.S.; Kim, S.J.; Han, S.Y.; Jeong, Y.W.; Kwon, Y.S.; Van Nguyen, Q. Simulation of a tilted-slide reactor for the fast pyrolysis of biomass. Biomass Bioenergy 2019, 126, 94–105. [Google Scholar] [CrossRef]
  32. Ranzi, E.; Debiagi, P.E.A.; Frassoldati, A. Mathematical Modeling of Fast Biomass Pyrolysis and Bio-Oil Formation. Note II: Secondary Gas-Phase Reactions and Bio-Oil Formation. ACS Sustain. Chem. Eng. 2017, 5, 2882–2896. [Google Scholar] [CrossRef]
  33. USDA. Foreign Agricultural Service Coffee: World Markets and Trade; USDA: Washington, DC, USA, 2019; pp. 1–9. Available online: https://www.fas.usda.gov/data/coffee-world-markets-and-trade (accessed on 29 April 2020).
  34. CD-adapco User Guide. In STAR-CCM+ Version 9.06; CD-adapco: New York, NY, USA, 2014.
  35. Gunn, D.J. Transfer of heat or mass to particles in fixed and fluidised beds. Int. J. Heat Mass Transf. 1978, 21, 467–476. [Google Scholar] [CrossRef]
  36. Seshadri, V.; Westmoreland, P.R. Concerted reactions and mechanism of glucose pyrolysis and implications for cellulose kinetics. J. Phys. Chem. A 2012, 116, 11997–12013. [Google Scholar] [CrossRef] [PubMed]
  37. Vinu, R.; Broadbelt, L.J. A mechanistic model of fast pyrolysis of glucose-based carbohydrates to predict bio-oil composition. Energy Environ. Sci. 2012, 5, 9808–9826. [Google Scholar] [CrossRef]
  38. Zhou, X.; Nolte, M.W.; Mayes, H.B.; Shanks, B.H.; Broadbelt, L.J. Experimental and mechanistic modeling of fast pyrolysis of neat glucose-based carbohydrates. 1. Experiments and development of a detailed mechanistic model. Ind. Eng. Chem. Res. 2014, 53, 13274–13289. [Google Scholar] [CrossRef] [Green Version]
  39. Faravelli, T.; Frassoldati, A.; Migliavacca, G.; Ranzi, E. Detailed kinetic modeling of the thermal degradation of lignins. Biomass Bioenergy 2010, 34, 290–301. [Google Scholar] [CrossRef]
  40. Oasmaa, A.; Sundqvist, T.; Kuoppala, E.; Garcia-Perez, M.; Solantausta, Y.; Lindfors, C.; Paasikallio, V. Controlling the phase stability of biomass fast pyrolysis bio-oils. Energy Fuels 2015, 29, 4373–4381. [Google Scholar] [CrossRef]
  41. Goodwin, D.G.; Speth, R.L.; Moffat, H.K.; Weber, B.W. Cantera: An Object-Oriented Software Toolkit for Chemical Kinetics, Thermodynamics, and Transport Processes. Available online: https://www.cantera.org (accessed on 9 September 2020).
  42. Blondeau, J.; Jeanmart, H. Biomass pyrolysis at high temperatures: Prediction of gaseous species yields from an anisotropic particle. Biomass Bioenergy 2012, 41, 107–121. [Google Scholar] [CrossRef]
  43. Mellin, P.; Kantarelis, E.; Yang, W. Computational fluid dynamics modeling of biomass fast pyrolysis in a fluidized bed reactor, using a comprehensive chemistry scheme. Fuel 2014, 117, 704–715. [Google Scholar] [CrossRef]
  44. Anca-Couce, A.; Sommersacher, P.; Scharler, R. Online experiments and modelling with a detailed reaction scheme of single particle biomass pyrolysis. J. Anal. Appl. Pyrolysis 2017, 127, 411–425. [Google Scholar] [CrossRef]
  45. Park, W.C.; Atreya, A.; Baum, H.R. Experimental and theoretical investigation of heat and mass transfer processes during wood pyrolysis. Combust. Flame 2010, 157, 481–494. [Google Scholar] [CrossRef]
  46. Yang, H.; Yan, R.; Chen, H.; Zheng, C.; Lee, D.H.; Liang, D.T. In-depth investigation of biomass pyrolysis based on three major components: Hemicellulose, cellulose and lignin. Energy Fuels 2006, 20, 388–393. [Google Scholar] [CrossRef]
Figure 1. Biomass characterization from elemental analysis.
Energies 13 06605 g001
Figure 2. Schematic diagram of the tilted-slide fast pyrolyzer.
Energies 13 06605 g002
Figure 3. Calculation domain and mesh.
Energies 13 06605 g003
Figure 4. Particle size distributions of sand and coffee ground.
Energies 13 06605 g004
Figure 5. Product yields from fast pyrolysis of coffee ground at various reactor temperatures.
Energies 13 06605 g005
Figure 6. Mass fractions of gas-phase species calculated by detailed and simplified kinetics in plug-flow reactor (t = 5 s) starting from the pyrolysis products from coffee ground at the reactor temperature of 563 °C.
Energies 13 06605 g006
Figure 7. Particle behaviors and streamlines at the reactor temperature of 554 °C.
Energies 13 06605 g007
Figure 8. Temperature, pressure and mass fractions of major volatile species from cellulose, hemicellulose, lignin and extractives at the reactor temperature of 554 °C.
Energies 13 06605 g008
Figure 9. Species yields from fast pyrolysis of coffee ground at various reactor temperatures.
Energies 13 06605 g009
Figure 10. Mass flow rate of pyrolyzed particles along the distance from the top of the reactor.
Energies 13 06605 g010
Figure 11. Mass flow rate of biomass components along the distance from the top of the reactor.
Energies 13 06605 g011
Table 1. Proximate analysis (wt%) of coffee ground (wet basis).
MoistureVolatileFixed CarbonAsh
6.1072.2218.912.77
Table 2. Elemental composition (wt%) of coffee ground (dry and ash-free basis).
CHO *NS
52.546.8337.792.840
* By difference.
Table 3. Characterization of coffee ground.
SpeciesMass Fraction
CELL0.3487
HECELL0.1894
LIG-H0.1431
LIG-O0.0444
LIG-C0.0280
TGL0.1577
Moisture0.0610
Ash0.0277
Table 4. Solid species in the simulation [27].
NameFormulaNote
CELLC6H10O5Cellulose
HECELLC5H8O4Hemicellulose
LIGCC15H14O4Lignin rich in carbon
LIGHC22H28O9Lignin rich in hydrogen
LIGOC20H22O10Lignin rich in oxygen
TGLC57H100O7Triglyceride
ACQUAH2OWater
ASHASHAsh
CELLAC6H10O5Intermediate species
HCE1C5H8O4
HCE2C5H8O4
LIGCCC15H14O4
LIGOHC19H22O8
LIGC11H12O4
CharCChar
G{H2}H2Metaplastic
G{CO}CO
G{CO2}CO2
G{COH2}COH2
G{CH4}CH4
G{CH3OH}CH3OH
G{C2H4}C2H4
Table 5. Gaseous species in the simulation [27].
FormulaNote
Volatile (Condensable)H2Owater
CH2Oformaldehyde
HCOOHformic-acid
CH3OHmethanol
C2H2O2glyoxal
CH3CHOacetaldehyde
CH3COOHacetic-acid
C2H4O2hydroxyacetaldehyde
C2H5OHethanol
C2H3CHOacrolein
C2H5CHOpropionaldehyde
C3H6O23-hydroxypropanal
C5H4O2furan-2-carboxaldehyde(furfural)
C5H8O4xylofuranose
C6H5OHphenol
C6H6O35-(hydroxymethyl)-furfural
C6H10O5levoglucosan
C6H5OCH3anisole
C9H10O24-(3-hydroxy-1-propenyl)phenol(pCoumaryl)
C11H12O43-(4-hydroxy-3_5-dimethoxyphenyl)acrylaldehyde
C13H22O2double_unsaturated_methyl_ester
C19H34O2methyl_linoleate
NoncondensableH2hydrogen
COcarbon-monoxide
CO2carbon-dioxide
CH4methane
C2H4ethylene
Ccarbon
Table 6. Kinetic mechanism of biomass pyrolysis [27].
Pyrolysis ReactionsKinetic Parameters
A(s−1), Ea(kcal/kmol)
Cellulose
1CELLCELLA1.5 × 1014 × exp(−47000/RT)
2CELLA0.4 C2H4O2 + 0.05 C2H2O2 + 0.15 CH3CHO + 0.25 C6H6O3 + 0.35 C2H5CHO + 0.15 CH3OH + 0.3 CH2O + 0.61 CO + 0.36 CO2 + 0.05 H2 + 0.93 H2O + 0.02 HCOOH + 0.05 C3H6O2 + 0.05 G{CH4} + 0.2 G{H2} + 0.61 CHAR2.5 × 106 × exp(−18871/RT)
3CELLAC6H10O53.3 × T × exp(−10000/RT)
4CELL5 H2O + 6 CHAR6 × 107 × exp(−30618/RT)
Hemicellulose
5HECELL0.58 HCE1 + 0.42 HCE21 × 1010 × exp(−31000/RT)
6HCE10.6 C5H8O4 + 0.2 C3H6O2 + 0.12 C2H2O2 + 0.2 C5H4O2 + 0.4 H2O + 0.08 G{H2} + 0.16 CO3 × T × exp(−10618/RT)
7HCE10.4 H2O + 0.79 CO2 + 0.05 HCOOH + 0.69 CO + 0.01 G{CO} + 0.01 G{CO2} +0.35 G{H2} + 0.3 CH2O + 0.9 G{COH2} + 0.625 G{CH4} + 0.375 G{C2H4} + 0.875 CHAR1.8 × 10−3 × T × exp(−2618/RT)
8HCE20.2 H2O + 0.275 CO + 0.175 CO2 + 0.4 CH2O + 0.1 C2H5OH + 0.05 C2H4O2 + 0.35 CH3COOH + 0.025 HCOOH + 0.25 G{CH4} + 0.3 G{CH3OH} + 0.225 G{C2H4} + 0.4 G{CO2} + 0.725 G{COH2} + CHAR5 × 109 × exp(−31500/RT)
Lignins
9LIGC0.35 LIGCC + 0.1 C9H10O2 + 0.08 C6H5OH + 0.41 C2H4 + 1.0 H2O + 0.7 G{COH2} + 0.3 CH2O + 0.32 CO + 0.495 G{CH4} + 5.735 CHAR1 × 1011 × exp(−37200/RT)
10LIGHLIGOH + 0.5 C2H5CHO + 0.5 C2H4 + 0.2 C2H4O2 + 0.1 CO + 0.1 G{H2}6.7 × 10¹² × exp(−37500/RT)
11LIGOLIGOH + CO23.3 × 108 × exp(−25500/RT)
12LIGCC0.3 C9H10O2 + 0.2 C6H5OH + 0.35 C2H4O2 + 0.7 H2O + 0.65 CH4 + 0.6 C2H4 + H2 + 1.4 CO + 0.4 G{CO} + 6.75 CHAR1 × 104 × exp(−24800/RT)
13LIGOHLIG + 0.9 H2O + 0.1 CH4 + 0.6 CH3OH + 0.1 G{H2} + 0.3 G{CH3OH} + 0.05 CO2 + 0.55 CO + 0.6 G{CO} + 0.05 HCOOH + 0.85 G{COH2} + 0.35 G{CH4} + 0.2 G{C2H4} + 4.15 CHAR1 × 108 × exp(−30000/RT)
14LIG0.7 C11H12O4 + 0.3 C6H5OCH3 + 0.3 CO + 0.3 G{CO} + 0.3 CH3CHO4 × T × exp(−12000/RT)
15LIG0.6 H2O + 0.4 CO + 0.2 CH4 + 0.4 CH2O + 0.2 G{CO} + 0.4 G{CH4} + 0.5 G{C2H4} + 0.4 G{CH3OH} + 2 G{COH2} + 6 CHAR8.3 × 10−2 × T × exp(−8000/RT)
16LIG0.6 H2O + 2.6 CO + 1.1 CH4 + 0.4 CH2O + C2H4 + 0.4 CH3OH + 4.5 CHAR1 × 107 × exp(−24300/RT)
Extractive
17TGLC2H3CHO + 0.5 C13H22O2 + 2.5 C19H34O27 × 1012 × exp(−45700/RT)
Metaplastic
18G{CO2}CO21 × 10 6 × exp(−24000/RT)
19G{CO}CO5 × 10 12× exp(−50000/RT)
20G{COH2}CO + H21.5 × 10 12× exp(−71000/RT)
21G{H2}H25 × 10 11× exp(−75000/RT)
22G{CH4}CH45 × 10 12× exp(−71500/RT)
23G{CH3OH}CH3OH2 × 10 12 × exp(−50000/RT)
24G{C2H4}C2H45 × 10 12× exp(−71500/RT)
H2O Evaporation
25ACQUAH2O1 × T × exp(−8000/RT)
Table 7. Secondary tar cracking reactions.
ReactionsKinetic Parameters A(s−1), Ea(J/mol)
1CH2OH2 + CO1.2 × 105 × exp(−108000/RT)
2HCOOHH2 + CO21.2 × 105 × exp(−108000/RT)
3CH3OH1.5 H2 + 0.5 CO + 0.25 CO2 + 0.25 CH41.2 × 105 × exp(−108000/RT)
4C2H2O2H2 + 2 CO1.2 × 105 × exp(−108000/RT)
5CH3CHOCO + CH41.2 × 105 × exp(−108000/RT)
6CH3COOH1.5 H2 + 1.5 CO + 0.25 CO2 + 0.25 CH41.2 × 105 × exp(−108000/RT)
7C2H4O21.5 H2 + 1.5 CO + 0.25 CO2 + 0.25 CH41.2 × 105 × exp(−108000/RT)
8C2H5OHH2 + CO + CH41.2 × 105 × exp(−108000/RT)
9C2H3CHOCO + C2H41.2 × 105 × exp(−108000/RT)
10C2H5CHO0.5 CO2 + 0.5 CH4 + C2H41.2 × 105 × exp(−108000/RT)
11C3H6O2H2 + 2 CO + CH41.2 × 107 × exp(−108000/RT)
12C5H4O22 CO + C2H4 + C1.2 × 105 × exp(−108000/RT)
13C5H8O4H2 + 2 CO2 + 1.5 C2H41.2 × 105 × exp(−108000/RT)
14C6H5OHCO + 0.5 CH4 + C2H4 + 2.5 C1.2 × 105 × exp(−108000/RT)
15C6H6O33 CO + 1.5 C2H41.2 × 105 × exp(−108000/RT)
16C6H10O51.5 H2 + 2.5 CO2 + 1.75 C2H41.2 × 105 × exp(−108000/RT)
17C6H5OCH3CO + 2 C2H4 + 2 C1.2 × 105 × exp(−108000/RT)
18C9H10O22 CO + CH4 + 1.5 C2H4 + 3 C1.2 × 105 × exp(−108000/RT)
19C11H12O44 CO + 2 CH4 + C2H4 + 3 C1.2 × 105 × exp(−108000/RT)
20C13H22O22 CO + 5.5 C2H41.2 × 105 × exp(−108000/RT)
21C19H34O22 C2H3CHO + 6.5 C2H42.2 × 106 × exp(−108000/RT)
Publisher’s Note: MDPI stays neutral with regard to jurisdictional claims in published maps and institutional affiliations.

