Experimental Determination of the Influence of Shape on the Heat Transfer Process in a Crushed Granite Storage Bed


Abstract
:1. Introduction
- 6 h of charging [28]—test stand with rocks. Swedish diabase and magnetite were tested as the filling material, and the working medium was air.
- 8 h of charging [29]—laboratory test stand for testing the operation of the bed storage with parameters as in the case of concentrated solar power plants when combined with the Brayton cycle. The working medium was air.
- 8 h of charging [30]—the potential of quartzite and flint rocks as filler materials was investigated experimentally.
- 6 h [23]—charging of a rock bed. The research covered issues related to air distribution during charging and discharging.
- 8 h [31]—charging of a bed storage intended for a solar thermal power plant. The working medium was air.
- 8 h [32]—charging the bed storage of a solar thermal power plant. The authors conducted thermodynamic modelling and performed exergy analysis. They used air.
2. Materials and Methods
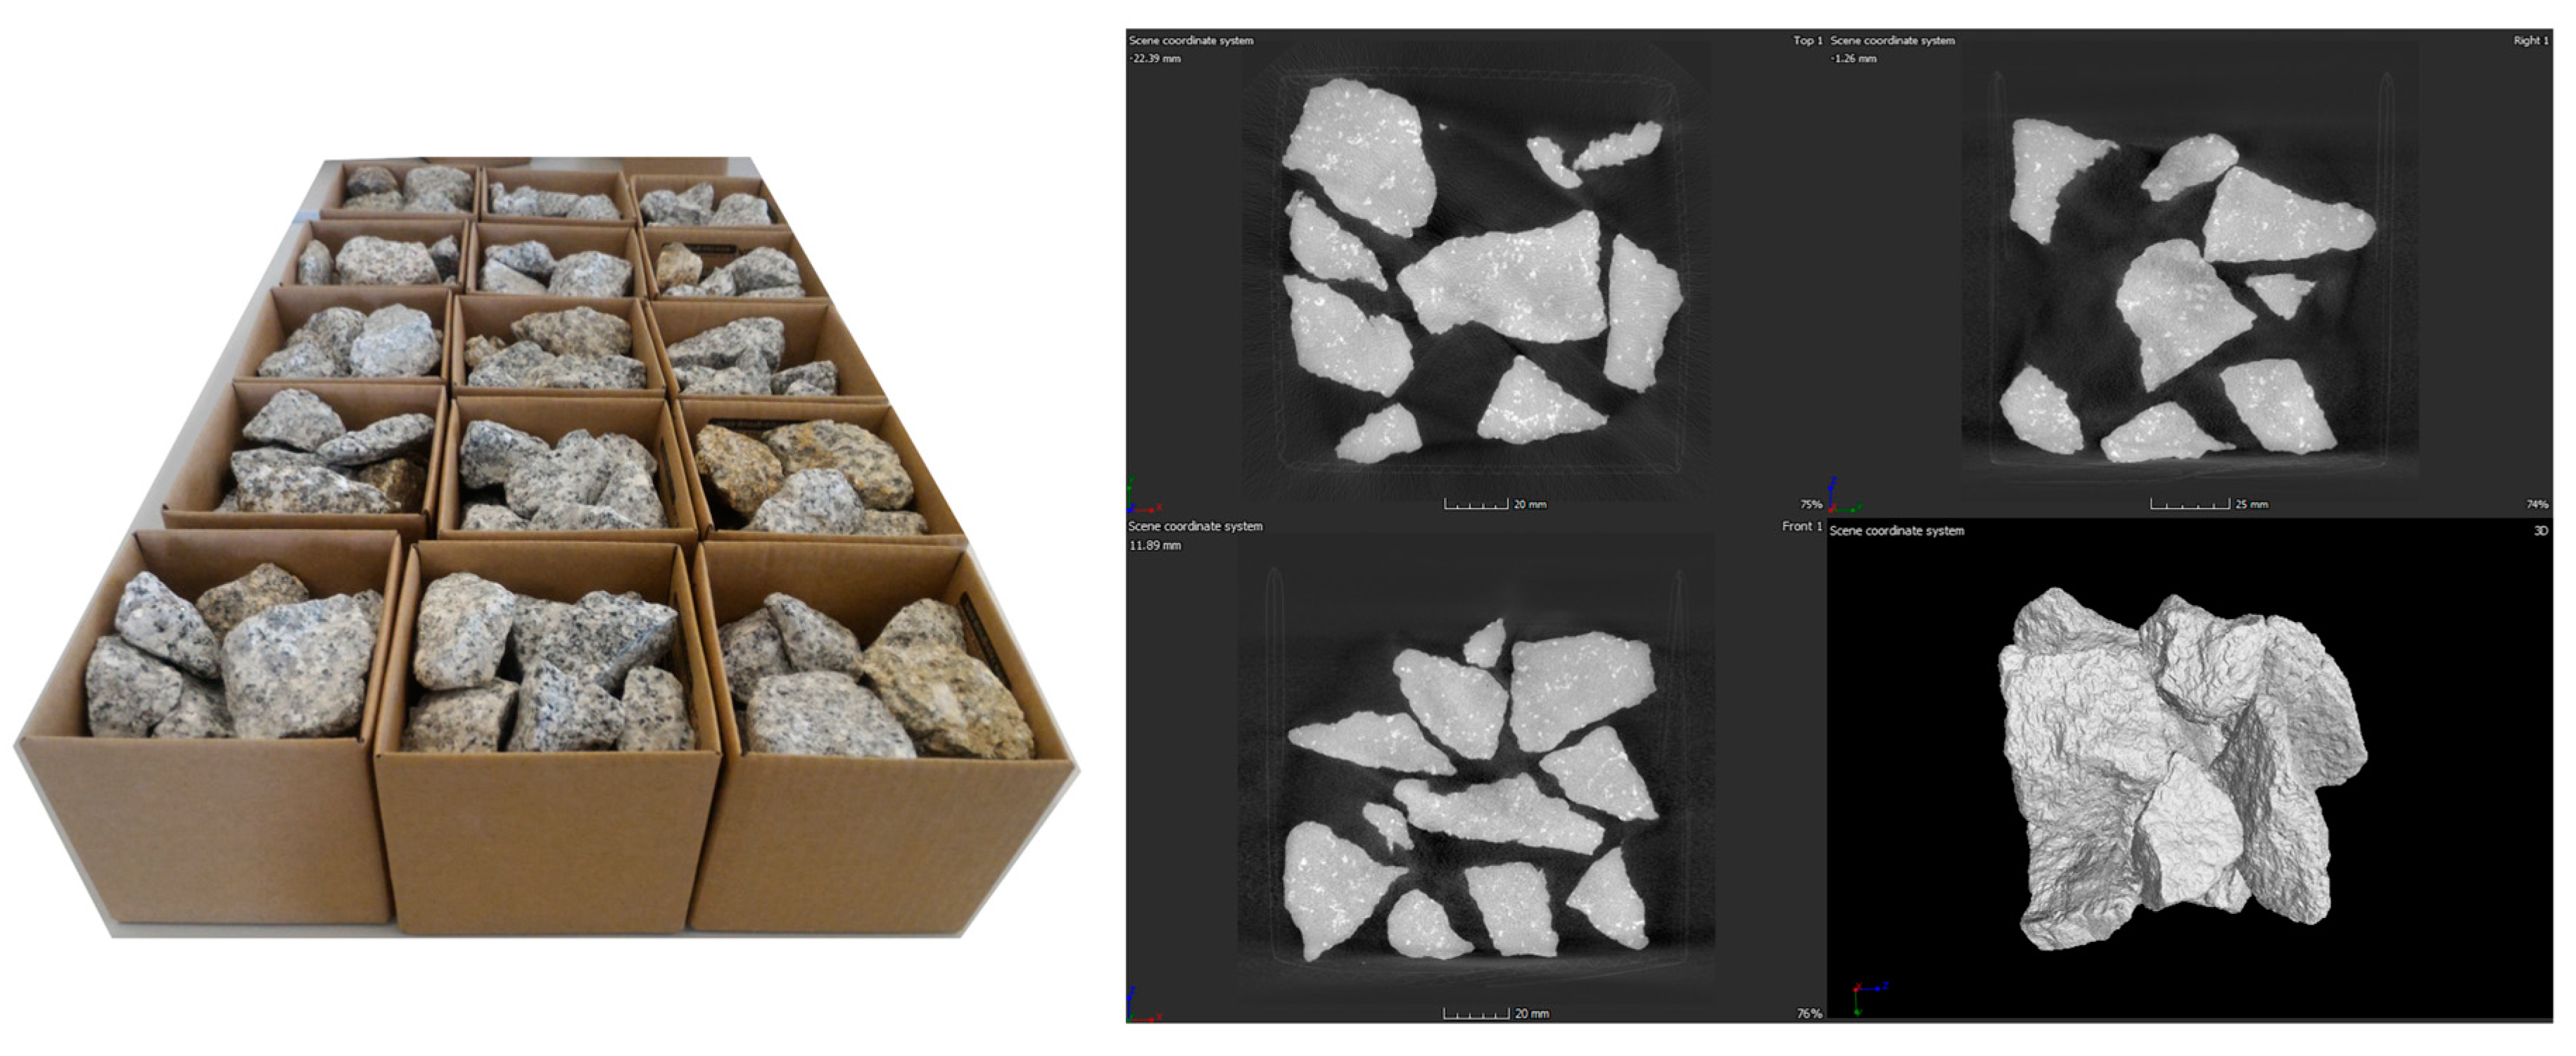
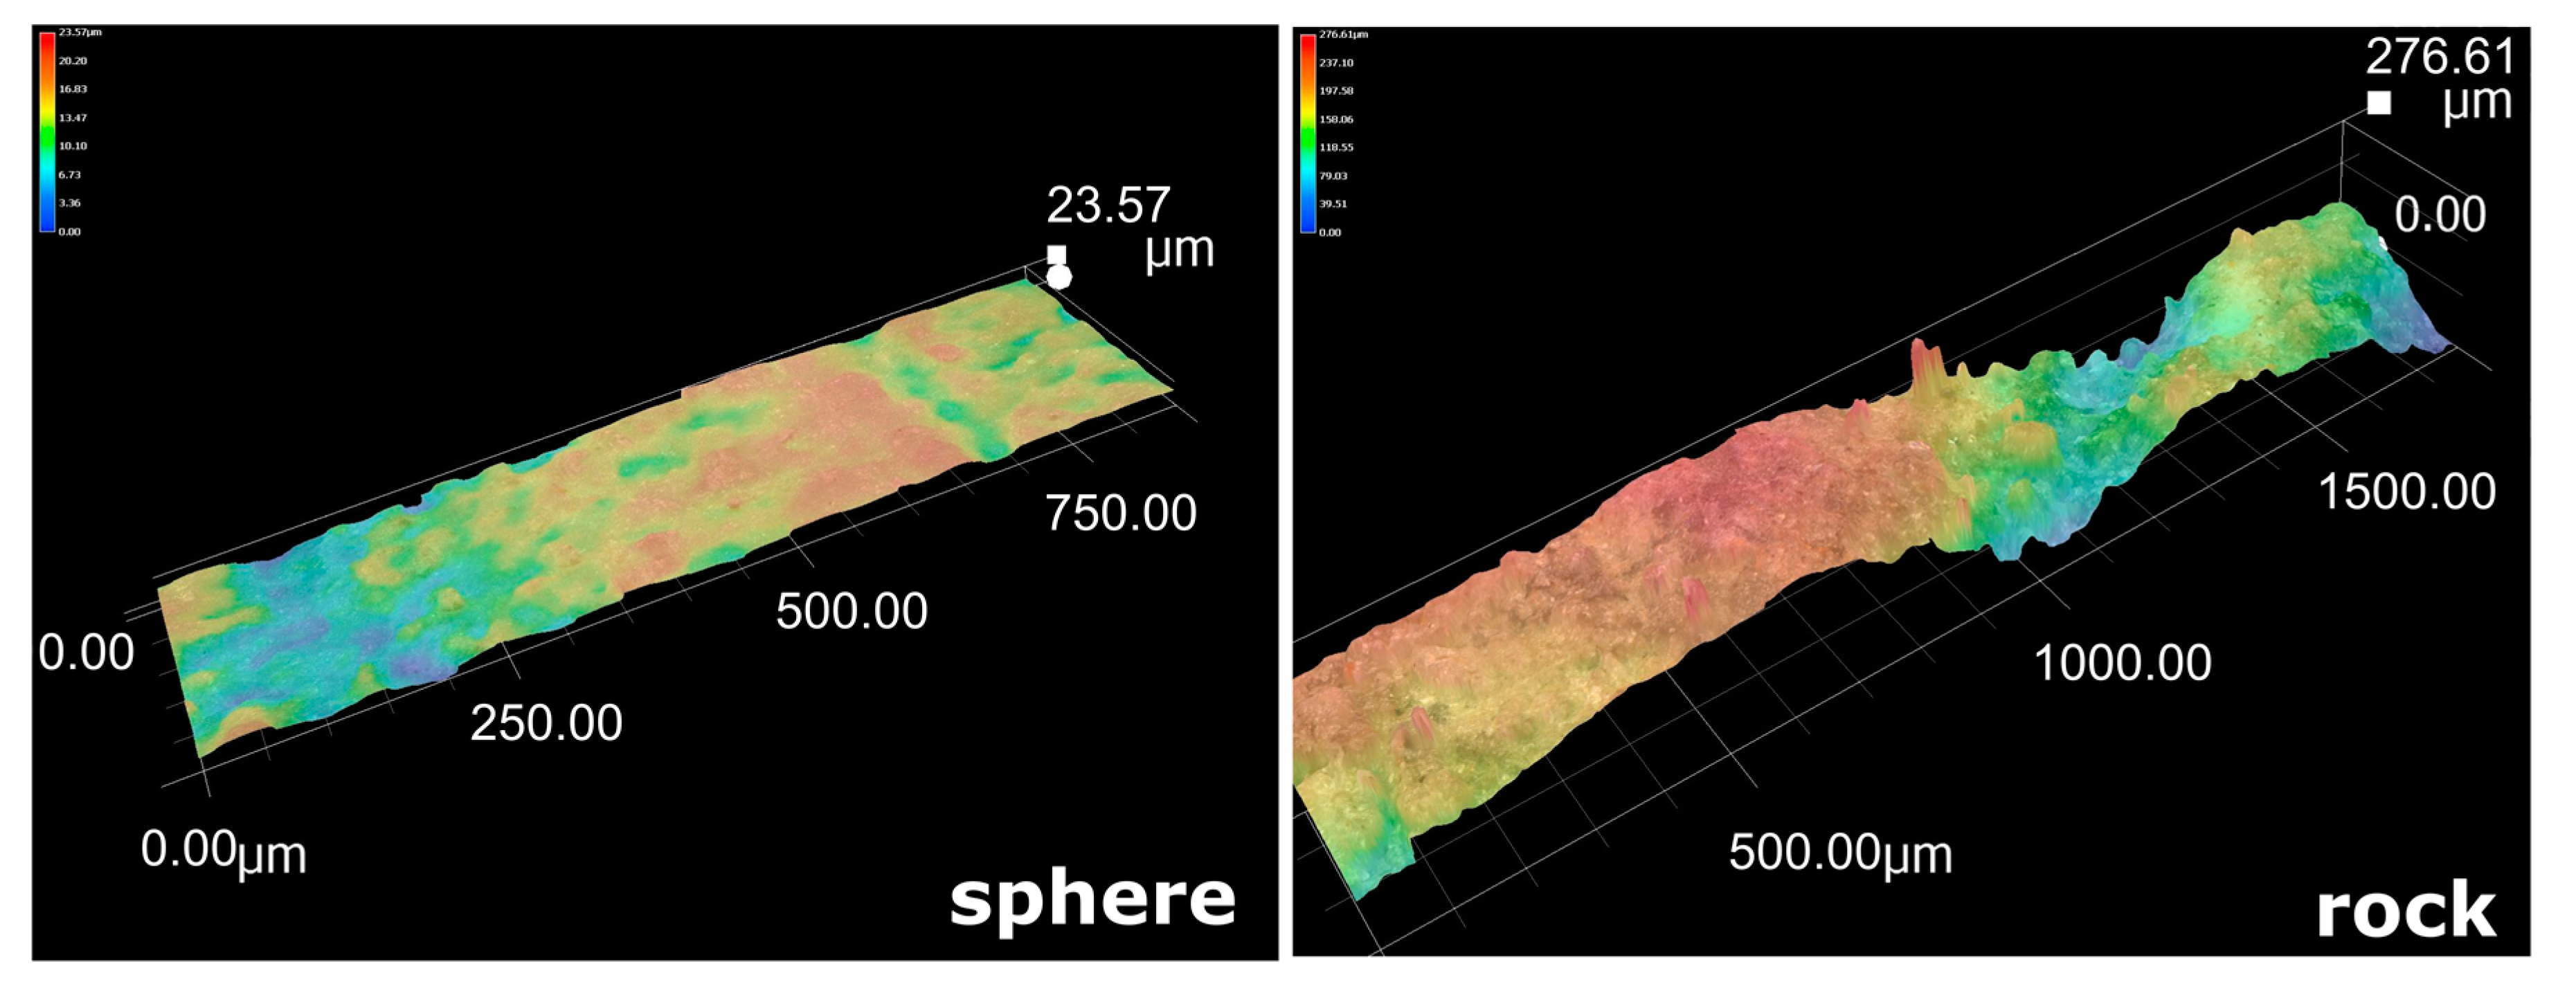
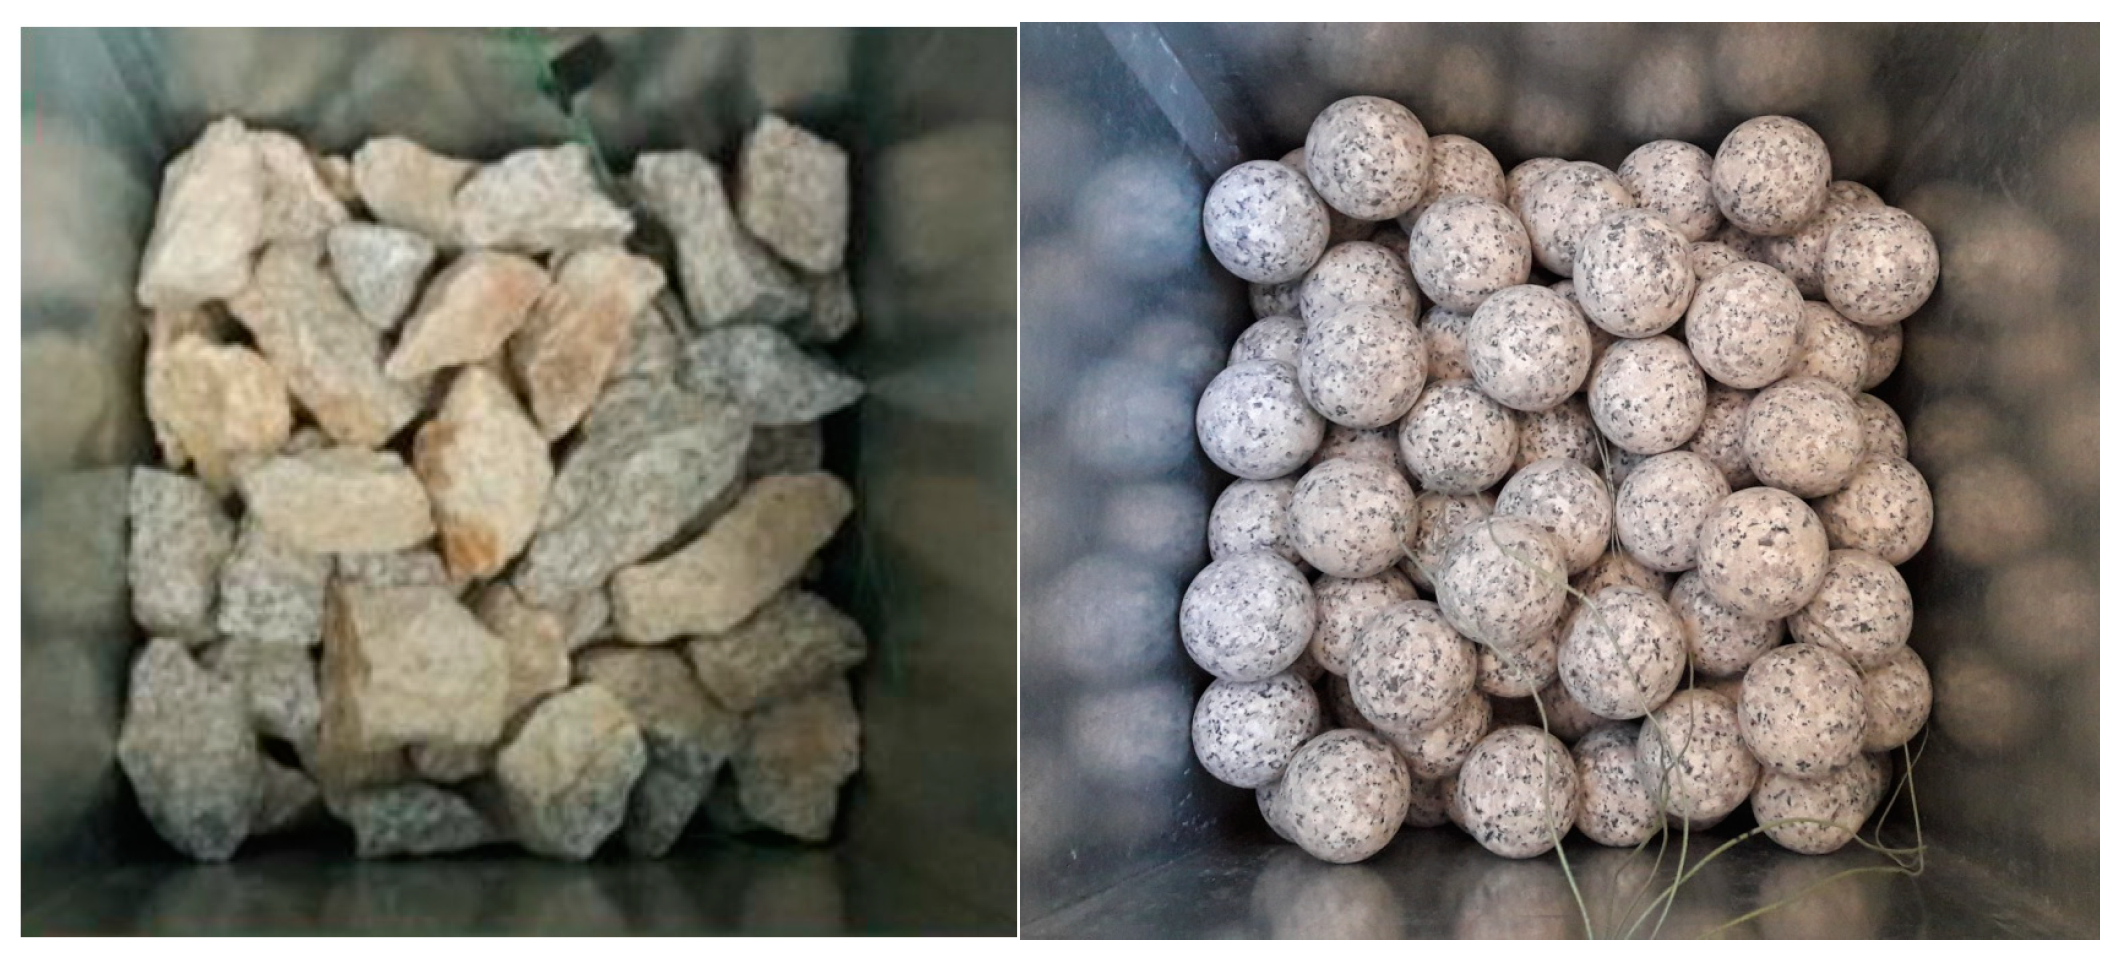
2.1. Preparation of the Material for Research
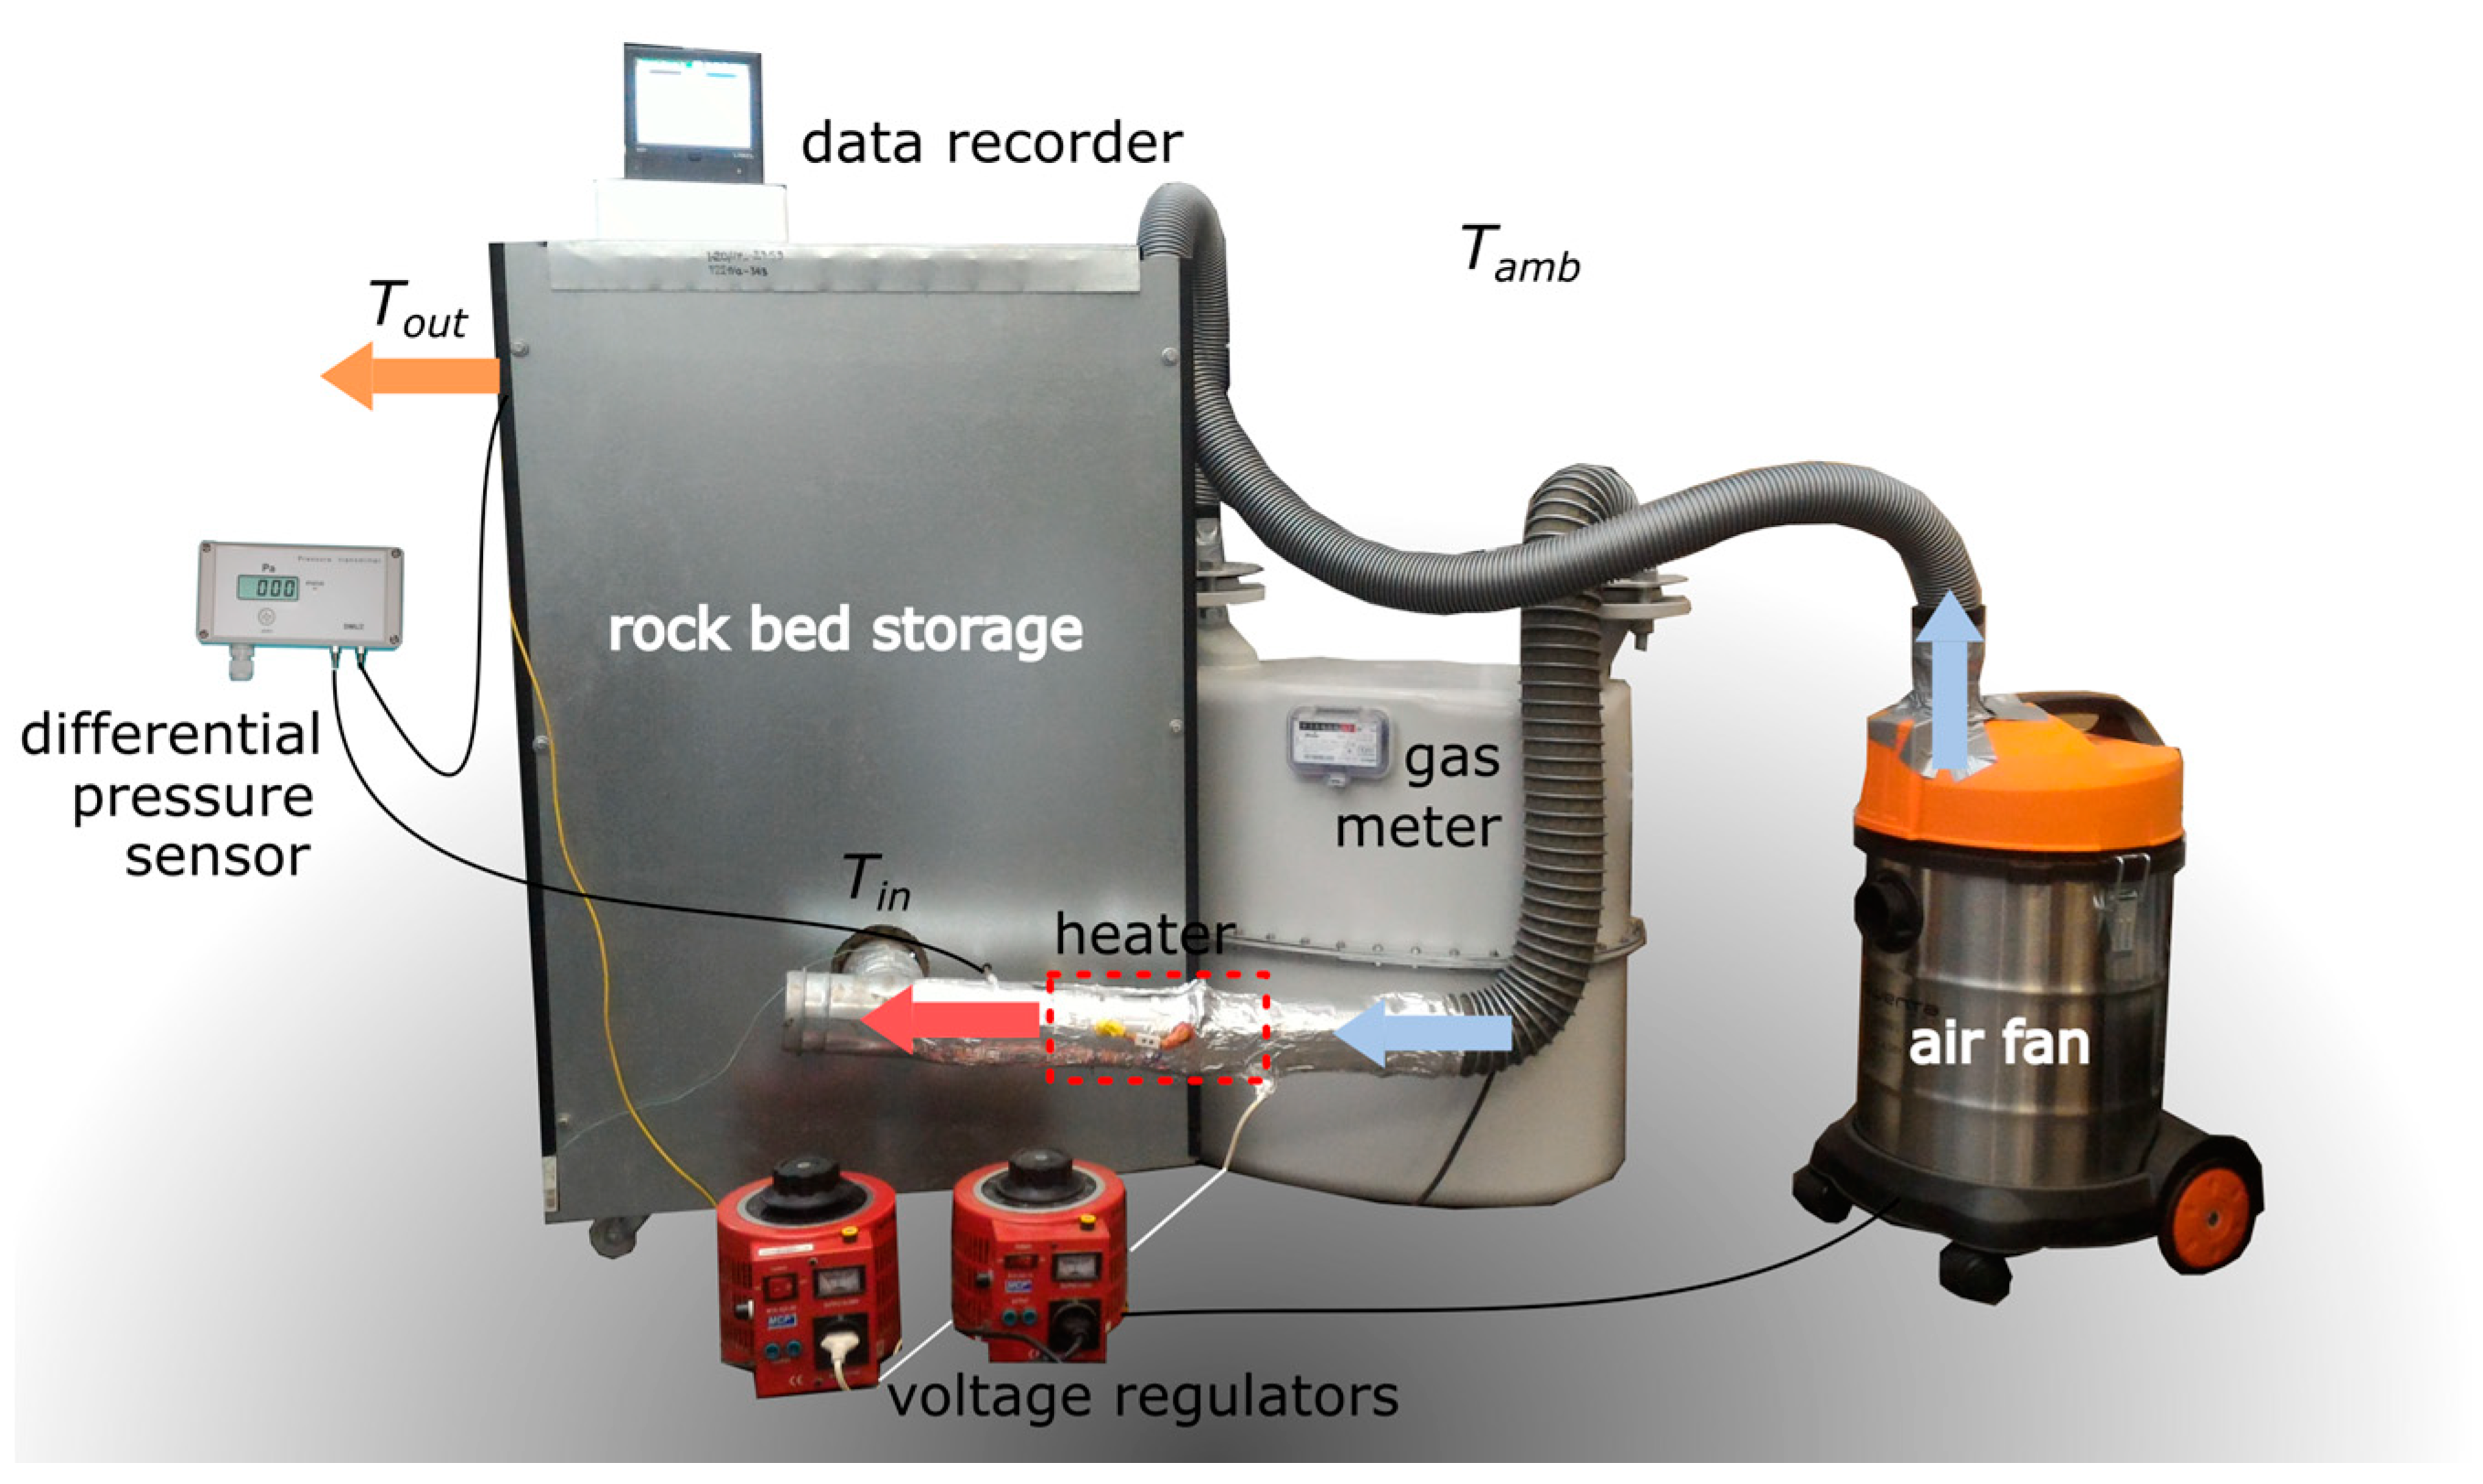
2.2. Test Stand and Experimental Research
2.3. Determination of the Characteristic Numbers
3. Results
4. Discussion and Conclusions
Funding
Conflicts of Interest
References
- Gautam, A.; Saini, R.P. A review on technical, applications and economic aspect of packed bed solar thermal energy storage system. J. Energy Storage 2020, 27, 101046. [Google Scholar] [CrossRef]
- Ergun, S.; Orning, A.A. Fluid Flow through Randomly Packed Columns and Fluidized Beds. Ind. Eng. Chem. 1949. [Google Scholar] [CrossRef]
- Esence, T.; Bruch, A.; Molina, S.; Stutz, B.; Fourmigué, J.F. A review on experience feedback and numerical modeling of packed-bed thermal energy storage systems. Sol. Energy 2017, 153, 628–654. [Google Scholar] [CrossRef]
- Koçak, B.; Fernandez, A.I.; Paksoy, H. Review on sensible thermal energy storage for industrial solar applications and sustainability aspects. Sol. Energy 2020, 209, 135–169. [Google Scholar] [CrossRef]
- Atalay, H. Assessment of energy and cost analysis of packed bed and phase change material thermal energy storage systems for the solar energy-assisted drying process. Sol. Energy 2020, 198, 124–138. [Google Scholar] [CrossRef]
- Palacios, A.; Barreneche, C.; Navarro, M.E.; Ding, Y. Thermal energy storage technologies for concentrated solar power—A review from a materials perspective. Renew. Energy 2020, 156, 1244–1265. [Google Scholar] [CrossRef]
- Kumar, A.; Kim, M.H. Solar air-heating system with packed-bed energy-storage systems. Renew. Sustain. Energy Rev. 2017, 72, 215–227. [Google Scholar] [CrossRef]
- Mohana, Y.; Mohanapriya, R.; Anukiruthika, T.; Yoha, K.S.; Moses, J.A.; Anandharamakrishnan, C. Solar dryers for food applications: Concepts, designs, and recent advances. Sol. Energy 2020, 208, 321–344. [Google Scholar] [CrossRef]
- Bazgaou, A.; Fatnassi, H.; Bouharroud, R.; Elame, F.; Ezzaeri, K.; Gourdo, L.; Wifaya, A.; Demrati, H.; Tiskatine, R.; Bekkaoui, A.; et al. Performance assessment of combining rock-bed thermal energy storage and water filled passive solar sleeves for heating Canarian greenhouse. Sol. Energy 2020, 198, 8–24. [Google Scholar] [CrossRef]
- König-Haagen, A.; Höhlein, S.; Brüggemann, D. Detailed exergetic analysis of a packed bed thermal energy storage unit in combination with an Organic Rankine Cycle. Appl. Therm. Eng. 2020, 165, 114583. [Google Scholar] [CrossRef]
- Singh, H.; Saini, R.P.; Saini, J.S. A review on packed bed solar energy storage systems. Renew. Sustain. Energy Rev. 2010, 14, 1059–1069. [Google Scholar] [CrossRef]
- Berrhazi, S.; Ouammi, A.; Benchrifa, R. Thermo-physical effect of solid filler on the performance of a packed-bed thermal storage. Therm. Sci. Eng. Prog. 2020, 20, 100716. [Google Scholar] [CrossRef]
- Gautam, A.; Saini, R.P. Experimental investigation of heat transfer and fluid flow behavior of packed bed solar thermal energy storage system having spheres as packing element with pores. Sol. Energy 2020, 204, 530–541. [Google Scholar] [CrossRef]
- Nemś, M.; Nemś, A.; Pacyga, P. A granite bed storage for a small solar dryer. Materials 2018, 11, 1969. [Google Scholar] [CrossRef] [PubMed] [Green Version]
- Nemś, M.; Nemś, A.; Gębarowska, K. The Influence of the Shape of Granite on the Heat Storage Process in a Rock Bed. Energies 2020, 13, 5662. [Google Scholar] [CrossRef]
- Ranz, W.E.; Marshall, W.R. Evaporation from drops. Parts I & II. Chem. Eng. Prog. 1952. [Google Scholar] [CrossRef]
- Melissari, B.; Argyropoulos, S.A. Development of a heat transfer dimensionless correlation for spheres immersed in a wide range of Prandtl number fluids. Int. J. Heat Mass Transf. 2005, 48, 4333–4341. [Google Scholar] [CrossRef]
- Kunii, D.; Levenspiel, O. Fluidization Engineering, 2nd ed.; Elsevier: Amsterdam, The Netherlands, 1991; ISBN 0-409-90233-0. [Google Scholar]
- Singh, R.; Saini, R.P.; Saini, J.S. Nusselt number and friction factor correlations for packed bed solar energy storage system having large sized elements of different shapes. Sol. Energy 2006, 80, 760–771. [Google Scholar] [CrossRef]
- Singh, H.; Saini, R.P.; Saini, J.S. Performance of a packed bed solar energy storage system having large sized elements with low void fraction. Sol. Energy 2013, 87, 22–34. [Google Scholar] [CrossRef]
- Allen, K.G.; von Backström, T.W.; Kröger, D.G. Rock bed pressure drop and heat transfer: Simple design correlations. Sol. Energy 2015, 115, 525–536. [Google Scholar] [CrossRef]
- Allen, K.G.; von Backström, T.W.; Kröger, D.G. Packed bed pressure drop dependence on particle shape, size distribution, packing arrangement and roughness. Powder Technol. 2013, 246, 590–600. [Google Scholar] [CrossRef]
- Barton, N.G. Simulations of air-blown thermal storage in a rock bed. Appl. Therm. Eng. 2013, 55, 43–50. [Google Scholar] [CrossRef]
- De la Beaujardiere, J.-F.P.; von Backström, T.W.; Reuter, H.C.R. Applicability of the local thermal equilibrium assumption in the performance modelling of CSP plant rock bed thermal energy storage systems. J. Energy Storage 2018, 15, 39–56. [Google Scholar] [CrossRef]
- Soprani, S.; Marongiu, F.; Christensen, L.; Alm, O.; Petersen, K.D.; Ulrich, T.; Engelbrecht, K. Design and testing of a horizontal rock bed for high temperature thermal energy storage. Appl. Energy 2019, 251, 113345. [Google Scholar] [CrossRef]
- Hailu, G.; Hayes, P.; Masteller, M. Long-term monitoring of sensible thermal storage in an extremely cold region. Energies 2019, 12, 1821. [Google Scholar] [CrossRef] [Green Version]
- Allen, K.G.; Von Backström, T.W.; Kröger, D.G.; Kisters, A.F.M. Rock bed storage for solar thermal power plants: Rock characteristics, suitability, and availability. Sol. Energy Mater. Sol. Cells 2014, 126, 170–183. [Google Scholar] [CrossRef]
- Marongiu, F.; Soprani, S.; Engelbrecht, K. Modeling of high temperature thermal energy storage in rock beds—Experimental comparison and parametric study. Appl. Therm. Eng. 2019, 163, 114355. [Google Scholar] [CrossRef]
- Yang, B.; Bai, F.; Wang, Y.; Wang, Z. Study on standby process of an air-based solid packed bed for flexible high-temperature heat storage: Experimental results and modelling. Appl. Energy 2019, 238, 135–146. [Google Scholar] [CrossRef]
- Jemmal, Y.; Zari, N.; Maaroufi, M. Experimental characterization of siliceous rocks to be used as filler materials for air-rock packed beds thermal energy storage systems in concentrated solar power plants. Sol. Energy Mater. Sol. Cells 2017, 171, 33–42. [Google Scholar] [CrossRef]
- Heller, L.; Gauché, P. Modeling of the rock bed thermal energy storage system of a combined cycle solar thermal power plant in South Africa. Sol. Energy 2013, 93, 345–356. [Google Scholar] [CrossRef]
- Ozturk, M.; Dincer, I.; Javani, N. Thermodynamic modeling of a solar energy based combined cycle with rock bed heat storage system. Sol. Energy 2020, 200, 51–60. [Google Scholar] [CrossRef]
- Tuttle, J.F.; White, N.; Mohammadi, K.; Powell, K. A novel dynamic simulation methodology for high temperature packed-bed thermal energy storage with experimental validation. Sustain. Energy Technol. Assess. 2020, 42, 100888. [Google Scholar] [CrossRef]
- Esence, T.; Bruch, A.; Fourmigué, J.F.; Stutz, B. A versatile one-dimensional numerical model for packed-bed heat storage systems. Renew. Energy 2019, 133, 190–204. [Google Scholar] [CrossRef]
- Nemś, M.; Kasperski, J. Experimental investigation of concentrated solar air-heater with internal multiple-fin array. Renew. Energy 2016, 97. [Google Scholar] [CrossRef]
- Bellos, E.; Tzivanidis, C. Alternative designs of parabolic trough solar collectors. Prog. Energy Combust. Sci. 2019, 71, 81–117. [Google Scholar] [CrossRef]
- Kalinowski, E. Termodynamika; Wydawnictwo Politechniki Wrocławskiej: Wrocław, Poland, 1994; ISBN 83-7085-063-4. (In Polish) [Google Scholar]
- Cengel, Y.A. Heat Transfer: A Practical Approach, 2nd ed.; McGraw-Hill: New York, NY, USA, 2002; ISBN 9780072458930. [Google Scholar]
- Cengel, Y.A.; Boles, M.A. Thermodynamics: An Engineering Approach, 8th ed.; McGraw-Hill: New York, NY, USA, 2014; ISBN 9780073398174. [Google Scholar]
- Wakao, N.; Funazkri, T. Effect of fluid dispersion coefficients on particle-to-fluid mass transfer coefficients in packed beds. Correlation of sherwood numbers. Chem. Eng. Sci. 1978, 33, 1375–1384. [Google Scholar] [CrossRef]
- Beek, J. Design of Packed Catalytic Reactors. Adv. Chem. Eng. 1962. [Google Scholar] [CrossRef]
- Gupta, A.S.; Thodos, G. Mass and heat transfer in the flow of fluids through fixed and fluidized beds of spherical particles. AIChE J. 1962, 8, 608–610. [Google Scholar] [CrossRef]
- Gupta, S.N.; Chaube, R.B.; Upadhyay, S.N. Fluid-particle heat transfer in fixed and fluidized beds. Chem. Eng. Sci. 1974, 29, 839–843. [Google Scholar] [CrossRef]
- Nield, D.A.; Bejan, A. Convection in Porous Media, 3rd ed.; Springer: New York, NY, USA, 2006; ISBN 9780387290966. [Google Scholar]
- Beasley, D.E.; Clark, J.A. Transient response of a packed bed for thermal energy storage. Int. J. Heat Mass Transf. 1984. [Google Scholar] [CrossRef] [Green Version]
- Kostowski, E. Zbiór Zadań z Przepływu Ciepła; Wydawnictwo Politechniki Śląskiej: Gliwice, Poland, 2006; ISBN 83-88000-18-7. (In Polish) [Google Scholar]
- Domański, R. Magazynowanie Energii Cieplnej; Państwowe Wydawnictwo Naukowe: Warsaw, Poland, 1990; ISBN 8301093978. (In Polish) [Google Scholar]


| Shape of Material | Equivalent Diameter | Surface Area |
|---|---|---|
| sphere | 0.05 m | 0.00785 m2 |
| crushed rock (treated as a sphere) | 0.05 m | 0.00785 m2 |
| crushed rock | 0.05 m | 0.010983 m2 |
| Rock bed | Internal height | 0.5 m |
| Internal thickness | 0.3 m | |
| Internal length | 0.3 m | |
| Storage material | Equivalent sphere diameter | 0.50 m |
| Number of elements | 230 | |
| Mass | 40.02 kg | |
| Air | Inlet temperature | 110 °C |
| Volumetric flow rate 1 | 0.0060 m3/s | |
| Volumetric flow rate 2 | 0.0080 m3/s | |
| Volumetric flow rate 3 | 0.0100 m3/s | |
| Insulation | Top insulation thickness | 0.20 m |
| Bottom insulation thickness | 0.15 m | |
| Side insulation thickness | 0.15 m | |
| Thermal conductivity | 0.039 W/(m·K) |
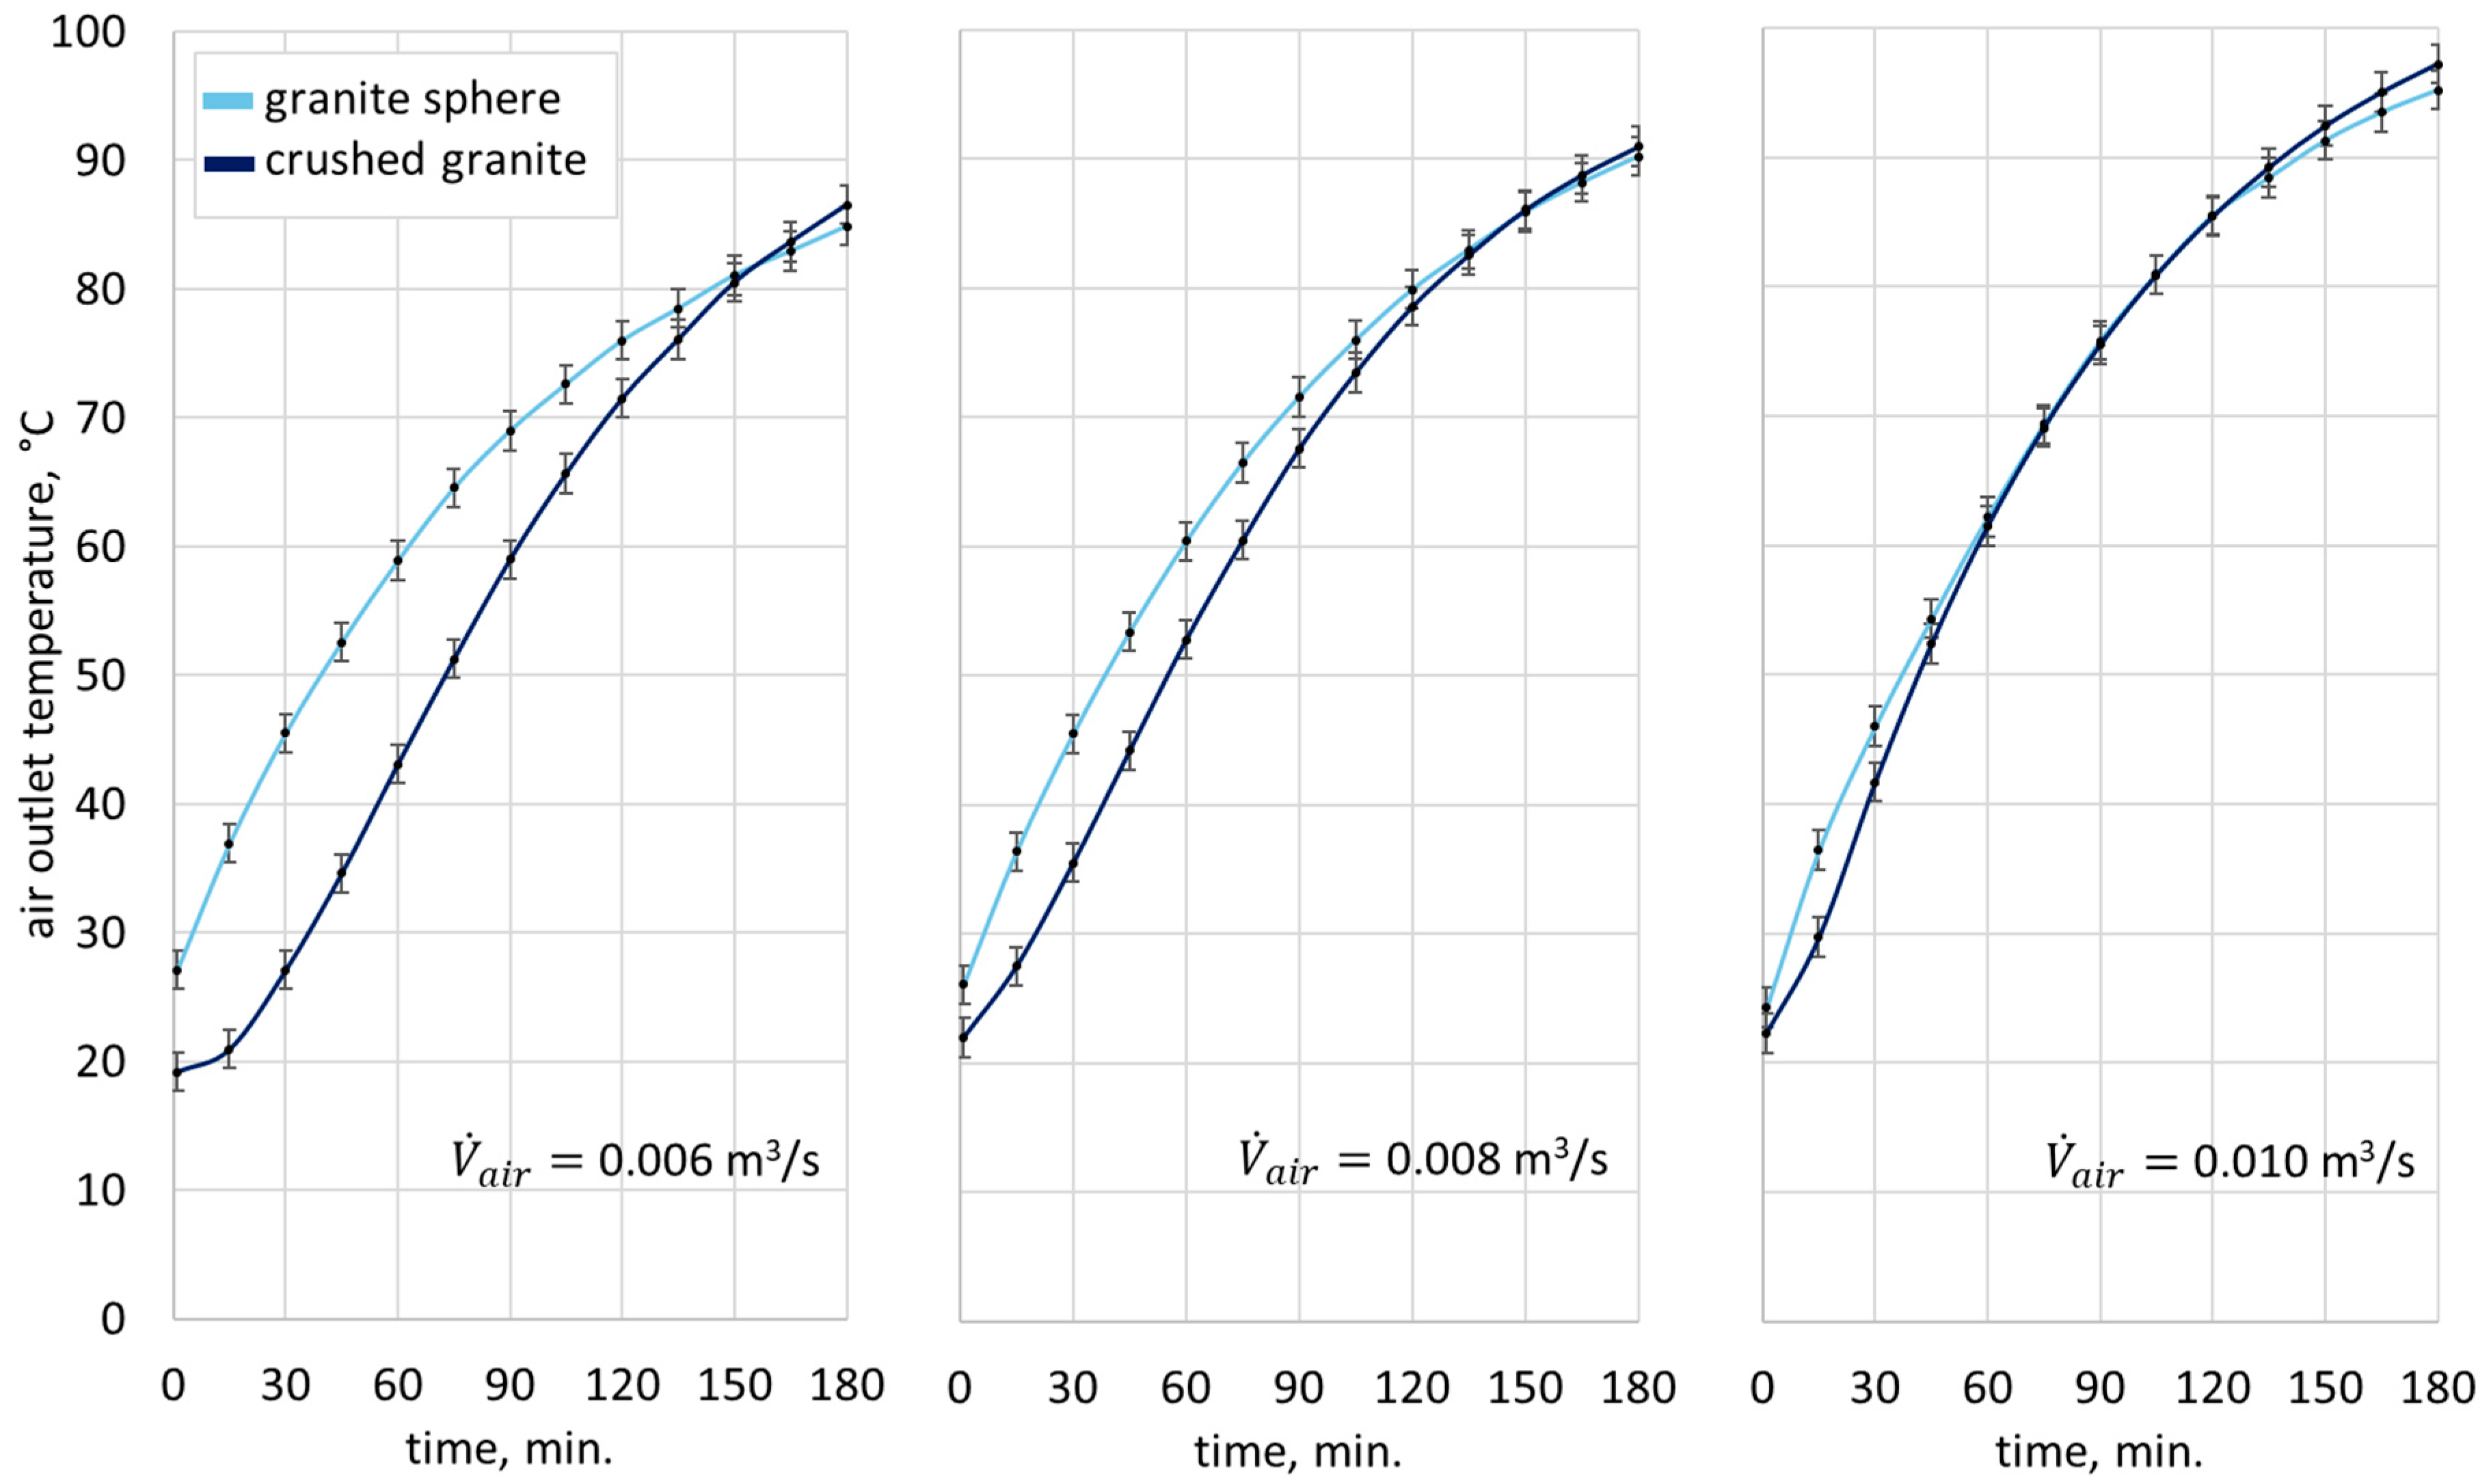
| Volumetric Flow Rate, m3/s | Shape of Material | Initial Temperature, °C |
|---|---|---|
| 0.006 | granite sphere | 19.1 |
| crushed granite | 19.0 | |
| 0.008 | granite sphere | 21.6 |
| crushed granite | 20.8 | |
| 0.010 | granite sphere | 19.0 |
| crushed granite | 19.2 |
| Volumetric Flow Rate, m3/s | Shape | Final Temperature, °C |
|---|---|---|
| 0.006 | granite sphere | 63.4 |
| crushed granite | 79.4 | |
| 0.008 | granite sphere | 80.6 |
| crushed granite | 90.5 | |
| 0.010 | granite sphere | 89.2 |
| crushed granite | 96.9 |
| No. | Dimensionless Equation | Notes | Ref. | |
|---|---|---|---|---|
| 1 | (16) | 100 ≤ Re Pr for typical gases and liquids | [16] | |
| 2 | (17) | 15 ≤ Re ≤ 8500 | [40] | |
| 3 | (18) | 40 < Re | [41] | |
| 4 | (19) | 20 < Re | [42] | |
| 5 | (20) | 10 < Reeq | [43] | |
| 6 | (21) | Re ≤ 2400 | [44] | |
| 7 | (22) | 60 ≤ Re | [45] | |
| 8 | (23) | 1 ≤ Re ≤ 70,000 0.6 ≤ Pr ≤ 400 | [46] | |
| 9 | (24) | 500 ≤ Re ≤ 50,000 | [45] | |
| 10 | (25) | - | [47] | |
| 11 | (26) | [19] | ||
Publisher’s Note: MDPI stays neutral with regard to jurisdictional claims in published maps and institutional affiliations. |
© 2020 by the author. Licensee MDPI, Basel, Switzerland. This article is an open access article distributed under the terms and conditions of the Creative Commons Attribution (CC BY) license (http://creativecommons.org/licenses/by/4.0/).
Share and Cite
Nemś, M. Experimental Determination of the Influence of Shape on the Heat Transfer Process in a Crushed Granite Storage Bed. Energies 2020, 13, 6725. https://doi.org/10.3390/en13246725
Nemś M. Experimental Determination of the Influence of Shape on the Heat Transfer Process in a Crushed Granite Storage Bed. Energies. 2020; 13(24):6725. https://doi.org/10.3390/en13246725
Chicago/Turabian StyleNemś, Magdalena. 2020. "Experimental Determination of the Influence of Shape on the Heat Transfer Process in a Crushed Granite Storage Bed" Energies 13, no. 24: 6725. https://doi.org/10.3390/en13246725