Article

Numerical Analysis for Hydrogen Flame Acceleration during a Severe Accident in the APR1400 Containment Using a Multi-Dimensional Hydrogen Analysis System

Korea Atomic Energy Research Institute, Daejeon 34057, Korea
*
Author to whom correspondence should be addressed.
Energies 2020, 13(22), 6151; https://doi.org/10.3390/en13226151
Submission received: 16 October 2020 / Revised: 18 November 2020 / Accepted: 19 November 2020 / Published: 23 November 2020
(This article belongs to the Special Issue Advances in Hydrogen Safety)

Abstract

:
Korea Atomic Energy Research Institute (KAERI) established a multi-dimensional hydrogen analysis system to evaluate hydrogen release, distribution, and combustion in the containment of a Nuclear Power Plant (NPP), using MAAP, GASFLOW, and COM3D. In particular, KAERI developed an analysis methodology for a hydrogen flame acceleration, on the basis of the COM3D validation results against measured data of the hydrogen combustion tests in the ENACCEF and THAI facilities. The proposed analysis methodology accurately predicted the peak overpressure with an error range of approximately ±10%, using the Kawanabe model used for a turbulent flame speed in the COM3D. KAERI performed a hydrogen flame acceleration analysis using the multi-dimensional hydrogen analysis system for a severe accident initiated by a station blackout (SBO), under the assumption of 100% metal–water reaction in the Reactor Pressure Vessel (RPV), to evaluate an overpressure buildup in the containment of the Advanced Power Reactor 1400 MWe (APR1400). The magnitude of the overpressure buildup in the APR1400 containment might be used as a criterion to judge whether the containment integrity is maintained or not, when the hydrogen combustion occurs during a severe accident. The COM3D calculation results using the established analysis methodology showed that the calculated peak pressure in the containment was lower than the fracture pressure of the APR1400 containment. This calculation result might have resulted from a large air volume of the containment, a reduced hydrogen concentration owing to passive auto-catalytic recombiners installed in the containment during the hydrogen release from the RPV, and a lot of stem presence during the hydrogen combustion period in the containment. Therefore, we found that the current design of the APR1400 containment maintained its integrity when the flame acceleration occurred during the severe accident initiated by the SBO accident.

1. Introduction

There is extensive research on the possibility of a hydrogen explosion, and of a safety device to reduce the hydrogen concentration in the containment of a Nuclear Power Plant (NPP) in the Republic of Korea, since the hydrogen explosion accident of the NPP in Fukushima in 2011 [1,2]. Thus, Passive Auto-catalytic Recombiners (PARs) were additionally installed in all NPP containments, to reduce hydrogen concentration during a severe accident in the Republic of Korea [1]. A total of 30 PARS were installed in the Advanced Power Reactor 1400 MWe (APR1400), which had an air-free volume of 88,575 m3 and an opening connection between important compartments in the containment [3,4]. However, the calculation result of a hydrogen distribution, assuming 100% metal–water reaction and uncertainty of a hydrogen generation model during the severe accident initiated by a station blackout accident (SBO) in the APR1400, showed that hydrogen concentration is higher than approximately 10% at a local position for an instant time in the containment [3]. Thus, to assure containment integrity, it is necessary to evaluate an overpressure buildup resulting from a propagation of hydrogen flame along the obstacle, and to wall in containment during severe accidents in the APR1400 by the multi-dimensional hydrogen analysis system.
Korea Atomic Energy Research Institute (KAERI) chose the COM3D [5] as the computational code for calculating the overpressure buildup, owing to the hydrogen flame acceleration, by evaluating its numerical methods, physical models, a solver algorithm, validation and application results, and its ability to connect an analysis code of a hydrogen distribution in the containment. KAERI finally established a multi-dimensional hydrogen analysis system for evaluating a hydrogen release, distribution, and combustion in the containment of an NPP, using MAAP, GASFLOW, and COM3D [6]. The GASFLOW calculates the hydrogen distribution in the containment with a hydrogen source evaluated by the MAAP during severe accidents [7,8]. The COM3D can analyze the overpressure buildup resulting from the containment with the hydrogen distribution result calculated by the GASFLOW. It is necessary to evaluate an uncertainty of the COM3D code using experimental data, such as hydrogen combustion tests conducted in the ENACCEF and THAI facilities [9,10,11,12], before applying it to the hydrogen combustion during a severe accident in the APR1400 containment. In addition, a proper test data for the COM3D validation should be chosen by considering the hydrogen and steam concentrations predicted by the GASFLOW and the geometric characteristics of the APR1400 containment to increase the credibility of the COM3D code.

2. Analysis Methodology for Hydrogen Flame Acceleration

2.1. Numerical Models in the COM3D Version 4.10

The COM3D version 4.10 is a fully explicit finite-differences code on the basis of the well-established numerical methods for solving the compressible Navier–Stokes equation in three-dimensional Cartesian space. The COM3D utilizes a set of transport equations for every gas species and for the total energy, mass, and momentum (Equations (1)–(7)). The term of M i j x j in Equations (2) and (3) represents a diffusion phenomenon due to the viscous stress. The total energy e in Equation (3) is defined as a sum of internal energy and kinetic energy, as shown in Equation (6). In the gas species equation (Equation (5)), ω ¯ α represents a source or sink of α species during the chemical reaction of hydrogen and air.
ρ t + x i ρ U i = 0
ρ U i t + x j ρ U i U j = P x i + ρ g i + M i j x j
ρ e t + x j ρ e + p U j = ρ g j U j + U i M i j x j + x j μ t u r C h x j e 1 2 U i U i + P ρ + B + ρ ε
M i j = 2 3 δ i j ρ k + μ t u r U r x r + μ t u r U i x j + U j x i
ρ Y α t + x j ρ Y α U j = ω ¯ α + x j μ t u r C f α Y α x j
e = α = 1 N Y α μ α h α + Δ h α 0 R T + 1 2 U i U j
Y α = ρ α ρ
To model a turbulence flow during the hydrogen combustion, the standard k-ε model (Equations (8)–(12)) implemented in the COM3D code is used [13]; here, Cμ = 0.09, C1 = 1.44, C2 = 1.92, Ck = 1.0, and Cε = 1.3. The standard k-ε model might be used as a practical tool to calculate a turbulent flow in the hydrogen combustion, when considering its accuracy and calculation time [14,15].
ρ k t + x j ρ k U j = S ρ ε + x j μ t u r C k k x j
ρ ε t + x j ρ ε U j = ε k C 1 S C 2 ρ ε + x j μ t u r C k ε x j
S = U i x j M i j B
μ t u r = μ + C μ ρ k 2 ε
B = μ t u r C ρ 1 ρ 2 ρ x r P x r
The COM3D recently developed a combustion model KYLCOM+, which uses the forest fire algorithm with the burning velocity model for calculating the hydrogen flame propagation. The burning velocity model uses the transport equation of a progressive variable f, such as Equation (13). The variable f = 0 means a fresh mixture gas, whereas f = 1 means a completely developed reaction. A source term (Ф) to account for the flame propagation owing to a turbulent flow is shown in the transport equation (Equations (13) and (14)). A burning criterion, Fi,j,k (Equation (15)), is used to judge the flame propagation from a burned cell to neighbor cells in the computational domain. If the calculated Fi,j,k in the cell is larger than (1/2)2, the flame starts to move from the burned cell to its neighbor cells.
ρ f t + ρ u i f x i = x i ρ D t f x i + Φ
Φ = ρ C g Δ 1 f i , j , k 0 F i , j , k > 1 2 2 F i , j , k < 1 2 2
F i , j , k = f i + 1 , j , k 2 + f i 1 , j , k 2 + f i , j + 1 , k 2 + f i , j 1 , k 2 + f i , j , k + 1 2 + f i , j , k 1 2 3 f i , j , k 2
The flame propagation speed is predicted by Cg (Equation (16)), which is proportional to the gas expansion ratio (σ) and the turbulent flame speed model (St). In Equation (16), α and β are correlation constants obtained from numerical experiments with the values equal to 0.243 and 0.375, respectively. We chose three turbulent flame models proposed by Bradly (Equation (17)), Kawanabe (Equation (18)), and Schmidt (Equation (19)) in this validation, on the basis of the previous COM3D calculation results [16,17,18]. In three models (Equations (17)–(19)), SL represents the laminar flame speed dependent on the temperature, pressure, and steam concentration, and the turbulent intensity (u’) can be obtained by use of the calculated turbulent kinetic energy from Equations (8) and (9).
C g = α σ + β S t
S t B r a d l y = S L u S L L S L χ 1 6
S t K a w a n a b e = S L 1 + 1.25 u S L 0.7
S t S c h m i d t = S L + u 1 + 1 D a 2
Equations (20) and (21) shows the flammability limit for the diluted steam and its effect on the laminar flame speed. The chemical reaction of the hydrogen–air mixture is calculated by the one-step reaction (Equation (22)) or the multi-step reaction in the COM3D code, and the calculated combustion energy through the chemical reaction is used as the heat source of the energy equation (Equation 6).
S L , s t e a m ( T ) = S L , a i r ( T ) λ s t e a m ( T ) λ a i r ( T ) 1 X H 2 , s t e a m X L , s t e a m
X L , s t e a m = 0.5 0.2443 ln X H 2 , a i r 0.185 ln X H 2 , a i r 2
H 2 +   1 / 2 O 2 +   1.82 N 2 H 2 O   +   1.82 N 2 +   0.242   MJ

2.2. COM3D Validation

The test data of the hydrogen combustion performed at the ENACCEF and THAI facilities were chosen to evaluate the uncertainty of the COM3D code and determine the proper turbulent flame speed model for simulating the hydrogen flame acceleration during severe accidents in the APR1400 containment.

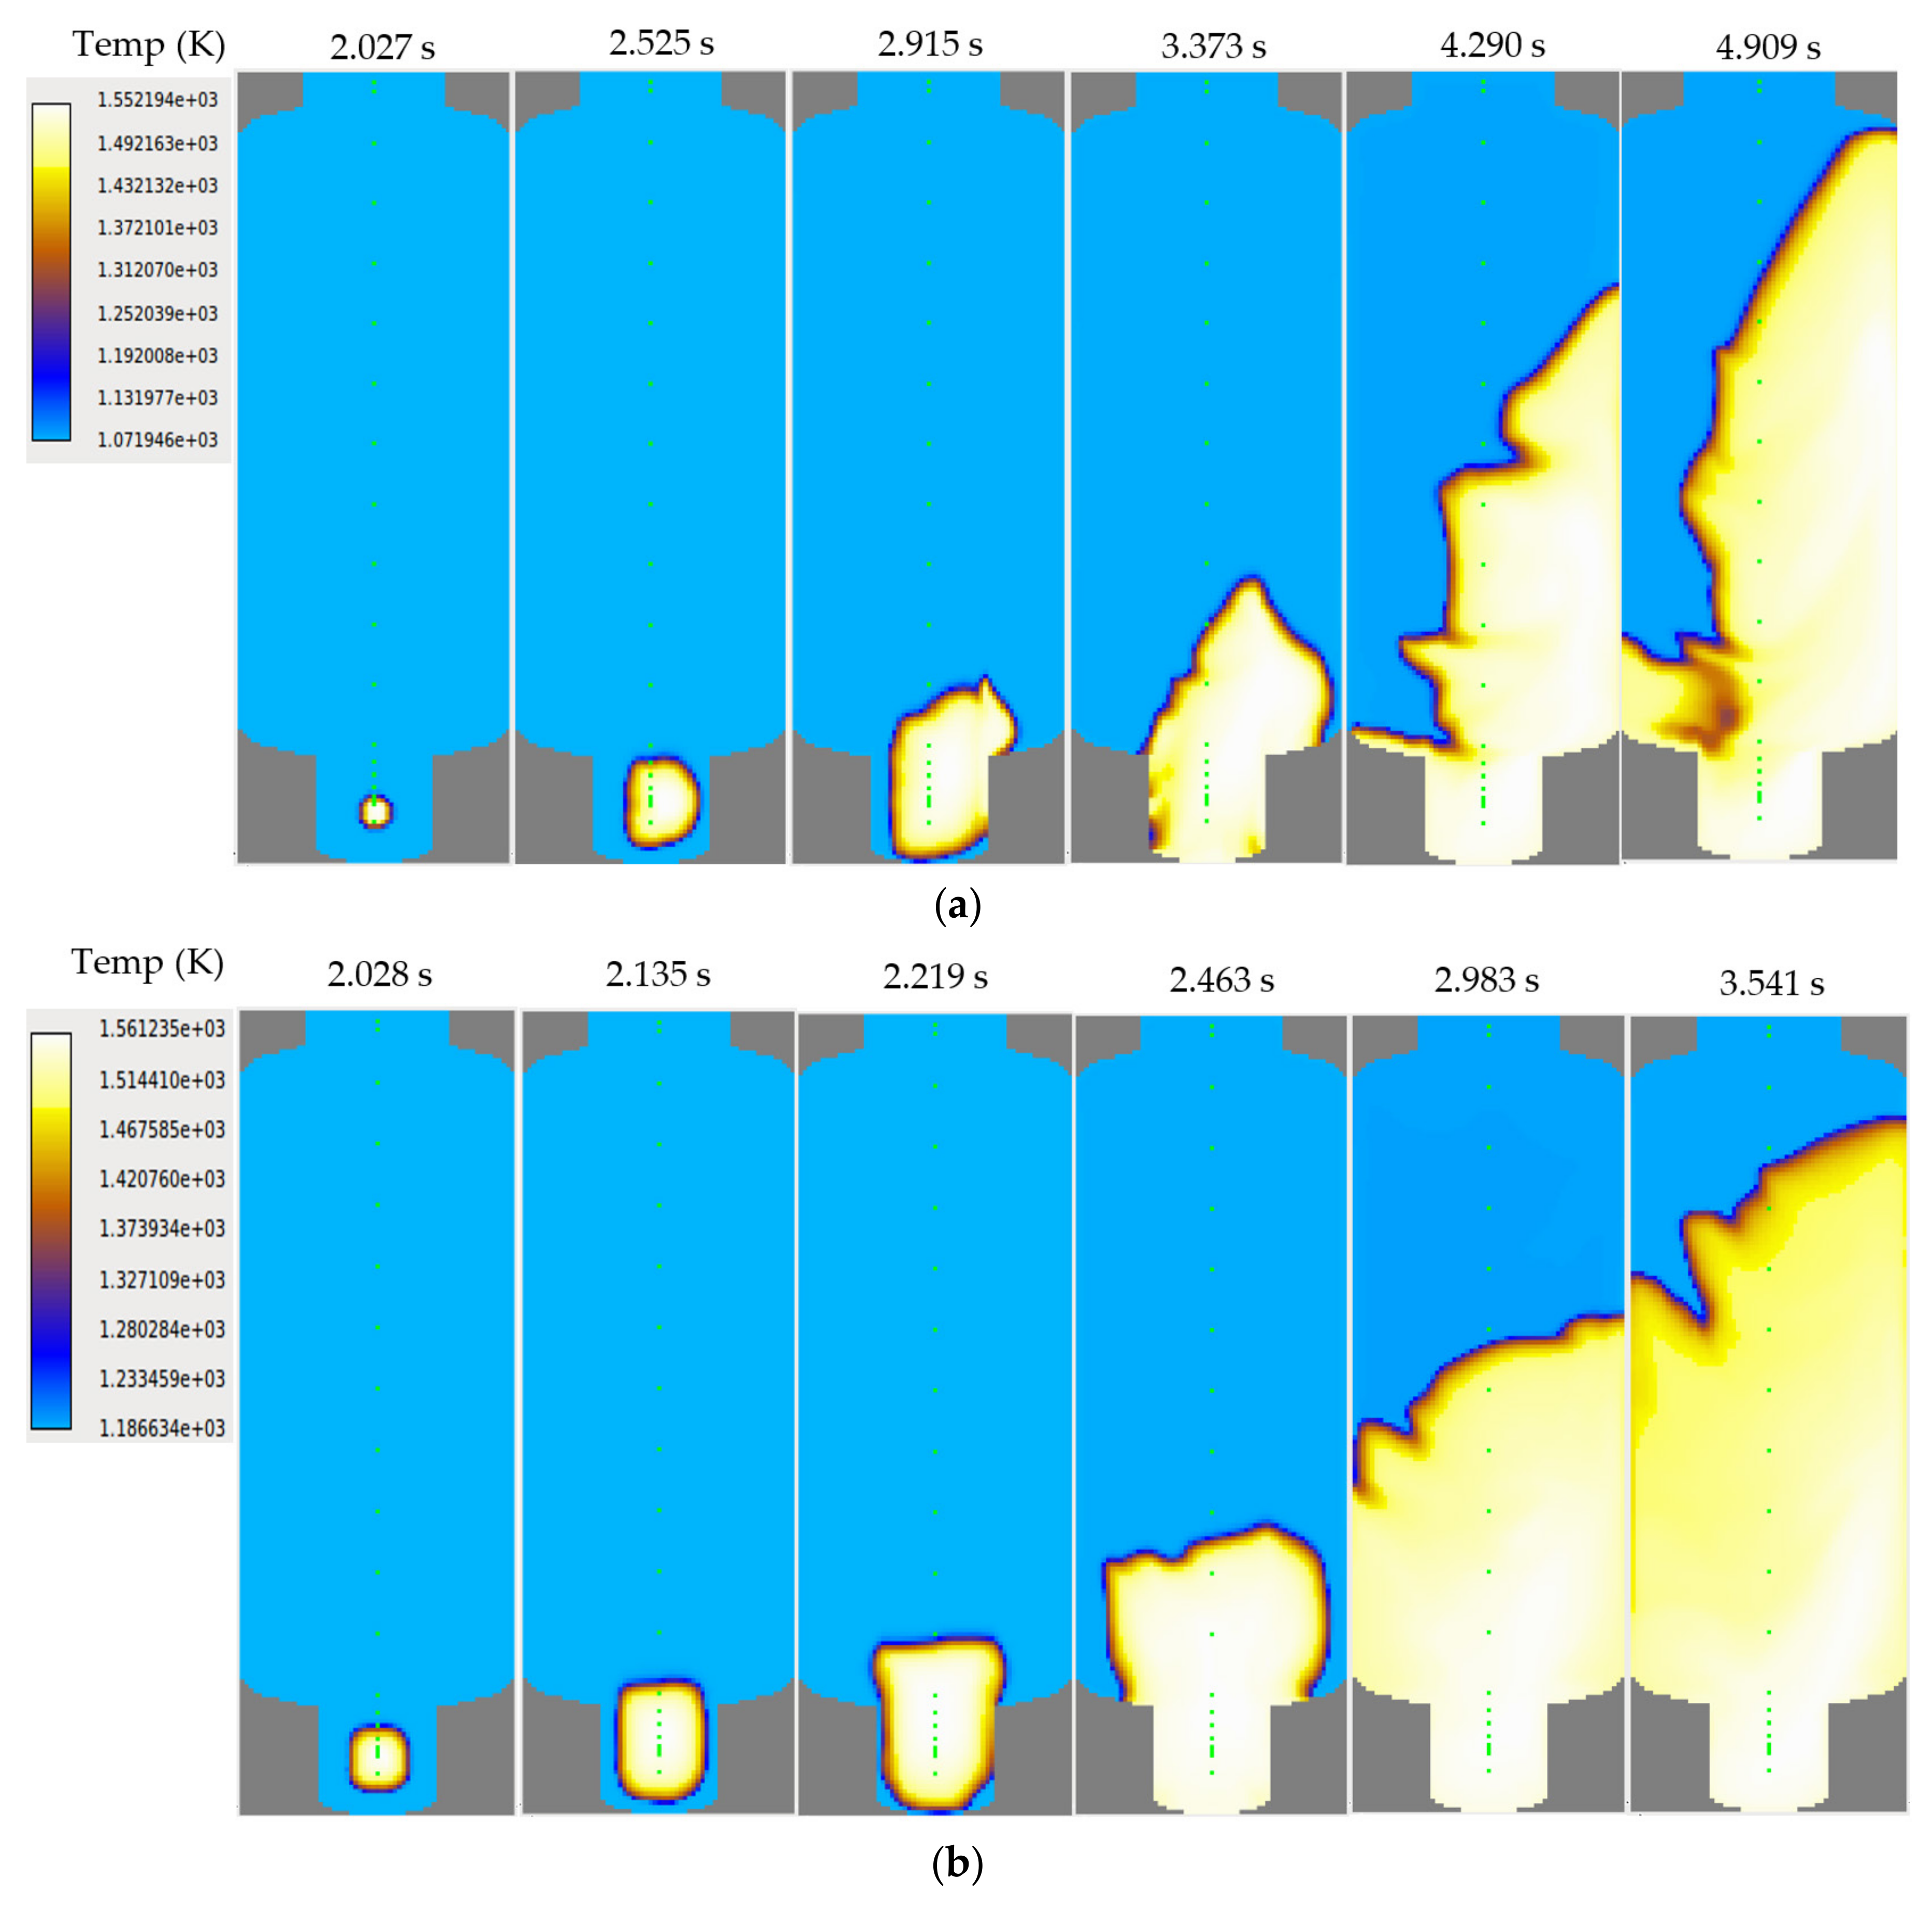
2.2.1. The ENACCEF Test

IRSN in France performed the hydrogen flame acceleration test using the ENACCEF facility with a hydrogen concentration of 13% and an obstacle blockage ratio of 0.63 (Table 1) [9,10,11]. The ENACCEF is a vertical facility of 5 m high, as shown in Figure 1. It is divided into two parts of the acceleration tube and the dome region. Nine annular obstacles are continually installed in the acceleration tube. The first obstacle is located at 0.876 m from the bottom of the acceleration tube. The blockage ratio of the obstacle is defined as Equation (23). In the equation, D and d are the inner diameters of the acceleration tube and obstacle, respectively. The hydrogen–air mixture was ignited at the bottom region by an electric spark device, after setting the initial hydrogen concentrations as shown in Table 1. Then, the hydrogen flame propagated upward along the acceleration tube in the test facility. They measured the flame front time of arrival (TOA) at 16 locations, using photomultiplier tubes, and the pressure at 9 locations to observe the flame acceleration phenomenon, using 9 high-speed pressure transducers, in which 7 transducers were a Chimie metal type and others were a Kistler type. The pressure data, as shown in Figure 2b, was measured by the Kistler pressure transducer.
BR   =   1     d / D 2
The COM3D analysis was performed for the ENACCEF test to estimate the uncertainty of the COM3D prediction, according to the turbulent flame speed models of Bradly, Kawanabe, and Schmidt. A turbulent flow in the combustion flow field was modeled using the standard k-ε turbulent model and the low Reynolds wall function model. One step H2-Air chemical reaction model (Equation (22)) was used with the KYLCOM+ combustion model. An ignition process was modeled by the use of a hot spot spherical region, with a radius of 30.8 mm, where the hydrogen–air chemical reaction took place with a laminar flame speed. A 3-dimensional grid model with a quarter symmetric condition was generated for simulating the ENACCEF test facility. A total of 439,217 hexahedral cells with a cell length of 7.7 mm were generated in the grid model. A slip wall condition was applied to reduce the number mesh distribution near the wall. A wall condition with a constant temperature of 298 K was applied on the outer surface of the grid model. The time step size for the COM3D calculations was automatically controlled to assure a Courant–Friedrichs–Lewy (CFL) number below 0.9 and a RED number below 0.4 (Equations (24) and (25)) [5]. In Equations (24) and (25), Δt is a time step size and Δx is a cell size in the grid model. c and Dα represent the speed of sound and the diffusion coefficient of gas species α.
CFL = Δ t × c + U max Δ x
RED = Max D α × Δ t Δ x 2 , μ × Δ t Δ x 2 , λ × Δ t Δ x 2
The test results showed that the flame acceleration through the obstacles induced the pressure buildups measured at PCB2 in Figure 2a. The first pressure peak (A) occurred by a compression effect when the hydrogen flame front arrived at the dome entrance. The second pressure peak (B) was developed at around the end of the hydrogen–air chemical reaction in the dome region. After the end of the hydrogen combustion, the pressure started to decrease by a heat loss from the ENACCEF wall into the air environment. These flame propagation features were also shown in the flame speed variation along the distance from the ignition point in the ENACCEF facility (Figure 2b). The flame speed increased to approximately 500 m/s, when the flame propagated through the nine annular obstacles. After finishing the flame propagation through the obstacles, the flame speed decreased to approximately 390 m/s, and then increased again to approximately 650 m/s, at around the end of the acceleration tube.
The calculated gas temperature according to the passage of time by the COM3D, as shown in Figure 2c, accurately simulated the characteristics of the flame propagation measured in the ENACCEF facility. The comparison between the COM3D result and the test data showed that the KYLCOM+ model with the Kawanabe correlation, accurately predicted the flame speed and peak pressure, with an error range of approximately ±10% (Figure 2). The flame arrival time needed for calculating the flame speed in the COM3D calculation was defined as the instant when the gas temperature increased to approximately 700 K, at locations of PM1 to PM16. However, the COM3D results overpredicted the pressure behavior from 0.15 s to 0.30 s, in Figure 2b. This overestimation might have resulted from the higher flame temperature, owing to the less heat transfer from the hydrogen flame to the test facility wall as COM3D did not have a steam condensation model along the wall or a radiative heat transfer model. We did not perform the grid sensitivity analysis for this problem because AREVA already conducted the grid dependency study for the ENACCEF test results with the COM3D in the ISP-49 benchmark problem [11]. They finally addressed that the COM3D had no significant grid dependency in the analysis of the ENACCEF test results, when a cell size of approximately 10 mm was used for the grid model.

2.2.2. THAI Test

Becker Technologies in Germany performed the hydrogen deflagration test at a condition of the hydrogen concentration of approximately 10%, by varying the steam concentration from 0% to 25% in the THAI facility [12]. The THAI facility is a cylindrical stainless steel vessel of 9.2 m height and 3.2 m diameter, with a total volume of 60 m3, as shown in Figure 3. The vessel outer wall is completely enveloped by a 120 mm rockwool thermal insulation. An obstacle geometry to accelerate the hydrogen flame was not installed, but a structure to support thermocouples existed in the vessel. An air-driven axial fan installed in the lower plenum of the vessel was used to set homogenization of the vessel gas atmosphere, prior to the start of the hydrogen combustion. To monitor the gas temperature change during hydrogen deflagration, 43 thermocouples (TCs) with outer diameter 0.25 mm were installed at 13 different elevations in the vessel. The gas temperatures were measured at the rate of 1000 Hz. The hydrogen–air mixture was ignited at the bottom region by an electric spark device, after setting the initial hydrogen concentrations, as shown in Table 2. Then, the hydrogen flame propagated upward along the acceleration tube in the test facility.
The flame speed data, as shown in Figure 2b in the ENACCEF test, was not provided in the THAI test HD-15 and HD-22. The reason for this difference between the two experiments might be explained by the fact that the measured temperatures by TCs with a response time of 0.001 s could not accurately detect the flame front arrival. Thus, we decided to use time needed for flame propagation on the basis of the measured temperature data from the bottom to the top in the vessel, as a parameter for observing the characteristics of the hydrogen flame propagation. The test results showed that the time needed for the flame propagation along the centerline from 0.7 m to 9.1 m in the vessel was increased from approximately 1.5 s to 2.0 s, as the steam concentration increased from 0% to 25%, as shown in Figure 4a and Figure 5a. In this estimation, we assumed that the flame front arrived when the gas temperature increased to approximately 700 K at the TC locations, along the centerline in the vessel. However, the maximum temperatures at the elevation 0.7 m to 9.1 m along the centerline were decreased from approximately 30 K to 70 K, as the steam concentration increased. This might be explained by the fact that more combustion energy was used to increase the temperature of the gas mixture of hydrogen, air, and steam in the test HD-22 because the specific heat of the gas mixture of hydrogen, air, and steam was increased to approximately 20% from those of the gas mixture of hydrogen and air in the test HD-15 [16]. As a result of this maximum temperature decrease, the peak pressure at elevation 7.7 m in the vessel decreased from approximately 5.0 bar to 4.6 bar, as the steam concentration increased, such as Figure 4b and Figure 5b. After the end of the hydrogen combustion in the test, the temperatures and pressure started to decrease by the heat loss from the THAI vessel wall into the air environment as in the ENACCEF test.
The COM3D analyses for the HD-15 and HD-22 tests were performed to measure an effect of steam presence on the hydrogen deflagration analysis, using the same models and methods, as used for the ENACCEF analysis. A full 3-dimensional grid model was generated for simulating the THAI vessel. A total of 481,928 hexahedral cells with a cell length of 50 mm were generated in the grid model on the basis of the previous COM3D analysis for the THAI experiments [17,18,19]. A wall condition with a constant temperature of 298 K was applied on the outer surface of the grid model. The ignition process was modeled by the use of a hot spot spherical region with a radius of 0.1 m, where the hydrogen–air chemical reaction took place, with the laminar flame speed.
The comparison of temperatures and pressure between the analysis results and test data are shown in Figure 4 and Figure 5. The COM3D results with the KYLCOM+ model using the turbulent flame speed models of Bradly, Kawanabe, and Schmidt showed that the pressure decrease according to the steam concentration increase from 0% to 25% were accurately predicted from approximately 5.5 bar to 5.0 bar, with an error range of approximately 10%, compared to the test data, as shown in Figure 4b and Figure 5b. However, the time needed for the flame propagation along the centerline from 0.7 m to 9.1 m in the test HD-22 decreased to approximately 75% of the calculated time for the test HD-15. These results were different from the measured data in the tests HD-15 and HD-22. This meant that the flame propagation becomes faster as the steam concentration increases from 0% to 25%. To find the exact reason for this problem, we investigated the laminar flame speed model at the steam presence implemented in the COM3D version 4.10 [5,19]. The time needed for the flame propagation using the Bradley model was longer than those of other models, as shown in Figure 4a and Figure 5a. This result might be explained by the fact that the hydrogen flame first propagated along the right side wall and moved upward and then turned its direction to the central region in the vessel, as shown in Figure 6a. The temperature contours on the center plane of the vessel by the Kawanabe model showed that the flame mainly propagated upward along the central plane in the vessel (Figure 6b). The flame propagation from the bottom to the top in the vessel by the Schmidt model was similar to that of the Kawanabe model (Figure 4a). Through the hydrogen combustion analyses for the tests of HD-15 and HD-22, we found that the calculated peak pressures accurately predicted the measured pressures, with an error range of approximately ±10%, even though the times needed for the flame propagations were not accurately predicted. The calculated pressure overestimated the measured pressure after completing the hydrogen combustion, such as the analysis result for the ENACCEF test, because the calculation results did not simulate the heat loss along the vessel wall owing to the steam condensation and the radiative heat transfer.

2.3. Proposed Analysis Methodology for the Hydrogen Flame Acceleration

KAERI established the analysis methodology (Table 3) for the hydrogen flame acceleration on the basis of the validation results against the test data of ENACCEF and THAI. The proposed analysis methodology accurately predicted the peak overpressure with an error range of approximately ±10%. However, the analysis results did not accurately predict the time needed for the flame propagation, under the condition of the steam presence in the THAI facility.

3. Application to the Severe Accident of the APR1400

3.1. Design Feature of the APR1400 Containment

There are two currently operational plants of APR1400 and four plants under construction, in Korea. The dimension of the APR1400 containment was changed to include the in-containment refueling water storage tank (IRWST) in the containment, which was located outside the containment of the Optimized Power Reactor 1000 MWe (OPR1000). Thus, the diameter and height of the APR1400 containment with a cylindrical dome geometry were increased to 45.72 m and 69.69 m from 43.89 m and 65.83 m in the OPR1000, respectively. The containment height was defined from the ground level to the top of the cylindrical dome. As a result of the geometrical change, the air-free volume in the APR1400 containment was also increased to approximately 88,631 m3 from 77,021 m3 of the OPR1000. The top and bottom of the SG compartments in the APR1400 and OPR1000 were opened to the air-free space in the containments, as shown in Figure 7a. In addition, the APR1400 had a safety depressurization system (SDS), which discharges the reactor coolant from the primary system to the IRWST, to reduce the primary system pressure during a high pressure accident like that of the SBO accident. A 3-way valve located at the bottom of the pressurizer (PZR) in the SDS changed the flow path of the discharge of the reactor coolant from the IRWST to the north SG compartment, when the severe accident occurred in the reactor pressure vessel (RPV) during the SBO accident, to prevent the hydrogen release to the IRWST, according to the severe accident management guideline (SMAG) [4]. In this study, the release location of the hydrogen in the SG compartment was assumed, as the elevation was similar to the bottom of the PZR. The released hydrogen gas into the containment could be removed by the thirty passive auto-catalytic recombiners (PARs) installed in the containment, though electrical power was not available during the SBO accident. The design pressure of the inner wall in the APR1400 containment was approximately 513 kPa in absolute pressure [4].

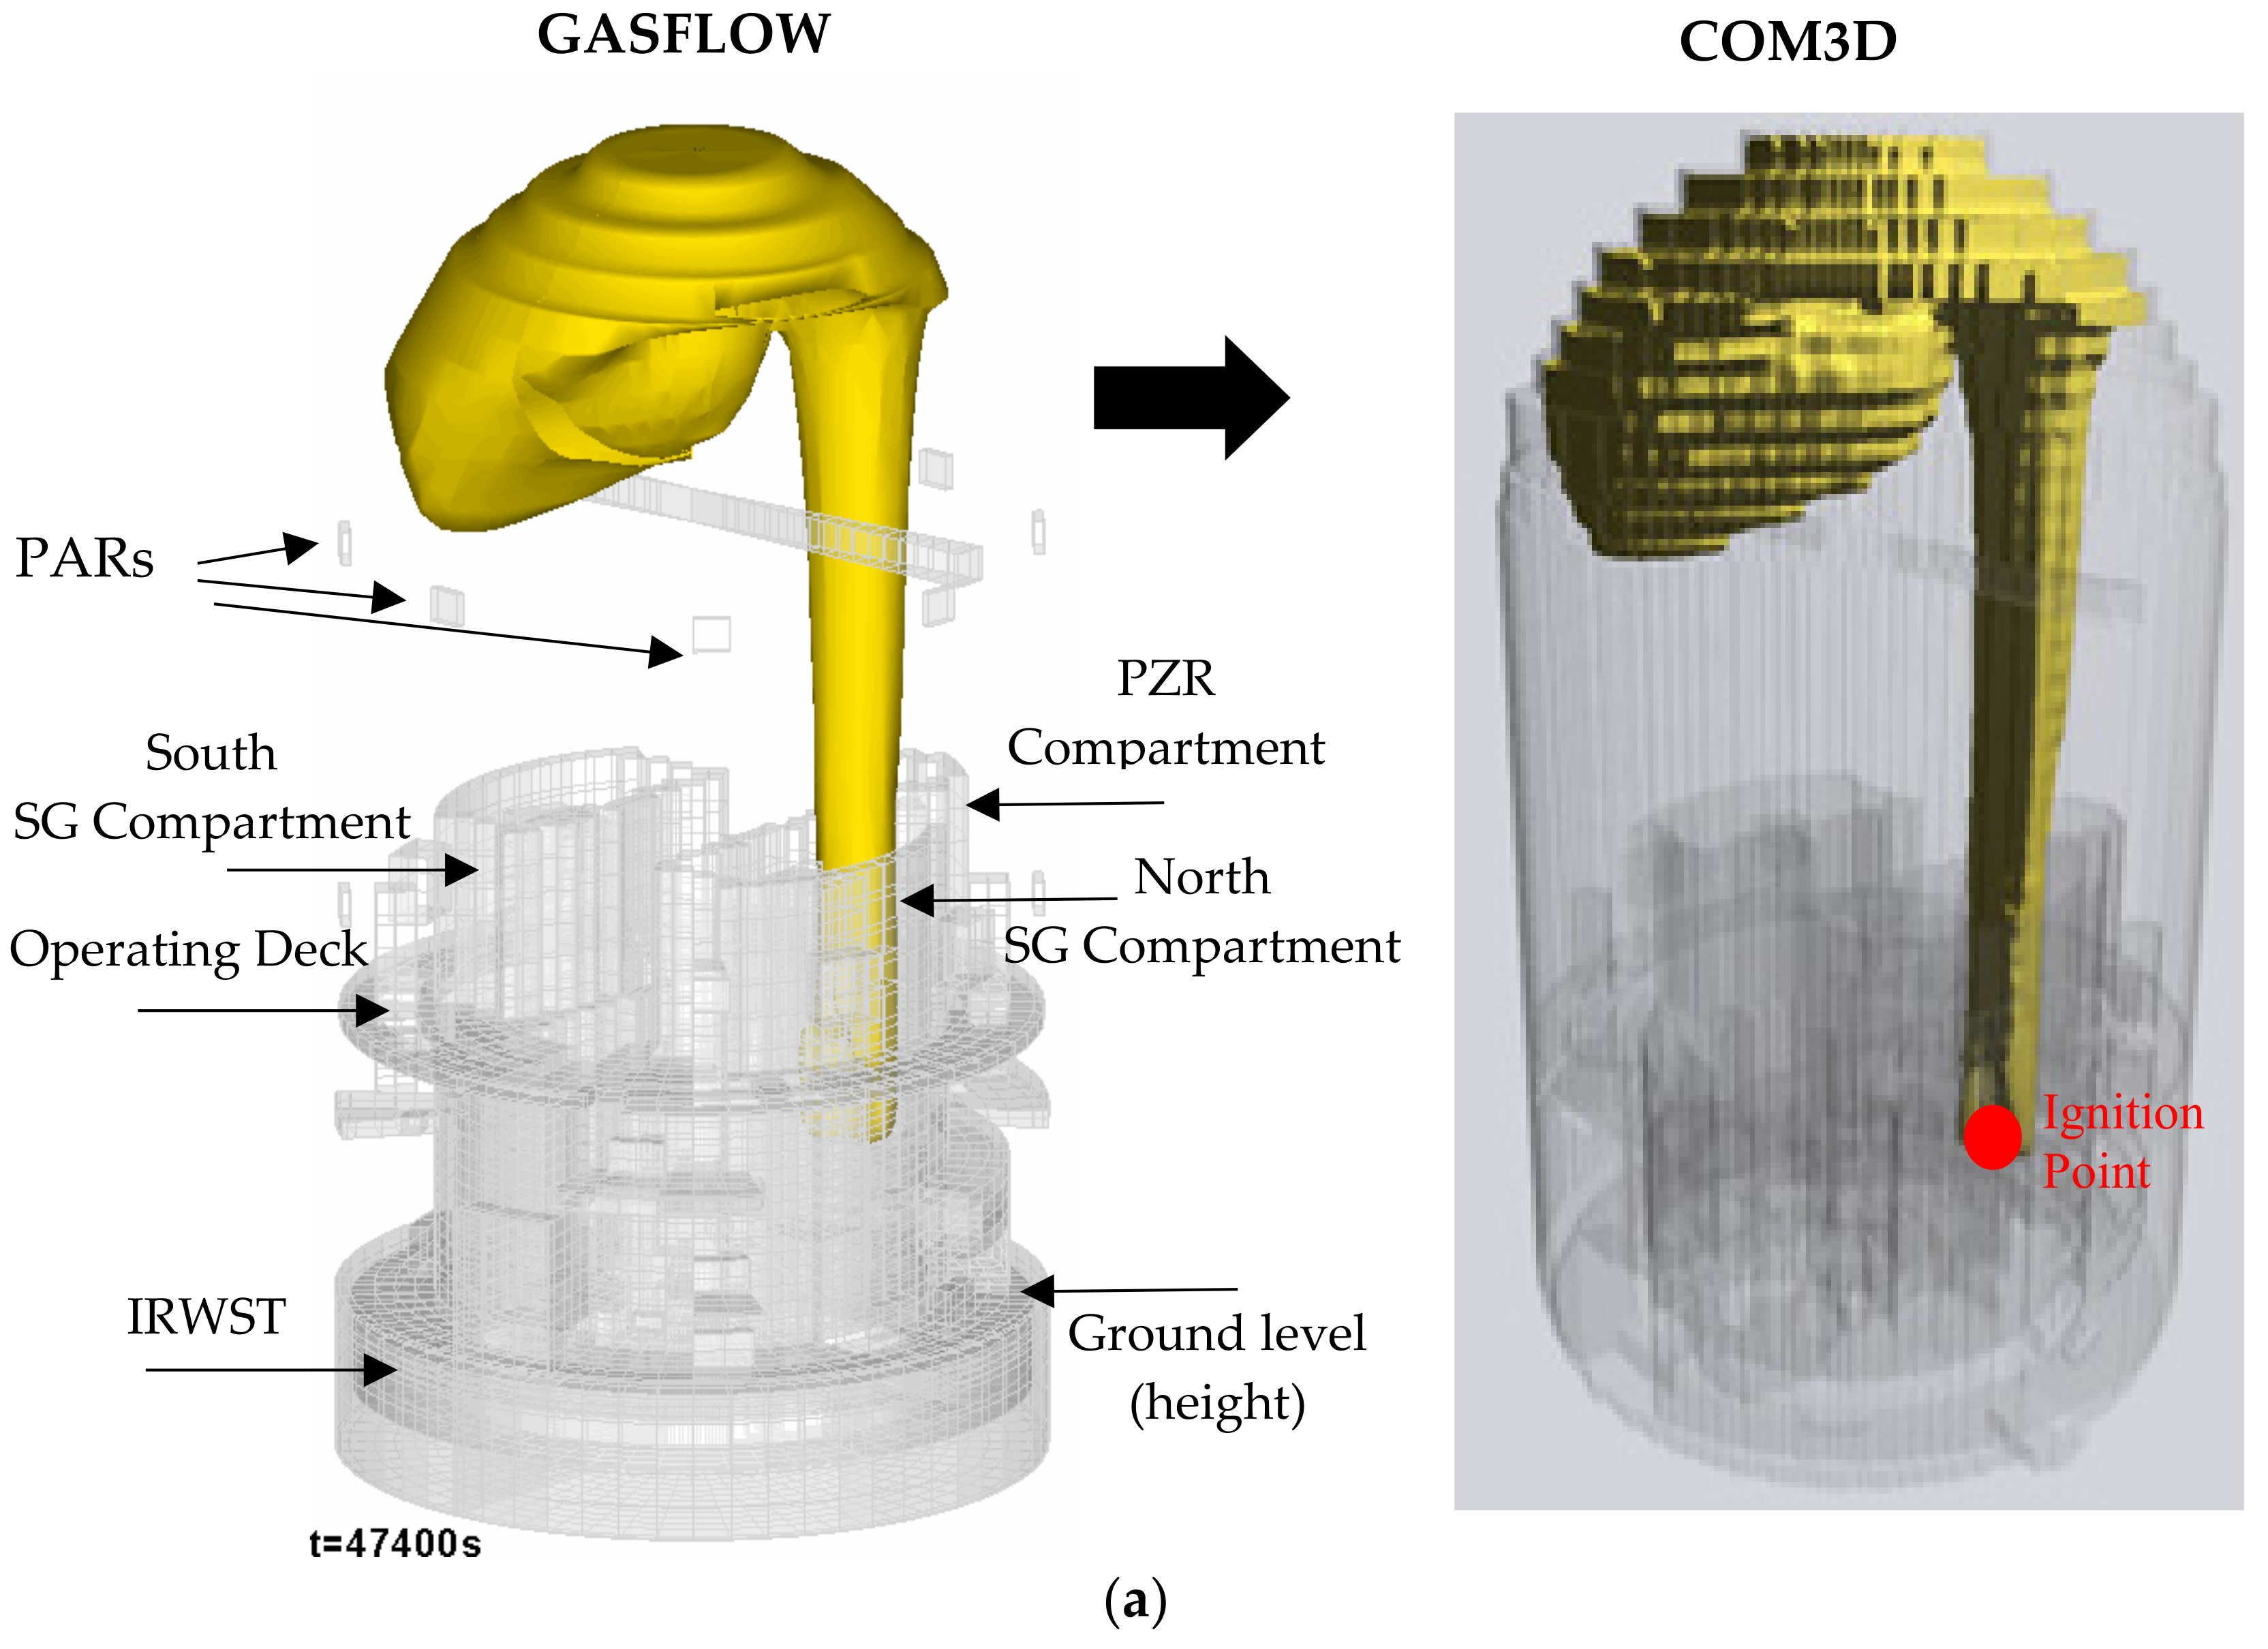
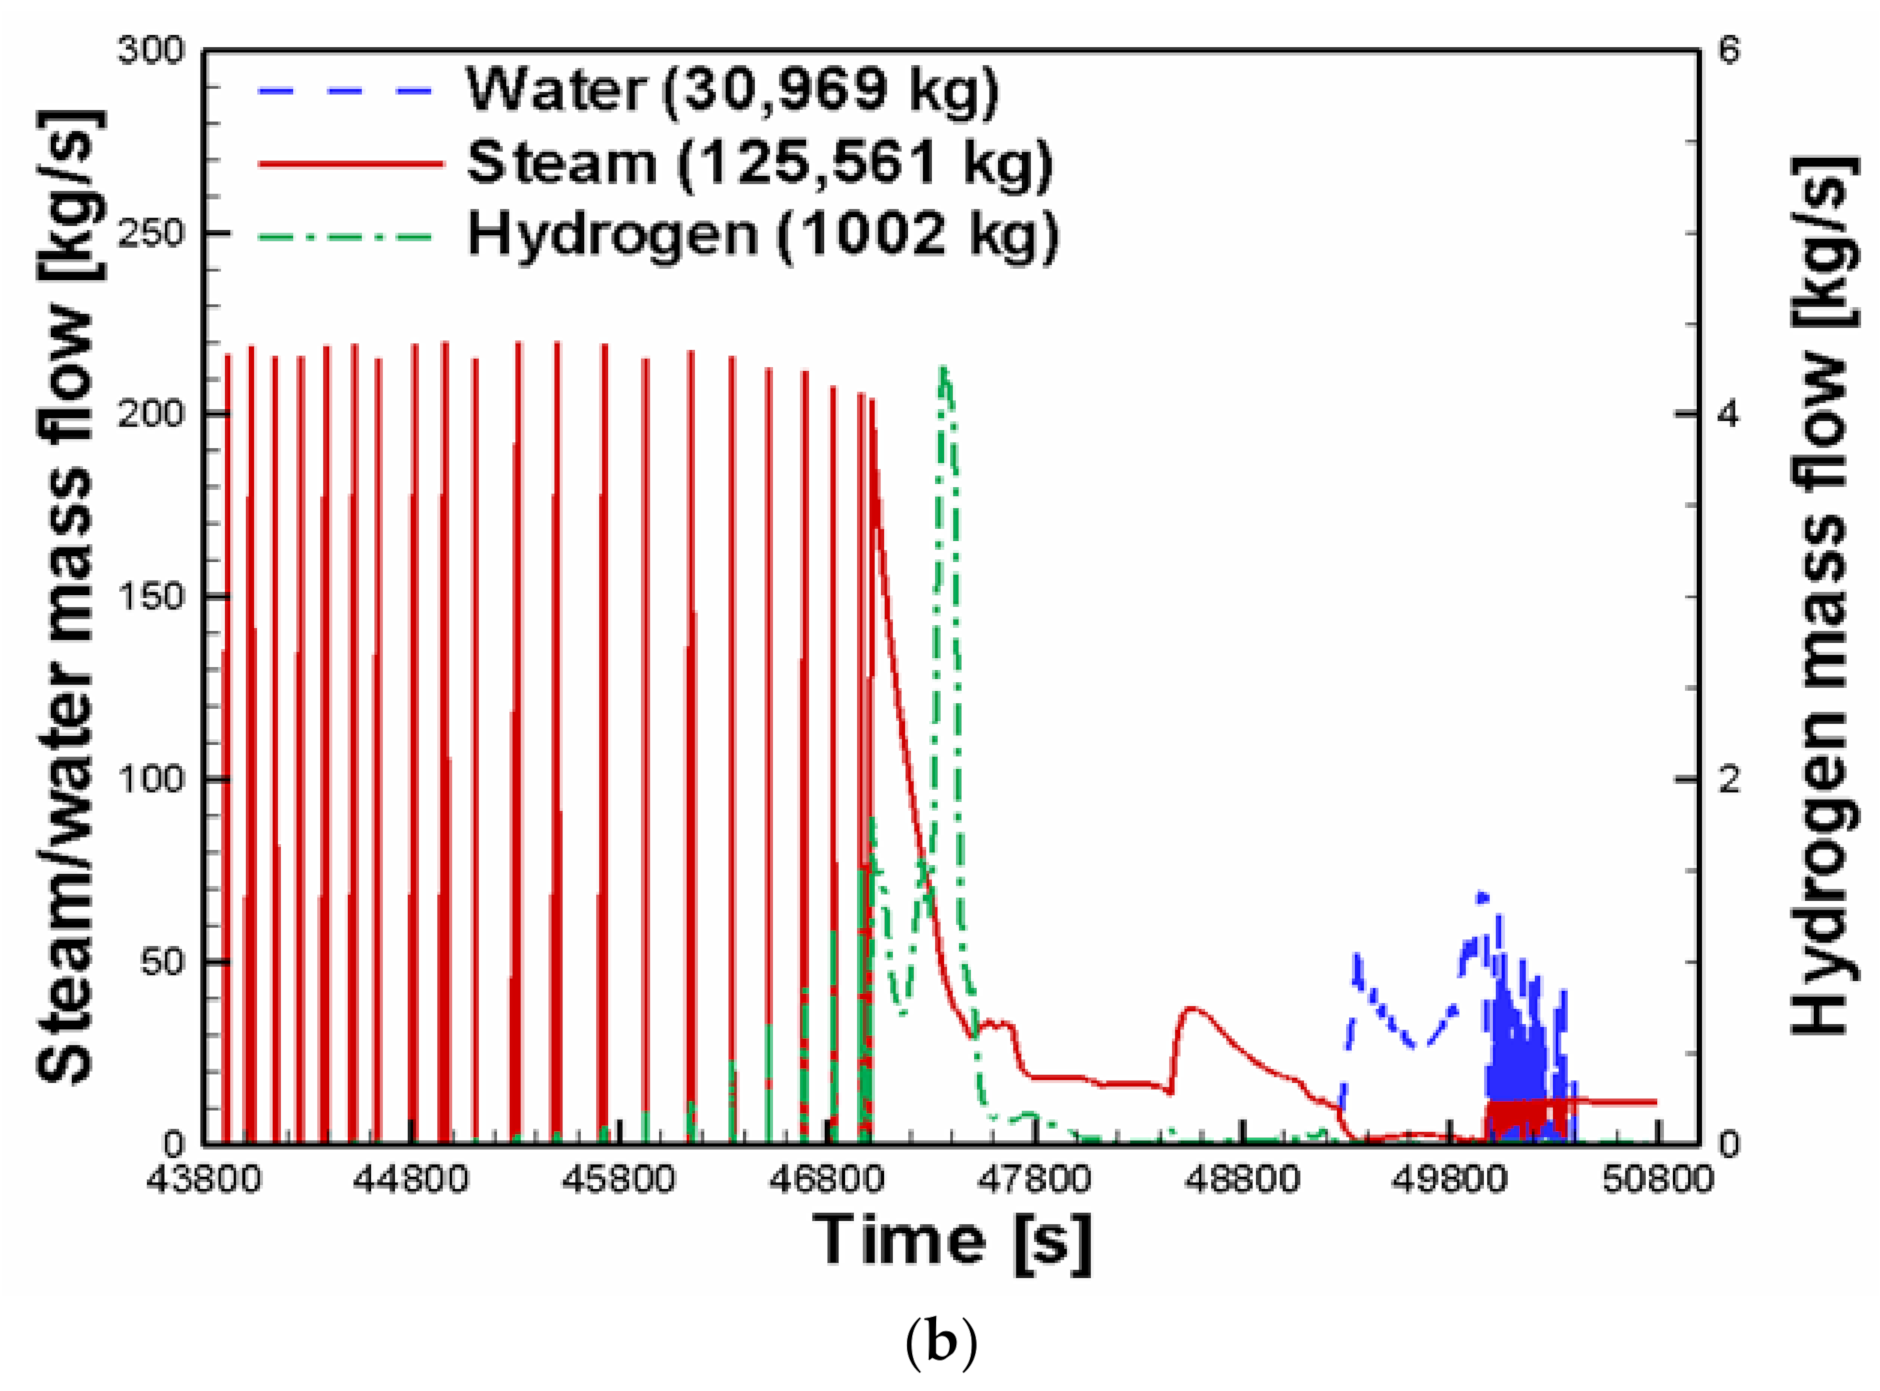
3.2. Calculation of the Hydrogen Distribution by GASFLOW and MAAP

To evaluate an overpressure buildup owing to hydrogen flame acceleration during the SBO accident in the APR1400 containment by the COM3D code, the hydrogen distribution in the containment by the GASFLOW was first calculated using the hydrogen and steam generation rate (Figure 7b). This was obtained under the assumption of a 100% metal–water reaction in the RPV, by considering the uncertainty of the hydrogen generation model in the MAAP code. The total generated hydrogen mass in the RPV was 1002 kg, which was calculated by imposing the 50% uncertainty to the zirconium oxidation rate. This generated mass was approximately 83% of the maximum hydrogen mass, through the zirconium oxidation in the RPV. Figure 7b shows that a lot of steam is released to the containment from the RPV before hydrogen discharges. The GASFLOW results at 47,400 s and its grid model representing the APR1400 containment, as shown in Figure 7a, were transferred from the GASFLOW to the COM3D, as the calculated sigma cloud by the GASFLOW revealed the possibility of hydrogen flame acceleration over a long distance [3]. The amount of hydrogen, oxygen, and steam transferred from the GASFLOW results at 47,400 s were 694.7 kg, 24,375 kg, and 48,760 kg, respectively. Figure 8 shows the initial conditions of the gas concentrations, temperature, pressure, and turbulence for the COM3D calculation, after transferring from the GASFLOW results. According to the distributions of the gas mixture of hydrogen and air, the flame acceleration might sufficiently occur along the mixture gas vertical column, with approximately 0.5 m diameter and 57 m length [20]. When the grid model was transferred from the GASFLOW to the COM3D, its cell length was decreased to approximately 50 cm from 100 cm, to accurately resolve the pressure wave propagation generated from the combusted region, model the important structures to the hydrogen flame acceleration in the containment, and complete the calculation of the hydrogen flame acceleration in proper time [18,19]. Therefore, a total of 1,453,025 hexahedral cells in the grid model were generated for the calculation of the hydrogen flame acceleration. The wall condition with a constant temperature of 298 K was applied to the outer surface of the grid model. The air-free volume in the grid model for the COM3D analysis was approximately 92,943 m3, which was approximately 4.8% larger than the design value of the air-free space in the APR1400 [4].

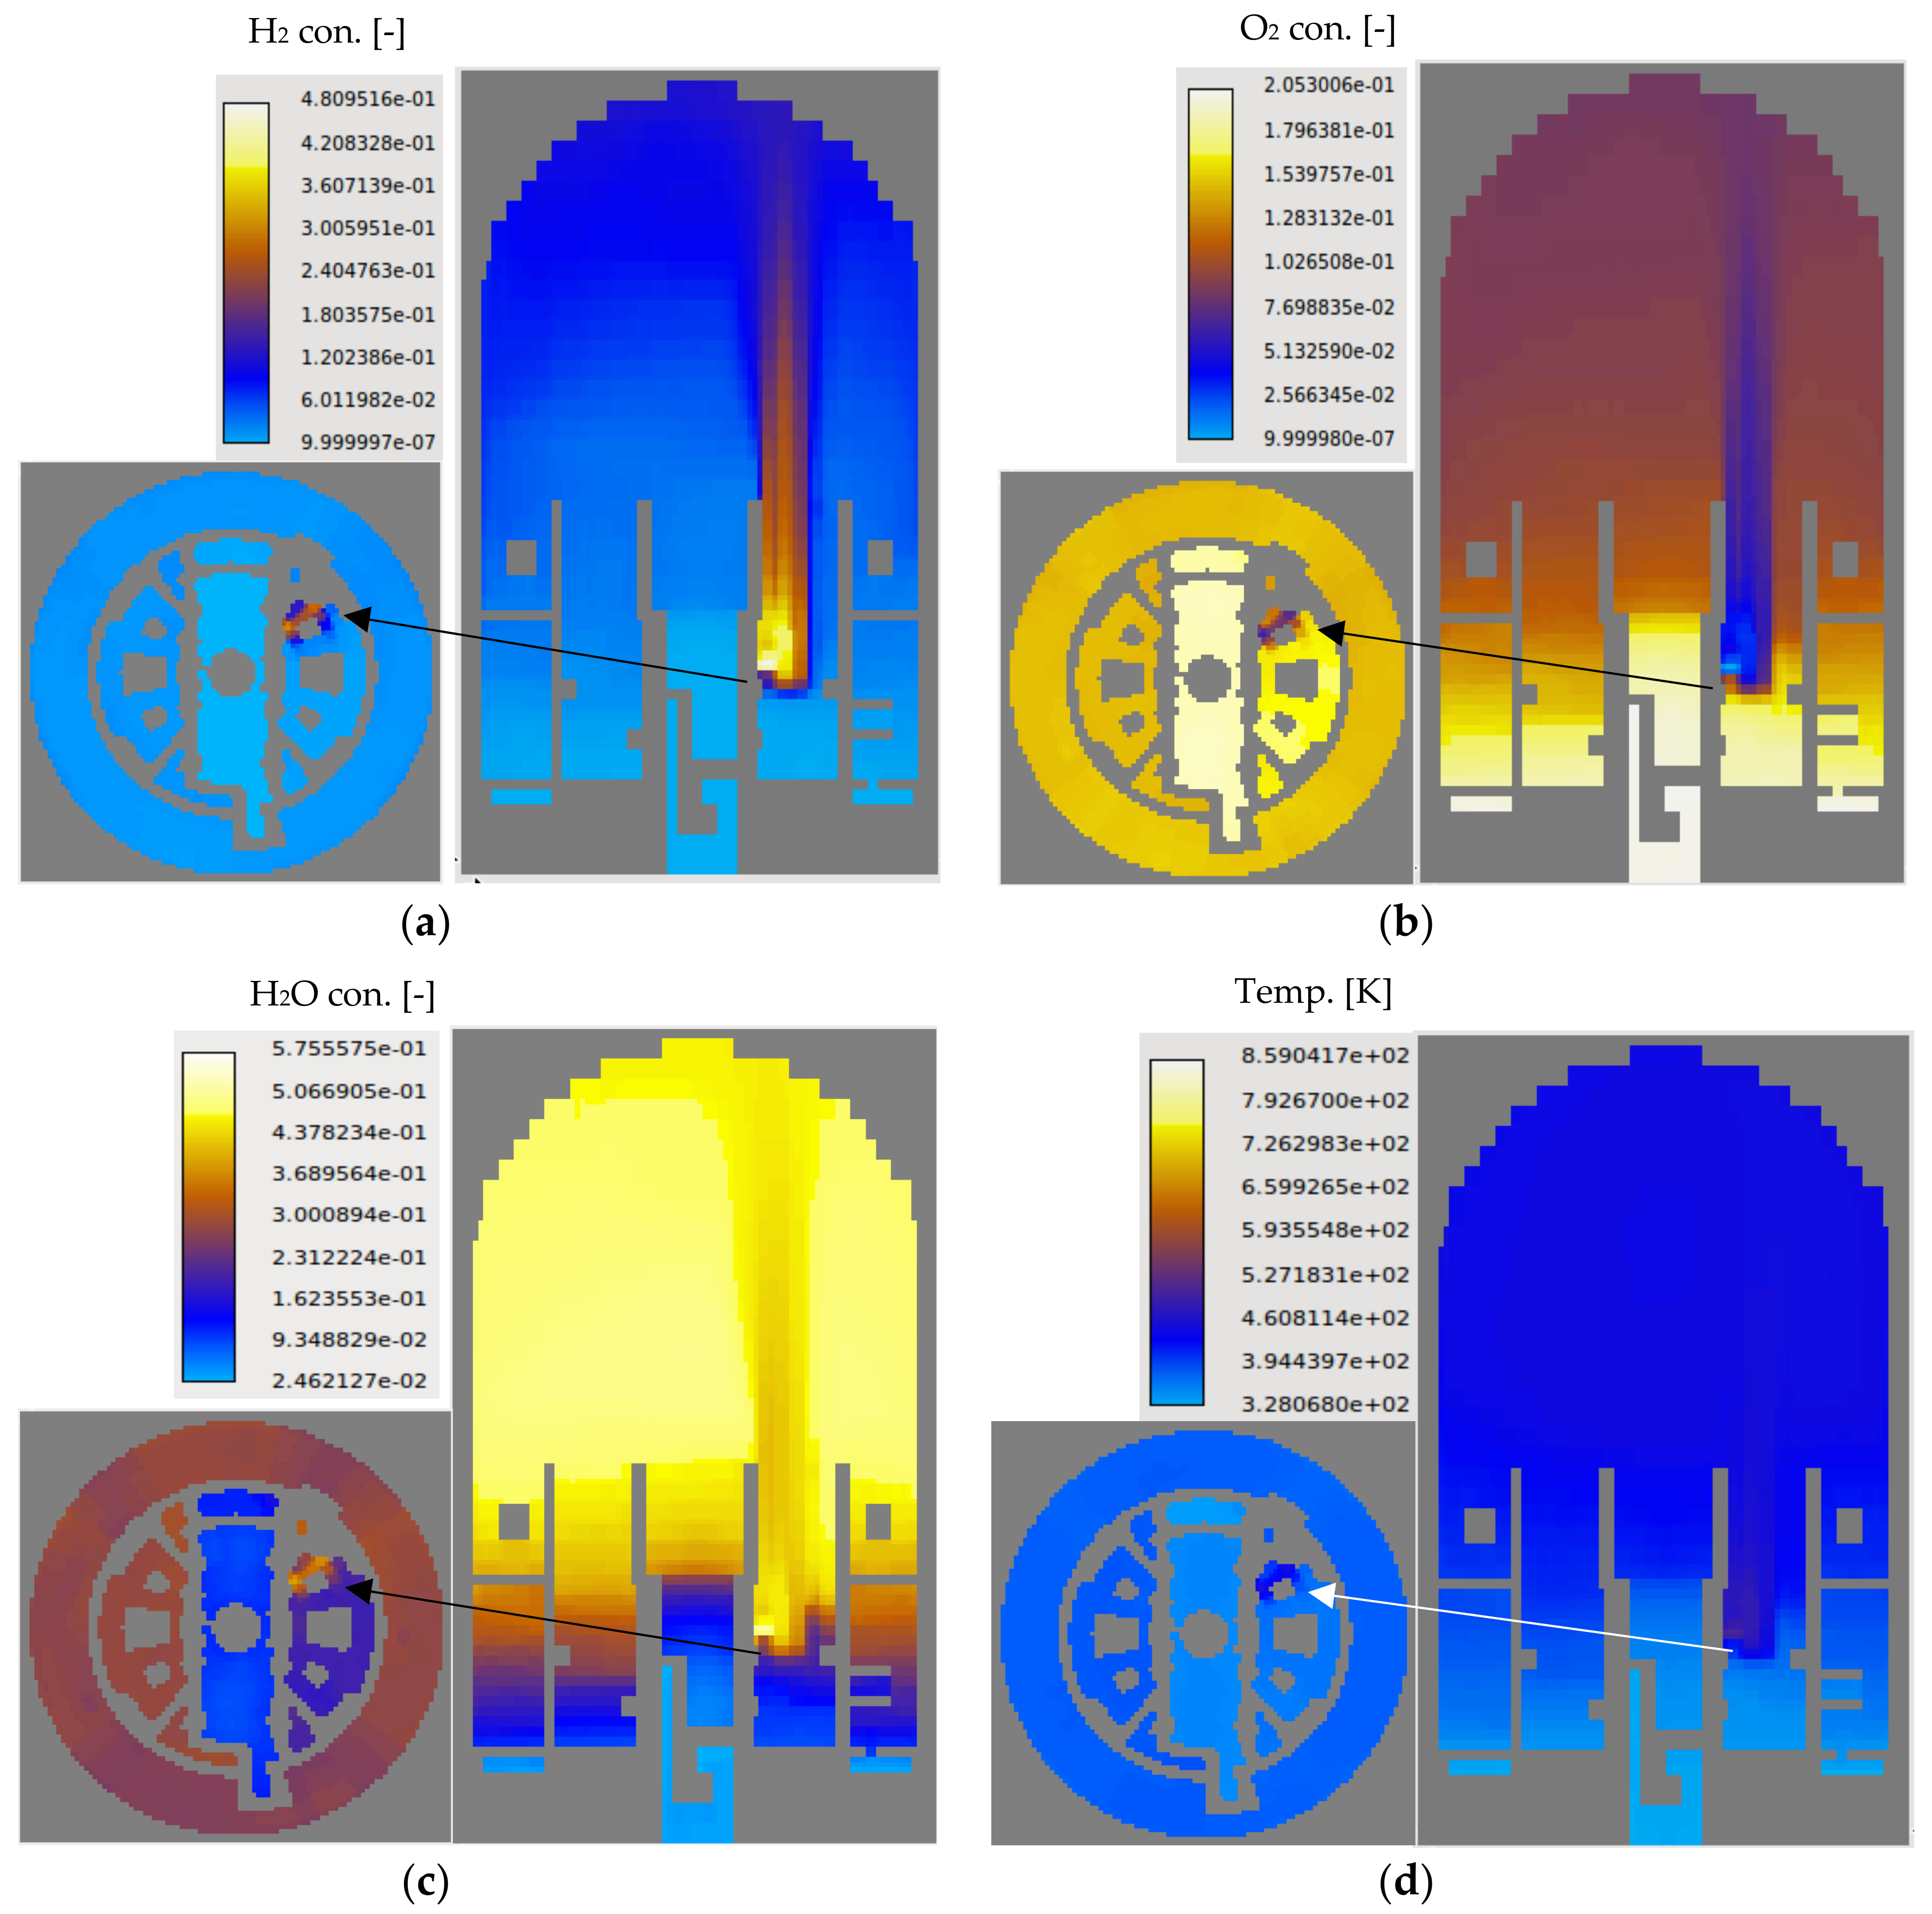
3.3. Calculation of the Hydrogen Flame Acceleration by the COM3D Code

The COM3D calculation for the hydrogen flame acceleration during severe accidents in the APR1400 containment was performed for approximately 30 s, using the transferred GAFLOW results and refined grid model, on the basis of the proposed analysis methodology (Table 3). In particular, to induce a strong flame acceleration over a long distance, the ignition point was assumed at around the hydrogen release location in the north SG compartment (Figure 7a) [21]. The ignition process was modeled by the use of a hot spot spherical region, with a radius of 0.5 m, where the hydrogen–air chemical reaction took place with the laminar flame speed. The COM3D results using the Kawanabe model showed that the hydrogen flame was propagated to approximately 57 m along the vertical direction, 1.0 s after the start of the ignition, and turned to the left where the hydrogen was located, as shown in Figure 9a. The calculated flame speeds between P1 to P3 increased to approximately 300 m/s, in the SG compartment and decreased to about 30 m/s at the upper region of the containment (Figure 9b). This flame speed variation along the vertical direction might have resulted from the initial conditions of the hydrogen, oxygen, and steam concentrations, and the turbulent kinetic energy (Figure 8). The flame arrival time needed for calculating the flame speed was defined as the instant when the gas temperature increased to approximately 700 K at the locations of P1 to P13. The calculated flame speed of approximately 300 m/s around the hydrogen release point in the SG compartment looked like a lower speed, when considering the hydrogen concentration of approximately 25% to 35%, as shown in Figure 8a. This result might be explained by the fact that the oxygen with approximately 4% to 7% located around the hydrogen release point limits the total hydrogen mass consumed in the chemical reaction of the hydrogen and air, as in Equation (22). Thus, the calculated combustion energy might be similar to that of the hydrogen concentration of approximately 8% to 14%.
In addition, the steam presence with approximately 35% to 45%, hinders the hydrogen–air chemical reaction around the hydrogen release point. As a result of the oxygen starvation phenomenon, hydrogen with approximately 15% to 20% still remains or the hydrogen moves downward to the lower region after the flame front arrives at the upper location of the top of the SG compartment (Figure 10). According to the hydrogen combustion limited by the oxygen starvation in the SG compartment, the increased pressures owing to the weak flame acceleration during the severe accident initiated by the SBO accident were approximately 260 kPa from the initial pressure of approximately 250 kPa, as shown in Figure 11a. The low pressure increase might have resulted from the low flame speed along the vertical hydrogen column. Another reason might be explained by the fact that the pressure wave generated at the combusted region passed through the open spaces in the upper region of the large containment, as shown in Figure 11b. If the COM3D could simulate the steam condensation along the containment wall, the peak pressure might decrease from approximately 510 kPa. Through the hydrogen combustion calculation, we found that the calculated peak pressure in the containment by the COM3D did not exceed the fracture pressure 1223 kPa in the absolute pressure, which was imposed on the inner wall of the APR1400 containment [4]. The fracture pressure was generally assumed to be approximately 2.38 times the design pressure of the containment [4].

4. Conclusions and Further Work

We established a multi-dimensional hydrogen analysis system for evaluating a hydrogen release, distribution, and combustion, in the containment of an NPP, using MAAP, GASFLOW, and COM3D. KAERI performed hydrogen combustion analyses for the ENACCEF and THAI tests to estimate the uncertainty of the COM3D prediction, according to the turbulent flame speed models of Bradly, Kawanabe, and Schmidt. Through the hydrogen combustion analyses for the ENACCEF and THAI tests, we developed the analysis methodology for the hydrogen flame acceleration, predicting the peak pressure with an error range of approximately ±10%. We analyzed the hydrogen flame acceleration accident in the APR1400 containment during the severe accident initiated by the SBO accident, using the multi-dimensional hydrogen analysis system, on the basis of the proposed the analysis methodology. In particular, to induce a strong flame acceleration over a long distance, the ignition point was assumed to be around the hydrogen release location in the SG compartment. From the hydrogen combustion calculation results, we found that the pressure buildup was approximately 250 kPa from the initial pressure of the COM3D calculation, because the flame speed did not increase above 300 m/s and the generated pressure wave passed through the open spaces in the upper region of the large containment. The hydrogen combustion results showed that the calculated peak pressure in the containment was lower than the fracture pressure of the APR1400 containment. In future work, we will investigate the laminar flame speed model under the steam presence implemented in the COM3D version 4.10, for a more accurate prediction of the THAI test HD-22. In addition, we will perform the analysis of the hydrogen flame acceleration against a large-scale test of the hydrogen combustion, to increase the applicability of the developed multi-dimensional hydrogen analysis system to the NPP containment.

Author Contributions

Conceptualization, S.B.K. and S.W.H.; methodology, H.S.K.; software, H.S.K. and J.K.; validation, H.S.K.; formal analysis, H.S.K.; investigation, H.S.K.; resources, H.S.K.; data curation, H.S.K.; writing—original draft preparation, H.S.K.; writing—review and editing, S.W.H.; visualization, J.K.; supervision, S.W.H.; project administration, S.W.H.; funding acquisition, S.W.H. All authors have read and agreed to the published version of the manuscript.

Funding

This research was funded by National Research Foundation OF Korea (NRF) grant funded by the Korean government (Ministry of Science, ICT, and Future Planning), grant number No. 2017M2A8A4015277.

Acknowledgments

This work was supported by the National Research Foundation of Korea (NRF) grant funded by the Korean government (Ministry of Science, ICT, and Future Planning) (No. 2017M2A8A4015277).

Conflicts of Interest

The authors declare no conflict of interest.

Nomenclature

cspeed of sound [m/s]
Dαdiffusion coefficient of gas species α [m2/s]
DaDamköhler number
Dtturbulent diffusion coefficient [m2/s]
einternal energy [J]
fprogressive variable [-]
ggravity [m/s2]
henthalpy [J]
kturbulent kinetic energy [m2/s2]
Lintegral length scale [m]
Ppressure [Pa]
Rgas constant [J/kgK]
SLlaminar flame speed [m/s]
Stturbulent flame speed [m/s]
Ttemperature [K]
u’turbulence intensity [m/s]
Uivelocity component [m/s]
Yαmass fraction of species α [-]
Greek Letters
α, βcorrelation constant [-]
εturbulent eddy dissipation [m/s2]
μviscosity [kg/ms]
λthermal conductivity [W/mK]
ρdensity [kg/m3]
ωreaction rate per unit volume [kg/m3s]
χthermal conductivity of mixture gas [W/mK]
σgas expansion coefficient [-]
Subscripts
Llaminar
turturbulence
tturbulence

References

  1. Severe Accident Research Committee. Status of follow-up action from Fukushima accident. In Proceedings of the Workshop of Korea Nuclear Society, Jeju, Korea, 16–18 May 2012. [Google Scholar]
  2. Nuclear Safety and Security Commission. Status of follow-up measures and action plan from Fukushima accident. In Proceedings of the 23rd Committee Meeting, Seoul, Korea, 14 March 2014. [Google Scholar]
  3. Kim, J.; Hong, S.W. Analysis of hydrogen flame acceleration in APR1400 containment by coupling hydrogen distribution and combustion analysis codes. Prog. Nucl. Energy 2015, 78, 101–109. [Google Scholar] [CrossRef]
  4. Korea Hydro & Nuclear Power. Final Safety Analysis Report of Shin-Kori 1&2; KHNP: Kyungju, Korea, 2012. [Google Scholar]
  5. Kotchourko, A.; Lelyakin, J.; Yanez, J.; Halmer, G.; Svishchev, Z.; Xu, Z.; Ren, K. COM3D User/Tutorial Guide; Version 4.10; KIT: Karlsruhe, Germany, 2015. [Google Scholar]
  6. Kang, H.S.; Kim, J.; Hong, S.W. Evaluation and Selection of a Multi-Dimensional Computational Code for a Hydrogen Combustion and Explosion in the Containment of a Nuclear Power Plant; Technical Report; KAERI: Daejeon, Korea, 2013. [Google Scholar]
  7. Henry, R.E.; Paik, C.Y.; Plys, M.G. MAAP4-Modular Accident Analysis Program for LWR Plants; Fauske and Associates Inc.: Burr Ridge, IL, USA, 1994. [Google Scholar]
  8. Travis, J.R.; Royal, P.; Xiao, J.; Necker, G.A.; Reflinger, R.; Spore, J.W.; Lam, K.L.; Wilson, T.L.; Muller, C.; Nichols, B.D. GASFLOW: A Computational Fluid Dynamics Code for Gases, Aerosols, and Combustion; KIT: Karlsruhe, Germany, 2011. [Google Scholar]
  9. Bentaib, A.; Bleyer, A.; Chaumeix, N.; Schramm, B.; Höhne, M.; Kostka, P.; Movahed, M.; Brähler, T.; Kang, H.S.; Kim, S.B.; et al. Final results of the SARNET Hydrogen deflagration Benchmark effect of turbulence of flame acceleration. In Proceedings of the 5th ERMSAR-2012, Cologne, Germany, 21–23 March 2012. [Google Scholar]
  10. Bentaib, A.; Bleyer, A.; Meynet, N.; Chaumeix, N.; Schramm, B.; Höhne, M.; Kostka, P.; Movahed, M.; Worapittayaporn, S.; Brähler, T.; et al. SARNET Hydrogen deflagration Benchmark: Main outcomes and conclusions. Ann. Nucl. Energy 2014, 74, 143–152. [Google Scholar] [CrossRef]
  11. Kotchourko, A.; Bentaib, A.; Fischer, K.; Chaumeix, N.; Yanez, J.; Benz, S.; Kudryakov, S. ISP-49 on Hydrogen Combustion; Technical Report, NEA/CSNI/R (2011); OECD-NEA: Paris, France, 2012. [Google Scholar]
  12. Kanzleiter, T.; Gupta, S.; Fisher, K.; Ahrens, G.; Langer, G.; Kuhnel, A.; Poss, G. Hydrogen and Fission Product Issues Relevant for Containment Safety Assessment under Severe Accident Conditions; Final Report, 1501326-FR 1, OECD-NEA THAI Project; OECD-NEA: Paris, France, 2010. [Google Scholar]
  13. Launder, B.E.; Sharma, B.I. Application of the energy-dissipation model of turbulence to the calculation of flow near a spinning disc. Lett. Heat Mass Transf. 1974, 1, 131–138. [Google Scholar] [CrossRef]
  14. Kang, H.S.; No, H.C.; Kim, S.B.; Kim, M.H. Methodology of CFD analysis for evaluating H2 explosion accidents in an open space. Int. J. Hydrog. Energy 2015, 40, 3075–3090. [Google Scholar] [CrossRef]
  15. Kang, H.S.; No, H.C.; Kim, S.B. Application of the developed CFD analysis methodology to H2 explosion accidents in an open space. Int. J. Hydrog. Energy 2017, 42, 1306–1317. [Google Scholar] [CrossRef]
  16. Kang, H.S.; Hong, S.W. CFD analysis of hydrogen combustion under spray operation with a modified TFC model. Presented at the OECD/NEA THAI2 Project 6th Meeting, Eschborn, Germany, 10–12 June 2014. [Google Scholar]
  17. Yanez, J.; Kotchourko, A.; Lelyakin, J. Hydrogen deflagration simulations under typical containment conditions for nuclear safety. Nucl. Eng. Des. 2012, 250, 678–686. [Google Scholar] [CrossRef]
  18. Movahed-Shariat-Panahi, M.A. Recommendation for maximum allowable mesh size for plant combustion analyses with CFD codes. Nucl. Eng. Des. 2012, 253, 360–366. [Google Scholar] [CrossRef]
  19. Kotchourko, A.; Lelyakin, J.; KIT, Karlsruhe, Land Baden-Württemberg, Germany. Personal communication, 2016.
  20. Bentaib, A.; Cataldo, C.; Chaumont, B.; Chevalier-Jabet, K. Evaluation of the impact PARs have on the hydrogen risk in the reactor containment: Methodology and application to PSA level 2. Sci. Technol. Nuclear Install. 2010, 2010, 1–7. [Google Scholar] [CrossRef]
  21. Kang, H.S.; Kim, J.; Kim, S.B.; Hong, S.W. Numerical analysis for a hydrogen combustion phenomenon in the APR1400 containment during severe accidents using a multi-dimensional hydrogen analysis system. In Proceedings of the WORTH-8, Yeosu, Korea, 22–24 October 2017. [Google Scholar]
Figure 1. The ENACCEF Facility [9].
Energies 13 06151 g001
Figure 2. COM3D results for the ENACCEF RUN153 Test. (a) Comparison of the pressure behavior between the test data and the COM3D results. (b) Comparison of the flame speed between the test data and the COM3D results. (c) Calculated gas temperature as time passes (time unit—millisecond).
Energies 13 06151 g002aEnergies 13 06151 g002b
Figure 3. THAI facility [12].
Energies 13 06151 g003
Figure 4. COM3D results for the THAI test HD-15. (a) Measured and calculated temperatures along the centerline of the vessel. (b) Comparison of pressure at the elevation 7.7 m between the test data and the COM3D results.
Energies 13 06151 g004aEnergies 13 06151 g004b
Figure 5. COM3D results for the THAI test HD-22. (a) Measured and calculated temperatures along the centerline of the vessel. (b) Comparison of pressure at the elevation 7.7 m between the test data and the COM3D results.
Energies 13 06151 g005aEnergies 13 06151 g005b
Figure 6. Temperature contours on the center plane for the Test HD-15 by COM3D. (a) Calculation by the Bradley model; and (b) Calculation by the Kawanabe model.
Energies 13 06151 g006
Figure 7. MAAP and GASFLOW results for the SBO accident. (a) Iso-surface of H2 10% in the grid model of CASFLOW and COM3D. (b) Predicted hydrogen and steam generation rate by MAAP.
Energies 13 06151 g007aEnergies 13 06151 g007b
Figure 8. Initial Conditions of the COM3D Calculation for the Severe Accident. (a) Hydrogen Concentration; (b) Oxygen Concentration; (c) Steam Concentration; (d) Temperature; (e) Pressure; and (f) Turbulent Kinetic Energy.
Energies 13 06151 g008aEnergies 13 06151 g008b
Figure 9. Calculated temperature for the hydrogen flame acceleration by COM3D. (a) Temperature distribution as time passes. (b) Temperature behaviors and flame speeds from P1 to P13.
Energies 13 06151 g009
Figure 10. Calculated concentrations of hydrogen, oxygen, and steam, according to time variation.
Energies 13 06151 g010
Figure 11. Predicted pressure for the hydrogen flame acceleration by COM3D. (a) Pressure distributions as time passes. (b) Pressure behavior from P1 to P13.
Energies 13 06151 g011
Table 1. Initial condition of the ENACCEF RUN153 Test [9].
CaseH2 Con. (%)Steam Con. (%)Air Con. (%)Temp (℃)Pressure (bar)
RUN15313087251.0
Table 2. Initial conditions of the THAI HD-15 and HD-22 Test [12].
CaseH2 Con. (%)Steam Con. (%)Air Con. (%)Temp (℃)Pressure (bar)
HD-159.93090.0792.51.50
HD-229.902565.1091.91.48
Table 3. Proposed COM3D analysis methodology for the hydrogen flame acceleration.
ParameterModel
  • Explicit solver
2nd order Total Variation Diminishing
  • Combustion model
KYLCOM+
  • Turbulent flame speed model
Kawanabe
  • Wall function
Low Re number
  • CFL number
< 0.9
  • RED number
< 0.4
Publisher’s Note: MDPI stays neutral with regard to jurisdictional claims in published maps and institutional affiliations.

