Article

Numerical Simulation of the Air Cooling System for Scientific Payload Rack on a Space Station

1
School of Aeronautic Science and Engineering, Beihang University, Beijing 100191, China
2
Institute of Engineering Thermophysics, North China University of Water Resources and Electric Power, Zhengzhou 450045, China
3
Advanced Research Center of Thermal and New Energy Technologies, Xingtai Polytechnic College, Xingtai 054035, China
*
Author to whom correspondence should be addressed.
Energies 2020, 13(22), 6145; https://doi.org/10.3390/en13226145
Submission received: 16 October 2020 / Revised: 8 November 2020 / Accepted: 19 November 2020 / Published: 23 November 2020
(This article belongs to the Section J: Thermal Management)

Abstract

:
The space scientific payload rack is a multifunctional experimental platform, and the requirements of the environmental temperature index are different for diversified experimental modules inside. The air cooling system is an important part of the rack thermal control system. A new type of air cooling system with small size and flexible arrangement is proposed in this paper, that is, micro air ducts with pinhole-sized air vents. The rack physical models of new and traditional air cooling modes are established, respectively. The numerical simulation of the inner air flow is carried out by Ansys Fluent CFD software (Ansys Inc., Canonsburg, PA, USA), which verifies that compared with the traditional method, the temperature field and flow field of the new air cooling method are more uniform, and the heat sources located at the edge of the rack can also be cooled better.

1. Introduction

The International Space Station (ISS) is an earth orbiting research facility that allows many astronauts to work and live for a long time, and its mission is to perform scientific, technological and commercial application research activities in a microgravity environment [1]. The ISS is not only a human outpost in near-earth orbit [2], but also an international science laboratory with the most advanced scientific facilities to support basic research in various physical and biological sciences [3,4]. The advantage of conducting scientific research on the space station is that astronauts can enter the microgravity environment frequently and operate experiments continuously for a long time [5]. At present, the projects that have been carried out on the space station involve various fields, such as technology development for exploration, physical science in microgravity, biological science in microgravity, human research program, observing the earth and educational activities [6].
Scientific experiments on the ISS require the support of Environmental Control Subsystem (ECS) in the experimental platform [7,8]. Equipment for biological science research, such as Cell Biology Experiment Facility (CBEF) which occupies one half of an International Standard Payload Rack (ISPR), and the Standard Interface Glovebox (SIGB) have a Temperature and Humidity Control System (THCS), which controls the culture temperature of biological samples [9]. The Combustion Integrated rack (CIR) provides the opportunity to conduct combustion experiments in microgravity on the ISS. The rack also has ECS including water thermal control, air thermal control, fire detection/suppression and gas interfaces [10]. Expedite the Processing of Experiments to Space Station (EXPRESS) is a standardized payload rack system designed to support science payloads in several disciplines. The internal Avionics Air Assembly (AAA) provides air cooling for rack components and payloads, and also supports smoke detection within the rack [11].
The thermal control design of the space scientific payload platform provides an independent experimental environment with higher control accuracy and technical index than that of the spacecraft platform, which is helpful to eliminate the interference of environmental factors in the experimental process. The thermal control system of the scientific experiment rack includes three modes: the liquid cooled plate cooling, the air circuit cooling and the combination of cold plate and air circuit cooling. Kim et al. suggested a kind of spacecraft thermal control hardware, which is composed of two parallel channels: heat pipe (HP) and solid-liquid phase change material (PCM). It is mainly used for intermittent work and high heat dissipation components with short working time [12]. Ben-Yuan Cai et al. proposed an indirectly coupled thermal control fluid loop system with an independent fluid loop in the rack. Intermediate heat exchangers, pumps and regulating valves are added to the rack. The independent and precise control of the experimental payload temperature in the rack is realized [13]. M. Lappa et al. performed fluid dynamics simulations of the fluid velocity and direction in the ISS Mice Drawer System (MDS), as well as oxygen and carbon dioxide levels in a steady state. The uniformity of the flow in the cages prevents the accumulation of impurities [14]. Although some of the thermal control research is not directed at the space station, the techniques are worth learning. Kourosh Nemati et al. conducted experimental and computational study on the closed server cabinet. A water/air heat exchanger is installed inside the cabinet, and chilled water is introduced from outside. Rear door mounted fans provide power for air circulation [15]. Christopher B. Delgado et al. have studied the effect of air flow and heat transfer in the telecommunication cabinet through experiment and numerical simulation, and have compared the results of experiment and simulation [16]. Chao Dang et al. suggested a cooling system using pulsating heat pipe and inner ducts in the rack of data center, and performed numerical simulations on its heat transfer performance. Air ducts are arranged in the rack to avoid mixing of hot and cold air [17].
In the case of large thermal load in the rack, it is necessary to add air cooling system to enhance heat dissipation. Chong-Chao He et al. calculated that the thermal control scheme of combining air cooling and liquid cooling can better meet the different temperature control requirements of instruments and samples in the space test platform [18]. The EXPRESS rack, the European Drawer Rack (EDR) and the Fluid Science Laboratory (FSL) are all cooled by a combination of air and liquid cooling [19,20]. The air cooling system for the experimental payload is independent of the ventilation system in the cabin [21]. At present, many scholars have conducted a lot of research on the thermal control system of space payload platform, but studies on the uniformity of flow field and temperature field of air cooling system in the rack are still rare. Based on the combination of liquid cooling and air cooling, this rare field is studied in this paper. A new air cooling method of micro air ducts with pinhole-sized air vents is presented, and its heat transfer performance is compared with that of the traditional air cooling method by numerical simulation.

2. Conception of Air Cooling System for Scientific Payload Rack on Space Station

2.1. Traditional Air Cooling System of Rack and Problems

At present, there are two commonly used air cooling methods. Figure 1a shows a centralized forced air cooling. The air is cooled by the central heat exchanger and then fed into the rack by air ducts to cool the various payloads [22]. The structure of this system is simple and easy to design. However, because the cold and hot channels are not separated, the whole rack is prone to the phenomenon of “under cold and upper hot”. When the heat load inside rack increases, it is necessary to increase the total air supply or reduce the gas outlet temperature of the central heat exchanger, which increases the power consumption of the system and is not conducive to system optimization. Another method is to install gas-liquid heat exchanger in each rack, and the air forms an independent circulation in the closed rack [23], as shown in Figure 1b. The air ducts are centrally installed in the rear of the rack [24]. There are a variety of layout according to the position of air inlet and the angle of air supply. This method effectively solves the problem of large thermal load of individual rack and avoids mutual influence between racks. The air cooling system of each rack is set separately, so that the control is more flexible. However, the concentrated speed of air inlets affects the uniformity of the flow field, which is prone to local “hot spots” [25].
The structure of the rack is compact. Either of the above systems takes up a large internal space, as well as the uniformity of the flow field and temperature field is poor. In this paper, the 45° upper and the 120° lower air supply of the second method mentioned above are compared with the new air cooling method [26].

2.2. Idea and Possible Advantages of New Air Cooling System

2.2.1. Coupled Mode of New Air Cooling System and Liquid Circuit

In this paper, a new type of air cooling system is designed to cool the payload platform of the rack in combination with liquid cooling. The coupling method is shown in Figure 2. The three upper floors of the rack are experimental space, which can be connected to various experimental load modules. The bottom floor is the equipment space, where the intermediate heat exchanger, pump components, gas-liquid heat exchanger, fan and other important thermal control accessories are located [13]. The air cooling system is mainly composed of gas-liquid heat exchanger, fan and air ducts. The air in the rack is driven by the fan to circulate. After absorbing the waste heat, the air is sent to the gas-liquid heat exchanger which is cooled by the cooling medium, and then sent to the payload platform of the rack. The gas-liquid heat exchanger and cold plates are in parallel. Through the intermediate heat exchanger, waste heat is transferred from cold plates and gas-liquid heat exchanger to the medium temperature liquid loop and finally discharged through the space station radiator.

2.2.2. Description of New Air Cooling System and Anticipated Advantages

The idea is to use micro air ducts as thin as the medical infusion tubes, as shown in Figure 3, the micro air ducts with a diameter of only 3 mm or so of the new air cooling system are covered with pinhole-sized air inlets. The air ducts of each layer are arranged in parallel, and each layer is provided with a centralized air outlet. This method may have advantages of small system size, flexible arrangement and uniform air supply. The layout of the air ducts is various, this paper has only studied the arrangement of one side wall in the rack.
The research in the scientific payload rack involves multiple disciplines, so the position and shape of thermal loads in the rack are different. Complex heat sources are placed in the scientific payload rack to be realistic. In order to facilitate heat dissipation, heat sources with the largest heat load are placed in the middle of each layer, heat sources with smaller heat load are placed in the upstream of the cold airflow and others with larger heat load are placed in the downstream of the cold airflow. Table 1 shows the specific parameters of heat sources.

2.3. Model Establishment and Research Procedure

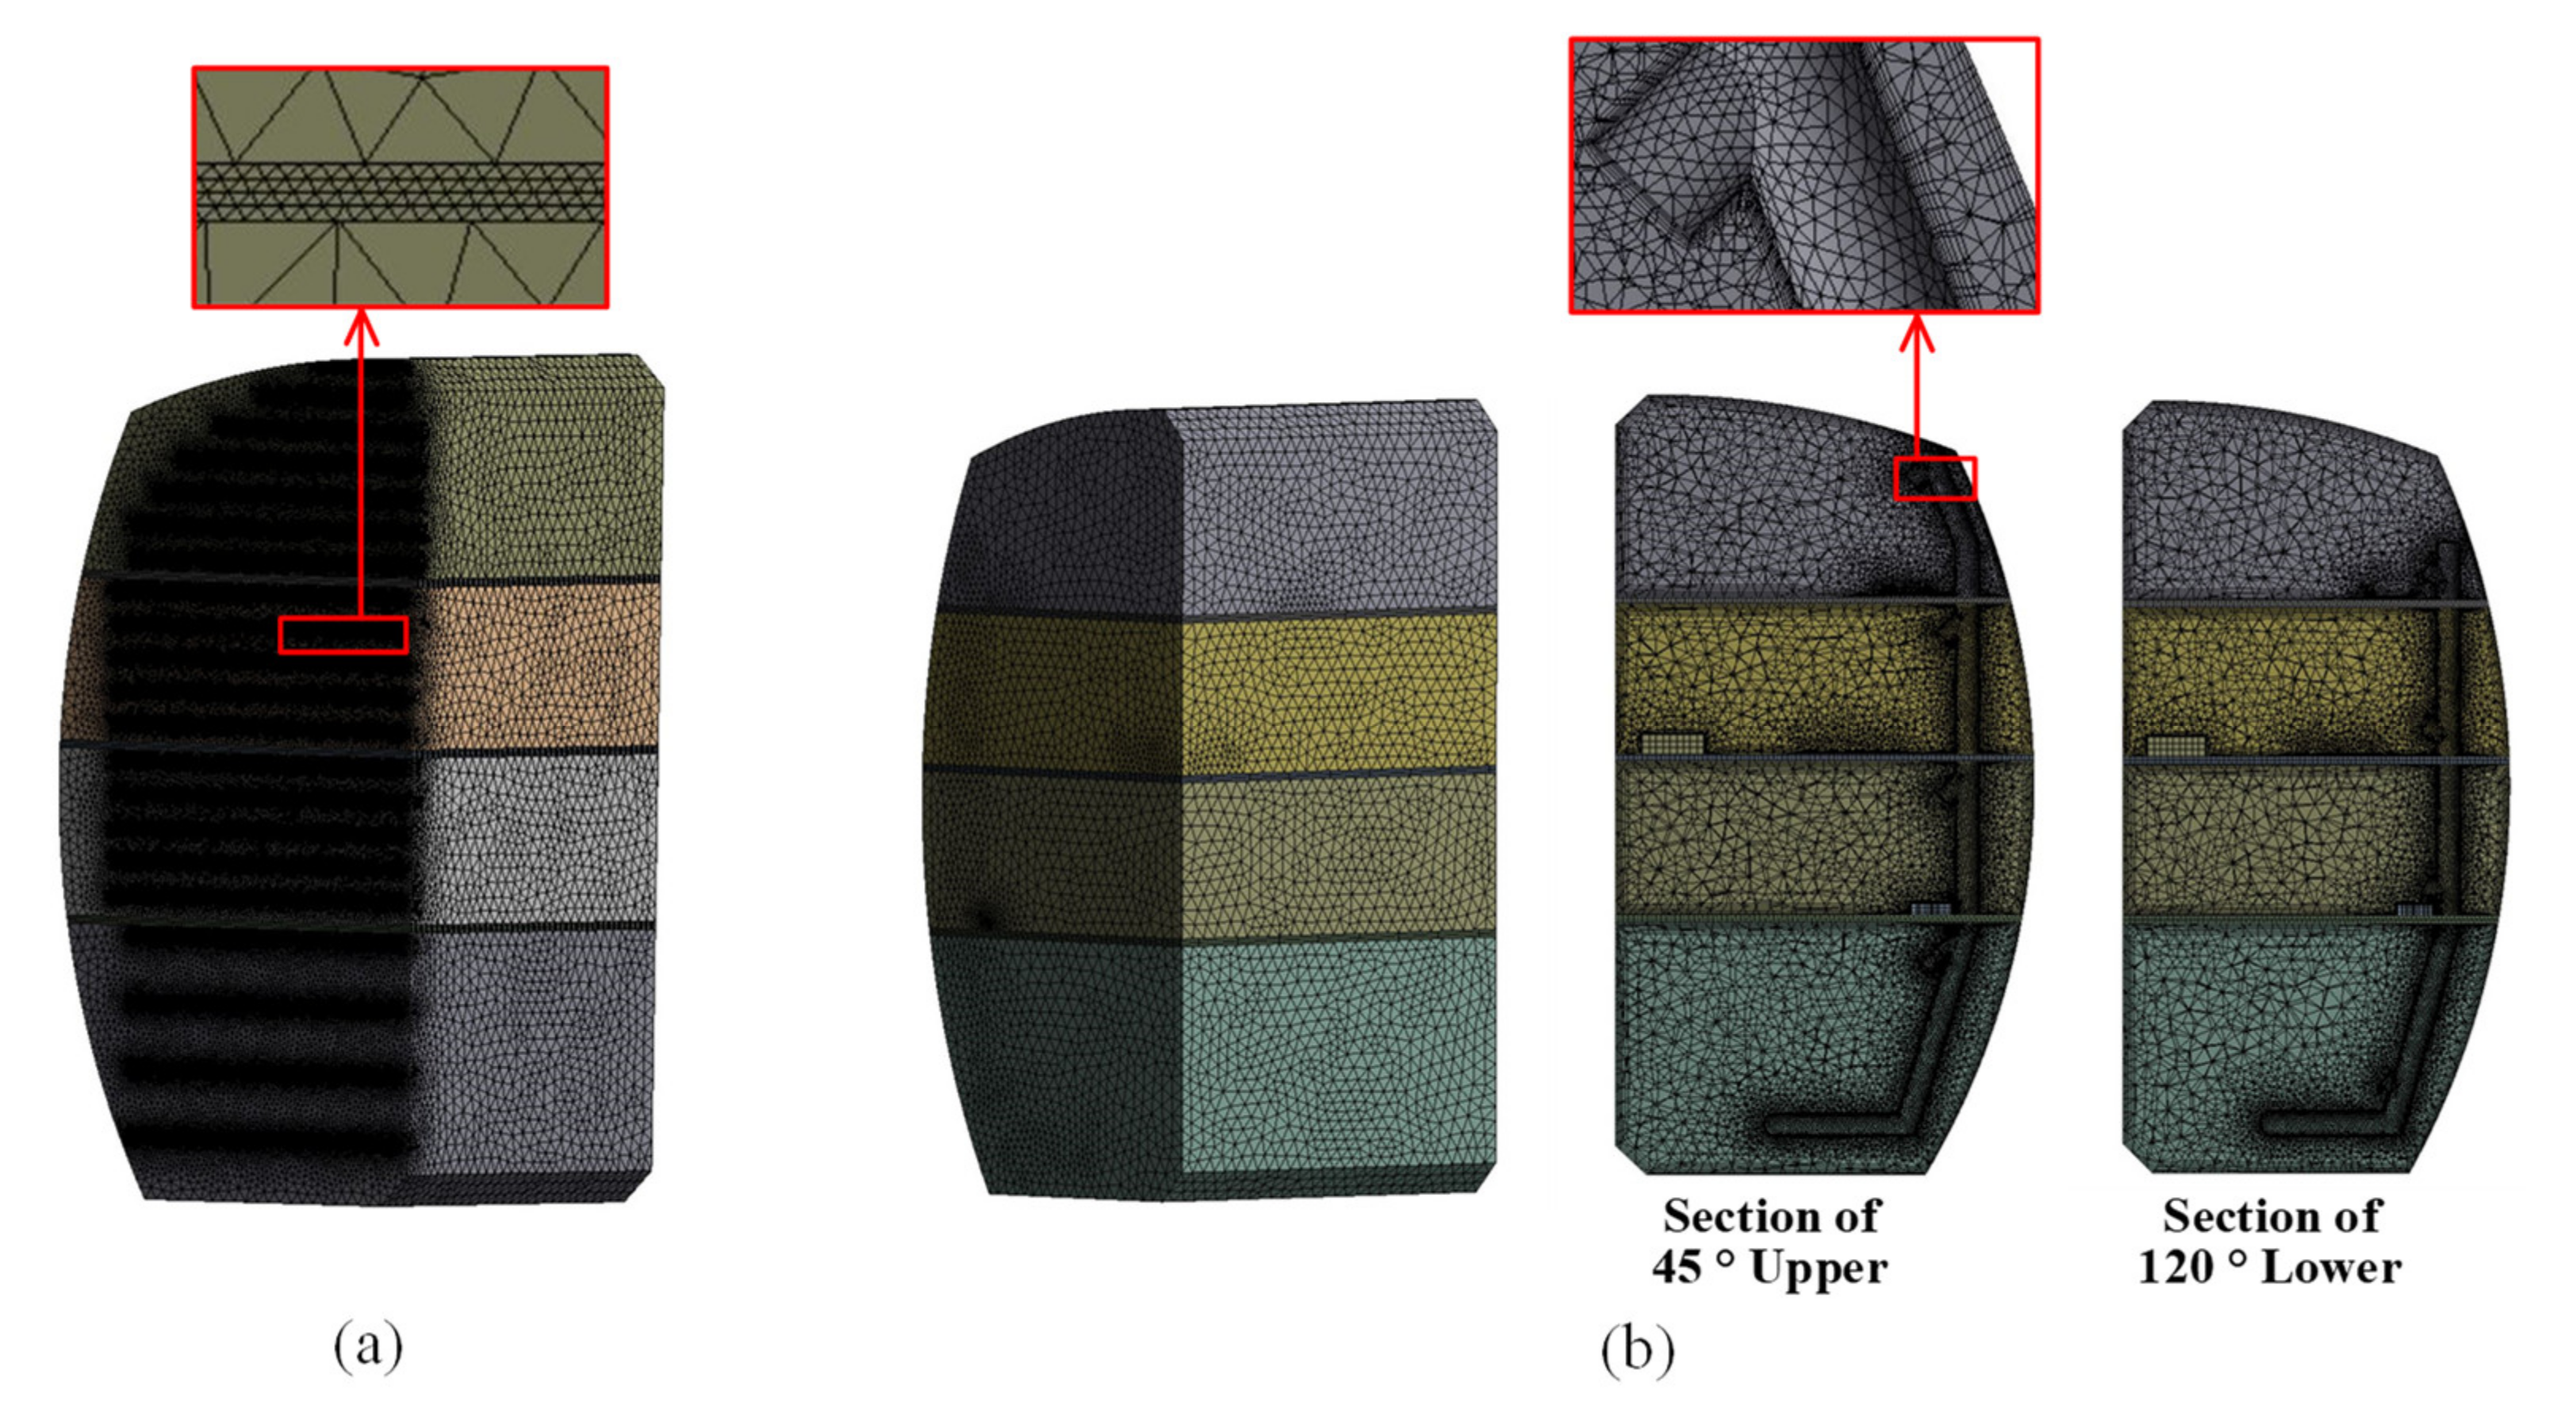
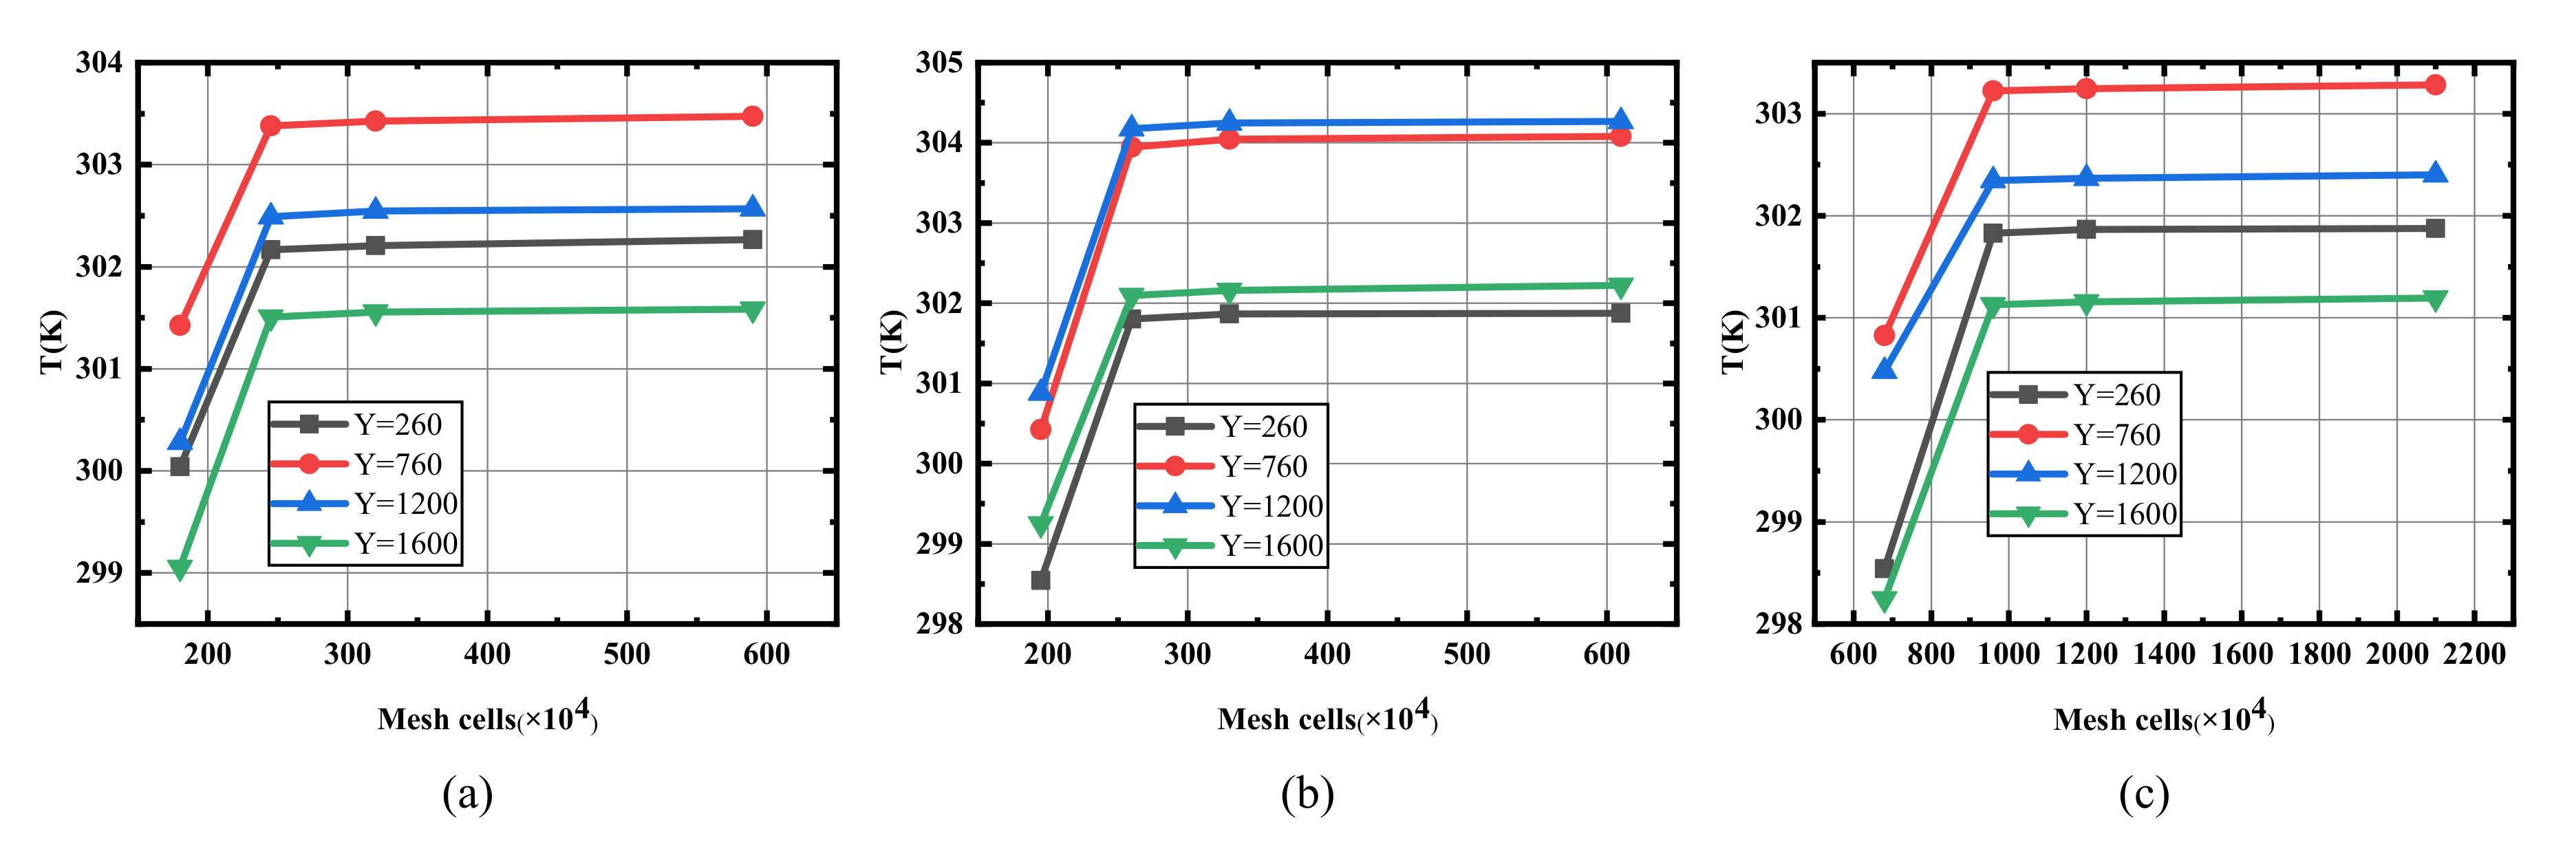
2.3.1. Physical Model and Mesh Generation

Figure 4 shows the rack geometric model of the air cooling system. It is based on the EXPRESS rack of the International Space Station. The basic structure consists of graphite-epoxy composite panels, support frames and connection attachments forged from aluminum and titanium. The rear of the rack is designed as an approximate arc to make full use of the space inside the space station [27]. The air ducts and vents of the traditional systems are centrally set in the rear of the rack, and the air supply angles are, respectively, 45° upper air supply and 120° lower air supply. The air ducts of new air cooling system are uniformly arranged on one side wall of the rack. Due to the small size of air ducts and vents, in order to reduce the difficulty of simulation, these air ducts are ignored in the physical model. In addition, the dense pinhole-sized air vents are also equivalent to the long strip vents. The air supply velocity decreased linearly along the length of long stripe vents. As shown in Figure 5, the unstructured grid is used here.
In order to ensure the grid independence, each model is divided into four different grid-numbers for simulation. The average temperatures of different sections (in the y direction) in the rack are compared. As shown in Figure 6, when the grid-numbers increase to a certain number, the differences of calculation results are not significant. Therefore, the grid-numbers in this numerical study are obtained through the grid independence study. The grid-number of traditional 120° lower air supply is 2,450,000, that of traditional 45° upper air supply is 2,600,000, and that of new air cooling system is 9,600,000. In order to adapt to the narrow parts of the geometric models, the minimum size of the mesh is set at 1 × 10⁻³ mm. The large aspect ratio and skewness are avoided by densifying the areas of wall boundary layers, vents, heat sources and cold plates. The aspect ratio is about 3.5 and the maximum skewness is about 0.88.

2.3.2. Numerical Model

(1)
Simplification of numerical model
The airflow movement within a ventilated enclosed space is complex, and the flow state is mainly turbulent flow [16,28]. In order to simplify the calculation, the following assumptions are assumed:
The airflow in the rack is steady state.
(a)
The effect of radiation can be ignored.
(b)
The air in the rack is low speed and incompressible.
(2)
Establishment of numerical model
On the basis of assumptions, the continuity equation can be expressed as [29]:
d i v ( ρ u ) = 0
where u represents the air velocity vector and ρ is the density of the air.
The momentum conservation equation can be expressed as [29]:
ρ u t + d i v ( ρ u u ) = p x + d i v ( μ   g r a d u ) + S u ρ v t + d i v ( ρ v u ) = p y + d i v ( μ   g r a d v ) + S v ρ w t + d i v ( ρ w u ) = p z + d i v ( μ   g r a d w ) + S w
where μ represents the dynamic viscosity of air; p is the pressure acting on the fluid element; S u , S v , and S w represent the generalized source terms in the three directions.
The energy conservation equation can be expressed as [29]:
ρ T t + d i v ( ρ u T ) = d i v ( λ c p g r a d T ) + S T
where λ represents the thermal conductivity; c p is the specific heat capacity and S T is the internal heat source term of the fluid.
The air flow in rack is a complex turbulent flow. In this paper, the turbulence model is the standard k - ε model.
The k equation and ε equation can be expressed as [30]:
Turbulent kinetic energy equation ( k equation):
ρ k t = x j [ ( μ + μ t σ k ) k x j ] + G k ρ ε
Turbulent dissipation rate equation ( ε equation):
ρ ε t = x j [ ( μ + μ t σ ε ) ε x j ] + ε k ( C ε 1 G k C ε 2 ρ ε )
where G k represents the generation term of turbulent kinetic energy; C ε 1 and C ε 2 are constants, C ε 1 = 1.45, C ε 2 = 1.92; σ k and σ ε are Prandtl numbers, σ k = 1.0, σ ε = 1.3.
(3)
Setting of boundary conditions
According to the actual situation of the project, the following boundary conditions are adopted in this paper.
(a)
Wall boundary: under the assumption of continuous medium, the non-slip wall condition is applied, that is, the velocity of the fluid relative to the wall is zero, k , ε and T are treated by the enhanced wall functions method. The convective heat transfer coefficient between the rack wall and the ambient air outside is 0.37 w / ( m 2 K ) . The ambient temperature outside the rack is 27 °C.
(b)
Inlet boundary: the velocity inlet boundary condition is adopted. The air velocities and temperatures of the air inlets are 0.5 m / s and 24 °C.
(c)
Outlet boundary: pressure boundary condition is adopted.
The near-wall treatment method used in this paper is the enhanced wall functions. This method is suitable for complex flow and requires dense grid near the wall, that is, y+ < 5. The y+ values of the models are calculated by Fluent software, as shown in Figure 7. It can be seen that most y+ values are less than 5, which meets the requirement of the turbulence model in this paper.

2.3.3. Research Procedure of Numerical Simulation

In this paper, the air convection and heat transfer in an enclosed space under steady state conditions has been studied. Figure 8 shows the solving process of numerical simulation. First, we need to establish the mathematical model, which includes: the establishment of control equations and the setting of boundary conditions. Second, we must determine the discretization method, that is, generate mesh and use the second order upwind finite volume discrete scheme to discretize control equations. Finally, the SIMPLE algorithm is used to solve the discretized equations, and the algebraic solution of each mesh is obtained to get the approximate solution of fluid computing domain.

3. Results and Discussion

The temperature field pictures and velocity vector diagrams of the sections in the rack have been obtained by numerical simulation. The selected sections are x = 120 mm, x = 600 mm and x = 900 mm. The color represents the magnitude in the diagrams.

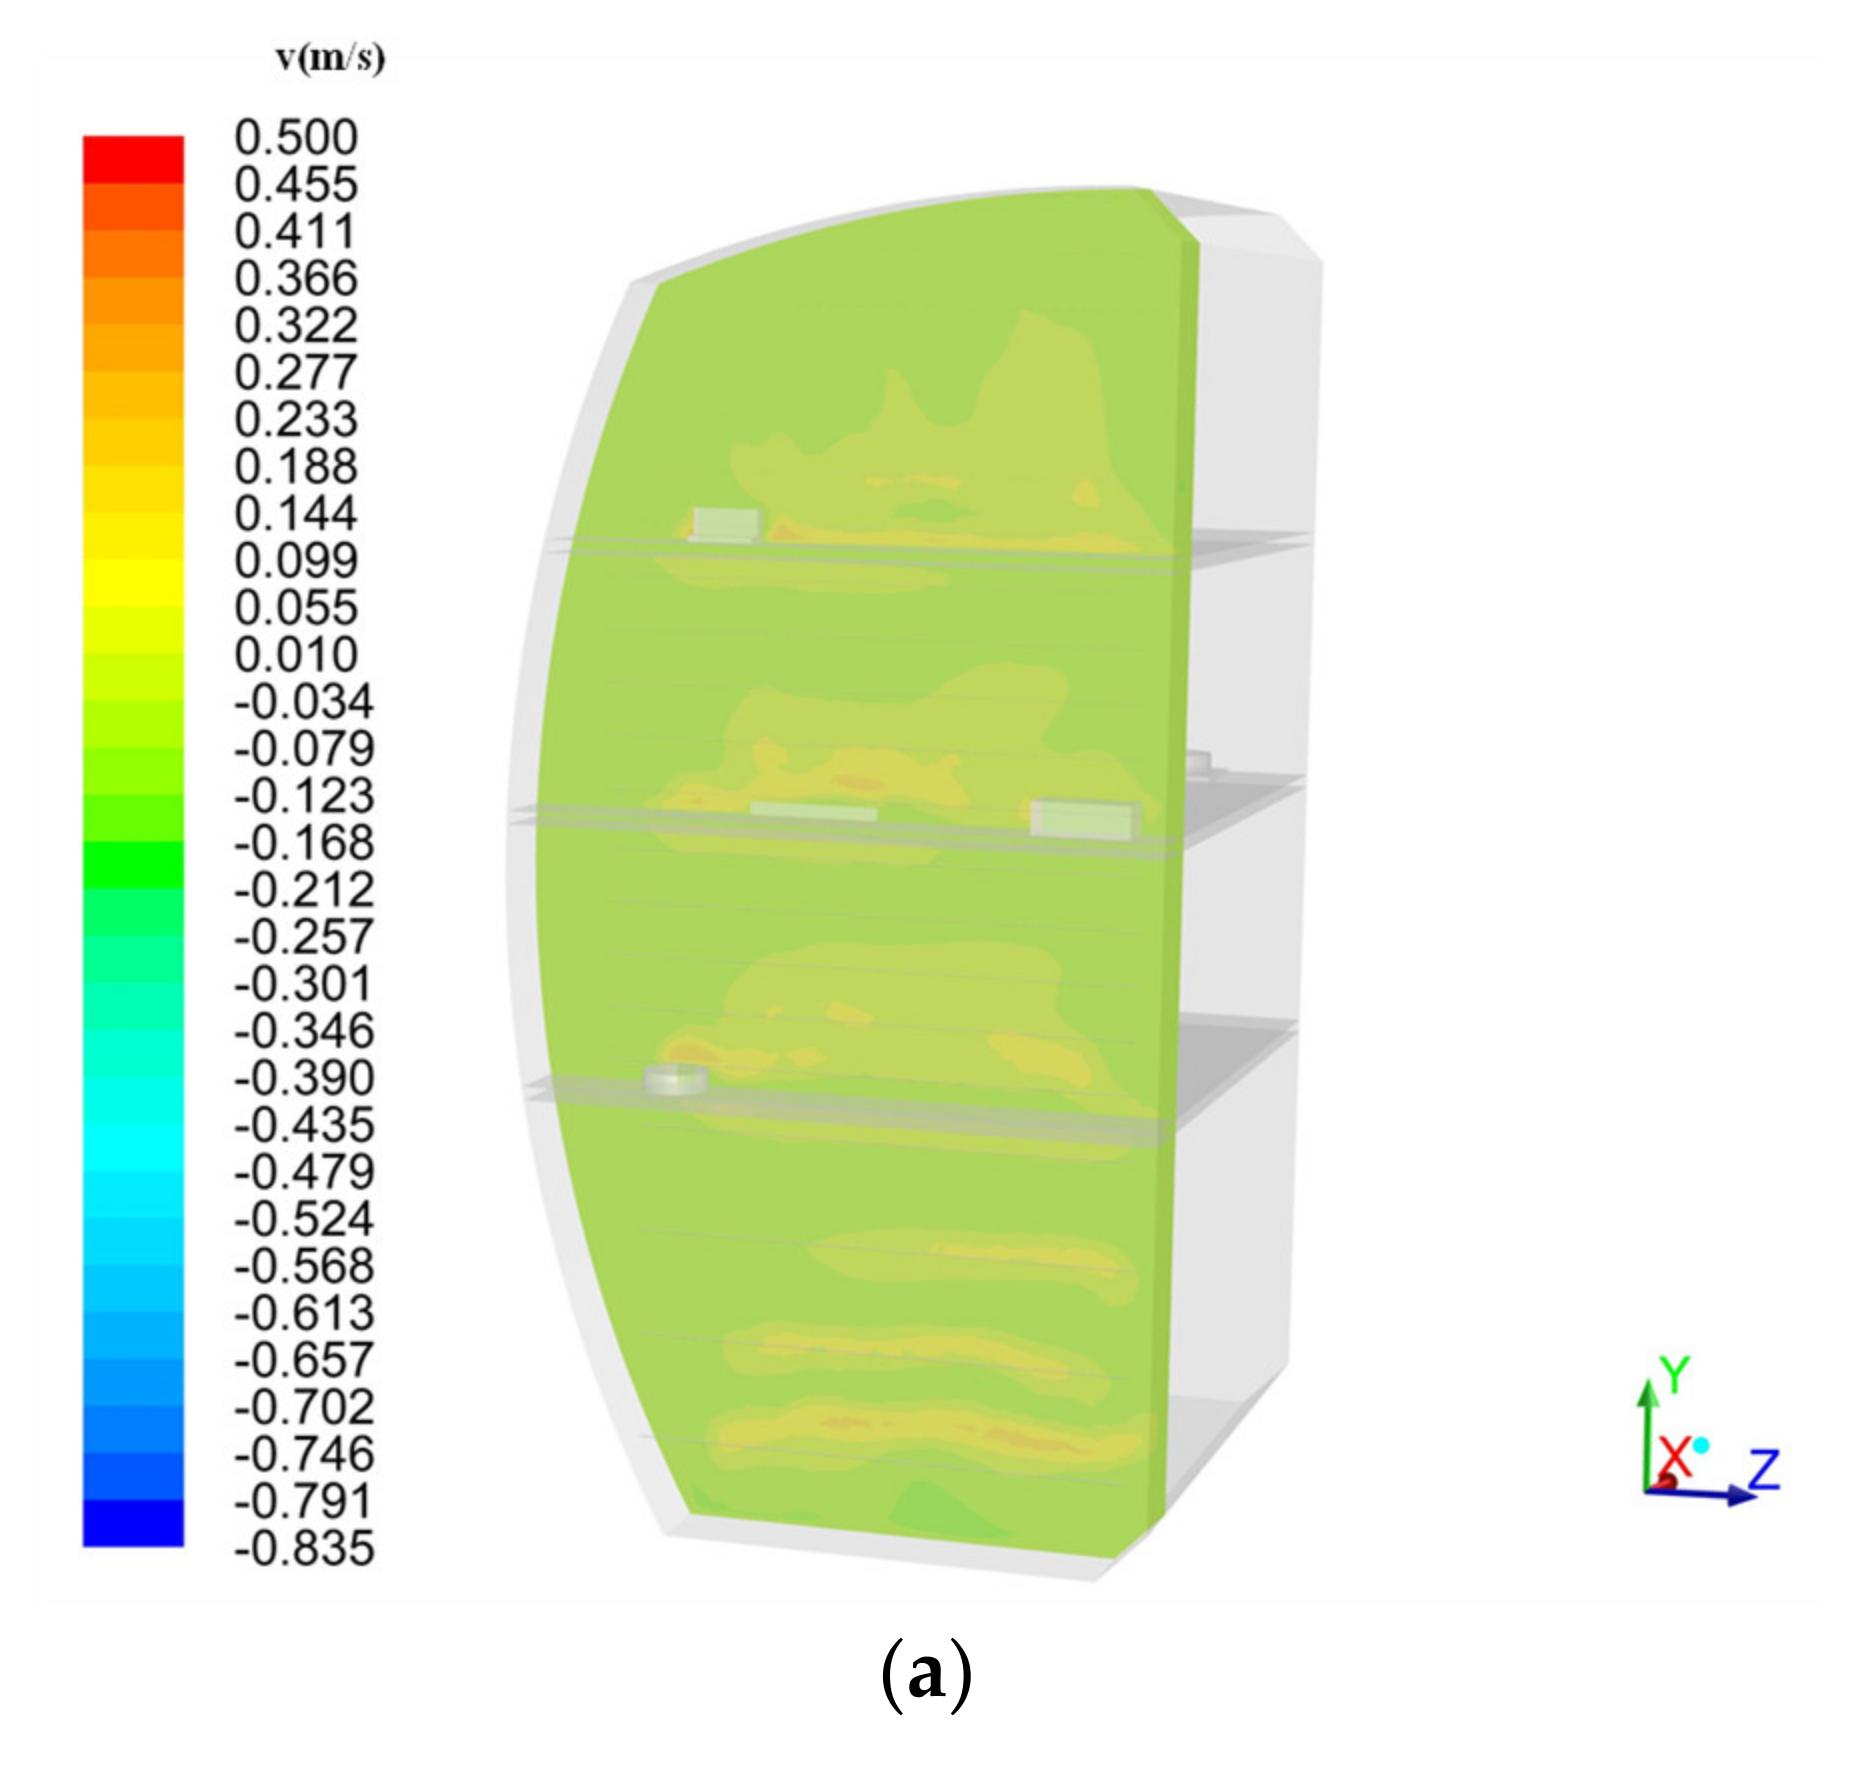
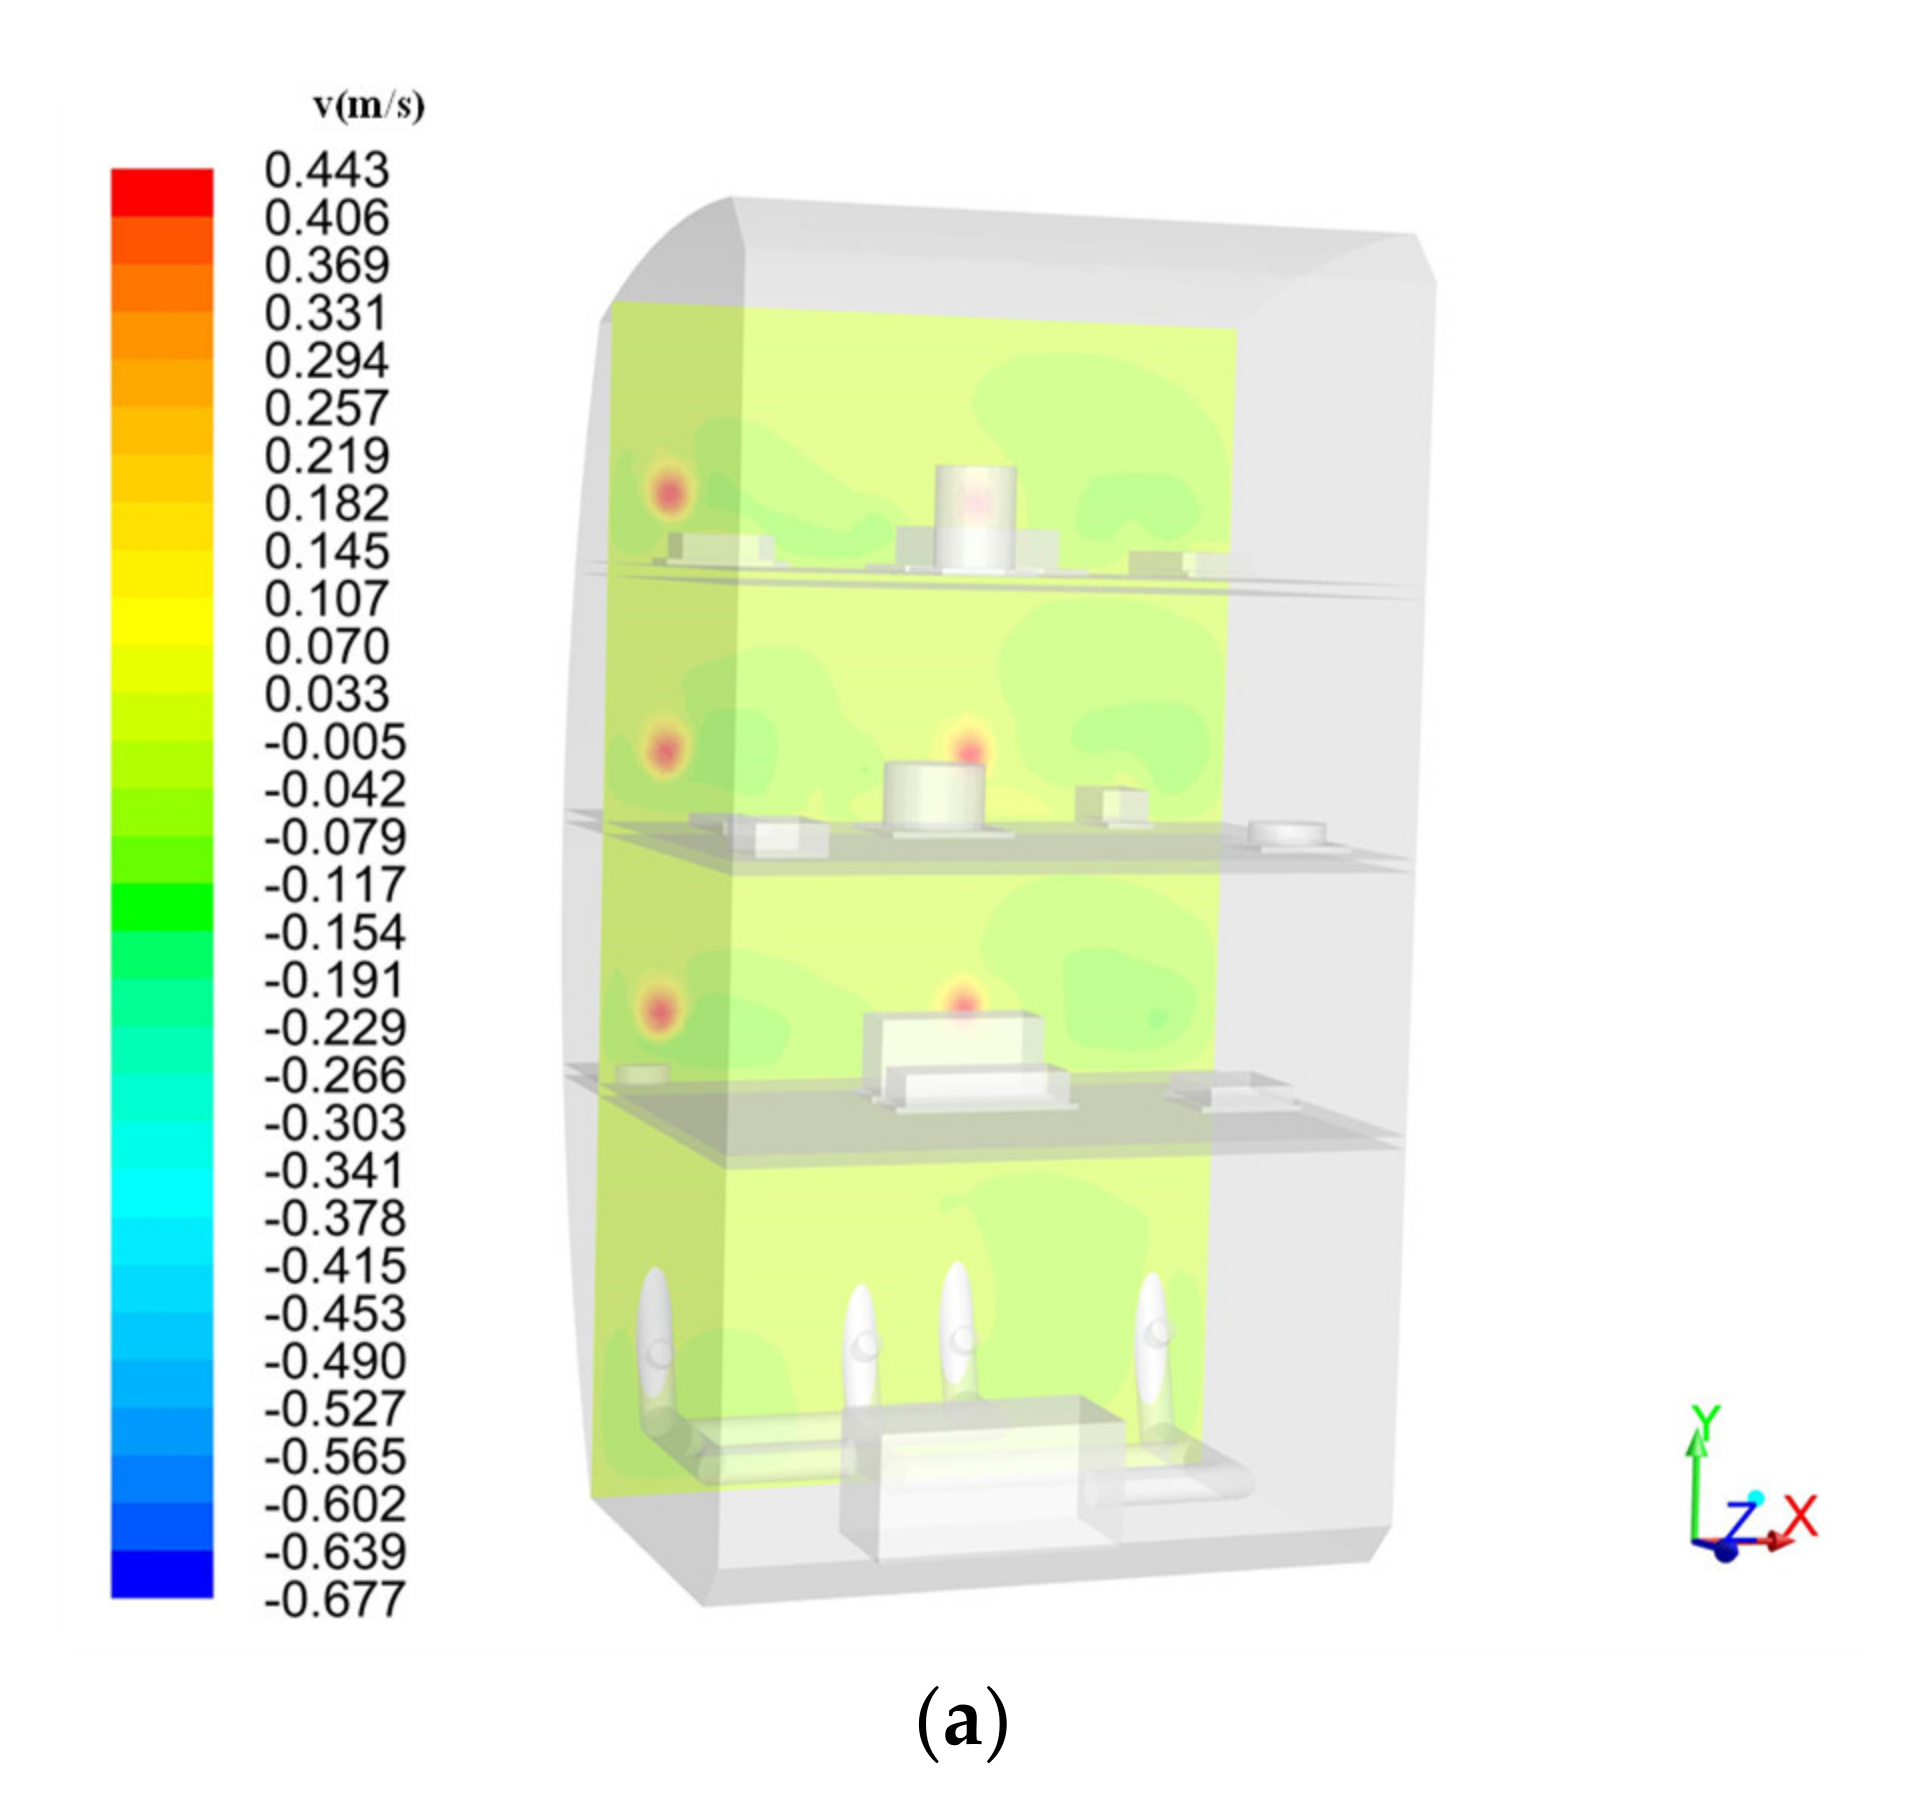
3.1. Temperature and Velocity Distribution of New Air Cooling Mode

Obviously, as shown in Figure 9, the heat sources located at the left edge of the rack have lower temperatures and higher surface air velocities, which is due to the evenly arranged air inlets on the left side wall of the rack. The hot air around the heat sources is entrained by the cold airflow, which makes the surface air velocities of the heat sources increase, so that the heat transfer is enhanced. The heat sources located at the center of the rack have higher temperatures, which is due to the low surface air velocities of the heat sources as shown in the velocity vector diagram, resulting in poor heat transfer. The heat sources located at the right edge of the rack are far away from air inlets, so the surface air velocities are lower, resulting in higher temperatures.
The air ducts of the new air cooling system are small in size and can be arranged close to the heat sources, so even the heat sources at the edge and corner of the rack are cooled better. This new air cooling mode can be flexibly arranged according to the position of heat sources.

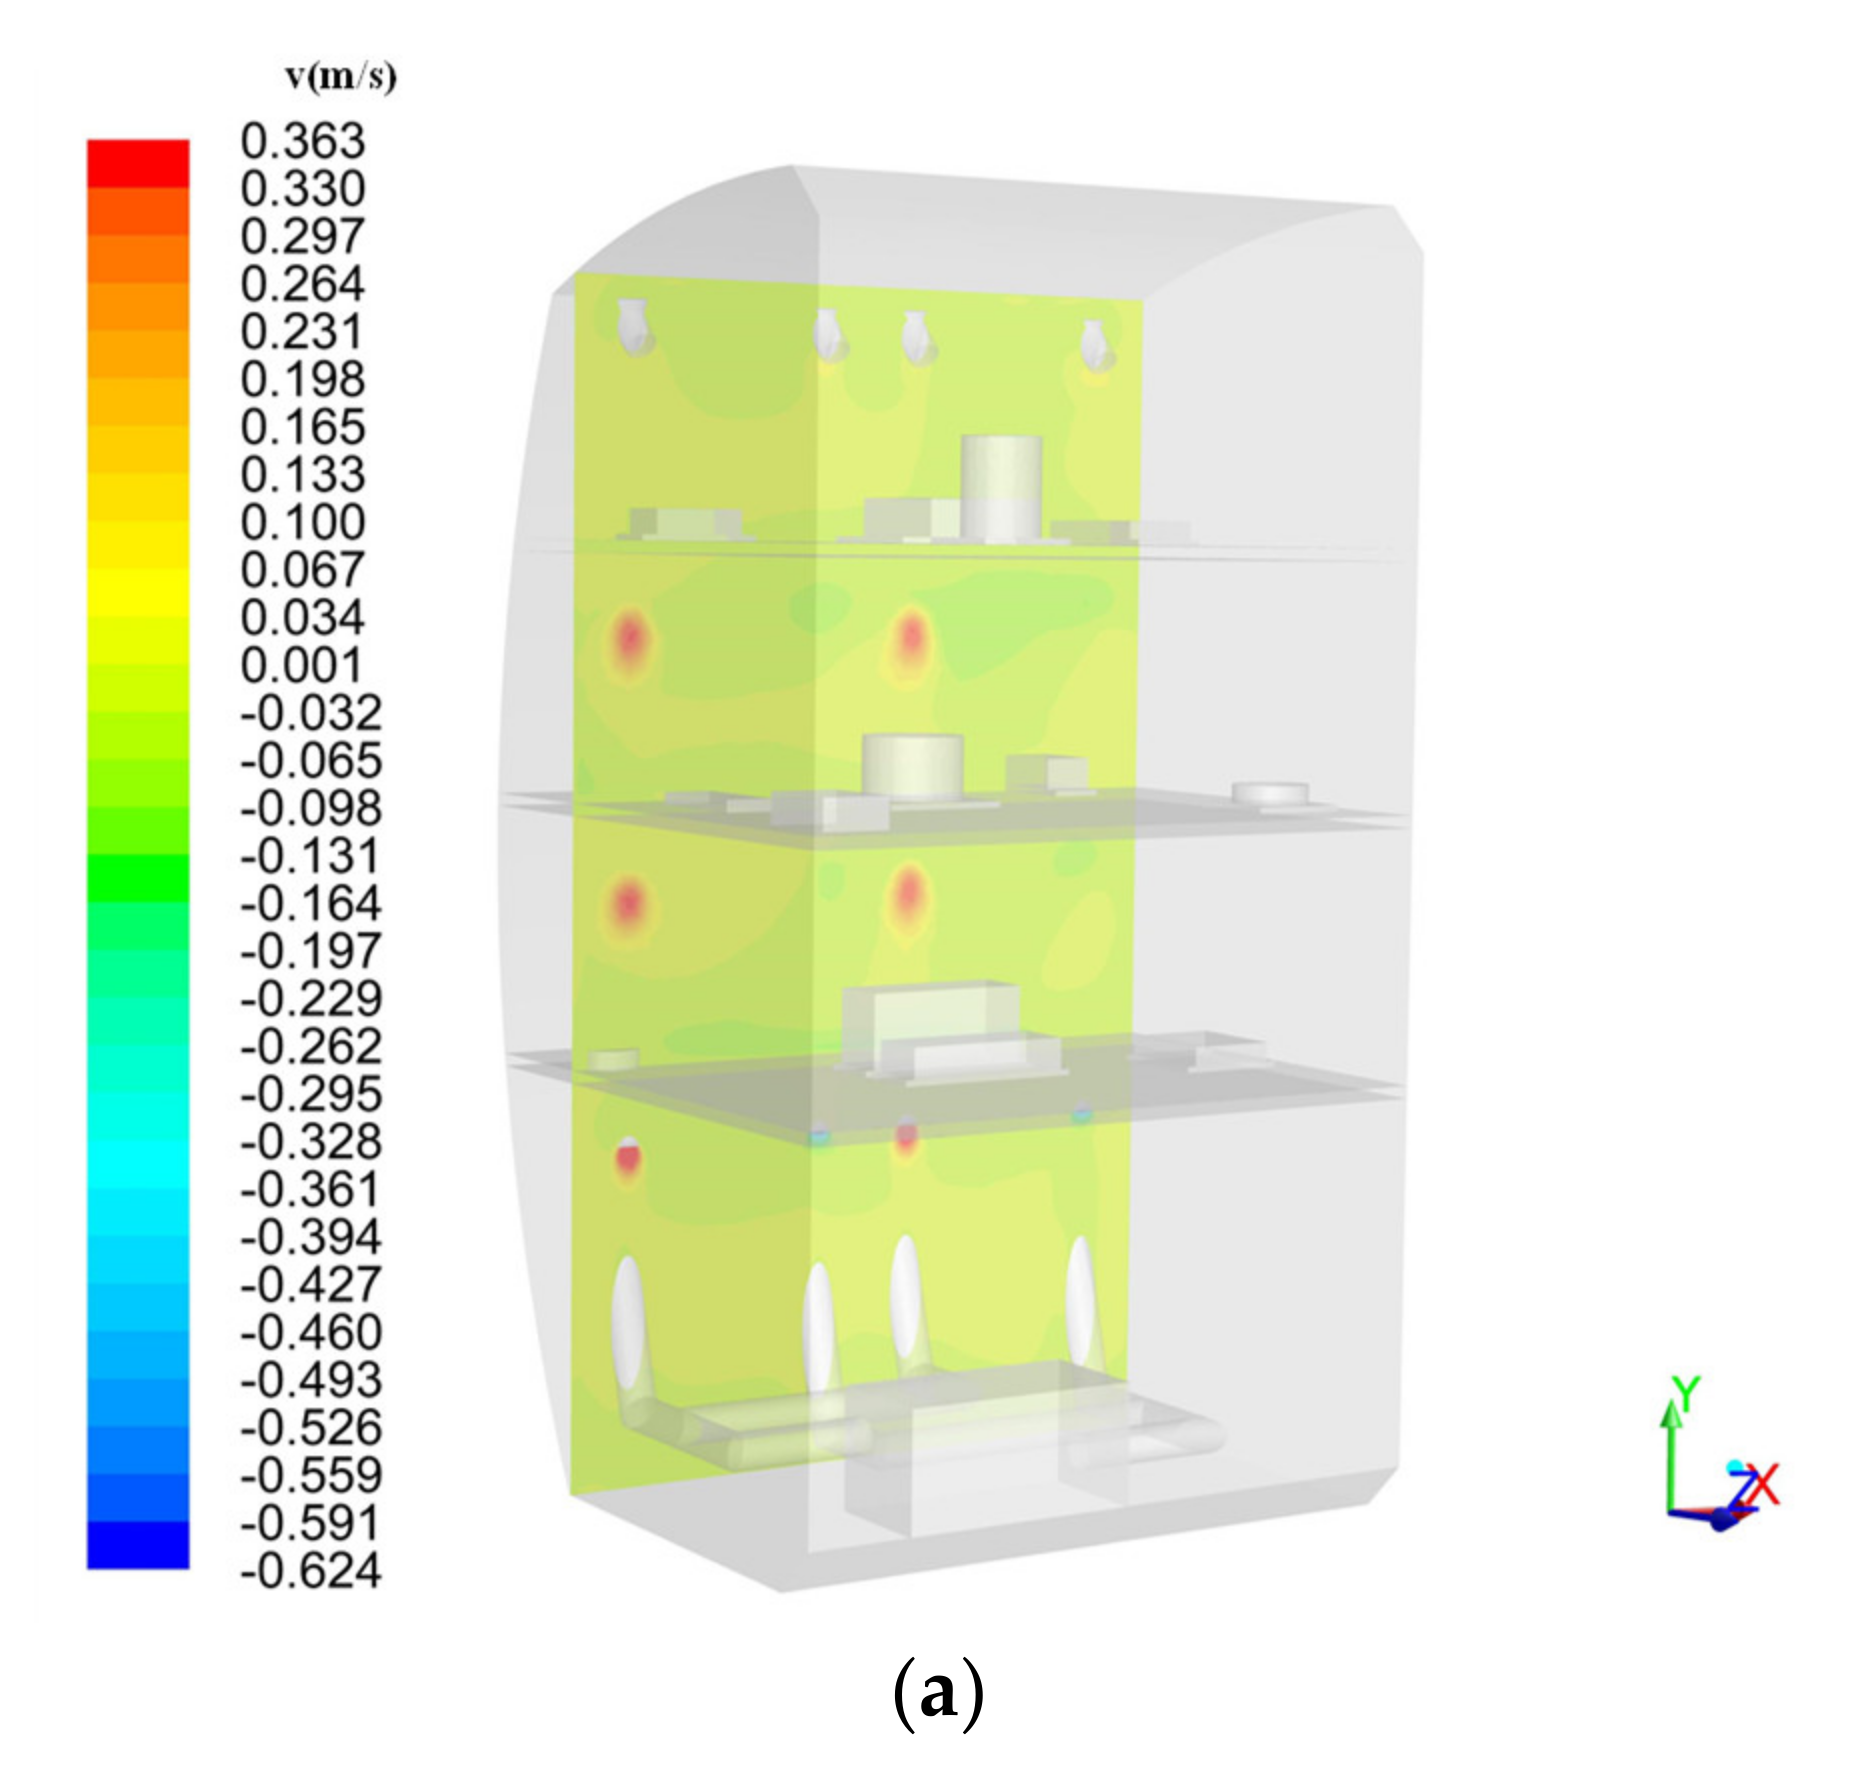
3.2. Temperature and Velocity Distribution of Traditional Air Cooling Mode

It can be inferred from Figure 10 and Figure 11 that when the traditional air cooling method is adopted, the heat sources at the left edge of the rack are not directly scoured by the cold airflow. According to the velocity vector diagrams, the surface air velocities of the heat sources are low, which weakens the heat transfer effect and leads to higher temperatures of the heat sources.
For the heat sources at the center of the rack, the cooling effect of the traditional 45° upper air supply is better than that of the traditional 120° lower air supply. The cold air of the former can directly scour the heat sources here in large quantities, while the cold air of the latter is sprayed to the roof and then bounced back to the heat sources, resulting in the decrease of air flow and intensity.
It can be seen from the velocity vector diagrams that the cooling effect of the heat sources at the right edge of the rack is better when the traditional air cooling of 120° lower air supply is adopted, because the surface air velocities of the heat sources are greater than that of the 45° upper air supply.
Therefore, the traditional air cooling method only has a good cooling effect on the heat sources that can be directly scoured by the cold air flow. Due to the large size, the air ducts and tuyeres cannot be flexibly arranged, so the cooling effect of the heat sources located at the edge which cannot be washed by cold airflow is poor.

3.3. Comparison of Air Cooling Modes

The heat sources surface temperatures of new air cooling method are compared with that of the traditional air cooling method, as shown in Table 2. Obviously, the heat sources on the left edge of the rack are cooled better when the new air cooling method is used, and the temperatures are about 3–15 °C lower than that of the traditional air cooling method. The heat sources located at the center of the rack have the lowest temperatures when the traditional 45° upper air supply is adopted, which are about 1~7 °C lower than that of the new air cooling method. The heat sources located at the right edge of the rack have the lowest temperatures when the traditional 120° lower air supply is adopted, which are about 1–4 °C lower than that of the new air cooling method.
In order to compare the ambient temperatures in the rack of the three air cooling modes, the average temperatures of different sections (in the y direction) of each layer are compared, as shown in Figure 12. It can be seen that the environmental temperatures in the rack are lower than that of the traditional air cooling method when the new air supply method is adopted, that is, the cooling effect of the new air supply method on inner air is better than that of the traditional air cooling method.
Take the sections perpendicular to the direction of air supply to observe the velocity distribution diagrams (Figure 13, Figure 14 and Figure 15). The cold airflow of the traditional way is blown out intensively and in large quantities, which forms large velocity gradients around the air inlets, and the velocities are relatively concentrated. The velocity gradients along the center line of the air supply trajectory are large, which is most obvious at the sections close to the air inlets, the velocity gradients of the sections far away from the air inlets are small. Due to the phenomenon of too concentrated speed, the cold airflow cannot be well diffused, resulting in poor heat exchange effect with hot air in the rack, so the air temperatures in the rack are high.
The air inlets of the new mode are evenly and intensively arranged. The cold airflow is soft and dispersed when it is fed in, forming a uniform velocity field. Even the velocity distribution diagrams of the sections near the air inlets have smaller velocity gradients, and the velocity field is uniform. Due to the dispersed and uniform cold airflow can fully mix with the hot air in the rack and conduct heat exchange, the air temperatures in the rack are relatively low.

4. Conclusions

By means of numerical simulation, the new air cooling method proposed in this paper has been analyzed and compared with the current traditional air cooling method. The uniformity of temperature field and velocity field of the new method has been verified. The main conclusions are as follows:
As the cold airflow of the traditional air cooling system is blown out from the tuyeres more intensively, so is the cooling effect on heat sources, which can best be directly scoured by a large amount of cold. However, the ducts take up a lot of space in the rack, and the layout is restricted and inflexible. In addition, the velocities near air inlets are concentrated and the velocity gradients are obvious, so the heat transfer effect is poor with the air inside rack, resulting in high ambient temperatures.
The micro air ducts of the new air cooling system occupy less space and can be flexibly arranged according to the locations of the heat sources. In addition, as the cold airflow of the new air cooling mode is dispersed, rather than being concentrated and blown out in large quantities, so it can be seen from the velocity distribution diagrams that the changes of the airflow velocities in the rack are small, and the velocities are evenly distributed. This causes the ambient temperature in the rack to be lower than that of traditional methods, so the heat exchange effect is better. On the contrary, the cold airflow is scattered, which makes it impossible to scour heat sources at a concentrated speed. Therefore, some heat sources that cannot be reached by cold airflow are cooled poorly. However, the disadvantage can be made up by adding air ducts near the heat sources with large heat generation or combining with the liquid cooled plate cooling mode.

Author Contributions

Conceptualization, Y.-Z.L.; methodology, Y.-Y.L.; software, Y.-Y.L.; validation, Y.-Z.L.; formal analysis, B.-Y.C.; investigation, B.-Y.C.; resources, Y.-Z.L.; data curation, J.-X.L.; writing—original draft preparation, Y.-Y.L.; writing—review and editing, E.-H.L.; supervision, Y.-Z.L.; project administration, Y.-Z.L. All authors have read and agreed to the published version of the manuscript.

Funding

The project was funded by the Open Research Fund of Key Laboratory of Space Utilization, Chinese Academy of Sciences, through grant no. LSU-JCJS-2017-1.

Conflicts of Interest

The authors declare no conflict of interest.

References

  1. Brekke, M.; Duncan, E. International Space Station Alpha Payload Accommodations. In Proceedings of the Space Programs & Technologies Conference & Exhibit, Huntsville, AL, USA, 27–29 September 1994. [Google Scholar]
  2. Afanasyev, I.B.; Baturin, Y.M.; Belozerskiy, A.G.; Ivanov, I.A.; Lazutkin, A.I.; Lantratov, K.A.; Lisov, I.A.; Lukashevich, V.P.; Marinin, I.A.; Markov, A.E.; et al. World’s Cosmonautics: History, Technology; People RTSoft: Moscow, Russia, 2005; Chapters 9–12, 15, 16, 19, 21. (In Russian) [Google Scholar]
  3. Clark, K.I. Scientific Research Aboard the International Space Station. In Proceedings of the 38th Aerospace Sciences Meeting & Exhibit, Reno, NV, USA, 10–13 January 2000. [Google Scholar]
  4. Wang, J.-X.; Guo, W.; Xiong, K.; Wang, S.N. Review of aerospace-oriented spray cooling technology. Prog. Aerosp. Sci. 2020, 116, 100635. [Google Scholar] [CrossRef]
  5. Pellis, N.R.; North, R.M. Recent NASA research accomplishments aboard the ISS. Acta Astronaut. 2004, 55, 589–598. [Google Scholar] [CrossRef]
  6. Evans, C.; Robinson, J.; Tate-Brown, J. Research on the International Space Station: An Overview. In Proceedings of the 47th AIAA Aerospace Sciences Meeting Including the New Horizons Forum and Aerospace Exposition, Orlando, FL, USA, 5–9 January 2009. [Google Scholar]
  7. Wang, J.-X.; Li, Y.Z.; Liu, X.D.; Shen, C.Q.; Zhang, H.; Xiong, K. Recent active thermal management technologies for the development of energy-optimized aerospace vehicles in China. Chin. J. Aeronaut. 2020, in press. [Google Scholar] [CrossRef]
  8. Wang, J.-X.; Li, Y.-Z.; Li, J.-X.; Li, C.; Zhang, Y.; Ning, X.-W. A gas-atomized spray cooling system integrated with an ejector loop: Ejector modeling and thermal performance analysis. Energy Convers. Manag. 2019, 180, 106–118. [Google Scholar] [CrossRef]
  9. Phillips, R.W. Plant Research Facilities on the International Space Station. In Proceedings of the 26th International Conference on Environmental Systems, Monterey, CA, USA, 8–11 July 1996. [Google Scholar] [CrossRef]
  10. OMalley, T.F.; Weiland, K.J. The FCF Combustion Integrated Rack: Microgravity Combustion ScienceOnboard the International Space Station. In Proceedings of the International Space Station Utilization—2001, Cape Canaveral, FL, USA, 15–18 October 2001. [Google Scholar] [CrossRef]
  11. Cruzen, C.; Gibbs, R.; Dyer, S.; Cech, J. Expanding Remote Science Operations Capabilities Onboard the International Space Station. In Proceedings of the 2005 IEEE Aerospace Conference, Big Sky, MT, USA, 5–12 March 2005. [Google Scholar]
  12. Kim, T.Y.; Hyun, B.S.; Lee, J.J.; Rhee, J. Numerical study of the spacecraft thermal control hardware combining solid–liquid phase change material and a heat pipe. Aerosp. Sci. Technol. 2013, 27, 10–16. [Google Scholar] [CrossRef]
  13. Cai, B.-Y.; Wei, H.-Y.; Li, Y.-Z.; Lou, Y.-Y.; Li, T. Dynamic Analysis and Intelligent Control Strategy for the Internal Thermal Control Fluid Loop of Scientific Experimental Racks in Space Stations. Entropy 2020, 22, 72. [Google Scholar] [CrossRef] [Green Version]
  14. Lappa, M.; Castagnolo, D.; Sgambati, A. The fluid-dynamics of the ISS Mice Drawer System under microgravity. Microgravity Space Stn. Util. 2002, 3, 39. [Google Scholar]
  15. Nemati, K.; Murray, B.T.; Sammakia, B. Experimental Characterization and Modeling of a Water-Cooled Server Cabinet. In Proceedings of the Fourteenth Intersociety Conference on Thermal and Thermomechanical Phenomena in Electronic Systems (ITherm), Orlando, FL, USA, 27–30 May 2014; pp. 723–728. [Google Scholar]
  16. Delgado, C.B.; Silva, P.D.; Pires, L.C.; Gaspar, P.D. Experimental study and numerical simulation of the interior flow in a telecommunications cabinet. Energy Procedia 2017, 142, 3096–3101. [Google Scholar] [CrossRef]
  17. Dang, C.; Jia, L.; Lu, Q. Investigation on thermal design of a rack with the pul- sating heat pipe for cooling CPUs. Appl. Therm. Eng. 2017, 110, 390–398. [Google Scholar] [CrossRef]
  18. Chongchao, H.; Hanxun, Z. Fluid Loops in general-purpose space science experimental platform. Chin. J. Space Sci. 2010, 30, 165–169. [Google Scholar]
  19. James, T. Automation Study for Space Station Subsystems and Mission Ground Support Final Report; NASA: Washington, DC, USA, 1985.
  20. Vaccaneo, P.; Gottero, M. The Thermal Environmental Control (TEC) of the Fluid Science Laboratory (FSL): A Combined (Water/Air) Thermal Design Solution for a Columbus Active Rack. In Proceedings of the 31st International Conference on Environmental Systems, Orlando, FL, USA, 9–12 July 2001. [Google Scholar] [CrossRef]
  21. Zengqi, H.; Jingang, H. Spacecraft Thermal Control Technology-Principles and Applications; Beijing Science and Technology of China Press: Beijing, China, 2007. (In Chinese) [Google Scholar]
  22. Accardi, F.; Lobascio, C.; D’Auria, R.; Veneri, R. Impacts of Rack Configuration on Columbus Avionics Air Loop Architecture and Control. In Proceedings of the SAE Technical Paper; 20th lntersociety Conference on Environmental Systems, Williamsburg, VA, USA, 9–12 July 1990. [Google Scholar] [CrossRef]
  23. O’Connor, E.; Nason, R.; Rubalcaba, D.; Klym, J. Space Station Distributed Avionics Air Cooling. In Proceedings of the 24th International Conference on Environmental Systems and 5th European Symposium on Space Environmental Control Systems, Friedrichshafen, Germany, 20–23 June 1994. [Google Scholar] [CrossRef]
  24. Zhang, Y.; Tong, T.F. Thermal control scheme study of scientific experiment rack of new manned space station. Procedia Eng. 2016, 157, 374–381. [Google Scholar] [CrossRef] [Green Version]
  25. Weijia, R.; Zifa, C.; Tiefeng, T.; Qiang, S. Optimization for distributed air loop in space science experiment platform. Chin. J. Space Sci. 2015, 35, 217–223. (In Chinese) [Google Scholar] [CrossRef]
  26. Zhi-Yu, Z.; Bing, X.; Xiang-Ling, K.; De-Min, K. Numerical Simulation of Indoor Heat Transfer with Different Air Conditioner Installation Positions and Blow Angles. Fluid Mach. 2017, 45, 73–77. [Google Scholar]
  27. Boutros, R.; Cory, J.; Beasley, M. Modular Rack Design for Multiple Users. In Proceedings of the 24th International Conference on Environmental Systems and 5th European Symposium on Space Environmental Control Systems, Friedrichshafen, Germany, 20–23 June 1994. [Google Scholar] [CrossRef]
  28. Nie, Q.; Joshi, Y. Multi-Scale Thermal Modeling Methodology for Electronics Cabinets. In Proceedings of the Thermal and Thermomechanical Proceedings 10th Intersociety Conference on Phenomena in Electronics Systems (ITHERM 2006), San Diego, CA, USA, 30 May–2 June 2006; pp. 677–684. [Google Scholar]
  29. Versteeg, H.K.; Malalasekera, W. An Introduction to Computational Fluid Dynamics: The Finite Volume Method; Wiley: New York, NY, USA, 1995. [Google Scholar]
  30. Sheth, D.V.; Saha, S.K. Numerical Study of Thermal Management of Data Centre using Porous Medium Approach. J. Build. Eng. 2019, 22, 200–215. [Google Scholar] [CrossRef]
Figure 1. Diagram of traditional air cooling system. (a) Concentrated air supply cooling mode; (b) Built-in gas-liquid heat exchanger air cooling mode.
Energies 13 06145 g001
Figure 2. Schematic diagram of rack cooling system.
Energies 13 06145 g002
Figure 3. Diagram of new air cooling system.
Energies 13 06145 g003
Figure 4. Geometric model. (a) Geometric model of new air cooling system; (b) Geometric model of traditional 120° lower air supply; (c) Geometric model of traditional 45° upper air supply.
Energies 13 06145 g004
Figure 5. Mesh configuration. (a) Mesh configuration of new air cooling system; (b) Mesh configuration of traditional air cooling system.
Energies 13 06145 g005
Figure 6. Analysis of grid independence. (a) Traditional 120° lower air supply; (b) Traditional 45° upper air supply; (c) New air cooling system.
Energies 13 06145 g006
Figure 7. Y+ values near the wall. (a) Traditional 120° lower air supply; (b) Traditional 45° upper air supply; (c) New air cooling system.
Energies 13 06145 g007
Figure 8. Solving process of numerical simulation.
Energies 13 06145 g008
Figure 9. Temperature distribution and velocity vector of new air cooling system. (a) x = 120 mm, (b) x = 600 mm, and (c) x = 900 mm.
Energies 13 06145 g009aEnergies 13 06145 g009b
Figure 10. Temperature distribution and velocity vector of traditional 45° upper air supply. (a) x = 120 mm, (b) x = 600 mm, and (c) x = 900 mm.
Energies 13 06145 g010
Figure 11. Temperature distribution and velocity vector of traditional 120° lower air supply. (a) x = 120 mm, (b) x = 600 mm, and (c) x = 900 mm.
Energies 13 06145 g011
Figure 12. Comparison of ambient temperature in rack. Case 1: new type of air cooling; Case 2: traditional air cooling of 120° lower air supply; Case 3: traditional air cooling of 45° upper air supply.
Energies 13 06145 g012
Figure 13. Velocity distribution in x direction of new air cooling system. (a) x = 120 mm, (b) x = 600 mm, and (c) x = 900 mm.
Energies 13 06145 g013aEnergies 13 06145 g013b
Figure 14. Velocity distribution in z direction of traditional 45° upper air supply. (a) x = 320 mm, (b) x = 550 mm, and (c) x = 900 mm.
Energies 13 06145 g014aEnergies 13 06145 g014b
Figure 15. Velocity distribution in z direction of traditional 120° lower air supply. (a) x = 320 mm, (b) x = 550 mm, and (c) x = 900 mm.
Energies 13 06145 g015aEnergies 13 06145 g015b
Table 1. Parameters of heat sources.
No.Thermal LoadLiquid CoolingAir Cooling
Layer 11-1200 w195 w5 w
1-270 w68 w2 w
1-310 w5 w5 w
1-420 w18 w2 w
Layer 22-1255 w250 w5 w
2-22 w-2 w
2-313 w10 w3 w
2-425 w20 w5 w
2-52 w-2 w
2-63 w-3 w
Layer 33-1140 w135 w5 w
3-218 w15 w3 w
3-32 w-2 w
3-4140 w135 w5 w
Layer 46 w-6 w
Table 2. Heat sources temperature of each layer in rack.
No.New Type of Air CoolingTraditional 120° Lower Air Supply Traditional 45° Upper Air Supply
Layer 11-1 41 °C41 °C35 °C
1-2 38 °C37 °C38 °C
1-3 50 °C56 °C65 °C
1-4 32 °C32 °C34 °C
Layer 22-1 35 °C34 °C34 °C
2-2 38 °C41 °C37 °C
2-3 49 °C45℃ 47 °C
2-4 55 °C52 °C53 °C
2-5 34 °C37 °C37 °C
2-6 48 °C46 °C52 °C
Layer 33-1 46 °C45 °C39 °C
3-2 46 °C44 °C45 °C
3-3 43 °C57 °C55 °C
3-4 53 °C49 °C51 °C
Layer 437 °C38 °C34 °C
Publisher’s Note: MDPI stays neutral with regard to jurisdictional claims in published maps and institutional affiliations.

