Article

Pore-Structural Characteristics of Tight Fractured-Vuggy Carbonates and Its Effects on the P- and S-Wave Velocity: A Micro-CT Study on Full-Diameter Cores

State Key Laboratory of Oil and Gas Reservoir Geology and Exploitation, Southwest Petroleum University, Chengdu 610500, China
*
Author to whom correspondence should be addressed.
Energies 2020, 13(22), 6148; https://doi.org/10.3390/en13226148
Submission received: 8 October 2020 / Revised: 17 November 2020 / Accepted: 17 November 2020 / Published: 23 November 2020
(This article belongs to the Special Issue Development of Unconventional Reservoirs 2020)

Abstract

:
Pore structure has been widely observed to affect the seismic wave velocity of rocks. Although taking lab measurements on 1.0-inch core plugs is popular, it is not representative of the fractured-vuggy carbonates because many fractures and vugs are on a scale up to several hundred microns (and greater) and are spatially heterogeneous. To overcome this shortage, we carried out the lab measurements on full-diameter cores (about 6.5–7.5 cm in diameter). The micro-CT (micro computed tomography) scanning technique is used to characterize the pore space of the carbonates and image processing methods are applied to filter the noise and enhance the responses of the fractures so that the constructed pore spaces are reliable. The wave velocities of P- and S-waves are determined then and the effects of the pore structure on the velocity are analyzed. The results show that the proposed image processing method is effective in constructing and quantitatively characterizing the pore space of the full-diameter fractured-vuggy carbonates. The porosity of all the collected tight carbonate samples is less than 4%. Fractures and vugs are well-developed and the spatial distributions of them are heterogeneous causing, even the samples having similar porosity, the pore structure characteristics of the samples being significantly different. The pores and vugs mainly contribute to the porosity of the samples and the fractures contribute to the change in the wave velocities more than pores and vugs.

1. Introduction

During the past 20 years, deep buried carbonate formations have become one of the major sources of natural gas resources in China. Unlike the carbonate formations discovered in the middle-east having a porosity of about 8–25% buried in depths of 2000–4500 m underground, lots of the carbonate gas formations discovered in China are buried over 5000 m in depth and consequently, these formations are usually ‘tight’ having a porosity of less than 6% [1]. The pore structural characteristics of these deep-buried tight carbonates are different from those buried at shallower depths and referred studies are rare. In the seismic exploration, as well as the acoustic-logging evaluation, of the tight fractured-vuggy carbonate formations, a widely-aware challenge is that the seismic and acoustic properties of the carbonate formations depend, not only on the minerals and the porosity, but also the pore structural characteristics, especially for the tight deeply buried carbonates [2,3,4,5,6,7]. This issue becomes further complicated considering the fractures and the vugs developed in the carbonate rocks [8,9]. These challenges aroused interest in characterizing both the pore-structures and elastic properties of the tight fractured-vuggy carbonates in the lab before field formation evaluations.
Thin section observation, mercury injection, gas absorption, nuclear magnetic resonance (NMR), and micro-CT scanning are the popular methods for characterizing the pore structure in lab [10,11,12,13,14,15,16,17,18]. Among these methods, micro-CT scanning has a unique advantage in offering a visible spatial distribution of the pore space, including both the fractures and vugs. Characterizing the pore space of a rock using micro-CT scanning usually contains three major steps: segmenting the 2D pore space from each CT-scanned 2D image, constructing the 3D pore space with all the 2D images, and extracting pore structural parameters to quantitatively characterize the pore structure [19,20,21,22]. Histogram shape, clustering, entropy, object attribute, spatial and local methods are the commonly used threshold segmenting method [23,24]. Parameters widely used to characterize the pore structure are the porosity, tortuosity, connectivity, pore radius distribution, ratio of pore radius over throat radius, fracture orientation, etc. [25,26,27,28,29,30,31,32]. These pore structural parameters along with porosity are then usually used to interpret the behavior of the elastic waves propagating in carbonates [33,34,35]. It has been shown that the porosity–velocity relationship is related to the pore structure, especially those possessing fractures and vugs [36,37,38]. Previous studies are usually carried out on 1.0-inch cores that might not be representative for tight fractured-vuggy carbonates. Moving the lab study from 1.0-inch core plugs to full diameter cores could provide more representative results but adds to the difficulties in acquiring and interpreting the lab data.
One difficulty is the relatively low quality of the micro-CT scanning images. For the full-diameter cores having a diameter of, for example, 6.5 cm, it is relatively hard for the x-ray to penetrate the rock. This fact causes noised micro-CT images and low contrasts between the fractures and the rock matrix. Consequently, image processing, for example, filtering and enhancement, are necessary before segmenting and constructing the pore space of fractured-vuggy carbonates. Averaging and median filtering are commonly used filtering methods [39,40,41]. For the filtering of the micro-CT images of the fractured-vuggy carbonates, the challenge involved in denoising the images are that the method should maintain the details of the pore structure or at least avoid blurring the image. In this consideration, filtering methods, for example, nonlocal means and anisotropic diffusion filtering, that tried to maintain the structural boundaries during filtering might be potentially better [42,43]. For the issue of the low contrasts between the fractures and the matrix, image enhancement techniques are possible solutions [44,45]. One issue involved here is that the ‘background energy’ of the figure might not be uniform and, in this consideration, the methods that can calibrate the background energy difference might be potentially better, for example, the top-bottom hat method [46,47].
Another aspect of difficulties is in linking the wave speeds to the porosity and pore-structural parameters. The pore space of 1.0-inch core plugs contains limited amounts of fractures and vugs while that of the full-diameter cores is usually composed of pores, fractures, and vugs that affect the wave speeds of carbonates comprehensively. Thus, the cross plot of wave speeds over porosity might be scattered [38,48]. It is not clear which pore-structural parameter is the key in linking the wave velocity to the porosity, especially for the fractured-vuggy carbonates.
In this paper, we first develop an image-processing method to improve the quality of each the micro-CT scanned image of the full diameter cores, construct the pore space, and extract the pore structural characteristics. Then, these pore structural parameters are related to the wave speeds to analyze the effect of pore structure on the wave velocity of fractured-vuggy carbonates.

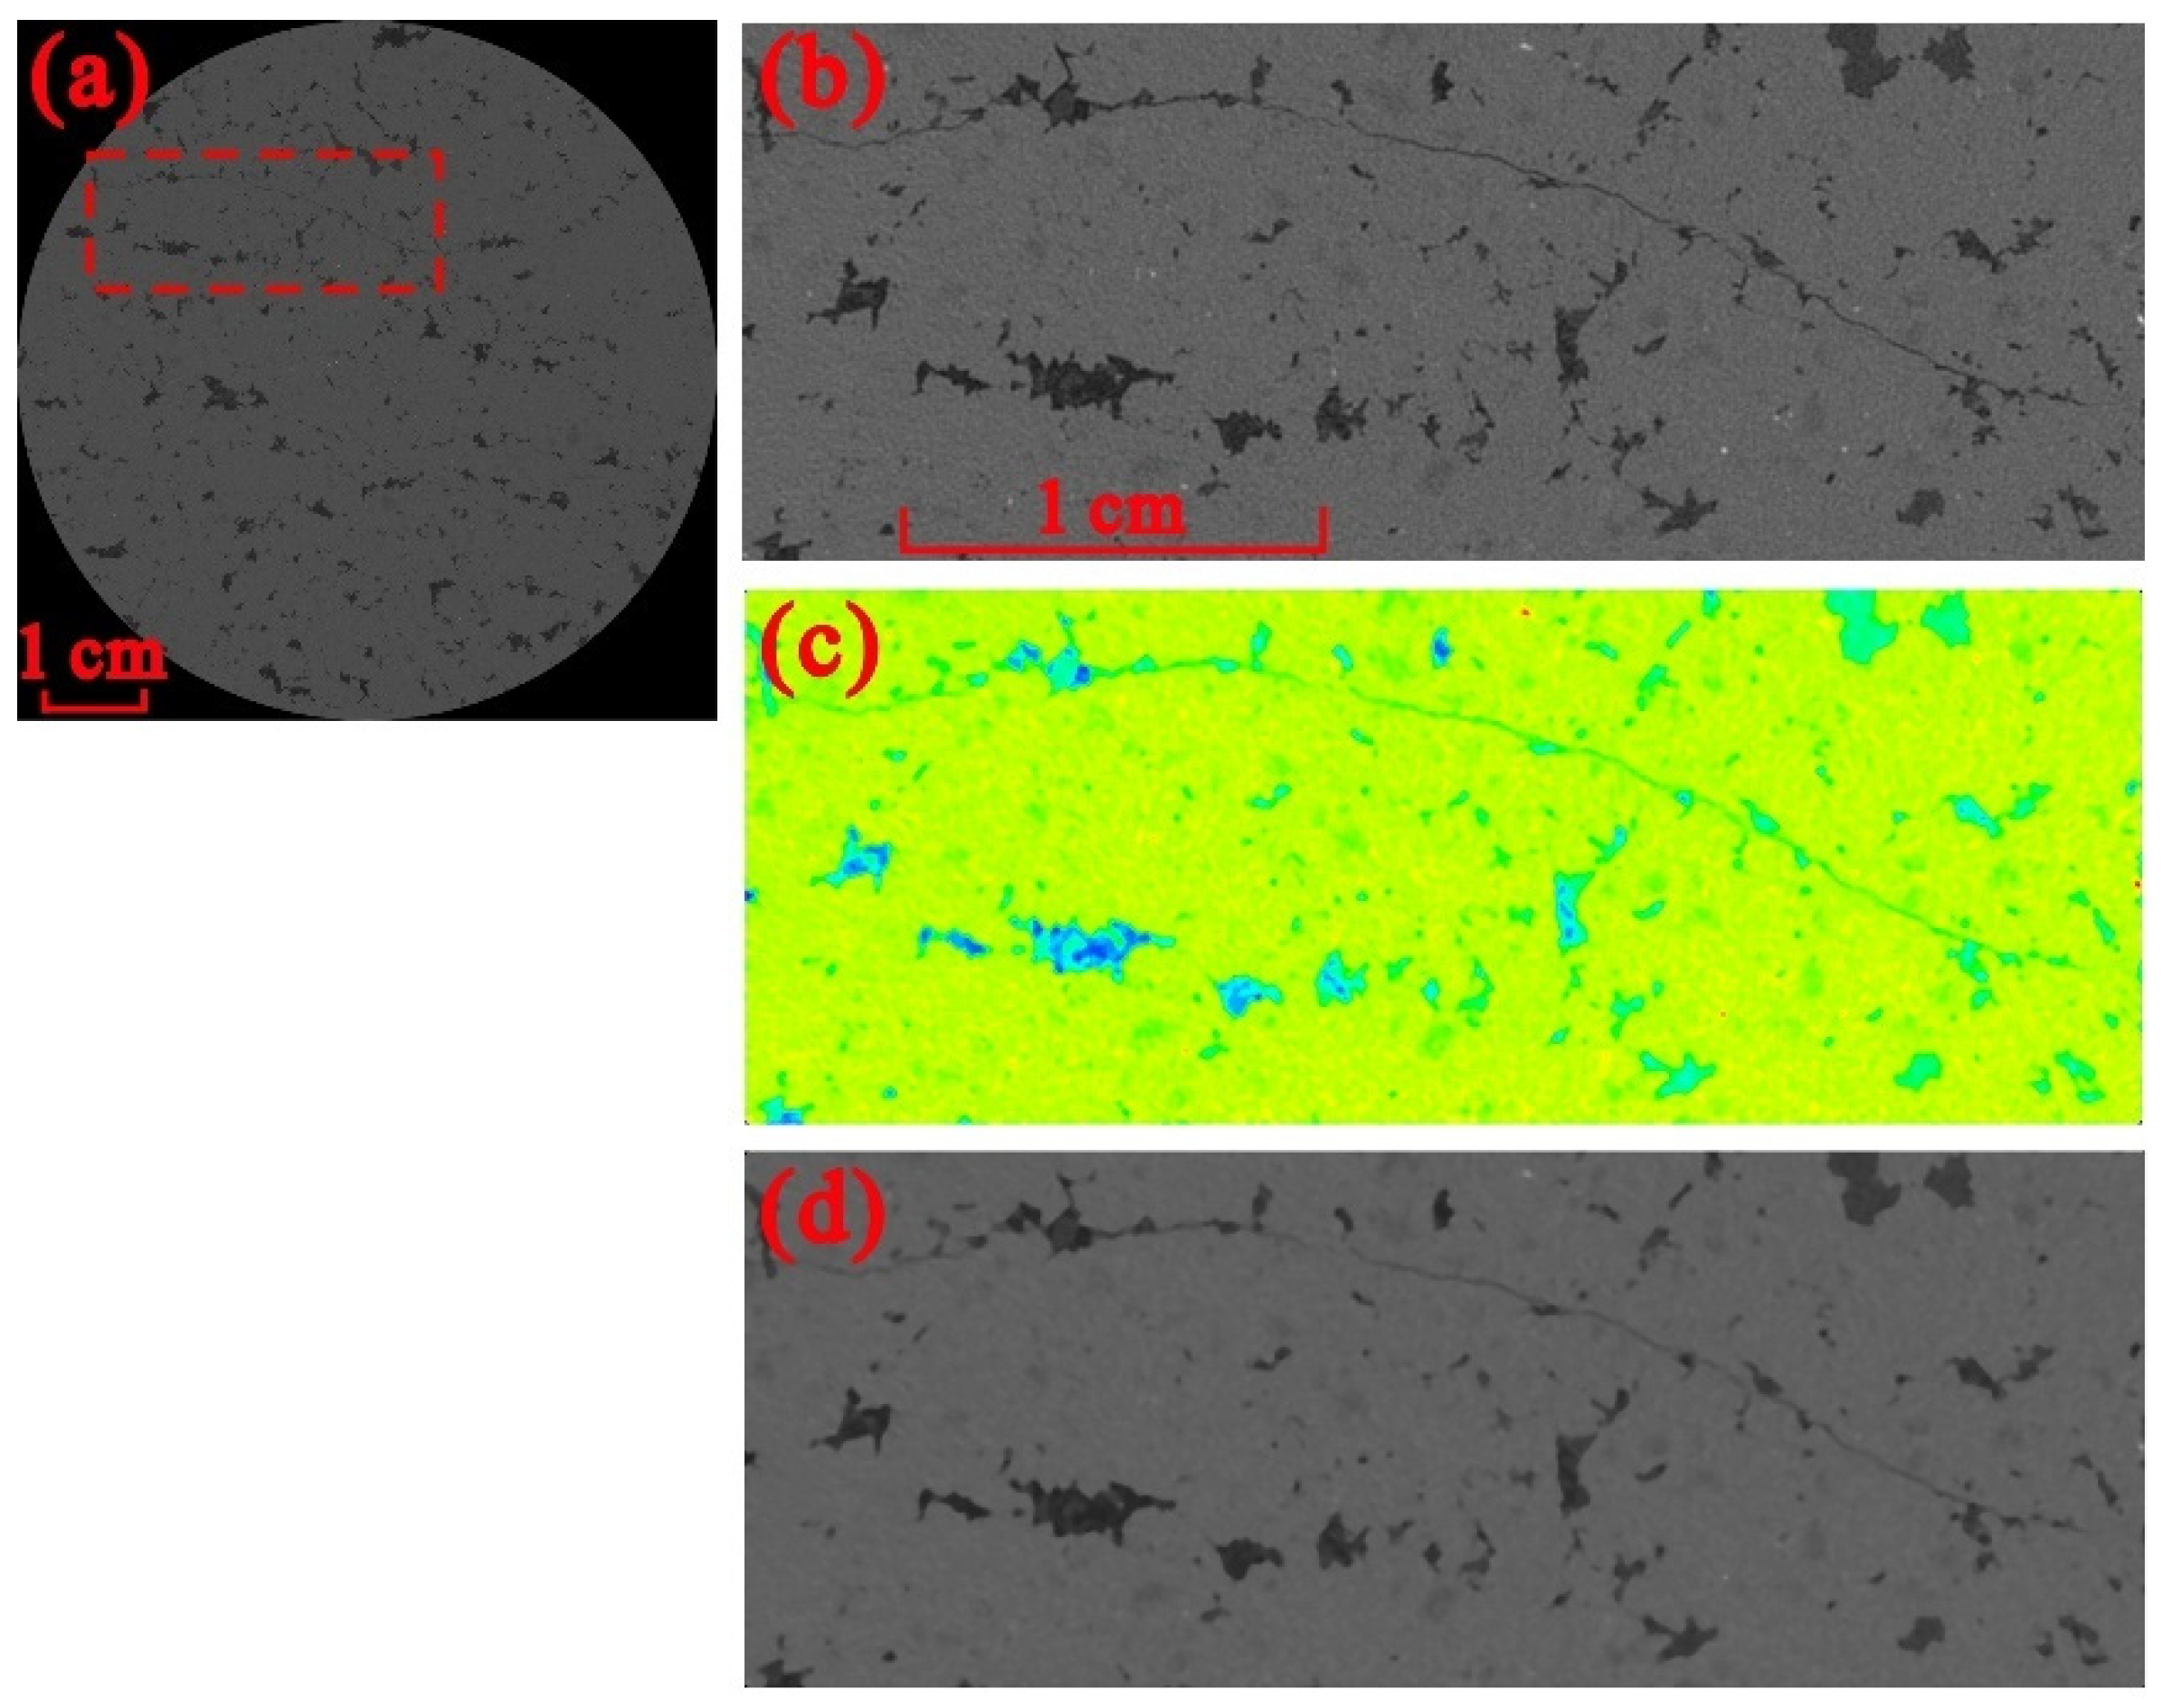
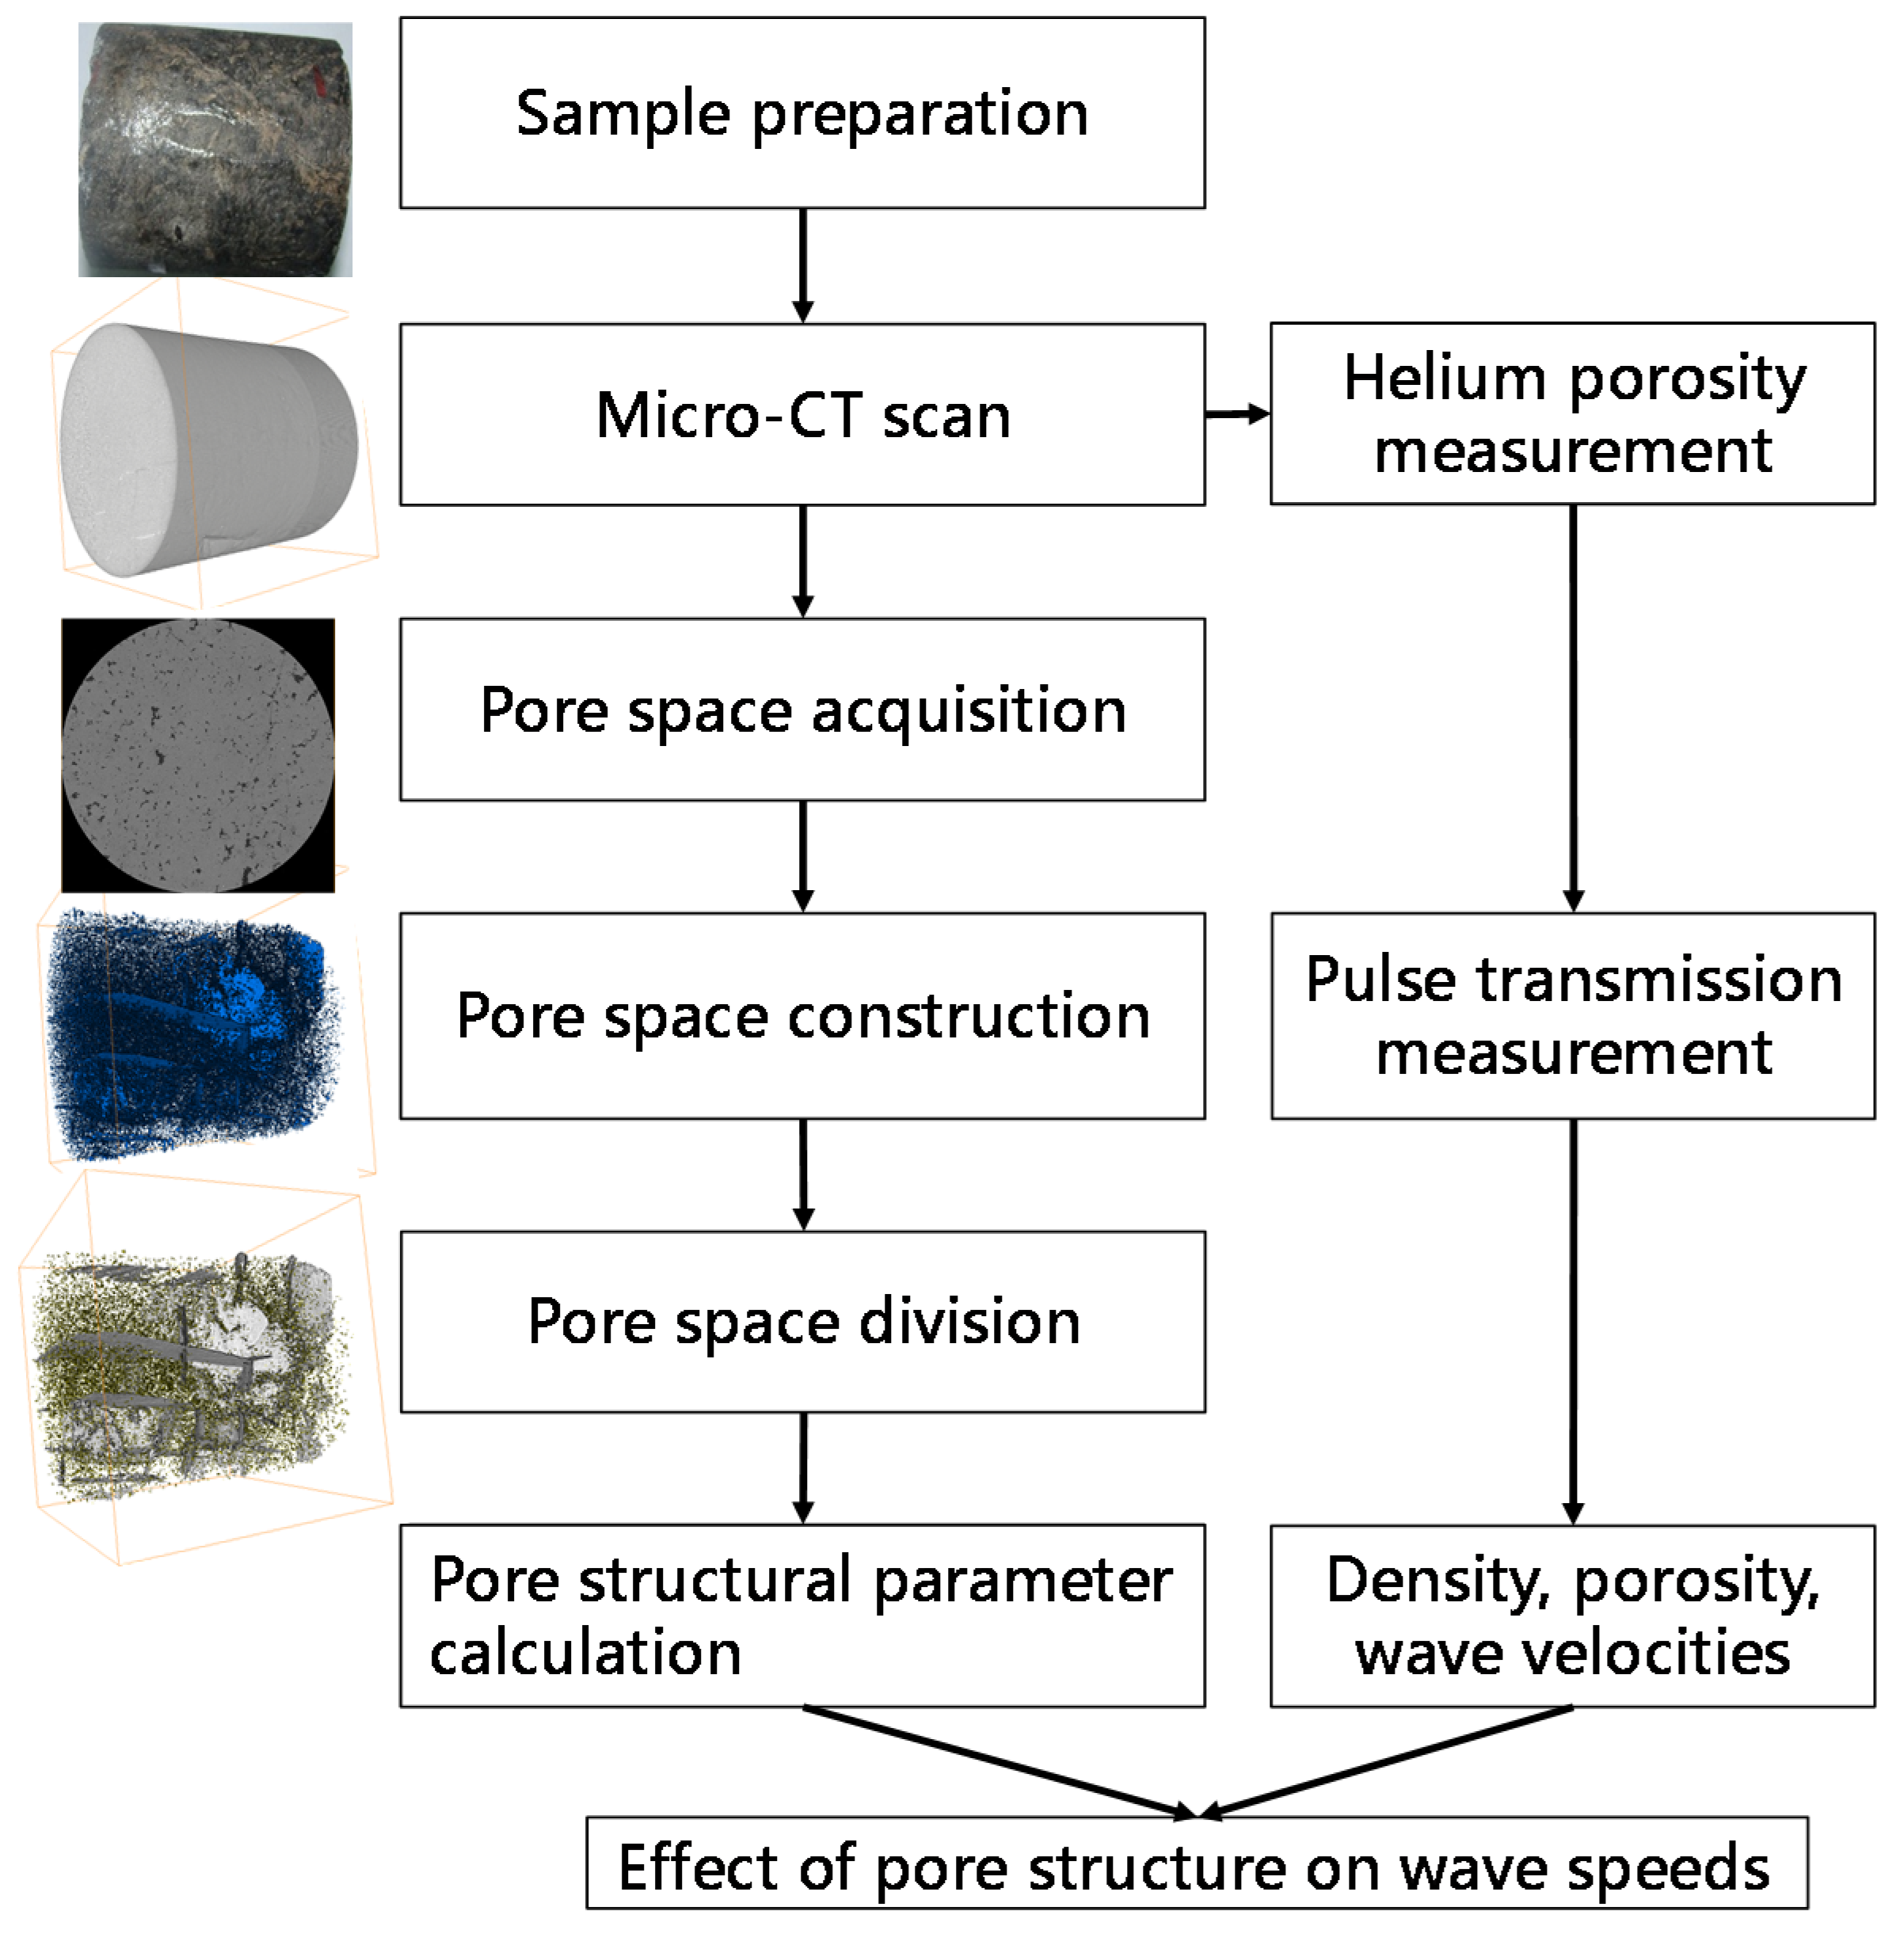
2. Scanned Micro-CT Images of the Full-Diameter Carbonate Cores

We collected 18 carbonate samples, having a diameter of 6.5–7.5 cm and a length of 5.0–10.0 cm, from a burial depth of over 5000 m in the DY Group, Sichuan Basin, Southwest China. Fractures and vugs can be observed with naked eyes on the surface of the sample. According to the standard of the study area, the pore spaces having a ratio of length over width higher than 10 are defined as the fractures, the pore spaces having a diameter longer than 2.0 mm are defined as the vugs, and shorter than 2.0 mm are defined as the pores [49]. From the naked-eye observation of the fractures and vugs appearance on the surface of the collected carbonate cores, the samples can be roughly summarized into three groups: fractured-vuggy carbonates containing relatively developed fractures and vugs, fractural carbonates possessing relatively developed fractures, and vuggy carbonates having relatively developed vugs. The exact classification of the samples was done according to the quantitative analysis of the pore spaces constructed from the micro-CT scanned images.
The samples are scanned using an industrial micro-nano CT instrument—phoenix v|tome|x M manufactured by General Motors Corporation. The High power 300 kV micro-scale X-ray source was used. The micro-CT scanning was taken with an X-ray tube voltage of 200 kV and a tube current of 180 mA. Each sample was scanned for 8 h to achieve the best physical resolution of the instrument. A resolution of 40–50 μm/pixel was achieved and about 1100–1700 slices, depending on the lengths of the scanned samples, having about 1680 × 1695 pixels were obtained for each sample. The resolution and number of slices of the micro-CT scanning of all the samples are listed in Table 1. Some of the obtained micro-CT images are shown in Figure 8. According to the observation of micro-CT scanned images, the length of the fractures varies obviously from partly through the sample (e.g., sample Num. 10) to fully penetrate the sample, e.g., sample Num. 12. The orientations of the fractures are different. Some of the fractures, in the sample, e.g., Num. 16, are parallel while others intersect each other, e.g., Num. 12. The spatial distributions and the sizes of the vugs are significantly heterogeneous. The pores are widely distributed throughout the sample.

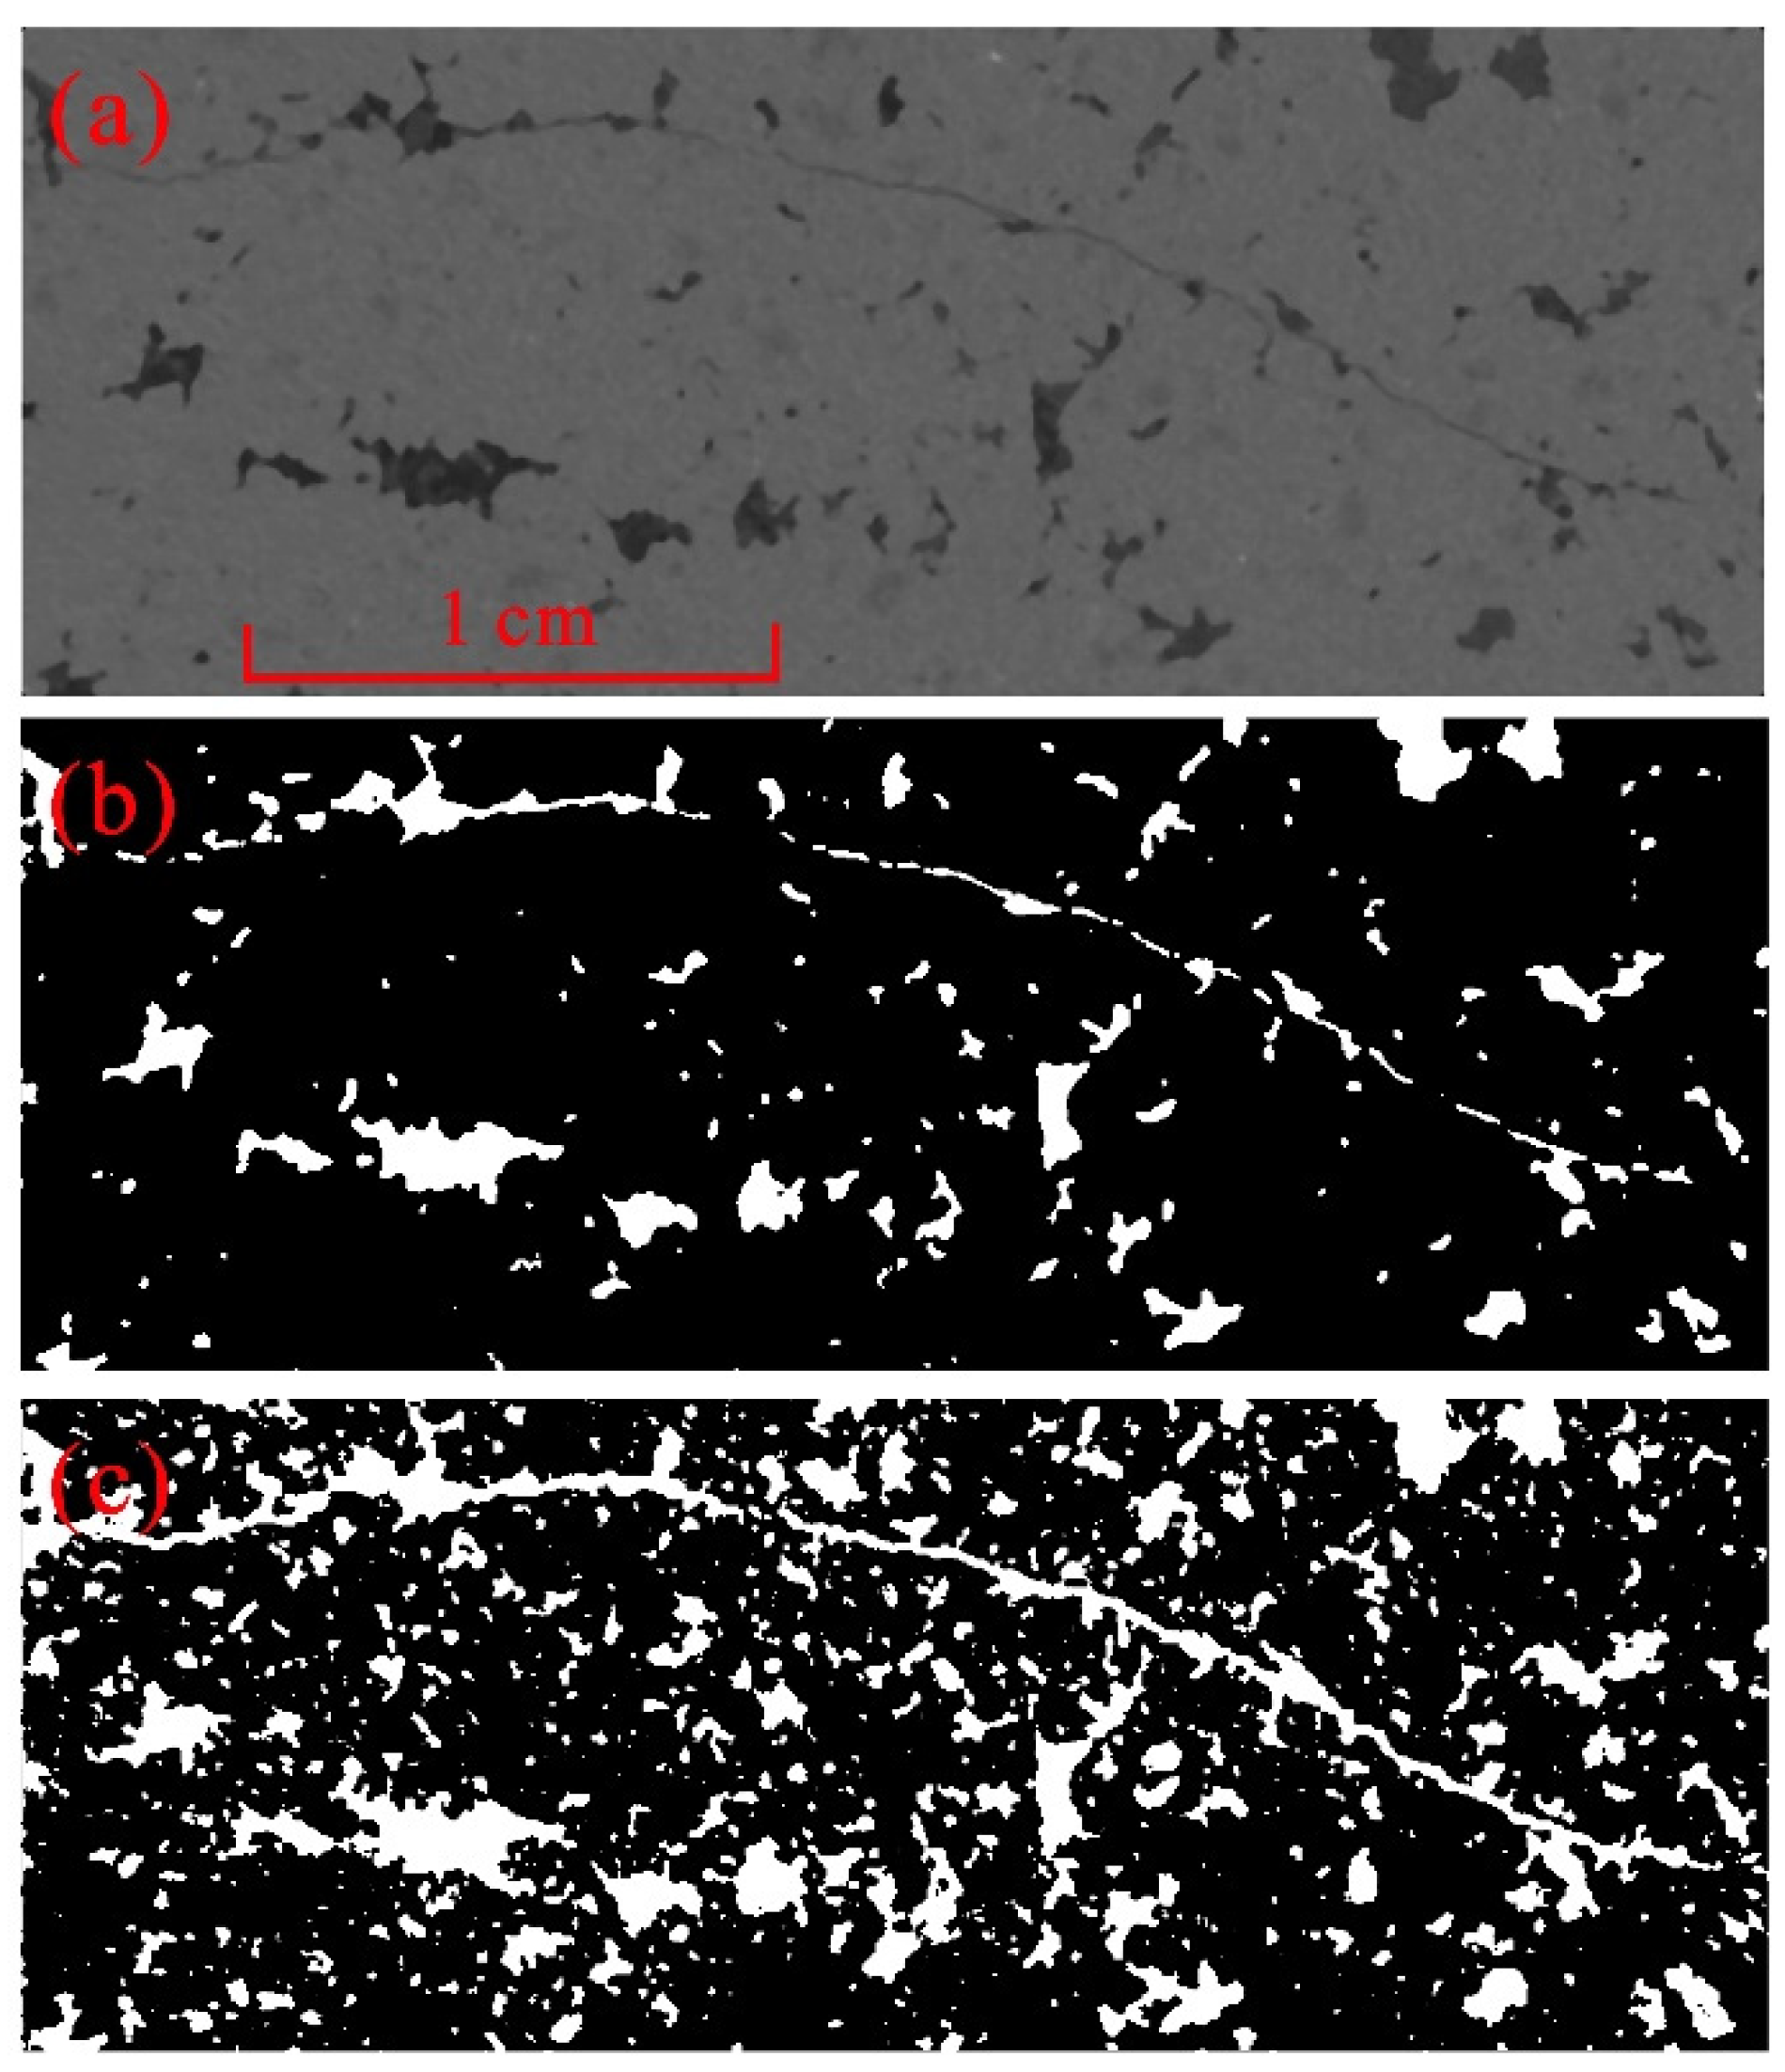
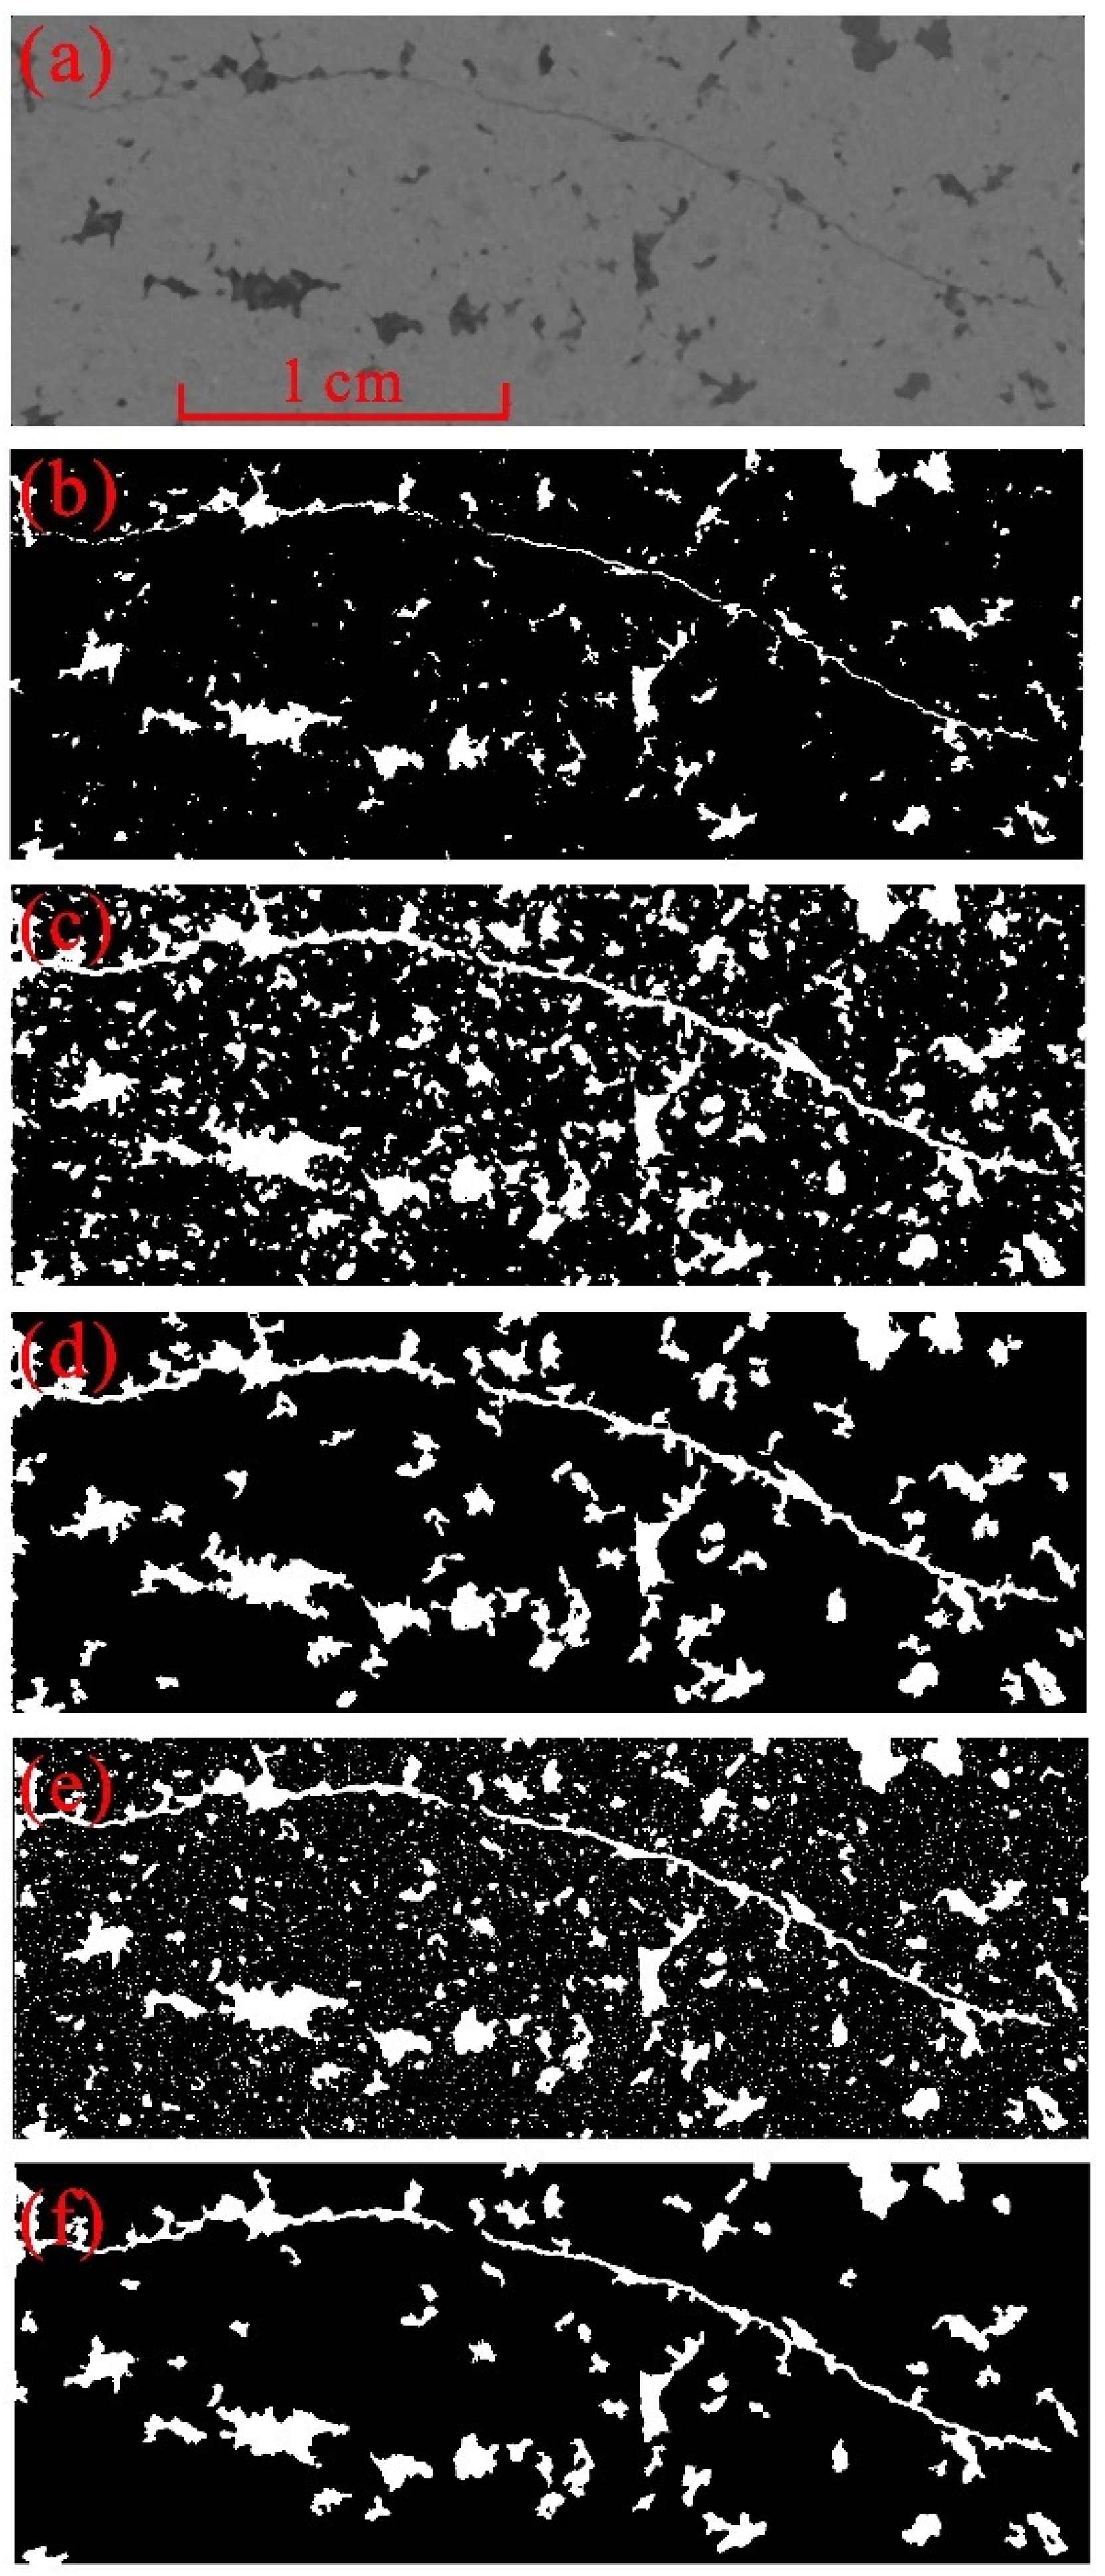
3. Difficulties in Constructing the Pore Space

If we zoom in each 2D micro-CT image, it is obvious that the speckled random noise and the Gaussian noise are involved in the image (Figure 1a). To give a relatively straightforward view of the noises, we used the false coloring technique to turn a grayscale image into an RGB color image (Figure 1b,c). After that, the speckled random noise is as shown as the red dots; the Gaussian noise makes the matrix (colored in yellow) into yellow and green messy patterns. It is important to filter the noise before constructing the pore space, especially when image enhancement is necessary, to avoid mistakenly considering the noise as parts of the pore space. The pepper and speckled random noise can be removed by median filtering. However, the most commonly used averaging filtering is not applicable for removing the Gaussian noise because it blurs the image and lowers the contrasts between the pore space and the matrix. To avoid this issue, the Gaussian noise was filtered using nonlocal mean filtering. After filtering, the noise involved in the image is decreased and the image is only slightly blurred that will not affect the acquisition of the pore space (Figure 1d).
After filtering the image, another difficulty is the lower contrast between the fractures and the matrix compared to the contrast between the vugs or pores with the matrix (Figure 2). A consequence of this lower contrast is that, if one uses the commonly used binary thresholding segmentation, a low threshold can segment the pores and the vugs well but it cannot segment the fractures (Figure 2b), and a high threshold can continuously segment the fractures, but the volumes of the acquired pores and vugs are larger than they should be and the shapes of the pores and vugs are partly distorted (Figure 2c).
We applied three methods, including the watershed segmentation [50], histogram equalization enhancement [44], and top-bottom hat algorithm, to enhance and acquire the fractures (Figure 3). The watershed algorithm is self-adaptive thresholding that segments the pore space basing on the local minimum instead of a single threshold. The acquired pore space using watershed is as shown in Figure 3b. Although the acquired pores and vugs are clear, the watershed method cannot acquire the fractures. After enhancing the image with the histogram equalization algorithm (Figure 3c) and filtering the remained noise enhanced by the algorithm (Figure 3d), the acquired pore space is similar to that segmented using a high threshold in that the fractures are acquired but the volume of the pores and vugs are larger compared to the original figure and the shapes of the pores and vugs are distorted to some extent. Compared to the former two methods, the top-bottom hat algorithm is better in that the fracture is acquired and it avoids the ‘overflow’ of the pores and vugs and maintains the majority of the shape details (Figure 3e,f). Basing on the above studies about the methods of filtering and enhancement applied to the micro-CT images of tight fractured-vuggy carbonates, a workflow is established to acquire and link the pore structural characteristics to the wave velocities.
The image processing methods mentioned above to contour the issue of the low contrast between the pore space and the matrix is convenient to use. However, if the contrast between the pore space and the matrix is too low, physical method might be necessary to enhance the contrast, for example, the difference map method [51]. The difference map method is to scan the sample twice under the conditions of dry and saturated with fluids containing X-ray dense agent, respectively. The pore space then can be highlighted by subtracting the dry image from the saturated image. This method is effective, but the disadvantage is that one has to make sure that the pore space can be fully saturated with the fluid. For the rocks having relatively high porosity, is relatively easier to saturate the pore space. However, for tight rocks, for example, the rocks having a porosity of less than 6%, it is hard to fully saturate the sample. For our samples, the image processing method is enough for extracting the pore space and thus, we did not apply physical method to enhance the contrast between the pores and the matrix.

4. Methods

The method is mainly composed of the acquisition and analysis of the three experimental measurements: the micro-CT, helium porosity, and the pulse transmission measurements. The overall method is shown in Figure 4. First, the collected carbonate samples were sawed into cylindrical plugs and scanned using micro-CT instruments. The obtained 2D images of micro-CT were filtered and enhanced to improve quality. Then, the pore space in each 2D image was acquired and the 3D pore spaces of the samples were constructed using the software AVIZO (manufactured by Visualization Sciences Group, FEI Co., Hillsboro, OR, USA) basing on the 2D pore space. After that, the pore space was divided into pores, vugs, and fractures according to the geometry and the diameter of each individual pore space. Finally, the pore structure parameters were calculated to quantify the characteristics of the pore space and analyze its effect on wave speeds. The density and porosity were measured with helium and the wave speeds were determined using the pulse transmission technique. The following two subsections provide details of pore space acquisition, helium porosity measurements, and the pulse transmission measurements.

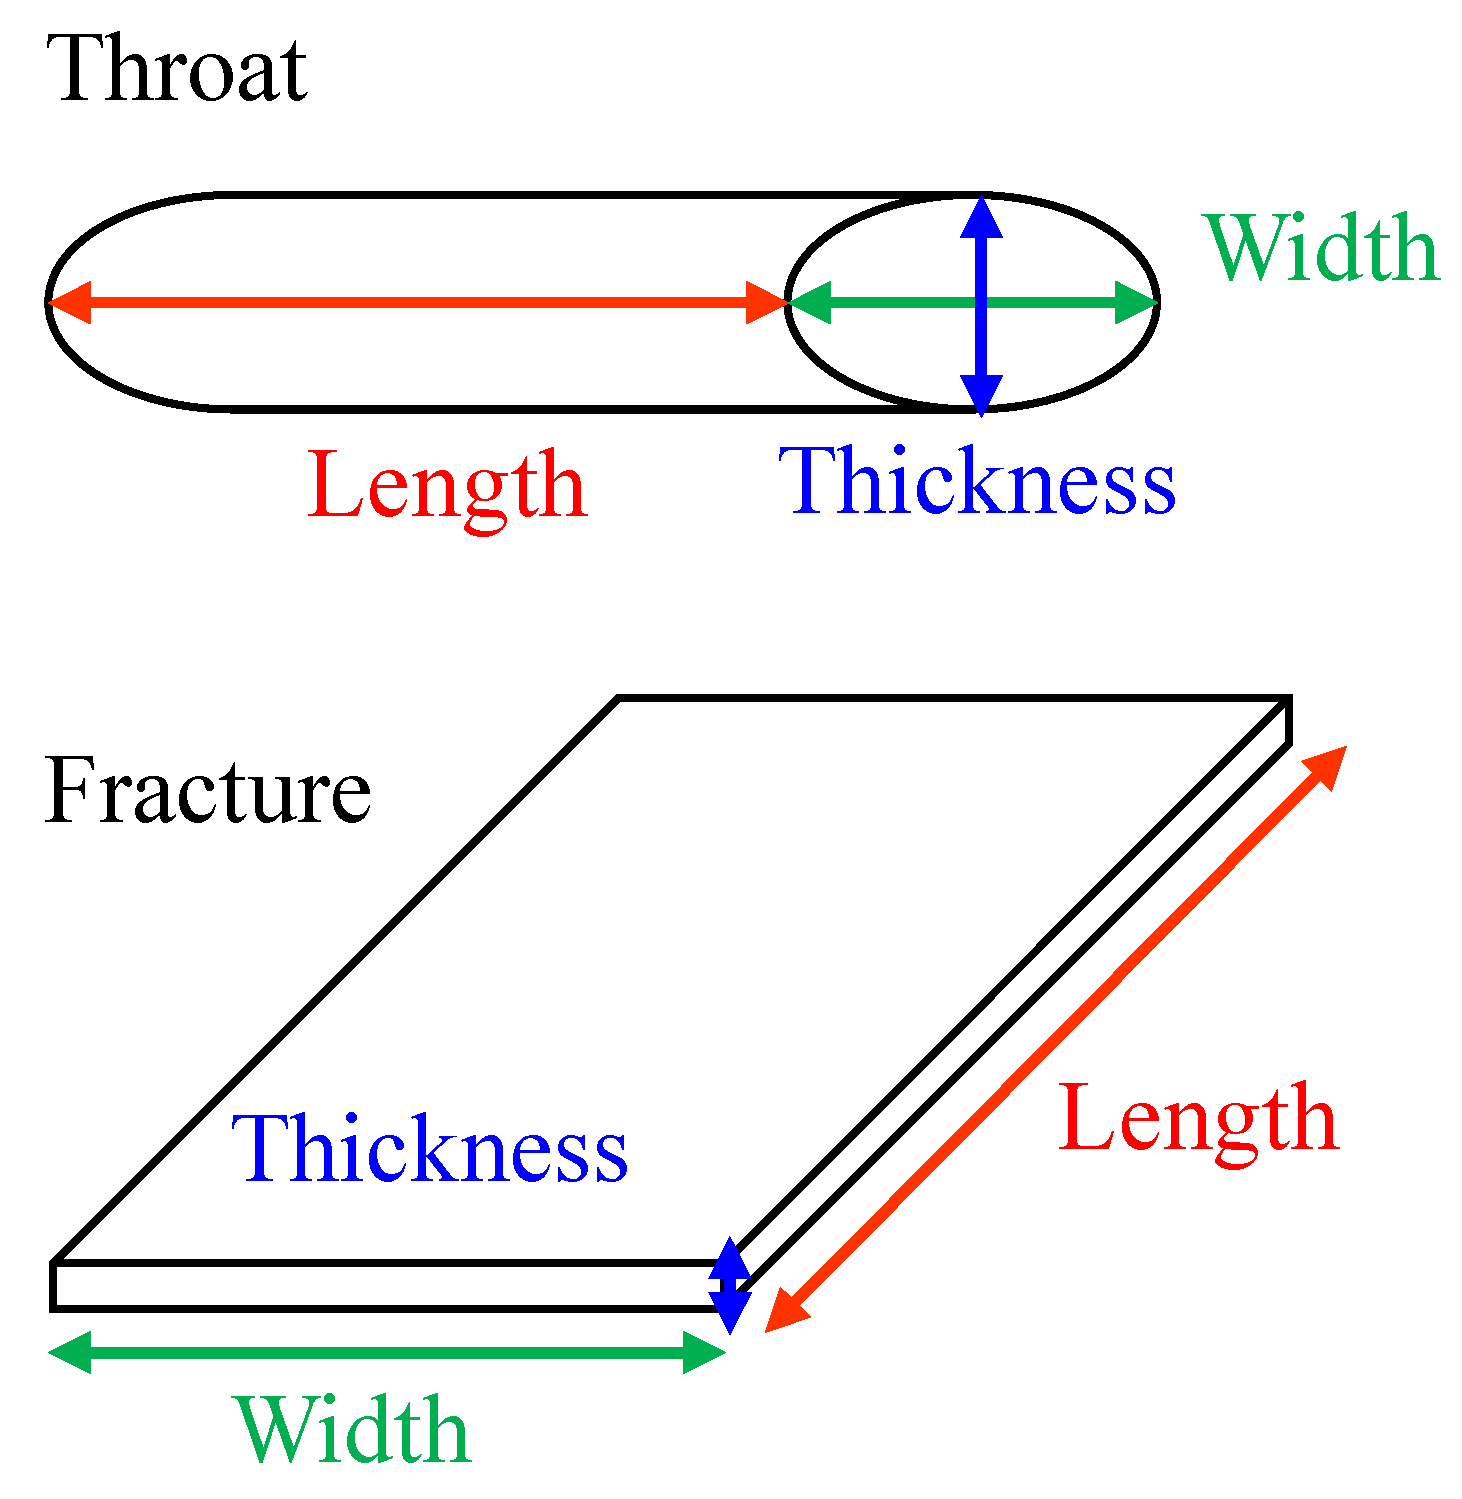
4.1. Pore Space Construction and Division Method

Median filtering and nonlocal means filtering were applied to the micro-CT images first to remove the speckled random noises and the Gaussian noises. Then, the micro-CT image was enhanced with the top-bottom hat transformation. Finally, the processed image was filtered again to remove the remaining noises that were also enhanced after top-bottom hat transformation.
For the division of the pore space, the total pore space was segmented into individual volumes using the watershed algorithm and then the individual volumes were classified into pores, fractures, and vugs according to its geometry and diameter. Usually, the fracture is identified from the pores and vugs using the ratio of the length and width over thickness and the vugs are separated from the pores by the diameter of the isovolumetric sphere. It should be noted that using only the ratio of length over the thickness may mistakenly classify a throat into a fracture (Figure 5). Thus, we used both the ratio of length over thickness and the ratio of width over thickness to avoid this issue. According to the standard of the studies area, the volumes having both the ratios of length over thickness and width over thickness higher than 10 were defined as fractures. The remaining volumes having an equivalent diameter longer than 2.0 mm were defined as vugs and those having an equivalent diameter shorter than 2.0 mm were defined as pores.
After dividing the total pore space into pores, vugs, and fractures the pore structural parameters are quantified. The porosity of the whole pore space, the pores, the vugs, and the fractures were calculated by dividing the total amount of the pixels in the whole pore space, the pores, the vugs, and the fractures over that of the whole sample, respectively. The equivalent pore diameter was calculated by averaging the diameters of the isovolumetric spheres of the pores and the vugs. The orientation of a fracture was defined by the normal vector of the fracture surface.

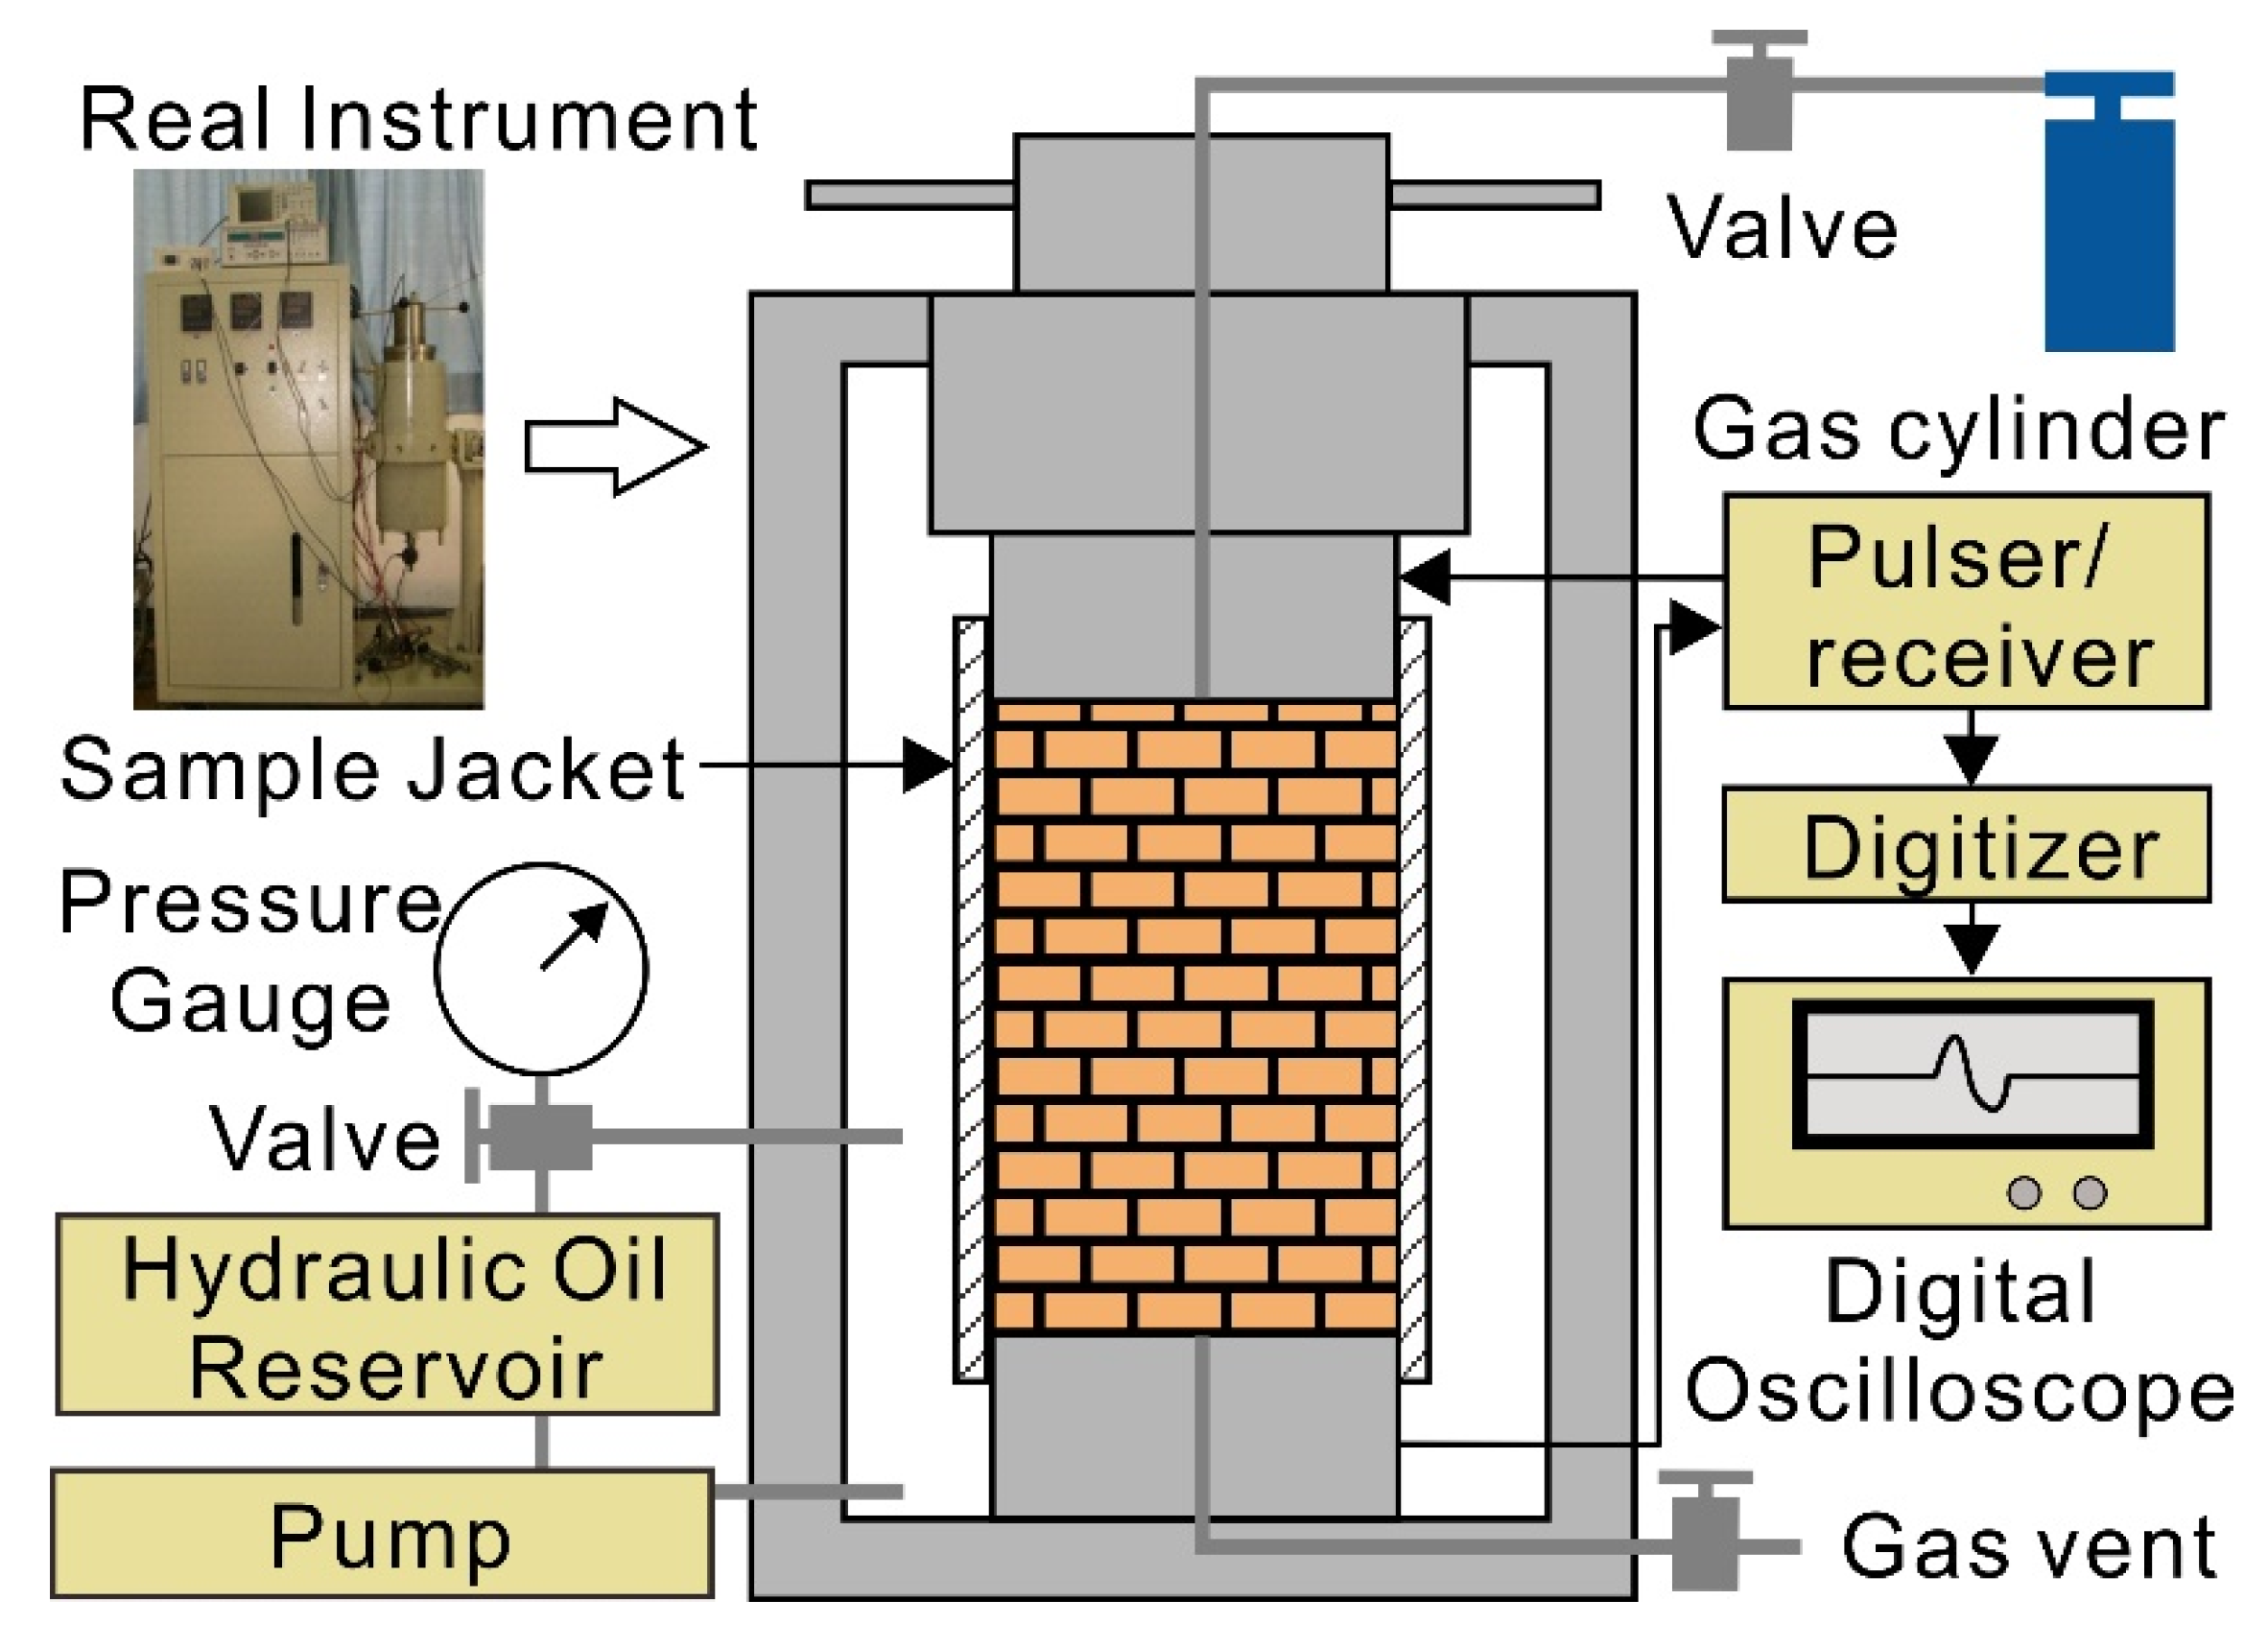
4.2. Porosity and Wave Velocity Measurements

The porosity of the samples was determined with the single-cell He-gas filling method to offer a reference for the micro-CT pore-space construction. The pore volume was determined using Boyle’s Law under room temperature and a confining pressure of 3 MPa applied to the external surface of the sample jacket. The diameter and the length of the samples are both measured three times for each sample using a caliper and the averaged diameter and length were used to calculate the volume of the cylindrical samples. The porosimeter apparatus was built based on API RP40 (1998) [52] as shown in Figure 6. Before measuring the porosity of the samples, the measurement system was calibrated using a standard sample to calibrate the system dead volume. The total pore volume of the samples was determined following API RP40 (1998) and the porosity was obtained by dividing the volume of the pore space over that of the sample.
The wave velocities of the P- and S-waves of the collected carbonate samples were determined with the ultrasonic pulse transmission technique. The voltage step was periodically applied to the piezoelectric ceramic to generate a pulse. The generated pulse transmits throughout the sample and encountered the piezoelectric ceramic used to receive the pulse by converting the vibration back to an electrical voltage. The voltage was recorded into the computer by an 8-bit digitizer and a digital oscilloscope programmed using LabVIEW software. The sampling rate was 10.0 ns. The averaged receiving signal was stacked over 300 times and then collected. The transit time was picked at the first amplitude peak of the received waveform. The calibration of the transducer delay was determined from the measurements taken on a set of cylindrical aluminum plugs (6061-T6) with different lengths following Melendez-Martinez (2014) [53]. By plotting the transit time against cylinder length, the excitation delay, equaling 16.16 μs for the longitudinal-mode piezoelectric discs or 8.82 μs for the transverse mode piezoelectric plates, was obtained from the non-zero intercept of the fitting line. The measurement was taken under a confining pressure of 70 MPa (the in-situ confining pressure).

5. Results

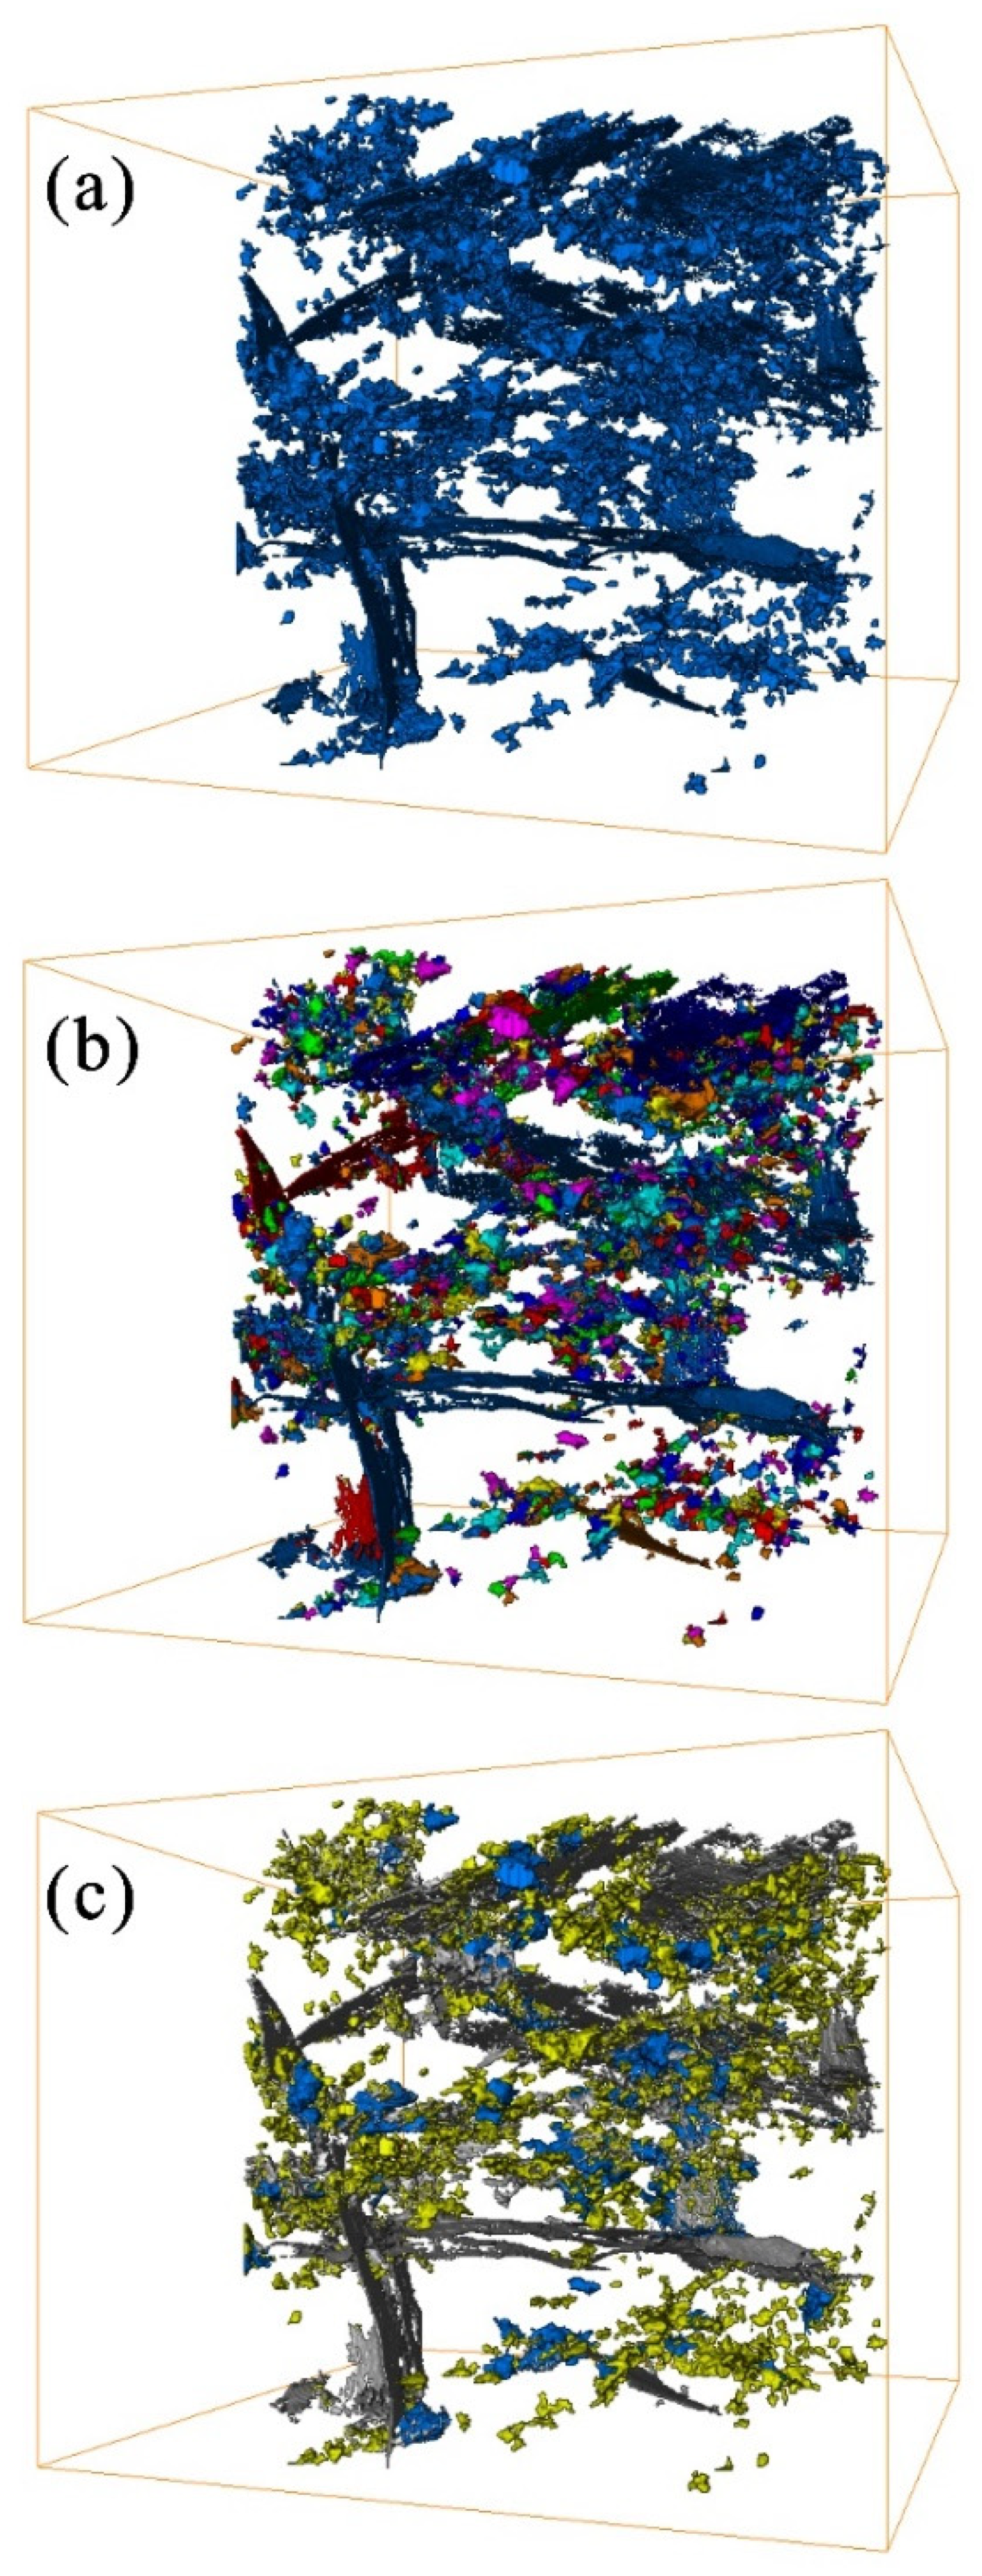
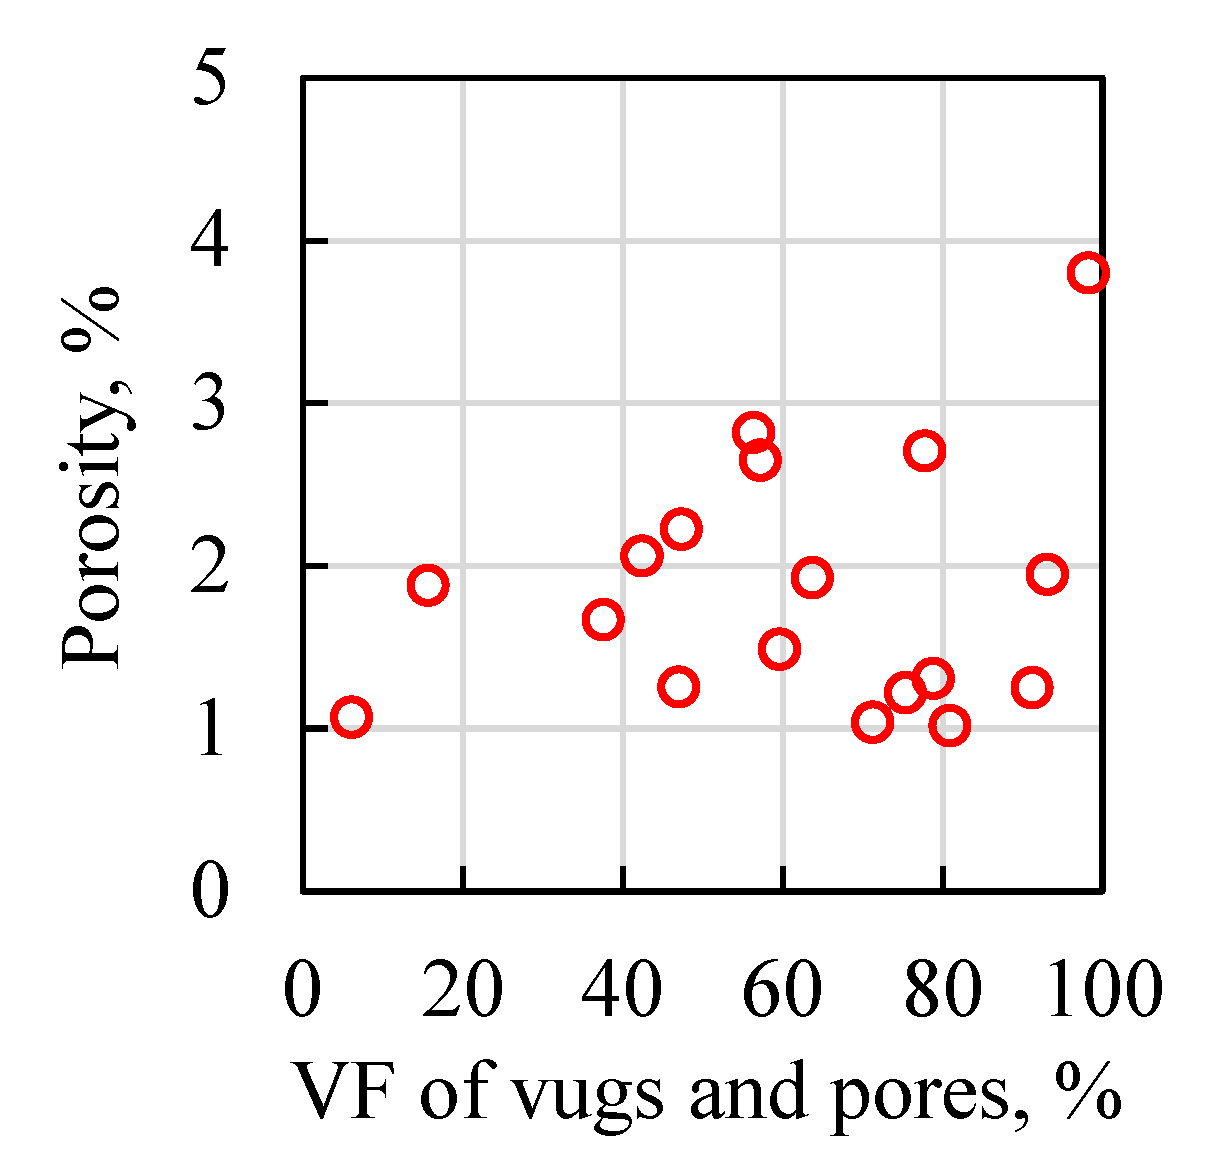
5.1. Pore Structure Characteristics of the Tight Carbonates

After processing each 2D micro-CT image, the processed 2D images were imported into the software AVIZO to construct and divide the pore spaces of the samples. Taking sample Num. 10 as an example, the total pore space (Figure 7a) was separated into individual volumes using a watershed algorithm (Figure 7b). The colors used in Figure 7b help identify the individual volumes. These individual volumes were classified into pores (colored in yellow), vugs (in blue), and fractures (in gray) according to the geometry of the individual volumes as shown in Figure 7c. It can be seen in Figure 7 that the proposed method can effectively divide the pore spaces into pores, vugs, and fractures. The pore structure parameters were acquired basing on the characteristics of the constructed spaces of pores, vugs, and fractures.
The structural characteristics of the tight carbonate samples vary significantly, although the values of the porosity of the samples are close being less than 4%. The results of six samples are shown in the 6th and 7th columns of Figure 8 and the rest are shown in Appendix A. Inside the pore space, bubble-like pores and vugs and sheet-like fractures are observed. The pores are separately distributed, and the fractures are intersected and widely distributed inside the core. Fractured-vuggy, fractured, and vuggy carbonates are observed. For the fractured-vuggy carbonates, both the fractures and the vugs are well developed inside the sample. Although, the fractional volumes of the fractures are relatively low compared to the sum of those of the vugs and pores, the fractures penetrating the samples and each other connecting the pore spaces. For the fractured carbonates of the collected samples, the pore space is mainly composed of the fractures and the total porosity of them are all less than 2%.
The acquired pore structural parameters are listed in Table 2. The micro-CT porosity of the collected samples ranges from about 1% to 4%. The averaged equivalent pore diameter ranges from about 100 to 400 μm. The vugs are the main contribution of the large pores. The volumetric fractions of pores, vugs, and fractures vary significantly with the samples be 5.16–57.63%, 0–75.22%, and 1.77–94.01%, respectively. The majority of the samples contain both the vugs and fractures. The orientations of the fractures change a lot from being parallel to intersect with each other. The intersection of the fractures with pores and vugs form the main flow channel of the tight carbonates.

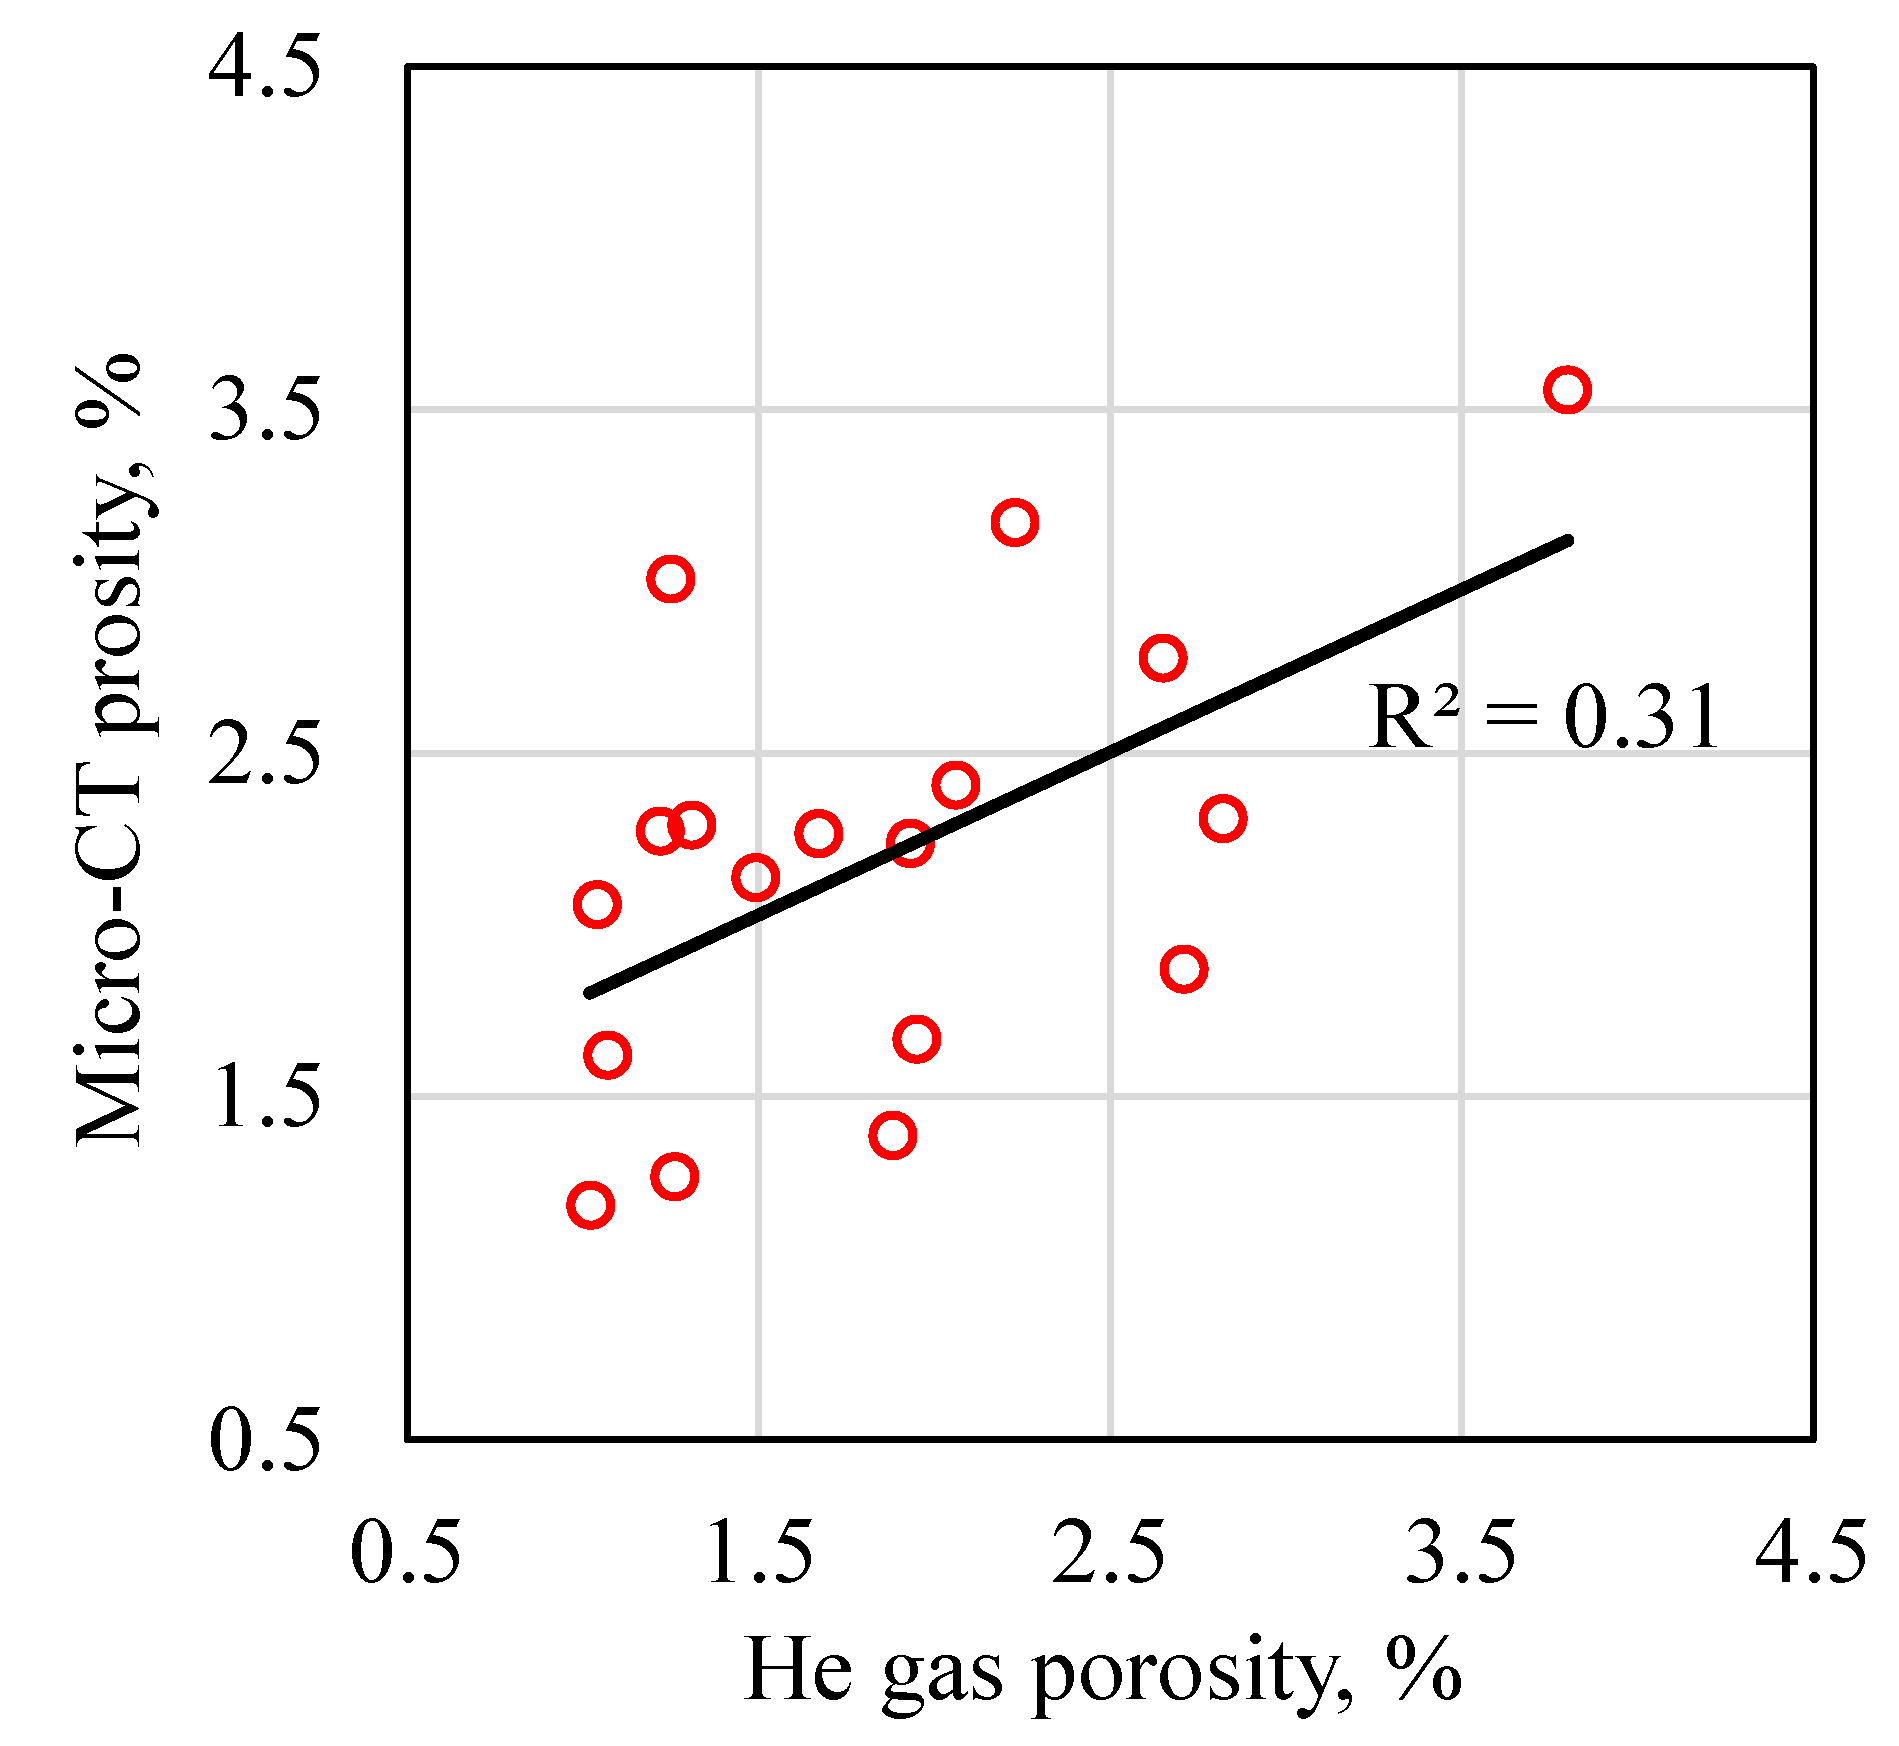
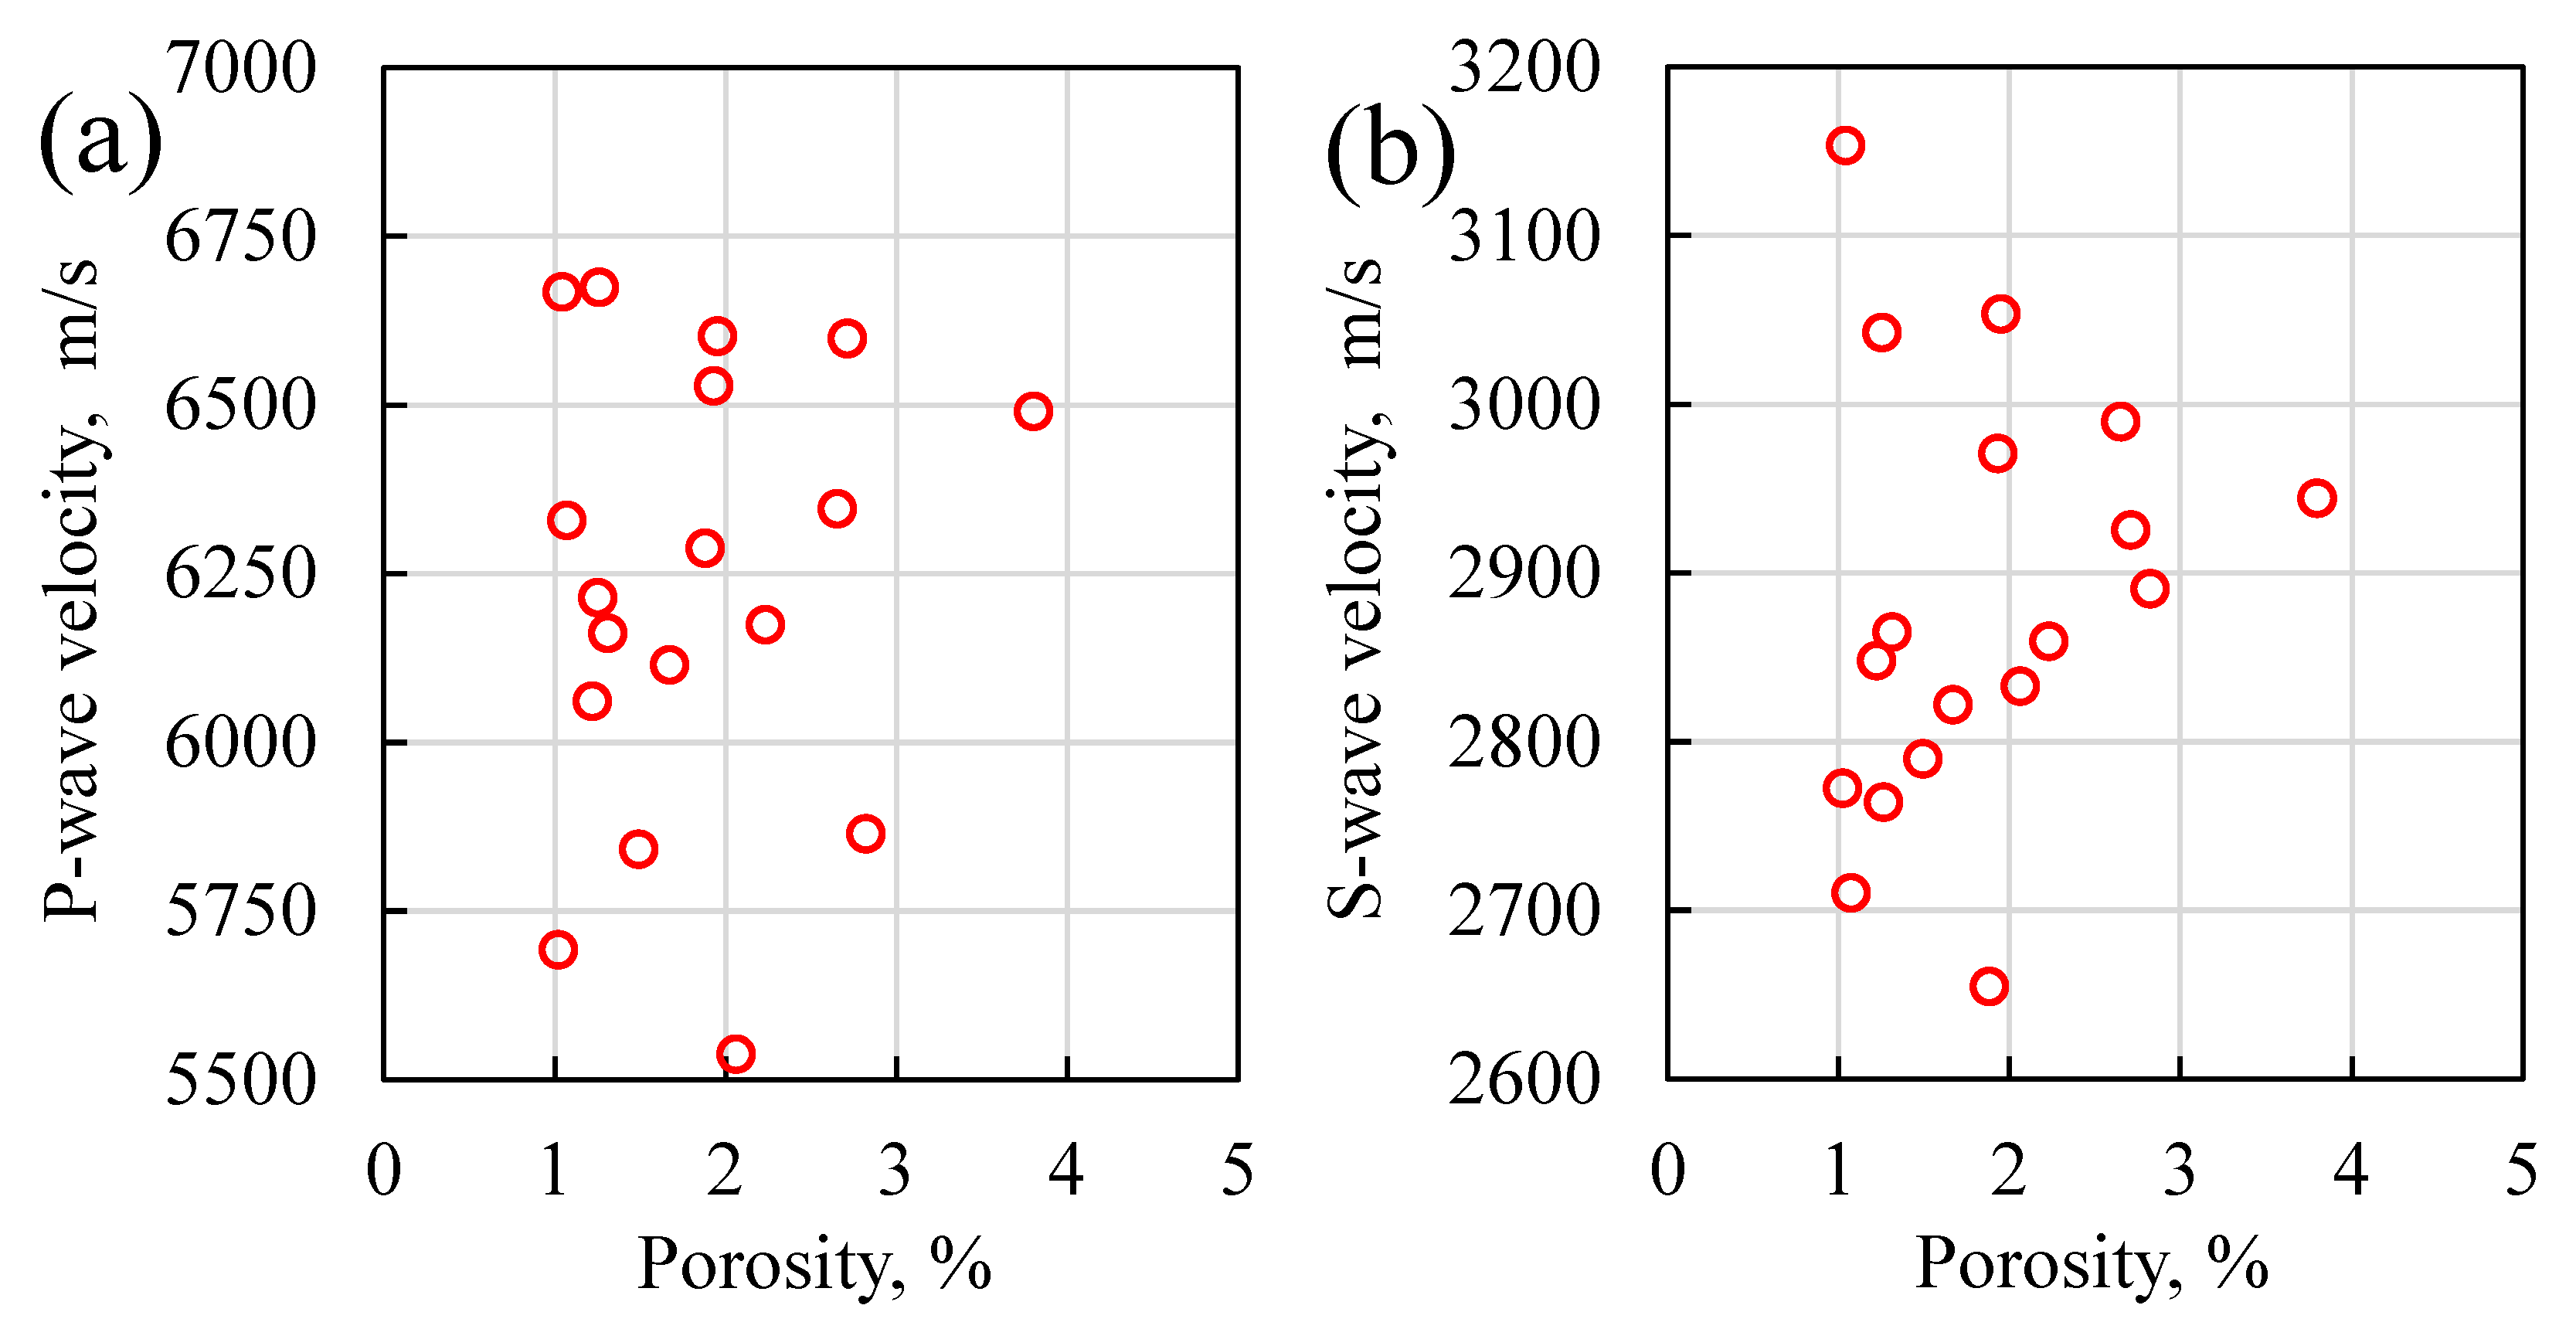
5.2. Porosity and Wave Velocities of the Tight Carbonates
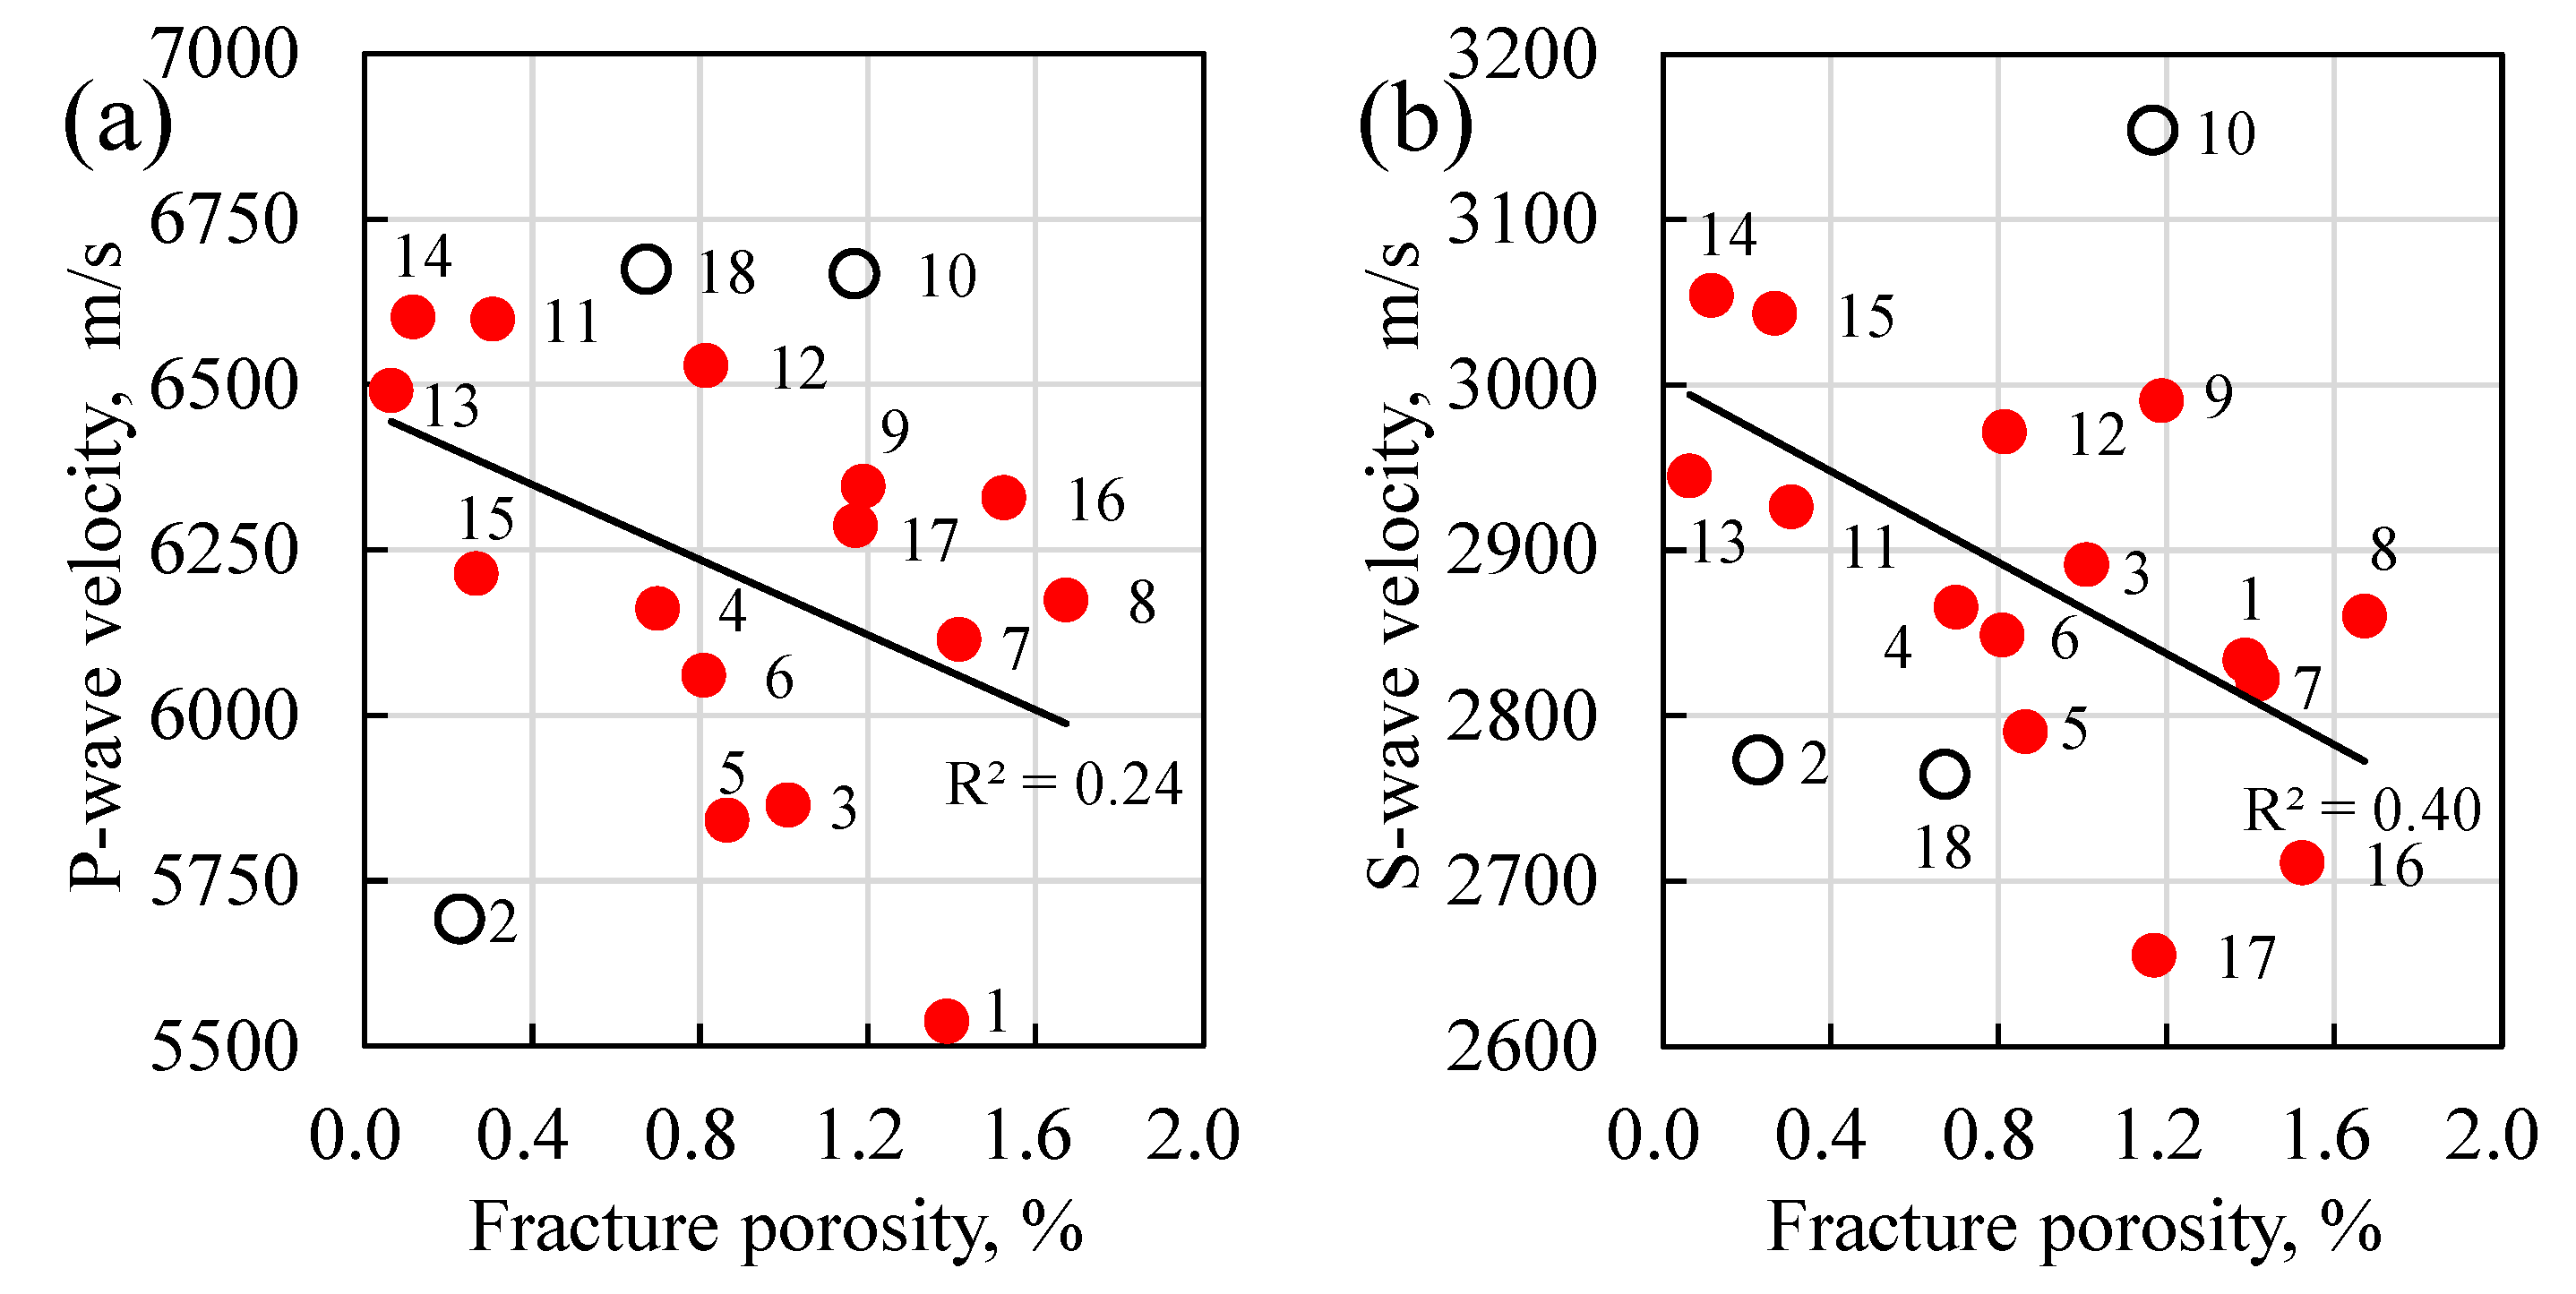
The He gas porosity and wave speeds of both the P- and S-waves of the tight carbonate samples are shown in Figure 9 and Figure 10. The samples are collected at a burial depth of over 5000 m and, thus, the porosity of the tight carbonate samples is less than 5%. The porosity acquired from the micro-CT scanning is close to that obtained from He gas filling demonstrating that the acquired pore space from micro-CT is reasonable (Figure 9). The difference in the acquired porosity between the micro-CT and He gas filling might be caused by the isolated pores or the resolution of the micro-CT that pores less than 40 μm are too small to be detected. The wave speeds are measured under an in-situ confining pressure of about 70 MPa. The P- and S-wave velocities of the collected samples range from about 5.6 to 6.7 km/s and 2.6 to 3.2 km/s, respectively. The ratio of Vp over Vs ranges from 1.95 to 2.41. The cross plots of the wave velocities of both P- and S-waves against the He gas porosity are scattered (Figure 10).

6. Discussion

The pore structure of the tight carbonates is involved to help analyze and explain the relationship between the porosity and the wave speeds of both P- and S-waves. Seen from the constructed pore space of the tight carbonates, the pore spaces of the tight carbonate samples vary significantly and fractures and vugs are well developed causing the relationship between the porosity and the wave speeds to be scattered.
The pores and vugs possess the majority of the pore space for most of the samples, except those fractured tight carbonates. Thus, the porosity of the samples is positively related to the sum of the volume fraction of the vugs and pores (Figure 11). The existence of vugs and pores improves the porosity of the tight carbonate samples. However, considering the wave speeds, the fractures are key compared to the pores and the vugs because the vugs are distributed heterogeneously in the samples, and some of them are on or near the sidewall of the core plugs that might not affect the path of the waves.
If a fracture is perpendicular to the wave path, the wave has to transit through the fracture and consequently, its speed is slower. However, a fracture can merely affect the wave speed if it is parallel to the wave path. This kind of fracture adds to the total porosity but will not reduce the wave speed. Thus, the heterogeneity in the spatial distribution of the vugs and the fractures with high orientation angles are the main causes of the scatterings in the porosity and wave velocity relationship. On this consideration, the wave speeds of both the P- and S-waves are related to the porosity of the fractures as shown in Figure 12. Removing the samples with a limited amount of low-oriented fractures (the fractures having their surface perpendicular or nearly perpendicular to the direction of wave propagation), the wave velocity of the remaining samples is negatively related to the fracture porosity indicating that the wave velocity of the tight carbonate samples is more sensitive to the fractures, especially those intersecting its wave path. The Pearson coefficient of S-wave velocity with fracture porosity is about two times that of the P-wave velocity with fracture porosity indicating that the S-wave is more sensitive to the fracture porosity compared to the P-wave.

7. Conclusions

Carbonate rocks, buried at depths deeper than 5 km, are usually tight. Characterizing the pore structure characteristics of the tight carbonates are key in evaluating its physical properties. To be representative, micro-CT scanning and pulse transmission measurements were carried out on full-diameter drilling cores instead of 1.0-inch core plugs. The two main challenges in constructing the pore space of a full-diameter carbonate core sample basing on micro-CT are the noisy image and the low contrast between the fractures and the matrix. The proposed micro-CT workflow can effectively construct the pore space and divide the pore space into pores, vugs, and fractures so that the pore structural parameters can be quantitatively acquired.
Both the micro-CT acquired and He gas-filling measured porosity show that the porosity of the collected tight carbonate samples is less than 5%. Although the values of the porosity of the tight carbonates are similar, the pore structure varies significantly from sample to sample. The majority of the samples possess well-developed fractures and vugs. The spatial distribution of fractures, vugs, and pores is strongly heterogeneous. Both parallel and intersected fractures are observed in the constructed pore space. The porosity of the samples is positively related to the volume fraction of the vugs and pores. Due to the complex pore structure of the tight carbonates, the relationships between the porosity and the wave speeds of both P- and S-waves are scattered. The wave velocity is related to the fracture porosity for the samples having the majority of the fractures aligned perpendicular to the wave path.
The micro-CT scanning taken on full-diameter core plugs do not contain any information about the pores having a diameter of less than 50 microns. A combination of the study on full-diameter core plugs and those on smaller samples or other pore structure measurements, for example, SEM, NMR, and mercury injection, is an interesting further work.

Author Contributions

Conceptualization, W.L., X.L. (Xiangjun Liu), and L.L.; methodology, W.L., X.L. (Xiangjun Liu), and L.L.; software, W.L. and Y.Z.; lab measurement, X.L. (Xiansheng Li), and J.X. All authors have read and agreed to the published version of the manuscript.

Funding

This research received no external funding.

Conflicts of Interest

The authors declare no conflict of interest.

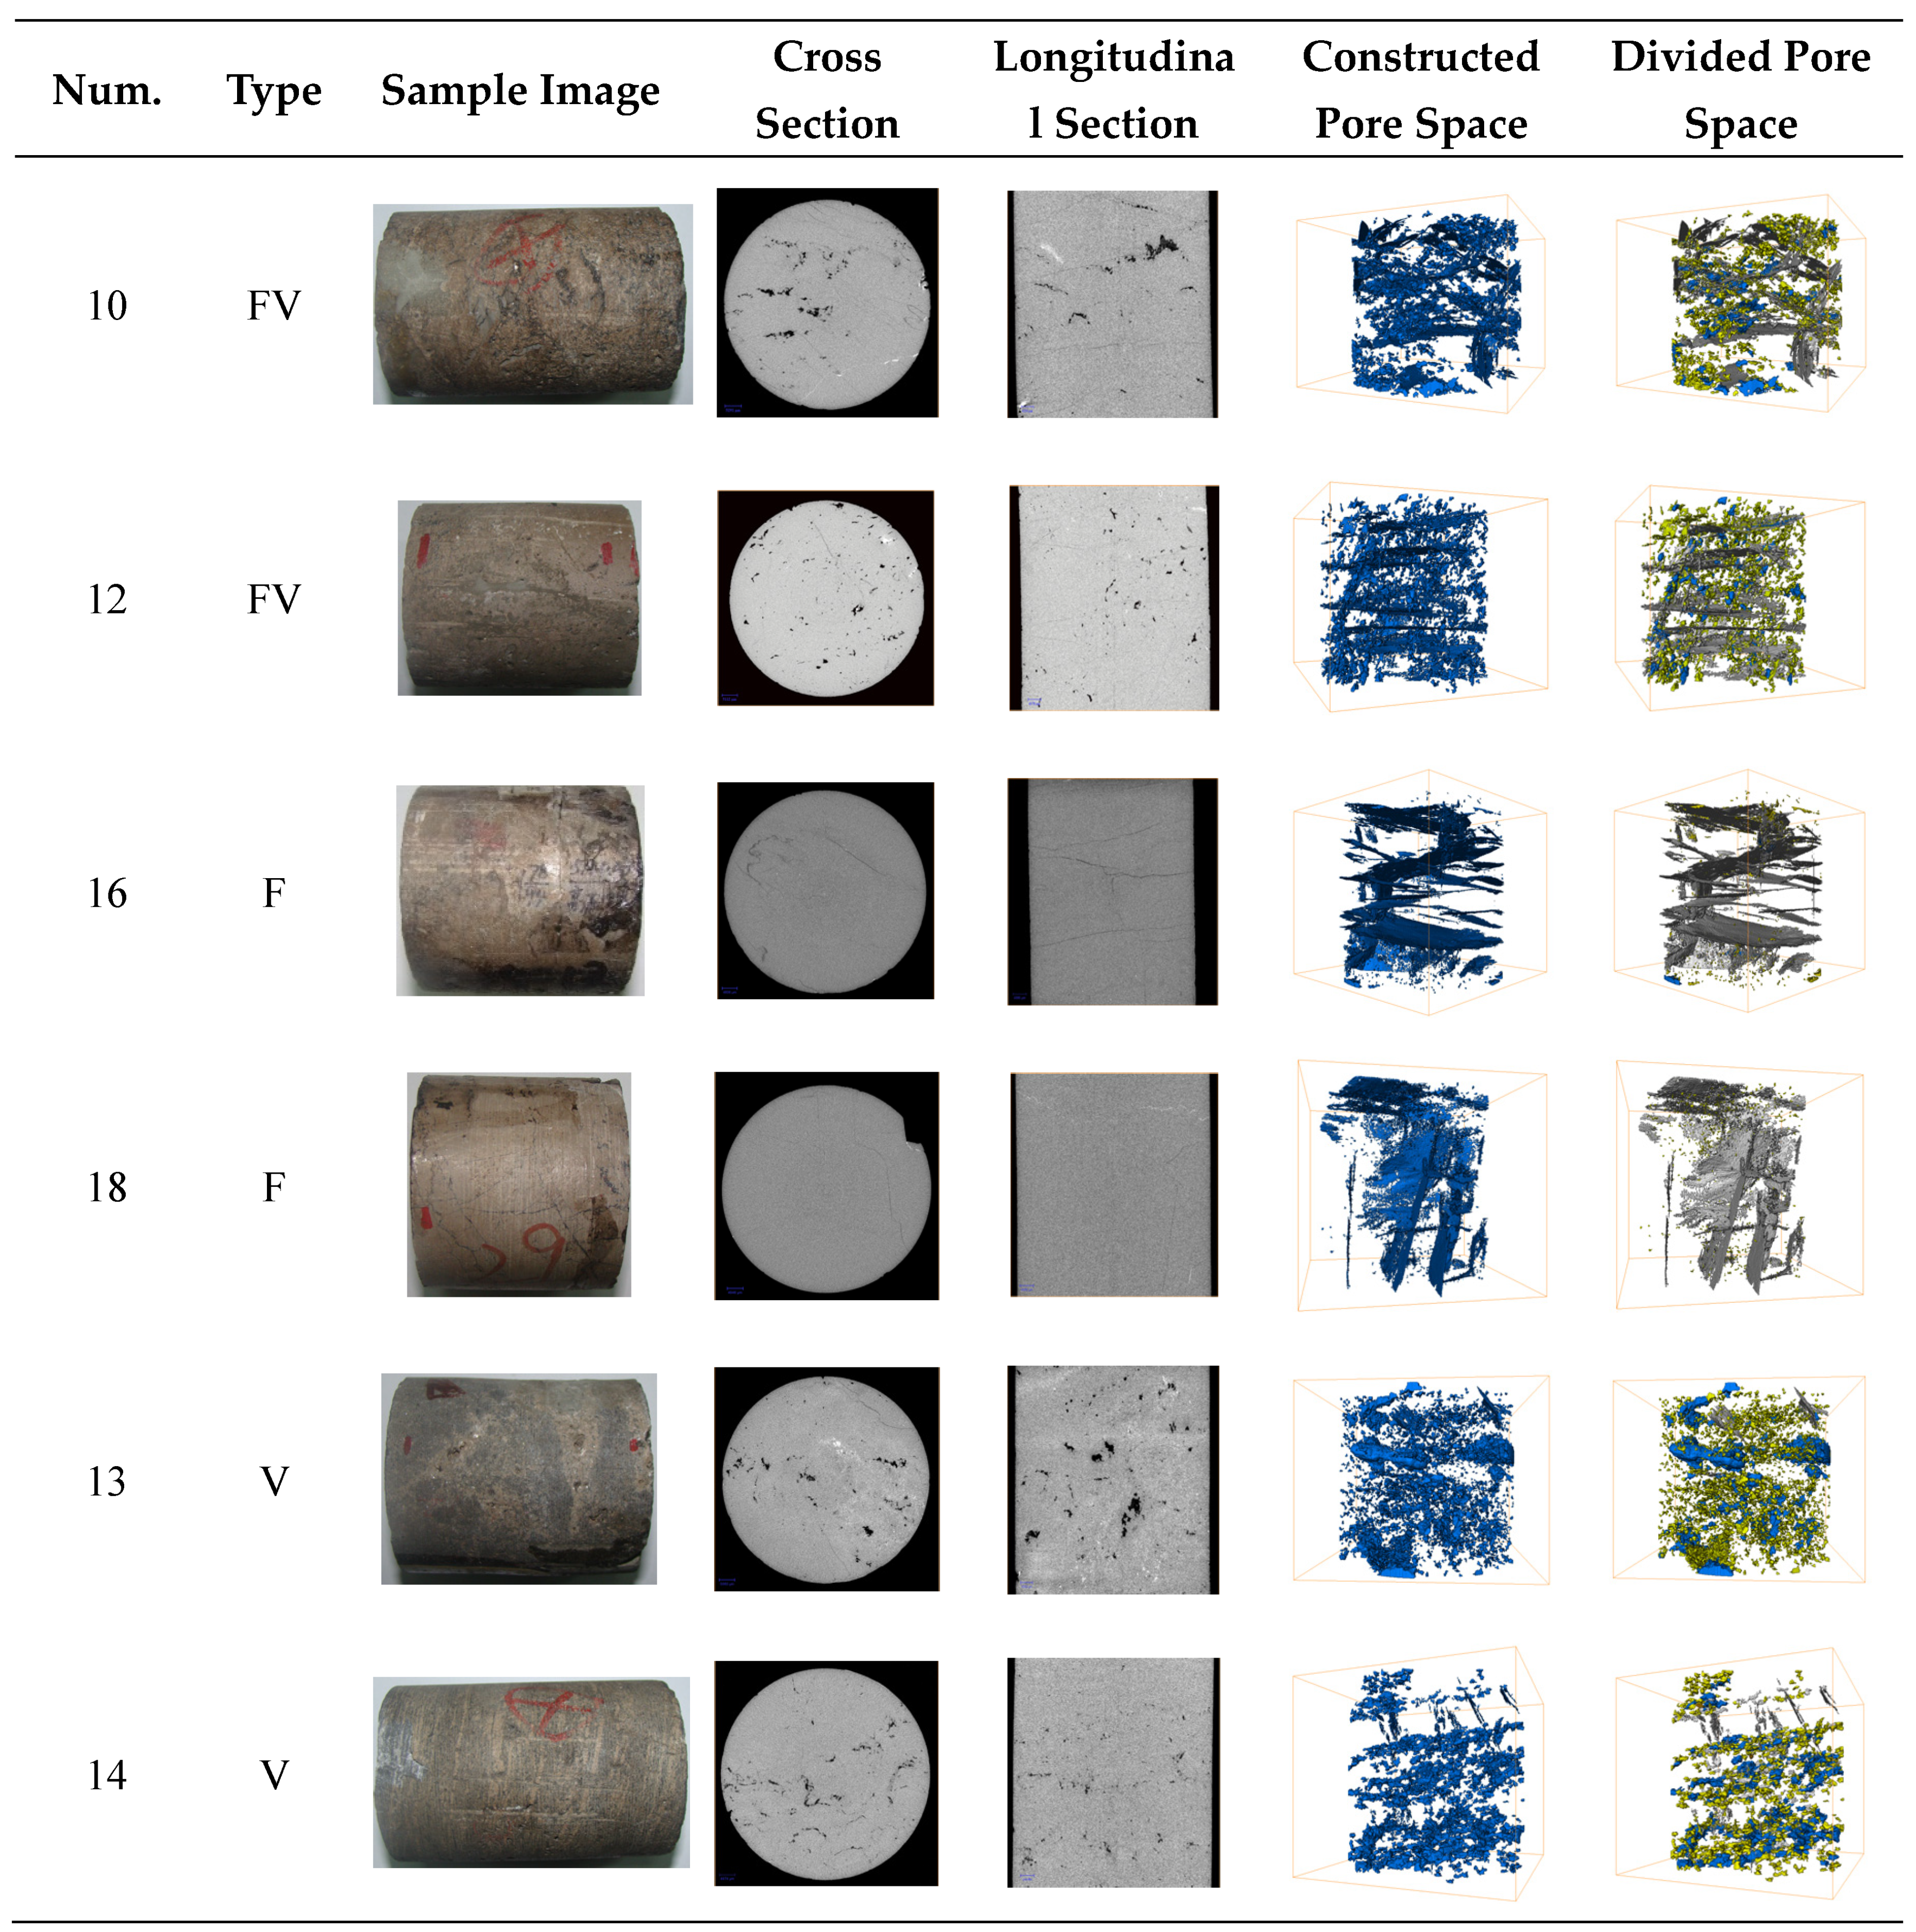
Appendix A. Constructed and Divided Pore Spaces of the Rest Tight Carbonates

The constructed pore spaces and the pores, vugs, and fractures acquired by dividing the pore spaces of six samples are listed in Figure 8. The results referring to the remaining samples are shown in Table A1.
Table A1. Photos, cross and longitudinal sections of the CT scanning image, constructed pore spaces, and divided pore spaces of the remaining carbonate samples. This figure together with Figure 8 provides the constructed and divided pores spaces of all the collected tight carbonate samples. ‘FV’, ‘F’, and ‘V’ represent fractured-vuggy carbonate, fractured carbonate, and vuggy carbonate, respectively. In the last column, the fractures, vugs, and pores are colored in gray, blue, and yellow, respectively. The subgraphs are too small that a scale would be hard to see if it is directly marked on the subgraph. Thus, instead of a scale, we provide the physical size including the radius and the length of all the samples in Table 1.
Num.TypeSample ImageCross SectionLongitudinal SectionConstructed Pore SpaceDivided Pore Space
1FV Energies 13 06148 i001 Energies 13 06148 i002 Energies 13 06148 i003 Energies 13 06148 i004 Energies 13 06148 i005
2FV Energies 13 06148 i006 Energies 13 06148 i007 Energies 13 06148 i008 Energies 13 06148 i009 Energies 13 06148 i010
3FV Energies 13 06148 i011 Energies 13 06148 i012 Energies 13 06148 i013 Energies 13 06148 i014 Energies 13 06148 i015
4FV Energies 13 06148 i016 Energies 13 06148 i017 Energies 13 06148 i018 Energies 13 06148 i019 Energies 13 06148 i020
5FV Energies 13 06148 i021 Energies 13 06148 i022 Energies 13 06148 i023 Energies 13 06148 i024 Energies 13 06148 i025
6FV Energies 13 06148 i026 Energies 13 06148 i027 Energies 13 06148 i028 Energies 13 06148 i029 Energies 13 06148 i030
7FV Energies 13 06148 i031 Energies 13 06148 i032 Energies 13 06148 i033 Energies 13 06148 i034 Energies 13 06148 i035
8FV Energies 13 06148 i036 Energies 13 06148 i037 Energies 13 06148 i038 Energies 13 06148 i039 Energies 13 06148 i040
9FV Energies 13 06148 i041 Energies 13 06148 i042 Energies 13 06148 i043 Energies 13 06148 i044 Energies 13 06148 i045
11FV Energies 13 06148 i046 Energies 13 06148 i047 Energies 13 06148 i048 Energies 13 06148 i049 Energies 13 06148 i050
15V Energies 13 06148 i051 Energies 13 06148 i052 Energies 13 06148 i053 Energies 13 06148 i054 Energies 13 06148 i055
17F Energies 13 06148 i056 Energies 13 06148 i057 Energies 13 06148 i058 Energies 13 06148 i059 Energies 13 06148 i060

References

  1. Du, J.; Zou, C.; Xu, C.; He, H.; Shen, P.; Yang, Y.; Li, Y.; Wei, G.; Wang, Z.; Yang, Y. Theoretical and technical innovations in strategic discovery of a giant gas field in Cambrian Longwangmiao Formation of central Sichuan paleo-uplift, Sichuan Basin. Pet. Explor. Dev. 2014, 41, 294–305. [Google Scholar] [CrossRef]
  2. Kazemzadeh, E.; Nabi-Bidhendi, M.; Moezabad, M.K.; Rezaee, M.R.; Saadat, K. A new approach for the determination of cementation exponent in different petrofacies with velocity deviation logs and petrographical studies in the carbonate Asmari formation. J. Geophys. Eng. 2007, 4, 160–170. [Google Scholar] [CrossRef]
  3. Weger, R.J.; Eberli, G.P.; Baechle, G.T.; Massaferro, J.L.; Sun, Y.-F. Quantification of pore structure and its effect on sonic velocity and permeability in carbonates. Aapg Bull. 2009, 93, 1297–1317. [Google Scholar] [CrossRef]
  4. Claes, S.; Soete, J.; Cnudde, V.; Swennen, R. A three-dimensional classification for mathematical pore shape description in complex carbonate reservoir rocks. Math. Geol. 2016, 48, 619–639. [Google Scholar] [CrossRef]
  5. Zhu, L.; Zhang, C.; Wei, Y.; Zhou, X.; Huang, Y.; Zhang, C. Inversion of the permeability of a tight gas reservoir with the combination of a deep Boltzmann kernel extreme learning machine and nuclear magnetic resonance logging transverse relaxation time spectrum data. Interpretation 2017, 5, T341–T350. [Google Scholar] [CrossRef]
  6. Zhu, L.-Q.; Zhang, C.; Wei, Y.; Zhang, C.-M. Permeability Prediction of the Tight Sandstone Reservoirs Using Hybrid Intelligent Algorithm and Nuclear Magnetic Resonance Logging Data. Arab. J. Sci. Eng. 2016, 42, 1643–1654. [Google Scholar] [CrossRef]
  7. Li, H.; Zhang, J. Well log and seismic data analysis for complex pore-structure carbonate reservoir using 3D rock physics templates. J. Appl. Geophys. 2018, 151, 175–183. [Google Scholar] [CrossRef]
  8. Bing, X.; Li, B.; Zhao, A.L.; Zhang, Y.H.; Wang, Y. Application of Sonic Scanner logging to fracture effectiveness evaluation of carbonate reservoir: A case from Sinian in Sichuan Basin. Lithol. Reserv. 2017, 29, 117–123. (In Chinese) [Google Scholar]
  9. He, S.; Qin, Q.R.; Wang, J.S.; Li, F.; Duan, W. Fracture Properties and Development Mechanisms of Sinian Dengying—4 Member in Central Sichuan. Lithol. Reserv. 2020, 27, 60–66. (In Chinese) [Google Scholar]
  10. Okabe, H.; Blunt, M.J. Pore space reconstruction of vuggy carbonates using microtomography and multiple-point statistics. Water Resour. Res. 2007, 43, 1–5. [Google Scholar] [CrossRef]
  11. Rezaee, M.; Motiei, H.; Kazemzadeh, E. A new method to acquire m exponent and tortuosity factor for microscopically heterogeneous carbonates. J. Pet. Sci. Eng. 2007, 56, 241–251. [Google Scholar] [CrossRef] [Green Version]
  12. Tiwari, P.; Deo, M.; Lin, C.; Miller, J. Characterization of oil shale pore structure before and after pyrolysis by using X-ray micro CT. Fuel 2013, 107, 547–554. [Google Scholar] [CrossRef]
  13. Zhang, J. Experimental Study and Modeling for CO2Diffusion in Coals with Different Particle Sizes: Based on Gas Absorption (Imbibition) and Pore Structure. Energy Fuels 2016, 30, 531–543. [Google Scholar] [CrossRef]
  14. Li, W.; Zou, C.; Wang, H.; Peng, C. A model for calculating the formation resistivity factor in low and middle porosity sandstone formations considering the effect of pore geometry. J. Pet. Sci. Eng. 2017, 152, 193–203. [Google Scholar] [CrossRef]
  15. Wang, L.; Zhao, N.; Sima, L.; Meng, F.; Guo, Y. Pore Structure Characterization of the Tight Reservoir: Systematic Integration of Mercury Injection and Nuclear Magnetic Resonance. Energy Fuels 2018, 32, 7471–7484. [Google Scholar] [CrossRef]
  16. Yuan, Y.; Rezaee, R.; Verrall, M.; Hu, S.-Y.; Zou, J.; Testmanti, N. Pore characterization and clay bound water assessment in shale with a combination of NMR and low-pressure nitrogen gas adsorption. Int. J. Coal Geol. 2018, 194, 11–21. [Google Scholar] [CrossRef]
  17. Dong, S.; Zeng, L.; Xu, C.; Dowd, P.; Gao, Z.; Mao, Z.; Wang, A. A novel method for extracting information on pores from cast thin-section images. Comput. Geosci. 2019, 130, 69–83. [Google Scholar] [CrossRef]
  18. Zhang, F.; Jiang, Z.; Sun, W.; Li, Y.; Zhang, X.; Zhu, L.; Wen, M. A multiscale comprehensive study on pore structure of tight sandstone reservoir realized by nuclear magnetic resonance, high pressure mercury injection and constant-rate mercury injection penetration test. Mar. Pet. Geol. 2019, 109, 208–222. [Google Scholar] [CrossRef]
  19. Pal, N.R.; Pal, S.K. A review on image segmentation techniques. Pattern Recognit. 1993, 26, 1277–1294. [Google Scholar] [CrossRef]
  20. Martin, J.B.; Branko, B.; Hu, D.; Oussama, G.; Stefan, I.; Peyman, M.; Adriana, P.; Christopher, P. Pore-scale imaging and modeling. Adv. Water Resour. 2013, 51, 197–216. [Google Scholar]
  21. Liang, L.; Yongkoo, S.; Karl, J. Pore-Scale Visualization of Methane Hydrate-Bearing Sediments with Micro-CT. Geophys. Res. Lett. 2018, 11, 5417–5426. [Google Scholar]
  22. Njiekak, G.; Schmitt, D.R.; Kofman, R.S. Pore systems in carbonate formations, Weyburn field, Saskatchewan, Canada: Micro-tomography, helium porosimetry and mercury intrusion porosimetry characterization. J. Pet. Sci. Eng. 2018, 171, 1496–1513. [Google Scholar] [CrossRef]
  23. Sankur, B. Survey over image thresholding techniques and quantitative performance evaluation. J. Electron. Imaging 2004, 13, 146–168. [Google Scholar] [CrossRef]
  24. Noiriel, C. Resolving Time-dependent Evolution of Pore-Scale Structure, Permeability and Reactivity using X-ray Microtomography. Rev. Miner. Geochem. 2015, 80, 247–285. [Google Scholar] [CrossRef] [Green Version]
  25. Sok, R.M.; Varslot, T.; Ghous, A.; Latham, S.; Knackstedt, M.A. Pore scale characterization of carbonates at multiple scales: Integration of micro-ct, bsem, and fibsem. Petrophysics 2010, 51, 379–387. [Google Scholar]
  26. Wildenschild, D.; Sheppard, A.P. X-ray imaging and analysis techniques for quantifying pore-scale structure and processes in subsurface porous medium systems. Adv. Water Resour. 2013, 51, 217–246. [Google Scholar] [CrossRef]
  27. Neto, I.A.L.; Misságia, R.M.; Ceia, M.A.; Archilha, N.L.; Oliveira, L.C. Carbonate pore system evaluation using the velocity–porosity–pressure relationship, digital image analysis, and differential effective medium theory. J. Appl. Geophys. 2014, 110, 23–33. [Google Scholar] [CrossRef]
  28. Tonietto, S.N.; Smoot, M.Z.; Pope, M. Pore type characterization and classification in carbonate reservoirs. In Proceedings of the AAPG Annual Convention and Exhibition, Houston, TX, USA, 6–9 April 2014. [Google Scholar]
  29. Promentilla, M.A.B.; Takafumi, S.; Takashi, H.; Nobufumi, T. Characterizing the 3d pore structure of hardened cement paste with synchrotron microtomography. J. Adv. Concr. Technol. 2008, 6, 273–286. [Google Scholar] [CrossRef] [Green Version]
  30. Promentilla, M.A.B.; Cortez, S.M.; Papel, R.A.D.; Tablada, B.M.; Sugiyama, T. Evaluation of Microstructure and Transport Properties of Deteriorated Cementitious Materials from Their X-ray Computed Tomography (CT) Images. Materials 2016, 9, 388. [Google Scholar] [CrossRef] [Green Version]
  31. Li, B.; Tan, X.; Wang, F.; Lian, P.; Gao, W.; Li, Y. Fracture and vug characterization and carbonate rock type automatic classification using X-ray CT images. J. Pet. Sci. Eng. 2017, 153, 88–96. [Google Scholar] [CrossRef]
  32. Xu, Z.; Lin, M.; Jiang, W.; Cao, G.; Yi, Z. Identifying the comprehensive pore structure characteristics of a rock from 3D images. J. Pet. Sci. Eng. 2020, 187, 106764. [Google Scholar] [CrossRef]
  33. Eberli, G.P.; Baechle, G.T.; Anselmetti, F.S.; Incze, M.L. Factors controlling elastic properties in carbonate sediments and rocks. Geophysics 2003, 22, 654–660. [Google Scholar] [CrossRef]
  34. Ralf, J.W. Quantitative Pore/Rock Type Parameters in Carbonates and Their Relationship to Velocity Deviations. Ph.D. Thesis, University of Miami, Coral Gables, FL, USA, 2006. [Google Scholar]
  35. Li, T.; Wang, R.; Wang, Z. A method of rough pore surface model and application in elastic wave propagation. Appl. Acoust. 2019, 143, 100–111. [Google Scholar] [CrossRef]
  36. Lubis, L.; Harith, Z.Z.T. Pore Type Classification on Carbonate Reservoir in Offshore Sarawak using Rock Physics Model and Rock Digital Images. IOP Conf. Ser. Earth Environ. Sci. 2014, 19, 12003. [Google Scholar] [CrossRef] [Green Version]
  37. Zambrano, M.; Tondi, E.; Mancini, L.; Arzilli, F.; Lanzafame, G.; Materazzi, M.; Torrieri, S. 3D Pore-network quantitative analysis in deformed carbonate grainstones. Mar. Pet. Geol. 2017, 82, 251–264. [Google Scholar] [CrossRef]
  38. Regnet, J.-B.; Fortin, J.; Nicolas, A.; Pellerin, M.; Guéguen, Y. Elastic properties of continental carbonates: From controlling factors to an applicable model for acoustic-velocity predictions. Geophysics 2019, 84, MR45–MR59. [Google Scholar] [CrossRef]
  39. Huang, T.S.; Yang, G.J.; Tang, G.Y. A fast two-dimensional median filtering algorithm. IEEE Trans. Acoust. Speech Signal Process. 1979, 27, 13–18. [Google Scholar] [CrossRef] [Green Version]
  40. Yin, G. Adaptive Filtering with Averaging. In Directions in Robust Statistics and Diagnostics; Springer Science and Business Media LLC: Berlin/Heidelberg, Germany, 1995; Volume 74, pp. 375–396. [Google Scholar]
  41. Lu, C.-T.; Chou, T.-C. Denoising of salt-and-pepper noise corrupted image using modified directional-weighted-median filter. Pattern Recognit. Lett. 2012, 33, 1287–1295. [Google Scholar] [CrossRef]
  42. Vargas, J.I.D.L.R.; Villa, J.J.; Gonzalez, E.; Cortez, J. A tour of nonlocal means techniques for image filtering. In Proceedings of the 2016 International Conference on Electronics, Communications and Computers (CONIELECOMP), Cholula, Mexico, 24–26 February 2016; pp. 32–39. [Google Scholar]
  43. Wang, X.; Shen, S.; Shi, G.; Xu, Y.; Zhang, P. Iterative non-local means filter for salt and pepper noise removal. J. Vis. Commun. Image Represent. 2016, 38, 440–450. [Google Scholar] [CrossRef]
  44. Wang, Y.; Chen, Q.; Zhang, B. Image enhancement based on equal area dualistic sub-image histogram equalization method. IEEE Trans. Consum. Electron. 1999, 45, 68–75. [Google Scholar] [CrossRef]
  45. Xu, H.; Zhai, G.; Wu, X.; Yang, X. Generalized Equalization Model for Image Enhancement. IEEE Trans. Multimed. 2013, 16, 68–82. [Google Scholar] [CrossRef]
  46. Kushol, R.; Kabir, H.; Salekin, S.; Rahman, A.B.M.A. Contrast Enhancement by Top-Hat and Bottom-Hat Transform with Optimal Structuring Element: Application to Retinal Vessel Segmentation. In Proceedings of the International Conference Image Analysis and Recognition, Montreal, QC, Canada, 5–7 July 2017; Springer: Cham, Switzerland, 2017. [Google Scholar]
  47. Wang, W.; Wang, W.; Hu, Z. Segmenting retinal vessels with revised top-bottom-hat transformation and flattening of minimum circumscribed ellipse. Med Biol. Eng. Comput. 2019, 57, 1481–1496. [Google Scholar] [CrossRef] [PubMed]
  48. Wang, Z.; Wang, R.; Wang, F.; Qiu, H.; Li, T. Experiment study of pore structure effects on velocities in synthetic carbonate rocks. Geophysics 2015, 80, D207–D219. [Google Scholar] [CrossRef]
  49. Li, L.X.; Chang, C.; Xu, W.; Yan, Y.J.; Yang, L.; Deng, H. Reconstruction of porosity and permeability characteristics of fracture-vug reservoirs by using digital core together with imaging logging. Nat. Gas Explor. Dev. 2017, 40, 16–23. (In Chinese) [Google Scholar]
  50. Roerdink, J.B.; Meijster, A. The Watershed Transform: Definitions, Algorithms and Parallelization Strategies. Fundam. Inform. 2000, 41, 187–228. [Google Scholar] [CrossRef] [Green Version]
  51. Shabaninejad, M.; Middlelton, J.; Fogden, A. Systematic pore-scale study of low salinity recovery from Berea sandstone analyzed by micro-CT. J. Pet. Sci. Eng. 2018, 163, 283–294. [Google Scholar] [CrossRef] [Green Version]
  52. API RP40. Recommended Practices for Core Analysis; American Petroleum Institute (API): Washington, WA, USA, 1998. [Google Scholar]
  53. Melendez-Martinez, J. Elastic Properties of Sedimentary Rocks. Ph.D. Thesis, University of Alberta, Edmonton, AB, Canada, 2014. [Google Scholar]
Figure 1. The application of image filtering method to the micro-CT scanned image: (a) the micro-CT scanning image, (b) the enlarged image, (c) the false-colored image, and (d) the filtered image. After the false coloring, the pore space is in sky blue and the matrix is in yellow. The speckled random noises are the red dots and Gaussian noises make the matrix a mix of green and yellow.
Energies 13 06148 g001
Figure 2. Binary threshold image segmentation: (a) the original figure, (b) the segmented image using a low threshold, and (c) the segmented image using a high threshold. The fractures cannot be segmented as shown in the subgraph (b) and the volumes of the pores and the vugs spilled out in the subgraph (c).
Energies 13 06148 g002
Figure 3. Different methods applied to fracture acquirement: (a) the filtered image, (b) the segmented pore space by watershed method, (c) the segmented pore space after histogram equalization enhancement, (d) the filtered image of the subgraph (c), (e) the segmented pore space after top-bottom hat algorithm, (f) the filtered image of the subgraph (e).
Energies 13 06148 g003
Figure 4. Workflow chat for characterizing the pore space and analyzing its effect on wave speeds. After sawing the samples into cylindrical plugs, the samples are scanned using micro-CT. Then, the quality of each acquired 2D micro-CT image is improved using image filtering and enhancement techniques. The pore spaces of the samples are constructed and divided into pores, fractures, and vugs basing on the geometric characteristics of each individual pore space. Finally, the pore-structural parameters are acquired and related to the density, porosity, and wave velocities to analyze its effect on wave speeds.
Energies 13 06148 g004
Figure 5. Illustration of the difference between a throat and a fracture in geometry. The lengths of a throat and a fracture are both usually significantly longer than their widths and thicknesses. The difference is that the width and the thickness of a throat are close while the width of a fracture is usually significantly longer than the thickness of it. To avoid mistakenly acquire a throat as a fracture, both the ratios of length over thickness and width over thickness should be large.
Energies 13 06148 g005
Figure 6. Scheme of the wave velocity measurement system. The system is mainly composed of three parts that provide confining pressure, porosity measurement, and pulse transmission measurement, respectively.
Energies 13 06148 g006
Figure 7. Illustration of (a) the acquired pore space, (b) segmented individual volumes with watershed method, and (c) divided pores, vugs, and fractures according to the geometry of individual volumes.
Energies 13 06148 g007
Figure 8. Examples of the sample, cross section, and longitudinal section of the CT scanning image, constructed pore space, and divided pore space of the carbonate samples. ‘FV’, ‘F’, and ‘V’ represent fractured-vuggy carbonate, fractured carbonate, and vuggy carbonate, respectively. The total pore spaces of the carbonate samples are in blue as shown in the sixth column. The pore space after division is shown in the seventh column with the fractures colored in gray, vugs in blue, and pores in yellow. The rest of the constructed and divided pore spaces of the samples are provided in the supplementary file. The subgraphs are too small that a scale would be hard to see if it is directly marked on the subgraph. Thus, instead of a scale, we provide the physical size including the radius and the length of all the samples in Table 1.
Energies 13 06148 g008
Figure 9. Cross plot of the micro-CT porosity against He gas filling porosity. It can be seen that the porosity acquired from micro-CT is close to that from He gas.
Energies 13 06148 g009
Figure 10. Cross plots of (a) P-wave and (b) S-wave speeds against He gas porosity. The data referring to both P- and S-waves are scattered.
Energies 13 06148 g010
Figure 11. The cross plot of the sum of the volume fractions (VF) of vugs and pores against the He gas porosity.
Energies 13 06148 g011
Figure 12. The cross plots of (a) P- and (b) S-wave porosity against fracture porosity. For the convenience in referring the dots to the micro-CT images, the number of the samples are marked on the figure. The red solid and black empty dots represent the data collected from the samples possessing fractures with low and high orientation angles, respectively. Decreasing trends of the wave speeds with porosity are observed for both P- and S-waves in the samples mainly containing low orientation fractures.
Energies 13 06148 g012
Table 1. The resolution, pixels per scanned image, and the amount of the scanned images, and the size information of all the samples.
Num.Resolution (um/pix)Pixels Per Scanned ImageNumber of Scanned ImagesSample Radius (um)Sample Length (um)
1501450 × 1454160036,30080,000
2501442 × 1448129836,12564,900
3451607 × 1644142736,15764,215
4501456 × 1437147036,16273,500
5501402 × 1409140035,13770,000
6501457 × 1485120336,77560,150
7451423 × 1427140032,06263,000
8431489 × 1514112432,28248,332
9451384 × 1363140031,14063,000
10401613 × 1641144532,54057,800
11431405 × 1404160030,19668,800
12421463 × 1451144530,72360,690
13401682 × 1682146533,64058,600
14411586 × 1583160032,48265,600
15501418 × 1435140035,66270,000
16451394 × 1396140031,38763,000
17401548 × 1565174231,13069,680
18461314 × 1340140030,52164,400
Table 2. Pore structural parameters obtained from the constructed pore space. ‘VF’ represents volume fraction. The VF of pores, vugs, or fractures equals the ratio of the volume of them over that of the total pore space, respectively. The orientation of the fractures parallel or perpendicular to the ends of the core plug is defined as 0° or 90°, respectively. The VR of oriented fractures equals the ratio of the volume of the fractures oriented in a certain angle range, for example, 0–30°, over that of all fractures.
Num.CT PorosityVF of PoresVF of VugsVF of FracturesAveraged Equivalent Pore DiameterVF of Oriented Fractures
0–30°30–60°60–90°
%%%%μm%%%
12.41 24.61 17.79 57.60 413.2558.80 13.85 27.34
21.18 53.49 27.40 19.11 332.8514.59 40.52 44.89
32.31 31.20 25.07 43.73 398.9951.75 20.18 28.07
43.29 14.82 63.99 21.19 699.4952.99 27.49 19.52
52.14 28.68 30.93 40.39 586.2242.63 23.77 33.59
63.27 30.39 44.93 24.68 341.3428.11 25.60 46.30
72.27 29.98 7.51 62.50 392.1227.85 21.88 50.27
83.17 15.09 32.18 52.73 248.2384.32 15.68 0.00
92.78 29.70 27.47 42.83 217.9130.44 33.29 36.28
104.06 20.92 50.33 28.75 317.2011.41 33.09 55.50
111.37 45.82 31.92 22.27 293.228.79 48.56 22.65
122.24 43.97 19.66 36.37 232.0448.53 20.16 31.31
133.56 24.51 73.72 1.77 278.9821.52 45.11 33.37
141.67 57.63 35.46 6.91 380.3831.93 17.61 50.46
153.01 15.93 75.22 8.84 316.7648.20 29.90 21.90
161.62 5.16 0.82 94.01 244.9889.05 10.95 0.00
171.39 14.86 0.70 84.44 417.9059.04 1.56 39.40
181.27 46.92 0.0053.08 254.1713.78 15.70 70.52
Publisher’s Note: MDPI stays neutral with regard to jurisdictional claims in published maps and institutional affiliations.

