Article

Optimization of a PV-Wind Hybrid Power Supply Structure with Electrochemical Storage Intended for Supplying a Load with Known Characteristics

1
Faculty of Control, Robotics and Electrical Engineering, Poznań University of Technology, 60-965 Poznań, Poland
2
Faculty of Environmental Engineering and Energy, Poznań University of Technology, 60-965 Poznań, Poland
3
Faculty of Electrical Engineering Automatic Control and Informatics, Opole University of Technology, 45-758 Opole, Poland
4
Power Systems Analysis Group, Río Cuarto National University, Rio Cuarto X5804BYA, Argentina
*
Author to whom correspondence should be addressed.
Energies 2020, 13(22), 6143; https://doi.org/10.3390/en13226143
Submission received: 22 October 2020 / Revised: 13 November 2020 / Accepted: 17 November 2020 / Published: 23 November 2020

Abstract

:
An important aspect of the off-grid utilization of hybrid generation systems is the integration of energy storage facilities into their structures, which allows for improved power supply reliability. However, this results in a significant increase in the cost of such systems. Therefore, it is justified to use optimization resulting in the minimization of the selected economic indicator taking into account the most important technical constraints. For this reason, this work proposes an algorithm to optimize the structure of a hybrid off-grid power distribution system (with electrochemical energy storage), designed to supply a load with known daily energy demand. The authors recommend genetic algorithm utilization as well as a modified criterion for evaluating the quality of solutions based on the Levelized Cost of Energy (LCOE) index. Several technical and economic analyses were presented, including unit costs, power distribution of the wind and solar sections, nominal battery capacity, SSSI index (System Self-Sufficiency Index), etc. The model of the system includes durability of the elements which have a significant impact on the periodic battery replacement. The tests were carried out for two types of loads and two types of electrochemical batteries (NMC—Lithium Nickel Manganese Cobalt Oxide; and PbO2—Lead-Acid Battery), taking into account the forecast of an increased lifetime of NMC type batteries and decreasing their price within five years. The proposed synthesis method of photovoltaic-wind (PV-wind) hybrid off-line systems leads to limiting the energy capacity of electrochemical storages. Based on the analyses, the authors proposed recommended methods to improve (reduce) the value of the criterion index (LCOE) for PV-wind off-grid systems while maintaining the assumed level of power supply reliability.

1. Introduction

1.1. Literature Review

Hybrid power generation systems (HPGS) have become increasingly popular as electrical energy generating systems [1,2,3]. The application of properly controlled energy storage in this type of systems greatly increases the probability of maintaining a continuous supply of different loads [4,5] connected to the system nodes, and dynamic modelling of the required output, simultaneously minimizing the cost of power generation.
Table 1 presents the comparison of various technologies used nowadays in distributed generation, including off-grid systems in remote areas. The main disadvantage of renewable energy sources is the strong dependence of electricity production on primary energy availability. Hybrid power generation systems with energy storage make it possible to minimize this drawback.
In the optimization of the structure of HPGS using solar and wind energy, with energy storages in a form of electrochemical batteries, a wide range of optimization methods is used, and the proposed solutions are constantly being improved. Paper [6] describes an iterative method of HPGS optimum dimensioning, used to design an independent power supply for a household in Algeria. Some simulations, also based on iterative calculations in Matlab environment of Mathworks company [7], were also performed for households located in three regions of Sicily. The study in Ref. [4] was divided into two stages, using separate iterative algorithms, which was aimed to match the power of renewable sources and to determine the storage system capacity. The method of optimizing the dimensioning of PV-wind HPGS with batteries proposed in Ref. [5] uses an adaptive system of neuro-fuzzy reasoning. The results of the algorithm operation were compared with analogical results of commercial software, i.e., Hybrid Optimization Model for Electric Renewables (HOMER) and Hybrid Optimization by Genetic Algorithms (HOGA). The authors of paper [8] used many variants of the particle swarm optimization algorithm, e.g., an algorithm based on the repulsion factor and an algorithm, taking into account the inertia-adaptive factor of particle mobility. The optimization task in paper [9] was solved with the cuckoo search algorithm, devised for a design of a system in an agricultural farm in Algeria. In Ref. [10] the firefly algorithm was employed, and the results were compared with other algorithms using metaheuristic methods, e.g., accelerated particle swarm optimization (APSO) algorithm or bat algorithm (BA). In Ref. [11] the process of identifying the optimum HPGS structure was carried out based on the clonal selection algorithm. The results were compared with the results of a genetic algorithm operation. The non-dominated sorting genetic algorithm II (NSGA II) was used in [12,13]. Paper [14] presents an optimization algorithm based on teaching and learning processes. Validation was made by comparing the results obtained in optimization with other popular algorithms—the particle swarm optimization algorithm and genetic algorithm. To ensure optimum sizing of the system supplying a telecommunications TBS, a discrete grey wolf optimizer algorithm was proposed in paper [15]. The authors of [16] proposed a multi-criteria decision-making method as an alternative for optimization algorithms.
Scientists use hybrid solutions in many research projects. A combination of the following three optimization algorithms was proposed in Ref. [17] to solve the optimization task: a random search algorithm, harmony search optimization algorithm and simulated annealing algorithm. In Ref. [18] the HPGS structure was optimized by using a combination of the flower pollination algorithm and simulated annealing algorithm. The authors of the study analyzed the case of a power supply system in a three-floor building in Teheran. In Ref. [19] the hybrid big-bang-big-crunch algorithm was used for optimizing the structure of an independent HPGS. A simulation of the algorithm operation was carried out for a village in Iran which was not connected to the power grid. The results were compared with the particle swarm optimization algorithm and harmony search discrete optimization. In Ref. [20] the hybrid algorithm optimization was applied, which is a combination of the genetic algorithm with the swarm particle optimization algorithm.
Searching for optimal electricity supply solutions for remote areas is frequently realized with the use of commercial software. Shezan et al., used Hybrid Optimization Model for Electric Renewables (HOMER) to design and simulate an operation of energy systems to support a small community considering an average load demand of 80 kWh/d with a peak load of 8.1 kW. The research conducted for localization of offshore areas in Bangladesh [21] and Indonesia [22] shown that PV–Wind–Biomass–Diesel HPGS with battery can reduce CO2 emission about 29.65% compared to conventional power plants, having the per unit Cost of Energy (COE) of USD 0.431/kWh. This region was also a subject of research in Ref. [23], where four different types of models including PV–Grid, Wind–Grid, Wind–PV–Grid, and off-grid hybrid renewables were designed using HOMER. Additionally, the detailed sensitivity analysis was performed, which showed that output results are more sensitive on the variations in long-term average wind speed and solar irradiance, nominal discount rate, and the lifetime of wind turbines than the other inputs. In Ref. [24], the simulation results from HOMER was validated by using Photovoltaic System Tools (PVSYST) renewable energy platform.
The HPGS structure is usually optimized through economic minimization at a simultaneous high-reliability level. The objective function is defined with several economic indicators. The most common ones include: power generation costs [6,10,12,15], total annual cost [7,8,17,25], total current cost [19,20], total system cost [13,26], total lifecycle cost [27,28], total investment cost [29] and the payback period [19]. The pre-determined reliability level is usually ensured by assuming some limitations in the algorithm. Similarly to the objective function, the limitations can be expressed with many reliability indicators, such as LPSP (loss of power supply probability) [5,11,12,13,15,18,20,27], ENS (energy not supplied) [19], GPAP (grid power absorption probability) [9], LDR (load dissatisfaction rate) [10] and LOLP (loss of load probability) [7]. The algorithm limitations in Ref. [29] assumed that the annual power generation of a system should cover or exceed the load energy, having taken into account the system capacity. In addition to assuring the reliability of the generating system, the authors add other constraints to their algorithms, e.g., the minimum and maximum battery charging level [12,17]. In order to avoid the system oversizing, the EEG (excess energy generation) index was defined in Ref. [15]. A popular solution is to include Diesel generators in the optimized structure of PV-wind HGPS [16,25,26]. In the reference case, the authors also take into consideration the environmental constraints related to fuel consumption and CO2 emission.
Researchers often do not define the type of energy storage used in their work or do so rarely. Contrary to previous similar studies, the lithium-ion battery model in Ref. [30] takes into account the capacity loss and temperature changes. Furthermore, on-shore and off-shore wind turbines were treated separately for optimization purposes. A case study was conducted for Jeju Island in South Korea.
Interesting and thematically related publications are [31,32]. In Ref. [31], the authors focused on the generational modelling method for an on-grid hybrid system based on System C-AMS. This allowed for considerable shortening of simulation time in comparison to the model developed in MATLAB Simulink environment. As the authors claim, up to several hundred times acceleration is possible to obtain, depending on analysis step time. In Ref. [32], the authors considered the technical and economic aspects of two hybrid systems, including the energy storage system and electric vehicle. The simulations were conducted for many variants of HPGS, moreover, economic indicators were calculated for various locations and HPGS configurations. Based on the set of obtained solutions, the optimal structures of HPGS with energy storage were determined, from the point of view of selected indicators.
Table 2 summarizes the abovementioned publications in terms of optimization algorithms utilized, as well as the constraints.

1.2. Problem Description

Taking into consideration the literature review presented above, the authors of this paper proposed an optimization algorithm of an off-grid hybrid power supply system (with electrochemical energy storage), intended to supply a load with known daily load characteristics. The quality of the proposed solutions can be evaluated based on the energy unit cost for the power generated in the system and used to supply the facility. This approach introduced an automatic reduction in the power generation system and storage capacity, with regard to the analyzed economic aspects of the solution. The energy transferred to the heaters (momentary excess energy) is also taken into account, whereby some of the emitted heat can be used by industrial loads for their processes and by communal loads for heating purposes. The basic assumed constraint is the maximum load working time over a year period at the supplied power below the assumed load curve (the issues of load supply reliability).
Based on the developed model of a hybrid system and the algorithms of its operation and optimization, the authors presented many results of engineering and economic analyses, including the unit cost of electrical energy generation in the studied power supply system type. In the process of reviewing the literature on electrochemical batteries, research was initially considered using many different types of batteries such as lead–acid, nickel–cadmium, nickel–metal hydride, nickel–zinc, silver–zinc, lithium–iron-phosphate and lithium–nickel–manganese–cobalt–oxide. However, in order to limit the volume of research and due to the predominant popularity of two types of cells in electricity solutions, the studies were conducted for two types of batteries: deep cycle lead–acid batteries and NMC (lithium–nickel–manganese–cobalt–oxide) batteries. The lifespan aspect significantly affects the periodical battery pack replacement. The forecasted increase in the NMC battery lifespan and the expected reduction in the prices of batteries over a five years perspective was taken into account in the storage model. The modelling of electrochemical storages includes elements, which increase the detail rate in reference to the conducted studies. Development of several variants for five values of the maximum annual time in which the power demand exceeds the total energy generated and supplied from the storage is an important aspect of the presented studies. Analyses are also performed for two annual load characteristics—communal and industrial end-users and variants with and without the power generation capacity limitation. The literature review revealed that the previous studies were limited to one value of the reliability index (one constraint variant), that the applied models did not include the lifespan of the electrochemical storages so accurately and the forecasts related to the change in the battery parameters and costs were not taken into consideration.
The paper is structured as follows: Section 2 describes the structure and operation of the hybrid power supply system with electrochemical storage. Section 3 includes a model of the analyzed system. Section 4 describes the power analysis algorithm and the energy storage charging level and presents the measurement data of the wind speed and irradiance used in the calculations. Section 5 covers the optimization algorithm of the analyzed system. Section 6 discusses the results. The paper ends with a summary.

2. Hybrid Power System with Electrochemical Energy Storage

PV-wind hybrid systems have been successfully used to supply loads with known 24 h load characteristics. The power generation characteristics of the wind and PV part in such systems are complementary, which enables better matching of the generation profile to the load profile against the wind or solar source [1,2,3]. The purpose of full matching of the profiles is to use energy storages, which are nowadays mainly electrochemical type, intended for deep discharge (the discharge depth up to 80%). Until recently, lead-acid batteries were mainly recommended, but the characteristics and declining prices of lithium-ion batteries contribute to their increasing popularity in the analysed group of systems [33,34,35,36,37].
The paper analyses a PV-wind system with the rated power Pn = PWT + PPV, where: PWT—the rated power of the wind turbines; PPV—the rated power of the photovoltaic modules, working off-line with the energy storage, intended for supplying small industrial loads (variant A) and communal loads (variant B). 
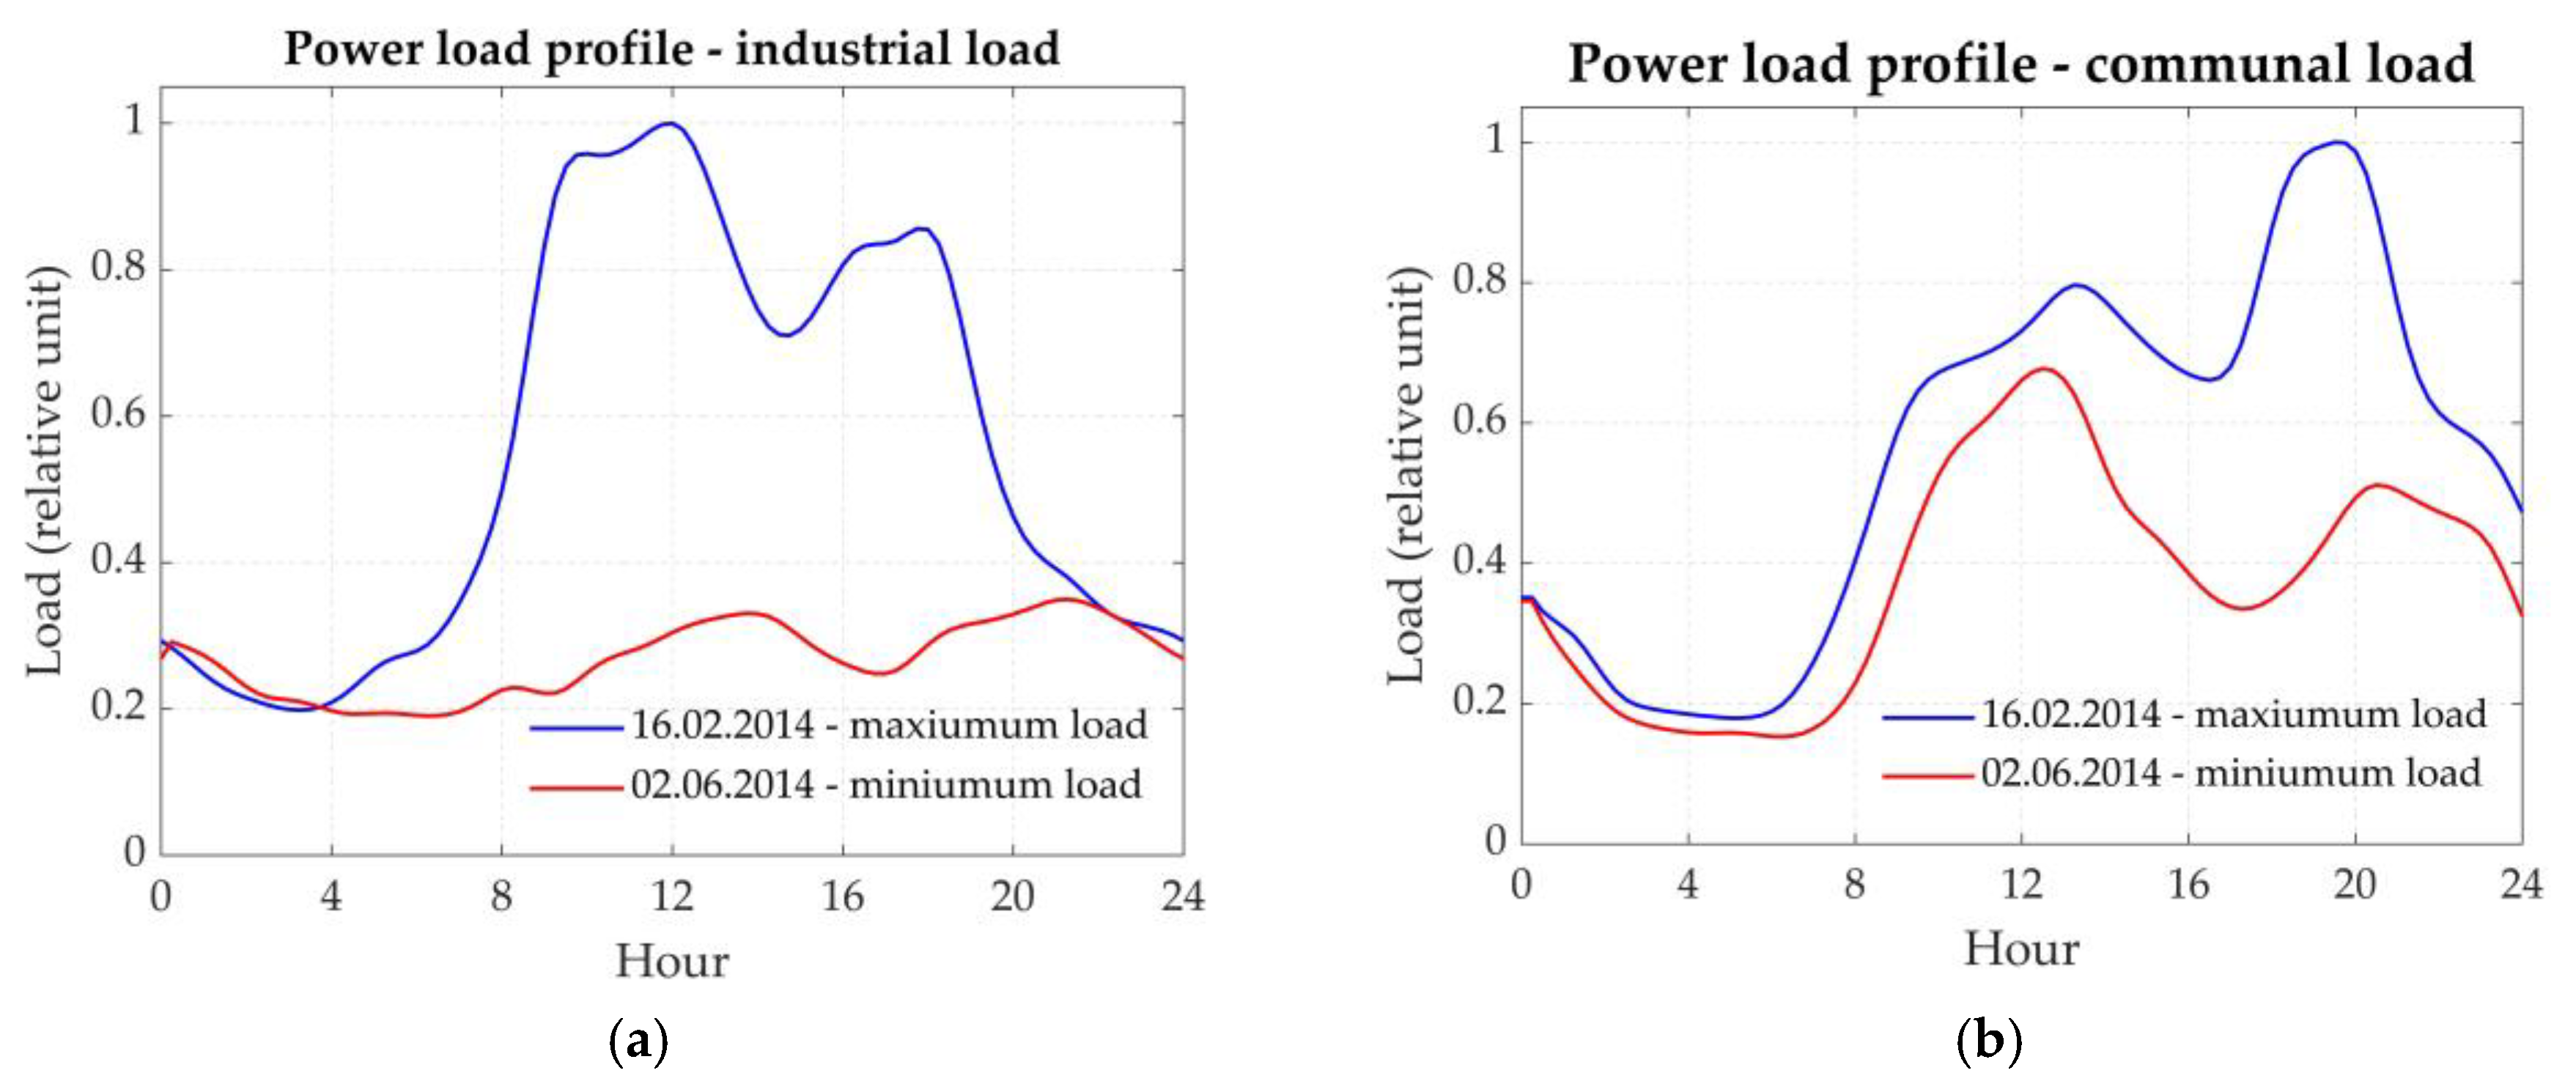
Figure 1 shows the profiles of relative load (P/Pmax, where P—active power of the load at time tPmax—maximum load value in the year 2014) of industrial facilities (Figure 1a) and communal facilities (Figure 1b) considering the lowest (red)—2 June 2014—and the highest (blue)—16 February 2014—energy demand in 2014). 
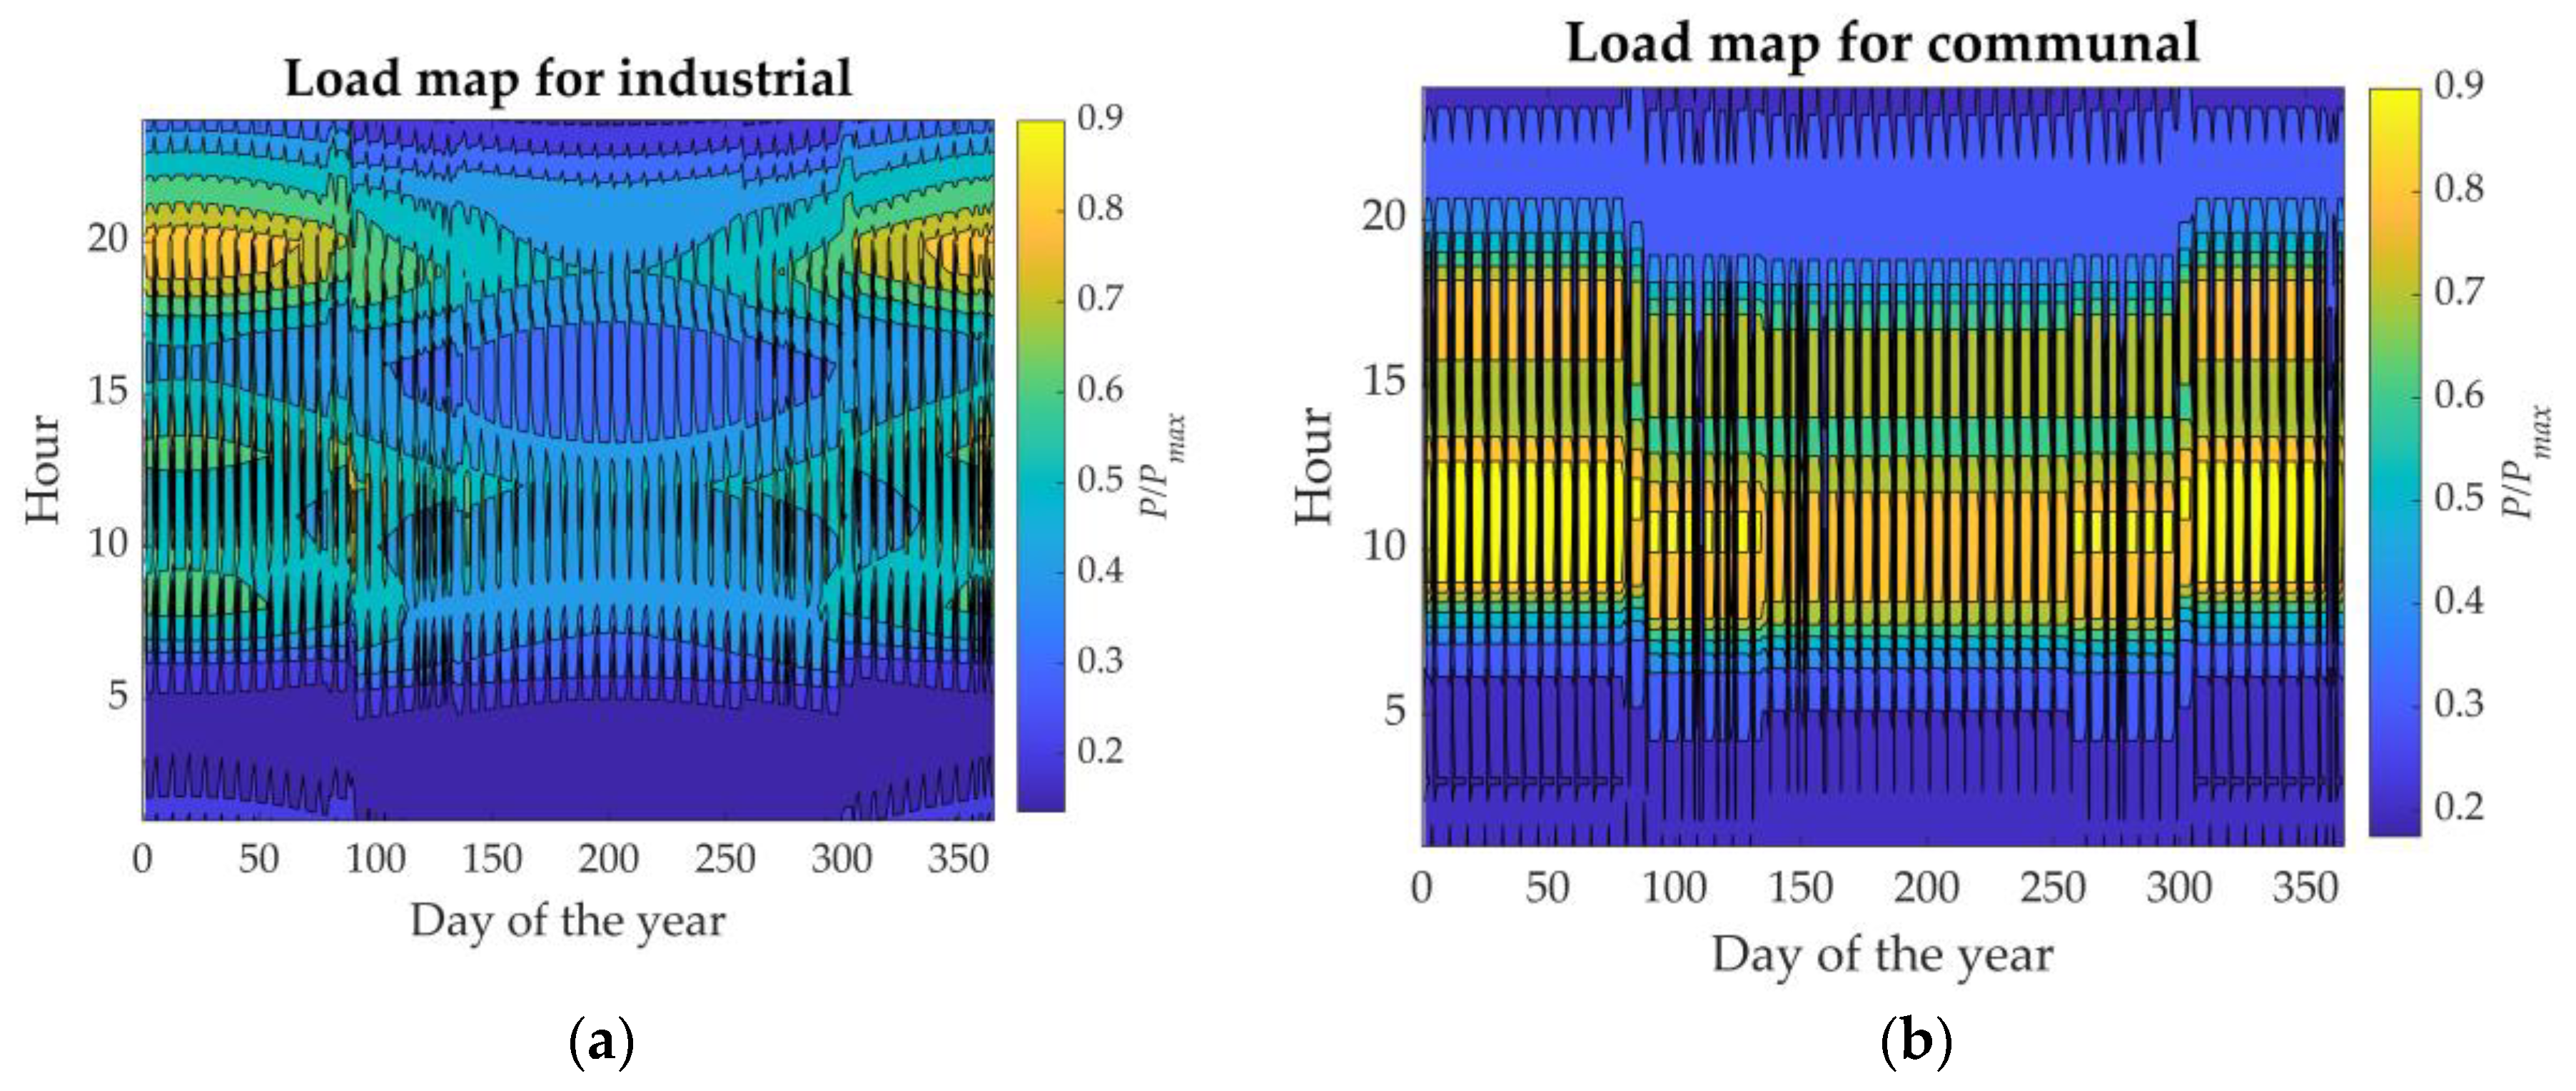
Figure 2 shows the above-mentioned data as an annual load map with a 15 min time step.
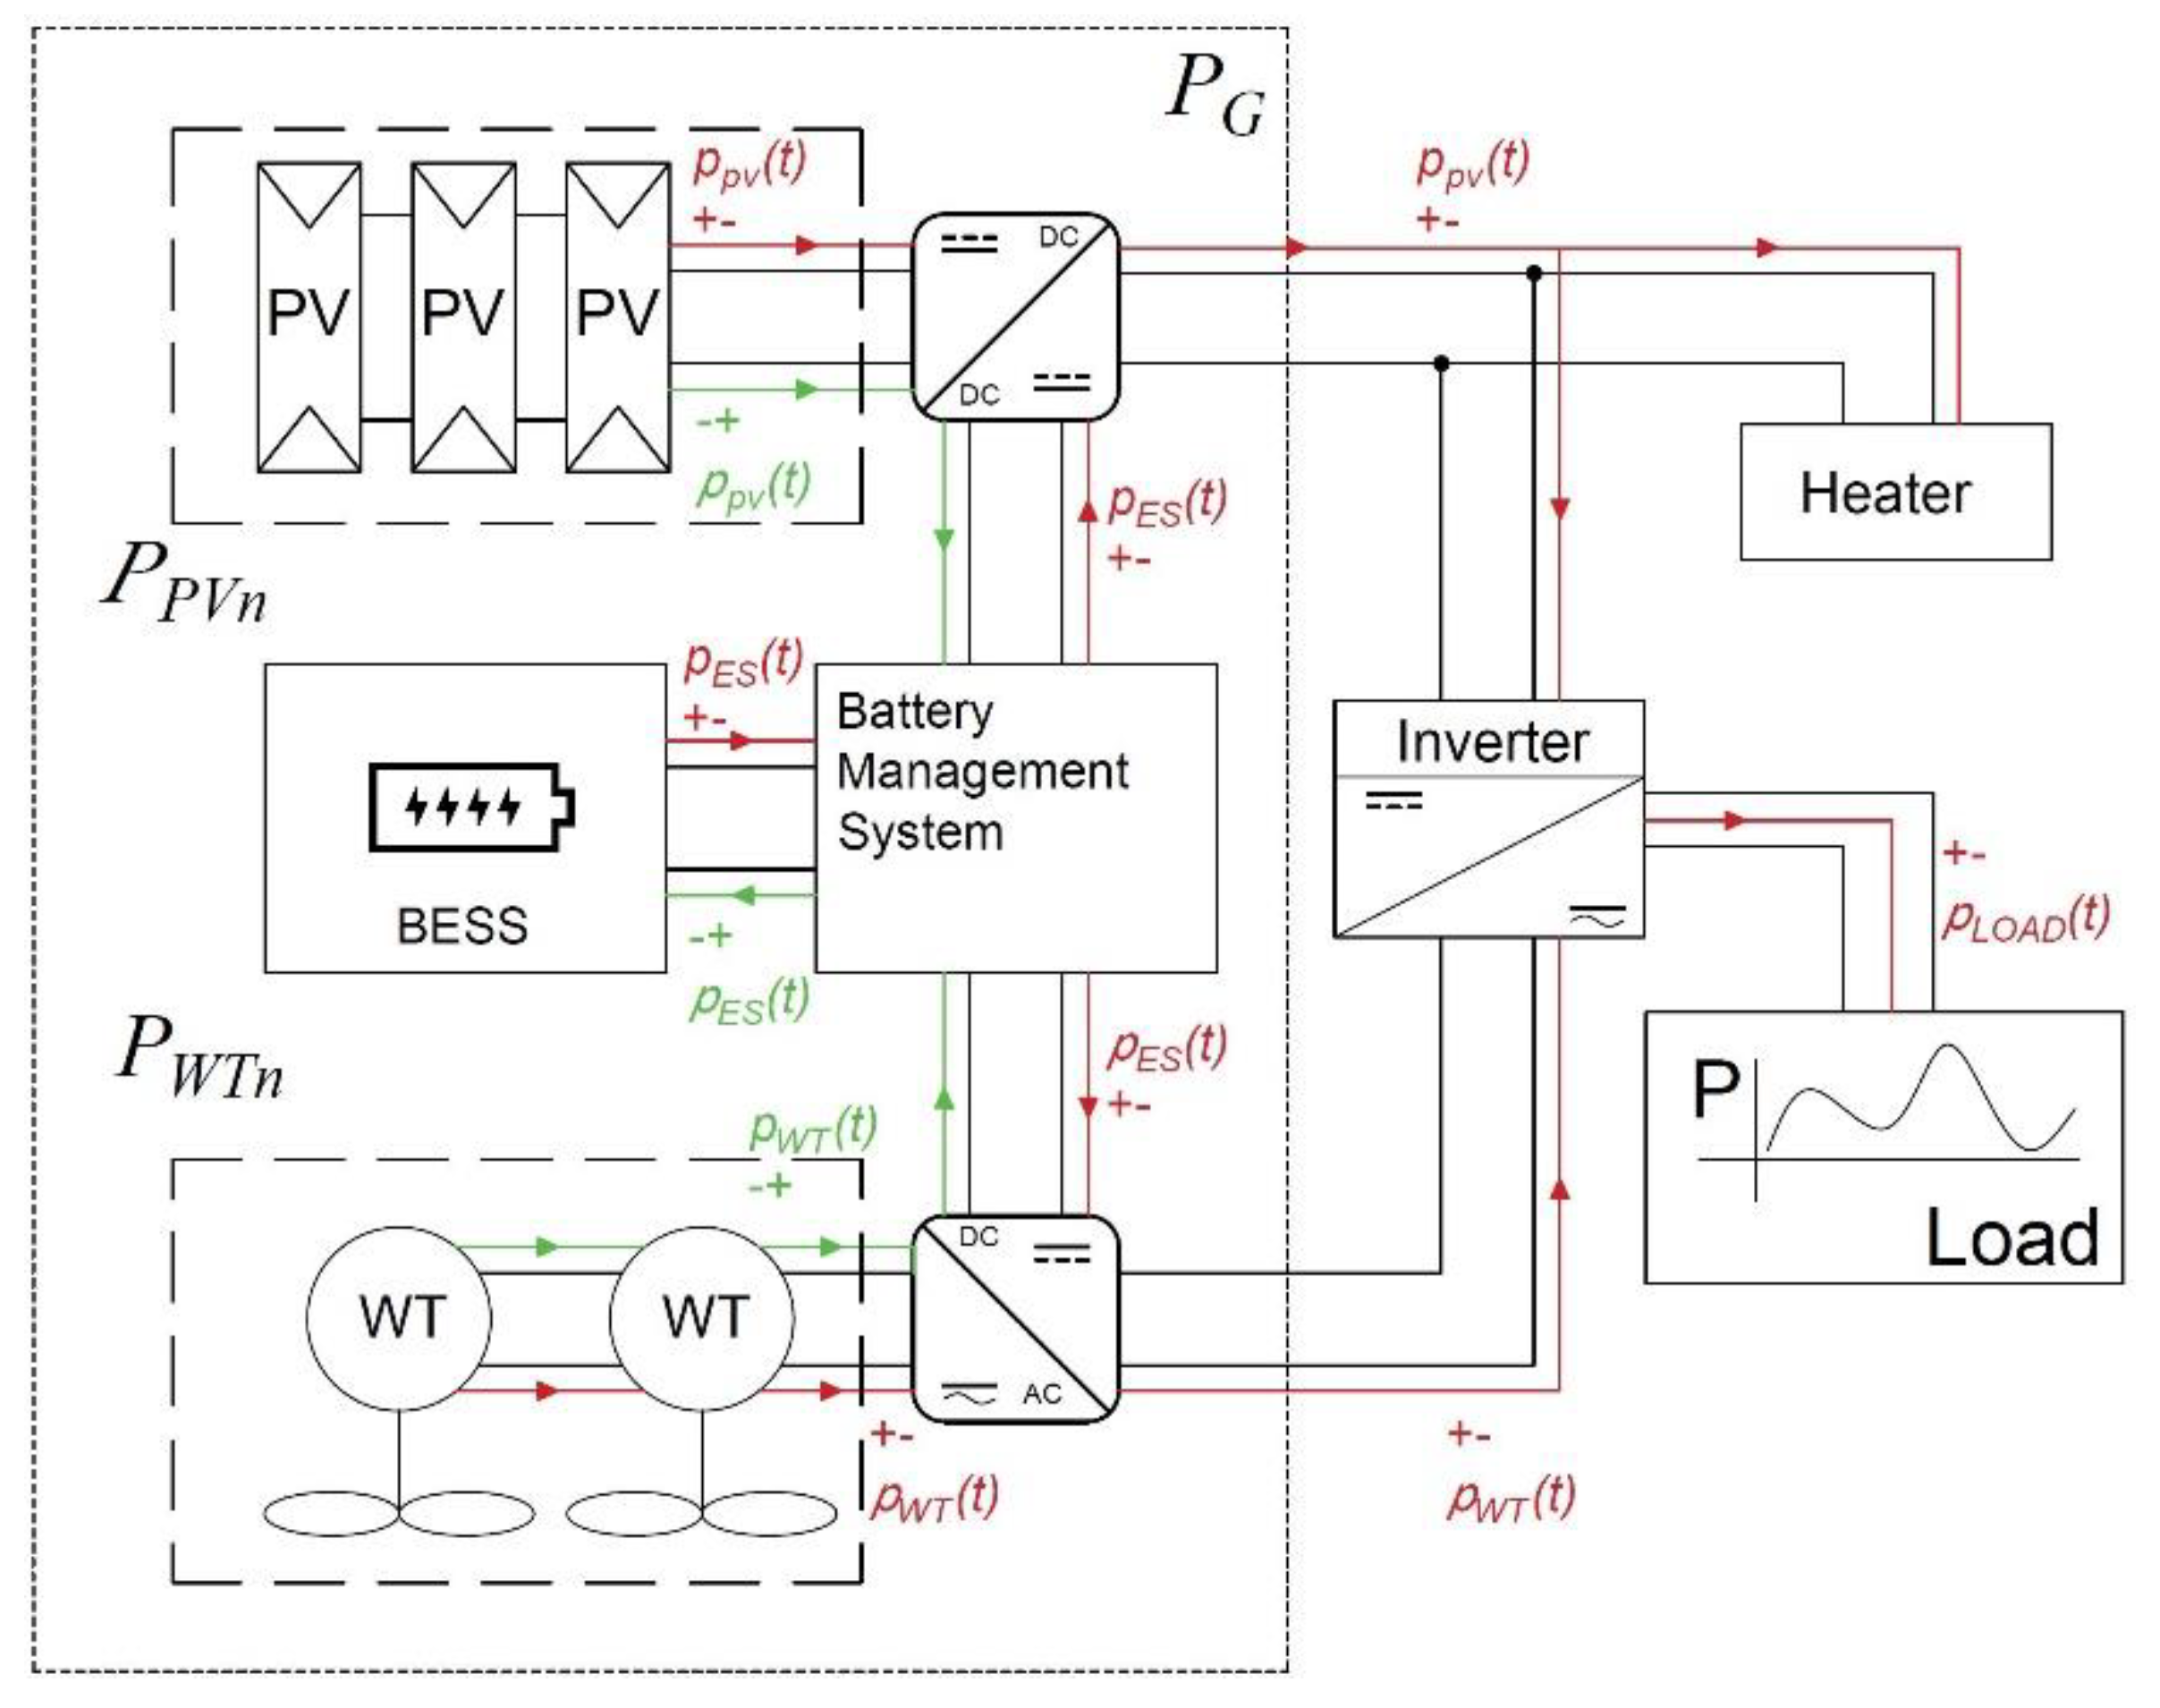
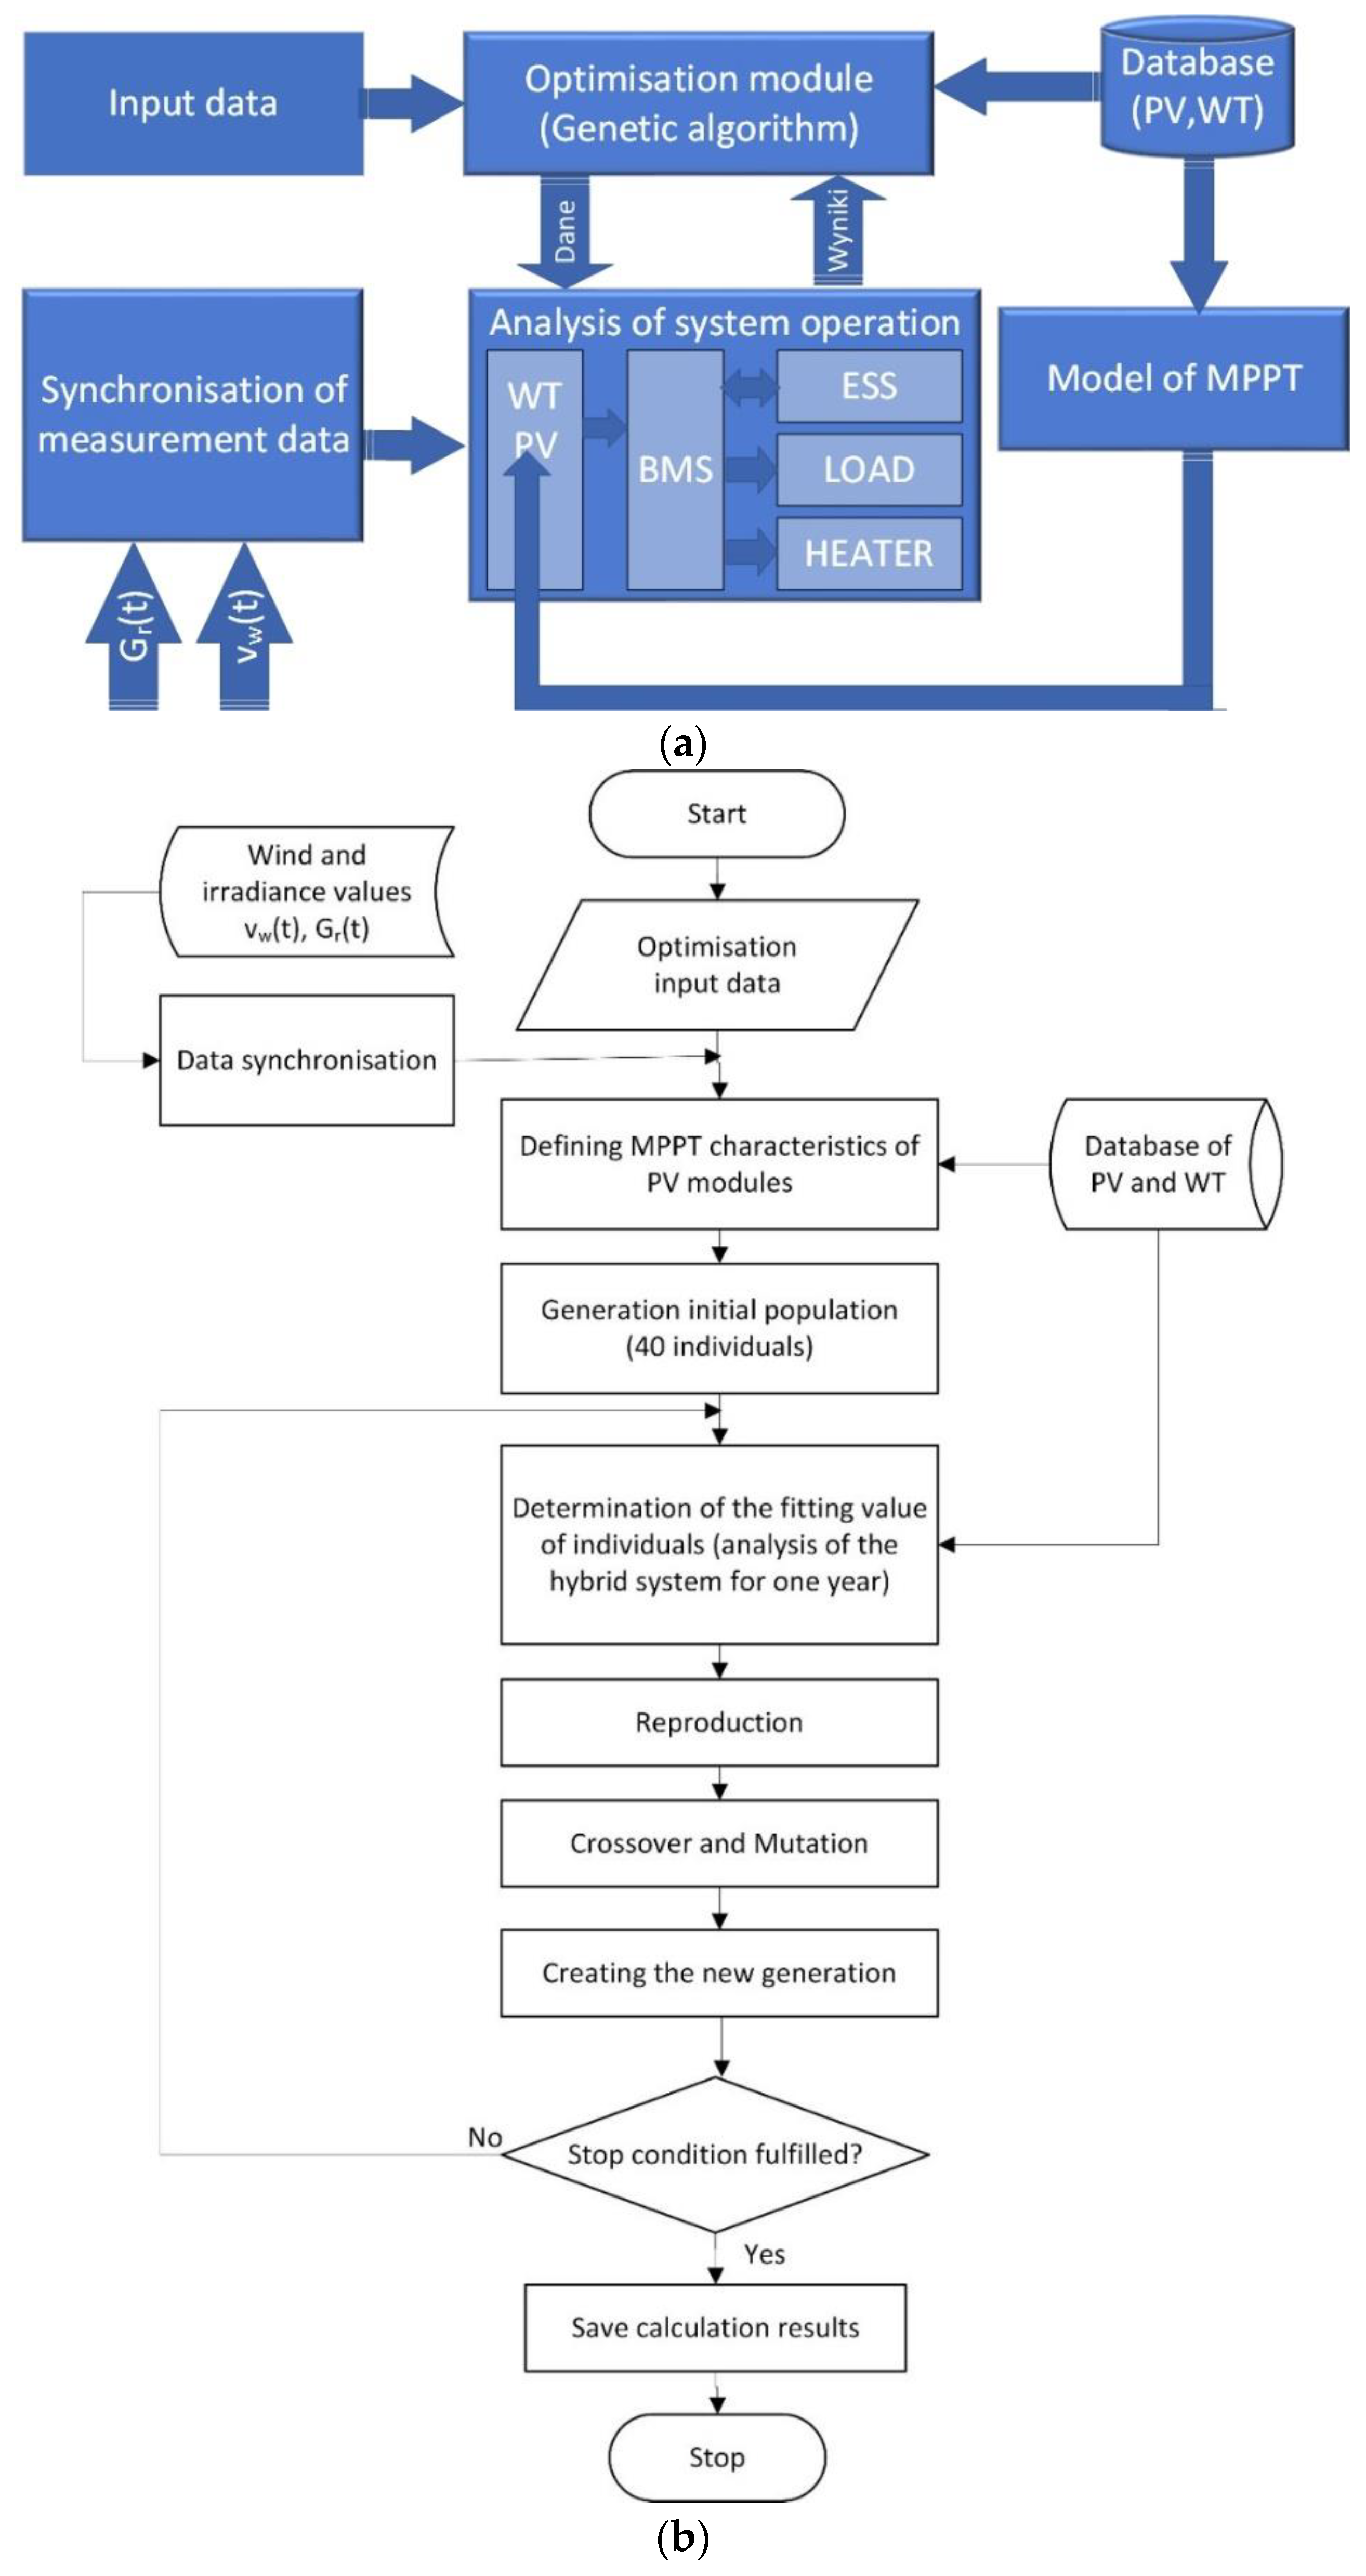
Figure 3 shows a general structure of the analyzed hybrid system with electrochemical storage. With regard to significant differences in the technical and operating parameters as well as costs of investment, an assumption was made to test the system for two configurations: with a lead–acid battery and with a lithium-ion battery. Electrical energy is generated in the solar (PV) and wind (WT) part of the system. The operation of the Battery Energy Storage System (BESS) is controlled by an adequate Battery Management System (BMS). Correct operation is additionally ensured by the heaters which receive excess energy, and by inverter systems.
An analysis of the system operation shown in Figure 3 is necessary in order to optimize its structure. It includes identification of the load profiles of wind turbines pWT(t) and photovoltaics pPV(t), energy storage pES(t) power (loading—“−”; or releasing—“+”), state of charge of the battery pack SOC(t), power transferred to the load from the generating system pG(t) and energy storage pES(t) as well as the load power pLOAD(t) based on the load characteristics of the analyzed load type. The following designation is used: PWTn for the wind turbines rated power and PPVn for the photovoltaics. Additionally, with regard to the power supply system character (off-grid), it is important to identify the profile of excess power pLESS(t) which is the excess power generated and taken to the storage versus the momentary load pWT(t) + pPV(t) + pES(t) > pLOAD(t). In the periods in which the power delivered to the load is lower than the load power demand pWT(t) + pPV(t) + pES(t) < pLOAD(t), pLESS(t) power is transferred to the heaters and is regarded as a loss in the context of a power generation system. Incorrect supply is the result of insufficient power delivered to the load (pWT(t) + pPV(t) + pES(t) < pLOAD(t)), which is taken into account in the reliability parameter of electrical energy delivery to the load—total time of the guaranteed load supply shortage in a year Tsum (h).

3. System Model

The determination of the abovementioned profiles requires assuming a mathematical model of a system, its numerical and IT implementation, and the use of input data in a form of wind speed vw and irradiance Gr profiles for a year’s period (representation of the geographical conditions in the location of the analyzed object). The Battery Management System (BMS) algorithm also has significant effects on the system operation.
Due to the computational complexity of the optimization task of a hybrid system with energy storage and the optimization algorithm adapted to the task, a simplified power supply system model was assumed in the paper. That enables to reduce the time of identifying the power profile, the electrochemical energy storage state of charge and other parameters characterized in Section 2 of the paper. The following four elements were taken into account in the proposed model: wind turbines, PV modules, electrochemical cells, inverter, BMS.

3.1. Model of Wind Turbine

A wind turbine model limited to one functional model representing the interpolation of its power characteristics PWT = f (vw(t)). To that end the characteristics are divided into three sections related to the wind speeds characteristic of the wind turbine: vcut-in—cut-in speed, vn—the rate of reaching the rated power and vcut-out—cut-out speed. For the power increase section in the function of wind speed vw a linear interpolation between two adjacent modes of discrete power characteristics is used. The power generated by the turbine for the wind speed vw can be identified based on the relationship [38]:
P W T =   P v 1 + P v 2 P v 1 v 2 v 1 v w v 1   for   v c u t - n i     v w   <   v w n   P W T n   for   v w n     v w   <   v c u t - o u t 0   for   other   v w  
where: v1, v2—wind speed from the wind turbine power discrete characteristics, where the wind speed (vw ∈ <v1;v2>) falls in between, Pv1 and Pv2—wind turbine power values corresponding to wind speed v1 and v2 read from the wind turbine power discrete characteristics, vwn—wind speed which enables reaching the wind turbine rated power PWTn.
Figure 4 presents a graphical interpretation of the parameters used in Relation (1) and determining method for PWT wind turbine power output for vw value.

3.2. Model of PV Module

A double-diode model (DDM) of a PV cell described with the relationship [39]:
  I   = I p h I S 1 e q U + R s I N 1 k B T 1 I S 2 e q U + R s I N 2 k B T 1 ( U + R s I ) R p ,
I p h   =   I p h 0 G r G r 0 α ( T T S T C ) ,
where: I, U—current and voltage on the PV cell terminals; Iph0—solar current generated at the actual irradiance Gr and at the PV module surface temperature T; Iph0—solar current generated at irradiance Gr0; Gr—actual irradiance on the PV cell surface, Is1; Is2—saturation currents of the first and second diode, N1; N2—coefficients of quality of the first and second diode; Rs—series resistance; Rp—parallel resistance; k—Boltzmann constant; T—PV cell temperature; q—electron elementary charge.
Based on paper [40] temperature T of the PV module temperature was determined taking into account ambient temperature Ta (obtained from the public data of the Institute of Meteorology of Water Management) and the measurements of wind speed vw synchronized with the measured values of irradiance Gr according to the relationship:
T = T a + ω 0.32 8.91   +   2 v w G r ,
where: ω—coefficient of the PV system mounting method (ω = 1—standalone system, (ω = 1.2—on a flat roof, ω = 1.8—on a sloped roof).
The PV module is modelled by solving a system of Equations (2) and (3) with Newton’s method, adopting the parameters from the available database and taking into consideration the PV module surface temperature—Relationship (4). The calculations are carried out prior to initiating the optimization temperature, and their result includes the group of current and voltage characteristics for the PV module surface temperature in the range between −30 °C to 70 °C (with a 2 °C step), and irradiance between 50 W/m2 and 1500 W/m2 (with a step of 50 W/m2). On that basis, Pmax = f(T, Gr) surface is calculated, which helps to identify—by means of approximation—the Maximum Power Point (MPP) for specific environmental conditions and also constitutes an MPP tracker system model.

3.3. Model of an Electrochemical Cell

A peripheral model of electrochemical cells used in the paper, which reflects the chemical phenomena occurring in the cell, is shown in Figure 5.
The model can be described by the system of differential Equation (5), which are based on the basic rules of the electric circuit theory; the equations were solved with Runge–Kutta 4th order method:
e m S O C , T + u 1 t + i t R 0 S O C , T p E S t i t = 0 i t = i R 1 t + i C t i C t = C 1 ( S O C , T ) d u 1 ( t ) d t i R 1 t = u 1 ( t ) R 1 ( S O C , T )
The equivalent circuit components shown in Figure 5 are non-linear and depend on the consumed current intensity, state of charge and temperature. The battery capacity C(I,T) and the components of the equivalent circuit (Em, R0, R1, R2, C1) for lead-acid cells were described with the following relationships [33]:
C I , T = K C C 0 1 + T e T f ε 1 + ( K c 1 ) I I n δ
E m = E m 0 K E 273.15 + T e 1 S O C ,
R 0 = R 00 1 A 0 1 S O C + R 20 exp [ 1 S O C ] 1 + exp A 22 I m I n ,
R 1   =   R 10 ln ( D O C ) ,
C 1   =   τ 1 R 1 ,
where: R00, R10, R20, A0, A21, A22, KE—constants which depend on the construction and state of the battery, determined on the basis of the estimation; τ1—time constant of the RC branch; Im—the current of the battery’s main branch; Em0—open-circuit battery voltage at 0°C, and the battery state of charge (SOC) and depth of charge (DOC) during discharging or charging are described by Equations (11) and (12) [33]:
S O C = 1 0 t i m t d t C 0 , T ,
D O C = 1 0 t i m t d t C I a v g , T ,
where: im—current flowing through the main branch; C(0,T)—no-load battery capacity at temperature T; C(Iavg,T)—battery capacity referred to the average discharge or charge current Iavg at set temperature T.
The same equivalent diagram was used for the lithium-ion cell; the values of the elements are usually presented in tables, similarly to the characteristics below (developed and described by the authors in paper) [41]—Figure 6.
The conditions of electrochemical storage operation, i.e., temperature, discharge depth, and the charge and discharge current (power) values greatly affect the actual lifespan of the storage [42]. That is why the following aspect was taken into consideration in the applied model. It was assumed that the storage would be placed in a room with controlled and constant temperature, and the mean charge and discharge current (power) is the factor which affects the storage lifespan most. Such a simplified approach is however necessary due to the analysis period. Taking the above into account, the lead–acid battery lifespan was determined based on the empirical relationship which identifies the equivalent number of cycles (EFC), after which the battery should be changed
E F C = 750 0.36 exp 3.9 P A E S n ,
where: 750—number of battery cycles under the rated charge and discharge conditions, P—mean load power; AESn—rated power capacity of the battery.
The battery lifespan in lithium-ion batteries was determined based on the empirical relationship:
E F C = 3000 65 exp 1.372 P A E S n ,
where: 3000—number of battery cycles under the rated charge and discharge conditions.
The number of battery operation cycles was determined on the basis of the analysis of the charge throughput [43]. This is a popular method used when analyzing the wear process of electrochemical energy storage facilities. It is often used also during the analysis of operation of hybrid energy systems cooperating with energy storages, with the difference that usually a long averaging time results in ignoring short-term current (or power) peaks. Meanwhile, the use of a 37 s averaging period in this work contributes to increase the accuracy of the analysis, which distinguishes the work in comparison with other studies of similar nature.

3.4. Model of Inverter

In the issues analyzed in the article, a simplified model of the inverter was used, taking into account only the change of its capacity change ηINV in the function of relative output power ηINV = f (PINV/PnINV), where PINV—momentary power of the inverter; PnINV—rated power of the inverter [44]. An exponential function was used for this purpose:
η = 1 a e b P O U T P n ,
with values of coefficients a and b determined in MATLAB environment using non-linear regression function. Figure 7 shows a changes in inverter efficiency (ηINV = f (PINV/PnINV)) used in the analyses in the article for parameters: a = 98.3 and b = 0.03 corresponding to the average characteristics of many different types of inverters.

3.5. Model of BMS

Battery Management System (BMS) algorithm—depending on the battery type (lead–acid or lithium-ion)—an algorithm was used which maintains the battery state of charge (SOC) in the ranges between the minimum value (SOCmin) and the maximum value (SOCmax), respectively: SOCPb ∈ <0.4;1>, SOCLi ∈ <0.2;0.9>. The working scopes of the cells result from effective use of the available storage capacity and its long lifespan. Many studies were conducted in the reference period [45,46], which confirmed the discharge depth influence on the electrochemical cell degradation. The Battery Management System algorithm additionally assumes that the current value of 0.5 C will not be exceeded for a long time in lead-acid batteries, while for a lithium-ion battery this value will amount to 2 C. Moreover, during modelling it was assumed that all the cells are identical and the system does not require balancing the voltage on the cells (the voltage on the cells is equal). It was also assumed that for the given current limitations, the temperature of the cells will not exceed the limit conditions (there is no need to limit the power of the cells for thermal reasons).

4. SOC and Power Analysis Algorithms for the Applied Measurement Data

4.1. Measurement Data

The wind speed vw and irradiance Gr measurement data used in the calculations have a form of discrete data sets, where every sample is an averaged value from the period Δt = 37 s. The N number of samples for one-year amounts to over 852,000. An important advantage of the measurements is that the averaging period used in the paper is short as compared to the periods used normally in renewable power engineering, ranging from a few to 10 min. Figure 8a,b show the profiles of wind speed and irradiance changes for the analyzed geographical location (south–eastern Poland) and the year 2014. The data were made available by the courtesy of prof. Krzysztof Markowicz from the Institute of Geophysics, University of Warsaw.

4.2. Computation Algorithm

According to the description above, the i-th sample stands for the wind speed and irradiance at t = i Δt for i = 0, 1, 2, … N−1. The calculations of power in the system shown in Figure 3, state of charge of the storage and the energy in the storage are made in sequence for subsequent samples of wind speed v w ( i ) and irradiance G r ( i ) as well as P L O A D i .
The power generated in the system for the i-th sample P G i is the sum of the wind turbine part P W T i and photovoltaic part P P V i generation for the i-th sample:
P G i ( v w i ,   G r ( i ) )   =   P W T i ( v w ( i ) ) + P P V i ( G r ( i ) ) ,
whereby for NWT wind turbines and NPV photovoltaic modules installed in the hybrid system:
P W T i v w i   = j = 1 N W T P W T ( j ) ( i ) v w i
P P V i G r i = k = 1 N P V P P V ( k ) ( i ) G r i ,
where: j and k—indices of the wind turbine and PV module number, respectively—while power P W T i and P P V i is determined based on Relationships (1)–(3), respectively.
The difference between the required demand ( P L O A D i ) and the generated power ( P G i ) marked as Δ P ( i )   for the i-th sample:
Δ P ( i )   =   P G i P L O A D ( i )
can have a negative, a positive or zero value.
The storage charging and discharging process is analyzed, which is always stopped when the battery reaches the state of charge of SOCmax and SOCmin respectively. The excess power which cannot be delivered to the storage is fed to the heaters and treated as power losses PLOSSES. PLOSS power can be used to generate process heat—an industrial load, heating for buildings—communal load, or transferred to thermoelectric energy storage.
For Δ P ( i ) > 0 (excess power) two states of the system are analyzed:
(a)
SOC(i) < SOCmax, then:
P E S ( i )   =   min { P E S m a x , Δ P i }
P L O S S ( i )   =   Δ P i   P E S ( i )
A E S ( i )   =   A E S ( i 1 )   +   η E S P E S ( i ) Δ t ,
where: PESmax—maximum power of energy storage; P L O S S i —power fed to the heaters for the i-th sample, AES(i); AES(i−1)—energy stored in the storage for sample i and i−1, respectively; ηES—energy storage charging and discharging capacity.
(b)
SOC(i)SOCmax, then:
P E S ( i ) = 0
P L O S S   ( i ) = Δ P i
A E S ( i ) = A E S ( i 1 )     Δ t P ESLOSS ,
where: PESLOSS—the power of energy storage idle losses (kW/h), corresponding to self-discharge.
For Δ P ( i ) < 0 (power shortage) two states of the system are analyzed:
(c)
SOC(i) > SOCmin and then:
P E S   ( i ) =   max { P E S m a x , Δ P i }
P L O S S   ( i ) =   0
A E S ( i )   =   A E S ( i 1 )   +   P E S η E S Δ t .
(d)
SOC(i)SOCmin and then:
P E S ( i )   = 0
P L O S S ( i ) = 0
A E S   ( i ) = A E S ( i 1 )     Δ t P E S L O S S .

5. Optimisation of the Structure of PV-Wind Hybrid Power Supply System with Energy Storage, Implementation of the IT Environment

5.1. Goal, Objective, and Constraints of the Optimisation

The optimizing purpose of the analyzed off-grid PV-wind power supply system with electrochemical energy storage, intended for supplying loads with known 24 h load characteristics (Figure 1 and Figure 2) is to determine its structure (the power of the wind turbine part PWTn and photovoltaic part PPVn, types of turbines and PV modules, energy capacity AME of battery packs and the maximum charge and discharge power PEsmax of the storage) which will guarantee a reduction in the generated electrical energy unit cost to the minimum [39,47,48,49], simultaneously maintaining the assumed reliability level of the load supply. The power supply reliability level is meant as the maximum time TsumLIMIT, in a one-year period, of delivering power to the load below the load value PG + PES < PLOAD.
A criteria function in a form of the unit cost of energy generation in a power generation plant, identified with a linearized cost method (LCOE), was used to evaluate the solution quality in the optimization process. LCOE is a widely used indicator used to compare unit costs of electricity generation by renewable sources. LCOE is applicable in many currently popular power sources such as: PV [50,51], wind farms [52,53], hybrid and other renewable energy technologies [34,49,50]. In the LCOE method the following investment and operating costs over time are taken into consideration according to the relationship [52]:
L C O E   =   y = 0 N I ( y ) + M ( y ) 1 + r y y = 0 N A ( y ) 1 + r y ,
where: LCOE—averaged unit cost of energy generation in a life cycle (€/kWh); y—index of the year; I(y)—investment expenditure in year y (€); M(y)—operating and financial expenditure in year y (€); A(y)—energy generation in year y (kWh); r—discount rate (%).
In the case of the system analyzed in the paper, taking into consideration the energy fed to the heaters, and dividing Relationship (32) into the parts related to the investment and operating costs [36,46], the objective function for the analyzed optimization task takes the final form:
L C O E = y = 0 N I 1 I P V P P V n + I W T P W T n + I E S A E S n 1 + r y y = 0 N I 1 ( A G y A H y + A H U ( y ) ) 1 + r y + y = N I N M M P V ( y ) P P V n + M W T ( y ) P W T n + M E S ( y ) A E S n 1 + r y y = N I N M ( A G ( y ) A H ( y ) + A H U ( y ) ) 1 + r y
where: NI—number of investment implementation years (in the analyzed case the investment is completed in year “zero”); NM—number of the years of the system operation (system lifespan); IPV, ITW—unit investment expenditure for the PV and wind part, respectively; IES—unit investment expenditure for the energy storage, MPV(y); MWT(y)—unit operating costs for the PV and wind part, respectively, in the year y (€/kW); MWT(y)—unit operating cost of the energy storage in the year y (€/kWh); AG(y)—quantity of energy generated in the hybrid system in the year y; AH(y)—the quantity of energy converted into heat in the year y; AHU(y)—the quantity of energy used in the year y in heat-related processes.
The investment and operating costs of the system are determined based on units costs of the PV and wind part and the energy storages [39], and their value is directly affected by the hybrid system parameters.
With regard to the system operation in the off-grid mode, only the energy generated in the system and used for supplying the load (including supply through the electrochemical storage) is used to determine the value of the LCOE index. Hence the energy generated in AG system is in Formula (32) reduced by the energy fed to heating components AH. Furthermore, the energy which was converted to heat and used for heating or in processes was taken into consideration in the objective function (33).
According to the above, a solution to a non-linear minimization task with the following general form is to be found:
min x   L C O E ( x ) ,
with a set of inequality constraints expressed as:
g(x) ≤ 0,
where: x—vector of decisive variables with the following components; x1—type of wind turbine (TWT); x2—number of wind turbines (NWT); x3—type of PV modules (TPV); x4—number of PV modules (NPV); x5—energy storage capacity AESn; x6—storage maximum charge and discharge power PESmax; g—vector of inequality constraints of a structural and functional character.
The first four decisive variables affect the installed power of the system, generation curve and the quantity of electrical energy generated in a year. The fifth one affects the system ability to compensate for shortages of energy from the wind and PV part with the energy from the storage, while the sixth one determines the battery pack charging and discharging rate.
A normalized set of the assumed inequality constraints g(x) ≤ 0 includes, depending on the implemented algorithm version:
(a)
time of delivering the power below the required power to the load:
T s u m T s u m L I M I T   1     0 ,
where: Tsum—total (annual) time of delivering power below the required power to the load; TsumLIMIT—acceptable (limit) annual time of delivering the power below the required power to the load,
(b)
acceptable storage working power related to maintaining its high lifespan:
P E S S m a x P E S S L I M I T   1     0 ,
where: PESSmax—maximum charge and discharge power of the energy storage during the storage operation; PESSLIMIT—acceptable (limit) charge and discharge power for a specific type of electrochemical storage,
(c)
rated power of the system related to the generation of high amounts of energy fed to the heaters:
P W T n + P P V n P L I M I T     1     0 ,
where: PWTn—rated power of the wind part, PPVn—rated power of the PV part; PLIMIT—acceptable (limit) rated power of a PV-wind type power generation system.
Furthermore, a modified version of SSSI (system self-sufficiency index) [54] described with the following relationship was used to compare different variants of the system:
S S S I = 0 T ( ( p W T t + p P V t + p E S t ) · d t ) 0 T p L O A D t d t ,
where: T—analysis period (which is T = 8760 h for the analyzed system).
In the applied version, the SSSI can take the value equal to 1 when balancing the generated and required energy, lower than 1 when the quantity of energy generated in the hybrid system is lower than the quantity of the required energy, and greater than 1 when the quantity of energy generated in the hybrid system is greater than the quantity of the required energy demand (excess energy is fed to the heaters).

5.2. Characteristics of the Optimisation Method Used

A modified genetic algorithm method implemented in the Matlab environment was used for the optimization task described with Relationships (33)–(38). The decisive variables included in the vector are of integer nature, and that is why the double vector method of encoding the variables is used. Moreover, the identification of such variables in the Matlab environment leads to an automatic application of the Laplace crossover method. A tournament selection was used, and reproduction was enriched with elitism, whereby the best individual from the current generation is moved to the next generation. The objective function scaling depending on the individual’s rank was additionally used in the algorithm, where the value of the adaptation function is inversely proportional to the individual’s rank square root. Non-linear constraints described by Relationships (35)–(38) were taken into consideration using the Augmented Lagrangian Genetic Algorithm [55,56,57].
Basic parameters of the algorithm, i.e., population size and the number of iterations (number of generations) were determined experimentally, based on the observation of the best individual’s adaptation function correlation in the function of the iteration number (generation). Furthermore, on-line effectiveness χ (mean value of the adaptation of the best individuals from all previous generations, including the current one, in the function of the iteration number) for the test tasks with a structure complying with the type of the hybrid systems was analyzed in the paper. Figure 9a shows a change in the best individual’s adaptation function value, while Figure 9b shows a diagram of on-line effectiveness in the function of the iteration number (generation) for the test tasks.
Determination of the adaptation function value related to the objective Function (33) requires analyzing a hybrid system’s operation in a year’s period and identification—based on the power profiles—of the storage state of charge and load characteristics, the quantity of energy generated in the system and used to supply the analyzed type of load. The presented analyses are conducted using the algorithm described in Section 4—Relationships from (16) to (31). The time necessary to determine the profiles for one system configuration and one-year period, for the applied measurement data, in several seconds. Taking into consideration the additional components of the genetic algorithm, it generates about 8 h of the optimization time of a hybrid system single structure, when the following computer configuration is used; Core i7-950 processor and 16 GB RAM. The studies are time-consuming, and the determination of the configuration and genetic algorithm parameters used in the studies required conducting of the aforementioned tests.

6. Results of the Optimization Calculation

Optimization of the hybrid power supply structure described in Section 2 (Figure 3) was performed using software implemented in Matlab and Microsoft Visual Studio, with a view to minimizing the unit cost of energy generated in the system and used to supply the assumed load type. Solutions were determined for the applied database of wind turbines and PV modules; the solutions minimize the objective Function (33) and fulfil the assumed constraints—Relationships (35)–(38)—based on the genetic algorithm described in Section 5. The quantity of energy generated in the system was calculated using the system model shown in Section 3 and its operation algorithm given in Section 4. Figure 10 shows diagrams of the developed IT system and the applied optimization using the genetic algorithm method.
The optimizing calculations were performed for:
  • a load with a 50 kW rated power,
  • two load profiles: a small industrial load and a communal load (Figure 1 and Figure 2),
  • two types of electrochemical batteries: lead-acid (deep cycle) and lithium-ion (NMC type),
  • a variant with no power limit in the power generation system and with its power limitation to 200 kW,
  • expected increase in the NMC type battery lifespan from 3000 to 5000 cycles and 20% reduction in their price over a five-year perspective, taking into consideration five limit values of the maximum working time of the load a year with the supplied power below the assumed load curve: TsumLIMIT = 86.7 h; 175.2 h; 262.8 h; 350.4 h and 438 h, which correspond to TsumLIMIT% = 1%, 2%, 3%, 4% and 5% of the number of hours a year (8760 h).
Additionally, for the NMC lithium-ion battery type a unit cost was calculated of generating the energy used for supplying the analyzed load types, when 10%, 20%, 30%, 40% and 50% of the energy emitted on the heaters is used for heating (communal load) or in technological processes (industrial profile).
The following investment and operation unit costs were assumed for the studied battery types: IESPb = IESLi-Ion = 533.3 €/kWh and MES = 22.2 €/kWh. The investment cost in this case also includes control and supervision systems. Additional studies were also performed for the investment cost level of lithium-ion batteries in a five years’ perspective for 80% value of the current prices, i.e., IESLi-Ion = 426.7 €/kWh, with increasing their lifespan from 3000 to 5000 cycles. The operation costs for electrochemical energy storages were assumed as MES = 22.2 €/kW. The mean adopted unit costs of investment and annual operation costs for the PV modules and wind turbines, which also included extra systems for each part, amounted to: IPV = 1359 €/kW, IWT = 1571 €/kW, MPV = 25.3 €/kW and MWT = 11.1 €/kW, respectively. The value of the price function is determined for the system life NM = 25 years and the discount rate r = 5%.
The technical parameters used in battery calculations, including the lifespan models, are given in Section 3 of the paper.
Table 3, Table 4, Table 5, Table 6, Table 7, Table 8, Table 9 and Table 10 list the results of the optimization calculations for the analyzed hybrid system structure, according to the variants presented above. Table 3 and Table 4 show the results of the optimization of the structure of the solar-wind hybrid power supply system for lead-acid and lithium-ion storage systems respectively for the communal and industrial type load with a peak capacity of 50 kW without the limitation of the power rating of the Pn generation system. Table 5 and Table 6 lists the results of a PV-wind type power supply hybrid structure optimization for lead-acid and lithium-ion batteries, determined both for a communal and individual load with a 50 kW peak power, with the rated power of the power generation system Pn limited to 200 kW. Table 7 and Table 8 show the comparison of the PV-wind hybrid power supply system for a lithium-ion battery with the current and future (five year perspective) parameters and prices for a communal and industrial load with a 50 kW peak power and with no limit in the power generation system rated power Pn, respectively. Table 9 and Table 10 contain the specifications of the studies on the change in the unit costs of energy generation in optimized hybrid systems, for an industrial and communal profile, respectively, in the function of the percentage of energy consumption fed to the heaters for processes or facility heating. Below the tables, the changes in the most important parameters are listed (LCOE, the energy capacity of energy storage AES and rated power of the system) in the function of time PsumLIMIT%.
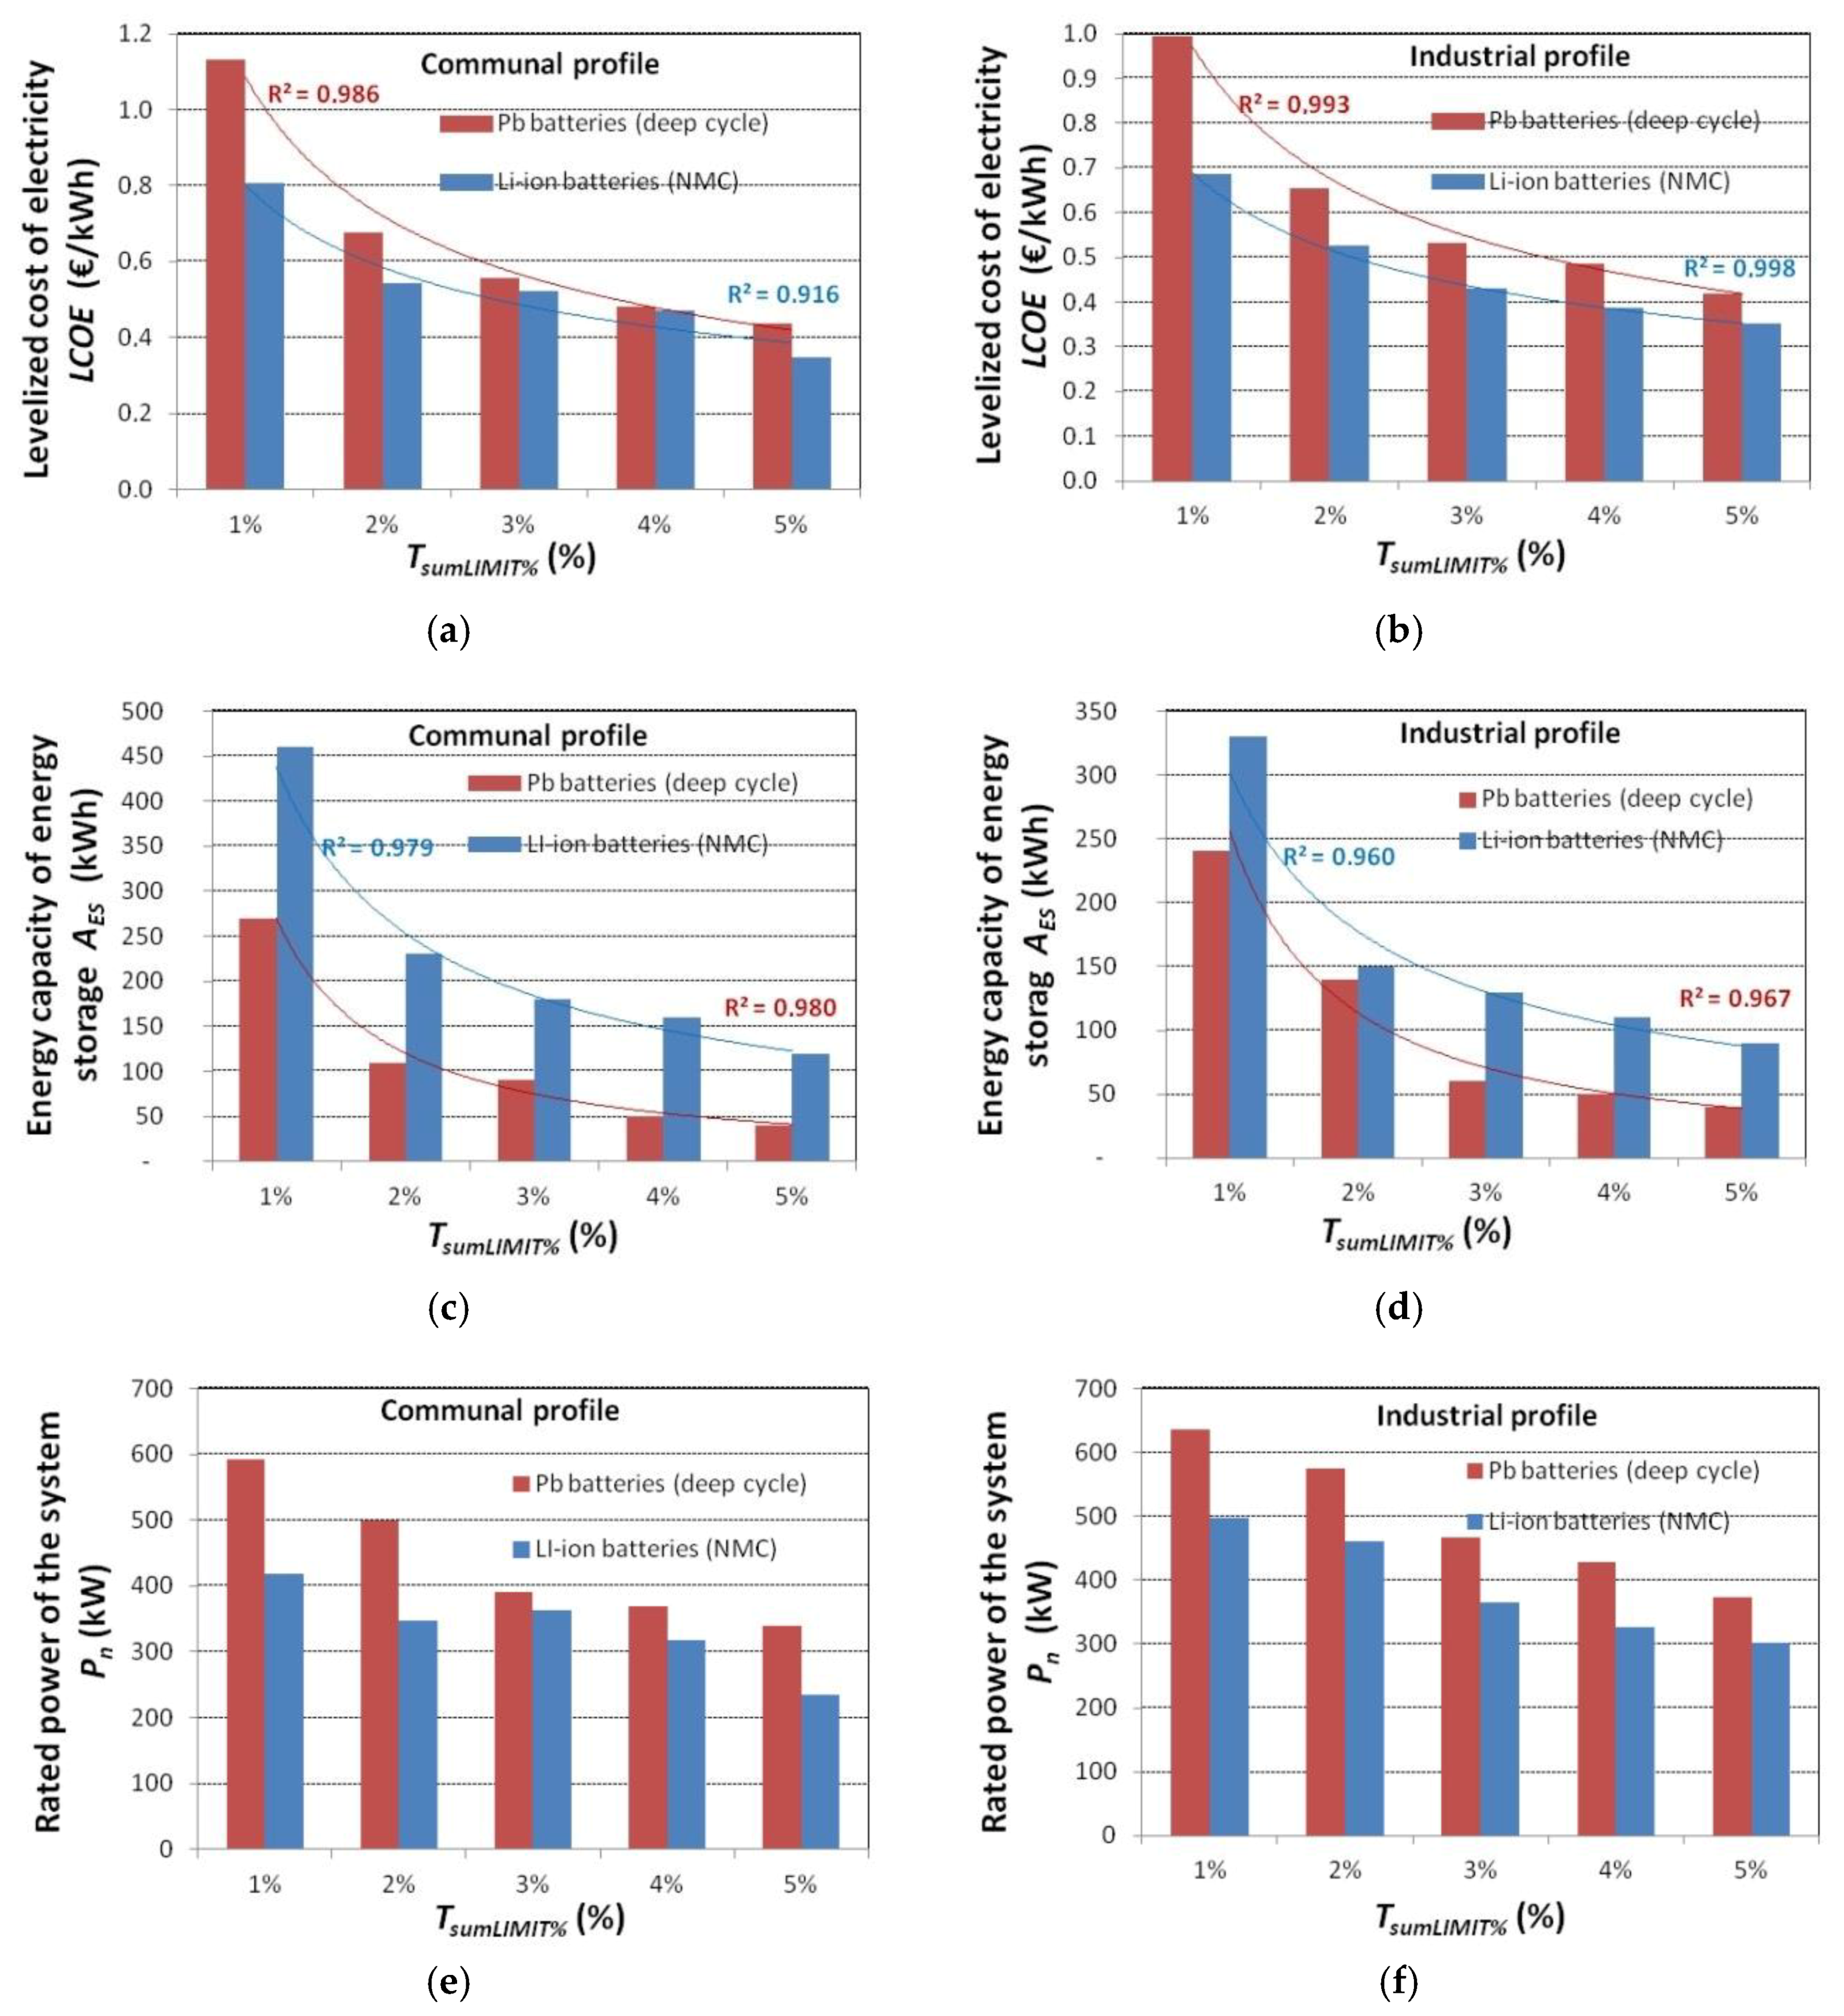
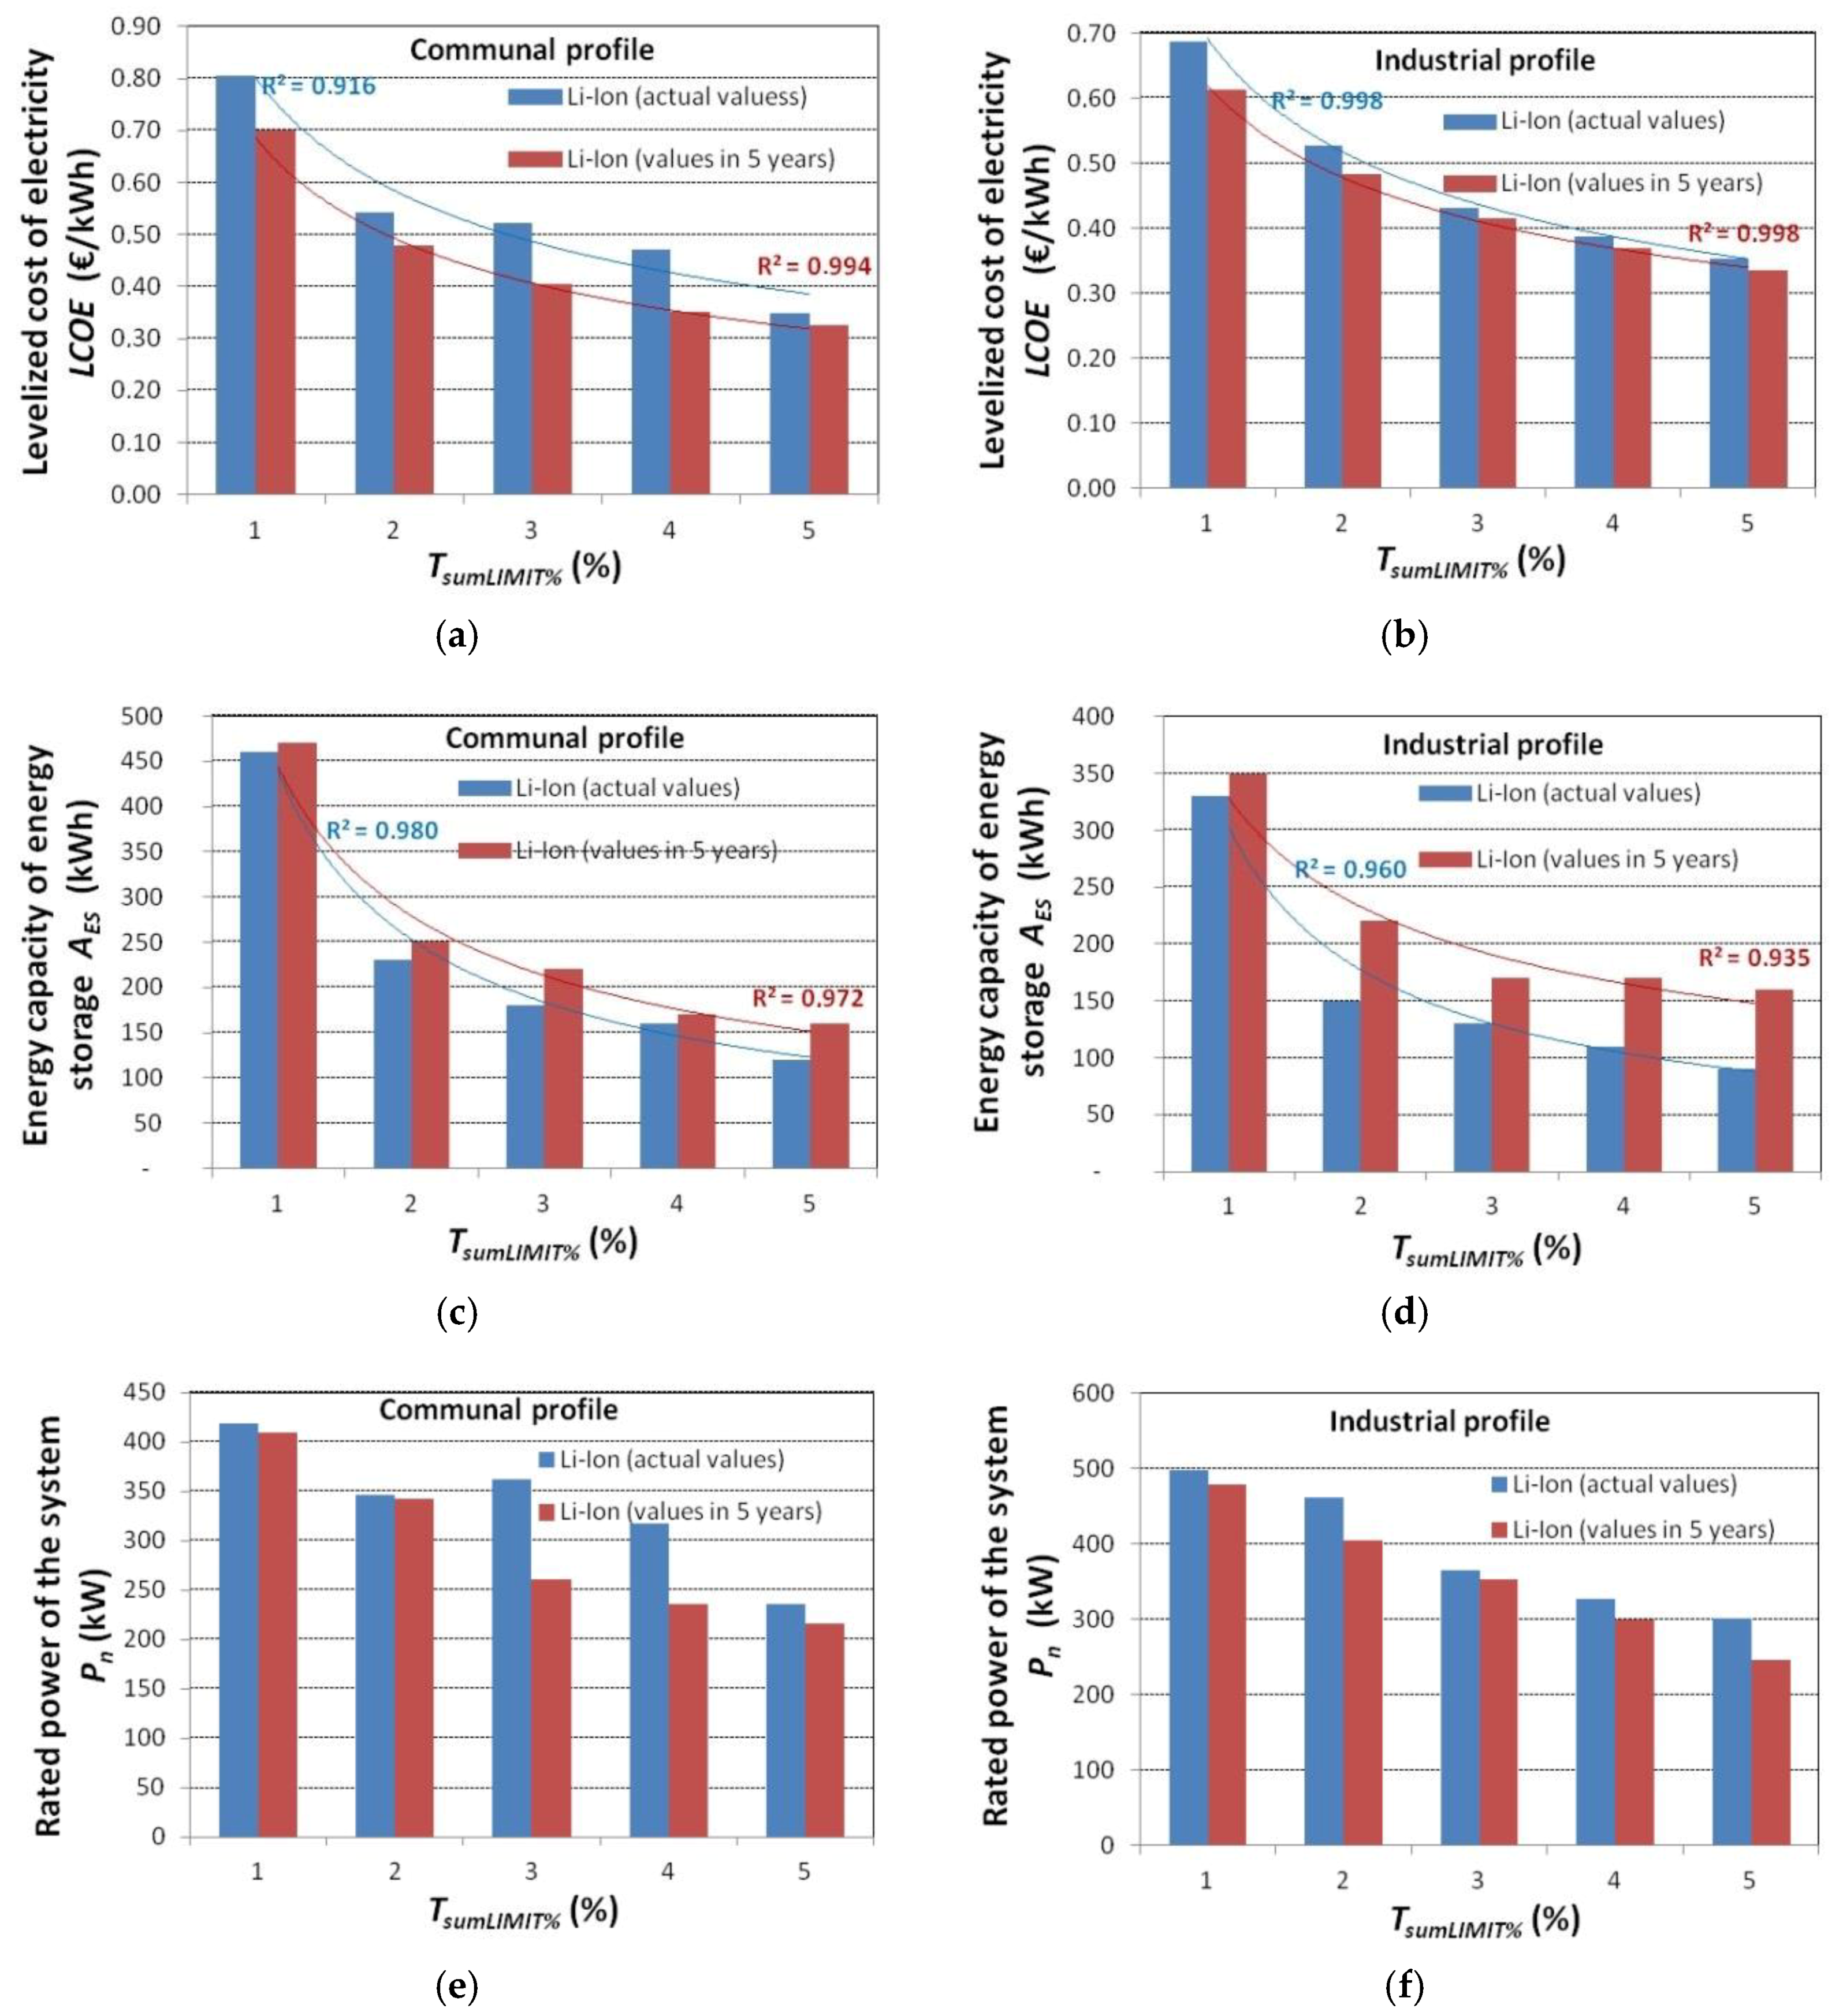
Figure 11 shows the changes in the most important parameters of the optimized PV-wind hybrid systems in the function of time TsumLIMIT% for two types of the analyzed batteries—Pb (deep cycle) and Li-Ion (NMC) and two load cycles. The presented optimization results apply to the 50-kW load peak power with no limit for the power generation system peak power Pn.
The LCOE for an optimized system decreases exponentially in the function of time TsumLIMIT, whereby it applies both to a system using lead-acid and lithium-ion batteries, and both types of loads (Figure 11a,b). The relationship of storage AES capacity changes in the optimized hybrid systems is of a similar nature (Figure 11c,d). For the presented LCOE diagrams and AES capacity, the values of determination factor R2 range between 0.92 and 0.99 and confirm the exponential nature of the changes.
The LCOE and energy storage capacities are lower for the industrial load profile than for the communal profile. It results from the shift in the industrial profile peak demand to the hours around the noon, which helps to better use the power generated in the PV part (direct load supply).
The capacities of lead-acid batteries determined during the optimization have lower values than the capacities of lithium-ion batteries obtained for the identical levels of power supply reliability (time limit TsumLIMIT). Despite of this, the LCOE for lead-acid batteries is higher, which can be attributed to worse operating parameters, in particular to the acceptable discharge depth, and the maximum charge and discharge power as compared to lithium-ion batteries.
The rated power Pn (total installed power of the PV and wind part) of the optimized hybrid systems for lead-acid batteries is higher than for lithium-ion batteries—Figure 11e,f. It results from the fact that lithium-ion cells are more capable of covering the difference between the required and generated power (their current limits are lower).
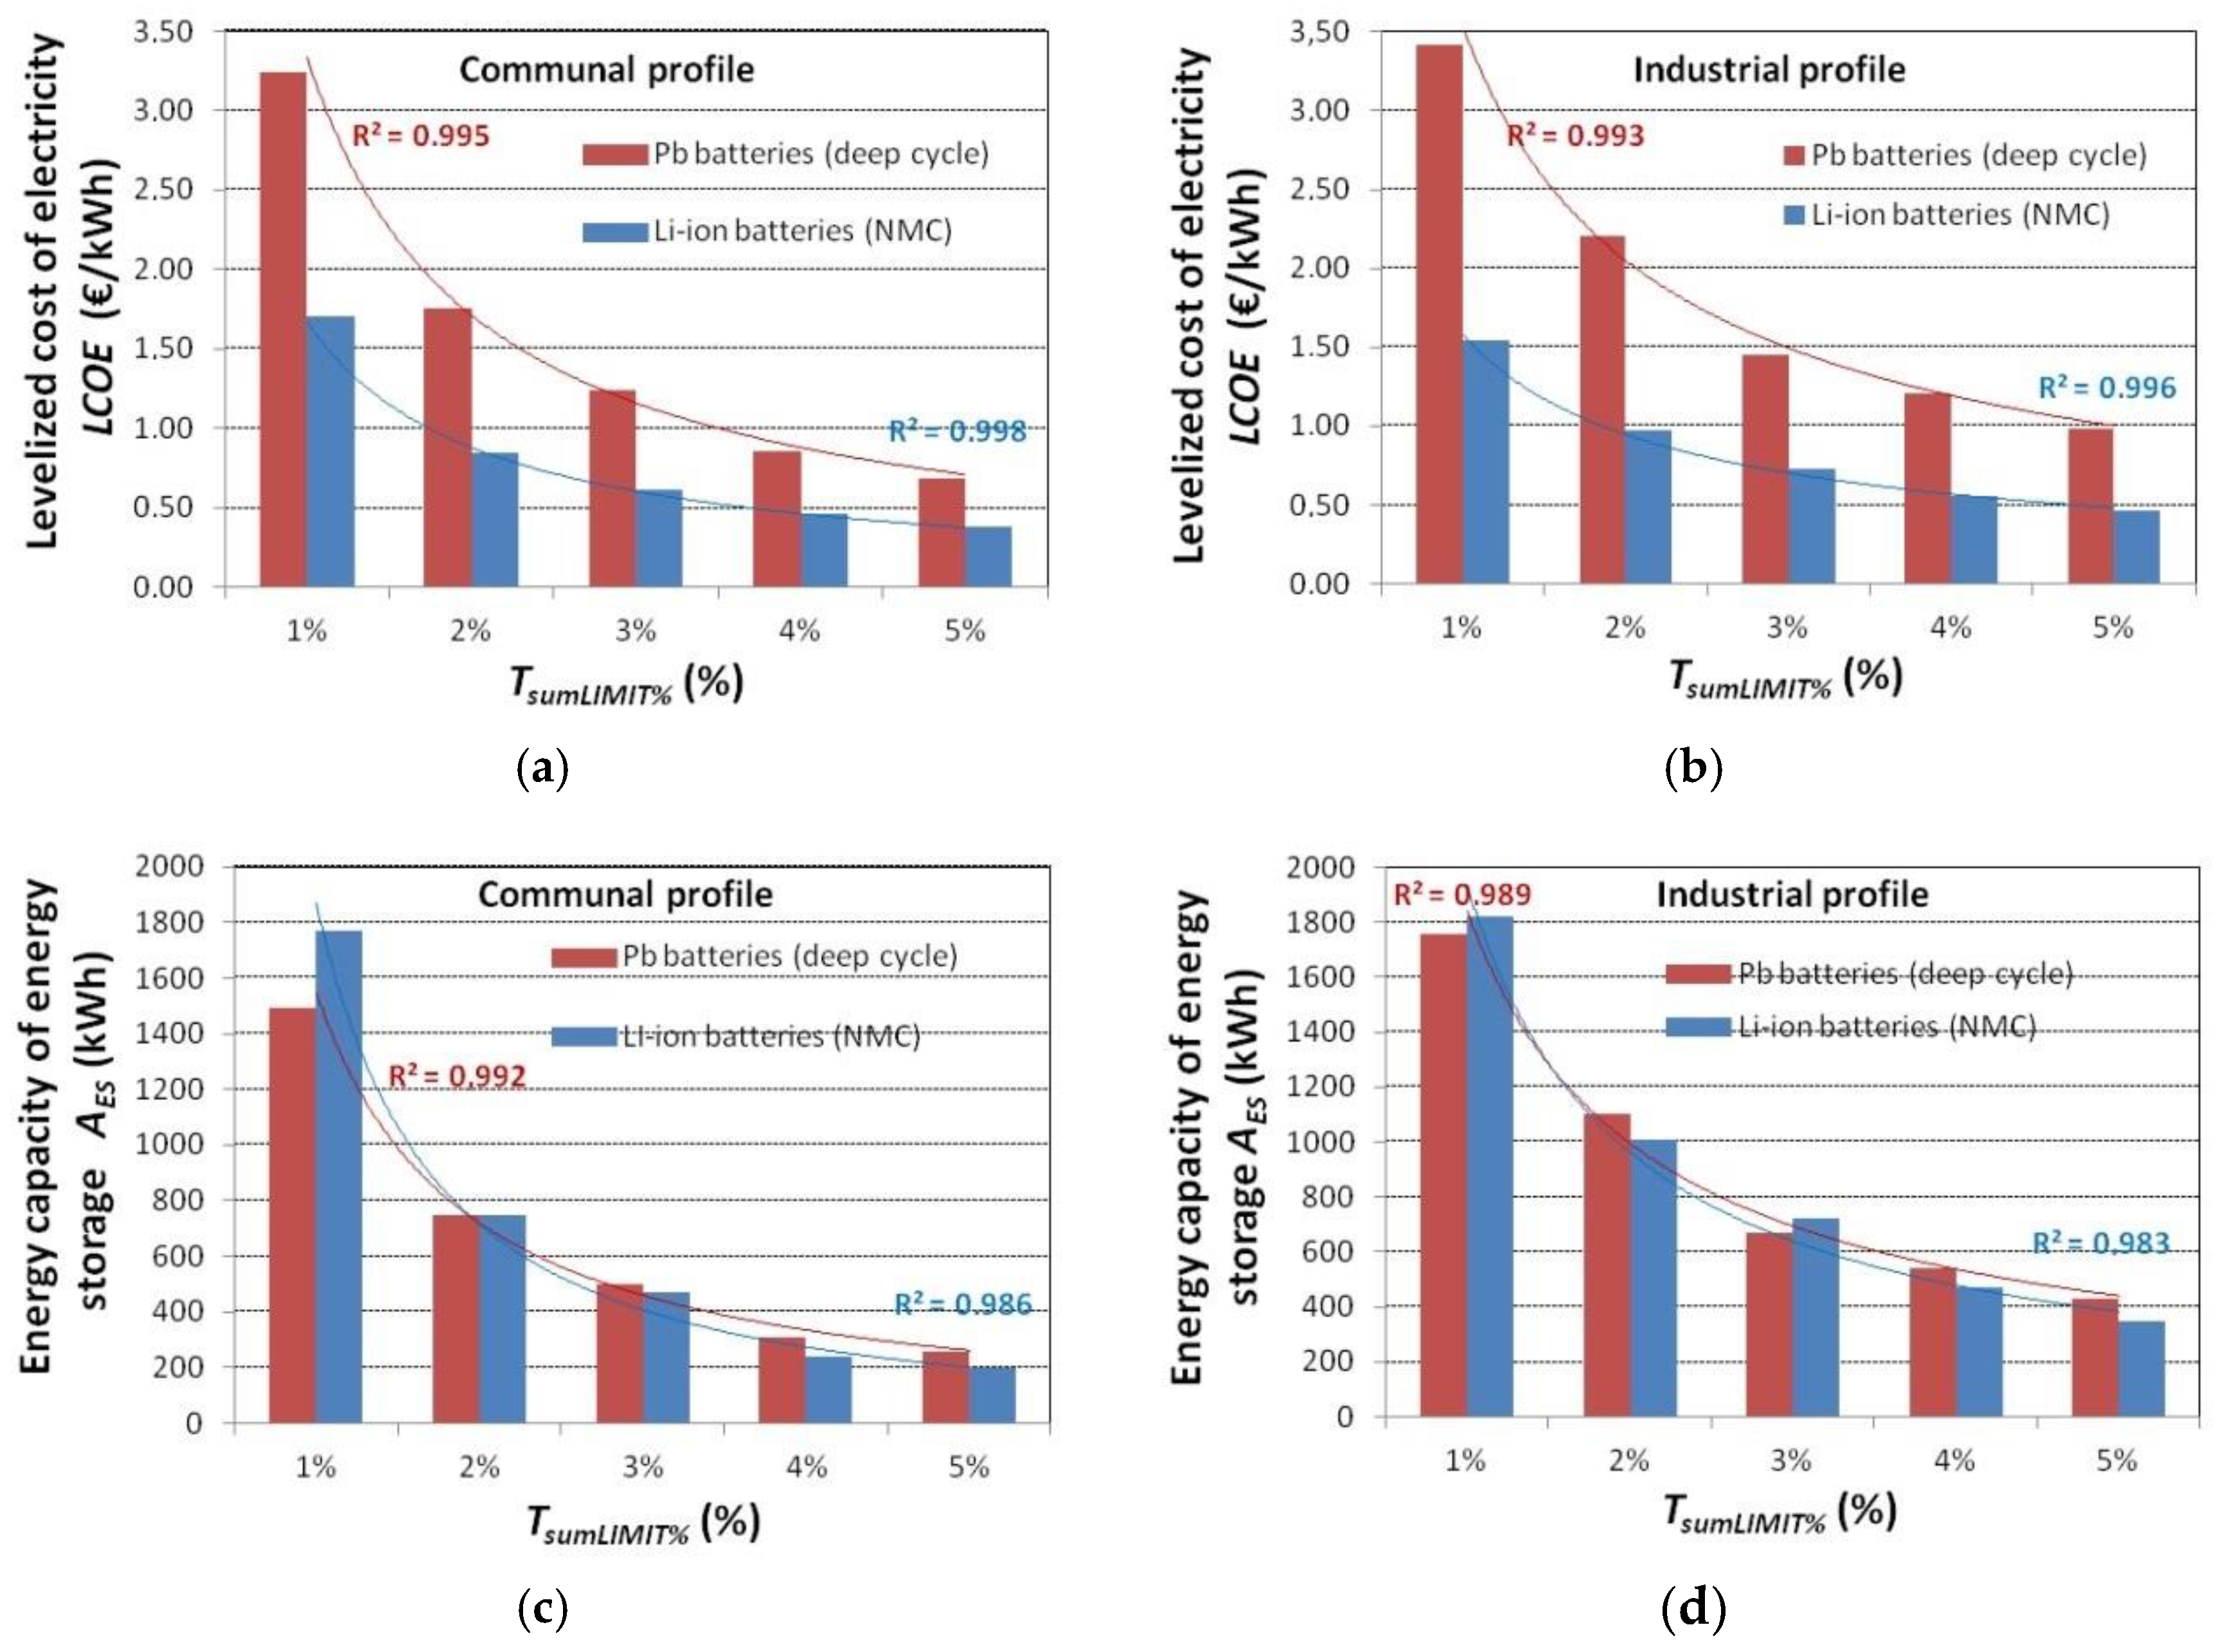
Figure 12 shows the changes in the most important parameters of the optimized PV-wind hybrid systems in the function of time TsumLIMIT% for two types of the analysed batteries—Pb (deep cycle) and Li-ion (NMC) and two load cycles. The presented optimization results apply to the 50-kW load peak power with the power generation system peak power Pn limited to 200 kW. In this case, the changes in the rated power Pn of the power generation system in the function of time TsumLIMIT% are not shown in the diagrams.
The results of a hybrid system optimization with taking into consideration the functional constraints of rated power Pn of 200 kW (quadruple peak power of the load) reveal significant deterioration (increase) in the LCOE indicator and the capacity of the applied electrochemical batteries as compared to the optimization variant with no system power limit (Table 3 and Table 4). The increase is particularly high for lead-acid batteries and on average amounts to 180% (industrial profile) and 120% (communal profile) for the LCOE, while for lithium-ion batteries it is 80% and 40%, respectively. A similar situation is observed for battery capacity AES. Its increase for lead-acid batteries is 850% (industrial profile) and 510% for the communal load, while for lithium-ion batteries it is 420% and 160%, respectively. From the economic point of view, it means that the optimization of off-line PV-wind hybrid structures should be executed with no limit for the system rated power Pn. Its inclusion in the optimization makes sense only if the space intended for the PV and wind system is limited. A reduction in generation power, as compared to the systems with no limits, results in longer periods in which the power does not satisfy the demand. Consequently, the algorithm selects higher capacities of the energy storages which help to maintain the assumed power supply reliability parameters. The changes in the LCOE and in the electrochemical storage capacity in the function of time TsumLIMIT are of an exponential nature, similar to the variant with no limits, which is confirmed by the values of determination factors R2 in the <0.98; 0.99> range (Figure 12).
Figure 13 shows the changes in the most important parameters of the optimized PV-wind hybrid systems in the function of time TsumLIMIT% for lithium-ion NMC type batteries, for two sets of engineering and economic parameters (current and future—over a five year perspective) and two load profiles. The presented results of a hybrid power supply system structure apply to the 50 kW peak power load and include an optimization variant with no limit for the power generation system. Rated power Pn, which according to the results given in Table 3 and Table 4 helps to achieve lower values of the quality criterion—LCOE, as compared to the optimization variant with the power generation system rated power limit (Table 5 and Table 6).
The capacities of the lithium-ion batteries in the optimized systems with the parameters estimated for a five years’ perspective are for both profiles higher than their corresponding battery capacities determined for the current profiles (Figure 13c,d). It enables better use of excess energy, i.e., power generated in a low-load period. A reduction in the storage cost by 20% and increasing their lifespan by over 67% despite of an increase in the storage capacity, helps to reduce the LCOE of the optimized systems (Figure 13a,b), including the LCOE reduction owing to the reduction in the quantity of energy generated in the power generation system and fed to the heaters. The values of the LCOE and energy storage capacity for the optimized systems decrease exponentially in the function of reliability index TSUMLimit%, for both analyzed load profiles—the current and future (five years’ perspective) ones. At low reliability of the system (TSUMLimit% = 5%), the values of the LCOE for both sets of parameters (current and future (over a five years period) are similar (Figure 13a,b). Furthermore, the capacity of energy storages in the function of reliability level TSUMLimit% decreases faster for the current parameters than for the parameters of lithium-ion storages estimated for a five years’ perspective.
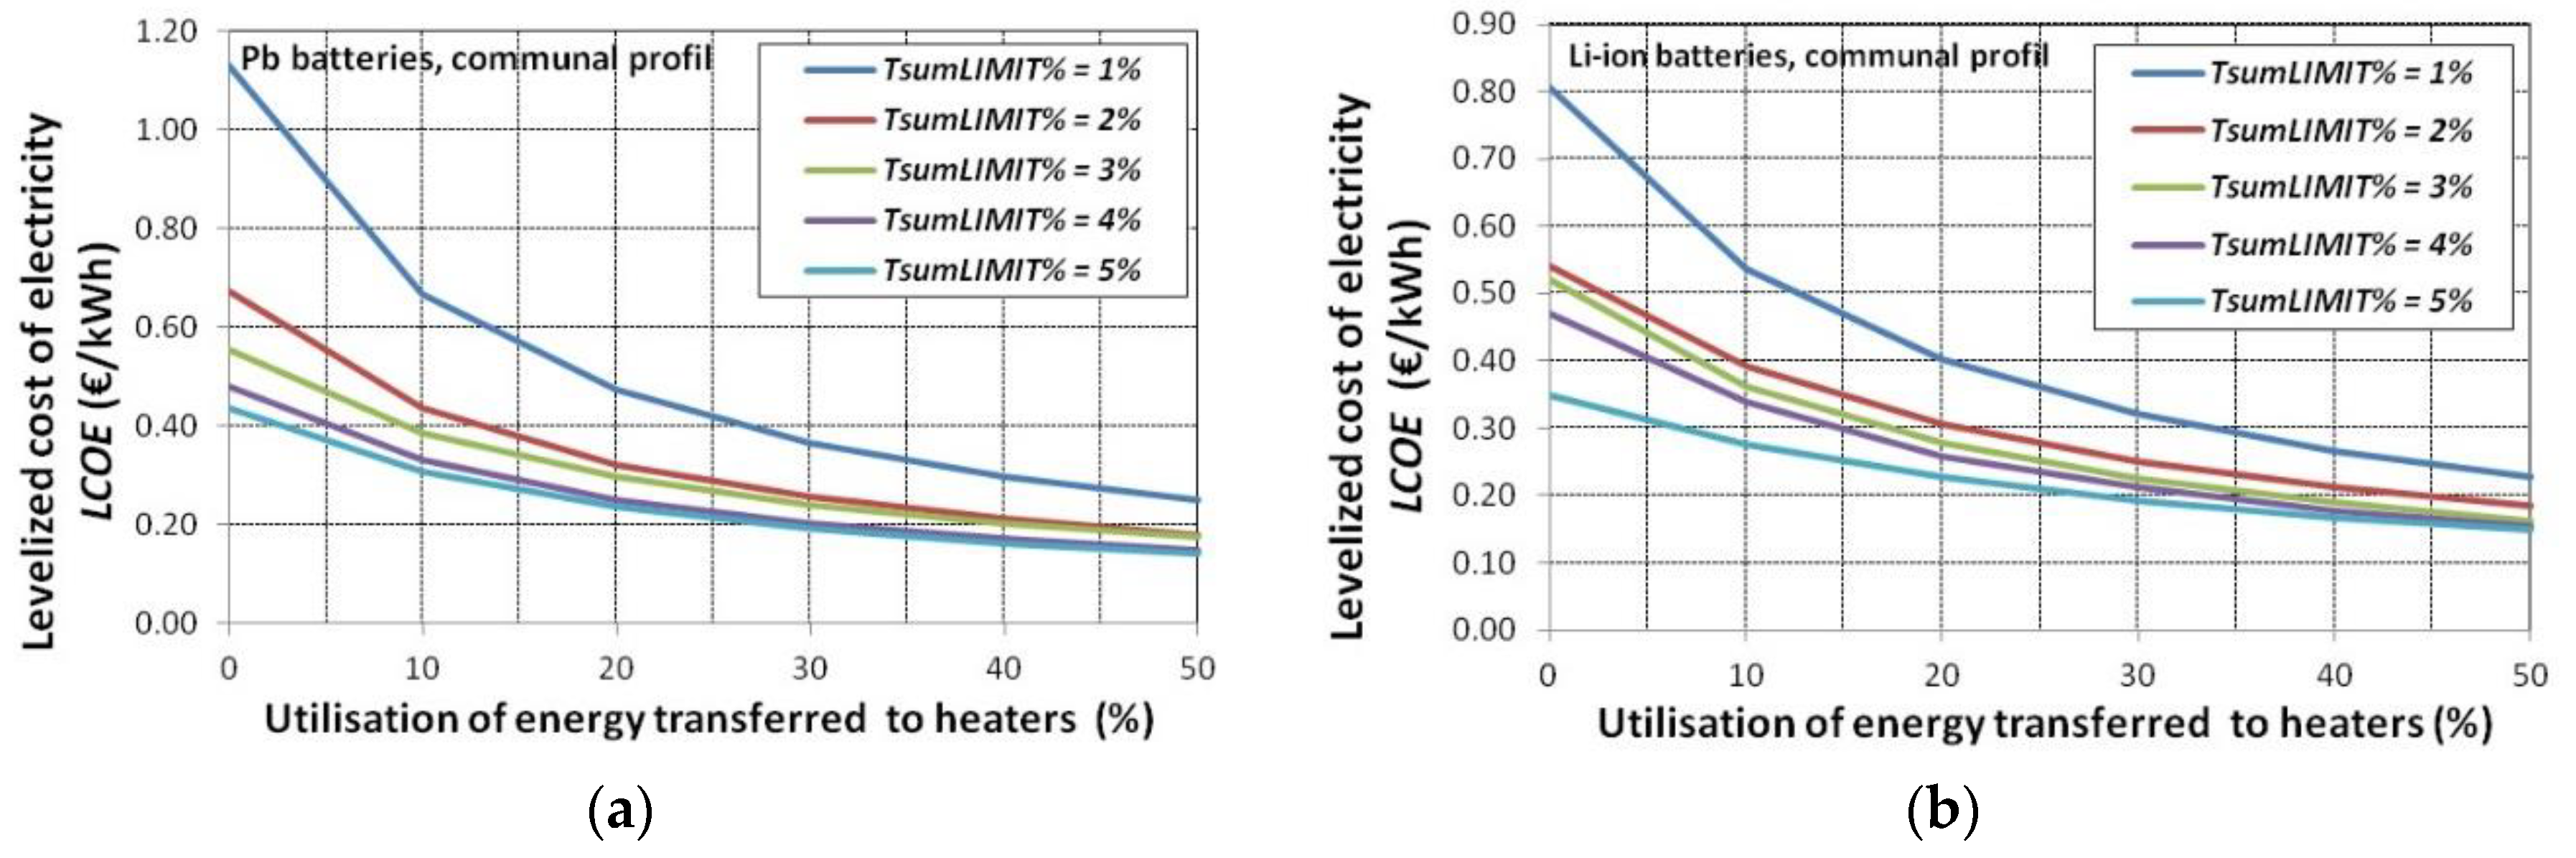
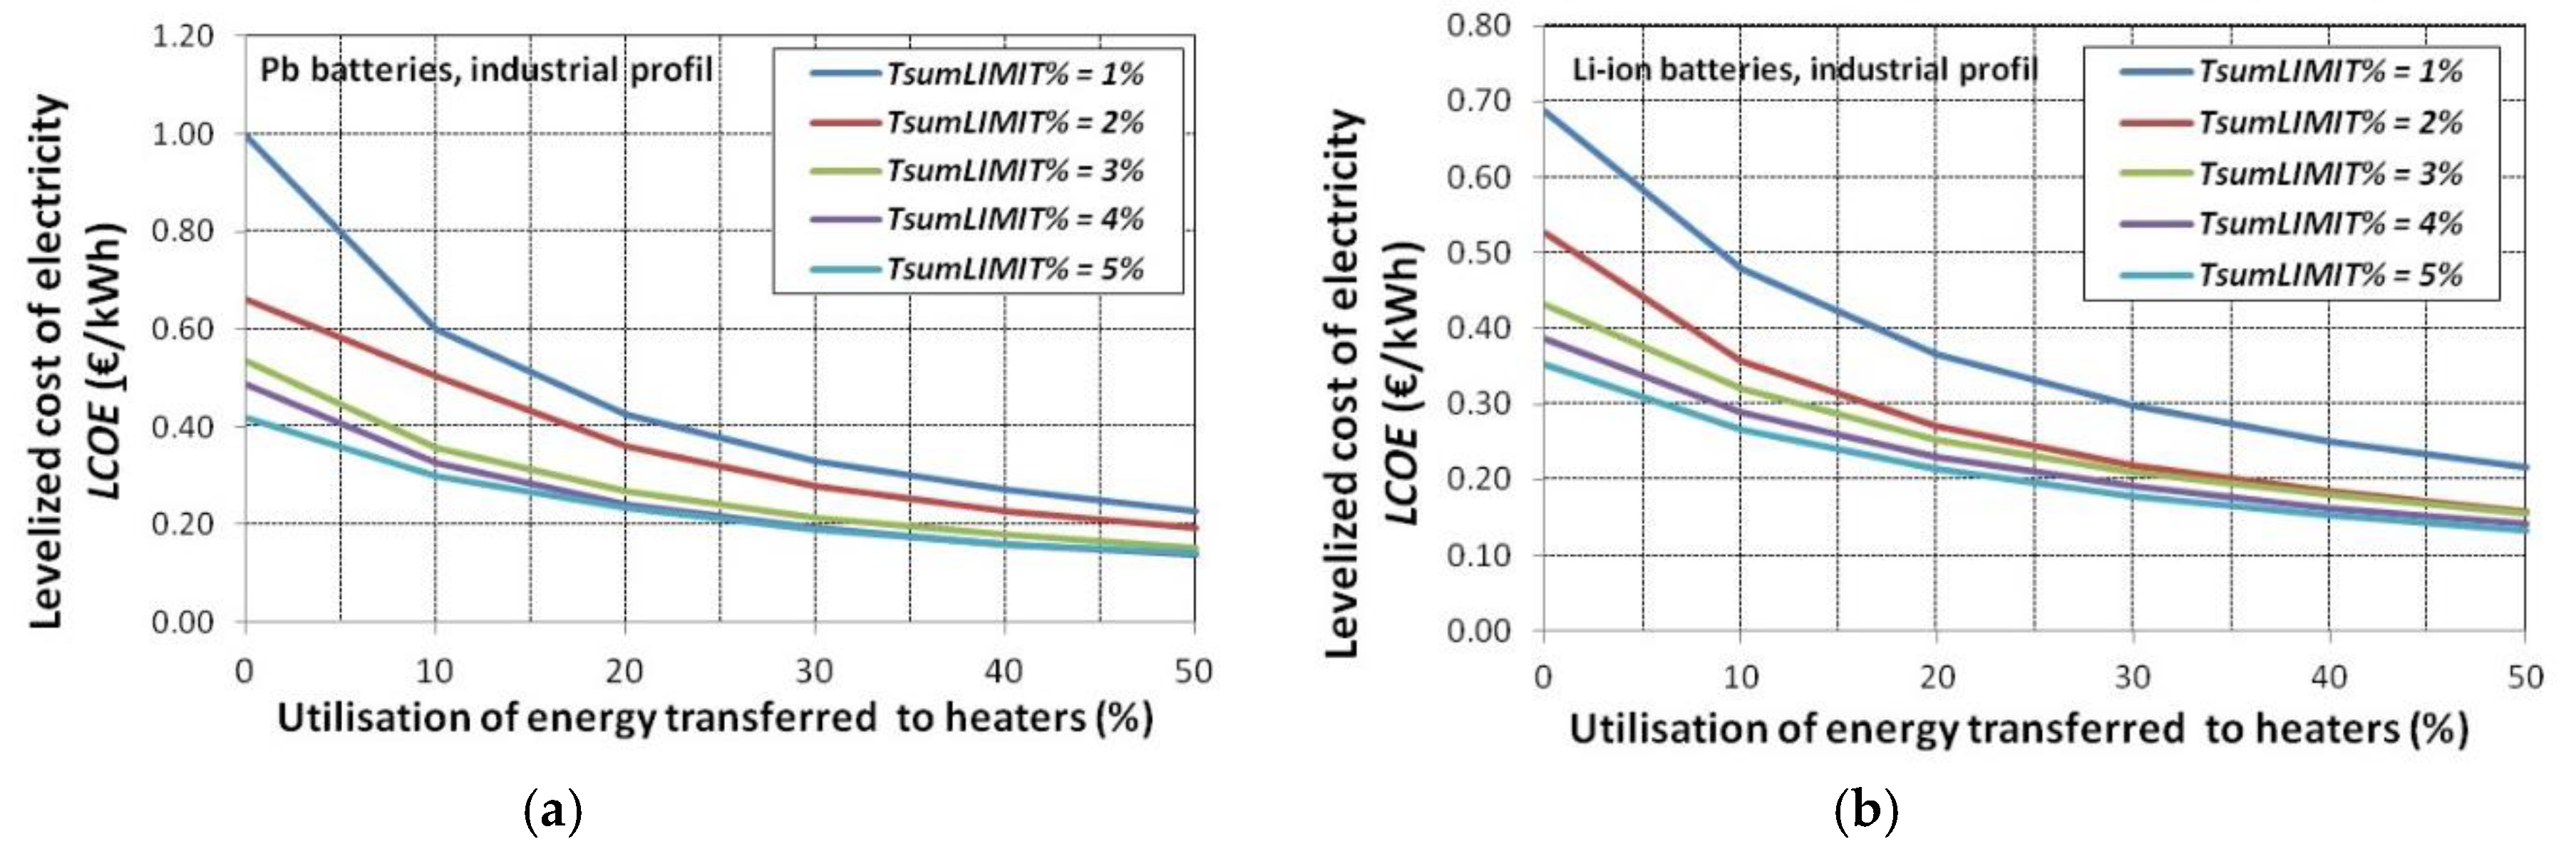
Figure 14 and Figure 15 show the changes in the LCOE for the optimum systems in the function of time TsumLIMIT% and percentage of energy quantity fed to the heaters and used for heating or processes, for two types of batteries (lead-acid and lithium-ion) and two load profiles—Figure 14 for communal and 12 for industrial. The analyses were carried out only for the optimization variants with no peak load limits in the power generation system.
The fact that a significant quantity of energy is fed to the heaters is a major drawback of the studied type of system (off-line), which negatively affects the value of the LCOE. It results from the fact that even in the optimized PV-wind system with electrochemical storages the quantity of the generated energy is several times higher than the required energy (the values of SSSI are high—Table 3 and Table 4). The paper revealed that such a state (significant reduction in the LCOE) and be ensured by using some of the energy for heating. It applies to systems with both lead–acid and lithium-ion batteries. The LCOE decreases exponentially in the function of energy quantity used for heating or processes—Figure 14 and Figure 15. The decrease is high and amounts to ca. 50% even when 20% of energy fed to the heaters is consumed. Its intensity depends on the kind of applied batteries and the assumed reliability levels of electrical energy supplies to the load (TsumLIMIT%).

7. Summary

A synthesis of highly-effective off-grid hybrid supply systems, which match the load characteristics, using volatile sources of renewable energy, especially solar and wind ones, is a complex issue, which requires taking into consideration both the engineering and economic aspects. The paper shows that one of the possible ways of its fulfilment is using global optimization task with the adopted non-technical quality criterion—a unit cost of electrical energy generation (LCOE).
The authors of the study claim that the major problem in the reference class of synthesis tasks is to include in the system model (even if they are simplified models) many elements such like: environmental parameters, economic factors, and data concerning the load change in a year. System operation simulations carried out as part of the optimization reflected the complexity of the parameters and phenomena affecting the value of the criterion function, and additionally helped to achieve the results within the acceptable time. In relation to high costs of periodical battery pack replacements, lifespan models which take into consideration at least their two operating conditions (charge and discharge currents, discharge depth and operating temperature), are of particular importance.
The LCOE for off-grid systems with energy storages is higher than for on-grid systems, which results from feeding some of the energy not used by the load to the heaters (losses), in addition to an increased energy capacity of the storages. The use of the optimization method helps to reduce the excess increase in the LCOE and to identify the system structure which matches best the geographical location and nature of the load, and the properties of the employed energy storages. The value of the referenced cost depends on many engineering and economic parameters, and on the assumed characteristics of the load supply system. Therefore, the major study results presented and commented on in the paper apply to two areas:
  • the influence of the level of supply reliability of a load with set load characteristics and the level of excess energy used (e.g., for heating structures), on the changes in LCOE values of the optimized hybrid structures,
  • inclusion of durability models of lead-acid and lithium-ion batteries, and the influence of changes in the engineering and economic parameters of lithium-ion batteries in a five years’ perspective on the value of the criterion function (LCOE) and the structure of optimized systems.
The proposed synthesis method of PV-wind hybrid off-line systems leads to limiting the energy capacity of electrochemical storages, including lead-acid and lithium-ion batteries, which unfortunately results in high amounts of energy being fed to the heaters. Due to worse parameters, it is particularly evident for lead-acid batteries. It results from the difficulty to match the power generation (stochastic power profiles of the PV and wind) with the load demand.
For the studied power generation systems, the value of the LCOE and energy storage capacity decreases exponentially in the function of power supply reliability measured with the maximum time a year when the load operates at the supplied power below the load curve TsumLIMIT%.
Based on the analyses, the authors identified the following recommended methods to improve (reduce) the value of the criterion index (LCOE) for PV-wind off-grid systems which supply communal users and minor industrial users:
  • partial use of energy fed to the heaters e.g., for facility heating or in processes—a decrease in the LCOE for lead-acid and lithium-ion batteries amount to ca. 50% already when 20% of energy fed to the heaters is used. When the energy further increases, the LCOE decreases exponentially, reaching ca. 30% when half of the energy fed to the heaters is used,
  • the use of electrochemical storages with better lifespan parameters—a change in the lithium-ion batteries lifespan from 3000 to 5000 cycles and a decrease in their prices by 20% as compared to the current costs, lead to the LCOE reduction from 3% to 13%, whereby the greatest drops are observed for the most stringent supply reliability limits—TsumLIMIT% = 1%.
In the analyzed types of systems, it can be recommended to use thermoelectrical storage to store the heat accumulated in the spring-summer season in order to use it in autumn and winter for heating. Another method suggested by the authors to minimize the LCOE is to use lithium-ion batteries in the “second-life” cycle, i.e., usually once they have been taken out of service in very strict conditions, e.g., in the electromobility areas.
The authors plan to carry out further research into the replacement of lithium-ion and lead-acid batteries with other types of storage, especially thermoelectric and fuel cells. The current prices of these systems are high, but according to scientists, these technologies may be predominant in the area of energy storage in the future. Therefore, the methods of optimal selection of their parameters for cooperation with renewable sources operating within off-grid hybrid generation systems and known load characteristics are an important direction of research.
Therefore, the authors will begin work on the extension of the hybrid system model with thermoelectric storages and fuel cells. This will require, apart from modelling electrical processes, also taking into account thermal processes. This is particularly important in the case of fuel cells, in which a large amount of heat is released during operation. This heat, in normal operating systems, is considered a loss. In the case of the proposed system, it is possible to store it in a thermal storage facility and recover it during periods of increased energy demand. This approach will improve the overall efficiency of the system.

Author Contributions

A.T. and L.K. have conceived the base of the paper, discussed the optimization method of hybrid systems, elaborated summary, prepared drawings, designed models of supply hybrid systems and energy storage, developed computer system, made calculations, G.T. has analyzed the results of simulation and optimization, K.T., J.A. and Z.N. have provided some valuable suggestions and revised the paper, A.M. and G.T. literature review, prepared introduction, R.P. has prepared drawings, data visualization and made proofreading. All authors have read and agreed to the published version of the manuscript.

Funding

This research was funded by Polish Government, grant number [0212/SPAD/0512].

Conflicts of Interest

The authors declare no conflict of interest.

Nomenclature

Description of the basic variables used in their calculations.
Variable/
Parameter
DescriptionSource of the Finding
pWT(t), pPV(t)Instantaneous powers of the wind and solar sectionMeasurements—Prof. K. Markowicz, University of Warsaw
vw(t)The wind speedValue range limitations according to Formula (1)
IphSolar current generated at the actual irradiance Gr and at the PV module surface temperature TCalculations based on the Formula (3)
pES(t)Energy storage power (loading—“−” or releasing—“+”)Calculations based on the Formulas (5), (19), (22), (25) and (28)
C(I,T)The battery capacityCalculations based on the Formula (6)
SOC(t)State of charge of the battery packCalculations based on the Formula (11)
DOC(t)Depth of charge during discharging or chargingCalculations based on the Formula (12)
EFCThe lead-acid battery lifespan, the equivalent number of cycles (EFC), after which the battery should be changedCalculations based on the Formulas (13) and (14)
pG(t)Power transferred to the load from the generating systemCalculations based on the Formula (15)
pLOAD(t)The load powerThe load characteristics of the analyzed load type—own measurements co-authors of the paper
PWTn, PPVnThe rated power of the wind turbines and the photovoltaic modulesThe value determined based on the result of the optimization
pLESS(t)The excess power (losses) transferred to the heatersCalculations based on the Formulas (15)–(30)
GrIrradiance profile for a year’s period and actual irradiance on the PV cell surfaceRepresentation of the geographical conditions in the location of the analyzed object
TThe PV module surface temperatureIt was determined taking into account ambient temperature Ta (obtained from the public data of the Institute of Meteorology of Water Management) and the measurements of wind speed vw synchronized with the measured values of irradiance Gr according to the relationship (4)
Δ P The difference between the required demand ( P L O A D i ) and the generated power ( P G i )Calculations based on the Formula (18)
PLOSSPower fed to the heatersCalculations based on the Formulas (20) and (23)
LCOELevelized cost of energyCalculations based on the Formulas (31)–(33)
gVector of inequality constraints of a structural and functional characterCalculations based on the Formula (34)
SSSISystem self-sufficiency indexCalculations based on the Formula (38)

References

  1. Huang, Y.; Xu, Y.; Zhou, X. Study on wind–solar hybrid generating system control strategy. In Proceedings of the International Conference on Multimedia Technology (ICMT), Hangzhou, China, 16–18 July 2011; pp. 773–776. [Google Scholar]
  2. Hua–wei, Z.; Nan, L. Study on the Wind and Solar Hybrid Control System. In Proceedings of the International Conference on Control Engineering and Communication Technology (ICCECT), Liaoning, China, 7–9 December 2012; pp. 121–124. [Google Scholar]
  3. Sowa, S. Increasing the Energy Efficiency of Hybrid RES Installations Using KNX System, Renewable Energy Sources: Engineering, Technology, Innovation; Springer: Cham, Switzerland, 2018; pp. 387–394. [Google Scholar]
  4. Akram, U.; Khalid, M.; Shafiq, S. Optimal sizing of a wind/solar/battery hybrid grid-connected microgrid system. IET Renew. Power Gener. 2018, 12, 72–80. [Google Scholar] [CrossRef]
  5. Rajkumar, R.K.; Ramachandaramurthy, V.K.; Yong, B.L.; Chia, D.B. Techno-economical optimization of hybrid pv/wind/battery system using Neuro-Fuzzy. Energy 2011, 36, 5148–5153. [Google Scholar] [CrossRef]
  6. Kaabeche, A.; Belhamel, M.; Ibtiouen, R. Sizing optimization of grid-independent hybrid photovoltaic/wind power generation system. Energy 2011, 36, 1214–1222. [Google Scholar] [CrossRef]
  7. Giallanza, A.; Porretto, M.; Li Puma, G.; Marannano, G. A sizing approach for stand-alone hybrid photovoltaic-wind-battery systems: A Sicilian case study. J. Clean. Prod. 2018, 199, 817–830. [Google Scholar] [CrossRef]
  8. Maleki, A.; Ameri, M.; Keynia, F. Scrutiny of multifarious particle swarm optimization for finding the optimal size of a PV/wind/battery hybrid system. Renew. Energy 2015, 80, 552–563. [Google Scholar] [CrossRef]
  9. Nadjemi, O.; Nacer, T.; Hamidat, A.; Salhi, H. Optimal hybrid PV/wind energy system sizing: Application of cuckoo search algorithm for Algerian dairy farms. Renew. Sustain. Energy Rev. 2017, 70, 1352–1365. [Google Scholar] [CrossRef]
  10. Kaabeche, A.; Diaf, A.; Ibtiouen, R. Firefly-inspired algorithm for optimal sizing of renewable hybrid system considering reliability criteria. Sol. Energy 2017, 155, 727–738. [Google Scholar] [CrossRef]
  11. Hatata, A.Y.; Osman, G.; Aladl, M.M. An optimization method for sizing a solar/wind/battery hybrid power system based on the artificial immune system. Sustainable Energy Technologies and Assessments. Sustain. Energy Technol. Assess. 2018, 27, 83–93. [Google Scholar] [CrossRef]
  12. Belouda, A.; Hajjaji, M.; Sliti, H.; Mami, A. Bi-objective optimization of a standalone hybrid PV–Wind–battery system generation in a remote area in Tunisia. Sustain. Energy Grids Netw. 2018, 16, 315–326. [Google Scholar] [CrossRef]
  13. Zhang, D.; Liu, J.; Jiao, S.; Tian, H.; Lou, C.; Zhou, Z.; Zhang, J.; Wang, C.; Zuo, J. Research on the configuration and operation effect of the hybrid solar-wind-battery power generation system based on NSGA-II. Energy 2019, 189, 116121. [Google Scholar] [CrossRef]
  14. Ashtiani, M.N.; Toopshekan, A.; Astaraei, F.R.; Yousefi, H.; Maleki, A. Techno-economic analysis of a grid-connected PV/battery system using the teaching-learning-based optimization algorithm. Sol. Energy 2020, 203, 69–82. [Google Scholar] [CrossRef]
  15. Kaur, R.; Krishnasamy, V.; Kandasamy, N.K.; Kumar, S. Discrete Multiobjective Grey Wolf Algorithm Based Optimal Sizing and Sensitivity Analysis of PV-Wind-Battery System for Rural Telecom Towers. IEEE Syst. J. 2020, 14, 729–737. [Google Scholar] [CrossRef]
  16. Lu, J.; Wang, W.; Zhang, Y.; Cheng, S. Multi-Objective Optimal Design of Stand-Alone Hybrid Energy System Using Entropy Weight Method Based on HOMER. Energies 2017, 10, 1664. [Google Scholar] [CrossRef] [Green Version]
  17. Askarzadeh, A. A discrete chaotic harmony search-based simulated annealing algorithm for optimum design of PV/wind hybrid system. Sol. Energy 2013, 97, 93–101. [Google Scholar] [CrossRef]
  18. Tahani, M.; Babayan, N.; Pouyaei, A. Optimization of PV/Wind/Battery stand-alone system, using hybrid FPA/SA algorithm and CFD simulation, case study: Tehran. Energy Convers. Manag. 2015, 106, 644–659. [Google Scholar] [CrossRef]
  19. Ahmadi, S.; Adbi, S. Application of the Hybrid Big Bang–Big Crunch algorithm for optimal sizing of a stand-alone hybrid PV/wind/battery system. Sol. Energy 2016, 134, 366–374. [Google Scholar] [CrossRef]
  20. Ghorbani, A.; Kasaeian, A.; Toopshekan, A.; Bahrami, L.; Maghami, A. Optimizing a hybrid wind-PV-battery system using GA-PSO and MOPSO for reducing cost and increasing reliability. Energy 2018, 154, 581–591. [Google Scholar] [CrossRef]
  21. Shezan, S.K.A.; Ping, H.W. Techno-Economic and Feasibility Analysis of a Hybrid PV-Wind-BiomassDiesel Energy System for Sustainable Development at Offshore Areas in Bangladesh. Curr. Altern. Energy 2017, 1, 20–32. [Google Scholar] [CrossRef]
  22. Shezan, S.K.A.; Al-Mamoon, A.; Ping, H.W. Performance Investigation of an Advanced Hybrid Renewable Energy System in Indonesia. Environ. Prog. Sustain. Energy 2018, 37. [Google Scholar] [CrossRef]
  23. Nurunnabi, M.; Roy, N.K.; Hossain, E.; Pota, H.R. Size Optimization and Sensitivity Analysis of Hybrid Wind/PV Micro-Grids- A Case Study for Bangladesh. IEEE Access 2019, 7, 150120–150140. [Google Scholar] [CrossRef]
  24. Shezan, S.K.A. Optimization and assessment of an off-grid photovoltaic–diesel–battery hybrid sustainable energy system for remote residential applications. Environ. Prog. Sustain. Energy 2019, 38. [Google Scholar] [CrossRef]
  25. Cho, J.-H.; Chun, M.-G.; Hong, W.-P. Structure Optimization of Stand-Alone Renewable Power Systems Based on Multi Object Function. Energies 2016, 9, 649. [Google Scholar] [CrossRef]
  26. Yoshida, Y.; Farzaneh, H. Optimal Design of a Stand-Alone Residential Hybrid Microgrid System for Enhancing Renewable Energy Deployment in Japan. Energies 2020, 13, 1737. [Google Scholar] [CrossRef] [Green Version]
  27. Zhang, W.; Maleki, A.; Rosen, M.A. A heuristic-based approach for optimizing a small independent solar and wind hybrid power scheme incorporating load forecasting. J. Clean. Prod. 2019, 241, 117920. [Google Scholar] [CrossRef]
  28. Li, J.; Wei, W.; Xiang, J. A Simple Sizing Algorithm for Stand-Alone PV/Wind/Battery Hybrid Microgrids. Energies 2012, 5, 5307–5323. [Google Scholar] [CrossRef] [Green Version]
  29. Hassan, A.; Saadawi, M.; Kandil, M.; Saeed, M. Modified particle swarm optimization technique for optimal design of small renewable energy system supplying a specific load at Mansoura University. Iet Renew. Power Gener. 2015, 9, 474–483. [Google Scholar] [CrossRef]
  30. Jung, W.; Jeong, J.; Kim, J.; Chang, D. Optimization of hybrid off-grid system consisting of renewables and Li-ion batteries. J. Power Sources 2020, 451, 227754. [Google Scholar] [CrossRef]
  31. Chen, Y.; Vinco, S.; Pagliari, D.J.; Montuschi, P.; Macii, E.; Poncino, M. Modeling and Simulation of Cyber-Physical Electrical Energy Systems with SystemC-AMS. IEEE Trans. Sustain. Comput. 2020. [Google Scholar] [CrossRef]
  32. Chen, Y.; Vinco, S.; Baek, D.; Quer, S.; Macii, E.; Poncino, M. Cost-Aware Design and Simulation of Electrical Energy Systems. Energies 2020, 13, 2949. [Google Scholar] [CrossRef]
  33. Kasprzyk, L. Modelling and analysis of dynamic states of the lead-acid batteries in electric vehicles. Eksploat. Niezawodn. Maint. Reliab. 2017, 19, 229–236. [Google Scholar] [CrossRef]
  34. Burzyński, D.; Kasprzyk, L. Modelling and simulation of lead-acid battery pack powering electric vehicle. E3S Web Conf. 2017, 14. [Google Scholar] [CrossRef] [Green Version]
  35. Mutarraf, U.M.; Terriche, Y.; Niazi, K.; Vasquez, J.; Guerrero, J.M. Energy Storage Systems for Shipboard Microgrids—A Review. Energies 2019, 11, 3492. [Google Scholar] [CrossRef] [Green Version]
  36. Arboleya, P.; El-Sayed, I.; Mohamed, B.; Mayet, C. Modeling, Simulationand Analysis of On-Board Hybrid Energy Storage Systems for Railway Applications. Energies 2019, 12, 2199. [Google Scholar] [CrossRef] [Green Version]
  37. Hussain Nengroo, S.; Umair Ali, M.; Zafar, A.; Hussain, S.; Murtaza, T.; Junaid Alvi, M.; Jee Kim, H. An Optimized Methodology for a Hybrid Photo-Voltaic and Energy Storage System Connected to a Low-Voltage Grid. Electronics 2019, 8, 176. [Google Scholar] [CrossRef] [Green Version]
  38. Tomczewski, A.; Kasprzyk, L.; Nadolny, Z. Reduction of power production costs in a wind power plant–flywheel energy storage system arrangement. Energies 2019, 12, 1942. [Google Scholar] [CrossRef] [Green Version]
  39. Kasprzyk, L.; Tomczewski, A.; Bednarek, K.; Bugała, A. Minimisation of the LCOE for the hybrid power supply system with the lead-acid battery. In Proceedings of the International Conference Energy, Environment and Material Systems (EEMS 2017) 2017, 01030, E3S Web Conferences 19/2017, EDP Sciences, Polanica Zdrój, Poland, 13–15 September 2017. [Google Scholar] [CrossRef] [Green Version]
  40. Skoplaki, E.; Boudouvis, A.G.; Palyvos, J.A. A simple correlation for the operating temperature of photovoltaic modules of arbitrary mounting. Sol. Energy Mater. Sol. Cells 2008, 92, 1393–1402. [Google Scholar] [CrossRef]
  41. Burzyński, D.; Kasprzyk, L. Analysis of the potential use of lithium-ion energy storage in the home charging station for electric cars. In Proceedings of the 2nd International Conference on the Sustainable Energy and Environmental Development, Krakow, Poland, 14–17 November 2017; IOP Conf. Series: Earth and Environmental Science. 214. [Google Scholar]
  42. Kasprzyk, L. Wybrane zagadnienia modelowania ogniw elektrochemicznych i superkondensatorów w pojazdach elektrycznych. Pozn. Univ. Technol. Acad. J. Electr. Eng. 2019, 101, 1–55. [Google Scholar] [CrossRef]
  43. Schmalstieg, J.; Käbitz, S.; Ecker, M.; Sauer, D.U. A holistic aging model for Li(NiMnCo)O2 based 18650 lithium-ion batteries. J. Power Sources 2014, 257, 325–3334. [Google Scholar] [CrossRef]
  44. Jarmuda, T. Optymalizacja Struktury Hybrydowego Systemu Zasilania Typu Słoneczno-Wiatrowego. Ph.D. Thesis, Poznan University of Technology, Poznan, Poland, 2019. [Google Scholar]
  45. Omar, N.; Monem, M.A.; Firouz, Y.; Salminen, J.; Smekens, J.; Hegazy, O.; Gaulous, H.; Mulder, G.; Van den Bossche, P.; Coosemans, T.; et al. Lithium iron phosphate based battery–assessment of the aging parameters and development of cycle life model. Appl. Energy 2014, 113, 1575–1585. [Google Scholar] [CrossRef]
  46. Waag, W.; Fleischer, C.; Sauer, D.U. Critical review of the methods for monitoring of lithium-ion batteries in electric and hybrid vehicles. J. Power Sources 2014, 258, 321–339. [Google Scholar] [CrossRef]
  47. Bilal, B.O.; Sambou, V.; Kébé, C.M.; Ndiaye, P.A.; Ndongo, M. Methodology to Size an Optimal Stand-Alone PV/wind/diesel/battery System Minimizing the Levelized cost of Energy and the CO2 Emissions. Energy Procedia 2012, 14, 1636–1647. [Google Scholar] [CrossRef] [Green Version]
  48. Nissen, U.; Harfst, N. Shortcomings of the traditional “levelized cost of energy”[LCOE] for the determination of grid parity. Energy 2019, 171, 1009–1016. [Google Scholar] [CrossRef]
  49. Tabak, A.; Kayabasi, E.; Guneser, M.T.; Ozkaymak, M. Grey wolf optimization for optimum sizing and controlling of a PV/WT/BM hybrid energy system considering TNPC, LPSP, and LCOE concepts. Energy Sources Part A Recovery Util. Environ. Eff. 2019, 42, 1–21. [Google Scholar] [CrossRef]
  50. Cirés, E.; Marcos, J.; de la Parra, I.; García, M.; Marroyo, L. The potential of forecasting in reducing the LCOE in PV plants under ramp-rate restrictions. Energy 2019, 188, 116053. [Google Scholar] [CrossRef]
  51. Xiaoting, W.; Barnett, A. The evolving value of photovoltaic module efficiency. Appl. Sci. 2019, 9, 1227. [Google Scholar] [CrossRef] [Green Version]
  52. Garcia-Sanz, M. A Metric Space with LCOE Isolines for Research Guidance in wind and hydrokinetic energy systems. Wind Energy 2020, 23, 291–311. [Google Scholar] [CrossRef]
  53. Pfaffel, S.; Faulstich, S.; Rohrig, K. Performance and reliability of wind turbines: A review. Energy 2017, 10, 1904. [Google Scholar] [CrossRef] [Green Version]
  54. Lombardi, P.; Arendarski, B.; Menke, N.; Hoepfner, A.; Komarnicki, P.; Liserre, M. Net-Zero Residential Energy System Planning Tool. In Proceedings of the CIGRE Chengdu 2019 Symposium, Chengdu, China, 20–26 September 2019; pp. 28–36. [Google Scholar]
  55. Goldberg, D.E. Genetic Algorithms in Search, Optimization & Machine Learning; Addison-Wesley: Boston, MA, USA, 1989. [Google Scholar]
  56. Jajczyk, J. Use of Personal Computers with Multi-core Processors for Optimisation Using the Genetic Algorithm Method. In Proceedings of the 17th International Conference on Computational Problems of Electrical Engineering (CPEE 2016), Sandomierz, Poland, 14–17 September 2016; ISBN 978-1-5090-2800-9. [Google Scholar] [CrossRef]
  57. MathWorks. Available online: www.mathworks.com (accessed on 31 June 2020).
Figure 1. The 24 h load profiles for: (a) industrial load; (b) communal load, for the maximum and minimum load day in 2014.
Energies 13 06143 g001
Figure 2. Annual load map (2014) for: (a) industrial load; (b) communal load.
Energies 13 06143 g002
Figure 3. Illustrative diagram of a PV—wind hybrid power supply system with electrochemical energy storage (PV—photovoltaic modules, WT—wind turbines, BESS—battery energy storage system, P—load, DC/DC, AC/DC—inverter systems working directly with the PV and wind part).
Energies 13 06143 g003
Figure 4. Graphical interpretation of determining method for PWT output power of a wind turbine in accordance with Relation (1).
Energies 13 06143 g004
Figure 5. Equivalent diagram of an electrochemical cell [34].
Energies 13 06143 g005
Figure 6. Relationships between: C1 (a), R1 (b), Em (c), R0 (d) of equivalent circuit parameters and SOC.
Energies 13 06143 g006
Figure 7. Typical change in the inverter capacity in the function of relative output power (averaged characteristics for the acceptable change in the inverter input voltage).
Energies 13 06143 g007
Figure 8. Annual change profile: (a) wind speed at the height of 10 m above the ground level, (b) irradiance in the analyzed geographical location.
Energies 13 06143 g008
Figure 9. Changes in: (a) the best individual’s adaptation function, (b) χ on-line effectiveness in the function of the iteration number (generation) for sample optimization processes of a PV-wind hybrid system.
Energies 13 06143 g009
Figure 10. Block diagram: (a) developed IT system; (b) optimization algorithm using the genetic algorithm method.
Energies 13 06143 g010
Figure 11. Changes in selected parameters of optimized systems with no limit for power Pn in the function of time TsumLIMIT%: the unit cost of generating energy (LCOE) consumed for supplying a communal load (a) and industrial load (b); energy capacity of a battery pack for a communal load (c) and industrial load (d); rated power of the power generation system Pn for a communal load (e) and industrial load (f).
Energies 13 06143 g011
Figure 12. Changes in selected parameters of the optimized systems with power Pn limited to 200 kW in the function of time TsumLIMIT%: the unit cost of generating energy (LCOE) consumed for supplying a communal load (a) and industrial load (b); energy capacity of a battery pack for a communal load (c) and industrial load (d).
Energies 13 06143 g012
Figure 13. Changes in selected parameters of the optimized systems with no limit for power Pn in the function of time TsumLIMIT% for lithium-ion batteries with the current and future (five years’ perspective) engineering and economic parameters: the unit cost of generating energy (LCOE) consumed for supplying a communal load (a) and industrial load (b); energy capacity of a battery pack for a communal load (c) and industrial load (d); rated power of the power generation system Pn for a communal load (e) and industrial load (f).
Energies 13 06143 g013
Figure 14. A change in the LCOE for optimum systems in the function of maximum time TsumLIMIT% and cases of the percentage use of energy emitted on the heaters during heating processes (communal profile, 50 kW peak power load): (a) lead-acid batteries; (b) lithium-ion batteries.
Energies 13 06143 g014
Figure 15. A change in the LCOE for optimum systems in the function of maximum time TsumLIMIT% and cases of the percentage use of energy emitted on the heaters during technological processes (industrial profile, 50 kW peak power load): (a) lead-acid batteries, (b) lithium-ion batteries.
Energies 13 06143 g015
Table 1. Table of strength and weakness points of various energy systems.
Energy SystemStrengthsWeaknesses
internal combustion engines (natural gas, biogas, petroleum, biofuels)
  • low investments costs
  • wide power range
  • quick start
  • relative high efficiency
  • high reliability
  • heat generation
  • noise emission
  • greenhouse gases emission
  • high maintenance costs
fuel cells
  • high efficiency
  • high reliability
  • low greenhouse gases emissions
  • low noise emission
  • heat generation
  • module construction
  • high investments costs
  • high working temperature
  • degradation
  • low durability
  • necessity of production, distribution and storage of hydrogen
small hydropower plants
  • renewable source
  • very high efficiency
  • low environmental impact
  • quick start
  • high investments cost
  • location constraints
wind turbines
  • renewable source
  • low greenhouse gases emissions
  • low reliability
  • low efficiency
  • noise emission
photovoltaic modules
  • renewable source
  • low operating costs
  • low greenhouse gases emissions
  • low reliability
  • low efficiency
  • degradation
Table 2. Summary of publications in terms of optimization algorithms used (applied), as well as the constraints and limitations.
Optimisation MethodReliability ConstraintsStorage System ConstraintsSupply System ConstraintsEnvironmental Constraints
LPSPENSGPAPLDRLOLPother
Iterative methods [7][4,6]
Particle swarm optimisation [10] [8,26,29]
Cuckoo search algorithm [9]
Firefly algorithm [10]
Bat algorithm [10]
Clonal selection algorithm[11]
Discrete grey wolf algorithm[15] [15]
Adaptive system of neuro-fuzzy reasoning[5]
Genetic algorithm[11]
NSGA II[12,13] [12]
Hybrid algorithms[18,20][19] [17][17]
Other algorithms[25] [25]
Commercial software[5] [21,22,23,24] [21,22,23,24]
Multi-criteria decision-making methods [16] [16]
Table 3. Results of PV-wind hybrid power supply system structure optimization (lead-acid and lithium-ion battery) for a 50 kW peak power of a communal load with no limit for the power generation system rated power Pn (for: IESPb = IESLi-Ion = 533.3 €/kWh, MES = 22.2 €/kWh, IESLi-Ion = 426.7 €/kWh, MES = 22.2 €/kW, IPV = 1359 €/kW, ITW = 1571 €/kW, MPV = 25.3 €/kW, MWT = 11.1 €/kW, NM = 25 years, r = 5%).
Parameter and UnitAcceptable Duration of Power Outage a Year TsumLIMIT (h) (%)
438.0 (5)350.4 (4)262.8 (3)175.2 (2)87.6 (1)
Electrochemical Storage Type
PbLi-IonPbLi-IonPbLi-Ion>PbLi-IonPbLi-Ion
LCOE (€/kWh)0.440.350.480.470.560.520.680.541.130.81
PWT (kW)260.0190.00280.0210.0270.0270.0380.0240.0390.0310.0
PWT% (%)76.780.676.066.169.274.573.369.366.074.1
PPV (kW)79.245.688.3107.6120.292.6120.2106.4201.3108.6
PPV% (%)23.319.424.033.930.825.626.730.734.025.9
Pn (kW)339.2235.6368.3317.6390.2362.6500.2346.4591.3418.6
Energy capacity ke (kWh/kW)2712.62823.02705.02164.72482.12707.72569.02570.82497.92674.8
Total generated power AG (MWh)920.1665.1996.4687.5968.5981.81285.1890.51477.01119.7
Energy fed to heaters AH (MWh)742.0485.0817.0507.0788.0800.01010.0707.01290.0934.0
Required energy ALOAD (MWh)186.3
SSSI (–)4.943.575.353.695.205.276.904.787.936.01
Total duration of power outages a year Tsum (h)435.7437.0349.6348.9262.2253.3174.0165.987.586.4
AME (kWh)401205016090180110230270460
Table 4. Results of PV-wind hybrid power supply system structure optimization (lead-acid and lithium-ion battery) for a 50 kW peak power of an industrial communal load with no limit for the power generation system rated power Pn (for: IESPb = IESLi-Ion = 533.3 €/kWh, MES = 22.2 €/kWh, IESLi-Ion = 426.7 €/kWh, MES = 22.2 €/kW, IPV = 1359 €/kW, ITW = 1571 €/kW, MPV = 25.3 €/kW, MWT = 11.1 €/kW, NM = 25 years, r = 5%).
Parameter and UnitAcceptable Duration of Power Outage a Year TsumLIMIT (h) (%)
438.0 (5)350.4 (4)262.8 (3)175.2 (2)87.6 (1)
Electrochemical Storage Type
PbLi-IonPbLi-IonPbLi-IonPbLi-IonPbLi-Ion
LCOE (€/kWh)0.420.350.490.390.530.430.660.531.000.69
PWT (kW)270.0240.0360.0250.0330.0240.0420.0310.0420.0260.0
PWT% (%)72.479.684.276.670.665.773.167.266.252.2
PPV (kW)102.861.467.576.2137.6125.3154.4151.1214.8238.2
PPV% (%)27.620.415.823.429.434.326.932.833.847.8
Pn (kW)372.8301.4427.5326.2467.6365.3574.4461.1634.8498.2
Energy capacity ke (kWh/kW)2629.32787.72889.42716.72592.42500.12685.22529.22505.52223.4
Total generated power AG (MWh)980.2840.21235.2886.21212.2913.31542.41166.21590.51107.1
Energy fed to heaters AH (MWh)778.0639.01030683.01000.0709.01340.0960.01383.0899.0
Required energy ALOAD (MWh)209.0
SSSI (–)4.694.025.914.245.804.377.385.587.615.30
Total duration of power outages a year Tsum (h)437.6437.2350.2349.9262.5261.1172.1174.987.287.3
AME (kWh)40905011060130140150240330
Table 5. Results of PV-wind hybrid power supply system structure optimization (lead–acid and lithium-ion battery) for a 50 kW peak power of a communal load with the power generation system rated power Pn limited to 200 kW (for: IESPb = IESLi-Ion = 533.3 €/kWh, MES = 22.2 €/kWh, IESLi-Ion = 426.7 €/kWh, MES = 22.2 €/kW, IPV = 1359 €/kW, ITW = 1571 €/kW, MPV = 25.3 €/kW, MWT = 11.1 €/kW, NM = 25 years, r = 5%).
Parameter and UnitAcceptable Duration of Power Outage a Year TsumLIMIT (h) (%)
438.0 (5)350.4 (4)262.8 (3)175.2 (2)87.6 (1)
Electrochemical Storage Type
PbLi-IonPbLi-IonPbLi-IonPbLi-IonPbLi-Ion
LCOE (€/kWh)0.690.380.860.461.240.611.750.853.241.71
PWT (kW)160.0140.0150.0160.0130.0140.0170.0170.0130.0150.0
PWT% (%)80.870.775.280.766.970.486.666.065.575.6
PPV (kW)38.058.049.638.264.358.926.326.768.448.3
PPV% (%)19.229.324.819.333.129.623.424.034.524.4
Pn (kW)198.0198.0199.6198.2194.3198.9196.3196.7198.4198.3
Energy capacity ke (kWh/kW)2747.52606.62669.42801.12502.52575.82894.62888.62469.82658.7
Total generated power AG (MWh)544.0516.1532.8555.2486.2512.3568.2568.2490.0527.2
Energy fed to heaters AH (MWh)364.0337.0351.0374.0305.0331.0385.0386.0305.0343.0
Required energy ALOAD (MWh)186.3
SSSI (–)2.922.772.862.982.612.753.053.052.632.83
Total duration of power outages a year Tsum (h)429.7431.9348.6349.4260.5260.5174.8174,487.486.1
AME (kWh)26020031024050047075075014901770
Table 6. Results of PV-wind hybrid power supply system structure optimization (lead–acid and lithium-ion battery) for a 50 kW peak power of an industrial load with the power generation system rated power Pn limited to 200 kW (for: IESPb = IESLi-Ion = 533.3 €/kWh, MES = 22.2 €/kWh, IESLi-Ion = 426.7 €/kWh, MES = 22.2 €/kW, IPV = 1359 €/kW, ITW = 1571 €/kW, MPV = 25.3 €/kW, MWT = 11.1 €/kW, NM = 25 years, r = 5%).
Parameter and UnitAcceptable Duration of Power Outage a Year TsumLIMIT (h) (%)
438.0 (5)350.4 (4)262.8 (3)175.2 (2)87.6 (1)
Electrochemical Storage Type
PbLi-IonPbLi-IonPbLi-IonPbLi-IonPbLi-Ion
LCOE (€/kWh)0.990.471.200.561.450.762.200.973.421.54
PWT (kW)170.0170.0170.0170.0170.0190.0180.0170.0170.0190.0
PWT% (%)85.185.787.487.485.595.391.786.285.395.5
PPV (kW)29.828.324.429.428.89.316.327.229.39.0
PPV% (%)14.914.312.612.614.54.78.313.814.74.5
Pn (kW)199.8198.3194.4194.4198.8199.3196.3197.2199.3199.0
Energy capacity ke (kWh/kW)2709.32898.42913.52967.32891.12831.42991.82904.02862.92741.2
Total generated power AG (MWh)541.3574.8566.4576.8574.8564.3587.3572.7570.6545.5
Energy fed to heaters AH (MWh)341.0374.0364.0374.0370.0408.0383.0366.0364.0402.0
Required energy ALOAD (MWh)209.0
SSSI (–)2.592.752.712762.752.702.812.742.732.61
Total duration of power outages a year Tsum (h)430.4437.4341.2348.1262.4261.2172.6173.387.687.1
AME (kWh)4303505404706707201100101017601820
Table 7. Comparison of the results of PV-wind hybrid power supply system structure optimization for lead-acid storage with the current and future (*—five years perspective) prices and parameters for a 50 kW peak power communal load with no limit for the power generation system rated power Pn (for: IESPb = IESLi-Ion = 533.3 €/kWh, MES = 22.2 €/kWh, IESLi-Ion = 426.7 €/kWh, MES = 22.2 €/kW, IPV = 1359 €/kW, ITW = 1571 €/kW, MPV = 25.3 €/kW, MWT = 11.1 €/kW, NM = 25 years, r = 5%).
Parameter and UnitAcceptable Duration of Power Outage a Year TsumLIMIT (h) (%)
438.0 (5)350.4 (4)262.8 (3)175.2 (2)87.6 (1)
Type of Electrochemical Storage
Li-IonLi-Ion *Li-IonLi-Ion *Li-IonLi-Ion *Li-IonLi-Ion *Li-IonLi-Ion *
LCOE (€/kWh)0.350.330.470.350.520.400.540.480.810.70
PWT (kW)190.00180.0210.0200.0270.0200.0240.0220.0310.0250.0
PWT% (%)80.683.366.184.774.576.669.364.274.161.0
PPV (kW)45.636.0107.636.192.661.0106.4122.6108.6160.0
PPV% (%)19.416.733.915.325.623.430.735.825.939.0
Pn (kW)235.6216.0317.6236.1362.6261.0346.4342.6418.6410.0
Energy capacity ke (kWh/kW)2823.02613.42164.72889.82707.72726.72570.82468.82674.82535.5
Total generated power AG (MWh)665.1564.5687.5683.7981.8711.7890.5845.81119.71039.6
Energy fed to heaters AH (MWh)485.0437.0507.0503.08000529.0707.0661.0934.00854.0
Required energy ALOAD (MWh)186.3
SSSI (–)3.573.033.693.675.273.824.784.546.015.58
Total duration of power outages a year Tsum (h)437.0432.7348.9349.3253.3257.1165.9174.186.487.1
AME (kWh)120160160170180220230250460470
Table 8. Comparison of the results of PV-wind hybrid power supply system structure optimization for lead–acid storage with the current and future (*—five years perspective) prices and parameters for a 50 kW peak power industrial load with no limit for the power generation system rated power Pn (for: IESPb = IESLi-Ion = 533.3 €/kWh, MES = 22.2 €/kWh, IESLi-Ion = 426.7 €/kWh, MES = 22.2 €/kW, IPV = 1359 €/kW, ITW = 1571 €/kW, MPV = 25.3 €/kW, MWT = 11.1 €/kW, NM = 25 years, r = 5%).
Parameter and UnitAcceptable Duration of Power Putage a Year TsumLIMIT (h) (%)
438.0 (5)350.4 (4)262.8 (3)175.2 (2)87.6 (1)
Type of Electrochemical Storage
Li-IonLi-Ion *Li-IonLi-Ion *Li-IonLi-Ion *Li-IonLi-Ion *Li-IonLi-Ion *
LCOE (€/kWh)0.350.340.390.370.430.420.530.480.690.61
PWT (kW)240.0190.0250.0180.0240.0240.0310.0250.0260.0250.0
PWT% (%)79.677.076.660.265.767.967.261.952.253.3
PPV (kW)61.456.876.2119.1125.3113.4151.1153.9238.2218.9
PPV% (%)20.423.023.439.834.332.132.838.147.846.7
Pn (kW)301.4246.8326.2299.1365.3353.4461.1403.9498.2468.9
Energy capacity ke (kWh/kW)2787.72726.92716.72382.82500.12543.02529.22416.42223.42308.8
Total generated power AG (MWh)840.2673.00886.2712.7913.3898.71166.2976.01107.11082.6
Energy fed to heaters
AH (MWh)
639.0423.0683.0510.0709.0690.0960.0770.0899.0880.0
Required energy
ALOAD (MWh)
209.0
SSSI (–)4.023.224.243.414.374.305.584.675.305.18
Total duration of power outages a year Tsum (h)437.2437.5349.9336.8261.1248.2174.9173.687.387.6
AME (kWh)90160110170130170150220330350
Table 9. Comparison of optimization results (LCOE) of a structure of a PV-wind hybrid power supply system for a 50 kW peak power communal load and Pb and Li-ion batteries (current parameters and prices), for the cases of using 10, 20, 30, 40 and 50% of the energy emitted on the heaters during heating of facilities.
Parameter and UnitAcceptable Power Outage Duration a Year TsumLIMIT (h) (%)
438 (5)350.4 (4)262.8 (3)175.2 (2)87.6 (1)
Type of Electrochemical Storage
PbLi-IonPbLi-IonPbLi-IonPbLi-IonPbLi-Ion
LCOE—0% (€/kWh)0.440.350.480.470.560.520.680.541.130.81
LCOE—10% (€/kWh)0.310.280.330.340.390.360.440.390.670.54
LCOE—20% (€/kWh)0.240.230.250.260.300.280.320.310.470.40
LCOE—30% (€/kWh)0.190.190.200.210.240.220.260.250.370.32
LCOE—40% (€/kWh)0.160.170.170.180.200.190.210.210.300.27
LCOE—50% (€/kWh)0.140.150.150.150.180.160.180.180.250.23
Table 10. Comparison of optimization results (LCOE) of a structure of a PV-wind hybrid power supply system for a 50 kW peak power of industrial load and Pb and Li-Ion batteries (current parameters and prices) for the cases of using 10%, 20%, 30%, 40% and 50% of the energy emitted on the heaters during heating of facilities.
Parameter and UnitAcceptable Power Outage Duration a Year TsumLIMIT (h) (%)
438 (5)350.4 (4)262.8 (3)175.2 (2)87.6 (1)
Type of Electrochemical Storage
PbLi-IonPbLi-IonPbLi-IonPbLi-IonPbLi-Ion
LCOE—0% (€/kWh)0.420.350.490.390.530.430.660.531.000.69
LCOE—10% (€/kWh)0.300.270.330.290.360.320.500.360.600.48
LCOE—20% (€/kWh)0.240.210.240.230.270.250.360.270.430.37
LCOE—30% (€/kWh)0.190.180.190.190.210.210.280.220.330.30
LCOE—40% (€/kWh)0.160.150.160.160.180.180.230.180.270.25
LCOE—50% (€/kWh)0.140.130.140.140.150.160.190.160.230.22
Publisher’s Note: MDPI stays neutral with regard to jurisdictional claims in published maps and institutional affiliations.

