1. Introduction
The development of sustainable manufacturing processes is becoming inevitable for the manufacturing industry. Sustainability does not solely address environmental issues; it also concerns social equity and economic development.
Production time, electrical power and energy consumption, production cost, carbon emissions, waste management, personal health and safety, and water consumption are the major sustainable metrics [
1]. The machinability factors include surface quality, cutting force, cutting temperature, residual stresses, and chip characteristics. Each sustainability factor further consists of sustainability indicators. Sustainability indicators (SIs) are the quantitative or qualitative measures of the sustainability performance of products or manufacturing processes in terms of sustainability aspects. The SIs are classified into two categories, i.e., quantitative indicators and qualitative indicators. The quantitative indicators include CO
2 emission, electrical power and energy consumption, and production cost [
2]. These indicators can be measured physically using instruments or calculated by using equations. However, qualitative indicators are assessed via expert opinion, International Organization for Standardization (ISO) standards, and surveys. It includes personnel health risks, safety, and customer satisfaction.
The sustainable value creation of products and services has become essential. Sustainable values consist of economic, environmental, and societal values. Economic values are relatively easy to calculate. However, environmental and societal values are difficult to obtain from the perspective of manufacturing processes. It is very difficult to define and establish a methodology for the value assessment of societal and other qualitative indicators. Mechanical machining is a widely used operation in the manufacturing industry. Thus, developing a sustainable value framework for advanced lubrication/cooling (lubricooling)-assisted machining processes will be a very effective tool for a machinist.
Initially, it is necessary to understand the existing methods of sustainability assessment since there is a dire need to develop sustainable guidelines based on the triple-bottom approach (TBC), 6R, life-cycle assessment (LCA), and energy, environment, economy (3E) methods. Therefore, it is an essential task to quantify sustainable value generation, which requires the quantification of environmental and societal metrics. The sustainable metrics were selected from the guidelines to develop a sustainability performance evaluation methodology. The proposed methodology defines sustainability metrics based on sustainable guidelines to evaluate the Overall Performance Assessment Indicator (OPAI) at the process level.
2. Literature Review
During the manufacturing processes, machine tools, workers, and equipment come together to add value to the material and produce mechanical parts. Machining is a key process in the manufacturing domain. The performance of machining processes from the machinability perspective has been studied by many scholars [
3,
4]. It is very difficult to machine hard materials, such as Haynes and titanium- and nickel-based alloys. These alloys are used in the aerospace and military industries. In the past, authors have proposed various technological measures to improve the machinability of difficult-to-cut materials [
5].
Jawahir and Jayal [
6] proposed a new methodology for the assessment of sustainability dimensions of the machining process. The authors used empirical and analytical techniques to develop their algorithm to predict the sustainability elements of machined products. Badurdeen et al. [
7] introduced a new approach for sustainable supply chain management (SCM) based on the total life cycle of a product. Unlike conventional practices, the new approach also included recovery, redesign, and remanufacture stages. Joshi et al. [
8] proposed a new closed-loop 6R methodology for sustainable manufacturing. The 6R approach added three more new stages to the recovery, redesign, and remanufacture stages in the traditional approach. Jawahir et al. [
9] worked on the 6R methodology for sustainability assessments in manufacturing processes. However, the authors did not quantify the qualitative indicators. Feng et al. [
10] defined the sustainability-related guidelines of a product for its entire life cycle. The authors considered the stock material preparation, manufacturing, distribution, customer use, and post-use stages to investigate three universal aspects of the TBC. General guidelines for sustainable products were already available in the literature. However, Fiksel et al. [
11] gathered holistic data from various companies and established quantification values through a sustainability performance measurement framework. The framework was based on three aspects, i.e., the triple-bottom approach, resource consumption, and the full life cycle.
Pusavec and Kopac [
12] highlighted the main sustainability indicators, i.e., waste management, environmental issues, electrical energy consumption, machining costs, and personal health and operational safety. In addition, the authors calculated the production cost of dry and cryogenic-assisted machining processes. Reich-Weiser et al. [
13] mainly focused on the sustainability assessment of a material processing industry (GM Motors). The authors established a top-down approach that highlighted the sustainability metrics, including environmental-cost- and energy-consumption-related metrics. In the past, several sustainability performance rating systems have been designed. For example, the Global Report Initiative (GRI) consists of 70 indicators, and the Ford Product Sustainability Index was proposed based on 8 indicators [
14].
Khan et al. [
2] conducted external turning experiments as part of holistic investigations of the nanofluid-assisted machining process. In the experimental study, the authors developed novel empirical models based on the energy, environment, economy (3E) approach. In another study, Priarone et al. [
15] used the 3E approach to find optimal cutting parameters for the conventional emulsion-assisted machining process. Optimal cutting parameters were found for electrical energy demand, production time, cost, and carbon emissions. However, the authors did not address waste management and personal health and safety. Khanna et al. [
16] conducted cryogenic–ultrasonic-assisted turning (CUAT) and cryogenic-assisted turning (CAT) experiments for the machining of Nimonic-90 alloys and investigated the sustainability and machinability aspects. Results revealed that 20% less energy consumption and CO
2 was emitted from CUAT as compared to CAT. In another study, Khanna et al. [
17] reduced power consumption from the ultrasonic-assisted turning of Nimonic-90 alloys. The authors used a hybrid particle swarm with simplex methods (PSO–SM), where it was found that the proposed machining method can reduce the electrical power consumption by 8–10% when compared with ordinary turning. Agrawal et al. [
18] developed a new cryogenic–ultrasonic minimum quantity lubrication-assisted machining setup and used traditional methodology for the analysis of sustainability and machinability aspects. The results showed that the proposed hybrid cooling approach improved sustainability during Ti-6Al-4V turning.
A state-of-the-art review paper on the holistic energy consumption of machine tools was published by Khan et al. [
19]. The review paper reported on various aspects of energy reduction strategies. Mia et al. [
20] considered cutting energy, surface quality, and productivity as response parameters. In addition, the authors used an LCA of cryogenic liquid nitrogen (LN
2)-assisted machining. Numerous efforts are also made for the reduction of CO
2 emissions from the machining process. Sing et al. [
21] compared the electrical energy consumption and carbon emissions between Ranque–Hilsch vortex tube (RHVT) and conventional Minimum Quantity Lubrication MQL-assisted machining processes. The results showed that RHVT has the potential to reduce carbon emissions by 45 to 56% in contrast with conventional MQL. The economic pillar of the TBC approach was also studied by many researchers. In a recent study, Khan et al. [
22] investigated the production of dry machining and mono and hybrid nanofluid-assisted machining processes. Their results showed that the hybrid nanofluid-assisted machining processes produced 4.7% less CO
2 compared to conventional machining methods.
The abovementioned literature reviews mainly focused on either machinability- or sustainability-based investigations of machining processes. Most of the studies were published on conventional, dry, or emulsion-assisted machining. Finding a set of optimal cutting parameters for advanced lubricooling-assisted machining processes has become inevitable. There is a dire need to include sustainability indicators that consider resource consumption as well. For example, energy consumption and carbon emissions from nanofluid and liquid nitrogen have not been addressed before.
Researchers have investigated the sustainability assessment of many manufacturing processes. However, integrating the machinability and sustainability aspects to generate a quantifiable sustainability value is very necessary for understanding the process performance. According to the authors’ best knowledge, sustainable value creation for the advanced lubricooling-assisted machining processes has not been addressed in the past. This research work covered (1) establishing sustainable guidelines for sustainable (dry, nanofluid- and cryogenic-assisted) machining processes, (2) developing an energy-integrated heuristic algorithm for sustainable machining, (3) quantifying environmental and societal indicators to generate a quantifiable sustainability value, and (4) model validation through three case studies.
3. Measuring the Sustainability Value of a Machining Process
The word sustainability can be defined as “development that meets the needs of the present without compromising the ability of future generations to meet their own needs.” Various methods have been adopted to evaluate the sustainability of the machining process. Each study contains a different set of metrics to evaluate sustainability, which makes this process complex.
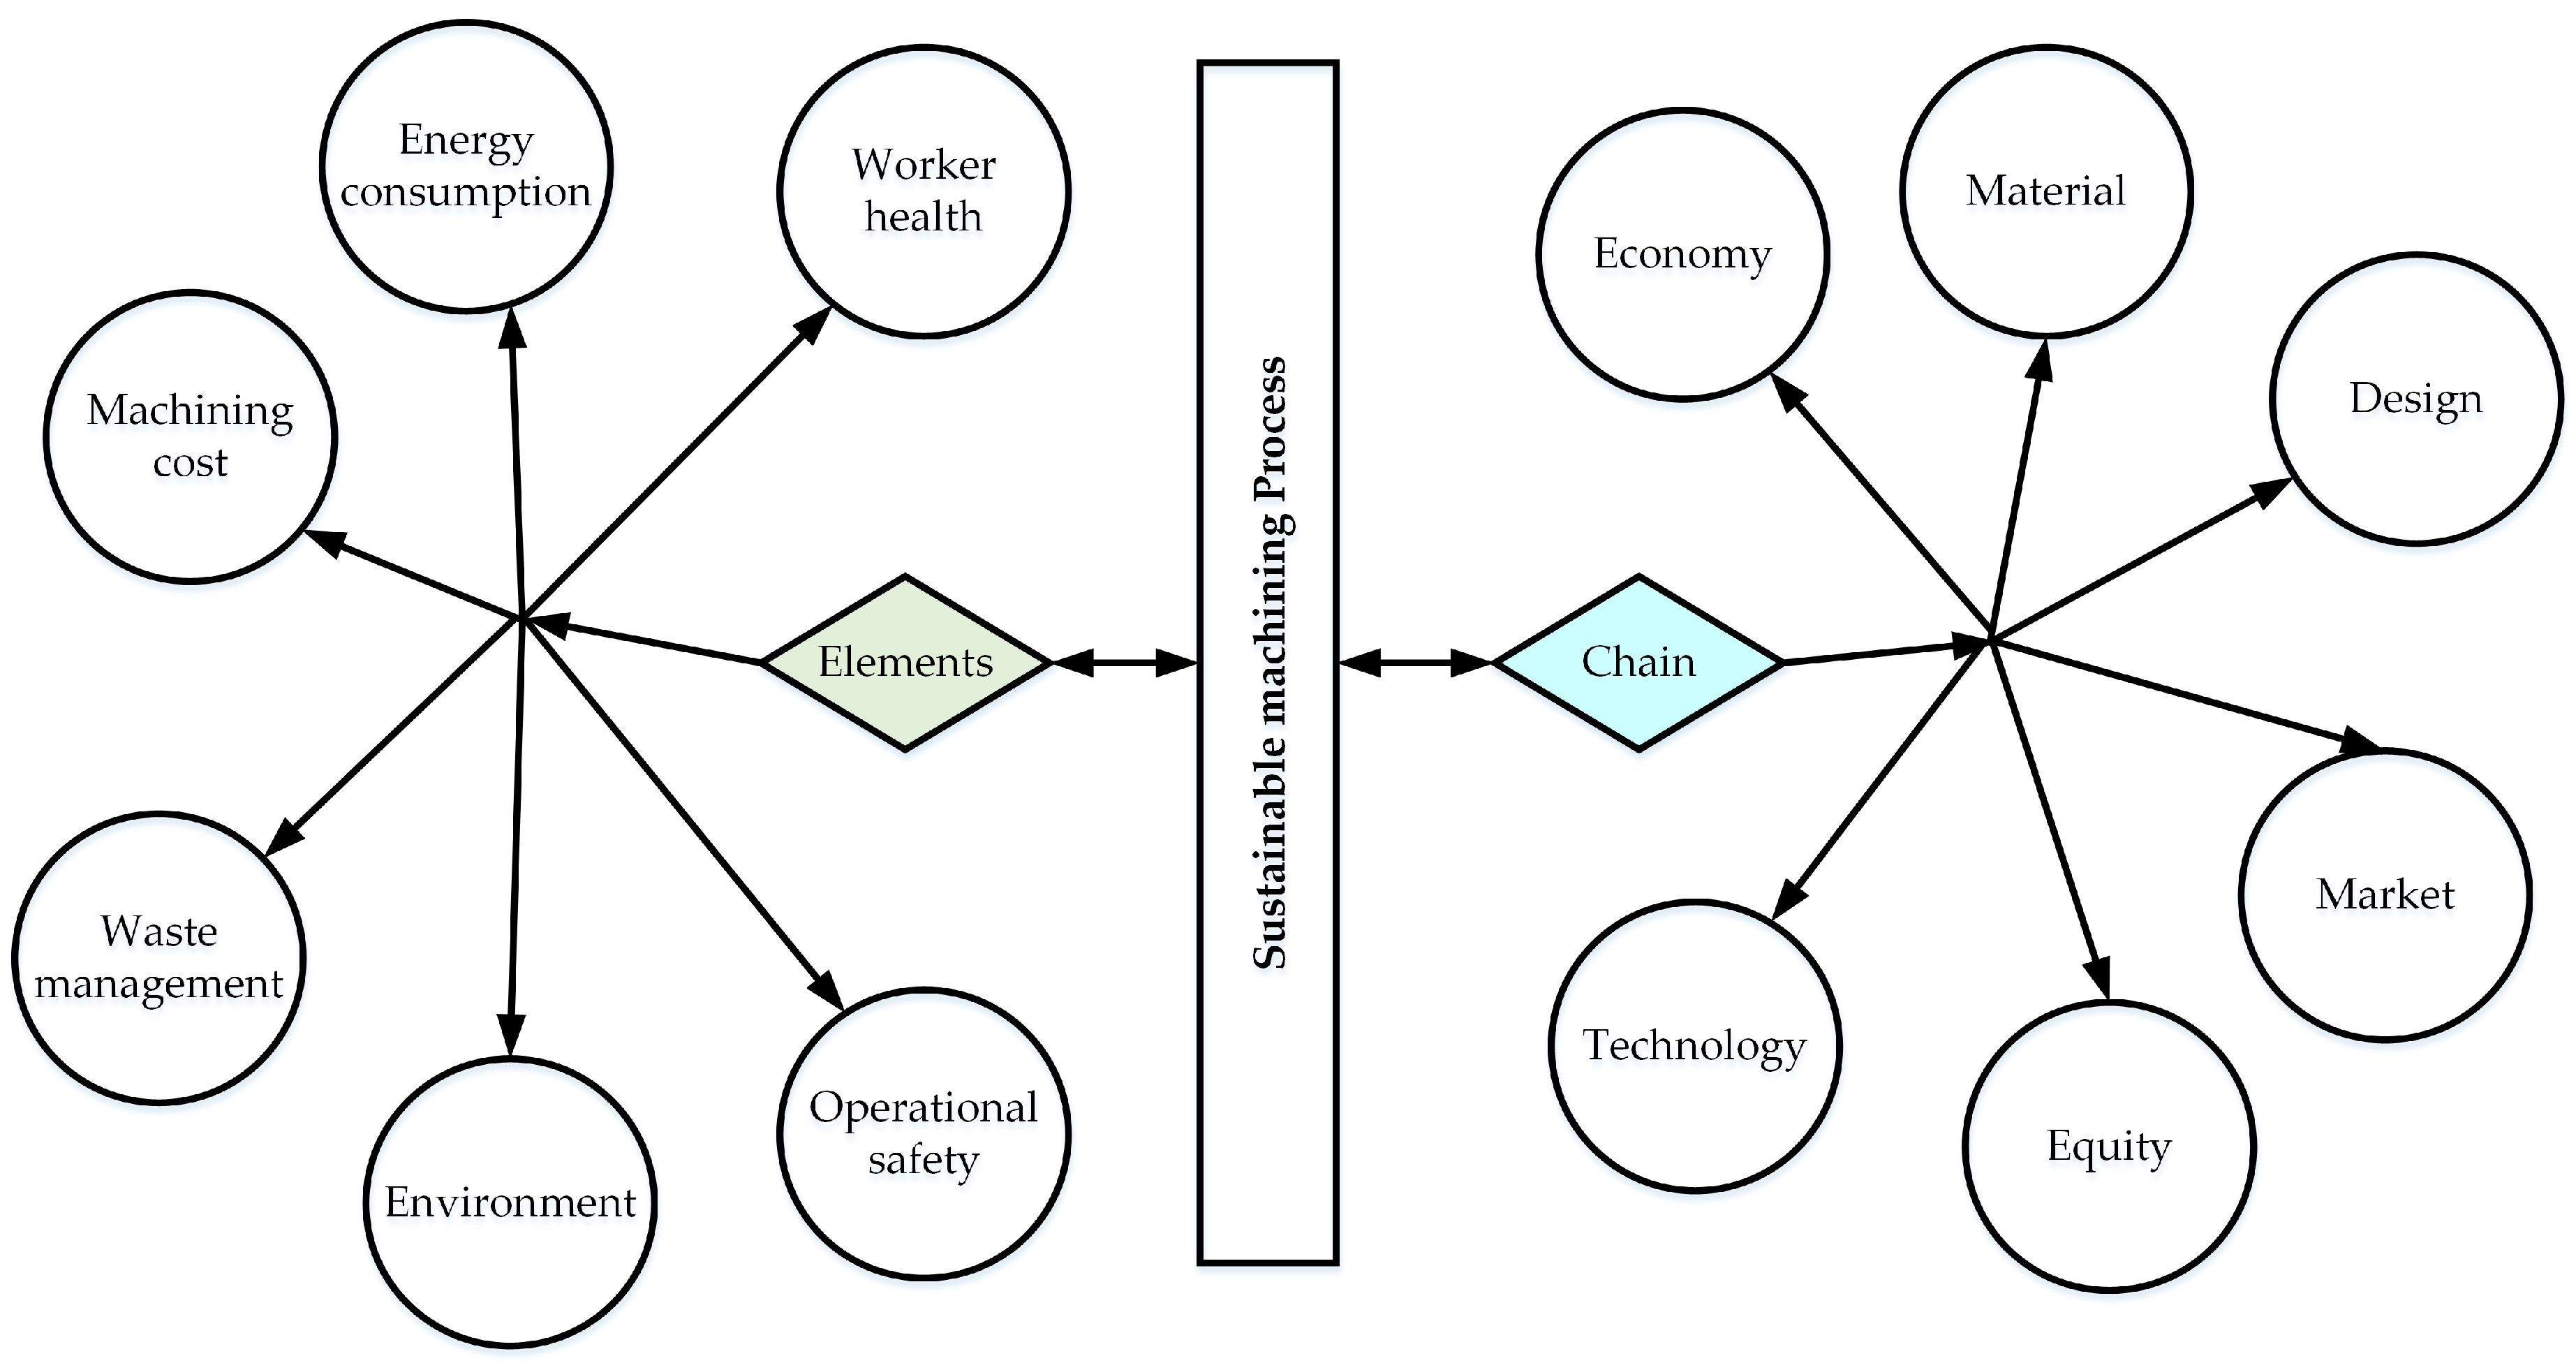
A synergistic and holistic analysis is usually performed for the evaluation of the sustainability of a machining process. Sometimes, the life cycle assessment of production has been used as a sustainability assessment of the machining process. Several elements can be studied for the sustainability assessment, which are shown in
Figure 1.
In the past, researchers studied the machining process from a sustainability point of view and made sure the process should have a lower environmental burden, be eco-benign, be harmless to worker health, and most importantly, it must be economical. The sustainability of the process also mainly depends upon the system boundary selected. If the system boundary is small, only a few indicators can be selected for the process evaluation [
23]. For a holistic analysis, four stages are commonly considered, namely, acquisition of raw material, manufacturing, use/reuse, and recycle and waste management.
The National Council for Advanced Manufacturing (NACFAM) accentuated the “sustainable” products and “sustainable manufacturing” in the metal processing industry [
24]. In another study, it was stressed that sustainable manufacturing must improve not only the resource and machine tool energy but also reduce environmental impacts. Furthermore, it must offer greater safety and produce minimal waste without compromising the quality of the workpiece [
6]. In the past, researchers used the three following major concepts repeatedly to evaluate the sustainability of the specific process.
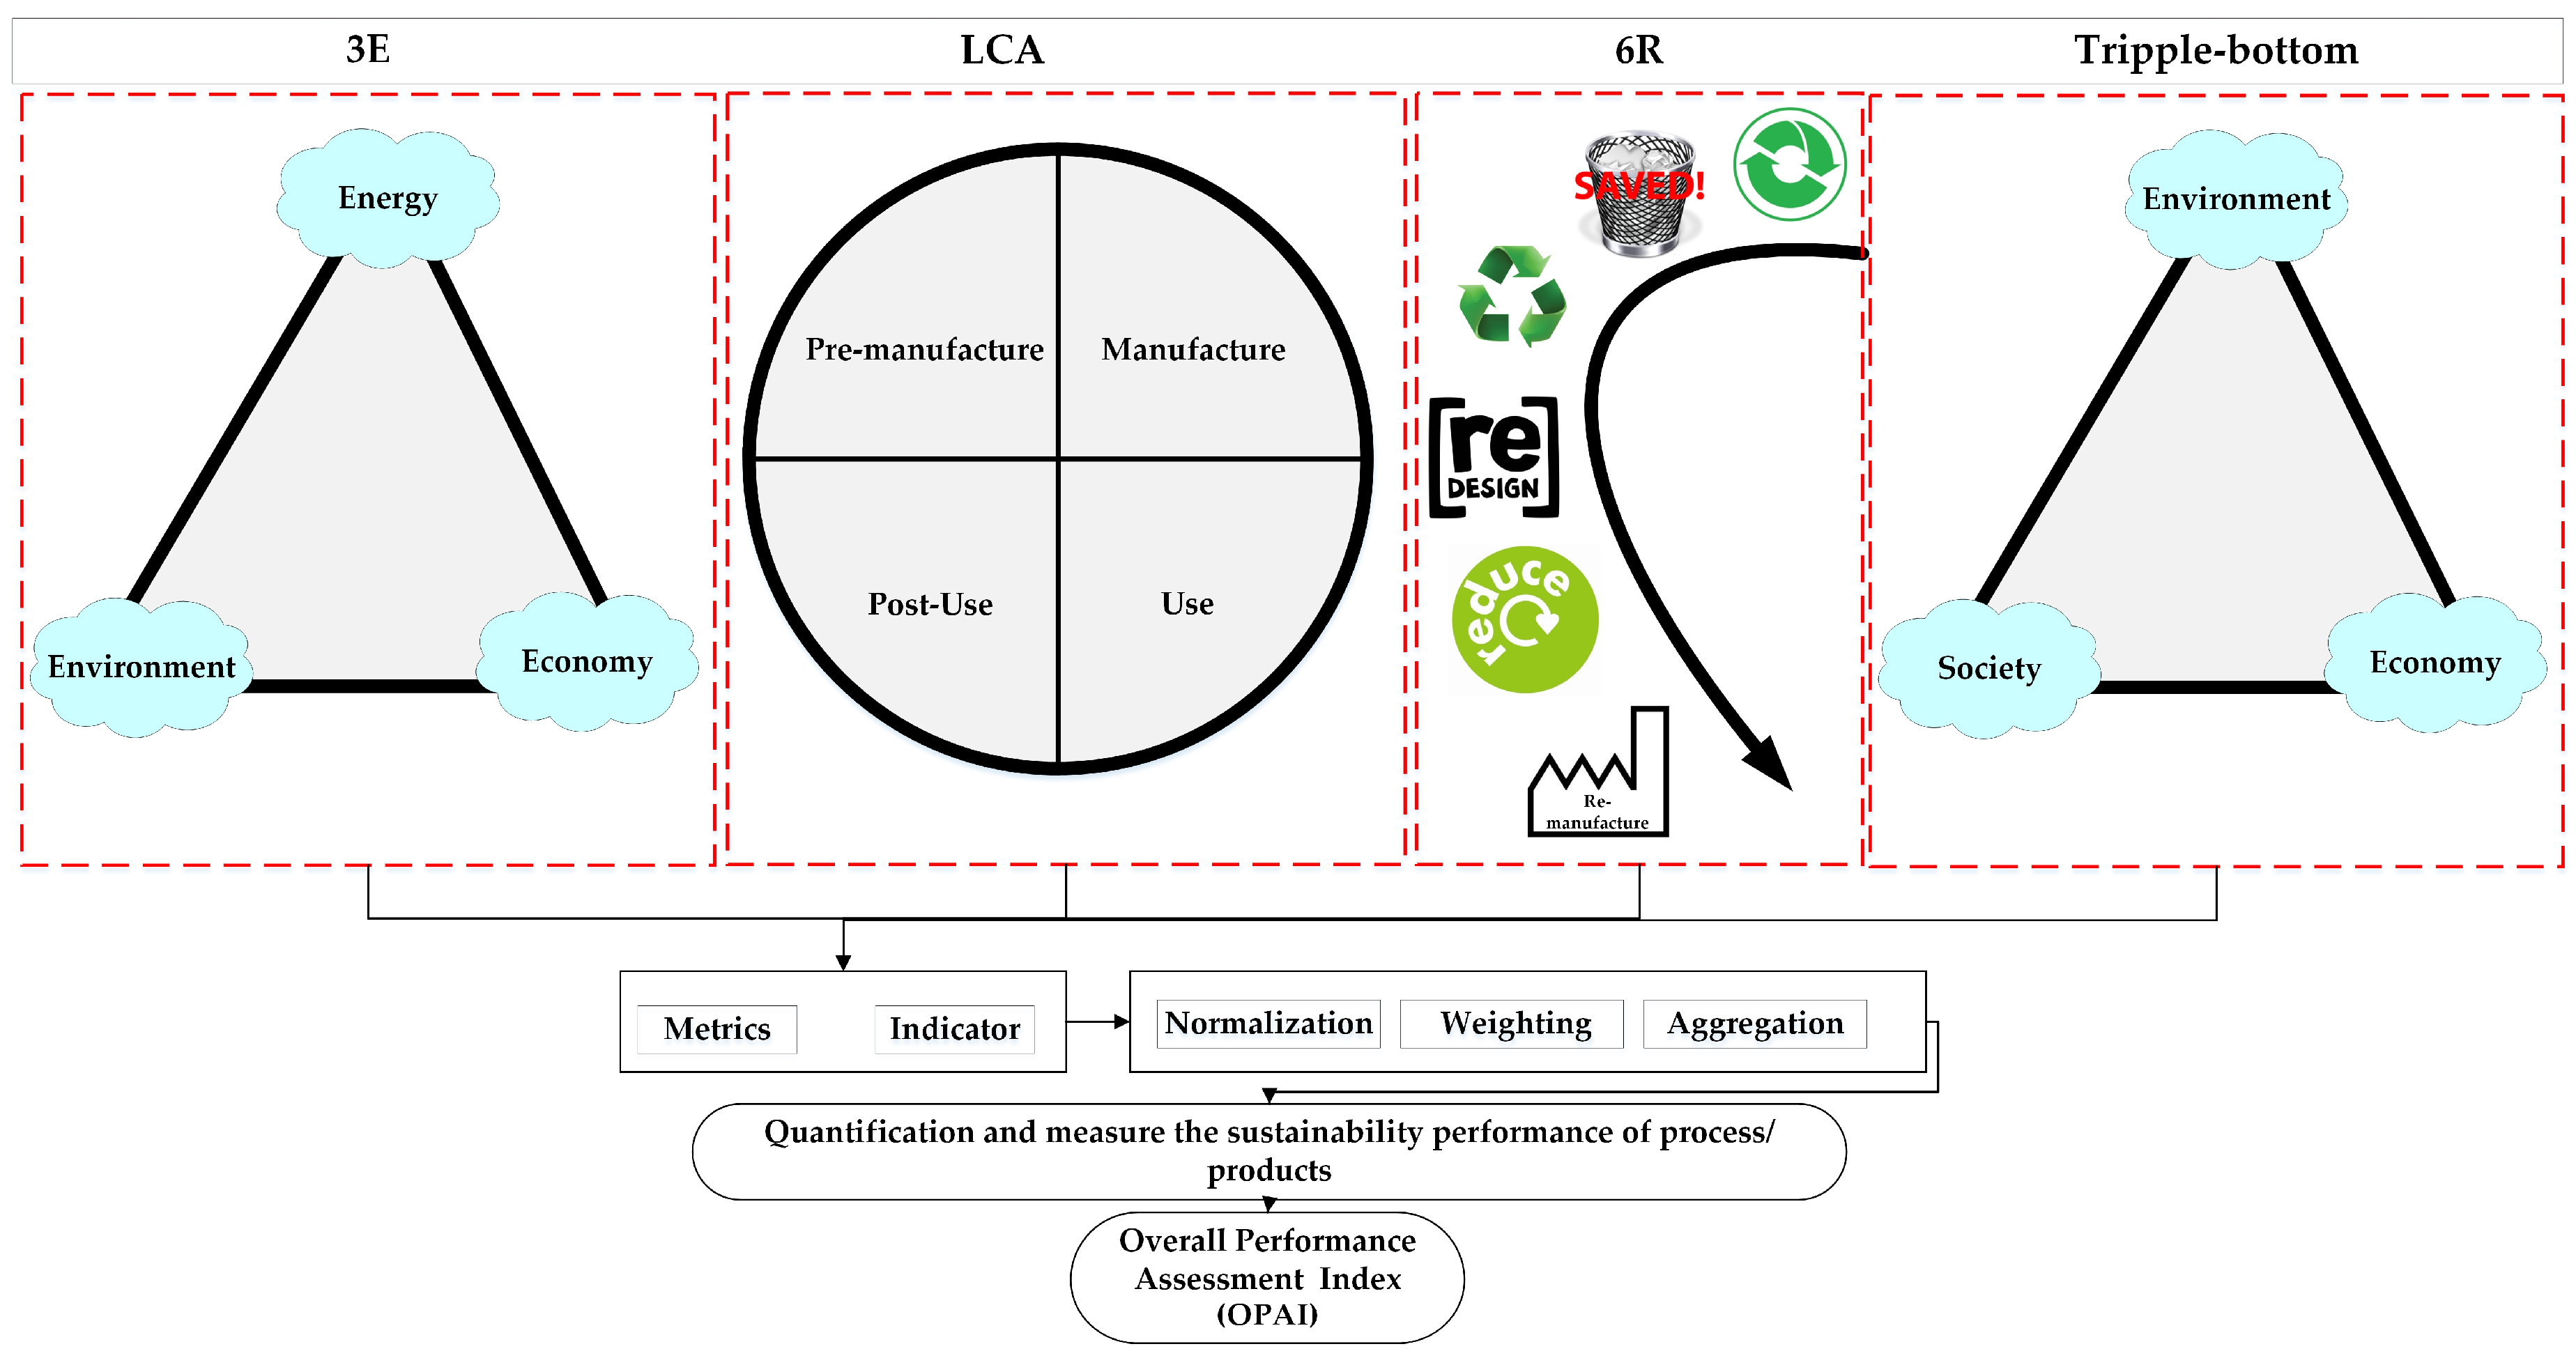
3.1. 6R Approach
The six stages named reduce, reuse, recycle, recover, redesign, and remanufacture are often called the 6R approach. The stages demonstrate the material flow through the system boundary. The 6R approach starts with reduce, which emphasizes the reduction of resource consumption. For example, recently, advanced manufacturing technologies have been proposed that can reduce resource consumption without compromising process efficiency. This approach also emphasizes the reuse and recycling of products, which can reduce the severe impacts of energy-intensive processes on the environment. Redesigning the already built technology is essential for improving the performance of the process. During the redesign stage, the environmental burden of the products and the process are considered. Similarly, natural resources, energy, and costs can be saved by remanufacturing the products. Hence, the 6R approach is an effective way to analyze the sustainability of the process. However, it is necessary to quantify the sustainable values of the 6R approach. The concept of the 6R approach is shown in
Figure 2.
3.2. Triple-Bottom Approach
In conventional practice, only the manufacturing cost is evaluated, and based on this cost estimation, the environmental and societal impacts are assessed. However, a TBC works in a holistic system and considers the economic, environmental, and societal aspects as three fundamental pillars of sustainability. A separate sustainable value for each metric can be achieved for the environmental and economic impacts of a specific process.
The manufacturing process needs renewable and non-renewable resources to produce industrial products for the welfare of society. The triple bottom line makes sure that the resource consumption is low to reduce the process’s impact on society and the environment. In the past, researchers evaluated the triple-bottom approach as a qualitative tool analysis [
7]. However, it is necessary to develop a state-of-the-art heuristic algorithm that can quantify sustainability values. The triple-bottom approach is displayed in
Figure 2.
3.3. Life-Cycle Assessment
Cradle-to-grave analysis of discrete part production is often performed by considering the total life-cycle assessment, which includes four stages: pre-manufacturing, manufacturing, use, and post-use, as highlighted in
Figure 2. In an LCA, each phase deals with various processes and it needs to incorporate various stakeholders. Thus, the sustainability assessment of each phase depends upon its factors and the average impact of all phases is taken into consideration to evaluate the process. The various environmental effects of products and services are quantified and compared, the obtained results are used to make the best decision and improve the process [
25].
3.4. 3E-Based Assessment
3E-based analysis is another method that is used to evaluate the sustainability of a machining process. The three Es stand for energy, environment, and economy [
2]. These three approaches are different from LCA as it replaces society with high concern for energy consumption. Researchers have employed the 3E-based sustainability method in processes such as gas generation systems [
26]. However, the same concept can also be used to evaluate the sustainability of a machining process. However, an assessment of the machining process alone is not enough to achieve sustainability targets. Thus, in this paper, sustainable guidelines are proposed for the 3E assessment method by including the engineering means for the evaluation of the used technology. After introducing all the guidelines from the sustainability indicators, a novel OPAI was proposed.
4. Guidelines for Sustainable Machining
A few years ago, Badurdeen et al. [
27] studied the major metrics and indicators involved in the manufacturing process and proposed a guideline for sustainable manufacturing. The authors studied some of the indicators under major metrics. The same concept was used for our specific machining process to develop an extended guideline for the process. Production time, electrical power, energy consumption, cost, waste management, worker health, and the safety and environmental impacts were considered as the metrics for the manufacturing process. The guidelines for each metric are provided in the following sections.
4.1. Production Time
Production time is an important parameter that directly influences both electrical energy and resource consumption. Machining time during the turning process consists of the idle time and the setup time. It is worth mentioning that the setup time is the sum of the workpiece, cutting tool setup time, and handling time. The air cutting time is the time when the tool moves but does not cut the workpiece. Similarly, the cutting, tool change, and cooling and lubrication time are also part of the total machining time [
28]. It is essential to highlight the indicators in the production time metrics. For example, the standby time is the sum of the setup time and the idle time. The setup time includes two stages, the cutting tool change stage and the workpiece handling stage. During the cutting time, the workpiece and cutting tool interact with each other, and material is removed by the cutting mechanism. Furthermore, other time factors, such as the transportation time, storage time, and cleaning and disposal time, also affect the overall sustainability of processes.
4.2. Power and Energy Consumption
The power demands from the different components of machine tools vary and it is tough to determine each component’s demand. The power structures in the machining process change with the functionality states of the machine tools. However, in general, maximum power is consumed when all components of the machine tool are active. These components consume power in the functional stages of a machine tool. These stages are idle, set up, air cutting, cutting, tool change, and lubrication and cooling. Energy consumption is the second important metric considered under the guidelines of a sustainable machining process. Sustainability indicators related to energy consumption are considered in the guidelines and are shown in
Table 1. The measurements of sustainability indicators under the domain of energy consumption are described in detail in [
22].
4.3. Cost
One of the most important parameters for a performance evaluation is an economic comparison. The cost model presented in Kalpakjian et al. [
29] showed major limitations. It described the production cost defined as the sum of the (1) machining cost, (2) tool change cost, and (3) cutting tool cost. However, costs due to non-cutting stages, particularly the lubrication stage and the advanced lubricooling process (MQL and cryogenic) were not addressed in detail. Hence, new cost models were developed to estimate the cost per part of sustainable and non-sustainable techniques. It is important to mention that the energy cost, machining cost, cutting tool cost, LN
2 cost, MQL oil cost, emulsion cost, cleaning and disposal cost, and environmental cost should be considered.
In the present study, a lot of indicators were included for the cost metrics (
Table 2). The general guidelines about costs demonstrate the details about all indicators of the cost measurement. Dry, MQL, Nanofluid MQL NFMQL, cryogenic, and hybrid CryoMQL assisted machining processes are the best examples of sustainable machining. Most of the indicators in all kinds of lubricooling-assisted machining processes are the same, such as the cutting tool cost, workpiece cost, and coolant cost. However, some cost components are specific for specific processes. For example, the cost of nanoparticles and the cost of nanofluid preparation is only used for NFMQL-assisted machining processes. Thus, guidelines for sustainable machining processes are given herein. The measurements of the sustainability indicators under the domain of energy consumption are described in detail in [
2].
4.4. Waste Management
Waste management is a very important process in industrial workshops, and ISO has imposed some standards to keep the workshop clean. Badurdeen et al. [
27] discussed several indicators that are used to assess the sustainable value of waste management. However, some additional indicators were also considered in this study.
The
WMrms can be calculated from the ratio of the total mass of the remanufactured scrap (
mrms) and total mass of the scrap (
ms). It can be defined as in Equation (1):
Recycle chips are quantified as the ratio of the total mass of recycled chips (
mrc) to the mass of the total chips (
mchip). It can be expressed as follows:
During the recycling process, not all chips can be recycled, where some of those that do not qualify for recycling must be disposed of properly. Chip disposal can also be quantified as the ratio of total disposed chips (
mdc) to the total mass of the chips:
Cutting tools are a major part of recycled scraps. Tool holders and fixtures also face wear and tear, but they have relatively long lives. Thus, recycled scrap can be defined as the ratio of the total mass of all kinds of recycled scrap to the total mass of scrap:
It is also a fact that not all scrap can be recycled or remanufactured. Scrap with extremely bad quality is separated and must be disposed of. The sustainable value of disposed scrap can be defined as the ratio of the total disposed scrap to the total mass of scrap, as shown in Equation (5):
During the MQL spray, a mist is generated, and quantification of the mist generation is necessary. It can be quantified as the ratio of the mist generated to the total mass of the spray, as follows:
Unlike MQL, during a flood-assisted machining process, cutting fluid is not used one time and it can be recycled after its life. It can be expressed as the ratio of the recycled metalworking to the total mass of the metalworking fluid, as follows:
The disposal of MWFs is inevitable after their application in a workshop. The disposal of cutting fluids can be defined as the ratio of the disposed of cutting fluid to the total cutting fluid used:
During the break time of the maintenance of a machine tool, unnecessary electrical appliances must be switched off to reduce electricity consumption. Work idle time during the shift time is also a major factor for idle electricity consumption. It can be demonstrated as the ratio of the idle electricity used to the total electricity used:
4.5. Personal Health and Operational Safety
It is also necessary to define guidelines for the personal health and safety of workers. Very little literature is published on the guidelines for worker health and safety for advanced machining processes. In this work, six indicators for worker health and safety were included.
The noise levels in a workshop significantly affect workers’ health. The indicator of the noise level can be classified into two parts. A noise level up to 90 dB is assigned 1 and a noise level of more than 90 dB is assigned value 2. The quantification of the noise level helps to reduce noise pollution.
The environmental conditions indicator Pec defines the working atmospheric conditions of workshops in metal processing industries. A sustainable value of Pec can also be assigned a 1 or a 2. The values 1 or 2 are assigned according to the wet-bulb globe temperature. If the measured value of the temperature is up to 28 °C (82 F), it is assigned a value of 1, and a value of 2 is assigned for higher values. It is pertinent to mention that these values do not require previous criteria and are selected manually.
The illumination level of the working environment is expressed in the personal health index Phi. If the illumination level is less than 807 lux (75 fc), it is given a value of 1, and if it is more than 807 lux (75 fc), then a value of 2 is assigned.
The total injuries rate is an alarming indicator under the personal health and operational safety metric. Several injuries per shift or per project are counted and its sustainable values are assigned according to the protection time according to ISO rules and regulations.
This includes dust, mists, and the application of toxic chemicals. The exposure to corrosive substances can be explained as the exposure of all kinds of corrosive substances that are toxic to workers and the environment. It can be measured in incidents per person per processing time. Emissions that cause negative effects are scored as either 1, 2, or 3, which depends upon the type of fluid used and the percentage concentration of nanoparticles used.
During the machining of difficult-to-cut materials, the machinist has to face high-temperature surfaces. The sustainable values of this indicator are assigned according to the value of the temperature. Mostly, temperature values are categorized into two levels, where level 1 represents the temperature values less than 600 °C and temperature values that are more than 600 °C lie within the second category.
The machine tool uses its maximum energy consumption during the machining process. In academia, mostly lower power rating machine tools are used. However, machine tools with total power up to 200 kW can be found in the industry. In this scenario, some components are energy-intensive and the worker may get injured while power measurements. It can be quantified as the injuries per person.
Exposure to high-speed components/surfaces is an independent indicator. The sustainable value of this indicator can be assigned as either 1 or 2, where it mainly depends upon the range of the cutting speed. For example, a cutting speed less than 900 rpm is assigned a value of 1 and a cutting speed of more than 900 rpm is assigned a value of 2.
4.6. Environmental Impacts
Environmental impacts are mostly characterized in terms of the CO2 emissions during the cutting process. These CO2 emissions are due to different components and/or different stages. The carbon emissions signature of the Nanjing power grid was used to find the sustainable values of the indicators. Some additional guidelines are as follows.
Direct and indirect activities that use energy also contribute to carbon emissions. As such, during the machining process, each process stage contributes to carbon emissions depending upon the corresponding process time. The total carbon emissions for the machining process is the sum of the carbon emissions due to computer numerical control (CNC)-machine-related activities and carbon emissions due to ancillary components. In this model, the carbon emissions for cleaning and disposal activities are also considered. The carbon emissions during each stage are calculated.
CO
2 emissions due to the electrical energy consumption of a machine tool mimic the trends of the cutting energy. Carbon emissions are negative outcomes of power generation because power generation requires coal, oil, gas, and biomass [
30]. The electrical energy produced by different types of fuels and its information is given in
Table 3.
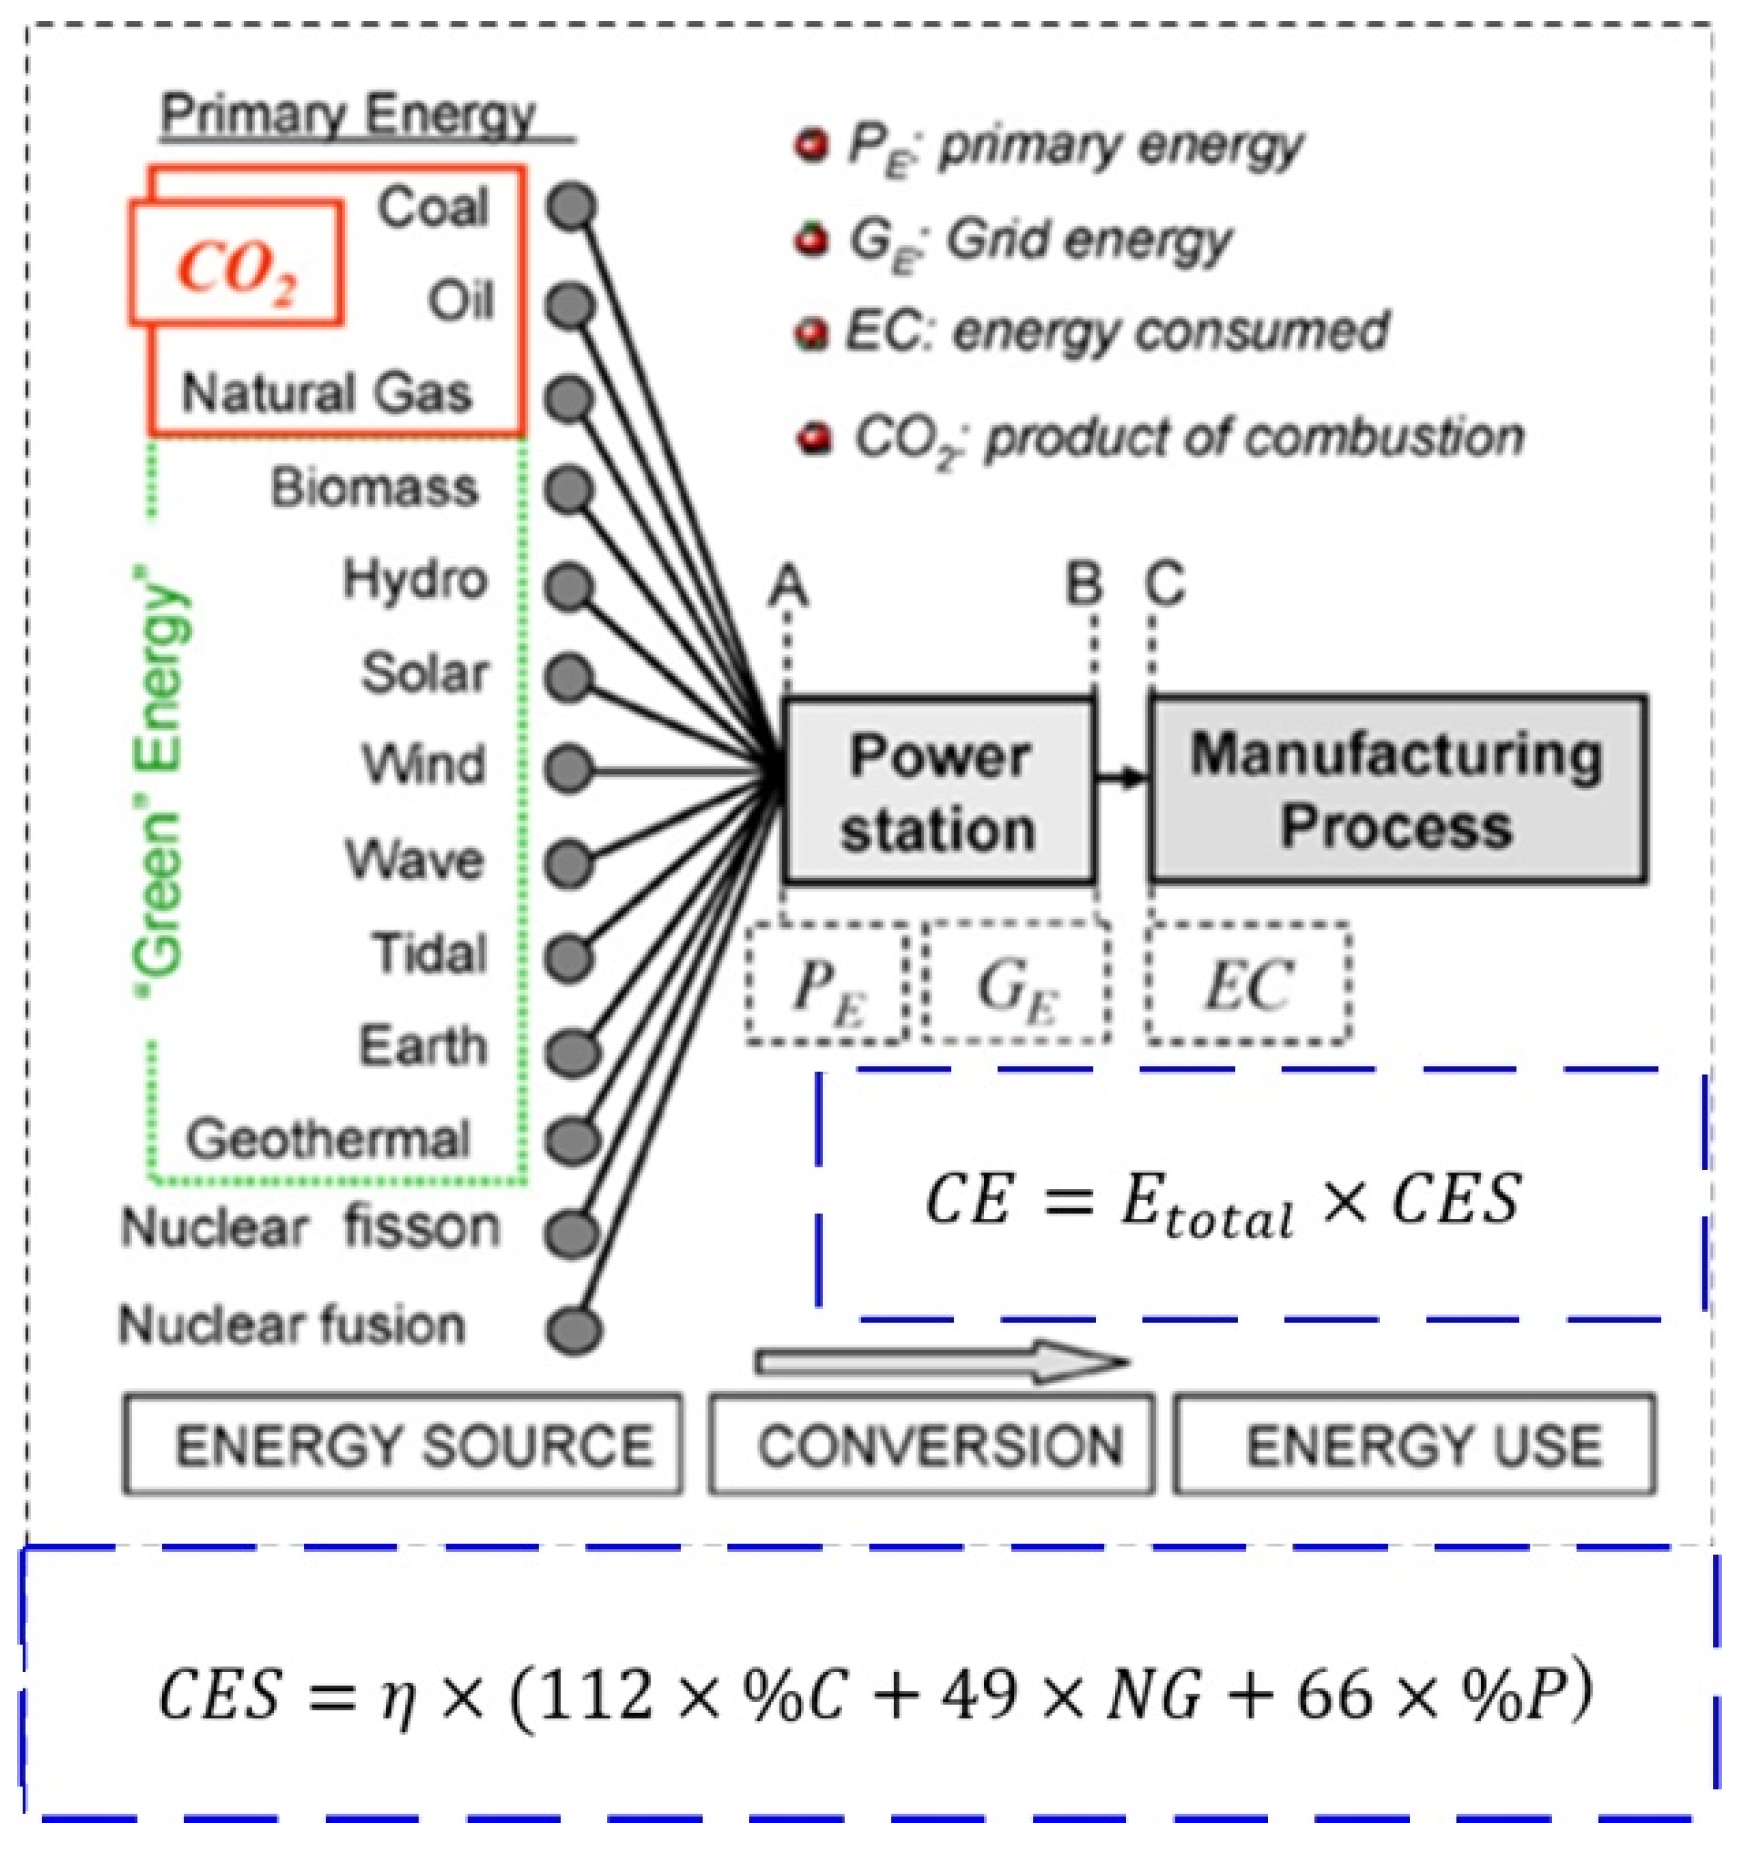
The complete combustion of coal emits a huge amount of CO
2. For example, the combustion of 1 ton of coal generates 2.86 tons of CO
2. Various types of fuels used to produce electricity are depicted in
Figure 3. Three power grids of different countries and their input fuel types are tabulated in
Table 4.
The total carbon emitted in the process can be obtained by total energy consumption multiplying by carbon emission signature (
CES).
where
CE is the amount of total Carbon Emission and
Etotal is a total electrical energy consumption.
Usually, a local power grid has multiple primary energy sources and their abbreviations have been listed in
Table 4. Every power grid has a specific
CES, which mainly depends upon the input source used to produce the electricity. Before the assessment of the carbon emissions in the machining stages, it is essential to determine the carbon emission signature:
The carbon emissions per part due to the machining stages can be calculated as follows:
Em and CEm are electrical energy and its footprints for part production, respectively.
As discussed earlier, the fabrication of cutting tools is an intensive process and environmental impacts of the fabrication of cutting tools can be obtained from the literature. The carbon emitted per part due to fabricating a cutting tool can be explained as:
where
CFCT is the carbon factor of the cutting tool and
TL is life of cutting tool. Carbon emissions due to
LN2.
Usually, it is considered that flood-assisted machining process is not environmentally friendly. However, if the environmental impacts of
LN2 are also included in the component-stage-based emissions-oriented (CSEO) model, the results could be significantly different. According to the authors’ best knowledge, this is the first study to analyze the impacts of
LN2 production on the environment. The CE per part due to
LN2 can be defined as:
where
is the carbon factor of liquid nitrogen,
ta is an air cutting time and
is flow rate of
LN2.
Even though MQL oil is used in a minimal quantity and has low environmental impacts, it is used one time (non-recoverable) and it cannot be neglected if used in an industrial environment where the cutting processes may continue for several hours. Therefore, the
CE per part due to MQL oil can be defined as:
The emissions due to the application of emulsions during the machining process can be obtained as follows. Where S denotes the flow rate and consumption of emulsion and
is the carbon footprints of emulsion.
The need for cleaning in the machining process is inevitable when emulsions are used. Environmental impacts or carbon emission factor of cleaning-related activities can be found in the literature. Hence, the
CE due to the cleaning stage is:
It is important to mention that CFcl is a carbon factor of the cleaning process and V is volume of material removed. The units of CF vary according to the process.
ISO and some governmental organizations have stringent rules about the disposal of metalworking fluids used in the machining process. Thus, it is necessary to include the carbon emissions of the disposal stage (
CFdisposal) in the system’s boundary:
Performance indicators are essential for studying the impact of the machining process on the environment. It is essential to determine the contribution of the cutting stages on the CO
2 emitted per part produced. Thus, the fraction of
CEm and carbon emission per part (
CEP), called the CO
2 emissions indicator (
CEI). It can be defined as:
It is a fact that cutting fluids are disposed of using various methods after use. Carbon emissions due to the distilling method used to dispose of the cutting fluids are measured in kilograms of CO2 per liter.
It is important to quantify the carbon emission due to the disposal of spindle lubricants. It is also measured in kilograms of CO2 per liter.
4.7. Water Consumption
Thousands of gallons of water (Wa) are consumed in machining workshops monthly. This water is also considered to be an important metric for evaluating sustainability. The sustainability values of water consumption for sustainable machining processes have not been included in the guidelines before. Pervaiz et. al [
32] published a state-of-the-art review study on water consumption in the machining process. The guidelines can be obtained in the authors’ study. The quantification of this sustainable metric is mainly obtained in terms of the quantity of water used in the workshop.
5. Energy-Integrated Heuristic Algorithm for Sustainable Machining
In the past, a bulk of published literature can be a fund which only focuses on finding the optimal cutting condition of the process [
33]. Different research groups tried to find optimal cutting conditions according to specific criteria and constraints. For example, researchers found the cutting parameters according to the best machining characteristics, such as the quality of the workpiece [
34]. On the other hand, a second group of scholars optimized the cutting parameters for the minimum environmental impacts of the machining process [
35]. A third group tried to minimize the machining costs to get economic benefits and optimized machining parameters [
15]. Similarly, cutting parameters were also optimized for the best tool design and a longer tool life. However, optimal sustainable parameters obtained by considering machinability, economic, and environmental aspects are not studied in detail for advanced machining technologies.
Thus, the purpose of the proposed algorithm was to find the optimal machining parameters and their levels by considering the sustainability indicators explained in the last section (
Section 4) and also the machinability characteristics. The proposed energy-integrated heuristic algorithm for sustainable machining offers the OPAI, which indicates the performance of the whole machining process in a holistic system. The proposed algorithm can deal with all kinds of qualitative and quantitative algorithms, regardless of whether they are considered to be “the higher the better” or “the lower the better.” In summary, the proposed algorithm was based on a heuristic approach and is a very useful tool for solving multi-criteria decision making (MCDM) problems in sustainable machining. The methodology used to find the sustainability values of process/products can be found in
Figure 2. Several variables along with notations and explanations are explained in
Table 5.
In the first step, experimental cutting test results are used along with sustainability indicators to get sustainability factors. Equations (20) and (21) define the sustainability factors. If each machining response (
Mrz) and sustainability indicator (
Imi) have the same status, i.e., the lower the better or the higher the better, then the sustainability factor can be obtained as follows:
However, if the machining response and sustainability indicator have opposite statuses, i.e., one is the higher the better, and the other is the lower the better, it can be calculated as follows:
Sustainability factors for each experimental test are calculated. From the sustainability factors, the optimal sustainability factors are calculated and used to find the sustainability index of each test. In this step, normalization or scaling of each response is performed. If
SFminz is based on the lower the better, the sustainability index can be defined as:
However, if
SFminz is based on the higher the better, the sustainability index can be defined as:
It is worth mentioning that the maximum value of SIminz will be 1. Once the SIminz’s are obtained, different weights can be assigned to calculate the weighted sustainability index.
Weights are assigned to the obtained
SIminz’s, where the weight assignments are highly dependent upon the user’s choice. Sometimes, all responses are considered equally; however, in industrial applications, some metrics are considered to be more important than others. For example, for aerospace- and defense-related products, surface quality is considered to be the most important metric compared to energy consumption. Weights can also be assigned according to expert opinion. In this work, the grey entropy method [
36] was used to calculate the weights for
SIminz:
The last step of the algorithm is to calculate the total weighted sustainability index. It can be calculated using Equation (25):
7. Conclusions
In the present work, holistic sustainable guidelines were developed for cryogenic- and nanofluid-assisted MQL machining processes. Based on the guidelines, a heuristic algorithm was proposed, which not only addressed sustainability metrics but also incorporated the machinability characteristics. A set of new optimal cutting parameters were found based on both the machinability (measured in case studies) and sustainability indicators (added in the algorithm).
Seven major sustainability metrics (time, electric power, energy, cost, emission, waste, and water consumption) were considered in the proposed algorithm. From the sustainable guidelines, several indicators were evaluated under each metric.
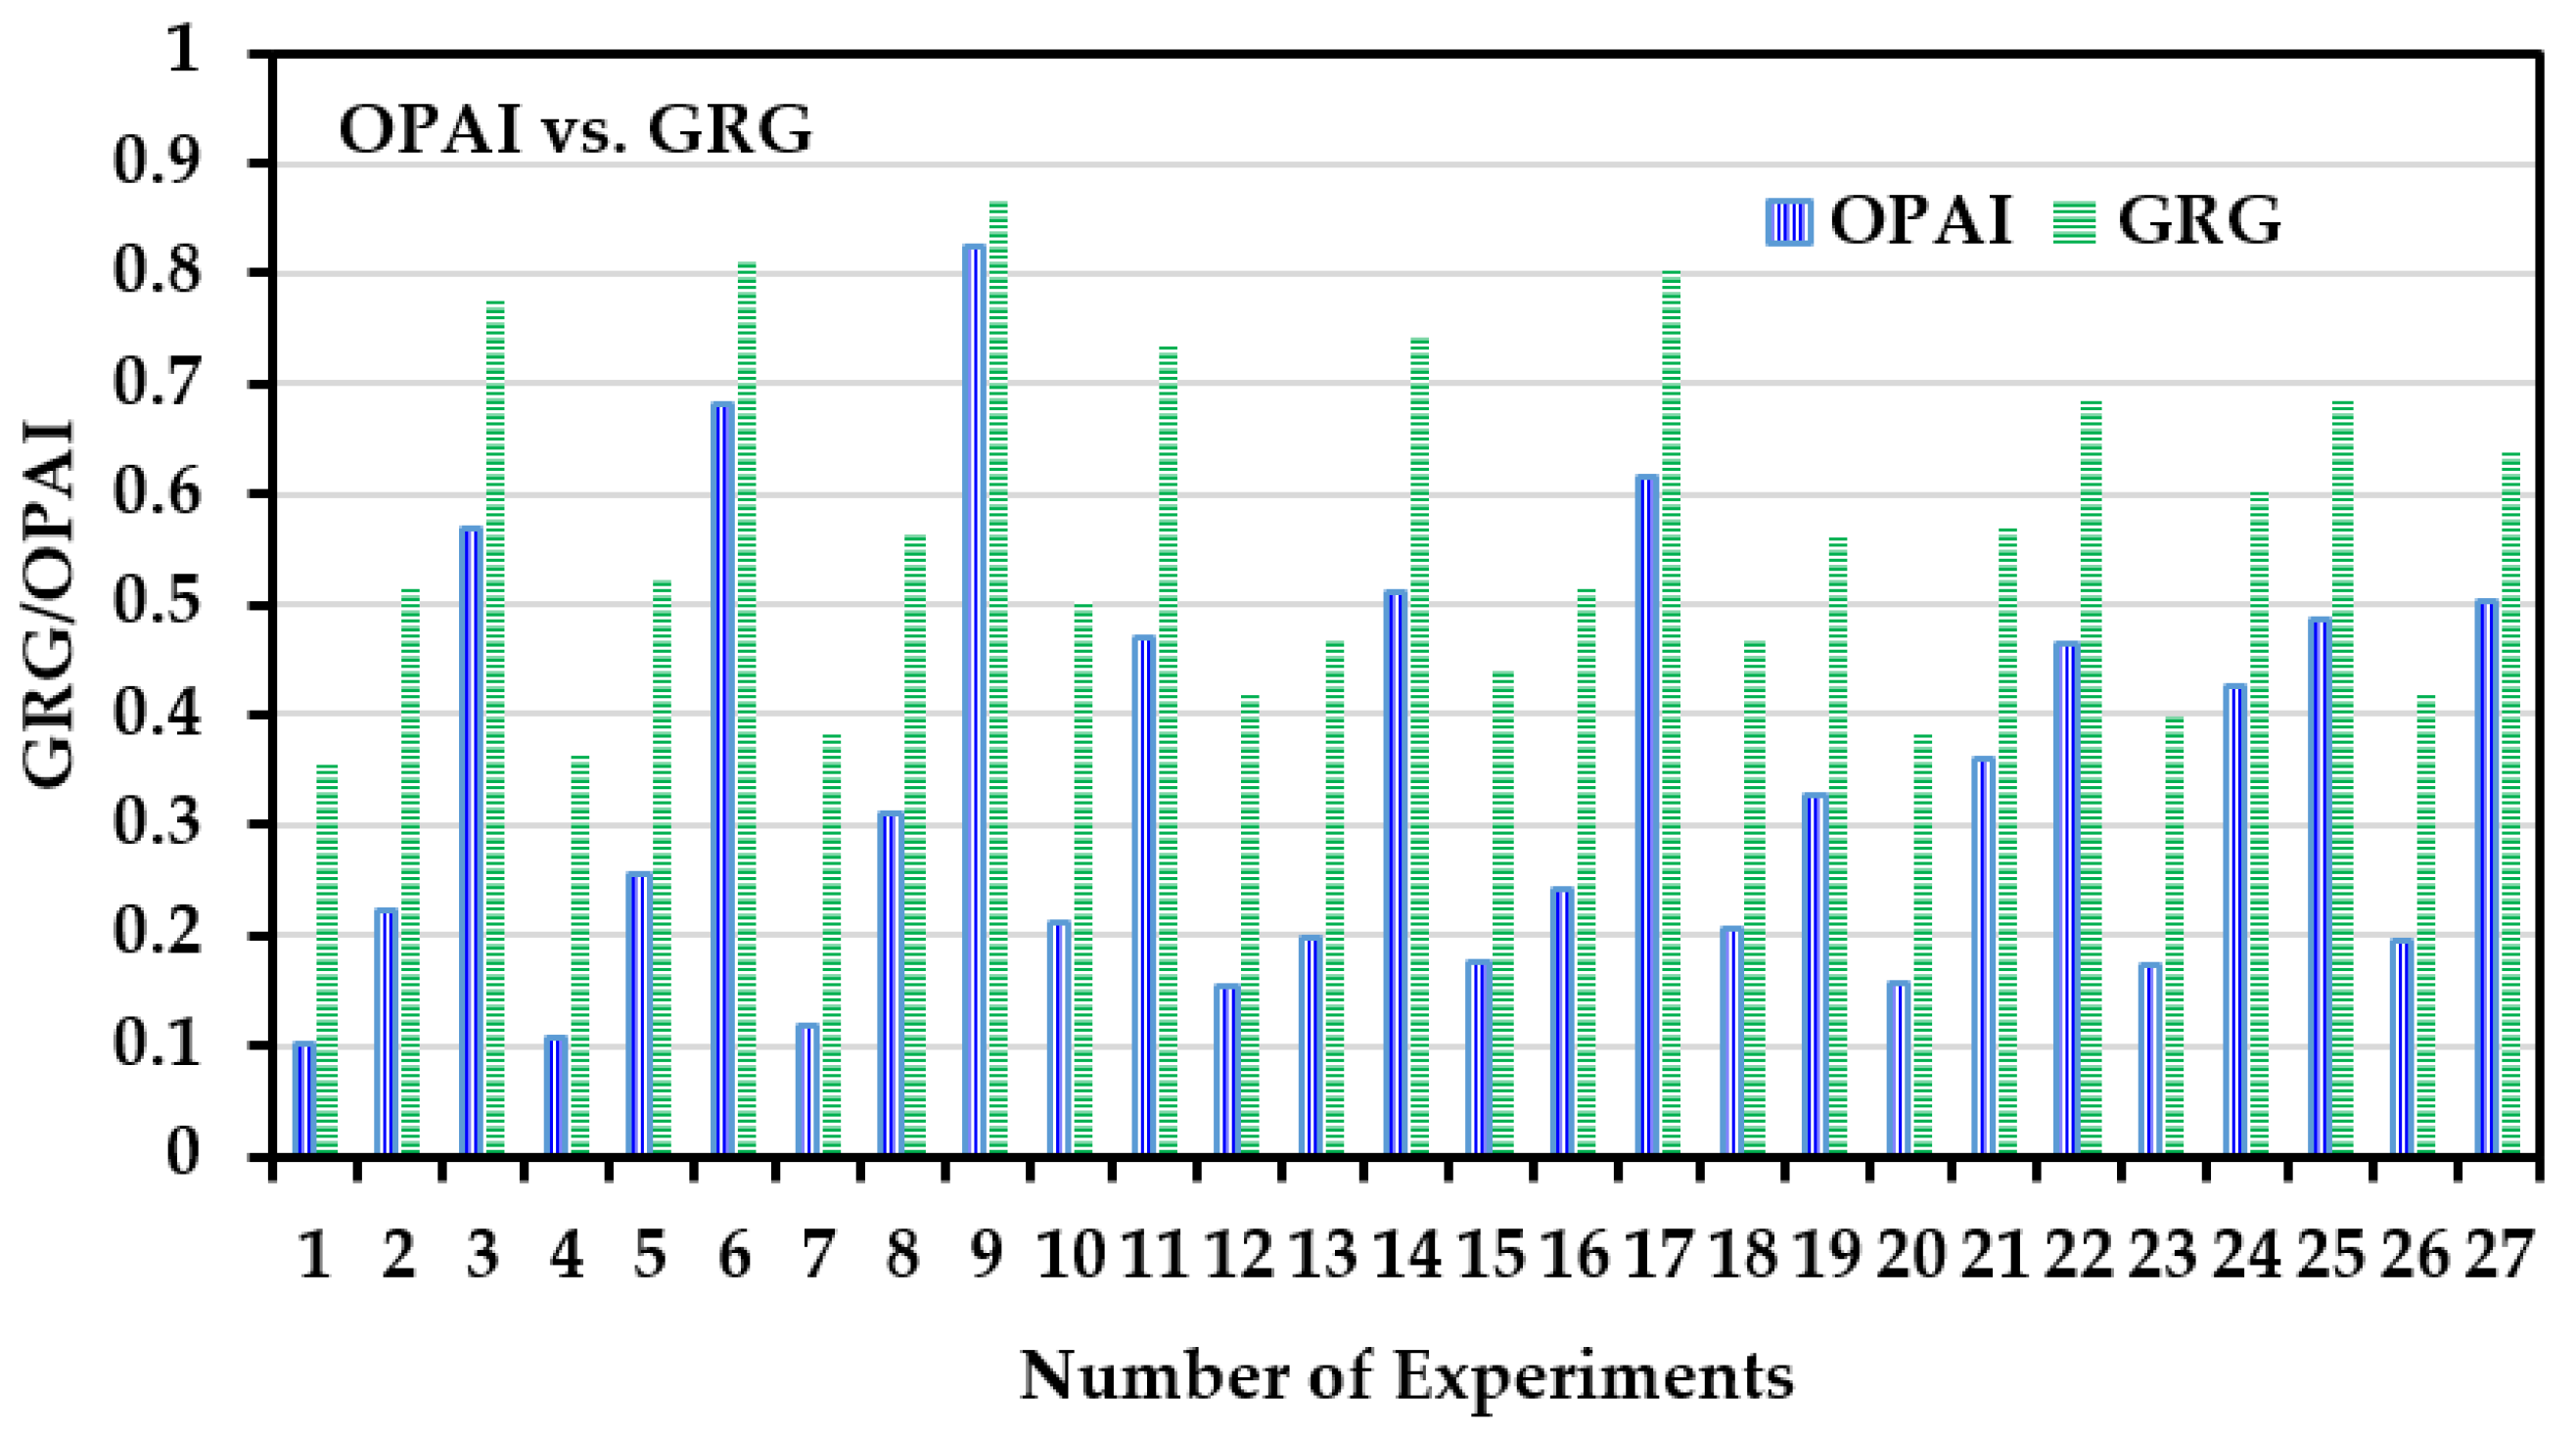
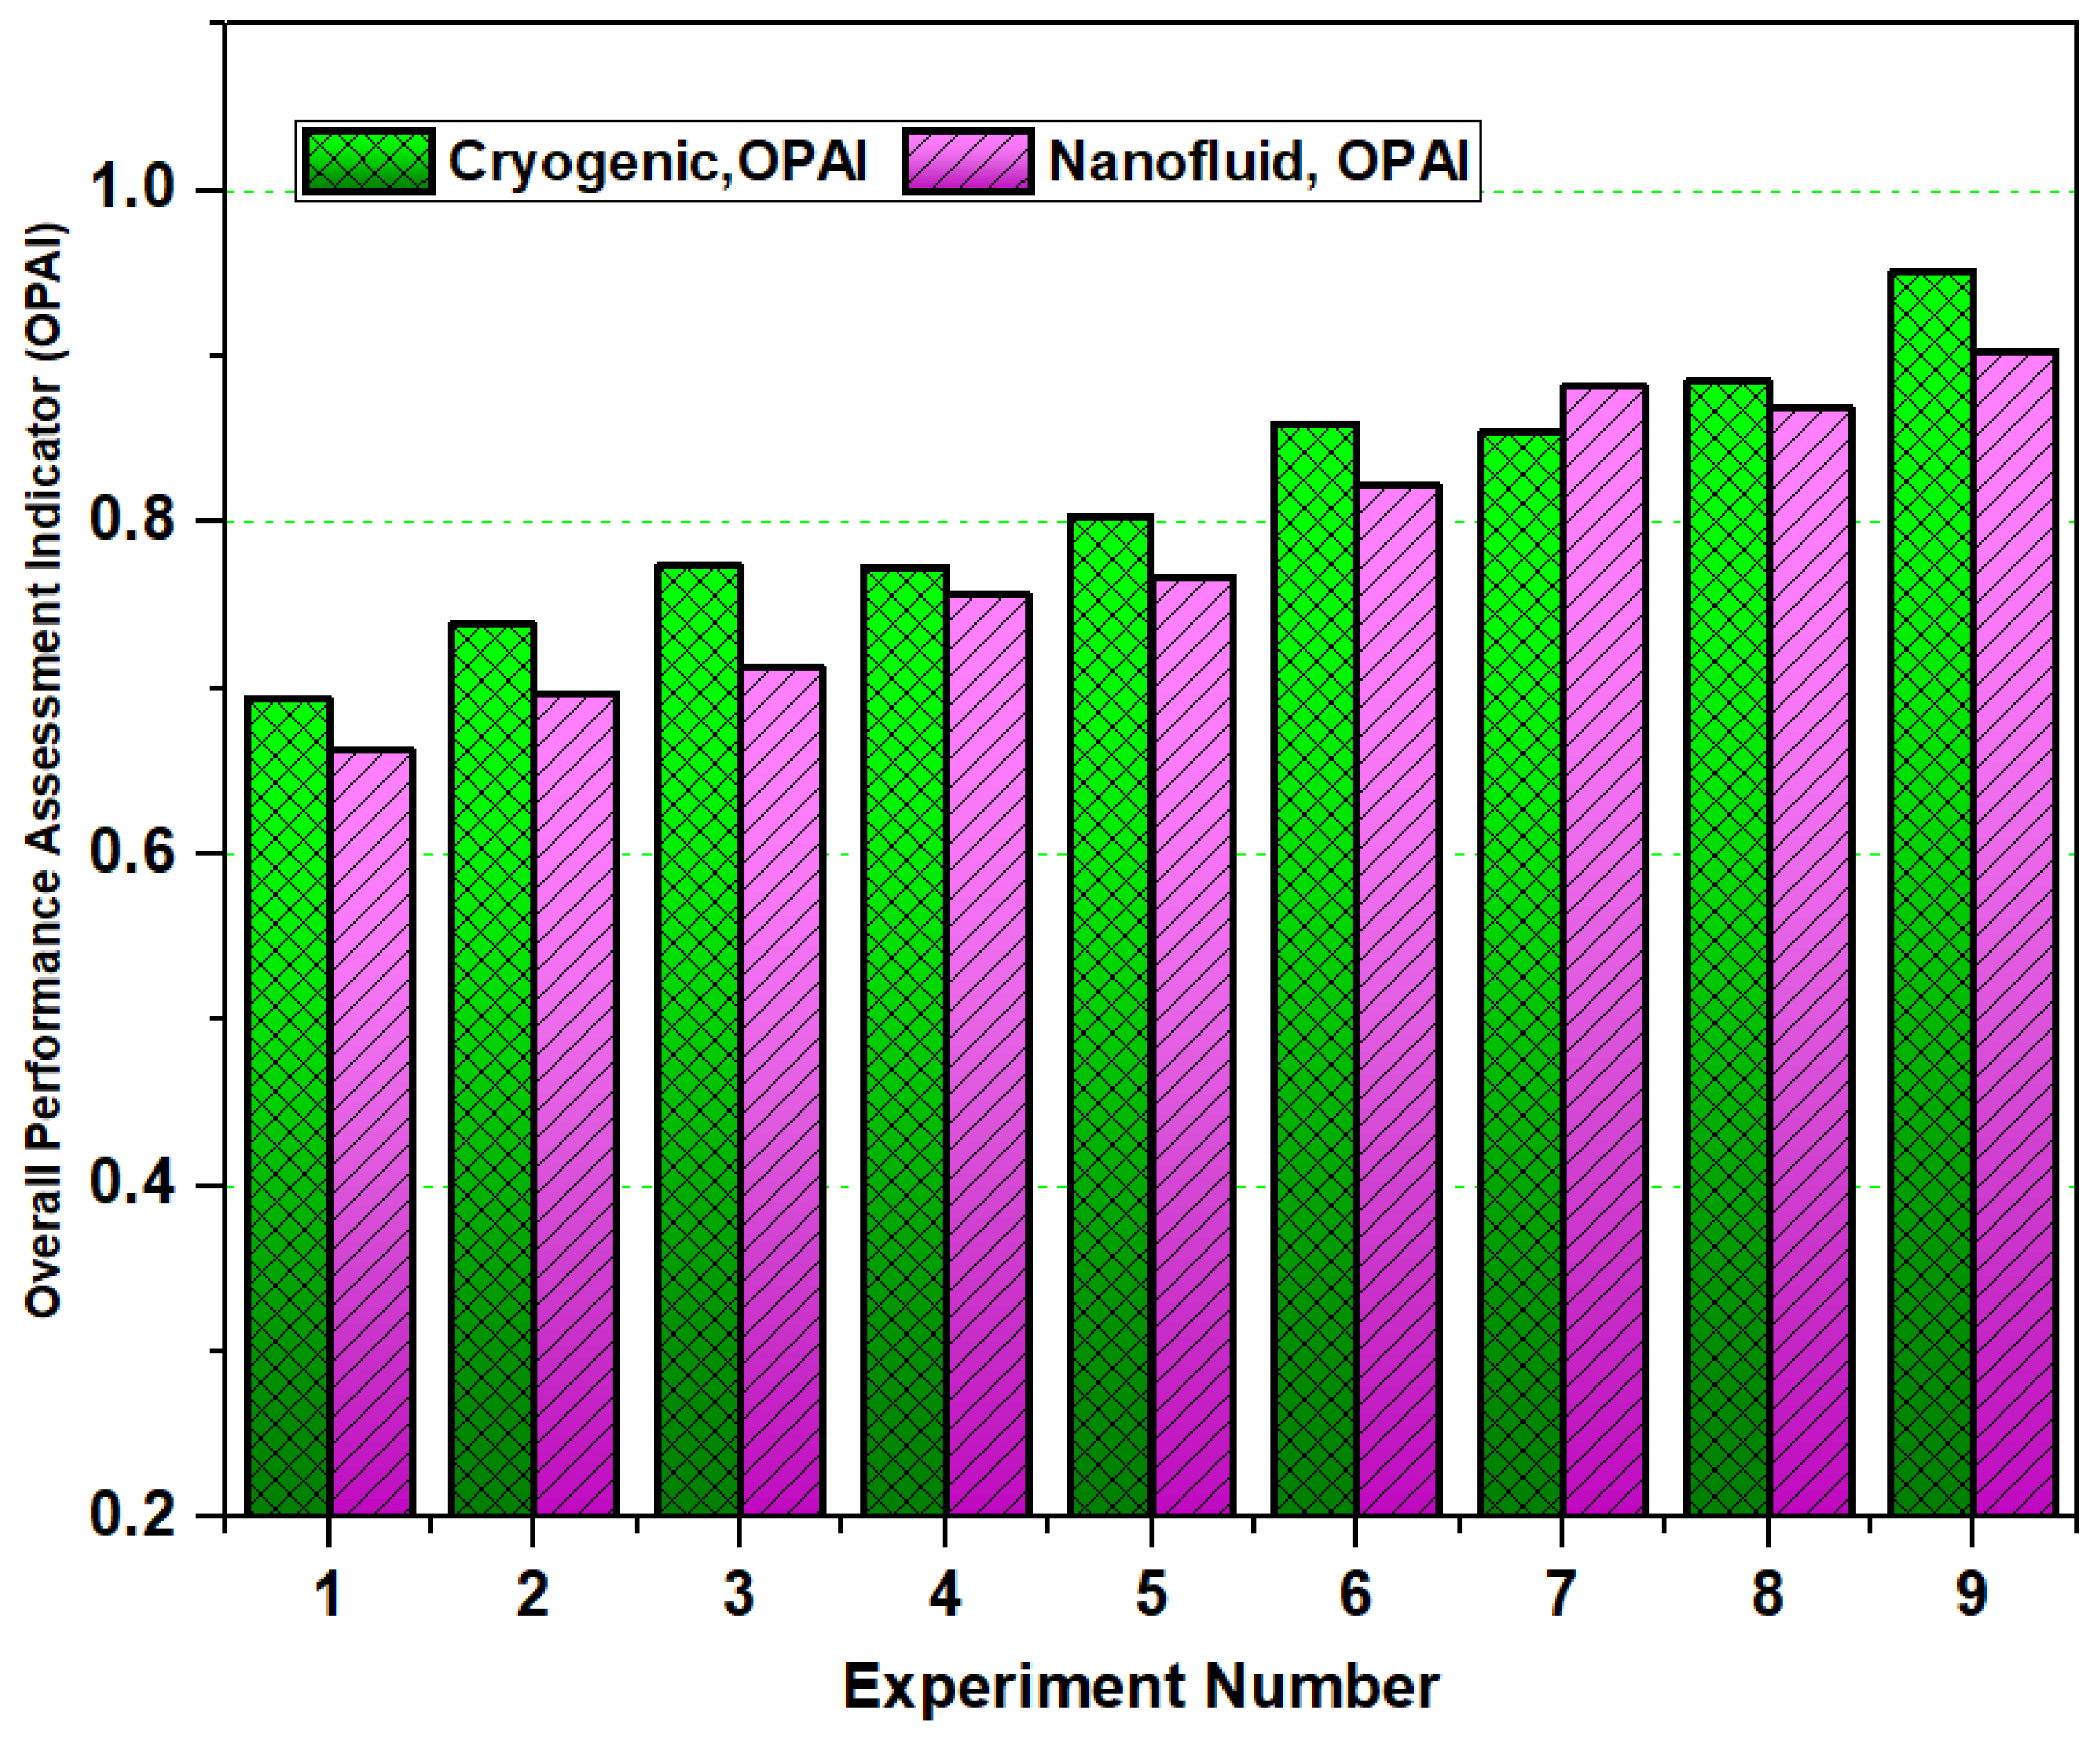
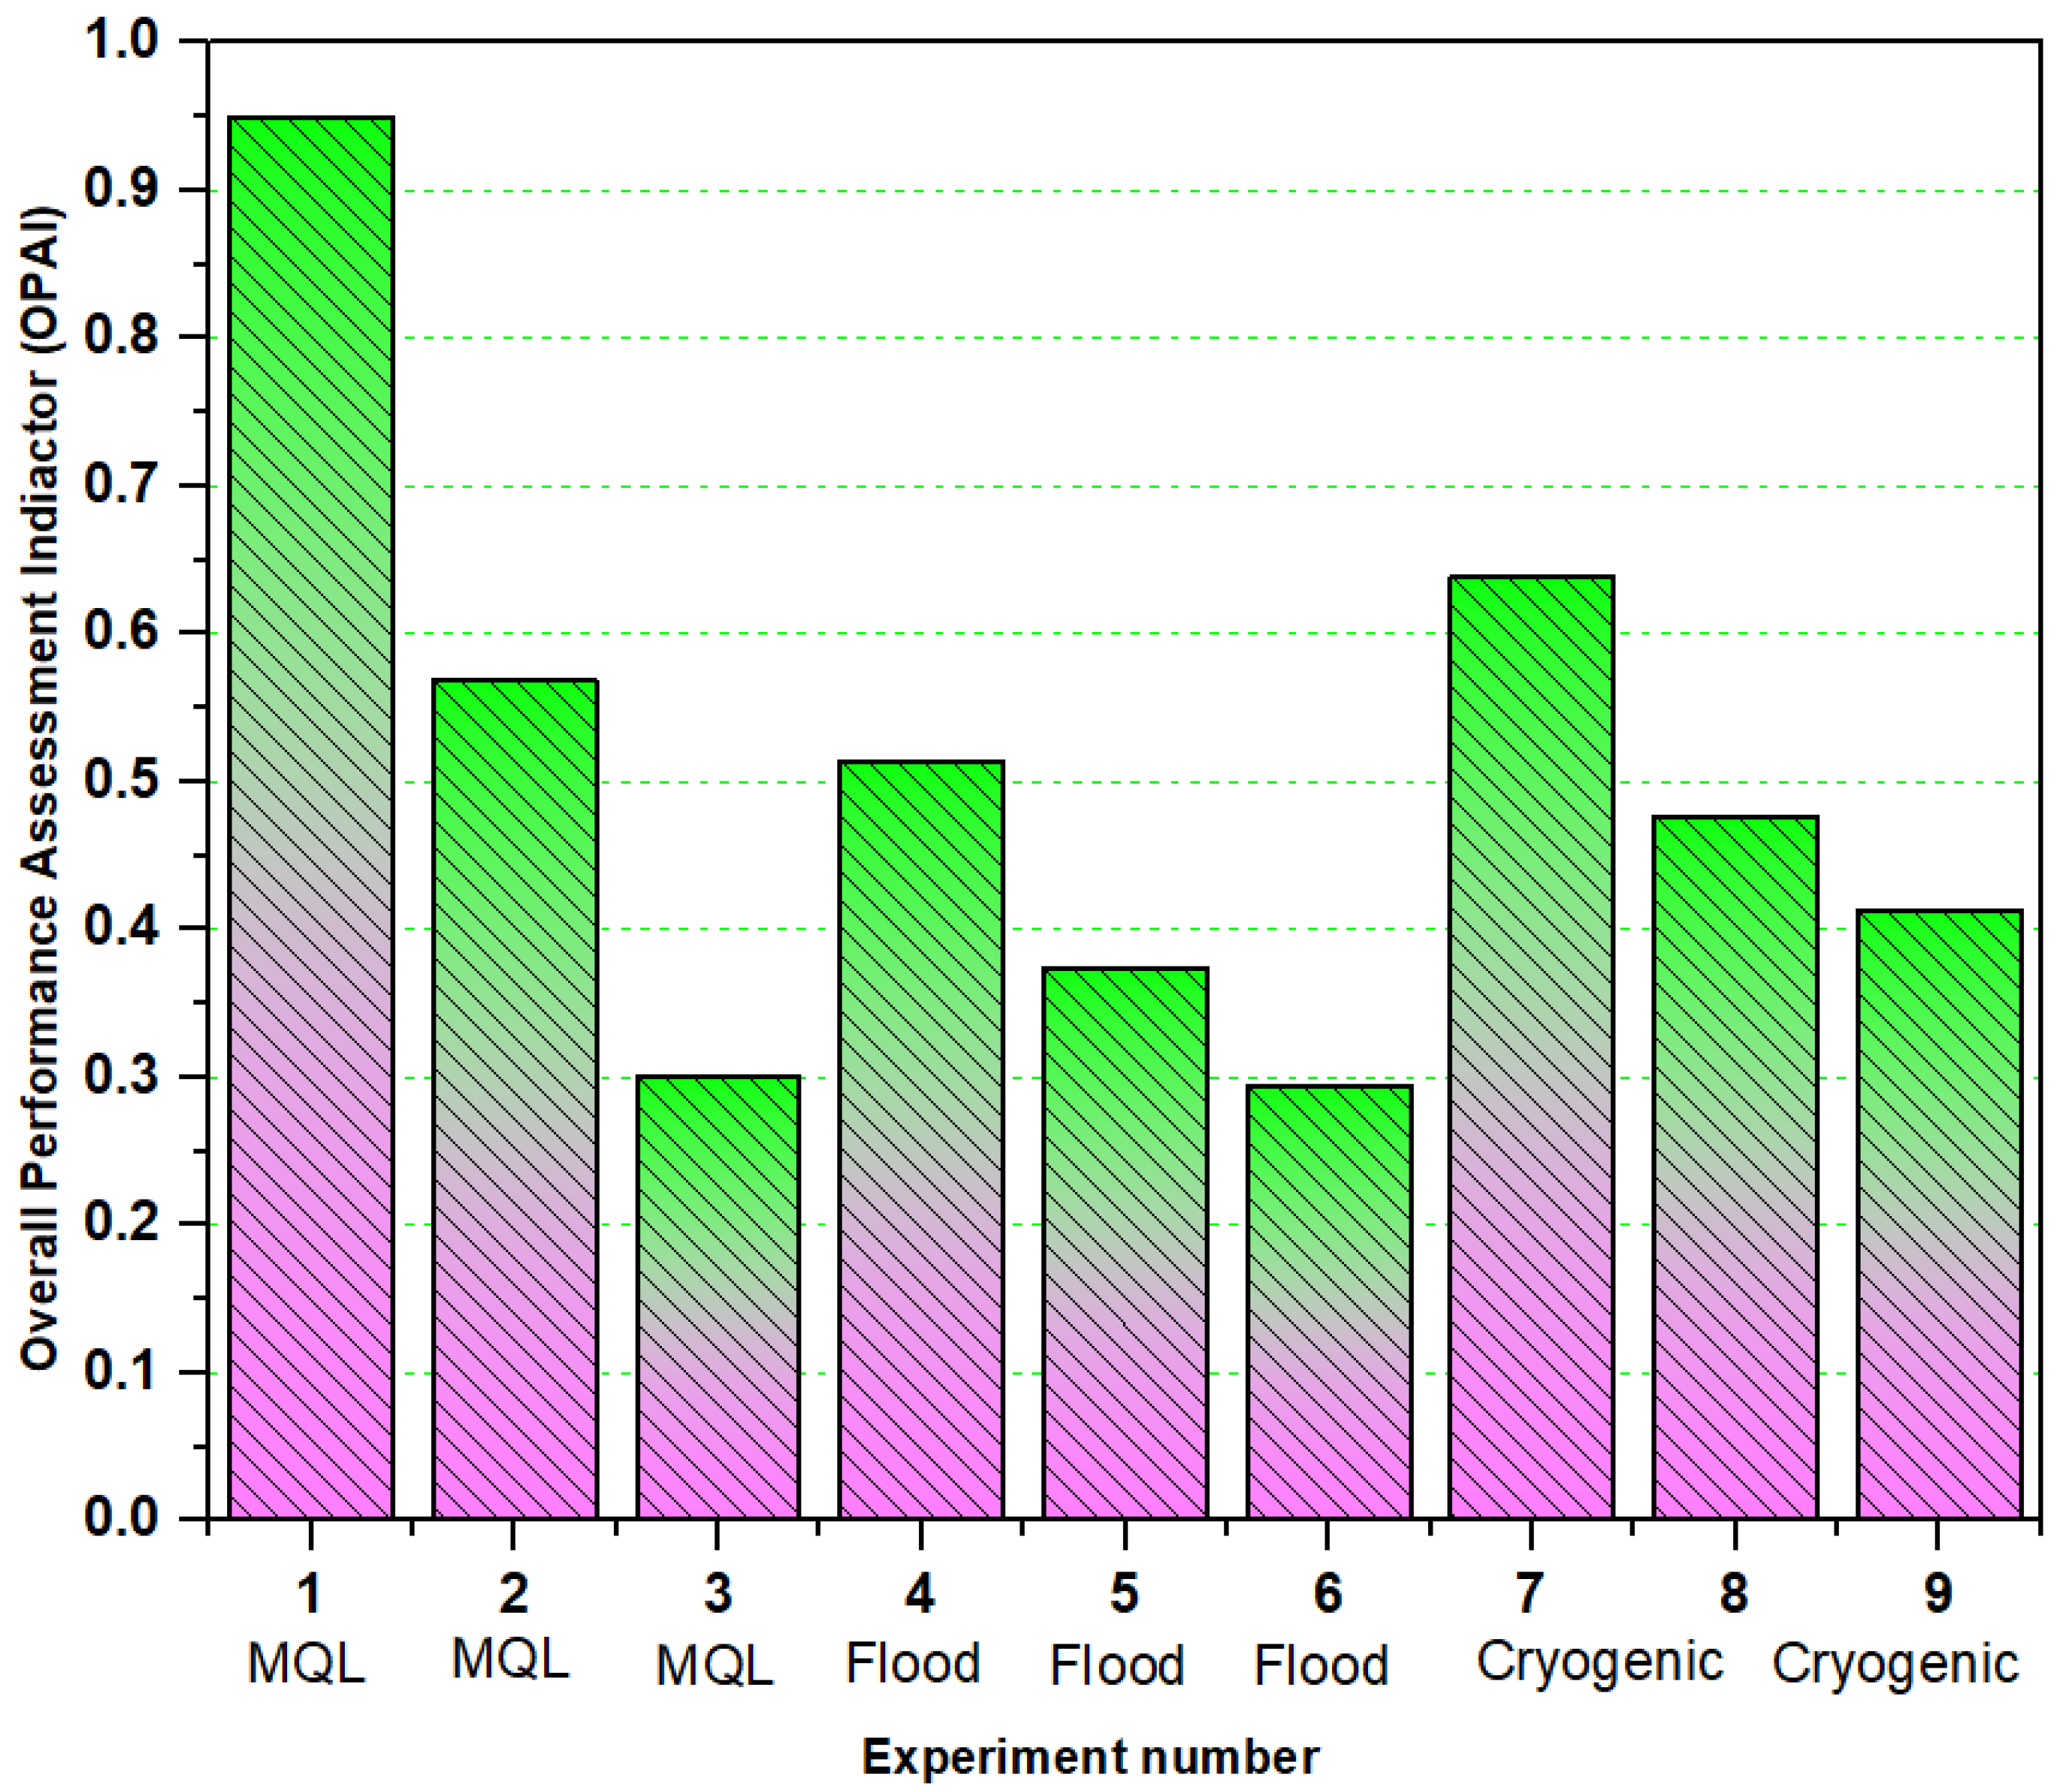
A novel assessment indicator named the Overall Performance Assessment Indicator was introduced and verified from three different case studies. The results obtained from the first case study were in good agreement with the experimental results of the case study. In the second and third case studies, the optimal cutting parameters were found for the machinability and sustainability perspectives simultaneously. The proposed OPAI indicator was found to be extremely useful for achieving optimization in the mechanical machining processes.
Limitation and Future Trends
There are some challenges that should be dealt with in the future. The qualitative indicators under sustainability guidelines received a specific quantitative score, which may vary in different industrial environments. Efforts should be made to make a unique score assignment mechanism. Second, data for some indicators, such as the fixture life or the cost incurred when disposing of chips were not available in detail, and manufacturers also lacked this type of data. This emphasizes the need for proper and detailed data collection to perform a holistic analysis. Another issue is that the influence of energy consumption on the economy and environment will vary from country to country. The price of electricity and the type of natural resources used to produce electricity are major factors that decide the impact.

 ,
, 


