Article

Hydrogen Fuel Cell Road Vehicles and Their Infrastructure: An Option towards an Environmentally Friendly Energy Transition

by
Olivier Bethoux
1,2
1
Laboratoire de Génie Electrique et Electronique de Paris, CNRS, Group Sorbonne Université, 75252 Paris, France
2
Laboratoire de Génie Electrique et Electronique de Paris, CNRS, CentraleSupélec, Université Paris-Saclay, 91192 Gif-sur-Yvette, France
Energies 2020, 13(22), 6132; https://doi.org/10.3390/en13226132
Submission received: 22 September 2020 / Revised: 2 November 2020 / Accepted: 17 November 2020 / Published: 23 November 2020

Abstract

:
The latest pre-production vehicles on the market show that the major technical challenges posed by integrating a fuel cell system (FCS) within a vehicle—compactness, safety, autonomy, reliability, cold starting—have been met. Regarding the ongoing maturity of fuel cell systems dedicated to road transport, the present article examines the advances still needed to move from a functional but niche product to a mainstream consumer product. It seeks to address difficulties not covered by more traditional innovation approaches. At least in long-distance heavy-duty vehicles, fuel cell vehicles (FCVs) are going to play a key role in the path to zero-emissions in one or two decades. Hence the present study also addresses the structuring elements of the complete chain: the latter includes the production, storage and distribution of hydrogen. Green hydrogen appears to be one of the potential uses of renewable energies. The greener the electricity is, the greater the advantage for hydrogen since it permits to economically store large energy quantities on seasonal rhythms. Moreover, natural hydrogen might also become an economic reality pushing the fuel cell vehicle to be a competitive and environmentally friendly alternative to the battery electric vehicle. Based on its own functional benefits for on board systems, hydrogen in combination with the fuel cell will achieve a large-scale use of hydrogen in road transport, as soon as renewable energies become more widespread. Its market will expand from large driving range and heavy load vehicles.

1. Introduction

Fuel cell (FC) applied research in recent decades and fuel cell system (FCS) deployments in niche markets have significantly advanced proton exchange membrane fuel cell (PEMFC) technology. Examples include space flight auxiliary power units (APUs), silent electric generators, hydrogen-powered domestic boiler for heat and electric micro cogeneration, forklifts. Progress is now sufficient to integrate FCS to provide traction power in road vehicles. Several demonstrators have been tested and several manufacturers are proposing successful integration in pre-production FC Vehicle (FCV). Over the last years, the automotive FCS estimated cost at high production volume has decreased dramatically. Considering 500,000 systems⁄yr, FCS cost was assessed at $124/kWelec in 2006 while in 2017 this value was reduced to $45/kWelec. It is quite close from the cost target enabling FCVs to compete with internal combustion engine (ICE) vehicles (i.e., $30⁄kWelec) [1].
Many commercially available direct hydrogen FC electric vehicles are light vehicles. Single on-board FCS power reaches up to 100 kW [2]. Since the FCV market is also focused on high load capacities, the same manufacturers are looking to extend the developed products to heavy industrial vehicles such as trucks and buses (Figure 1). In this context, the most expensive part (the FC and to a lesser extent the tank) can easily be achieved by combinations of proven elementary building blocks. This approach is achieved with a total decoupling of the energy and power aspects. To reach the specified driving range, the FCV has to embed the adequate number of dihydrogen tanks. To achieve the rated traction power, the option is to electrically connect the appropriate number of FCSs. In this way, FCS developments are easily paid off and FCS production costs reduced. Moreover, combining several FCSs gives new degrees of freedom in their management since the overall power comes from several partial powers. This architecture makes it possible to power splitting strategies in order to increase the overall efficiency over the cycle [3] and/or the lifetime [4], but also to ensure the continuity of service by operating in degraded mode [5,6]. Therefore, the designer has a powerful tool to push the limits of use and reach the most demanding requirements of the automotive application.
Among the many examples of heavy-duty vehicles currently being deployed is the Businova bus developed by the French manufacturer Safra in association with Symbio and Michelin groups (Figure 1a). This bus has a capacity of around 100 seats and is powered by a range extender architecture [2]. The 250 kW drive train is powered both by a 132 kWh lithium-ion battery and a 30 kW FCS drawing its hydrogen from four tanks carrying up to 30 kg of gaseous H2 at 350   bar . In this implementation the volume constraint was avoided by placing the tanks on the roof of the bus.
On the other hand, Hyundai chose a mid-power architecture for its 33-tonne Xcient FC heavy goods vehicle (HGV) [2,7]. Hyundai connects two 95   kW FCSs in parallel and carries seven 700 kg tanks capable of storing 35 kg of H 2 . As shown in Figure 1b, these tanks are located at the rear of the truck’s cab, in the space left free between the tractor and the trailer. Note that the entire hydrogen storage system (including the tanks) will be produced from 2021 onwards by the French equipment manufacturer Faurecia. From the point of view of use, the on-board energy allows the vehicle to travel 400 km since the average consumption of this type of vehicle is considered to be between 1,200 Wh.km−1 and 1400 Wh.km−1. Note that although the FCS generates the main energy, the auxiliary battery remains mandatory to maintain a high cruising speed when driving uphill. Indeed, at a cruising speed of 80 km.h−1, each additional % of the grade implies a 100 kW increase in wheel power. The Xcient combination of FCS, H2 tank and battery is 1 tonne, whereas for the same use 3 tons of lithium-ion battery would have been embedded. In addition to a lower ownership cost, this means that the load capacity is increased by 2 tons compared to the same pure battery truck. As the load capacity of such truck is around 60% of its total mass, this represents a 10% gain in payload, not to mention the other aspects: the high capital expenditure (CAPEX) of a battery electric vehicle (BEV) equipped with a 3-ton Lithium-ion battery, its use limited by long recharging times (non-productive downtime) and the heavy demand on the electrical network to draw very high power locally and punctually from the electricity grid. Based on the aforementioned Businova bus, the 30 kg on-board hydrogen enables a driving range higher than 300 km. The hydrogen refuelling time is lower than 15 min. Both characteristics are in line with the bus functionality. Alternatively, a similar BEV would need at least a battery pack with 850 kWh charging capacity. Even taking out the common constraints linked to battery thermal management, the possible rated current at the grid feed point and global grid stability, fully recharging the battery would require a rated power higher than 3.4 MW. This explains, amongst other things, why electricity companies are developing new distribution business models which determines kWh cost on the basis of peak usage (assessed on a few minutes range) making network punctual charging extremely expensive. In that respect, heavy road transportation and cars with intensive-use (e.g., taxis and delivery vans) are identified as the FCV key sectors in the future zero emission vehicles market [2].
Beyond these important points related to the functionality and social acceptability of the product constituted by the single vehicle, it is important to consider the complete system from the point of view of its life cycle. Such life cycle assessment (LCA) should include the energy use, the greenhouse gas (GHG) emissions, the water use and any pollutant flows required to manufacture, use and dispose both the vehicle and its energy infrastructure.
LCA methodology relies on a comprehensive footprint analysis of each involved process. To derive fully relevant conclusions, LCA inputs are well-documented data sets which may be difficult to find in the case of new processes that are still poorly established. It could lead to inconsistent outcomes difficult to interpret [8,9,10]. Basically, all the studies agree that the manufacture and disposal stages of both BEV and FCV have substantially higher footprints than those of conventional gasoline (G) or Diesel (D) internal combustion engine vehicles (ICEVs). The benefit of using an electric vehicle is both its local zero-emission (ZE) capability and, potentially, its low footprint during operation. Specifically, an important part of both FCS and electrolysers manufacturing and disposal footprint relies on their electrodes partially composed of rare metals. However, this cost and environmental barrier could be partly mitigated by efficiently and environmental-friendly recycling these metals including platinum which would substantially decrease the global impact on the comprehensive cradle-to-grave analysis [11,12]. Current researches prove this goal can be achieved as soon as FCV sector really emerges [13]. Apart from the FCS, the hydrogen tank also greatly impacts the FCV environmental burden. Similarly, recycling its carbon fiber would considerably mitigate this negative effect [14]. Finally, hydrogen production routes, which are virtually infinite, have a meaningful influence on the LCA of any hydrogen-based application.
At this stage in the development of electric vehicles, particularly those based on FCS, a limited analysis consists in evaluating the global well-to-wheel (WtW) energy consumption (EC) and GHG emissions. The European commission’s Joint Research Centre (JRC) carried out such calculation comparing conventional GICEV or DICEV with BEV as well as both full-power or mild-power FCV architectures [15]. The study was carried out on a light passenger car and relies on 2020 data. The first main conclusion is that BEV based on European electricity mix emits similar amount of GHG than a FCV fed by hydrogen produced by natural gas reforming. This quantity is half those observed when considering GICEV. In case of wind electricity both EV emits almost no GHG, hydrogen being produced water electrolysis. Similarly, waste food use either to produce electricity (BEV) or to convert biomass into H2 through thermo-chemical process produces few GHG. Regarding total WtWEC, FCV relying on gas reforming consumes a quarter energy less than GICEV and its energy consumption is also slightly lower than DICEV. FCS high efficiency compared to traditional ICE poor performance enables H2 road transportation to offset its complexity. While using wood waste primary feedstock, the global WtWEC becomes slightly higher than GICEV due to a lower yield of biomass gasification compared to methane water reforming. However the FCV option is very sensitive to the hydrogen production pathway. For instance, water electrolysis based on European electricity is energy-intensive. Its performance index is twice as large as that of the GICEV. Wind power exclusive use permits to reach a similar figure than the DICEV. BEV has a better performance index in part due to a better “tank to wheel” energy index. The total energy expended by BEV charged on European grid is similar to that of GICEV since avoiding the limited energy efficiency of the electrolyser. Similarly exclusive wind electricity use provides a performance index more than half the rate of the DICEV.
Figure 2 summarizes these findings. They show the potential of hydrogen road transportation option highly depends on the H2 production routes either in term of future technology advances and real large-scale primary feedstock availability including competition with other sectors also seeking to reduce greenhouse gases.
Automotive transport pilot projects demonstrating hydrogen energy use have been developed since the late 1990s [2]. They have been reaching pre-series scales since the end of 2010. All these experiments now enable to draw conclusions, both on the gap between current performance and the market target, but also on the progress made in two decades. It shows that FCV is a relevant option for intensive use both in high driving range light vehicles and in heavy-duty vehicles. In the context of ongoing maturity of hydrogen FCVs, the present article seeks to ascertain to what extent this technology can fully fulfil the demanding goals of car industry and how a possible large-scale FCV implementation can lead to an environmental friendly and economic road transport sector.
This paper is organized as follows. Section 2 investigates the present FCV pros and cons while identifying possible advance. Suggested improvements are comprehensively discussed to discriminate continuous and foreseeable enhancements from breakthrough innovations to overcome technological barriers. This section considers material and basic component rethinking as well as significant changes in FCS design and management which are two complementary explored avenues. Section 3 broadens the view beyond a focus on a single vehicle to address the required infrastructure to fuel a growing FCVs fleet. Based on environmental and economic criteria, it examines the global hydrogen infrastructure from production to distribution as well as transport and storage. Finally, Section 4 concludes and outlines policy implications.

2. FCV: Maturity Level of Technological Bricks and Associated Trends

The US Driving Research and Innovation for Vehicle efficiency and Energy sustainability (DRIVE) program, which is a partnership between the Department of Energy (DoE) and the US auto industry issues roadmaps every 4 years. The latest publication dates from 2017 and analyses the situation observed in order to compare it with the objectives of the automobile industry [16]. The US Department of Energy (DoE) regularly pilots and funds projects on the issue of hydrogen energy and FC [17]. Similarly, under the aegis of the European Union, the European industry has joined forces to pilot and structure the hydrogen sector in the Fuel Cells and Hydrogen—Joint Undertaking (FCH-JU) program [18]. At the French level, the automotive industry players (PFA) have established in 2020 recommendations on the technical development of hydrogen mobility [19]. Even if the absolute values differ, the findings are similar. As far as the vehicle is concerned, the three challenges to be met are cost reduction, as well as increases in service life and power density (Figure 3). In order to achieve this triple challenge, several drivers are available to designers; however, their effects can be antagonistic, especially on cost and lifetime criteria. This is certainly what still makes the speed of the announced progress towards the technical specifications recalled in Figure 3 uncertain.

2.1. Lifetime

The FCS lifetime is highly related to that of the elementary cell and more specifically its MEA. The service life is defined as the time during which the FC performance decreases from 100% down to 90%. More precisely, the FC voltage is measured at its rated current; a decrease of less than 10% is expected. The average life of the monitored fleets has been increasing steadily from 950 h in 2006 to 2500 h in 2009 and 4130 h in 2016. At this time, the longest FCV lifetime was 5648 h of operation. This performance indicator still requires a significant improvement to meet the specifications of 8000 h deemed necessary by the car industry and roughly corresponding to a driving distance of 240,000 km [16]. Moreover, for the first fleets, having thus been able to be tested over a longer period, the lifespan is doubled if a 30% performance degradation is accepted [17]. Besides, the larger the platinum particle size, the longer the lifetime [16]. Since a sphere volume is proportional to the cube of its radius while its surface area is proportional to the square of the radius, it is clear that for a given quantity of material (volume), it is better to fragment the material to increase its effective surface area. The following equation shows this: the increase in N (fragmentation) implies an increase in Surf, i.e., potential areas of electrochemical reaction:
{ V o l N r 3 S u r f N r 2 S u r f N 1 / 3 × V o l 2 / 3
This observation clearly shows that there is antagonism between the two performance criteria: lifetime and cost. This can be explained by the greater fragility of the platinum-polymer-graphite bond. Once the particle is released from this triple contact zone following multiple parasitic attacks, it is no longer effective in promoting the reaction [20].

2.2. Cost

The FCS cost mainly depends on the following components: (i) the MEA and more specifically the membrane and its catalyst, (ii) the bipolar plates (BPs), (iii) the auxiliaries and (iv) the tank and associated protection and distribution systems. These costs relate to both the materials and the manufacturing processes. Without knowing their actual cost, light vehicles marketed in 2020 have a unit selling price of around 65k€ before tax. Within the European Community, it will cost €78,900 for the Toyota Mirai and €79,900 for the Hyundai Nexo (including tax). These achievements on very limited series do not allow to give a precise idea of the cost of FCVs produced on a large scale (the initial targets are 500,000 vehicles/year). Nevertheless, reflection elements explain the main drivers for cost reduction [1,21]. Table 1 and Table 2 give a snapshot of the cost distribution for on-board FCSs having a rated power of 80 kW [21].
Hydrogen is a highly reactive gas that causes metals corrosion, especially since the low atomic radius of hydrogen enables it to penetrate deep inside structures, including metal structures, even under standard conditions. Thus, a degradation of the mechanical properties of materials exposed to such an aggressive environment can be observed [22]. The BPs degradation may lead, among other detrimental phenomena, to a voltage drop increase due to the rise in the contact resistance. For this reason, BPs, which are particularly exposed to corrosion, need to be protected by a corrosion protection coating with excellent thermal and electronic conduction properties (to match the BP requirements). This treatment (materials and deposition process) increases the BP cost. It is currently considered to account for 20% to 30% of the cell value [21]. Many works intend to extend the downward trend in the BP cost [23]. These include the use of untreated stainless steel, as Hyundai is experimenting with Nexo’s FC [24,25], the use of highly adherent coatings on stainless steel, and finally enhancement of the forming processes to produce the BP channels as close as possible to the sizing resulting from an optimization process [26].
Regarding the complete FCS, the auxiliary components that ensure the perfect real-time conditioning of the FC stack also have a significant impact on costs, since they contribute to half of it (Table 2). Contrary to a large part of the FCS (electrodes, bipolar plates, membranes, diffusion layers, …), these auxiliary components are often the result of industrial developments and are therefore already mature. Hence the scale effect is very positive. In addition, simplifying the FCS without losing functionality is another driver, which could lead to three main benefits: (i) reducing cost, (ii) reducing space requirements and (ii) increasing reliability. As already described above, an optimized FC design may ensure the proper MEA self-humidification, thus eliminating the humidifier [27]. An alternative approach consists in developing a membrane capable of withstanding slightly higher temperatures. It would reduce the heat exchanger size and possibly eliminate the need for a humidifier. In addition, overcoming multiple cooling temperatures is also a significant driver in reducing costs (as well as volumes and failure rates).
Finally, ongoing developments aim to reduce the cost of high-pressure storage and its associated gas management. This part is quite expensive, as the tank has to withstand high pressure and large pressure gradients during filling. In addition, the entire system must be designed to avoid any risk associated with the very high H2 reactivity. Hence the storage cost remains significant, in the order of 800 €/kgH2. Both the European and American sectors have set a target for reducing this cost to 400 €/kgH2 and 300 €/kgH2 respectively for a production of 500,000 units per year [17,18]. The largest effect here is expected to be the production in volume.

2.3. Platinium

Platinum (Pt) accounts for the bulk of the electrode cost (Table 2). Any action leading to the platinum charge reduction is therefore essential for the control of the overall FCS cost. This effort mainly concerns the cathode AL because the dioxygen reduction half-reaction is much slower than the dihydrogen oxidation. The cathode therefore requires high Pt loads, typically ~0.35 mg·cm−2 [12]. Basically, and beyond the strict cost aspect, platinum is a critical raw material, since it is currently crucial for the proper FCS operation in FCV while its supply is a major risk. Indeed, platinum is a precious metal and geographically poorly distributed. World platinum reserves are estimated at 13,000 tonnes with a distribution concentrated in few countries: mainly in South Africa (80%) and Russia. Regarding current mines, platinum production was 190 tonnes in 2017. 75% of it (143 t) came from South Africa. The other producing countries were Russia (21.8 t), Zimbabwe (14 t), Canada (9.5 t) and the United States (4.0 t). In addition, the physical and chemical characteristics of platinum make it a key material for many applications. The automotive sector absorbs 42% of production (mainly for catalytic converters for diesel engines), jewellery 38%, and 20% of platinum is used in other industrial sectors [28]. The European Union has therefore classified platinum (as well as cobalt (Co) needed for lithium-ion batteries) among the 14 most critical raw materials. Thus, the transition from pre-production to mass production may run up against a supply wall. The automotive industry is considering reducing the platinum charge so that it can shift the use of diesel engine catalytic converters to on-board FC electrodes in FCV. This scenario is all the more realistic as very efficient recycling channels have developed. Indeed, it seems possible to recover 95% of the platinum from a catalytic converter [19]. Furthermore, in a complementary and more distant scenario, electrode manufacturers could achieve the automotive application demanding performance with platinum-free catalysts.
In recent decades the reduction of the Pt load per unit area has been steady and very significant as shown in Table 3) [29]. Current on-board FCS reaches a performance level of about 0.125 gpt/kWelec [16]. Consequently slightly over ten grams of Pt are needed to ensure the electrochemical conversion H2 → Welec of a light FCV (12.5 gpt per kWelec). In comparison, the catalytic converter of a 100 kW diesel engine has a platinum charge close to 3 g, with typically 2/3 Pt and 1/3 Pd. For similar gasoline vehicles, the order of magnitude is 1 g to 2 g of platinum-group metals (PGM) with a typical ratio of: 90% Pd / 10% Rh. It is therefore vital to reduce the FC Pt charge by a factor of 10, or even to do without it, in order to develop a hydrogen-fueled automotive industry. The avenues being explored consist in ensuring a better distribution of catalyst nanoparticles and favoring bi or tri-metallic catalysts. Both approaches must take into account the electrode life cycle: better integration of platinum reduces its use but makes it more difficult and constraining its recycling. This approach will therefore inevitably lead to a trade-off between integration and recycling. The third path is to design catalysts without Pt or even PGM (i.e., ruthenium (Ru), rhodium (Rh), palladium (Pd), osmium (Os), iridium (Ir) and platinum (Pt), all of which being extremely rare components in the earth’s crust). This option has already been successfully explored. However, it still leads to bulky FC implementations which cannot be considered in automotive applications [12,30]. Indeed, the oxygen reduction activation requires large quantities of these catalysts, increasing the thickness of the AL by a factor of 100 (compared to PGM-based catalysis) which leads to a substantial increase in ohmic and transport losses [28]. Moreover, these MEAs using PGM-free catalysts suffer from a reduced lifetime due to a faster degradation of their catalytic sites. They suffer from a higher cathode production of a highly corrosive by-product, namely the hydrogen peroxide (H2O2) [30]. Integrating PGM-free FCS in the automotive industry remains a major challenge in 2020. Reaching this goal either in this radical form or more simply in the drastic reduction of the Pt load will positively impact the penetration of H2 in the energy sector and more specifically in road transportation vehicles sector. W/mgPt

2.4. Road FCV Roadmap

As already mentioned the main FCS bottleneck relies in the AL which is the core of many complex and multiscale physical and chemical phenomena. First, all over the world, many first-class teams gradually improve the fundamentally understanding of the nano-scale to milli scale FC electrode. For instance active layer carbon structure has recently proved to be of high importance [2,31,32]. Mesopores (4–7 nm) in the carbon aggregate are crucial. They improve proton and oxygen transport phenomena, which impacts positively the FC efficiency at high current densities, while enhancing Pt-alloy particles catalyst activity and stability [31]. Moreover present disorder carbon structure shows increases the tortuosity of transport pathways reducing the potential performance of the electrode which improves FC performance both in terms of efficiency and life-time duration [32]. Designing an order microstructure of active layer could enhance the electrode performance by both favoring mass transport and achieving a homogeneous current density along the electrode surface [32]. Finally some commercial ionomer-free active layers open a vivid debate in the research community about the real functionality of it [32]. Improved design and functioning are expected from a better understanding of this electrode material. These recent findings prove that the continuous progress partly illustrated by Table 3 has not yet find its asymptote and leaves potential to reach high current densities and with long-lasting performance. It theoretically leads to a win-win situation for the FCS cost and LCA.
Second many large-scale industrial processes have to be designed since the current FCS niche market doesn’t push to develop such pilot project.
Third, at that stage of early FCV fleets collecting users’s data will enable to monitor the actual use and to find systemic or device answers to real but as yet unforeseen operating conditions. The latter aspect is one of the major challenges that car manufacturers, their main suppliers and the hydrogen distributors will have to address in the next decade. It will condition the success of many advances in the fields of operational safety, system lifespan and social acceptance. Data mining, artificial intelligence and company’s cooperation are the keys of this holistic approach. For instance, a Swiss pilot interurban freight service will gradually be set up with 1600 Hyundai Xcient-FCV trucks by 2025 (50 in the 2021 initial step). The hydrogen production will be based on water electrolysis fed by with electricity generated from hydropower. Apart from Europe (and more specifically Germany and France), USA (and more specifically California), China, Japan and Sout Korea, which are currently the most involved in supporting FCV technology, have planned 1.0, 1.0, 0.8 and 0.6 million of FC cars by 2030 in order to solve the technical challenges and the appropriate strategies for significant FCV penetration. The expected industrial diffusion of hydrogen road transportation might start from 2030 [33]. Note that aircraft industry also expects commercial hydrogen airplane by 2035.
As the advances toward FCV mass production scale should be reached over ten years [12], the next section expands the questioning to the entire ecosystem: production, transport and distribution of dihydrogen.

3. Development of an Environment Friendly H2 Infrastructure

The prospect of scaling up the FCVs (cars, trucks, buses, construction equipment) also implies considering the whole infrastructure mandatory to disseminate this technology. This comprehensive approach leads to take a step back from the vehicle alone and consider hydrogen as an energy carrier to be produced, transported, stored and distributed. The present section is dedicated to the required infrastructure and intends to outline the main drivers. If H2 infrastructure has existed for more than a century, shifting transport sector to hydrogen energy will significantly increase its intensity and lead to branching out of this infrastructure on a very fine scale, never envisaged before in the industry sector.
To achieve a large market penetration of FCV, the French automotive industry considers that the price of H2 distributed to the customer must be €7.3/kg (including VAT, excluding margins) [19]. In addition to taxes, this cost is impacted by the H2 production mode, but also by its storage, routing and final distribution. Road FCV and its infrastructure are considered to be an option towards environmental friendly energy transition. In this context, current hydrogen productions costs based on renewable energies (such as green electricity or biomass) are still too high, in the order of €13/kg to €15/kg (distributed dihydrogen). To reduce that price, some of the barriers have been identified as elementary and may be resolved with small efforts whereas others need further investigation. Reaching the €7.3/kg target in industrial scale production would certainly require a decade. At this time (2030), both water electrolysis based on low cost green electricity or excess electricity (for which the electricity cost is zero or even negative) and biomass-based hydrogen production are expected to be able to perform cost effective large scale H2 production. This horizon is in line with the current roadmap of transportation applications: 2025–2030 in road and railway applications and 2035 in the aircraft industry.

3.1. H2 Production

The hydrogen element H, the first element on the periodic table, is one of the most abundant in the universe and on Earth. However its presence in the form of hydrogen gas H2 is rarely observed and generally poorly understood. At this stage, dihydrogen is therefore an energy vector produced from multiple molecules (water, hydrocarbons, biomass, etc.) in which the hydrogen atoms are inserted. Its energy interest lies in its high mass and volume densities (if it is at high pressures) and its speed and relative ease of transfer from high to low pressures.
From an industrial point of view, dihydrogen has been used for more than a century, almost exclusively as a process gas. In 2018, the world consumption of dihydrogen was €7.3/kg: 80% was used for the production of ammonia (NH3), a key product in nitrogen fertilizers, and the rest to remove sulphur from hydrocarbons, as a reducing agent in steelworks, glass industry, etc. [34,35]. At the same time, France consumed about 1 × 10⁶ tH2. However, the French fleet of light passenger cars is about 33 × 106 units. 10 million of these vehicles, travelling an average of 20,000 km/year each, would require 2 × 10⁶ tH2 of additional dihydrogen for the French territory, thus tripling H2 production. This order of magnitude, which takes into account only part of the need for road mobility, shows that the investment effort on production infrastructure, as well as on storage transport and distribution, is considerable and will have a strong impact on the ecological, economic and social balance sheets.
As an energy carrier, dihydrogen can be produced by almost any primary sources provided that the feedstock is water, hydrocarbons or organic matter; versatile H2 generation is one of the key merit making hydrogen economy attractive. Currently, hydrogen production can be achieved through multiple processes, with maturity levels ranging from research phases to the deployment of large-scale commercial applications over many decades [36,37,38]. The listed studies provide a relevant and up to date overview of current H2 production state of art including basic operating principles [37]. Without going into great details and without attempting to provide an exhaustive description, the means of obtaining synthetic dihydrogen are classified into three broad categories [37].

3.1.1. Grey Hydrogen

With a 96% market share, grey hydrogen obtained from fossil hydrocarbons represents the bulk of production. It is classified as grey because its production emits carbon dioxide CO2. It is obtained mainly from natural gas (49%), oil (29%) and coal (18%) [37,38]. These hydrocarbons are treated using thermochemical processes.
The methane steam reforming combined with the carbon monoxide shift is the most common process and the one that emits the least CO2. It requires a nickel-based catalyst and emits 9 tCO2 for every ton of H2 produced, not counting the part due to the electricity consumed [39]. Indeed, the balance of these two reactions is a globally endothermic reaction ( H = + 165   kJ · mol 1 ):
C H 4 + 2 H 2 O C O 2 + 4 H 2
which leads to a reaction mass ratio m C O 2 / m H 2 of 5.5. The factor 9 comes from the complete system that includes a synthesis gas purification step (H2, CO2, CO) [40]. The dihydrogen supplied to PEMFC must indeed be extremely pure and have only traces quantities of the large number of molecules that can poison the catalytic layers. Among these, the maximum threshold of carbon dioxide CO2 is 2 ppm while the level of carbon monoxide CO must not exceed 0.2 ppm [31].
Steam reforming is the most efficient process for light hydrocarbons but requires heat input, usually provided by the combustion of a part of the methane. To avoid this energy expenditure, auto-thermal reforming is often used [35]. This consists of introducing oxygen into the reactor to promote a second exothermic reaction, the partial oxidation reforming (ΔH = −77 kJ.mol−1):
C H 4 + H 2 O + 1 / 2 O 2 C O 2 + 3 H 2
The synthesis gas obtained from this first reactor is then purified in a second reactor. One possible process is permeation through a membrane designed to allow small molecules to pass selectively through.
Concerning the complete balance of large reformers, the energy efficiency for the production of a 99.9% purified dihydrogen (which is not yet sufficient for a PEMFC) is E H 2 / E C H 4 73   % (considering the lower calorific value (LCV) of the two gases) [41,42]. Thus, the cost of the H2 produced is strongly linked to that of natural gas. On the basis of the 2017 price (≅17 €⁄MWh), the cost of this process is about €2 kg without taking into account the financial cost of CO2 sequestration [42,43]. Indeed, even if the low carbon scenarios, including those of the IEA, are all based on massive recourse to this sequestration, its relevance, as well as its feasibility, still remain an open subject [44].
The oxidation of oil or coal leads to processes that emit even more CO2 and give a lower energy yield. First of all H:C ratio decreases in the chemical composition of the hydrocarbon feedstock from 4 regarding natural gas (mainly composed with CH4) to 1.67 considering oil, while coal is primarily composed with carbon. Second, as regards thermodynamics, the H 2 conversion energy efficiency decreases from 70–85% for natural gas reforming to 60–75% for coal gasification [38]. It is therefore pointless to use these different processes to generalize hydrogen mobility. Adding additional stages before final use would only contribute to higher direct and indirect CO2 emissions (for the implementation and maintenance of additional technological processes). Basically, coal gasification is still used extensively (~18% of the world’s H2 production) based on its low feedstock cost: $1.15–1.26 /GJ compared to $9.48 /GJ for natural gas [45]. This gives rise to questions about the need of world-wide policy coordination both to gradually eliminate fossil fuel subsidies and move to carbon pricing to discourage CO2 emissions based on fossil carbons (leading to climate disruption and oceans acidification).

3.1.2. Blue Hydrogen

Blue hydrogen is obtained from grey hydrogen production means with additional carbon sequestration technologies (Carbon Capture, Utilization and Storage or CCUS). Although this solution is still envisaged on a large scale in the various prospective scenarios of the International Energy Agency (IEA), it is legitimate to raise doubts as to: (i) the economic model of this option, which adds numerous processes and therefore a significant additional cost, (ii) the energy model, since carbon dissociation requires a lot of energy through its transport and compression for burial, and even more fundamentally, (iii) environmental sustainability, since the effective duration of deep geological storage is not at all guaranteed to date [46,47].

3.1.3. Green Hydrogen

The very rapid fall in the cost of renewable energies (solar, onshore and offshore wind power) suggests intermittent production on a very large scale in the coming decades. The most rational solution from all points of view is to electrify the numerous industrial uses [44], and to do so, to reinforce the structure of the large continental electricity networks. Nevertheless, in the longer term, and to reinforce the penetration of renewable energies in end uses, the dihydrogen energy vector can become an essential link because (i) its high mass and volume densities enable it to store intermittent energy over large time scales (months) and thus ensure the desynchronization of production means with power demand, and (ii) it is very versatile since it can be produced by the electrolysis of water using wind or solar electricity (electrolysis) or biomass (chemical dissociation of carbon chains). This green hydrogen is therefore clearly the horizon for mass production of hydrogen energy. This development only makes sense when the natural outlets for renewable resources are exhausted. Each local situation is different. Denmark, with a 60% penetration of renewable energies in its electricity grid by 2019 and despite its electricity interconnections with other Scandinavian countries, could soon enter a need for dihydrogen flexibility. Other countries such as Switzerland or Austria with their significant potential for reversible hydraulic resources are still far from having to resort to this technological option, which is costly from a financial and environmental point of view.
Many processes can be used to produce green hydrogen (i.e., without greenhouse gas emissions): electrolysis of water, photolysis of water (water and sunlight), thermolysis of water, thermochemical water splitting on metal oxides, thermochemical conversion of biomass (e.g., gasification and pyrolysis), fermentation of biomass, catalytic decomposition of methanol (e.g., from biomass fermentation) [37,38]. These different hydrogen production pathways and technologies range from commercial to long term maturity. They are dependent on feedstock availability and produce pure H2 or fuel admixture. Depending on end-use technical specifications, the purification sub-systems costs (energy consumption and recovery rate) may impact its competitiveness and LCA.

Water Electrolysis Based on Renewable Electricity

Water electrolysis is one of the most mature processes for producing this green hydrogen from renewable resources [37,38]. Moreover, this specific pathway directly produces the ultra-pure H2 required for road transportation fuel cells. It is therefore interesting to look at this technological brick in order to shed light on the technical and economic stakes involved.
From a thermodynamic point of view [2], the dissociation of the water molecule into dihydrogen and dioxygen implies both a minimum electrical energy ΔG which decreases with the reaction temperature T and also a minimum thermal energy Qrev = T.ΔS which increases with T. This thermal energy can be provided by the valorization of a fatal heat source or more simply by the losses (irreversibility of the reaction) induced by the process itself. Consequently, and from the strict point of view of the elementary cell of an electrolyzer, there is a so-called thermo-neutral point [48] for which all the electrical energy Welec supplied is converted into chemical energy ΔH at the end of the reaction. Moreover, the higher the operating temperature of the electrolyser, the lower the voltage required for the reaction (and therefore its energy). Also, as a high temperature means the ability to use common catalysts (such as nickel), the current developments are focused on high-temperature electrolyzer (of the order of 900 °C), known as solid oxide electrolyzer (SOE). Particularly for reasons of thermomechanical stresses leading to rapid fatigue, these electrolyzers are still under development with TRL levels of 3 to 5 [37] (the Technology Readiness Level (TRL) is commonly used by international organizations. On a scale of 1 to 9, a TRL of 1 means that paper-based studies have presented the basic principles of a technology, while a TRL of 9 means that the system is fully validated in real operational conditions).
In the low-temperature electrolyser category, proton exchange membrane electrolysers (PEMEs) have achieved TRL levels of 7 to 9 [37]. Their commercial deployment is underway as they allow high current densities (from 0.6 to 2.0 A.cm−2), fair system efficiencies (from 55% to 70%), very pure hydrogen (99.999%), operation over the entire power range (PPEME,min ~ 0% to 10% of PPEME,rated) and fast start-up. They also enable to produce high-pressure hydrogen with a high faradic efficiency, hence avoiding an auxiliary energy consuming gas compressor [49]. These electrolysers have to a lesser degree the faults of the on-board PEMFC. Their degradation is quite rapid. Their lifetime is around 20,000 h and their cost is high because of electrolytic layers using precious metals [45]. This last point is a real bottleneck for the scaling up of green hydrogen production. Historically these electrolyzers use platinum-palladium alloys (Pt/Pd) at the cathode to catalyze the reduction reaction (H2 production) and Ruthenium and Iridium oxides (RuO2/IrO2) at the anode to catalyze the oxidation reaction (O2 production). Research and development efforts are therefore focused on the use of more common metals. On the cathode side, the use of molybdenum sulphide (MoSx) and palladium (Pd) leads to good results while, on the anode side, to reduce the iridium charge, the combination of several metal oxides (tin oxides and tantalum oxides) is used [50].
At present, the alkaline electrolyser, with a liquid electrolyte allowing the exchange of the hydroxide ion OH-, is widely used and thus benefits from the greatest feedback. Alkaline electrolyte permits to use no noble metals to catalyze both electrochemical reactions. In addition to modest cost and ease of large-scale productions, it has a large lifetime (~90,000 h). Its drawbacks, which motivate research in other technologies, are moderate current densities (<0.45 A.cm−2), poor system efficiency (50% to 60%), higher reduced load (PAE,min ~10% to 40% of PAE,rated) and longer start-up times (~15 min) [51]. Alkaline electrolyser TRL is considered as 9, but several approaches may still improve this process. One instance is the development of anion exchange membranes. Low service life remains the major shortcoming of the latter. Once this issue is well addressed, anion exchange membranes would enable to simplify the system, reduce ohmic losses, and produce a very pure dihydrogen, without using noble catalysts based on PGM [51].
Regarding material barrier, the present focus on water electrolysis technology indicates that this technological brick could easily scale-up. However, in 2019, this production is marginal (which was not the case before the 1950s [52]). From an economic point of view, its development is strongly conditioned by the electricity price. Consequently, its economic interest is linked to a very large-scale deployment of intermittent renewable energies, as well as the price of natural gas and possible carbon taxes. Several international organizations (IEA, IRENA for example) frequently provide techno-economic analysis of the comparative H2 production costs. In a recent IEA study [44], Cédric Philibert looks for the tipping point from blue hydrogen to green hydrogen based on electrolyzers. He shows that the production cost of this green hydrogen is fixed at the first order by the price of electricity as soon as the electrolyzer charge factor is significant (>35%). Given the abundance of the multiple renewable energies available, such a charge factor is easily achievable. On the other hand, this constraint excludes the use of electrolyzers for the sole purpose of cutting down surplus power. Based on the study hypotheses [44], green hydrogen has a lower cost than blue hydrogen as soon as the electrolyzer operates more than 2000 h, i.e., has a charge factor of more than 23% (Figure 4). This shows this option is perfectly realistic. The switch to green hydrogen depends largely on a global political will. Indeed, economic players only make investments with medium- and long-term certainties. In recent years, the natural gas price has been uncertain but kept relatively low due to the large-scale exploitation of unconventional gas and oil. The price signal must therefore come from a steady and certain evolution of the carbon tax [53]. Additionally, note that a recent Korean study showed that car consumers are ready to pay a higher price for hydrogen refueling than for classic gasoline for internal combustion engine vehicles (GICEVs) [54].
Note also that natural gas steam reforming (eq. 1) requires an energy of 165/4 = 41.25 kJ per mole of H2 produced. In comparison, water splitting into pure H 2 and O 2 necessitates ΔH = 286 kJ/molH2 which is basically seven times higher. In water electrolysis, this energy splits into electric work (the main part which obviously has to be paid) and heat which possibly can be provided by the losses of another process using a thermal loop. Another interesting way to enhance economic viability of electrolysis is to valorized pure dioxygen by-product as a feedstock in industrial processes or as a medical gas. In this circumstance, the combination of an AWE electrolyzer and an electric plant based on a renewable energy source is already remunerative [55]. Last but not least, carbon taxes decided by multilateral government organizations is third driver to shift from fossil hydrocarbon use to this environmental friendly technology. In sum, the main electrolysis challenge to date is to lower its operating cost (OPEX) mainly imposed by electricity price. The CAPEX is a second-rate challenge, except in the case of using excess electricity which has a null or negative cost. It is currently addressed by increasing the operating current densities [48].
As mentioned green hydrogen market share is very low since current electrolytic hydrogen is only 4% of world H2 production in 2019. At present, electrolytic hydrogen is largely a by-product of the intentional production of chlorine (Cl2) and caustic soda (sodium hydroxide NaOH) [56]. This waste molecular hydrogen is useful to recover at the end of chlor-alkali electrolysis. It is cheap ($1⁄kg according to [56]) and relatively pure (99.9%). Nevertheless, its production level will be clearly insufficient to meet the future needs of mobility based, even partially, on hydrogen [42].

Biomass-Based H2 generation

The development of the electrolysis sector is closely linked to the development of renewable electrical energies and the lowering of their electricity prices. That is the reason why other hydrogen production technologies are simultaneously emerging using different resources. Amongst these are the high-tech biomass use for energy purposes. Two main types of processing may produce dihydrogen. One approach is based on fermentation and uses biological reactors [45,57] while the second one produces dihydrogen by thermo-chemical techniques [58,59].
Although these hydrogen generation pathways are completely different, they both uses similar feedstock, namely biomass available at low cost. Obviously it is mandatory to avoid specific crops which would be in competition with human food or wild life. By contrast, valorizing wastes is of high interest from both the global environmental point of view and the economic dimensions of the biomass-based H2 industry. Hence, industrial wastes, agricultural or forestry residues, or municipal wastes can viably provide cost-effective biomass-derived feedstock utilized for H2 generation. For instance, paper solid waste, animal manure, rice straw, sugarcane bagasse can provide large quantities to bio refineries. Basically, hydrogen bio-production routes require a feedstock with an excess of water. Conversely, thermo-chemical techniques need to process a dry biomass hence potentially requiring drying pre-treatments.
Both biomass-based techniques offers great opportunities for large-scale renewable hydrogen production because expecting low production cost and having already proven good energy conversion rate. First, before being rejected, the selected feedstocks must have already been processed to meet environmental standards. Therefore, there cost is limited if not null. The biomass transport cost is therefore a determining factor and bio refineries should be close to large and continuous biological feedstock stream as well as H2 end-users. Second, although various in origin, biological products issued from photosynthesis contain organic matter composed of carbon, oxygen and hydrogen. The H2 weight percent in biomass ranges roughly 6% which accounts for more than 40% of biomass initial energy [60]. These two key points makes biomass a promising feedstock for renewable hydrogen production.
Thermo-chemical ones have already achieved commercial step with industrial implementations while biomass fermentation is at research level and needs further improvements to achieve robust continuous hydrogen production [37,38].

The Thermochemical Biomass Conversion Technology

The main routes for thermochemical biomass conversion are pyrolysis [61,62] and gasification [58,59].
Pyrolysis and catalyst-based fast pyrolysis decomposes the dry organic matter at relative low temperature (400–600 °C) and in an oxidant-free atmosphere (complete absence of air or O2) in order to prevent any combustion or gasification. In these circumstances, the bio reactor works efficiently and the endothermic pyrolysis products bio oil and bio char, both of high energetic value. Operating conditions are commonly tuned to maximize oil yield making pyrolysis a pre-treatment technique to generate dihydrogen. Indeed, the pyrolysis products are easy to store and to transport which enables to overcome the biomass production geographic constraints: being placed in the core of high biomass production and high hydrogen use. It also permits to benefit from a low cost energy storage to meet fluctuating demand [61]. Note that the main biomass pyrolysis products (mainly oil) can feed a gasification reactor [58].
In contrast, biomass gasification and specifically steam gasification or supercritical water gasification produce an hydrogen-rich syngas composed of other combustible molecules (CH4, H2, CO and hydrocarbons CxHy) and non-combustible ones (CO2, N2). The gasification route involves many complex reactions and occurs at quite high temperature. Biomass steam gasification works at (700–1200 °C) with water vapor and is a sequence of several thermochemical reactions including carbon gasification, water-gas conversion, methane reforming and hydrocarbon reforming. Hydrogen content is mainly driven by steam-to-biomass ratio and a selective catalyst like Ni-based catalysts, silica sand or olivine [58,59] Expressed as percentage by volume, typical syngas composition achieved by an optimal steam-to-biomass ratio is: 30–50% of H2, 25–40% of CO, 8–20% of CH4 [58]. Alternatively supercritical water gasification operates at lower temperature (600–1000 °C) but higher pressures (22.1–40 bar) and uses water in the supercritical condition (above its critical point, i.e., 347.3 °C and 22.1 bar). The key point is that the feedstock no longer needs to be dry which saves an important amount of auxiliary energy and makes this technique energy efficient. The main driver of the H 2 yield is indeed operating temperature of supercritical water gasification.
The overall energy efficiency of biomass gasification is reported to range from 35–50% and obviously the syngas needs to be purified using pressure swing adsorption (PSA) or membrane techniques. Moreover the other by-products including hydrocarbon mixture should also be valorized.
There remain various challenges to promote thermochemical biomass gasification techniques and enabling them to switch from pilot and small-scale implementations to massive hydrogen production. First the supply chain as well as the bioreactor have to cope with the heterogeneity of biomass feedstock both over time and depending of the location. Second catalyst performances regarding activity and selectivity have to be more stable. Besides the catalyst material gas should also be recyclable. Third a simple way to valorize the char by-products would be to find an effective catalyst at low temperature able to promote carbon gasification [58]. Finally, the whole reactor has to be fully optimized to minimize heat consumptions and to find the best trade-off between H2 yield and raw materials cost. Similarly, the real time monitoring and management of the process has also to be fully engineered. Many of these avenues of progress seem to be achievable in a relatively short period of time, in particular those essential to the commercial success of biomass gasification.

Biological Hydrogen Production

The biomass fermentation pathway uses some bacteria strains capability to generate H2 while growing on a substrate with high concentration of hydro carbonates (like glucose, sucrose and starch) [45,57]. It means that a biomass feedstock pre-treatment is required to convert into glucose the various macromolecules. This first process is feedstock dependent and is a key stage in ensuring an inhibitor–free substrate and a large effective area for the microorganism. The selection of the relevant strains is another key issue and studies prove that the co-culture of at least two strains gives robust and high H 2 production.
Fermentation that relies only on the substrate energy is referred to as dark-fermentation. Conversely some bacterial strains requires light energy: this approach is called photo-fermentation. Photo-fermentation is really constraining since it requires day light and high surface-volume ratio to void self-shading. This leads to a raw material extensive-use bio-reactor. So photo-fermentation is only considered in combination with dark-fermentation as a second step to retreat the latter by-products. Indeed dark-fermentation produces many volatile fatty acids (like acetate, propionate, lactate) that are not environmental friendly. Using photon energy, photo-fermentation routes don’t use sugars and can produce H2 (and CO2) from VFAs. This second fermentation route both enhances global bio H2 yield and cleans the first by-products.
In brief main efforts concentrates on dark-fermentation which is an attractive dihydrogen production since it requires no external energy source [57,58]. Its large potential lies mainly in the simplicity in the bio-reactor working almost without additional energy and the abundant waste biomass. In dark-fermentation, the selected bacteria degrade the wet substrates through several pathways. One basic reaction produces acetate from glucose:
C 6 H 12 O 6 + 2 H 2 O 2 C H 3 C O O H +   2 C O 2 + 4 H 2
It illustrates that the theory bio H2 limit is 4 mole per mole of glucose or in an equivalent way that 1 kg of H2 requires at least 22.5 kg of pure glucose. Although feedstock is free or as even a negative price, a huge amount of biomass feedstock is required to produce the energy demanded by a passenger car for a 100 km-distance. This underlines the fact that the bioreactors have to be located close to large waste streams including wastewater treatment units. It also favors further research efforts to enhance the actual H2 fermentation production which ranges currently from 25% to 50% of the biomass available hydrogen. To address this issue the two avenues are bacteria selection and genetic engineering to reinforce H2 production routes and to inactivate metabolic pathway leading to H2 oxidation. A complementary action is to optimize the micro-nutrients vital to selected bacteria metabolism.
The basic reaction (Equation (3)) also shows the harmful by-product of fermentation: very large concentration of VFAs like acetate. It requires further liquid waste treatment to valorize this undesirable waste product and also to remove it so as to continue bio-hydrogen production. For high H2 yield, it is crucial to avoid VFAs accumulation. Among the various approaches to achieve this goal, additional bacteria can convert these VFAs into value-added products such as ethanol. This also involves further research to fully understand and optimize microorganisms’ interactions [54].
Finally basic reaction (Equation (3)) also reveals that the gas mixture leaving the bio reactor needs further treatments to achieve pure H2. Membrane separation is the best possible solution both in terms of selectivity and energy consumption.
This overview shows the potential of biomass fermentation to produce sustainable and low cost H2. Going from the current lab level to a pilot scale project to prove its economic potential and environmental relevancy needs to (i) develop continuous bio-hydrogen production based on efficient immobilized culture [63] (ii) ensure resilient pre-treatment and robust microorganism selection towards the heterogeneity of the biomass input (iii) find synergies to valorize all by-products. This makes biomass fermentation attractive as green hydrogen generator but in long-term perspective compared to thermo-chemical treatment.

Transformation of Methanol to Hydrogen

This subsection doesn’t illustrate a dihydrogen production but a hydrogen carrier and its transformation for the end-use by a thermo-chemical process.
Methanol (CH3OH) is an alcohol having a interesting H:C ratio which makes it attractive as an energy carrier instead of pure dihydrogen. Indeed, it is liquid at ambient temperature and pressure and has a quite high specific energy: 22.7 MJ.kg−1 and 17.85 MJ.m−3. It can be produced by many pathways and could therefore be a good alternative to hydrogen storage and transport. One of the methanol production route is biomass fermentation even though current production is mainly based on crude oil [39,59,64].
For final use, the methanol conversion process to hydrogen-rich gas is a low temperature endothermic reaction ( H = + 49 kJ · mol 1 ) called methanol reforming which can achieve 100% conversion ratio.
C H 3 O H + H 2 O   C O 2 + 3 H 2
It needs to be catalysed and produces a reformate gas with CO2 and also CO trace. Cu/ZnO–based catalysts are commonly considered to achieve efficient catalyst at low temperature. Among them CuZnAlOx and CuZnGaOx are specifically assessed and gives good performance at low temperature.
The perspective of methanol use remains uncertain. First the low-temperature catalyst material needs important improvements in terms of activity and durability. Second methanol is expensive. It is maybe a sign its use as an energy carrier to promote hydrogen end-use is debatable because involving to many sub-systems. The global model from primary feedstock to end-use should be comprehensively assessed. The relevance of using chemical hydrides, such as ammonia NH3 and methanol, to store and transport hydrogen at high density is currently an open question. The debate also encompasses whether the chemical hydrides should be converted back into dihydrogen or used directly as an energy source. Note that this global question only makes sense in case the H2 production plants are far away from the consumption locations. In the specific case of road transportation where local air pollution reduction is at stake, using on-board pure hydrogen in a FCS seems mandatory. Consequently using the chemical hydrides as intermediate energy carrier becomes much less relevant since this approach adds new converters, complex routes and hence increases the CAPEX and OPEX as well as reduces global energy efficiency.

Natural Hydrogen

As regards green hydrogen, natural hydrogen is also worth mentioning. Although dihydrogen has long been considered as a non-existent natural source, several sites of dihydrogen emission have been identified. The first discoveries have been made on the seabed, which is not economically viable. Recently, some have been found on the continents (Iceland, Sicily, California, Russia, etc.). The clear origin of these emanations has not yet been discovered. However, these sources emitting a gas more or less rich in dihydrogen are now being actively sought by satellite images. To this end, the European Space Agency (ESA) launched the sen4H2 project in 2019, for Sentinel Data for the Detection of Naturally Occurring Hydrogen Emanations [40]. The large-scale exploitation of these deposits could significantly change the hydrogen energy paradigm from an energy carrier to a primary source. The natural hydrogen exploitation gives high hope. The estimated cost of hydrogen production based on rich on-shore natural reservoirs is lower than any other manufactured hydrogen production [65]. To provide certainty for future investments, companies and geological experts are combining efforts to monitor and understand easy access sites [66]. Currently, this prospect is uncertain and, if exploitation potential is proven, remote.

3.2. H2 Storage

Dihydrogen vector enables to partially decouple an intrinsically intermittent renewable energies production from the final energy demand. Addressing H2 large-scale storage is therefore a key point of this intermediate energy vector. Storage is characterized by its cost, the abundance of the materials used, its volume and mass densities as well as the purity of the dihydrogen finally distributed and the capacity to receive or deliver large flows (i.e., its charge and discharge powers).
There is a very wide variety of hydrogen storage (in molecular or atomic form). Considering the levels of maturity reached and the full cost of such storage, few of them are capable of providing large-scale solutions. The storage currently in use is the physical storage of the hydrogen molecule in its pure state, either in gaseous or liquid form. Other approaches exist and can be classified in two categories. First the adsorption of the hydrogen molecule on or in materials based on Van der Walls forces. Second the use of chemical bonds to absorb hydrogen atoms in materials: metal hydrides (based on Manganese for example) and chemical hydrides [52,67].

3.2.1. Gaseous Storage

At atmospheric pressure, dihydrogen has a low volume density. Under standard conditions, its volume density is 0.091 kg·m−3, i.e., 1 kg of H2 requires a volume of 11 m3. It is therefore mandatory to compress it. Based on the ideal gas law hyperbolic form, the incremental gain in volume density tends towards zero as the pressure increases. Moreover, the cost and mass of the materials used to ensure this pressure resistance increase regularly with the pressure increase. Consequently, the compressed gas storage pressure is set at an optimum point based on the specifications. The automotive industry has opted for on-board storage at the rated pressure of 700 bar. This option is quite expensive and is only justified to ensure vehicle integration. Note also that 15% of LCVH2 is the energy required to compress H2 to this high pressure. For stationary applications [67], the standard pressures are 100 bar for surface tanks and 200 bar for underground storage. For the former, different forms exist; pipelines with a diameter of 1.4   m and a few kilometres in length are the preferred option. Underground storage benefits are (i) a limited floor space use and (ii) a reduce of dihydrogen loss through tank permeation. However, it makes its monitoring more delicate. Geological storage is being considered and implemented. It enables low cost storage of large quantities of dihydrogen. Saline cavities appear to be the most suitable solutions in terms of cost, leakage level, speed of filling and gas restitution, and risk of H2 contamination. Other geological solutions are, for example, former oil reservoirs (oil or natural gas). Emblematic storage sites in salt caverns exist in the United Kingdom (Teesside) and in the USA (Texas). Although their great interest, the natural reservoirs option cannot be generalized and correspond to large-scale centralized solutions.

3.2.2. Liquid Storage
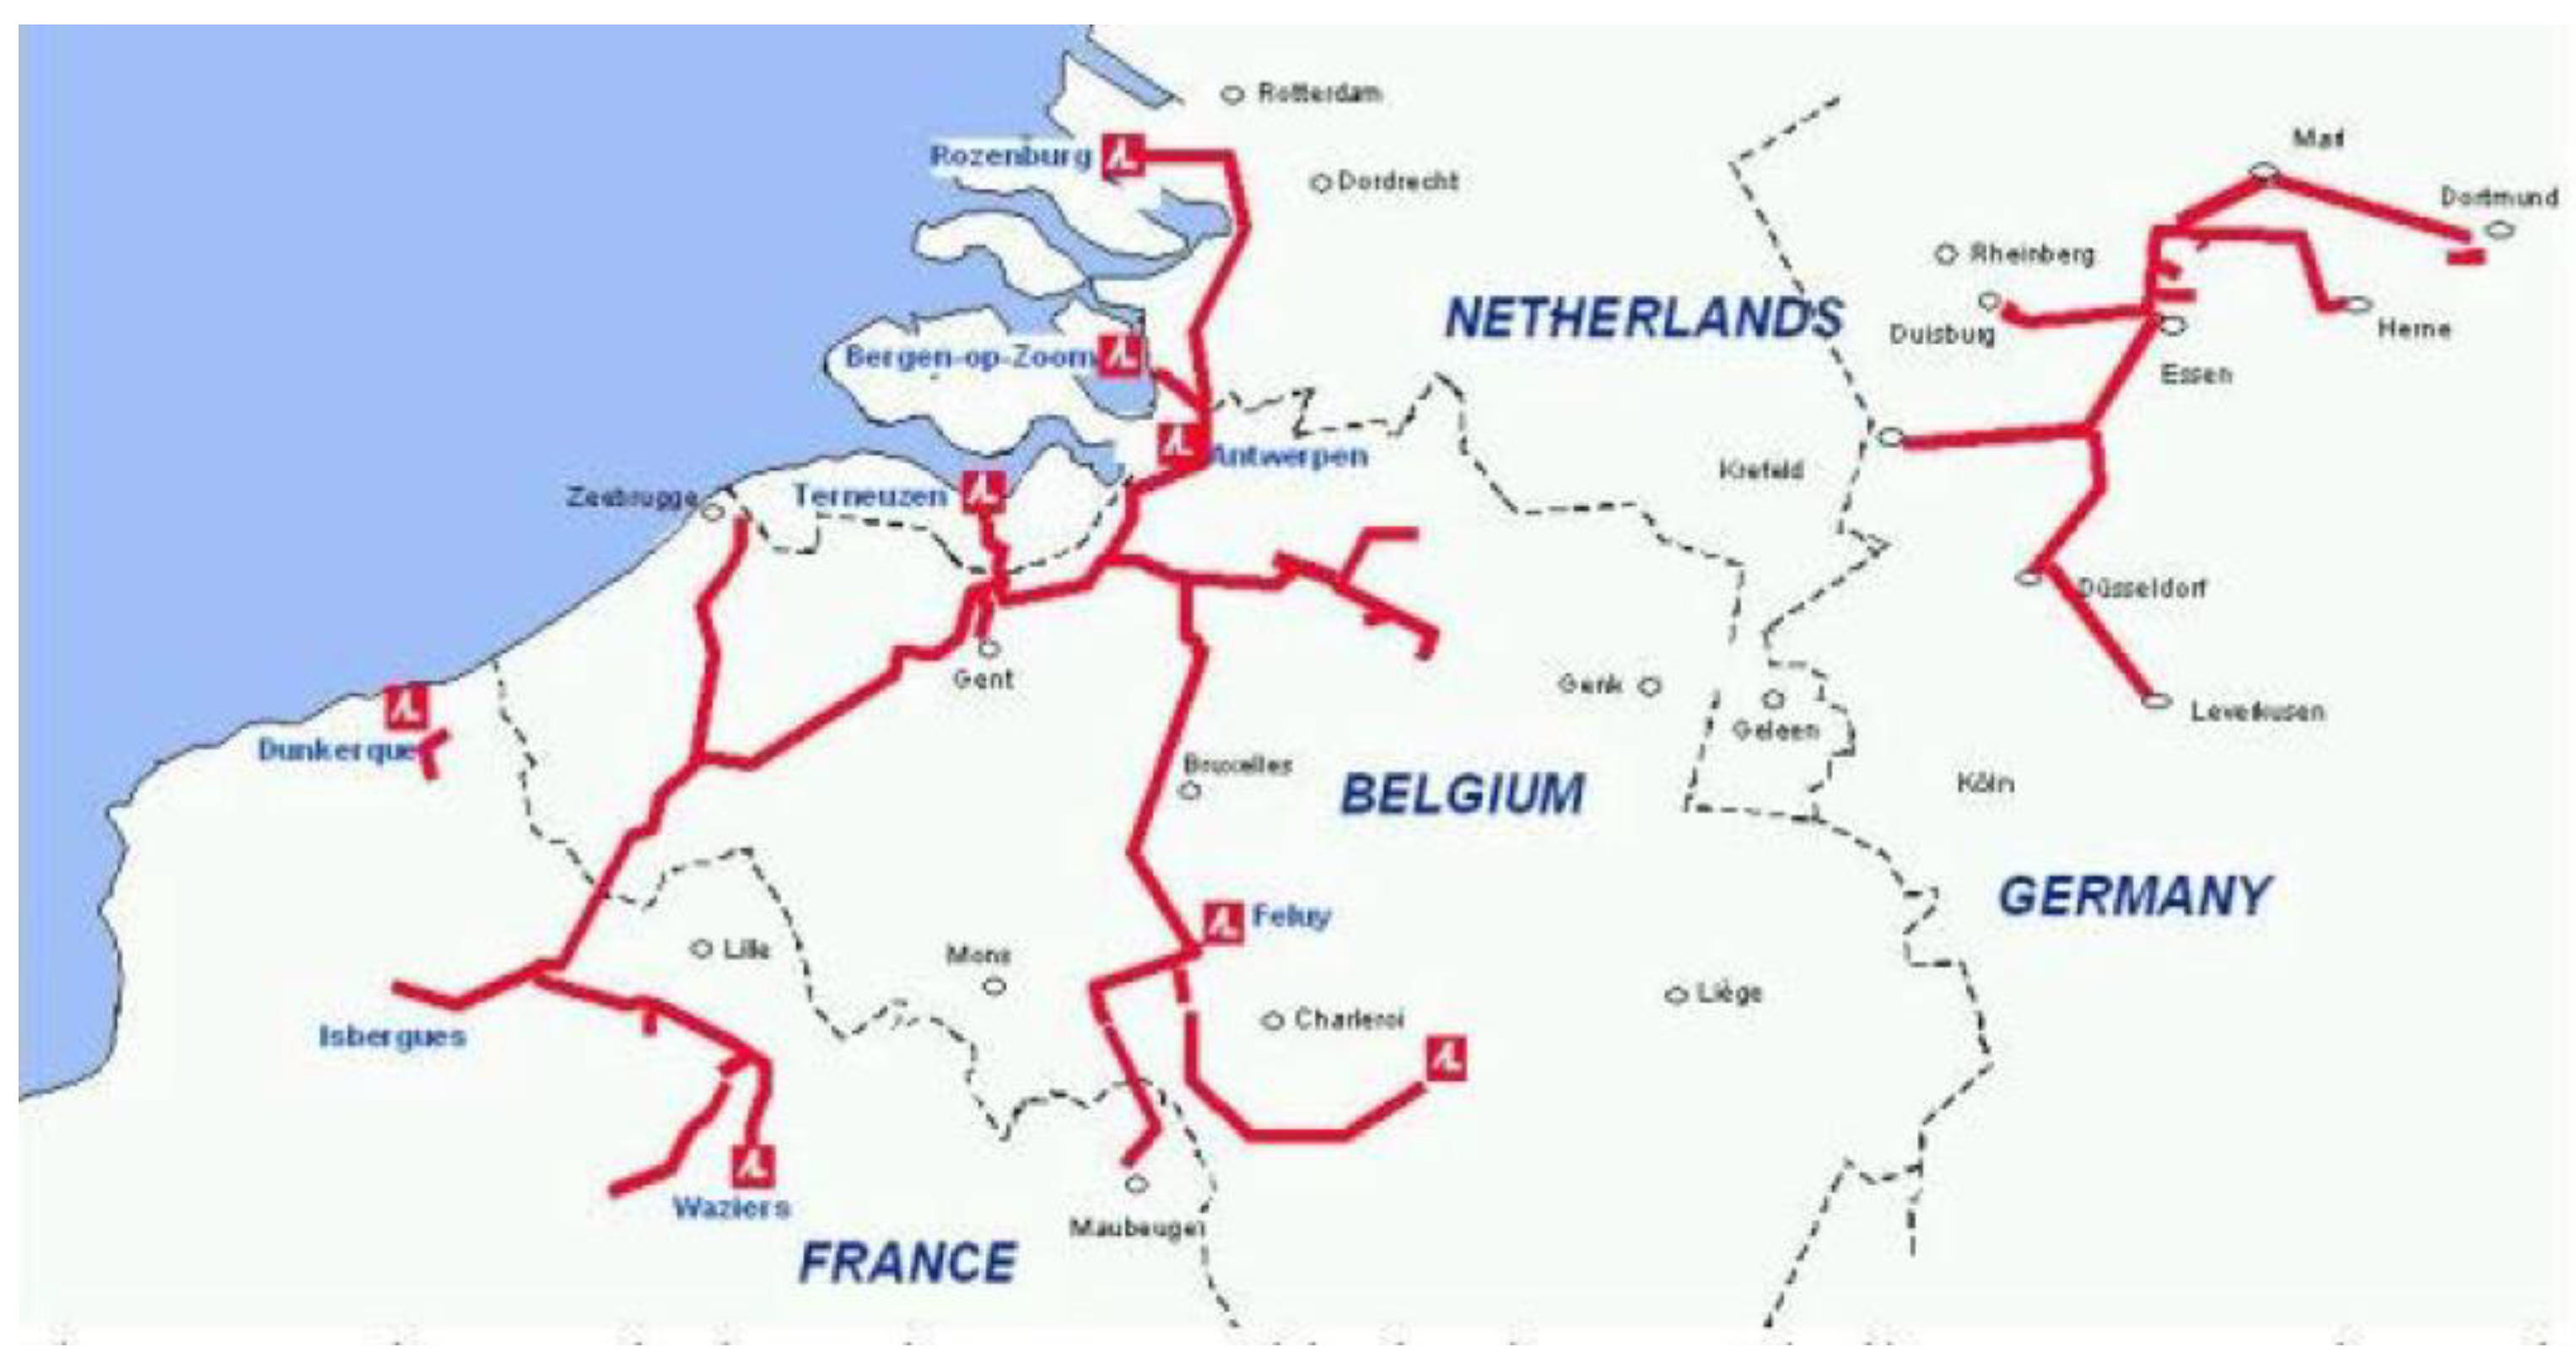
An apparently attractive solution to improve the H2 storage volume density is to liquefy the gas. At atmospheric pressure, its volume density increases to 70 kg.m−3, but its temperature must remain below its boiling point, i.e., −253 °C. This operation imposes two major energy losses and significant storage costs. The liquefaction system achieves the first energy consumption, regardless of the storage duration. Based on current technology, the liquefaction of 1 kg of H2 requires 10 kWhelec = 36 MJ of electrical energy. Considering the H2 LCV, 30% of the energy of this kg has been consumed. The second energy loss enables to maintain the tank at its cryogenic temperature. In addition to the double walls and insulation of the tank, large storage volumes are mandatory in order to minimize the surface⁄volume ratio. Despite all these technological choices, it is considered that 0.1 % of energy is lost per day. In conclusion, this storage can only be dedicated to short duration or low time constant needs and for very specific applications. The liquid H2 tanks of the rockets are an emblematic example.

3.3. H2 Transport

Today, two types of solutions coexist to transport dihydrogen and a third is under development.
The first is a network of gas pipelines to link the H2 production centers to the major chemical industrial centres using it. These networks are owned and operated by groups such as Air Liquide and Air Products in the European region of Netherlands—Belgium—Northern France—Rhine Germany. Figure 5 illustrates the networks of about 1600 km owned and operated by Air Liquide in this region. The pipeline system works at a pressure of 3 to 100 bar, is made of standard steel with diameters from 1 to 300 mm. This technique can be considered as mastered insofar as the 240 km Rhine network was developed in 1938 and is still operated without accidents [40,68]. For connecting large production and consumption centers with high flows, this transport option is the least expensive method. It is nevertheless only suitable for modest distances since the auxiliaries consume 1.4% of LCVH2 every 150 km. By way of comparison, RTE (the electricity transmission system operator of France.) claims 2.3% of losses in the entire French transmission and distribution power system with exceptional reliability, attested by an Equivalent Outage Time (EOT) of a few minutes (1 min 27 s in 2017) [69]. In the context of green hydrogen widespread use, the electricity and hydrogen carriers must work in synergy. Electricity transport provides global coverage and long-distance transport, while the hydrogen infrastructure is local and optimized to reach both the main consumption centers and the areas suitable to mass storage where electrolyzers must also be installed. If seasonal storage is not crucial, on-site electrolysis combined with small-scale storage becomes the preferred option!
The second means of conducting H2 is overland transport, either by road (trucks) or rail (trains) through racks of steel cylinders of compressed gaseous hydrogen (200 bar) and sometimes tanks of liquid hydrogen. Experiments are underway to increase the pressure of the cylinders to 700–900 bar. The cylinders are more expensive (increased CAPEX) but their use is more efficient (reduced OPEX). Basically, this delivery approach is very expensive. It has a significant effect on the price of the H2 distributed and also a major environmental impact. According to the French Environment and Energy Management called ADEME, hydrogen truck transport emits, every 100 km, about 1 kg equivalent of CO2 for every 1 kg of H2 transported [70]. In this context, ADEME recommends to stay well below a threshold distance of 100 km. Consequently road transport must be reserved for the last few kilometers to supply the service stations (which would not adopt the local electrolyzer option).
H2 long-distance shipping is still in the project and demonstration stage. This third option based maritime transport aims at transporting liquid hydrogen over long distances in order to connect low-density areas suitable for low-carbon electricity production (PV and wind power) with areas of high mobility consumption. The idea is to use the hydrogen losses from cryogenic tanks to propel the ship.

3.4. H2 distribution
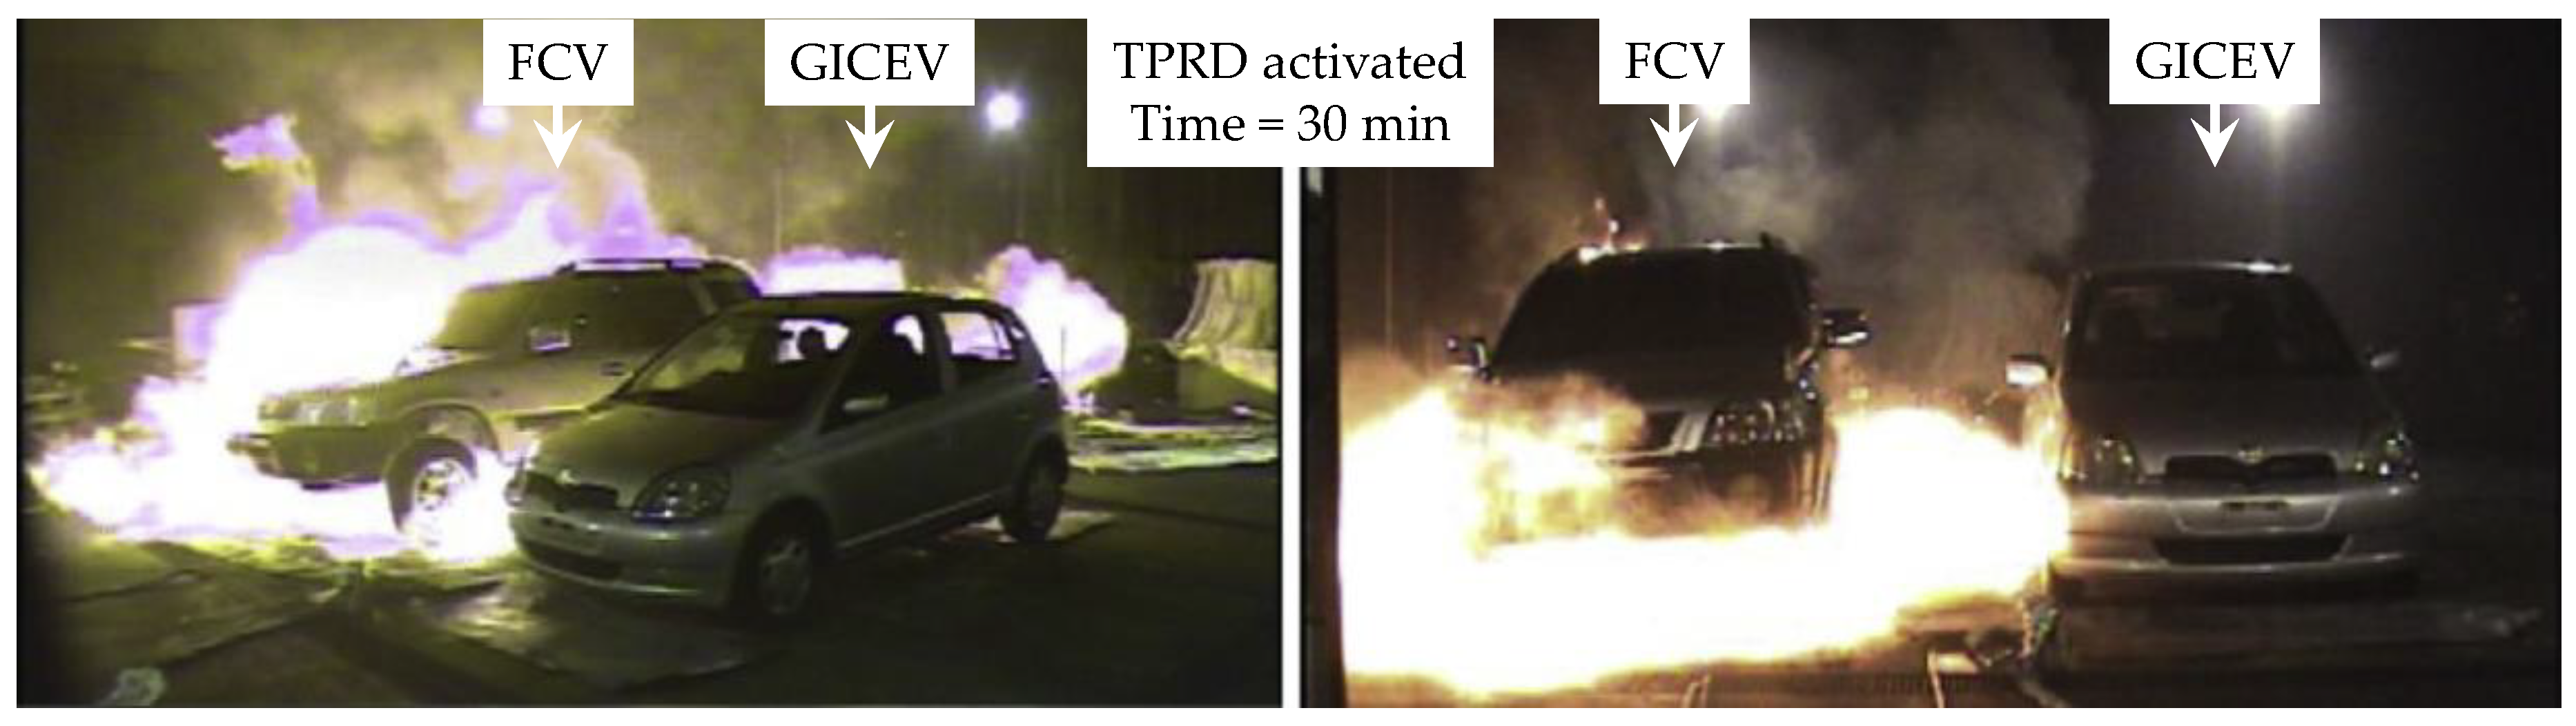
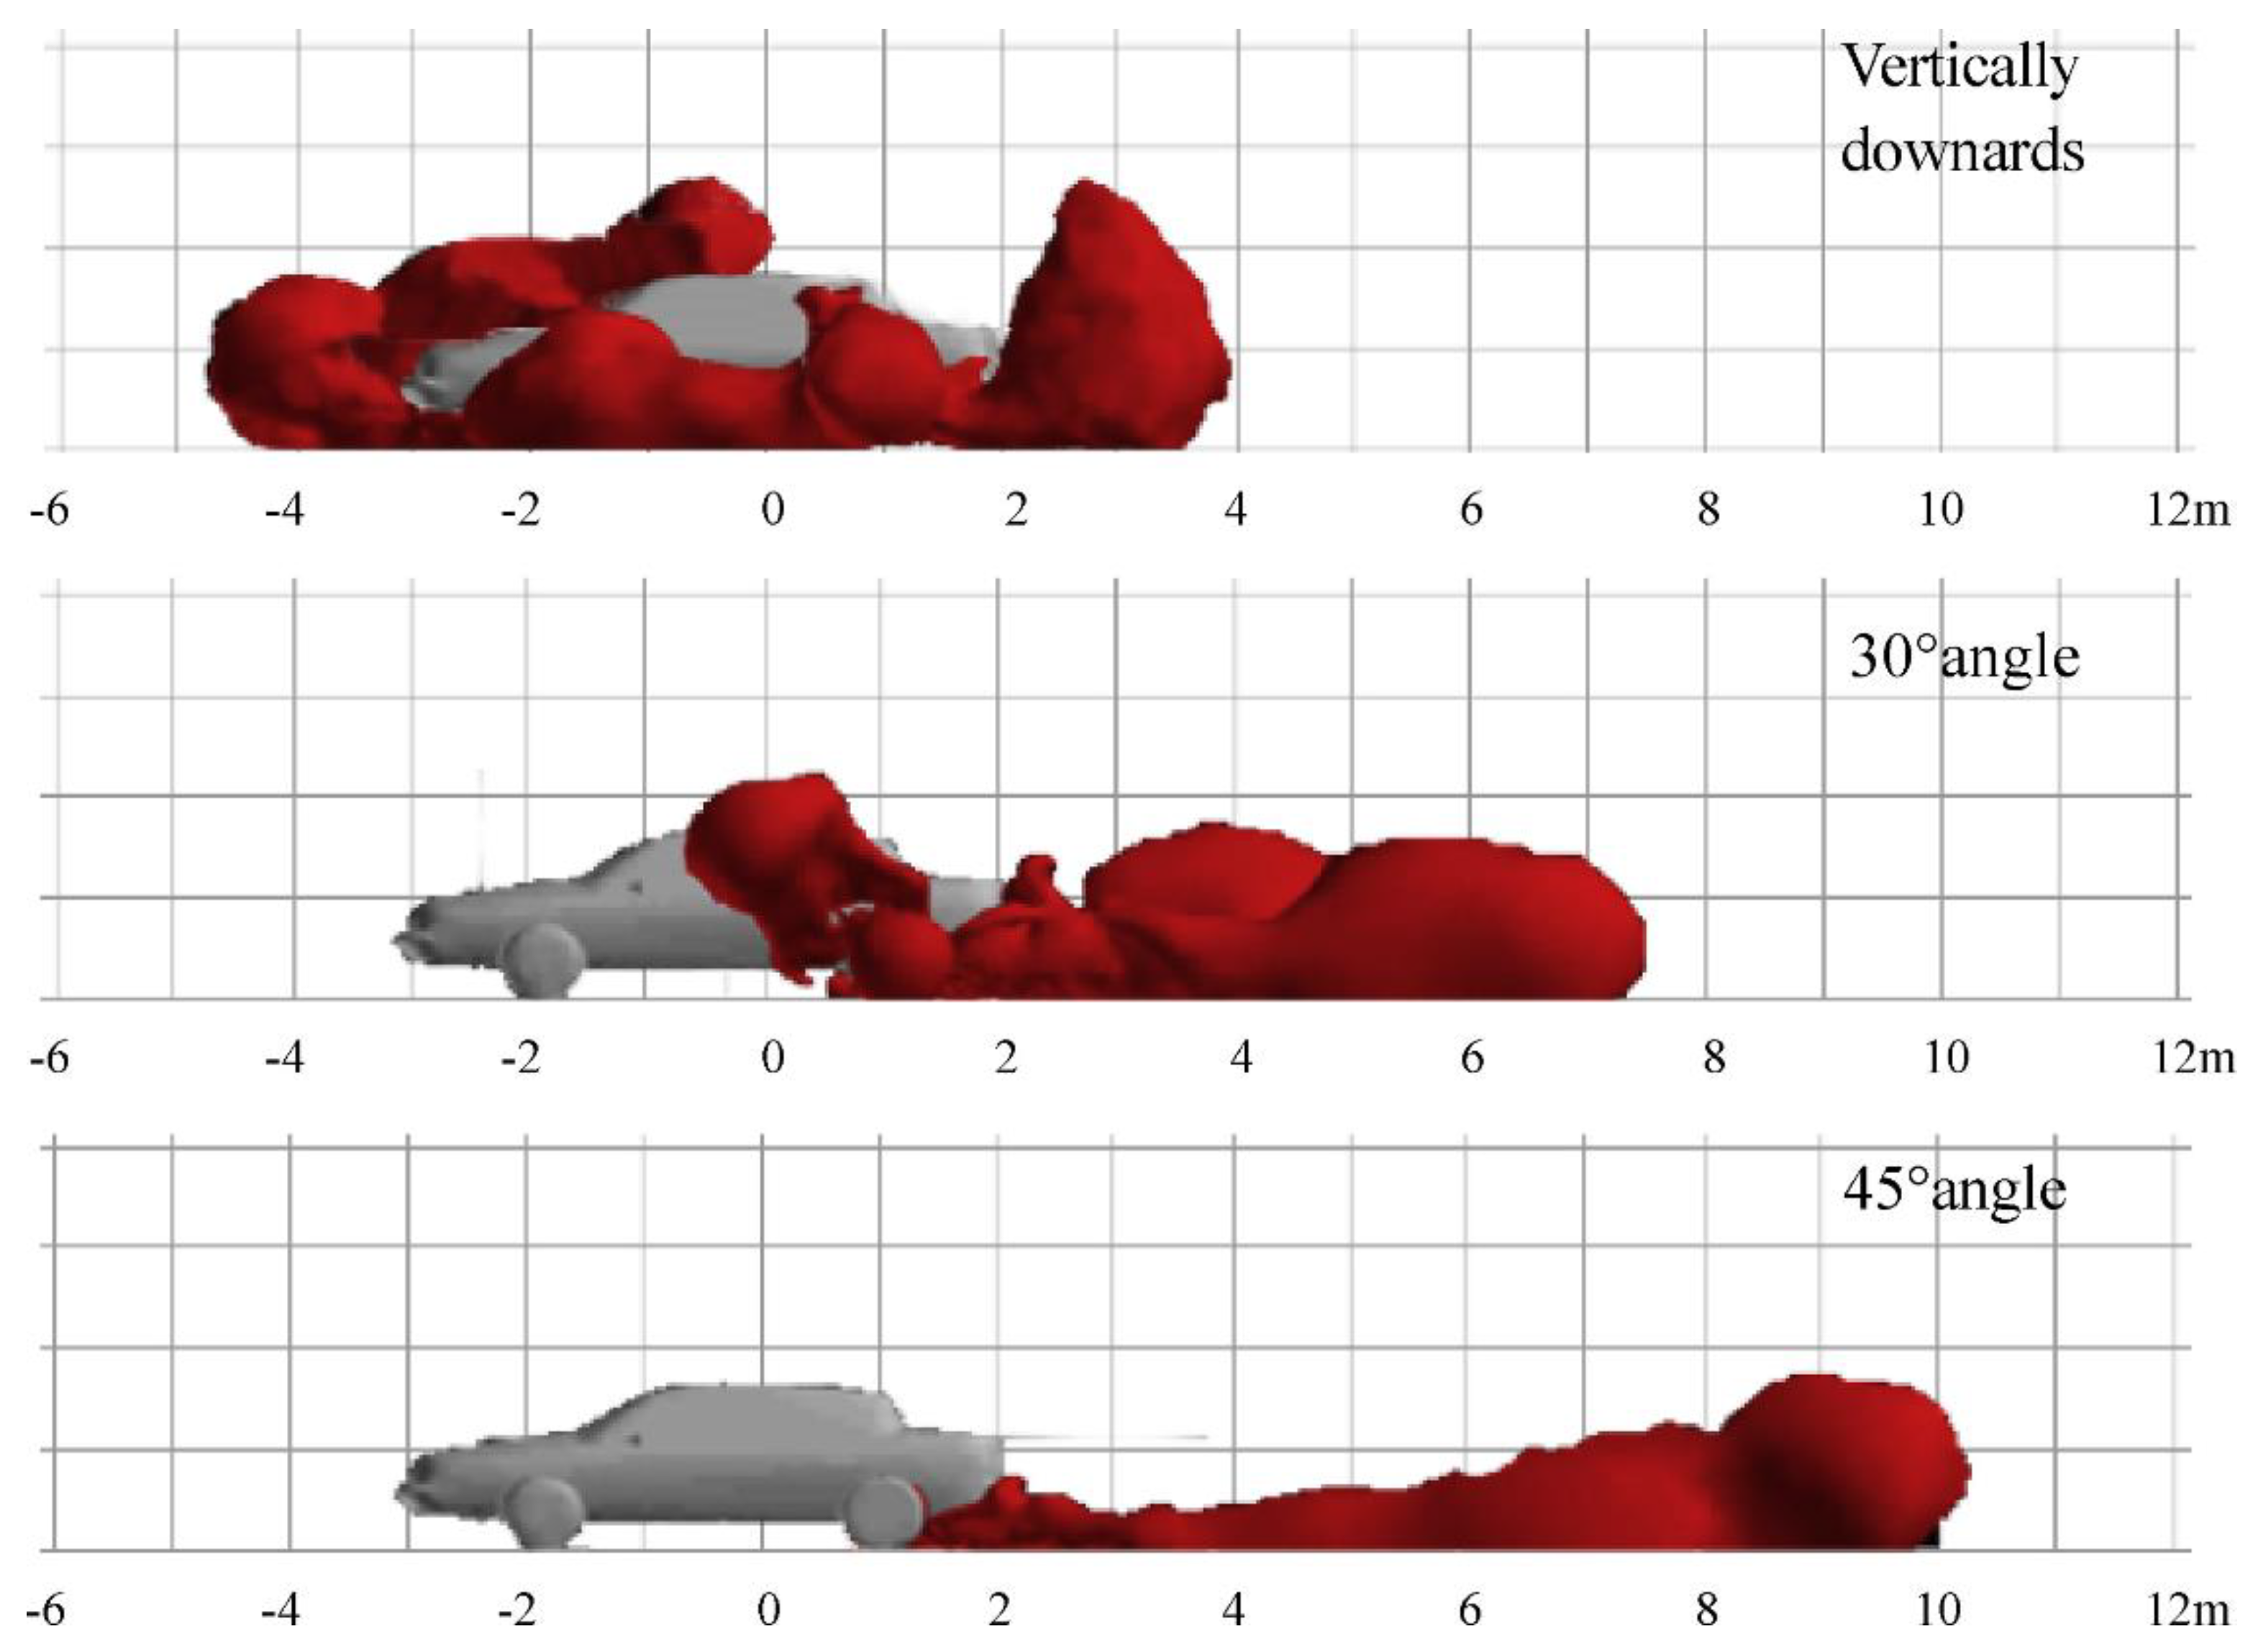
At the end of 2019, 432 H2 refueling infrastructures were in service worldwide, including 330 open to the general public. At the beginning of 2020, France has about thirty H2 stations allowing the road vehicles tanks to be recharged either at 350 bar, or 700 bar, or at both standard pressures. Some stations are reserved for captive fleets of vehicles. Filling is fast and ranges from 3 to 5 min for 5 kg of gas. This is a competitive advantage both regarding vehicle availability and considering the floor space used by the equipment. In fact, the current quick charging stations for BEV have a power of 50 kW which cannot always be exploited in order to respect the critical temperature threshold of the battery. Therefore, to recharge a battery of 83.3   kWh corresponding to the energy stored in 2.5 kgH2, the vehicle should at least occupy the charging station for 1 h 20 min. Hence, quick-charging BEV stations operators are developing an economic model mainly based on the charging space occupancy time. Strictly from a (fast) recharging point of view, within the recharging time of a BEV (of comparable functionality), the hydrogen station can recharge 20 FCV. For such intensive use, the footprint of the hydrogen filling station is clearly favorable.
Note that regarding zero emission electric vehicles, BEVs technology commonly shown as a competitor to FCVs solution [71] whereas they are complementary both in terms of use [72] and distribution. Regarding the latter point, Bansal et al. demonstrated that combining BEV and FCV charging in a single station was the optimal design solution both in terms of cost and grid infrastructure. These findings can lead to a relevant infrastructure policy based on the recent Korean study showing that drivers are willing to pay for accessibility with charging stations close from home [54].

3.5. H2 Safety

The safe use of dihydrogen both in the vehicle and in the overall infrastructure is a major issue of social acceptability of this technology. International standards and regulations for the various components and systems (stationary and on-board) exist or are being developed to frame the design, use and maintenance of this new hydrogen application.
Hydrogen has been used for over a century in industrial applications with a high level of safety. Its use in a professional environment is therefore no more dangerous than that of natural gas or liquid hydrocarbons.
The risks are specific and a good hydrogen hazards knowledge allows a safe use of the infrastructure and the final systems. First hydrogen is a particularly volatile gas which, through permeation, penetrates and passes through certain materials. This property may lead to permanent very small leakage and appropriate materials have to be selected to ensure the correct H2 impermeability. For instance, type IV H2 vessels uses high-density polyethylene liner to limit H2 permeation, whereas aluminum liner is sufficient for lower pressure (type III). Second H2 molecules may dissociate at certain metallic surface into atomic hydrogen. Atomic hydrogen is a powerful reducing agent, even at room temperature. It diffuses easily in the metal bulk and accumulates in its defects forming brittle metal hydrides which cause unwanted mechanical plastic behavior and, with time, hazardous metal cracking. It is mandatory to avoid any embrittlement phenomenon in any H2- dedicated device. This issue is easily addressed selecting the appropriate raw materials or implementing relevant coating [73]. Third hydrogen is a gas that can easily combust with oxygen from the air. The activation energy of ignition is extremely low, namely 20 μJ, which is ten times less than natural gas! Moreover the combustion flame is colorless, its temperature is very high ( 2000   ° C ) and its speed very high (~260 cm.s−1). Ignition can occur within a wide volume concentration range of (4%–75%). Detonation takes place in a smaller but significant range of (13%–65%). Based on H2 very high diffusivity, the strategy is therefore to avoid reaching a 4% concentration even in the event of a system failure. Due to the very high diffusion velocity of this gas in air (its air diffusion coefficient is 0.61 cm2.s−1), it is easy to achieve a low H2 concentration in an open environment even with dense tanks ( 700   bar pressured gas or liquid). Conversely confined environments must be treated with the utmost caution to avoid a cloud formation. Active or passive air circulation makes it possible to avoid this danger because of the high diffusivity mentioned [39,74]. Fourth, another danger lies in the frequent use of high pressures to ensure a high gravimetric and volumetric density [39,74]. Indeed, Dryer et al. [75] first demonstrated the possible self-ignition of compressed hydrogen sudden release into air. This spontaneous ignition of the gas mixture leads to continuous combustion and is mainly due to the shock wave at the boundary between low pressure air and high-pressure dihydrogen. Hence spontaneous ignition is a concern for type III and IV H2 vessels. The general idea is to control leakage that can dramatically occur when the H2 vessel wall becomes mechanically inefficient regarding high pressure. This is typically the case at high temperature. That is the reason why, international standards compel any hydrogen vehicle to have its hydrogen tank equipped with an active valve that monitor the temperature and releases the compressed hydrogen as soon as the 110 °C temperature setpoint is reached. This system is called TPRD for the thermal pressure relief device [76]. The general idea is to liberate the flammable/explosive hydrogen gas at a controlled flow rate and therefore benefit from H2 high diffusion capability. Hence, if TPRD works properly, it potentially enables to avoid explosion and limit the fire damages. The efficiency depends of course of the environmental operating conditions. In any case, this system permits to involve not more than a few per cent of the tank available energy which dramatically reduces the consequences of a catastrophic tank rupture [76,77]. To reinforce the FCV security, two projects are under study. First, some research centers, like HySAFER in UK, work intensively on thermic barrier that permits to slow down the temperature rise of the H2 vessel in case of fire (or any thermal source) and TPRD non-functioning (valve failure or local fire remote from the temperature sensor). The start time of the high-pressure tank rupture, which normally ranges between 6–12 min, is then increased permitting to mitigate the human and material consequences of the accident. The ultimate goal of research teams is to reach an infinite time [78]! Alternatively, other projects intend to optimize the TPRD functioning while keeping its cost low. The general idea is to actively control operating conditions during intended hydrogen release to mitigate the effect of the local fire hazard which could endanger passengers or pedestrians close to the FCV [79]. The purpose of adapting the TPRD in a rotary release device is to project the H2 flow into an empty space and to allow the exit of the passengers from the damaged car. To achieve an efficient implementation, the emergency system requires several temperature sensor to monitor the H2 vessel, the passenger compartment and the surroundings of the FCV (up to 12 m away). The processor unit determines in real time the best release device orientation.
Figure 6 shows a controlled fireball surrounding a FCV car during a classic TPRD activation. Note that the adjacent car only ignited 28 min after TPRD activated (Time = 58 min). Conversely, in Figure 7, numerical simulations illustrate the attractive approach of a fully active control of the TPRD. Using the appropriate angle enables passengers to go safely out the fired FCV.
The safety challenge lies in controlling the risk in the new use of hydrogen mobility. Indeed, it implies decentralized use, often in small units and by the general public, and therefore with very varied operating conditions. In addition, vehicles can be stored and used for very long periods and maintenance is poorly controlled. The regulatory framework for the hydrogen-energy carrier is still being defined between the players, the technical centers and the administration. At the European level, EC regulation n°79/2009 and its application directive 406/2010 govern FCVs and the 2014/94/EU standard details the recommendations relating to alternative fuel infrastructures.
On Monday 10 June 2019, a hydrogen station exploded in Oslo suburbs without causing any fatalities, but creating a road accident by the untimely triggering of the airbags of a vehicle travelling nearby. It seems that the explosion was due to a gas leak. The firemen stopped the fire in less than three hours [80]. A month earlier, in South Korea, the hydrogen tank of a government research project exploded, killing two people and injuring six others [81]. These examples show that safety remains an open topic despite the precautions taken by automobile manufacturers and hydrogen producers and distributors to obtain demonstrators that are attractive to the general public.

4. Conclusions

In the general context of limiting air pollution and noise emission in large urban areas, many state or international legislations tend to promote zero-emission vehicle (ZEV). This effort has to combine with the general challenge of limiting GHG emissions and using limited resources in all sectors including road transportation. As ZEV, BEVs seem good candidates to meet urban light vehicle requirements while FCVs could fulfill the specifications of long-distance or heavy duty vehicles. Regarding this very emerging sector, several manufacturers have successfully integrated FCSs into both light and heavy-duty vehicles. These pilot projects shows that hydrogen mobility is relevant while considering (i) its energy density, (ii) the H2 storage cost and (iii) the very fast energy transfer to the vehicle. The present study shows that many barriers to FCV development still need to be overcome so as to switch from current scale of a very small series product to the desired large commercialization deployment. Several key points were highlighted.
  • First, onboard FCS still requires further enhancements in term of cost, durability and environmental footprint. Mainly, the physical (mass transport) and electrochemical phenomena occurring at nano, micro and milli scales in the active layer of the FC electrode still need better fundamental understanding. Previous continuous progress and current investigation efforts promise many new conceptual advances which would initiate real technological breakthroughs. At the beginning of next decade, it would be reasonable to expect that FCS will address low cost, high durability car/truck specifications. At that point, mature technology could enable to develop environmental-friendly manufacturing and disposal processes. Apart from the FC, the H2 storage also requires both an improvement of its life cycle and new shape to enhance its integration capacity inside the vehicle.
  • Second, hydrogen production route reveals to be a crucial choice to ensure a positive impact on energy consumption and GHG emissions. Electrolysis is one of the pathway since it is based on excess of renewable electricity. Similarly, biomass-based hydrogen generation is expected to be attractive processes provided that biomass feedstock relies on wastes. In both cases, production on an industrial scale of such green hydrogen will gradually grow up. Obviously, regarding global footprint reduction, the first best use of such green hydrogen is to convert present grey industrial use into green one. Consequently, green hydrogen as an energy carrier for transportation should actually start in the next decade. Basically, this lack of an immediate green hydrogen is a bottleneck to low-carbon FCV development but is fully in line with the current forecast of the FCV commercial maturity.
  • Third, hydrogen-powered transportation and especially road vehicles sector has to face safety issue in order to warranty lower probability of hazardous accidents than standard gasoline option. This issue has already been successfully addressed for more than a century by the chemical industry which has develop a reliable and safe infrastructure (production—transport—storage—distribution) for its own usage of hydrogen (as a process agent). However, switching from these highly centralized applications managed by skilled staff to a consumer product used in various operational conditions is a challenge. Research studies show real opportunities to control risk. Taking into account any hazardous circumstances without significantly impacting the costs use and maintenance complexity remains an open question. That is the reason why the first step to really develop hydrogen mobility in intensive applications is to start with captive fleets (transport and distribution truck fleets, bus fleets and company utility vehicle fleets). These experiments, although limited in scope, focus on use cases that can be comprehensively monitored and studied. Their concrete deployment, with its unprecedented articulation of the entire sector involved in this mobility, will allow manufacturers to capitalize on real feedback and thus to learn and build the best trade-offs with a view to generalization. These pre-industrial demonstrators, by improving technological knowledge, working on the question of societal acceptance and revealing the true ways of using every device of the value chain, will allow technological solutions to emerge at limited cost and appropriate regulations to answer the crucial question of security.
  • Finally, the key outcome is that the beginning of large-scale commercialization of hydrogen-powered vehicles will possibly begin in the 2030–2035 years when the yet unresolved questions will be fully addressed. In the meantime, it will be crucial to design the whole hydrogen economy to achieve a low environmental footprint. Achieving consistent comparative studies of each transportation option will enable to define efficient deployment strategies. It requires steady data set based on both well-established processes and business models. In this respect, the present pilot projects will also enable to draw initial meaningful conclusions on the benefits and limits of hydrogen-powered transportation sector.

Funding

This research received no external funding.

Conflicts of Interest

The author declares no conflict of interest.

Abbreviations

ADEMEFrench Environment and Energy Management
APUAuxiliary Power Unit
AWEAlkaline Water Electrolyzer
BEVBattery Electric Vehicle
BPBipolar plate
CAPEXCapital Expenditure
CCUSCarbon Capture, Utilization and Storage
DDiesel
DICEVDiesel Internal Combustion Engine Vehicles
DoEUS Department of Energy
ECEnergy Consumption
EOTEquivalent Outage Time
FCSFuel Cell Systems
FCH-JUFuel Cells and Hydrogen - Joint Undertaking
FCVFuel cell vehicle
GGasoline
GICEVGasoline Internal Combustion Engine Vehicles
GHGGreenhouse Gas
H2Dihydrogen
HCVHigher Calorific Value (or gross calorific value)
HGVHeavy Good Vehicle
ICEVInternal Combustion Engine Vehicle
IEAInternational Energy Agency
JRCJoint Research Centre of the European commission
LCALife Cycle Assessment
LCVLower Calorific Value (or net calorific value)
MEAMembrane Electrode Assembly
OPEXOperational Expenditure
PEMEProton Exchange Membrane Electrolysers
PEMFCProton exchange membrane fuel cell
PGMPlatinum-Group Metal (Ru, Rh, Pd, Os, Ir and Pt)
PtPlatinum
PFAFrench automotive industry players association
RTEThe electricity transmission system operator of France
SOESolid Oxide Electrolyzer
TPRDThermal Pressure Relief Device
TRLTechnology Readiness Level
VVehicle
WtWWell-to-Wheel
ZEZero-Emission
ZEVZero-Emission Vehicle

References

  1. Thompson, S.T.; James, B.D.; Huya-Kouadio, J.M.; Houchins, C.; DeSantis, D.A.; Ahluwalia, R.; Wilson, A.R.; Kleen, G.; Papageorgopoulos, D. Direct hydrogen fuel cell electric vehicle cost analysis: System and high-volume manufacturing description, validation, and outlook. J. Power Sources 2018, 399, 304–313. [Google Scholar] [CrossRef]
  2. Béthoux, O. Hydrogen Fuel Cell Road Vehicles: State of the Art and Perspectives. Energies 2020, 13, 5843. [Google Scholar] [CrossRef]
  3. Marx, N.; Hissel, D.; Gustin, F.; Boulon, L.; Agbossou, K. On Maximizing the Steady-State Efficiency of a Multi-Stack Fuel Cell System. In Proceedings of the 2018 IEEE Vehicle Power and Propulsion Conference (VPPC), Chicago, IL, USA, 27–30 August 2018; pp. 1–6. [Google Scholar] [CrossRef]
  4. Marx, N.; Hissel, D.; Gustin, F.; Boulon, L.; Agbossou, K. On the sizing and energy management of an hybrid multistack fuel cell—Battery system for automotive applications. Int. J. Hydrog. Energy 2017, 42, 1518–1526. [Google Scholar] [CrossRef]
  5. Marx, N.; Cárdenas, D.C.T.; Boulon, L.; Gustin, F.; Hissel, D. Degraded mode operation of multi-stack fuel cell systems. IET Electr. Syst. Transp. 2016, 6, 3–11. [Google Scholar] [CrossRef]
  6. de Bernardinis, A.; Frappé, E.; Béthoux, O.; Marchand, C.; Coquery, G. Multi-port Power Converter for Segmented PEM Fuel Cell in Transport Application. Simulation with fault tolerant strategy. Eur. Phys. J. Appl. Phys. 2012, 58, 1–15. [Google Scholar] [CrossRef]
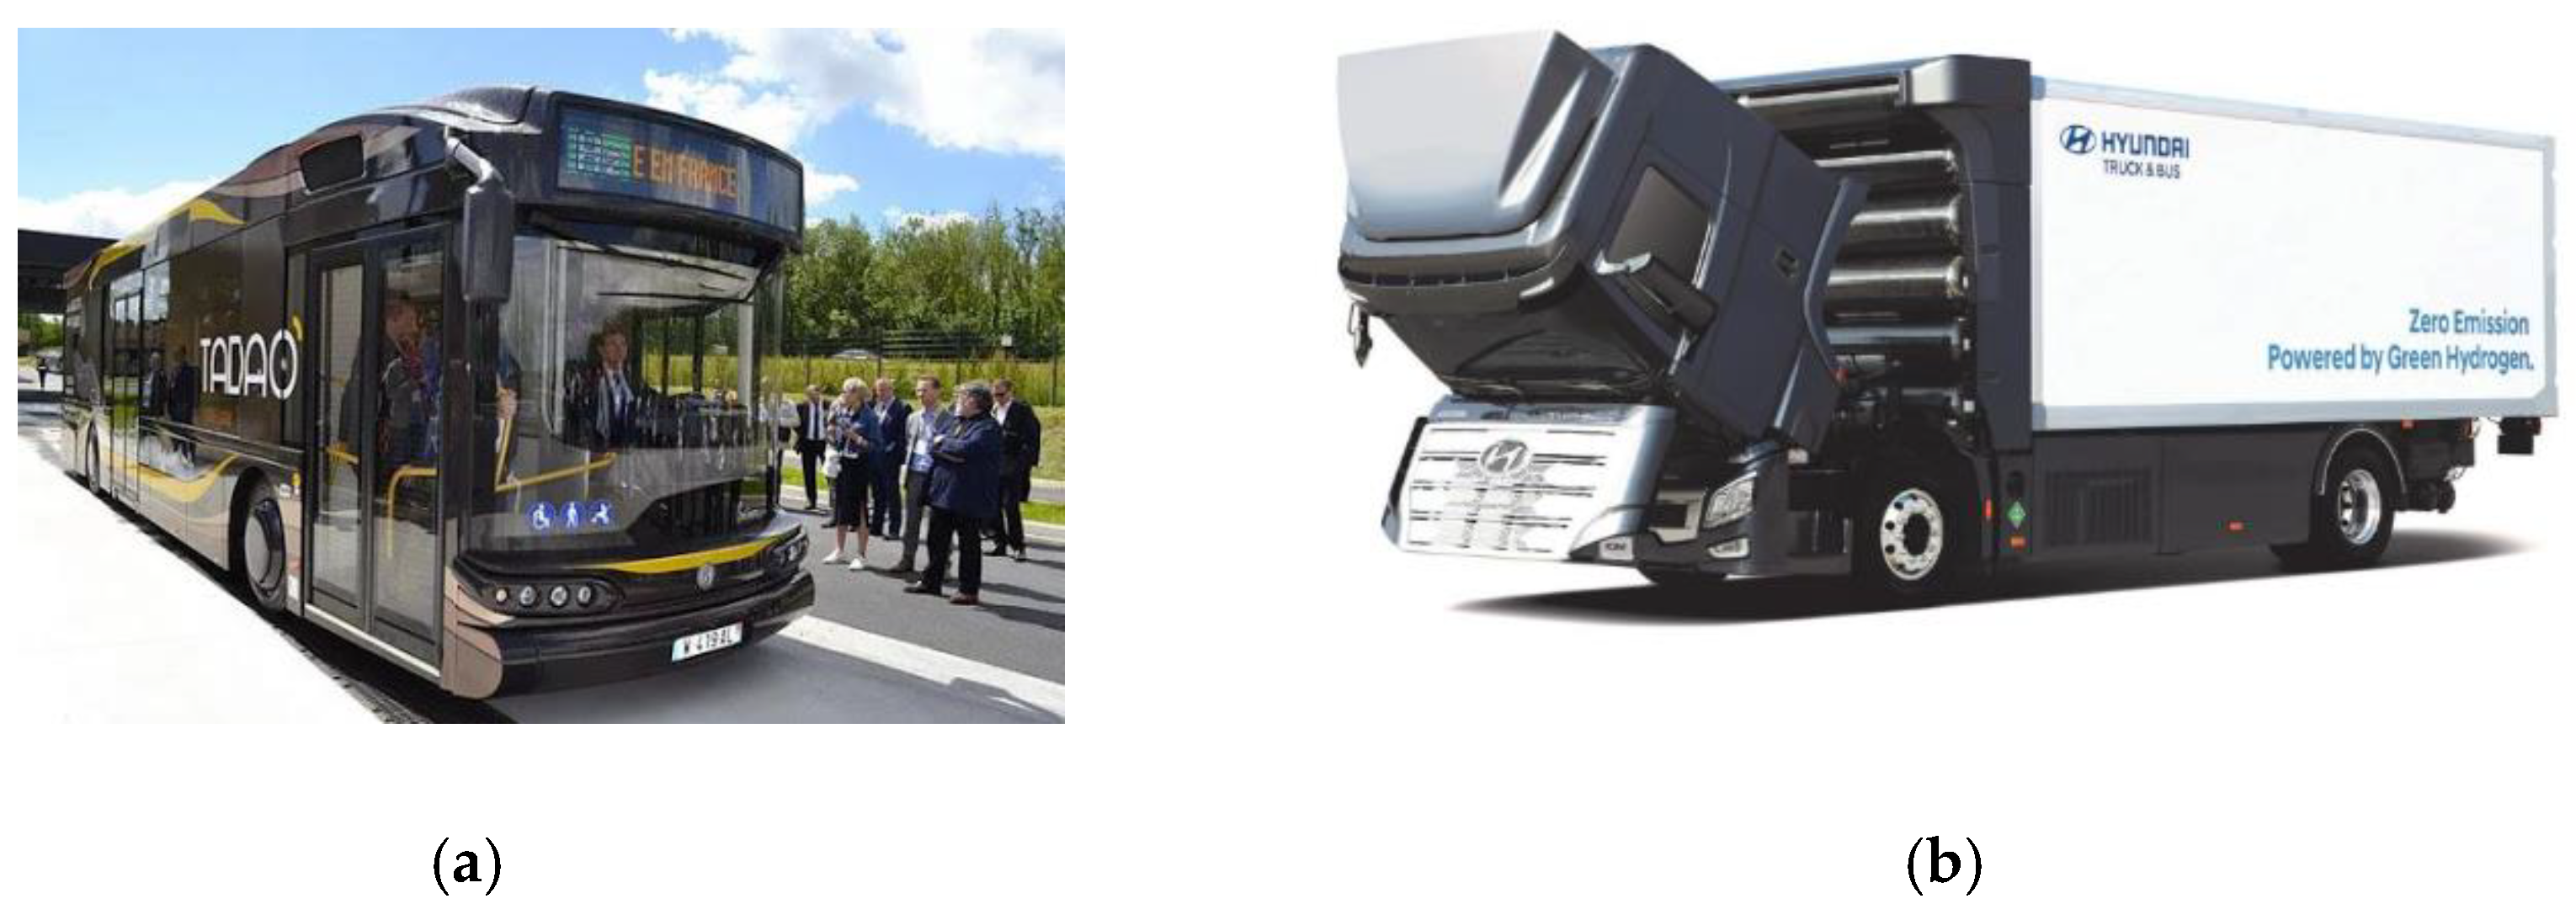
  7. Eckert, V.; Revill, J. Powered by Hydrogen, Hyundai’s Trucks Aim to Conquer the Swiss Alps; Reuters Agency: London, UK, 2020. [Google Scholar]
  8. Yang, Z.; Wang, B.; Jiao, K. Life cycle assessment of fuel cell, electric and internal combustion engine vehicles under different fuel scenarios and driving mileages in China. Energy 2020, 198, 117365. [Google Scholar] [CrossRef]
  9. Evangelisti, S.; Tagliaferri, C.; Brett, D.J.L.; Lettieri, P. Life cycle assessment of a polymer electrolyte membrane fuel cell system for passenger vehicles. J. Clean. Prod. 2017, 142, 4339–4355. [Google Scholar] [CrossRef]
  10. Bekel, K.; Pauliuk, S. Prospective cost and environmental impact assessment of battery and fuel cell electric vehicles in Germany. Int. J. Life Cycle Assess. 2020, 25, 831. [Google Scholar] [CrossRef] [Green Version]
  11. Lotrič, A.; Sekavčnik, M.; Kuštrin, I.; Mori, M. Life-cycle assessment of hydrogen technologies with the focus on EU critical raw materials and end-of-life strategies. Int. J. Hydrog. Energy 2020. in Press. [Google Scholar] [CrossRef]
  12. Pollet, B.G.; Kocha, S.S.; Staffell, I. Current status of automotive fuel cells for sustainable transport. Curr. Opin. Electrochem. 2019, 16, 90–95. [Google Scholar] [CrossRef]
  13. Duclos, L.; Chattot, R.; Dubau, L.; Thivel, P.; Mandil, G.; Laforest, V.; Bolloli, M.; Vincent, R.; Svecova, L. Closing the loop: Life cycle assessment and optimization of a PEMFC platinum-based catalyst recycling process, 2020. Green Chem. 2020, 22, 1919–1933. [Google Scholar] [CrossRef]
  14. Benitez, A.; Wulf, C.; de Palmenaer, A.; Lengersdorf, M.; Röding, T.; Grube, T.; Robinius, M.; Stolten, D.; Kuckshinrichs, W. Ecological assessment of fuel cell electric vehicles with special focus on type IV carbon fiber hydrogen tank. J. Clean. Prod. 2021, 278, 123277. [Google Scholar] [CrossRef]
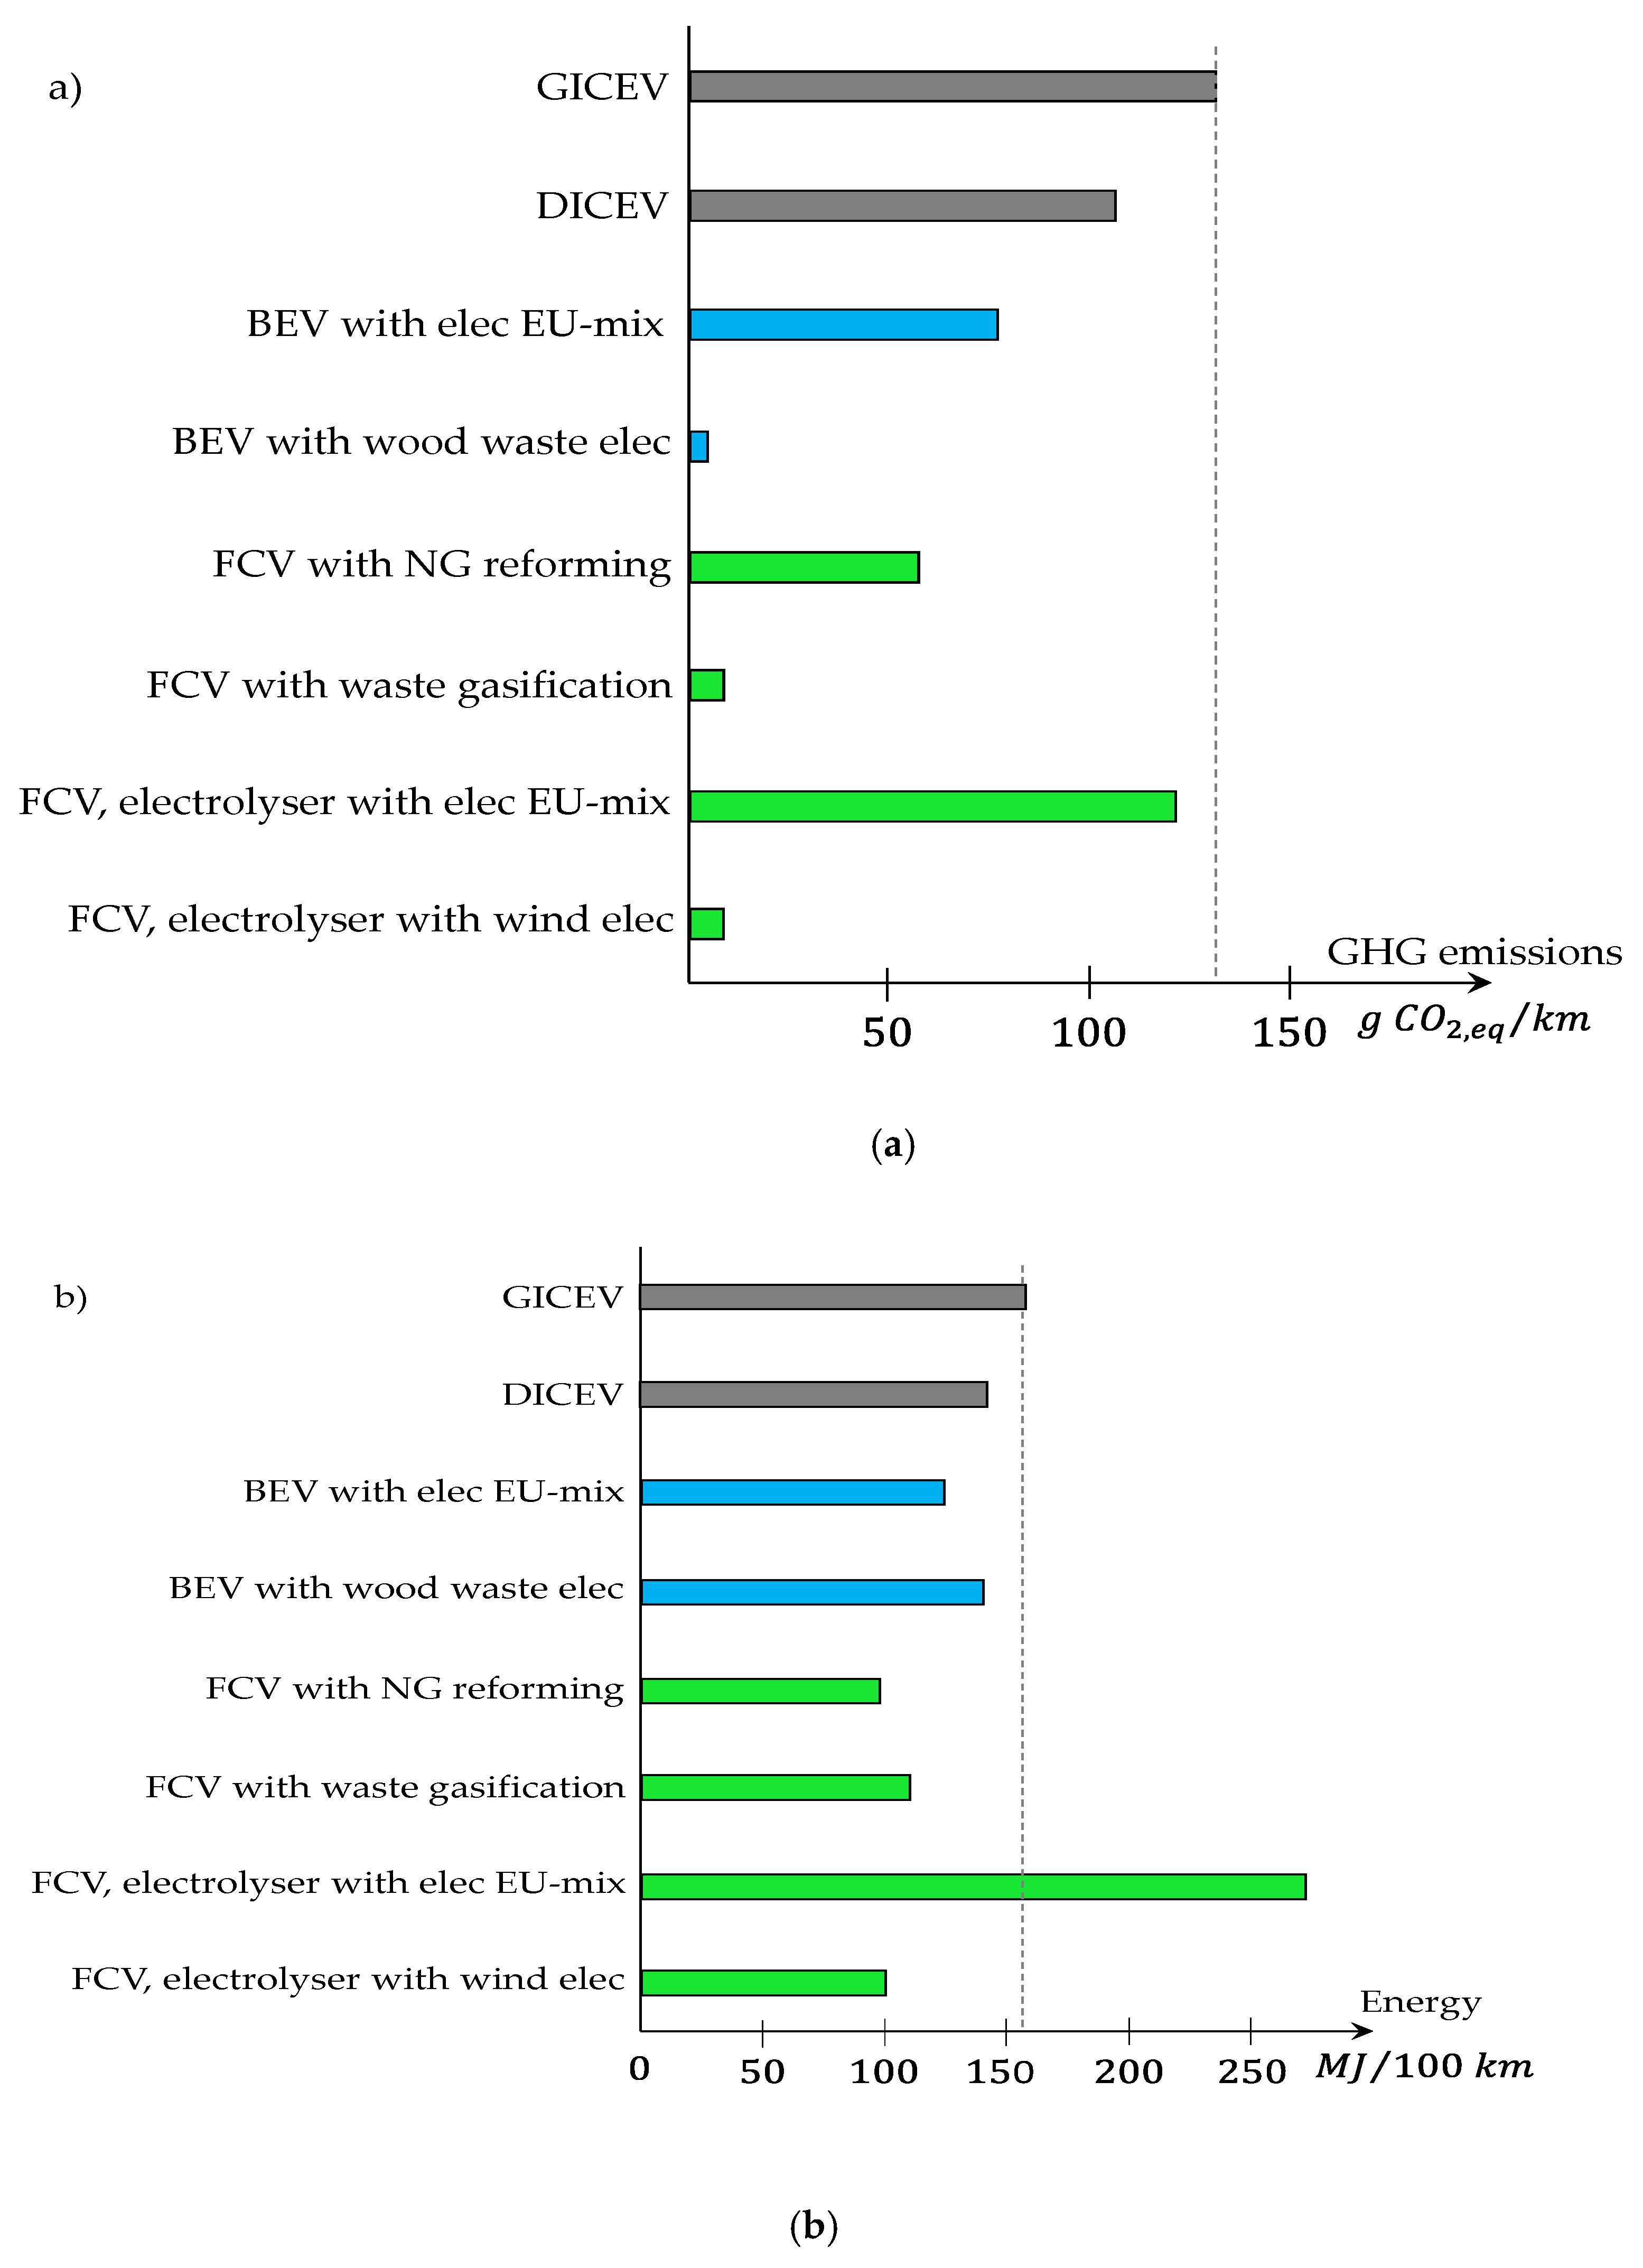
  15. Edwards, R.; Hass, H.; Larivé, J.; Lonza, L.; Maas, H.; Rickeard, D. Well-to-Wheels Analysis of Future Automotive Fuels and Powertrains in the European Context. European Commission Joint Research Center, Scientific and Technical Research Report. Available online: https://core.ac.uk/download/pdf/38627607.pdf (accessed on 22 November 2020).
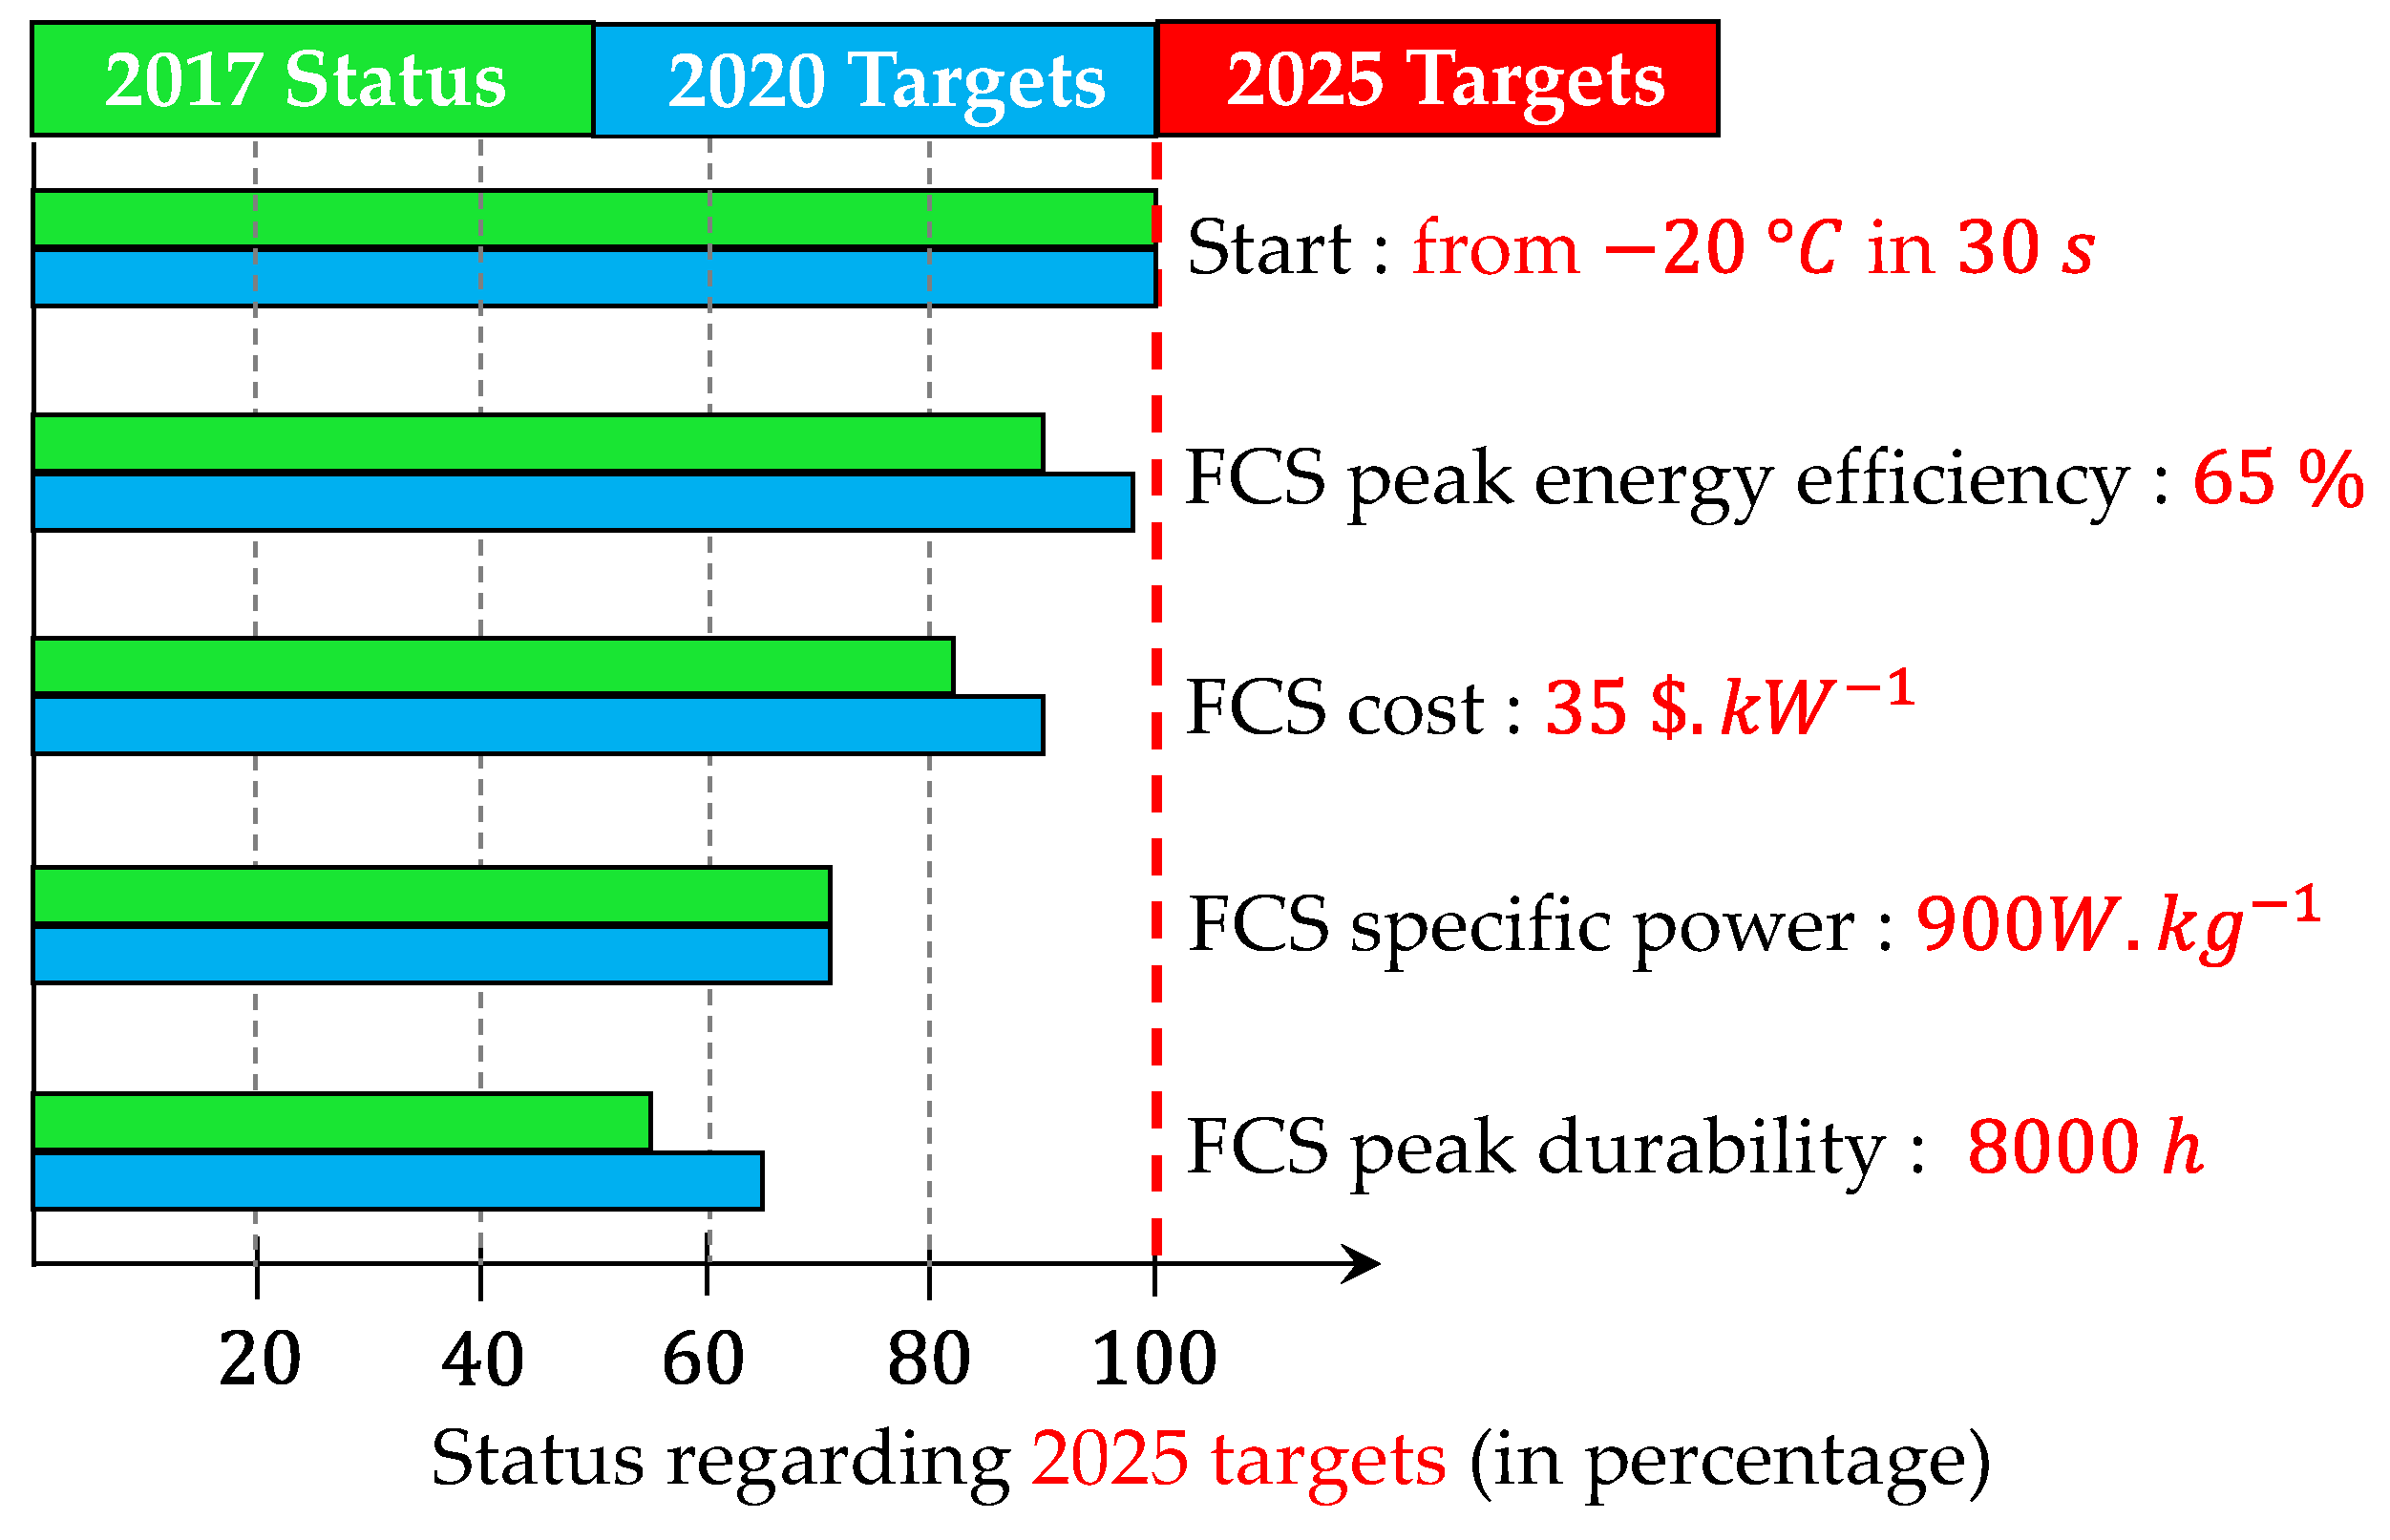
  16. U.S. DRIVE. Fuel Cell Technical Team Roadmap. November 2017. Available online: https://www.energy.gov/sites/prod/files/2017/11/f46/FCTT_Roadmap_Nov_2017_FINAL.pdf (accessed on 22 November 2020).
  17. DOE. Hydrogen and Fuel Cells Program, 2019 Annual Merit Review and Peer Evaluation Report. Available online: https://www.hydrogen.energy.gov/annual_review19_report.html (accessed on 22 November 2020).
  18. Hydrogen Roadmap Europe, Report; Fuel Cells and Hydrogen—Joint Undertaking (FCH-JU): Saint-Gilles, Belgium, 2019; ISBN 978-92-9246-331-1. EG-06-18-327-EN-N, fch.europa.eu. [CrossRef]
  19. Hydrogène et Piles à Combustible: Position Technique de Filière. Available online: https://pfa-auto.fr/wp-content/uploads/2020/02/CRA1-PTF-HYDROGENE-ET-PILES-A-COMBUSTIBLE-VF2.pdf (accessed on 22 November 2020).
  20. Borup, R.L.; Kusoglu, A.; Neyerlin, K.C.; Mukundan, R.; Ahluwalia, R.K.; Cullen, D.A.; More, K.L.; Weber, A.Z.; Myers, D.J. Recent developments in catalyst-related PEM fuel cell durability. Curr. Opin. Electrochem. 2020, 21, 192–200. [Google Scholar] [CrossRef]
  21. Wang, J.; Wang, H.; Fan, Y. Techno-economic challenges of fuel cell commercialization. Engineering 2018, 4, 352–360. [Google Scholar] [CrossRef]
  22. Bal, B.; Sahin, I.; Uzun, A.; Canadinc, D. A New Venue toward Predicting the Role of Hydrogen Embrittlement on Metallic Materials. Metall. Mater. Trans. A 2016, 47, 5409–5422. [Google Scholar] [CrossRef]
  23. Leng, Y.; Ming, P.; Yang, D.; Zhang, C. Stainless steel bipolar plates for proton exchange membrane fuel cells: Materials, flow channel design and forming processes. J. Power Sources 2020, 451, 227783. [Google Scholar] [CrossRef]
  24. JongHee KI, M.; Jo, K.; Kim, Y.; Lee, J.; Lee, Y.; Kim, J.; Seok, J. Stainless Steel for Polymer Fuel Cell Separator and Method for Preparing Same. U.S. Patent 9,290,845, 22 March 2016. [Google Scholar]
  25. Ide, S.; Honda, A.; Ishikawa, S.; Ujiro, T. Stainless Steel Having Good Conductivity for Use in Fuel Cell and Method for Producing the Same. U.S. Patent 8,440,029, 14 May 2013. [Google Scholar]
  26. Fink, C.; Fouquet, N. Three-dimensional simulation of polymer electrolyte membrane fuel cells with experimental validation. Electrochim. Acta 2011, 56, 10820–10831. [Google Scholar] [CrossRef]
  27. Nonobe, Y. Development of the fuel cell vehicle mirai. IEEJ Trans. Electr. Electron. Eng. 2017, 12, 5–9. [Google Scholar] [CrossRef] [Green Version]
  28. Sverdrup, H.U.; Ragnarsdottir, K.V. A system dynamics model for platinum group metal supply, market price, depletion of extractable amounts, ore grade, recycling and stocks-in-use. Resour. Conserv. Recycl. 2016, 114, 130–152. [Google Scholar] [CrossRef]
  29. Poirot-Crouvezier, J. Road Electric Transportation—Fuel Cell Vehicles; Techniques de l’ingénieur: Paris, France, 2015. (In French) [Google Scholar]
  30. Shao, Y.; Dodelet, J.; Wu, G.; Zelenay, P. PGM-free cathode catalysts for PEM fuel cells: A mini-review on stability challenges. Adv. Mater. 2019, 31, 1807615. [Google Scholar] [CrossRef]
  31. Ramaswamy, N.; Gu, W.; Ziegelbauer, J.M.; Kumaraguru, S. Carbon Support Microstructure Impact on High Current Density Transport Resistances in PEMFC Cathode. J. Electrochem. Soc. 2020, 167, 064515. [Google Scholar] [CrossRef]
  32. Chen, M.; Zhao, C.; Sun, F.; Fan, J.; Li, H.; Wang, H. Research progress of catalyst layer and interlayer interface structures in membrane electrode assembly (MEA) for proton exchange membrane fuel cell (PEMFC) system. eTransportation 2020, 5, 100075. [Google Scholar] [CrossRef]
  33. Trencher, G. Strategies to accelerate the production and diffusion of fuel cell electric vehicles: Experiences from California. Energy Rep. 2020, 6, 2503–2519. [Google Scholar] [CrossRef]
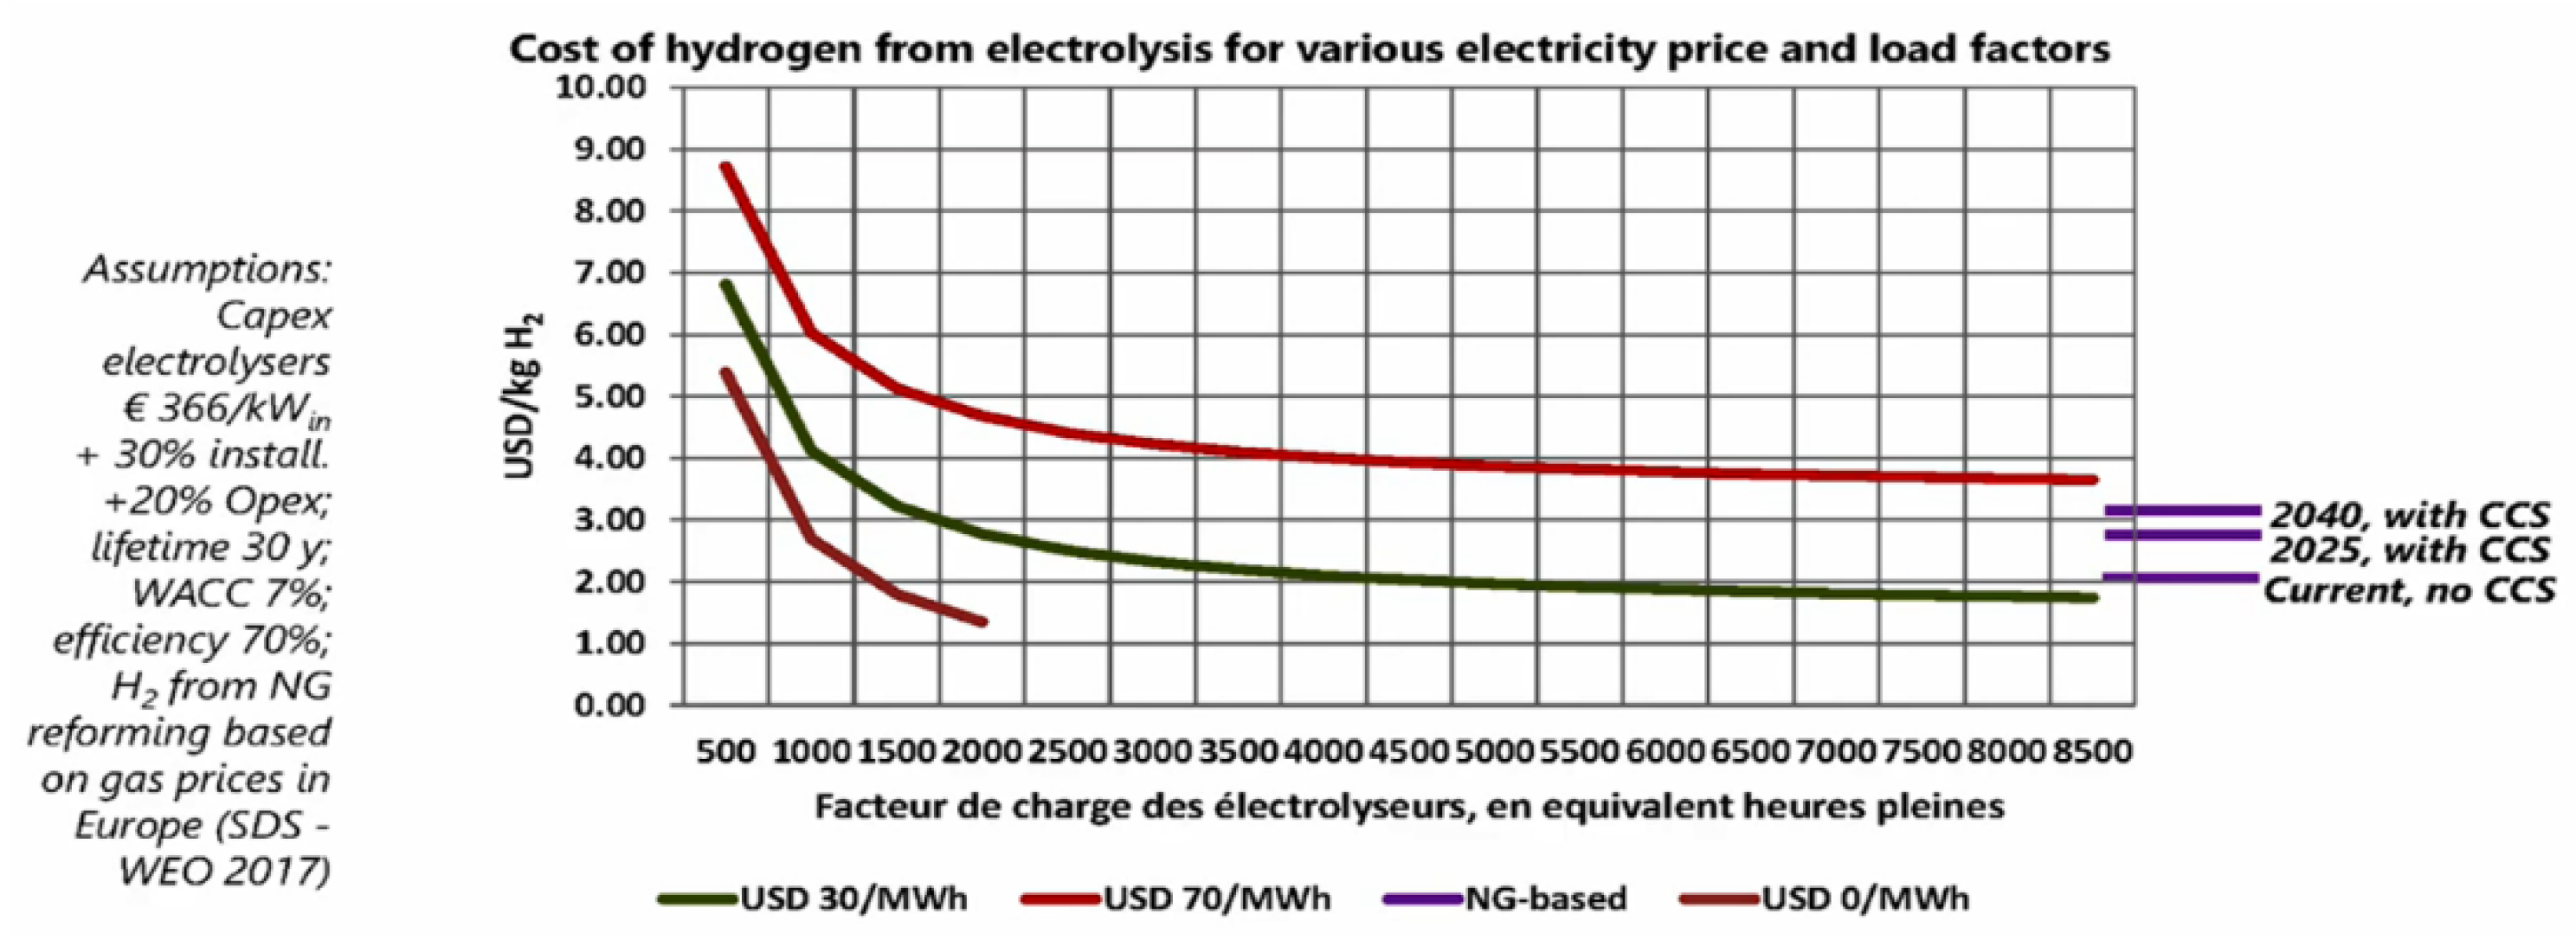
  34. IEA. The Future of Hydrogen—Seizing Today’s Opportunities; Technology Report; IEA: Paris, France, 2019. [Google Scholar]
  35. Ostadi, M.; Paso, K.G.; Rodriguez-Fabia, S.; Øi, L.E.; Manenti, F.; Hillestad, M. Process Integration of Green Hydrogen: Decarbonization of Chemical Industries. Energies 2020, 13, 4859. [Google Scholar] [CrossRef]
  36. Abdin, Z.; Zafaranloo, A.; Rafiee, A.; Mérida, W.; Lipiński, W.; Khalilpour, K.R. Hydrogen as an energy vector. Renew. Sustain. Energy Rev. 2020, 120, 109620. [Google Scholar] [CrossRef]
  37. Dawood, F.; Anda, M.; Shafiullah, G.M. Hydrogen production for energy: An overview. Int. J. Hydrog. Energy 2020, 45, 3847–3869. [Google Scholar] [CrossRef]
  38. Li, S.; Kang, Q.; Baeyens, J.; Zhang, H.L.; Deng, Y.M. Hydrogen Production: State of Technology. In Proceedings of the 2020 IOP Conference Series: Earth and Environmental Science, Vienna, Austria, 18–21 May 2020; Volume 544, p. 012011. [Google Scholar] [CrossRef]
  39. Muradov, N. Low to near-zero CO2 production of hydrogen from fossil fuels: Status and perspectives. Int. J. Hydrog. Energy 2017, 42, 14058–14088. [Google Scholar] [CrossRef]
  40. Surla, K. Hydrogen; J6368; Techniques de l’Ingénieur: Saint-Denis, France, May 2019. (In French) [Google Scholar]
  41. Andrews, J.W. Hydrogen production and carbon sequestration by steam methane reforming and fracking with carbon dioxide. Int. J. Hydrog. Energy 2020, 45, 9279–9284. [Google Scholar] [CrossRef]
  42. Peng, X.D. Analysis of the thermal efficiency limit of the steam methane reforming process. Ind. Eng. Chem. Res. 2012, 51, 16385–16392. [Google Scholar] [CrossRef]
  43. Nuttall, W.J.; Bakenne, A.T. Fossil Fuel Hydrogen; Springer: Berlin/Heidelberg, Germany, 2020; ISBN 978-3-030-30907-7. [Google Scholar] [CrossRef]
  44. Philibert, C. Electrification and Hydrogen in the Energy Transition. In Proceedings of the Energy Sustainability Conference, ENS Rennes, France, 25 October 2018. (In French). [Google Scholar]
  45. Baeyens, J.; Zhang, H.; Nie, J.; Appels, L.; Dewil, R.; Ansart, R.; Deng, Y. Reviewing the potential of bio-hydrogen production by fermentation. Renew. Sustain. Energy Rev. 2020, 131, 110023. [Google Scholar] [CrossRef]
  46. IFRI. Carbon Capture, Storage and utilization to the rescue of Coal?—Global Perspectives and Focus on China and the United States. In Sylvie Cornot-Gandolphe; IFRI: Paris, France, 2019. [Google Scholar]
  47. IRENA. Hydrogen: A Renewable Energy Perspective; International Renewable Energy Agency: Abu Dhabi, UAE, 2019; ISBN 978-92-9260-151-5. [Google Scholar]
  48. Grigoriev, S.A.; Fateev, V.N.; Bessarabov, D.G.; Millet, P. Current status, research trends, and challenges in water electrolysis science and technology. Int. J. Hydrog. Energy 2020, 45, 26036–26058. [Google Scholar] [CrossRef]
  49. Yodwong, B.; Guilbert, D.; Phattanasak, M.; Kaewmanee, W.; Hinaje, M.; Vitale, G. Faraday’s Efficiency Modeling of a Proton Exchange Membrane Electrolyzer Based on Experimental Data. Energies 2020, 13, 4792. [Google Scholar] [CrossRef]
  50. Kumar, S.S.; Himabindu, V. Hydrogen production by PEM water electrolysis—A review. Mater. Sci. Energy Technol. 2019, 2, 442–454. [Google Scholar] [CrossRef]
  51. David, M.; Ocampo-Martínez, C.; Sánchez-Peña, R. Advances in alkaline water electrolyzers: A review. J. Energy Storage 2019, 23, 392–403. [Google Scholar] [CrossRef] [Green Version]
  52. Philibert, C. Renewable Energy for Industry; IEA: Paris, France; OECD: Paris, France, 2017. [Google Scholar]
  53. Ceran, B. Multi-Criteria Comparative Analysis of Clean Hydrogen Production Scenarios. Energies 2020, 13, 4180. [Google Scholar] [CrossRef]
  54. Park, S.; Nam, S.; Oh, M.; Choi, I.-J.; Shin, J. Preference Structure on the Design of Hydrogen Refueling Stations to Activate Energy Transition. Energies 2020, 13, 3959. [Google Scholar] [CrossRef]
  55. Nicita, A.; Maggio, G.; Andaloro, A.P.F.; Squadrito, G. Green hydrogen as feedstock: Financial analysis of a photovoltaic-powered electrolysis plant. Int. J. Hydrog. Energy 2020, 45, 11395–11408. [Google Scholar] [CrossRef]
  56. Lee, D.; Elgowainy, A.; Dai, Q. Life cycle greenhouse gas emissions of hydrogen fuel production from chlor-alkali processes in the United States. Appl. Energy 2018, 217, 467–479. [Google Scholar] [CrossRef]
  57. Wang, S.; Zhang, T.; Bao, M.; Su, H.; Xu, P. Microbial Production of Hydrogen by Mixed Culture Technologies: A Review. Biotechnol. J. 2020, 15, 1900297. [Google Scholar] [CrossRef]
  58. Cao, L.; Yu, I.K.M.; Xiong, X.; Tsang, D.C.W.; Zhang, S.; Clark, J.H.; Hu, C.; Ng, Y.H.; Shang, J.; Ok, Y.S. Biorenewable hydrogen production through biomass gasification: A review and future prospects. Environ. Res. 2020, 186, 109547. [Google Scholar] [CrossRef]
  59. Dou, B.; Zhang, H.; Song, Y.; Zhao, L.; Jiang, B.; He, M.; Ruan, C.; Chen, H.; Xu, Y. Hydrogen production from the thermochemical conversion of biomass: Issues and challenges. Sustain. Energy Fuels 2019, 3, 314–342. [Google Scholar] [CrossRef]
  60. El-Emam, R.S.; Özcan, H. Comprehensive review on the techno-economics of sustainable large-scale clean hydrogen production. J. Clean. Prod. 2019, 220, 593–609. [Google Scholar] [CrossRef]
  61. van de Velden, M.; Baeyens, J.; Brems, A.; Janssens, B.; Dewil, R. Fundamentals, kinetics and endothermicity of the biomass pyrolysis reaction. Renew. Energy 2010, 35, 232–242. [Google Scholar] [CrossRef]
  62. Niezgoda, A.; Deng, Y.; Sabatier, F.; Ansart, R. From end-of-life tires to storable energy carriers. J. Environ. Manag. 2020, 276, 111318. [Google Scholar] [CrossRef] [PubMed]
  63. Wang, S.; Ma, Z.; Su, H. Two-step continuous hydrogen production by immobilized mixed culture on corn stalk. Renew. Energy 2018, 121, 230–235. [Google Scholar] [CrossRef]
  64. Herdem, M.S.; Sinaki, M.Y.; Farhad, S.; Hamdullahpur, F. An overview of the methanol reforming process: Comparison of fuels, catalysts, reformers, and systems. Int. J. Energy Res. 2019, 43, 5076–5105. [Google Scholar] [CrossRef]
  65. Prinzhofer, A.; Cissé, C.S.T.; Diallo, A.B. Discovery of a large accumulation of natural ydrogen in Bourakebougou (Mali). Int. J. Hydrog. Energy 2018, 43, 19315–19326. [Google Scholar] [CrossRef]
  66. Prinzhofer, A.; Moretti, I.; Françolin, J.; Pacheco, C.; D’Agostino, A.; Werly, J.; Rupin, F. Natural hydrogen continuous emission from sedimentary basins: The example of a Brazilian H2-emitting structure. Int. J. Hydrog. Energy 2019, 44, 5676–5685. [Google Scholar] [CrossRef]
  67. Andersson, J.; Grönkvist, S. Large-scale storage of hydrogen. Int. J. Hydrog. Energy 2019, 44, 11901–11919. [Google Scholar] [CrossRef]
  68. Kurtz, J.; Sprik, S.; Bradley, T.H. Review of transportation hydrogen infrastructure performance and reliability. Int. J. Hydrog. Energy 2019, 44, 12010–12023. [Google Scholar] [CrossRef]
  69. RTE. Electricity Report 2018. Available online: https://bilan-electrique-2018.rte-france.com/wp-content/uploads/2019/02/BE-PDF-2018-1.pdf (accessed on 22 November 2020).
  70. ADEME. Hydrogen in the Energy Transition. 2018. Available online: https://www.ademe.fr/sites/default/files/assets/documents/fiche-technique_hydrogene_dans_la_te_avril2018_2.pdf (accessed on 22 November 2020). (In French).
  71. van de Kaa, G.; Scholten, D.; Rezaei, J.; Milchram, C. The Battle between Battery and Fuel Cell Powered Electric Vehicles: A BWM Approach. Energies 2017, 10, 1707. [Google Scholar] [CrossRef] [Green Version]
  72. Bansal, S.; Zong, Y.; You, S.; Mihet-Popa, L.; Xiao, J. Technical and Economic Analysis of One-Stop Charging Stations for Battery and Fuel Cell EV with Renewable Energy Sources. Energies 2020, 13, 2855. [Google Scholar] [CrossRef]
  73. Briottet, L.; Moro, I.; Lemoine, P. Quantifying the hydrogen embrittlement of pipeline steels for safety considerations. Int. J. Hydrog. Energy 2012, 37, 17616–17623. [Google Scholar] [CrossRef]
  74. Darkrim-Lamari, F.; Malbrunot, P. Hydrogen Fuel—Use; Techniques de l’Ingénieur: Paris, France, 2013. [Google Scholar]
  75. Dryer, F.L.; Chaos, M.; Zhao, Z.; Stein, J.N.; Alpert, J.Y.; Homer, C.J. Spontaneous ignition of pressurized releases of hydrogen and natural gas into air. Combust. Sci. Technol. 2007, 179, 663–694. [Google Scholar] [CrossRef]
  76. Tamura, Y.; Takabayashi, M.; Takeuchi, M. The spread of fire from adjoining vehicles to a hydrogen fuel cell vehicle. Int. J. Hydrog. Energy 2014, 39, 6169–6175. [Google Scholar] [CrossRef]
  77. Hussein, H.; Brennan, S.; Molkov, V. Dispersion of hydrogen release in a naturally ventilated covered car park. Int. J. Hydrog. Energy 2020, 45, 23882–23897. [Google Scholar] [CrossRef]
  78. Dadashzadeh, M.; Kashkarov, S.; Makarov, D.; Molkov, V. Risk assessment methodology for onboard hydrogen storage. Int. J. Hydrog. Energy 2018, 43, 6462–6475. [Google Scholar] [CrossRef]
  79. Li, Z.; Sun, K. Mitigation measures for intended hydrogen release from thermally activated pressure relief device of onboard storage. Int. J. Hydrog. Energy 2020, 5, 9260–9267. [Google Scholar] [CrossRef]
  80. Huang, E. A hydrogen Fueling Station Fire in Norway Has Left Fuel-Cell Cars Nowhere to Charge; Reuters Agency: London, UK, 2019. [Google Scholar]
  81. Jin, H.; Chung, J. Hydrogen Hurdles: A Deadly Blast Hampers South Korea’s Big Fuel Cell Car Bet; Reuters Agency: London, UK, 2019. [Google Scholar]
Figure 1. Development of heavy FCV. (a) Hydrogen bus from Safra (Businova) (b) Truck 33T from Hyundai (Xcient-FC).
Energies 13 06132 g001
Figure 2. WtW compared environmental performance indexes of various passenger vehicles in 2020 European context according to the JRC-European report, based on [15]: GICEV, DICEV, BEV and FCV. (a) total GHG emissions (WtWGHG) (b) total energy consumption (WtWEC).
Energies 13 06132 g002
Figure 3. Comparison of the 2025 roadmap of road transport FCS with their observed state of performance in 2017, based on [16]. Red: 2025 roadmap. Blue: 2020 roadmap. Green: 2017 report.
Energies 13 06132 g003
Figure 4. Cost of low-carbon H2 production. Comparison of grey (“no CCS”), blue (“with CCS”) and green (“water electrolysis”) dihydrogen [44].
Energies 13 06132 g004
Figure 5. Air Liquide hydrogen networks in the north of Europe, (i.e., Benelux, Germany and France) [68].
Energies 13 06132 g005
Figure 6. A fireball ignited by a controlled H2 release managed by a TRPD—Two different views of the front of the vehicles (left a default FCV, and right a classic and undamaged gasoline vehicle (GICEV)) [76].
Energies 13 06132 g006
Figure 7. 3 numerical simulation of the fireball surrounding using different angle of the chosen release directions (0°, 30°, 45°) [79].
Energies 13 06132 g007
Table 1. Cost distribution of the complete FCS considering a FCS with a net power of 80   kW , based on [21].
Part of the FCSCost Part
Stack50%
Air management17%
Fuel management8%
Thermal management8%
Water management3%
System balancing7%
System assembly7%
Table 2. Cost distribution of the unique FC considering a FCS with a net power of 80   kW , based on [21].
Part of the FCCost Part
Active Layer (AL)51%
Membrane (M)4%
Gas Diffusion Layer (GDL)5%
Bipolar Plate (BP)24%
Seal7%
Stack balancing2%
Assembly5%
Conditioning2%
Table 3. PEMFC Platinum load trend over the past 2 decades regarding the complete FCS, based on [29].
Year199520002005201020152020
Pt load (W/mgPt)0.540.931.5952.715.008.00
Publisher’s Note: MDPI stays neutral with regard to jurisdictional claims in published maps and institutional affiliations.

