Energy and Economic Analysis of Date Palm Biomass Feedstock for Biofuel Production in UAE: Pyrolysis, Gasification and Fermentation


Abstract
:
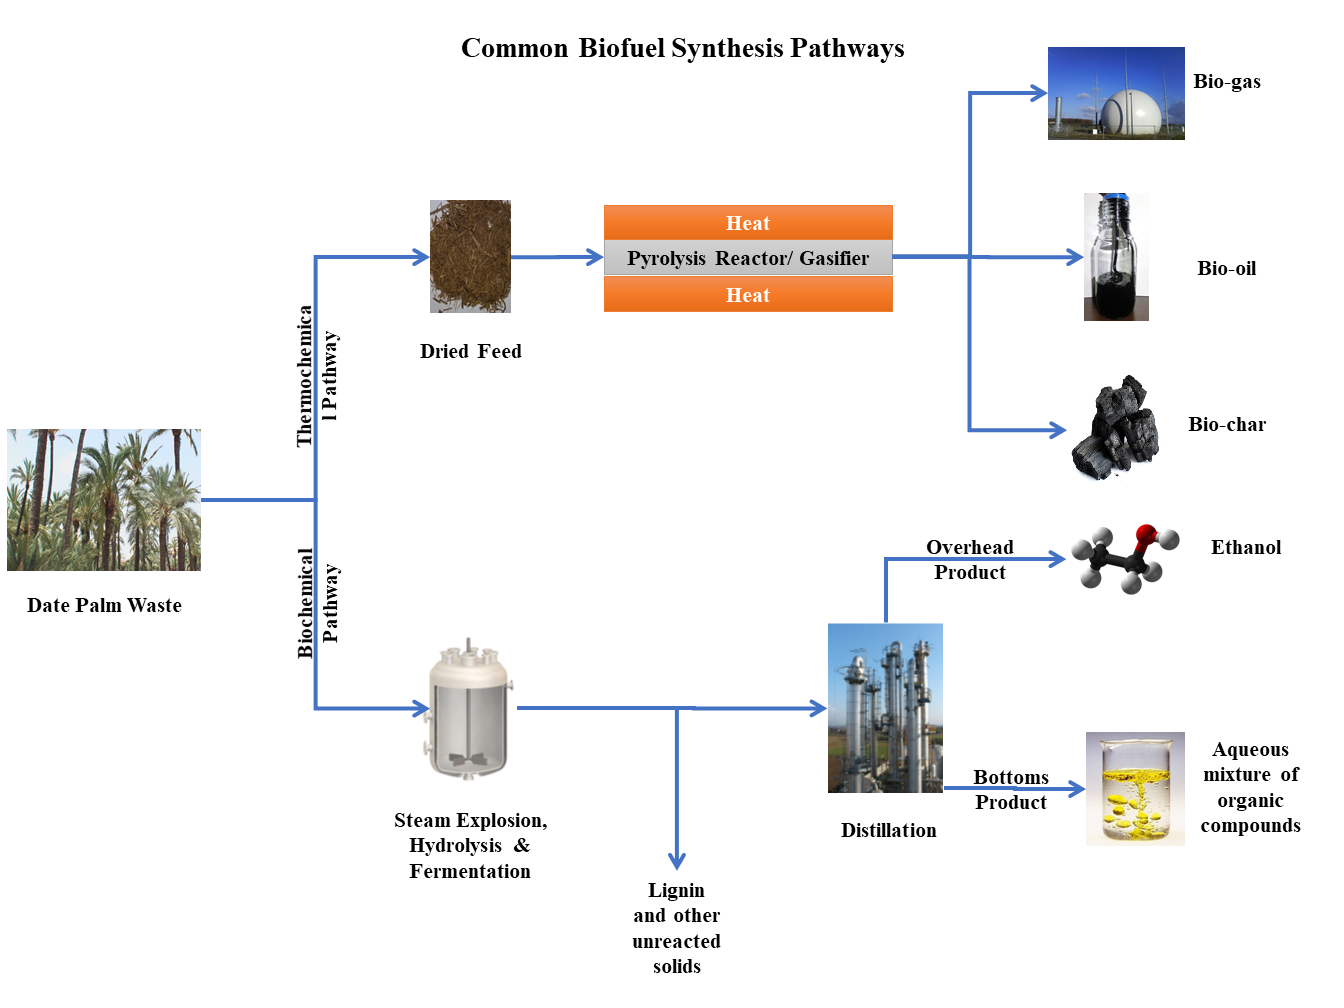
1. Introduction
2. Methodology and Model Development
- The processes are carried out at a steady-state, reactions occur in thermodynamic equilibrium, and reaction kinetics are not considered.
- Char is 100% carbon and biomass yield is specified on an ash-free basis.
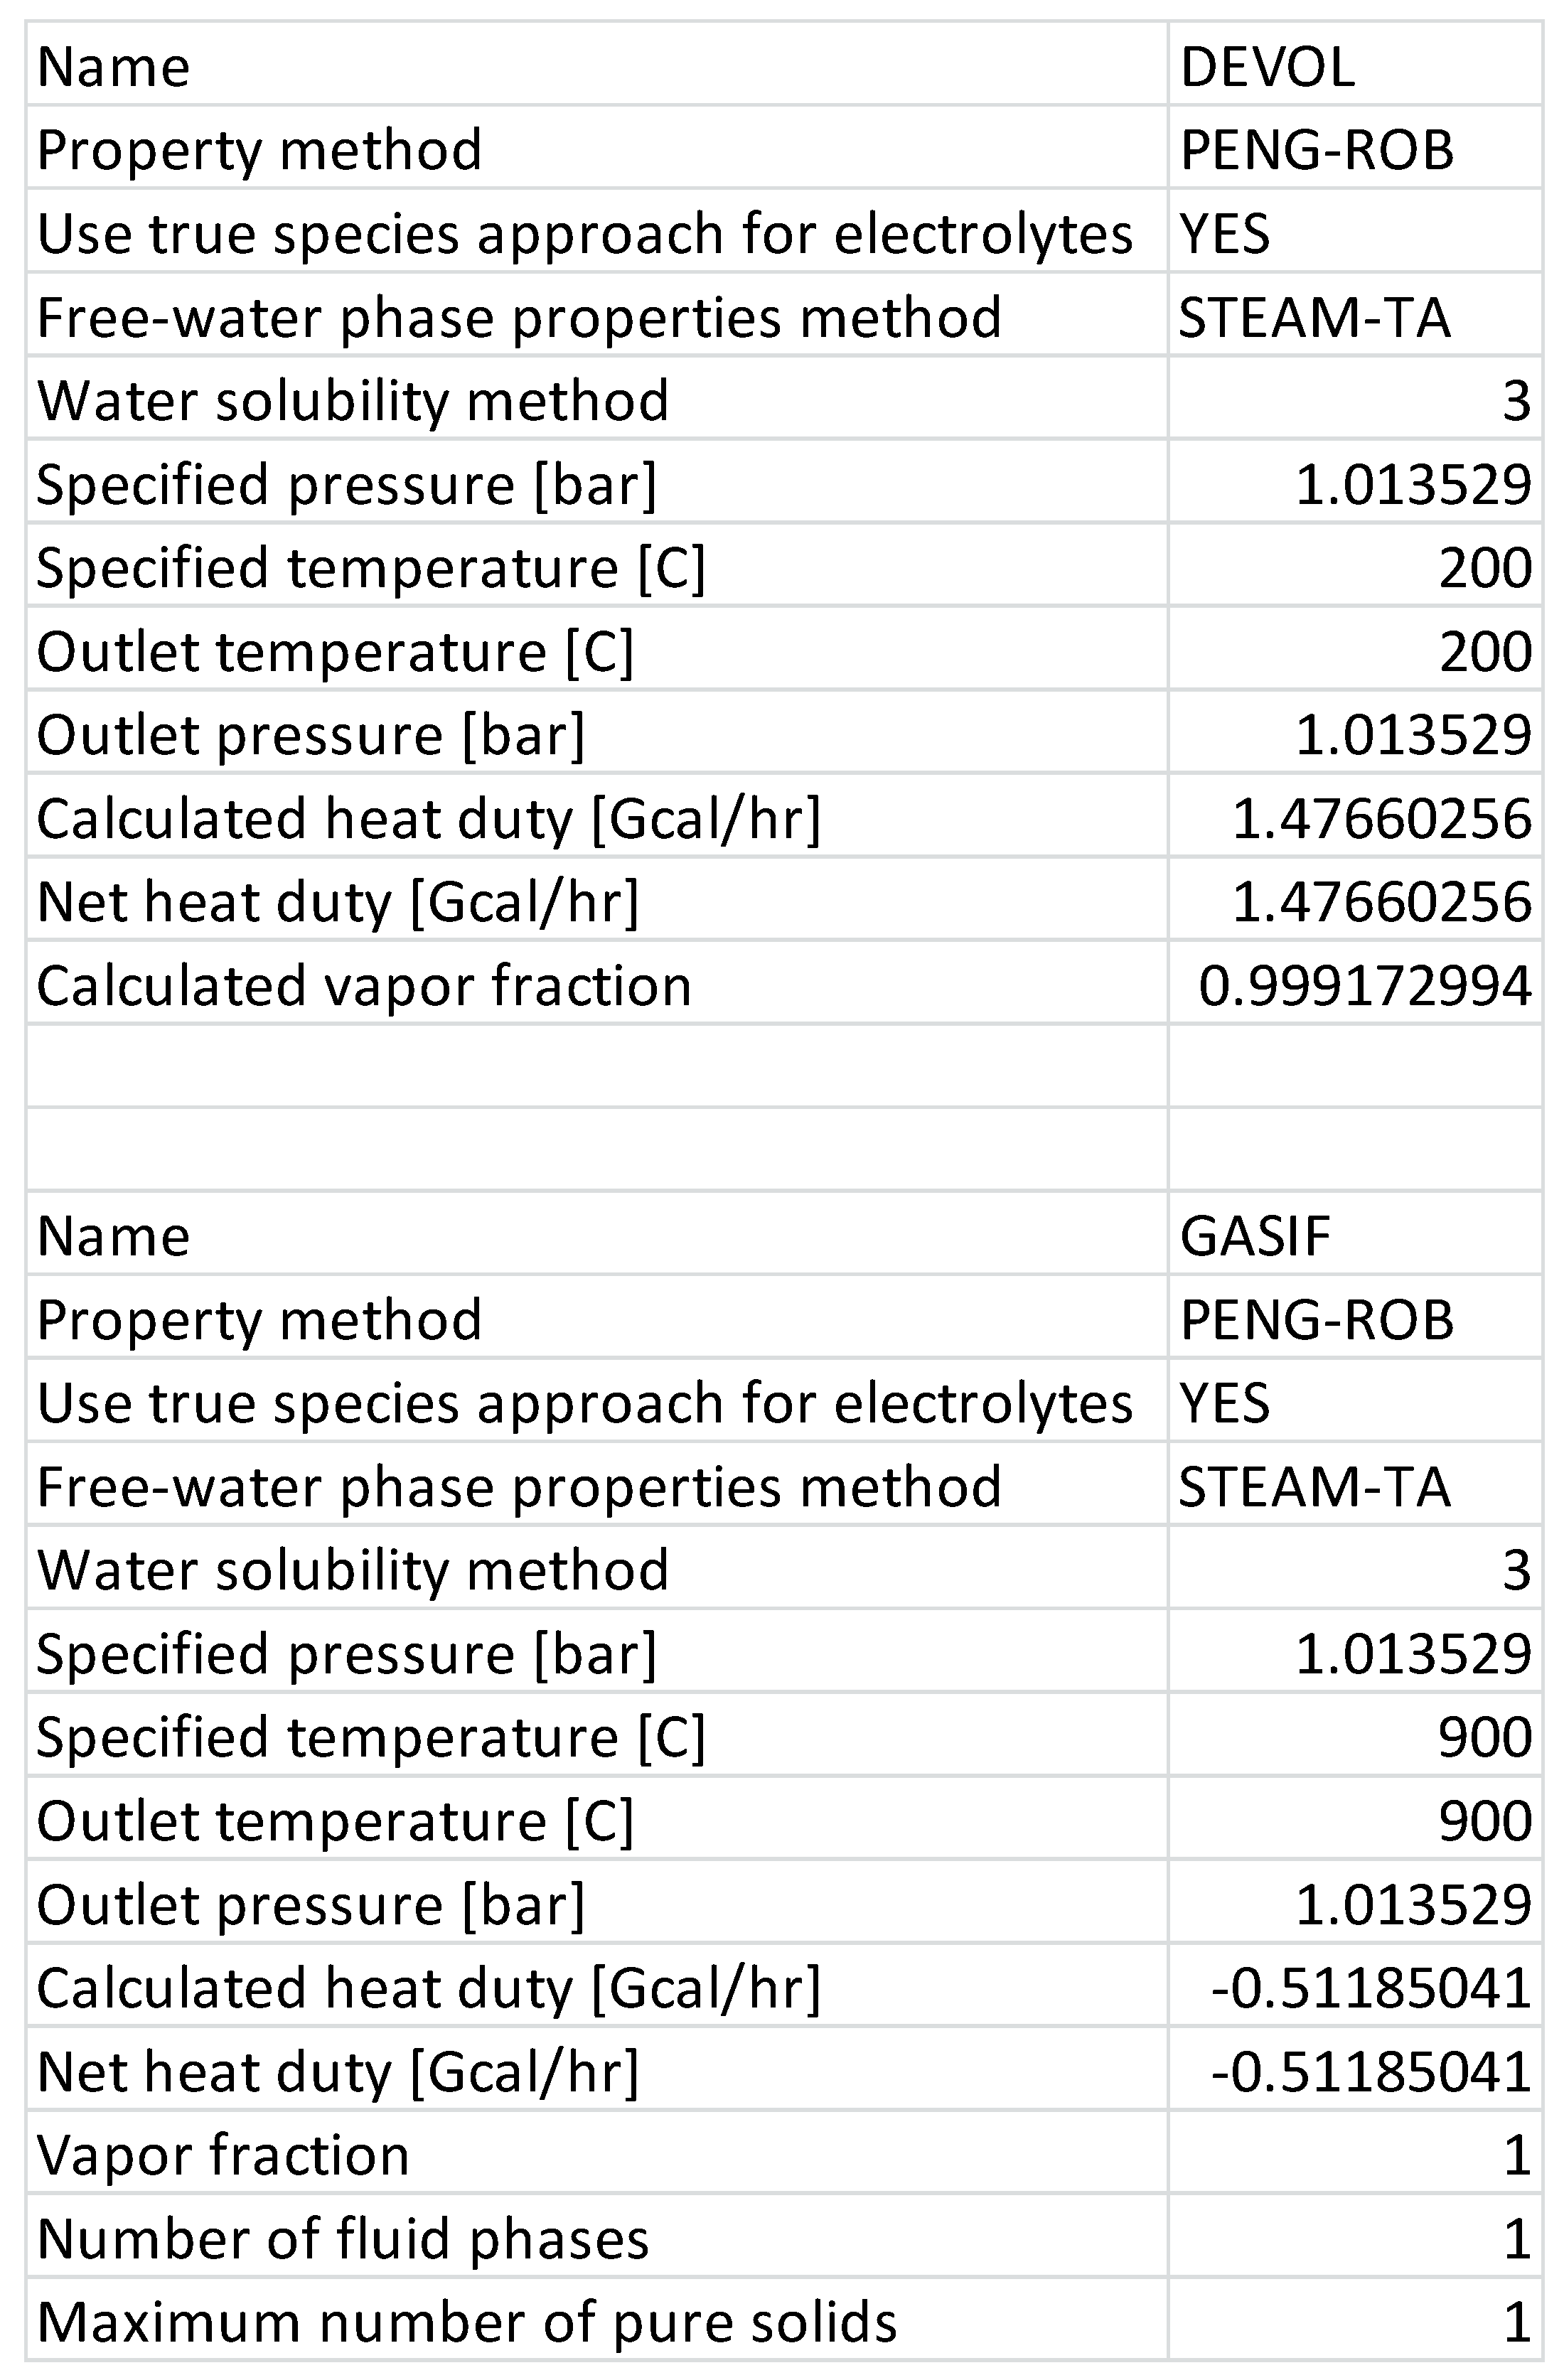
- Processes are isothermal and the devolatilization, pyrolysis, and gasification steps take place instantaneously.
- For thermochemical processes, it is assumed that 100% decomposition of biomass into its elemental composition and eventually into final products takes place.
- Phase/component splitters achieve perfect separation.
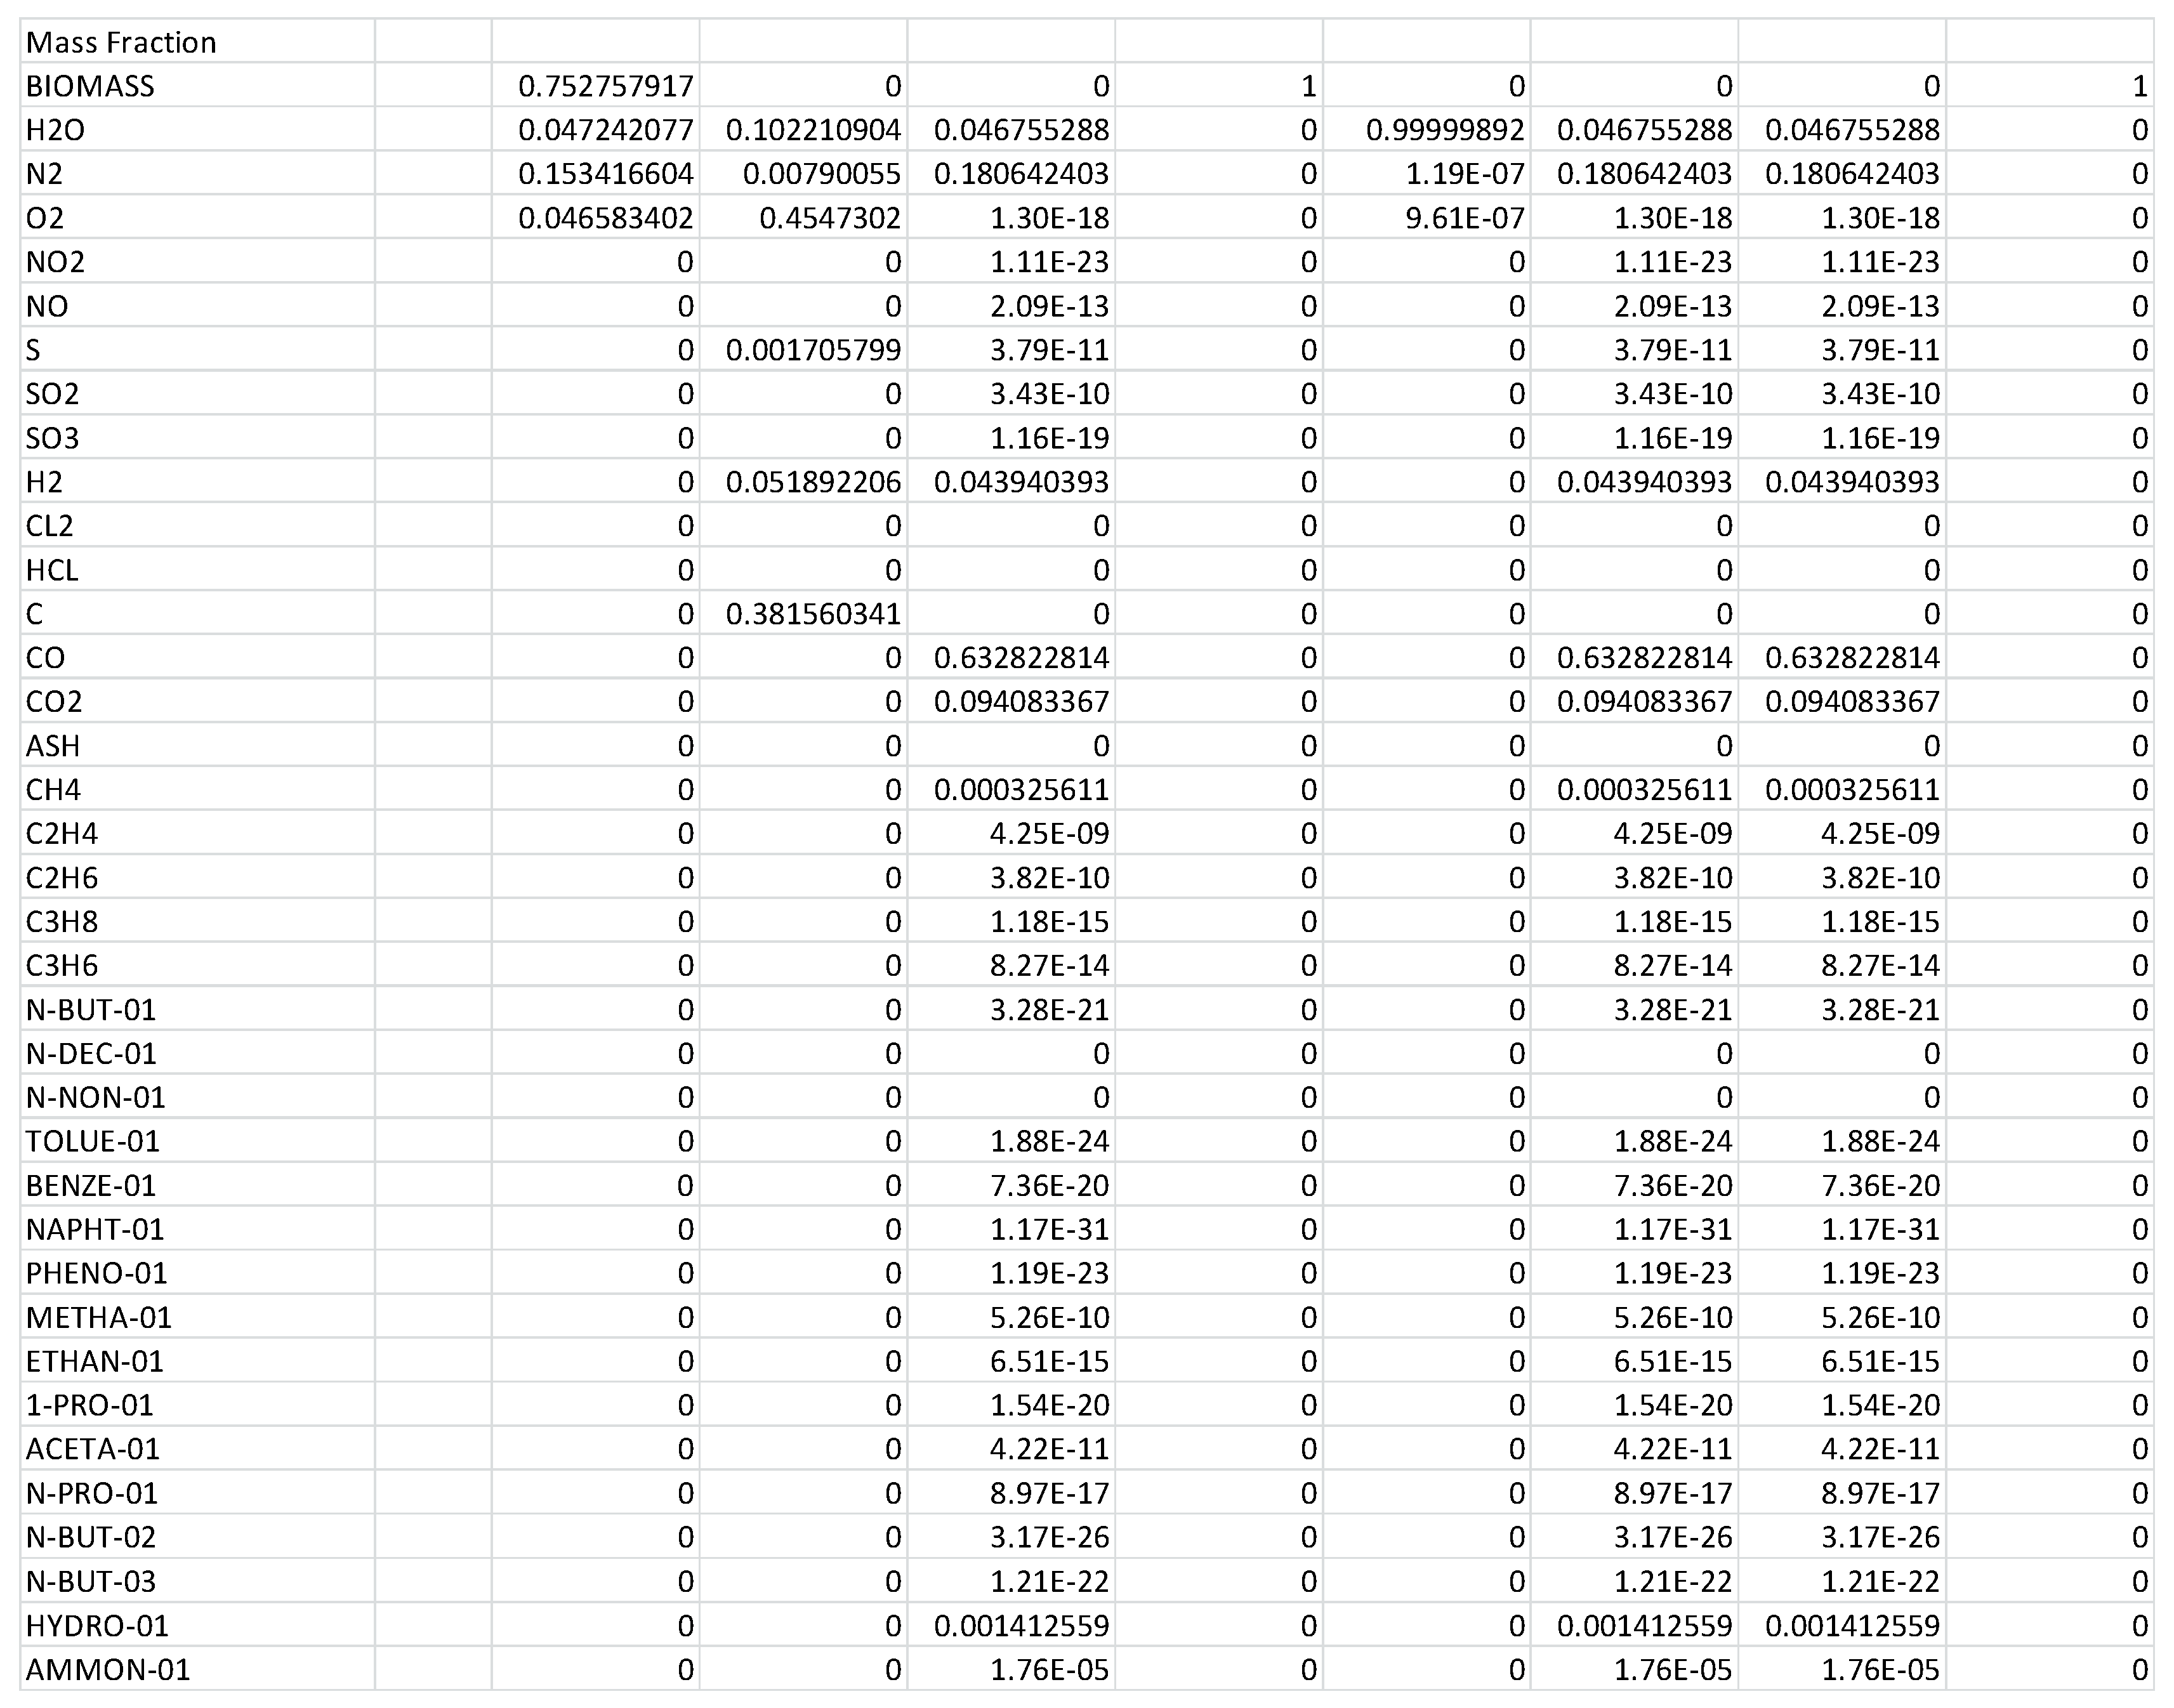
- Only the most commonly occurring and major compounds are defined in the simulations. Trace components present in bio-oil are not considered.
- Particle size and distribution have not been considered in the simulation. The biomass feedstock is considered to be uniformly ground and possess optimal physical characteristics (size, shape, and distribution).
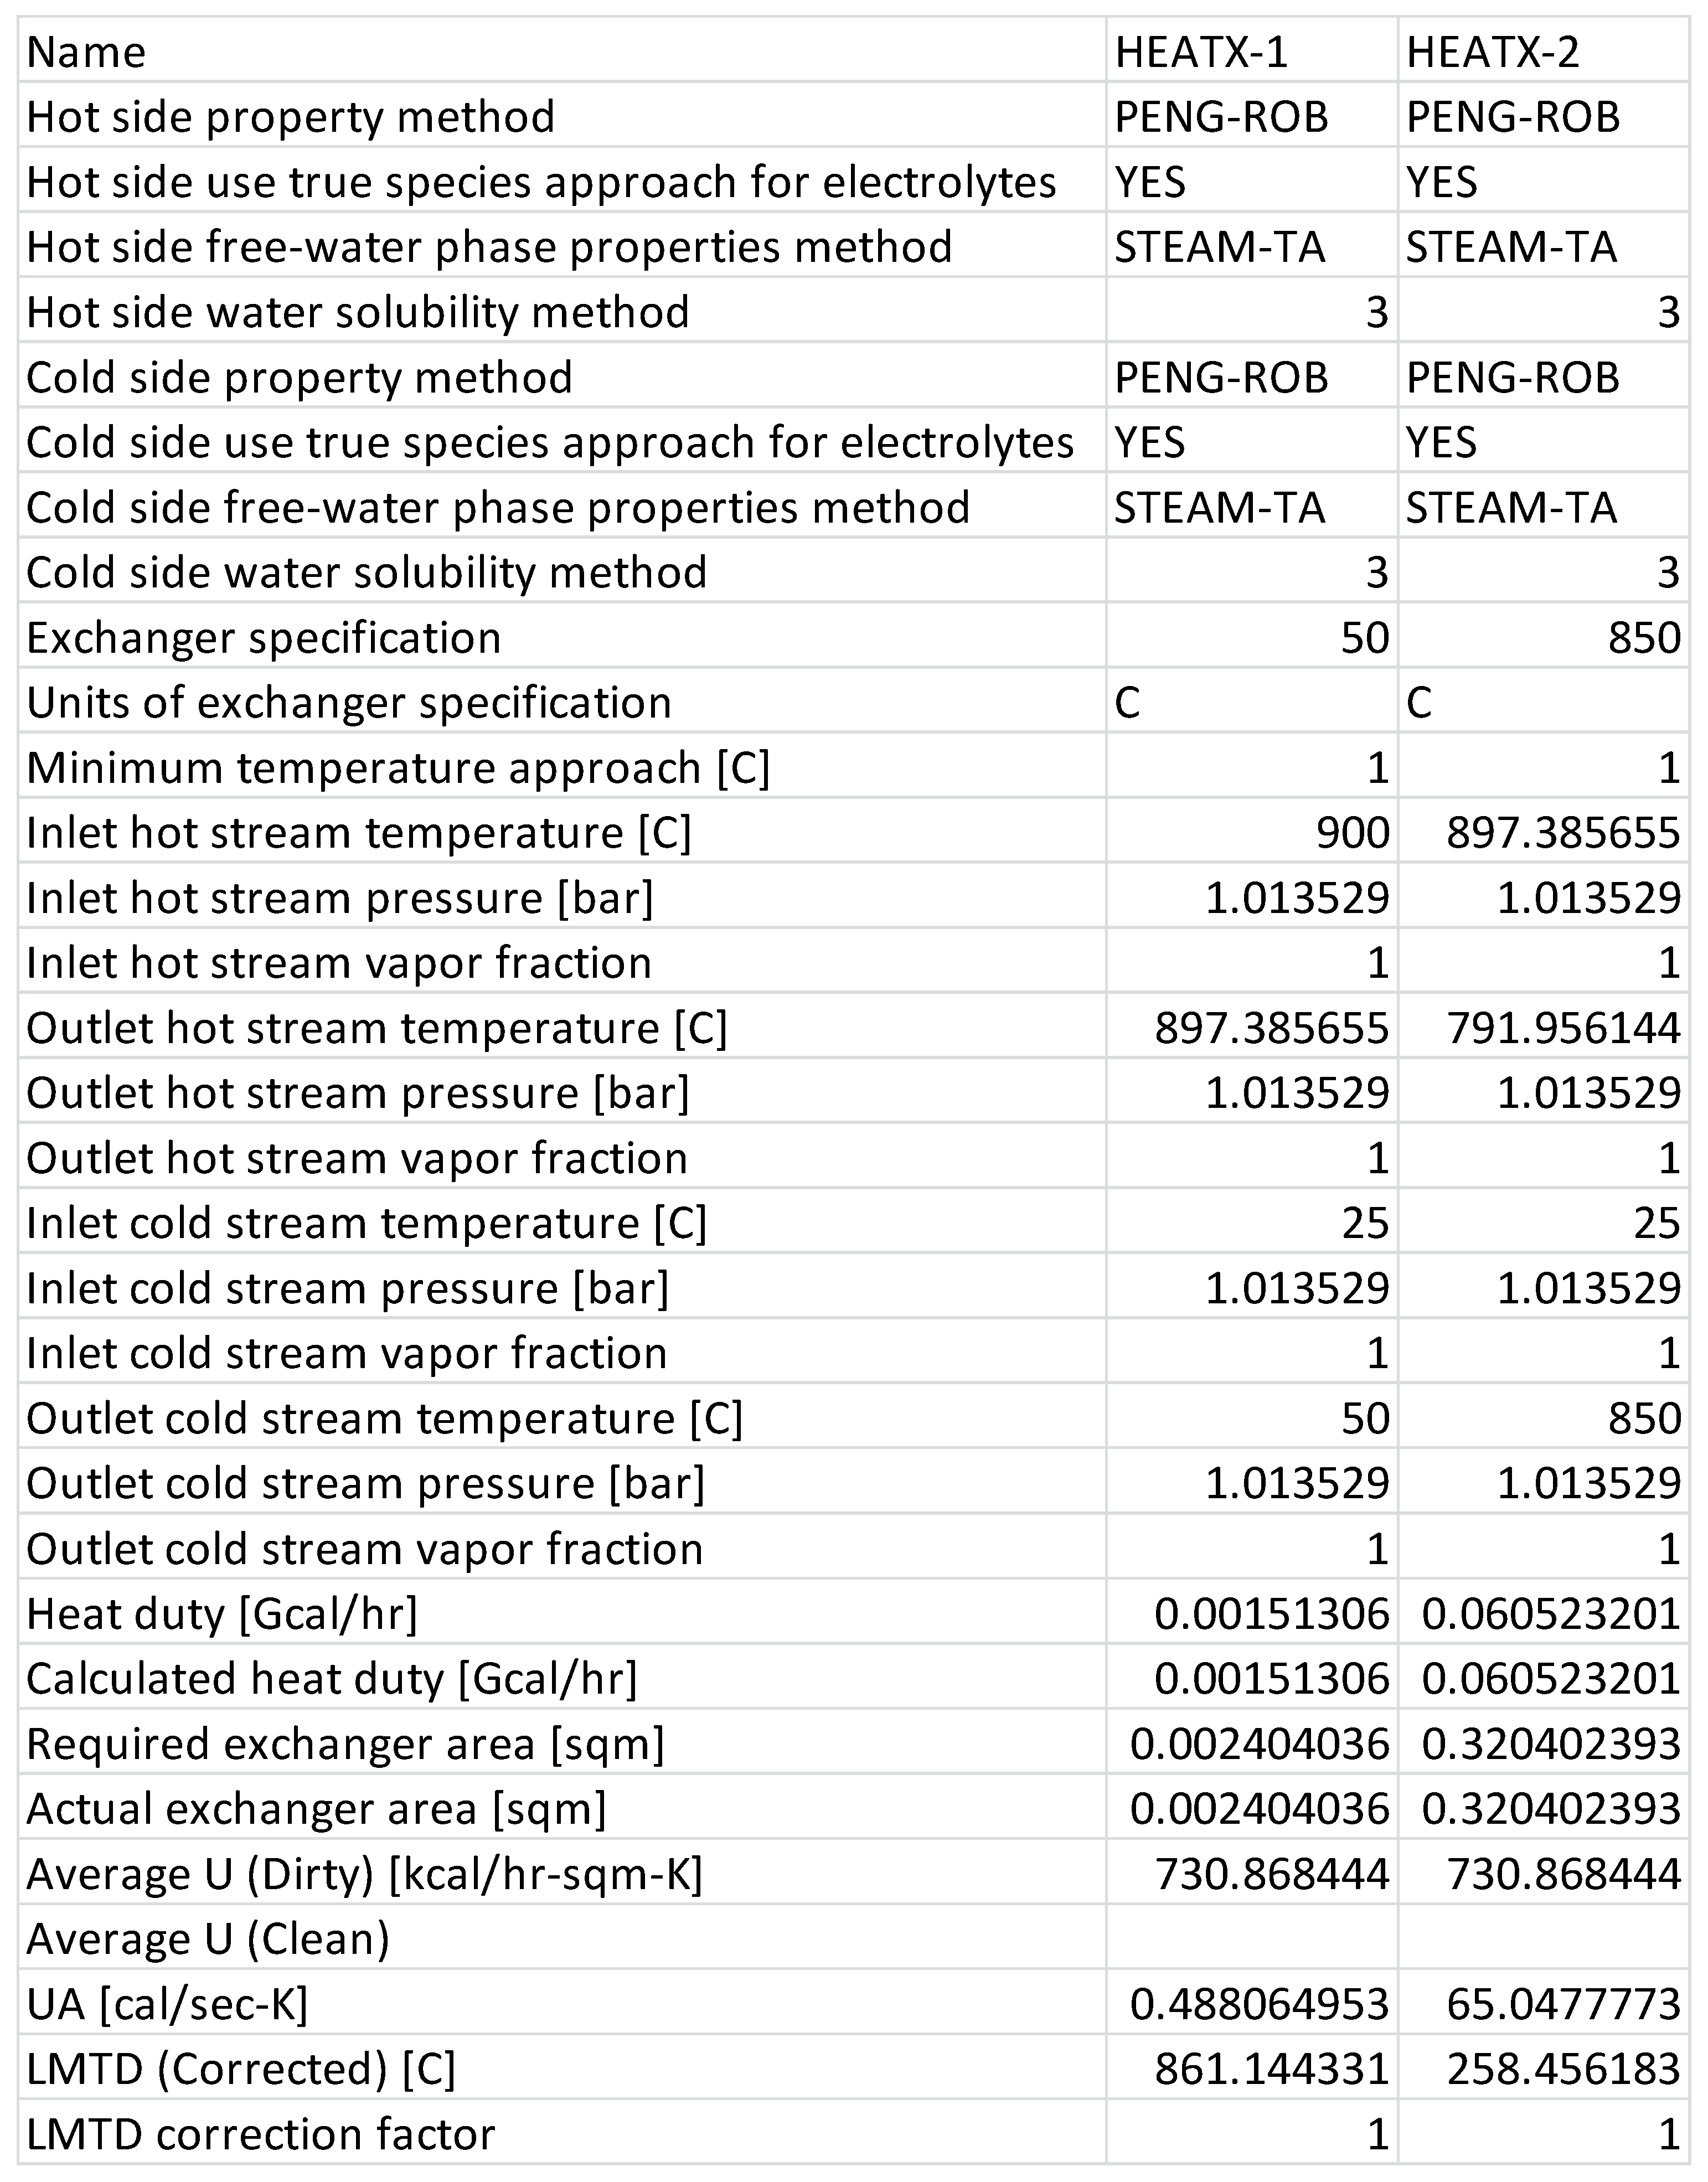
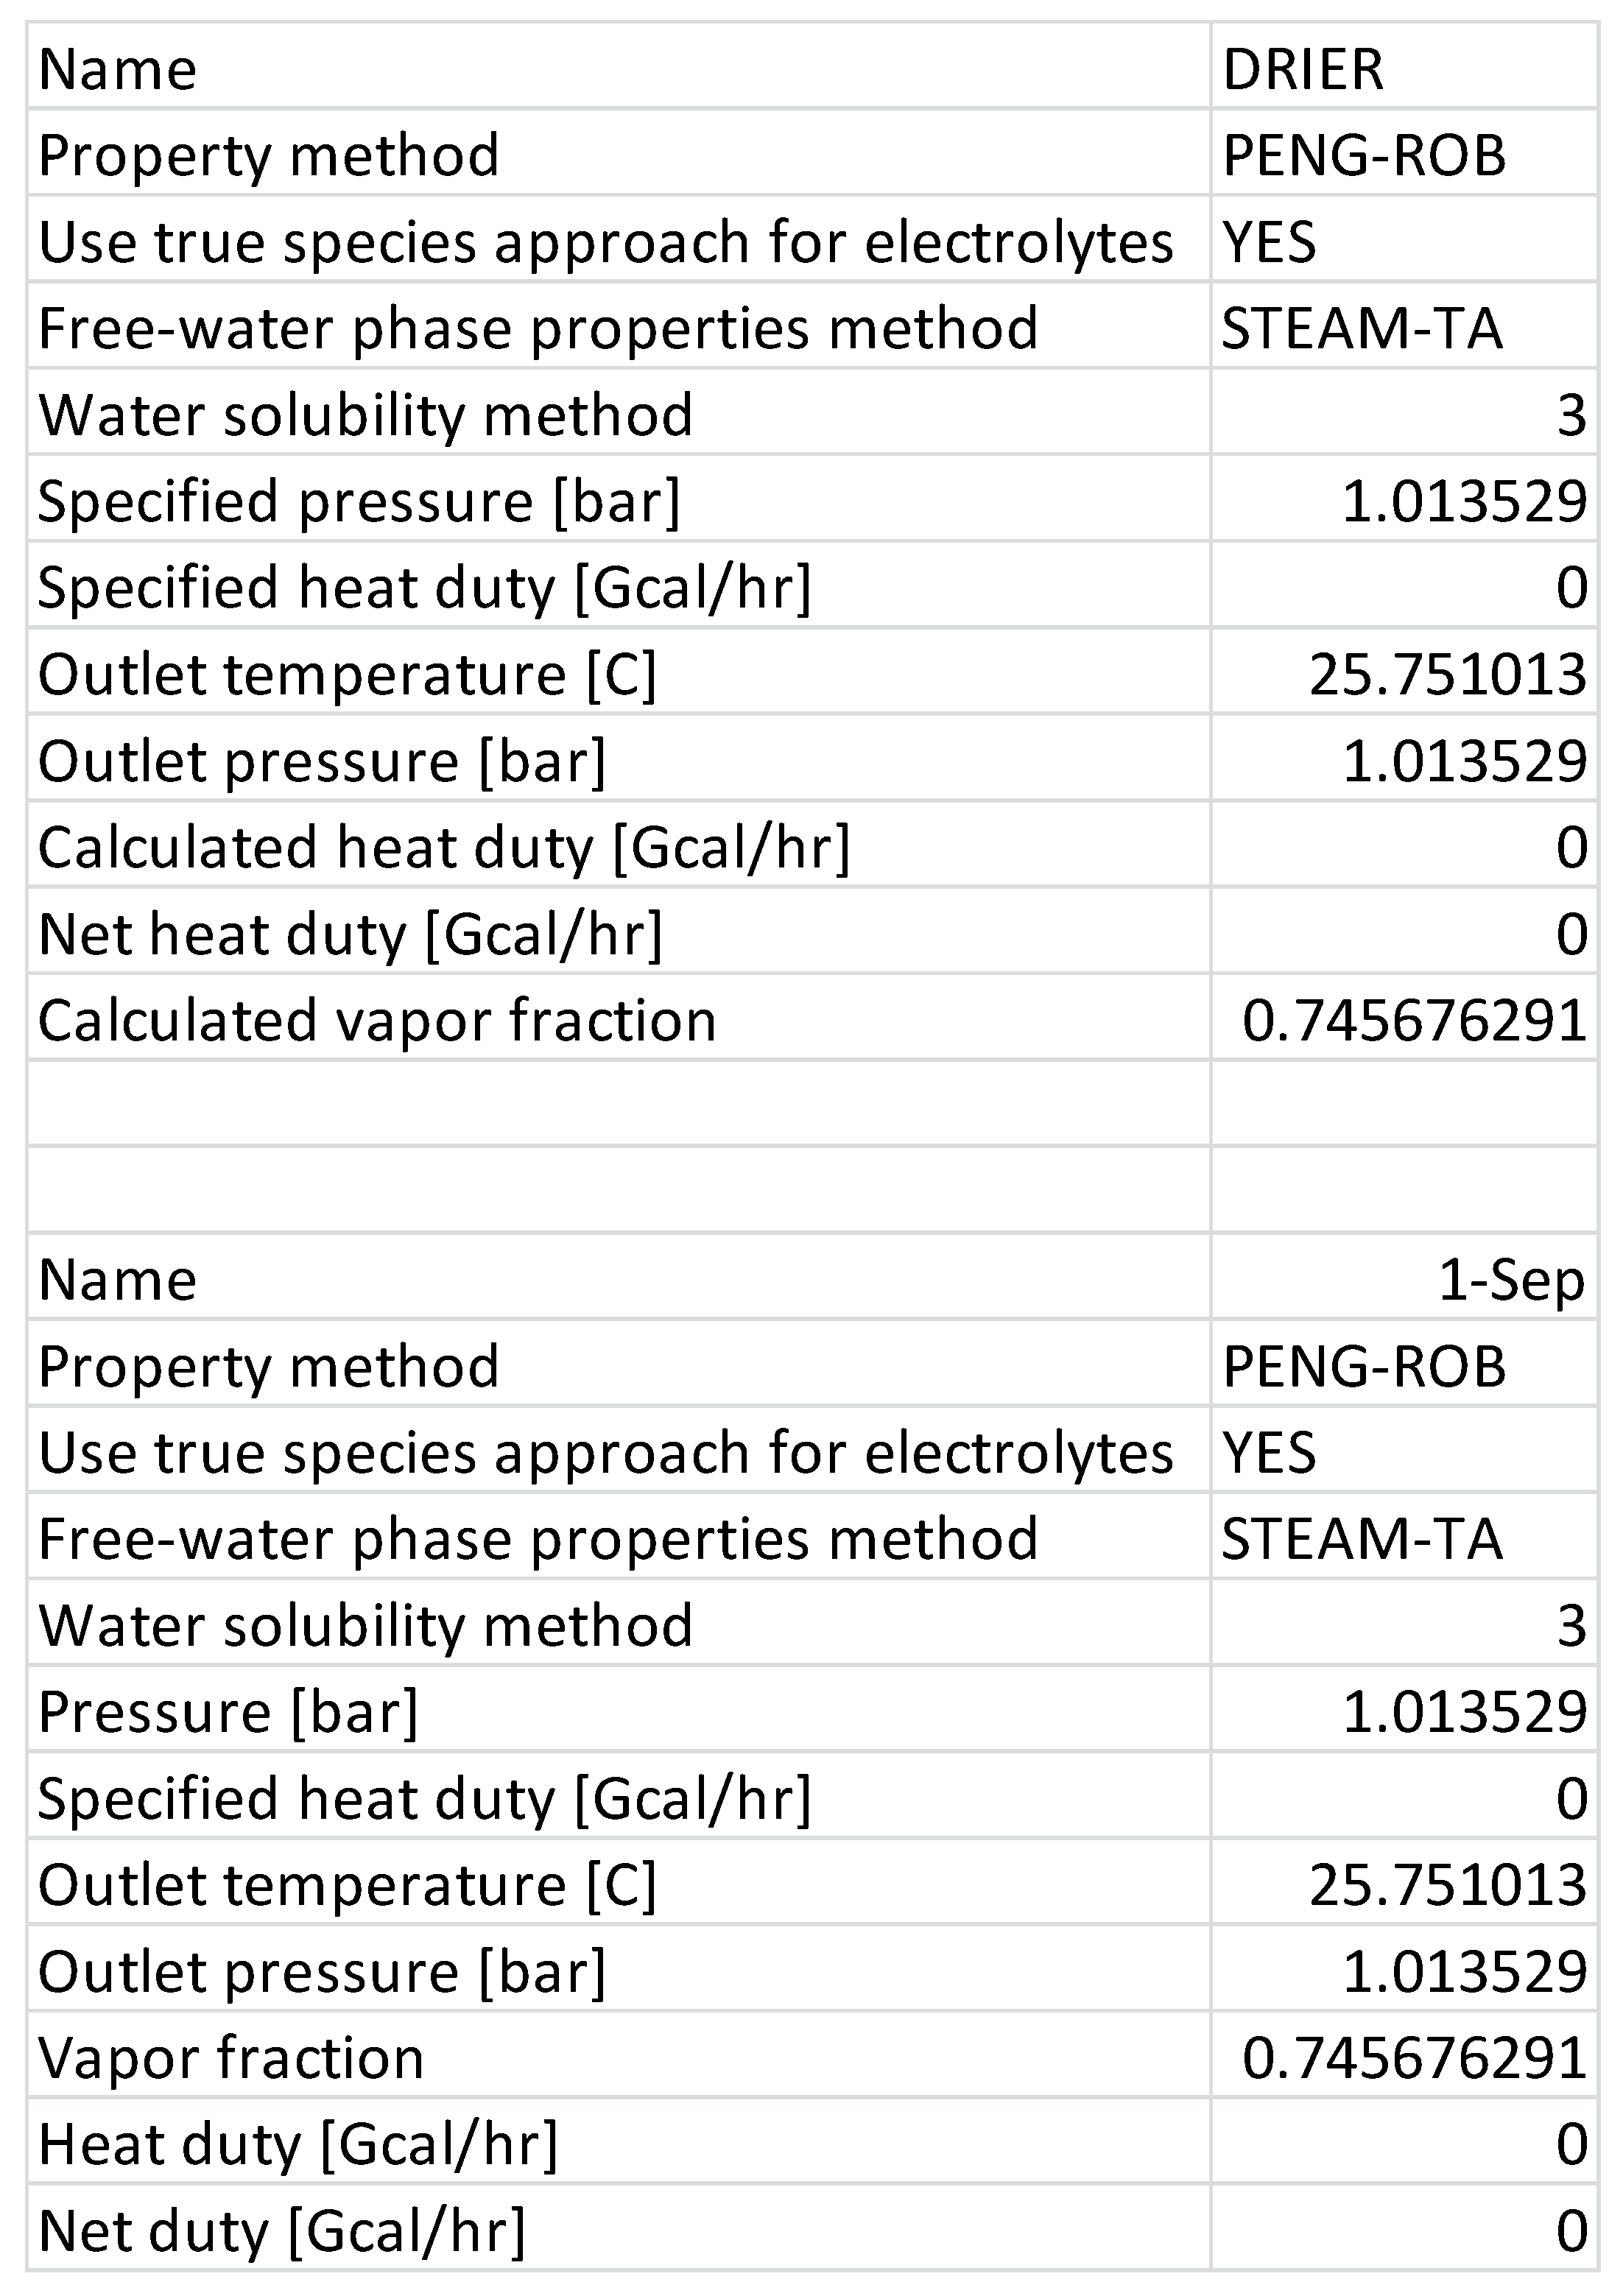
- In the thermochemical models, the drying block, i.e., the drier and downstream separator (SEP1), is operated adiabatically.
2.1. Biomass Properties in this Work
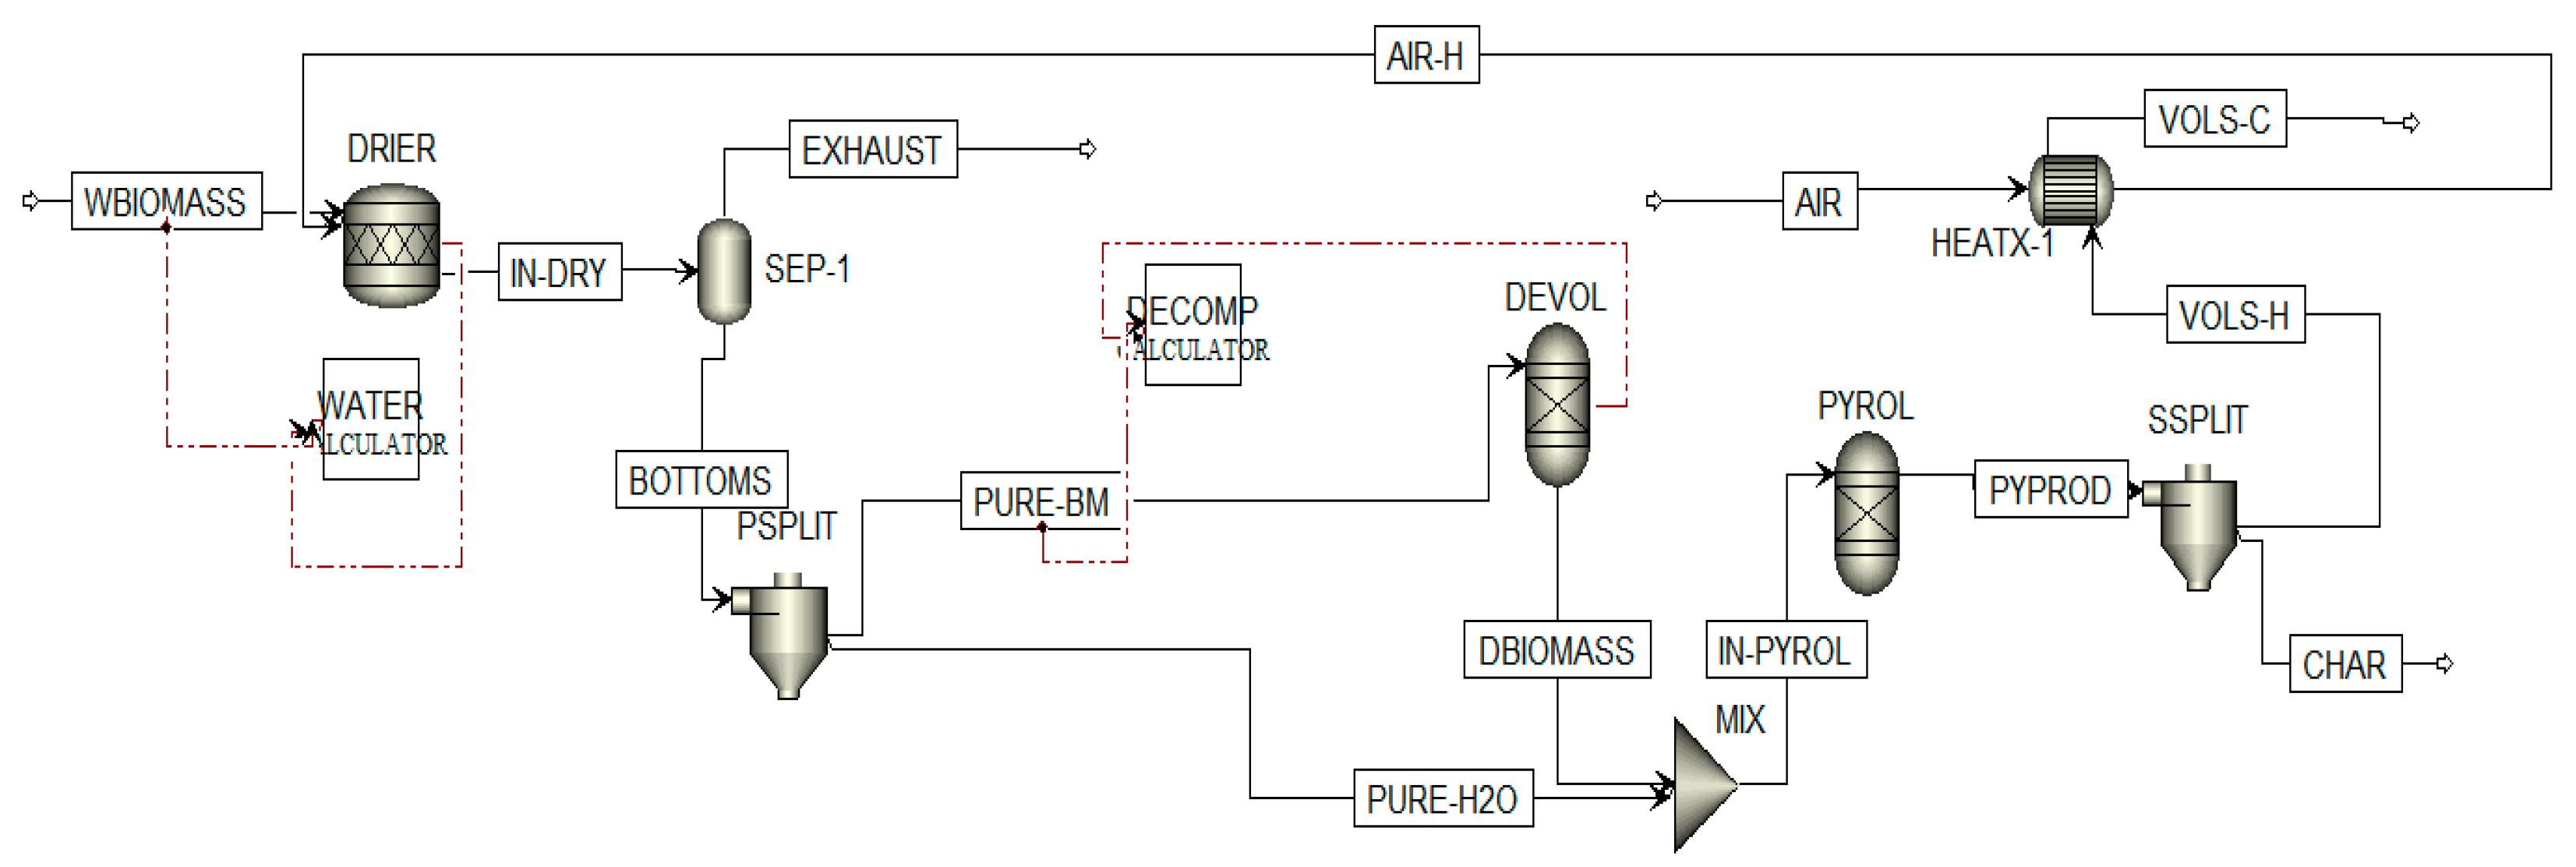
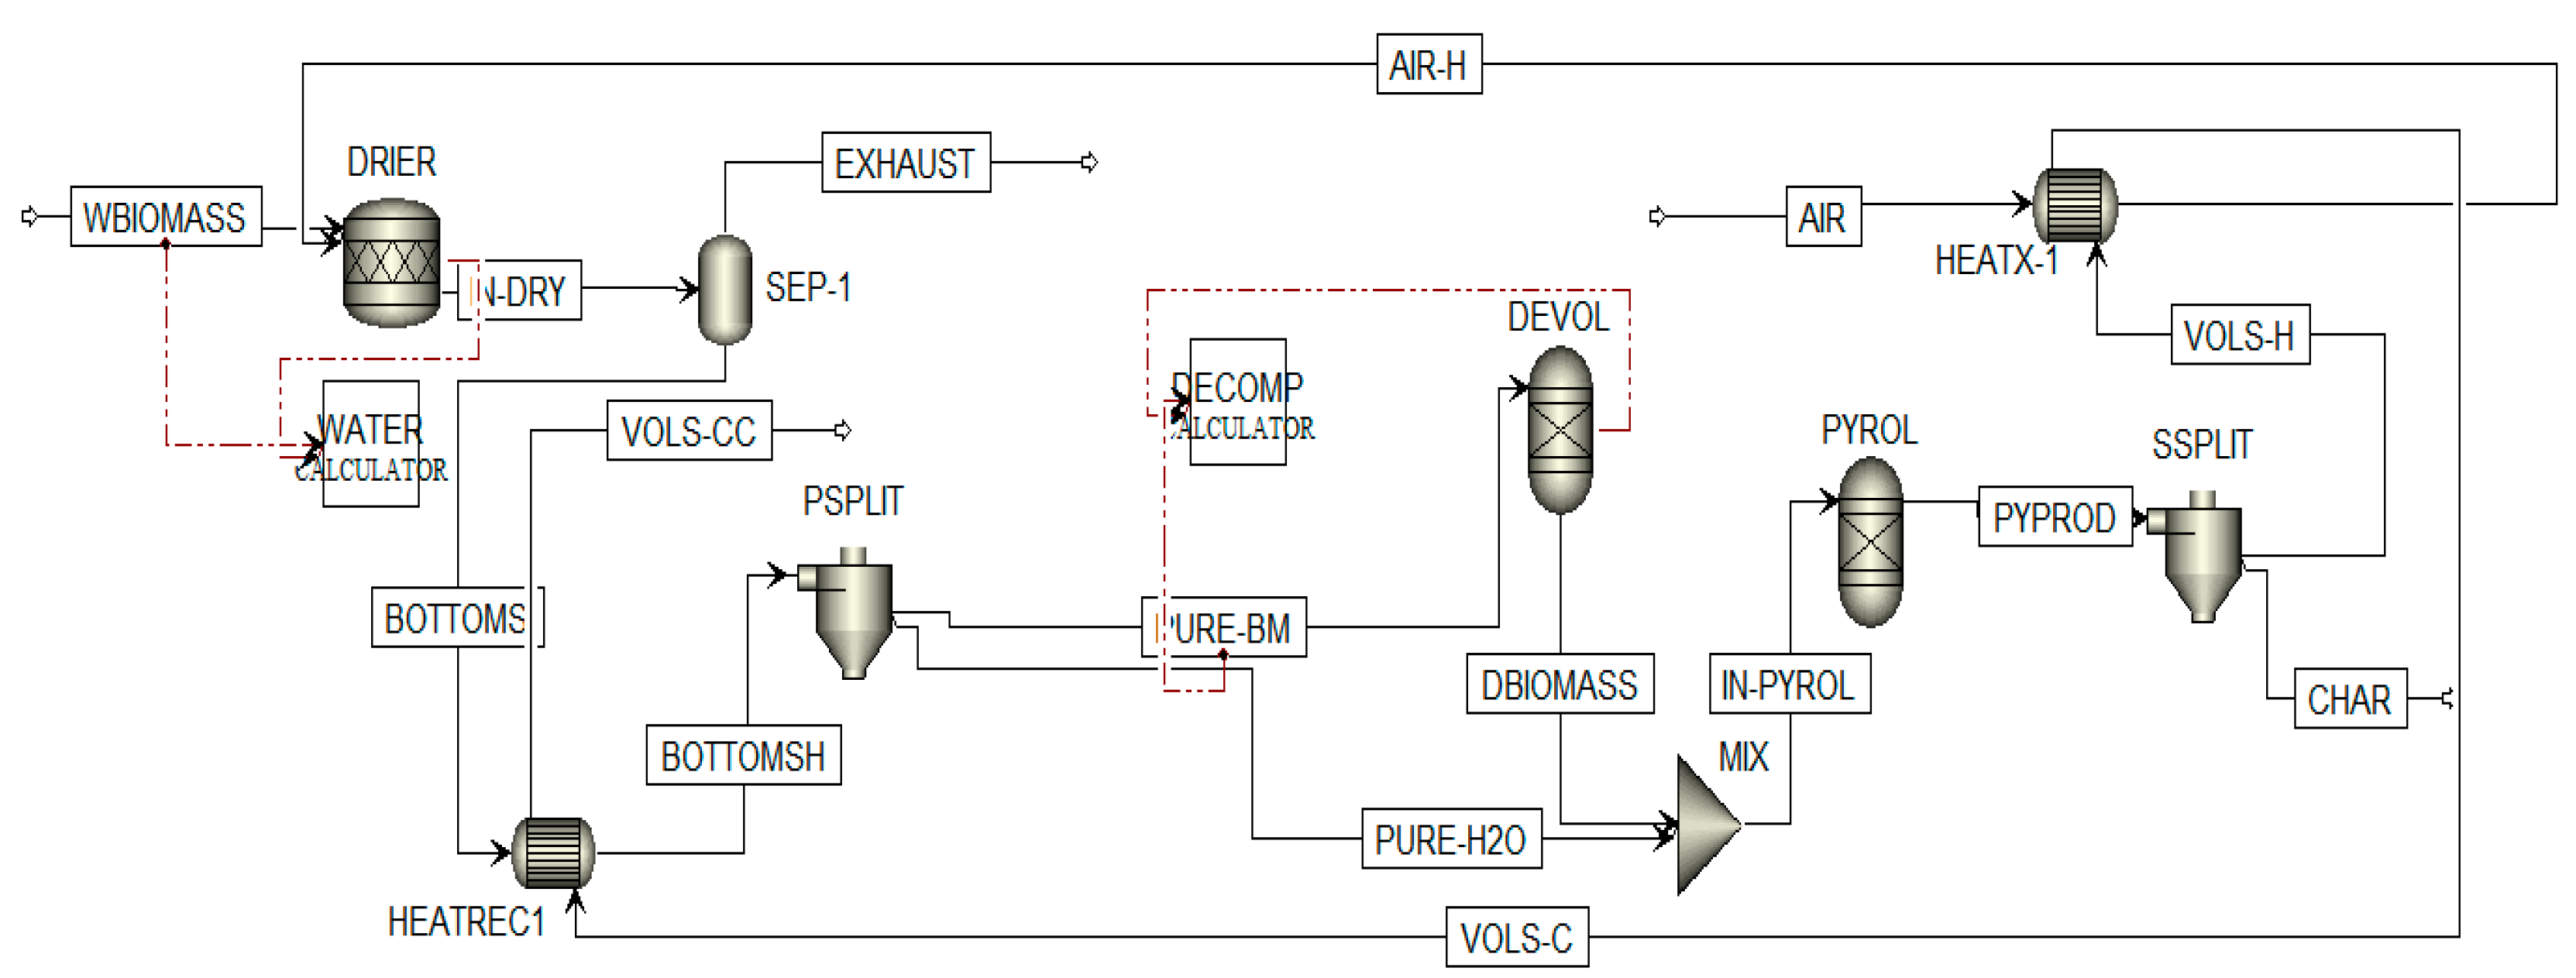
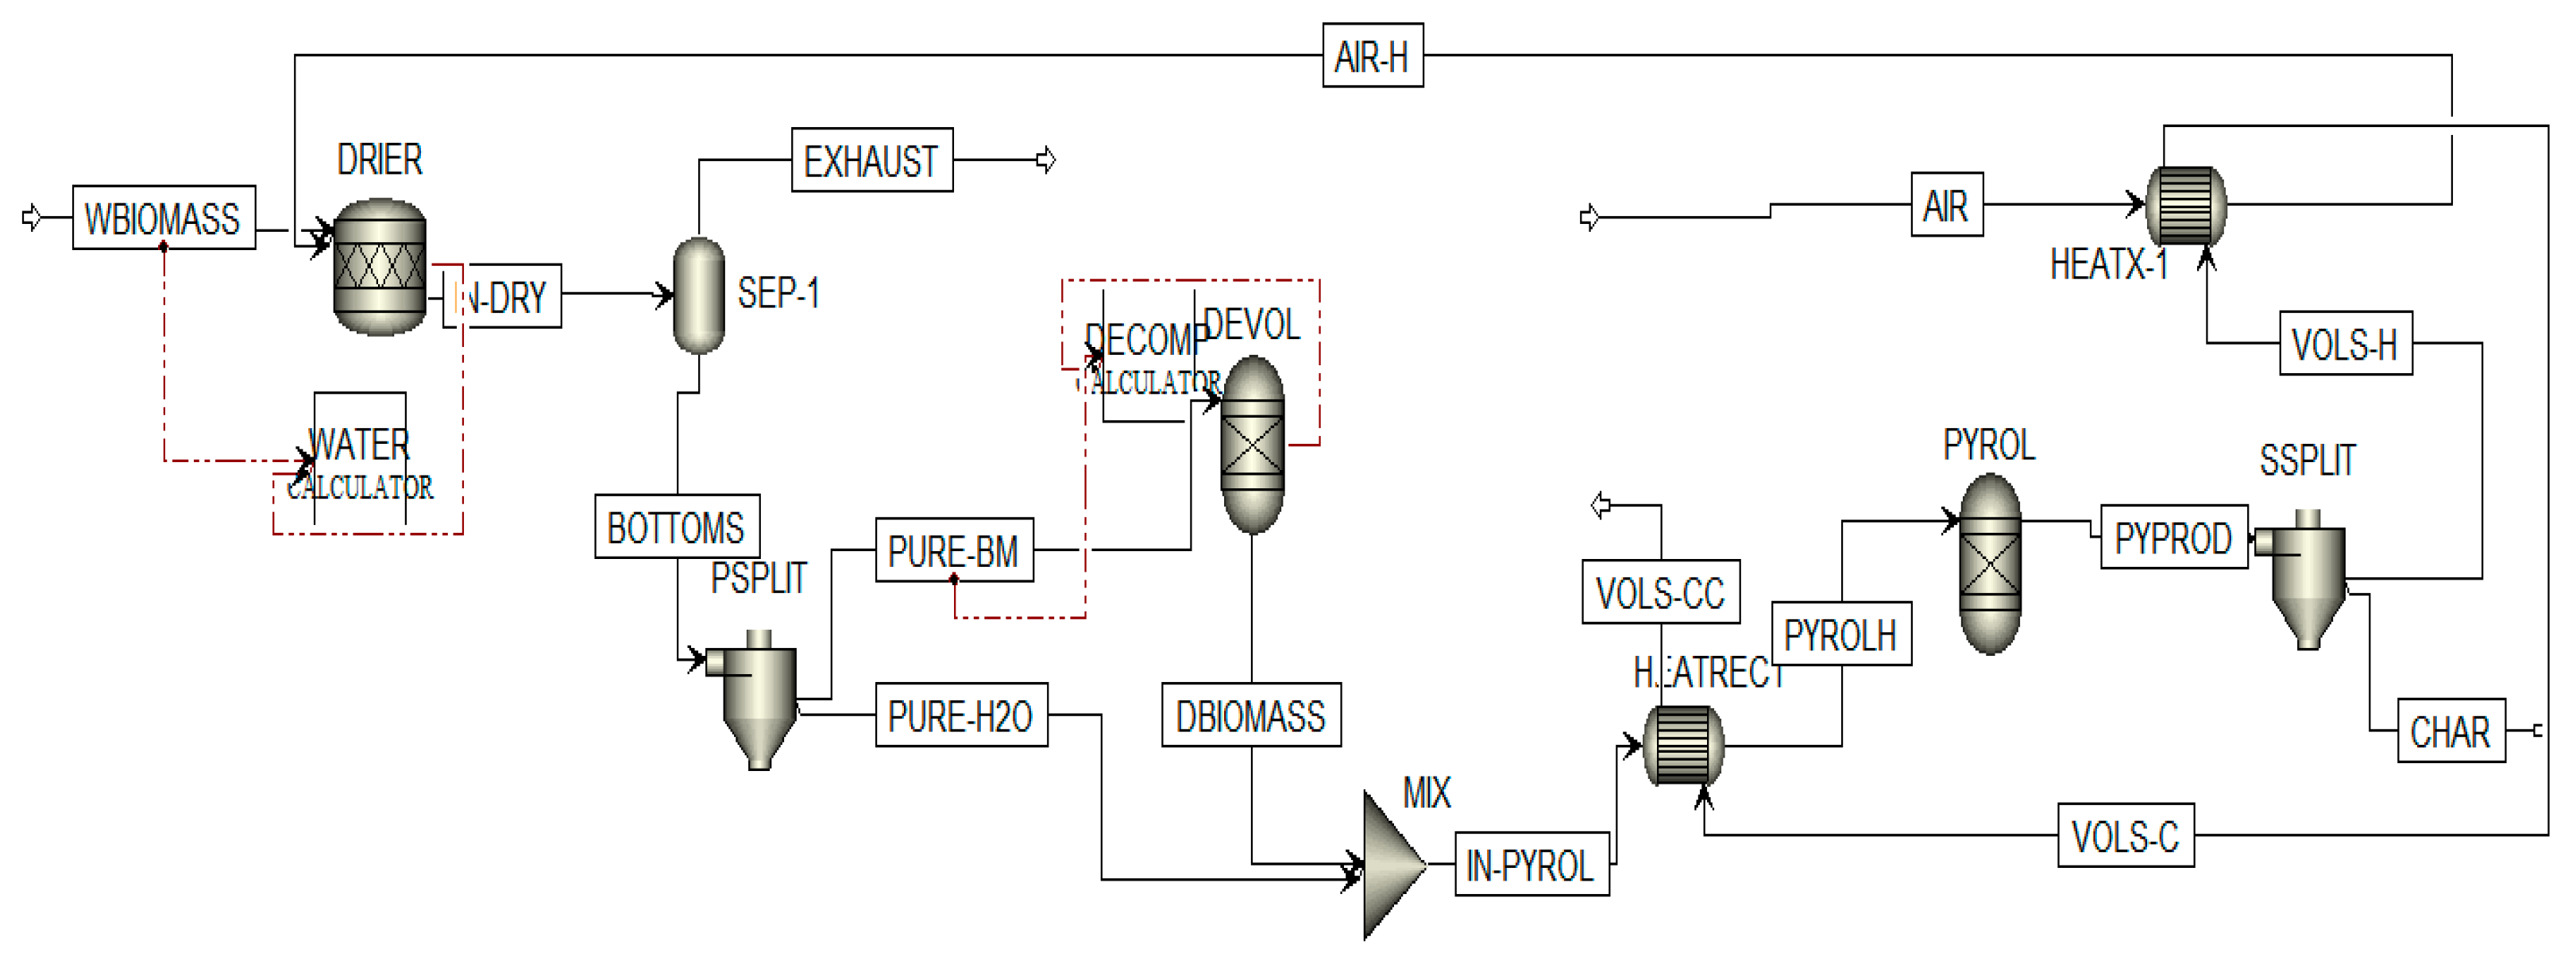
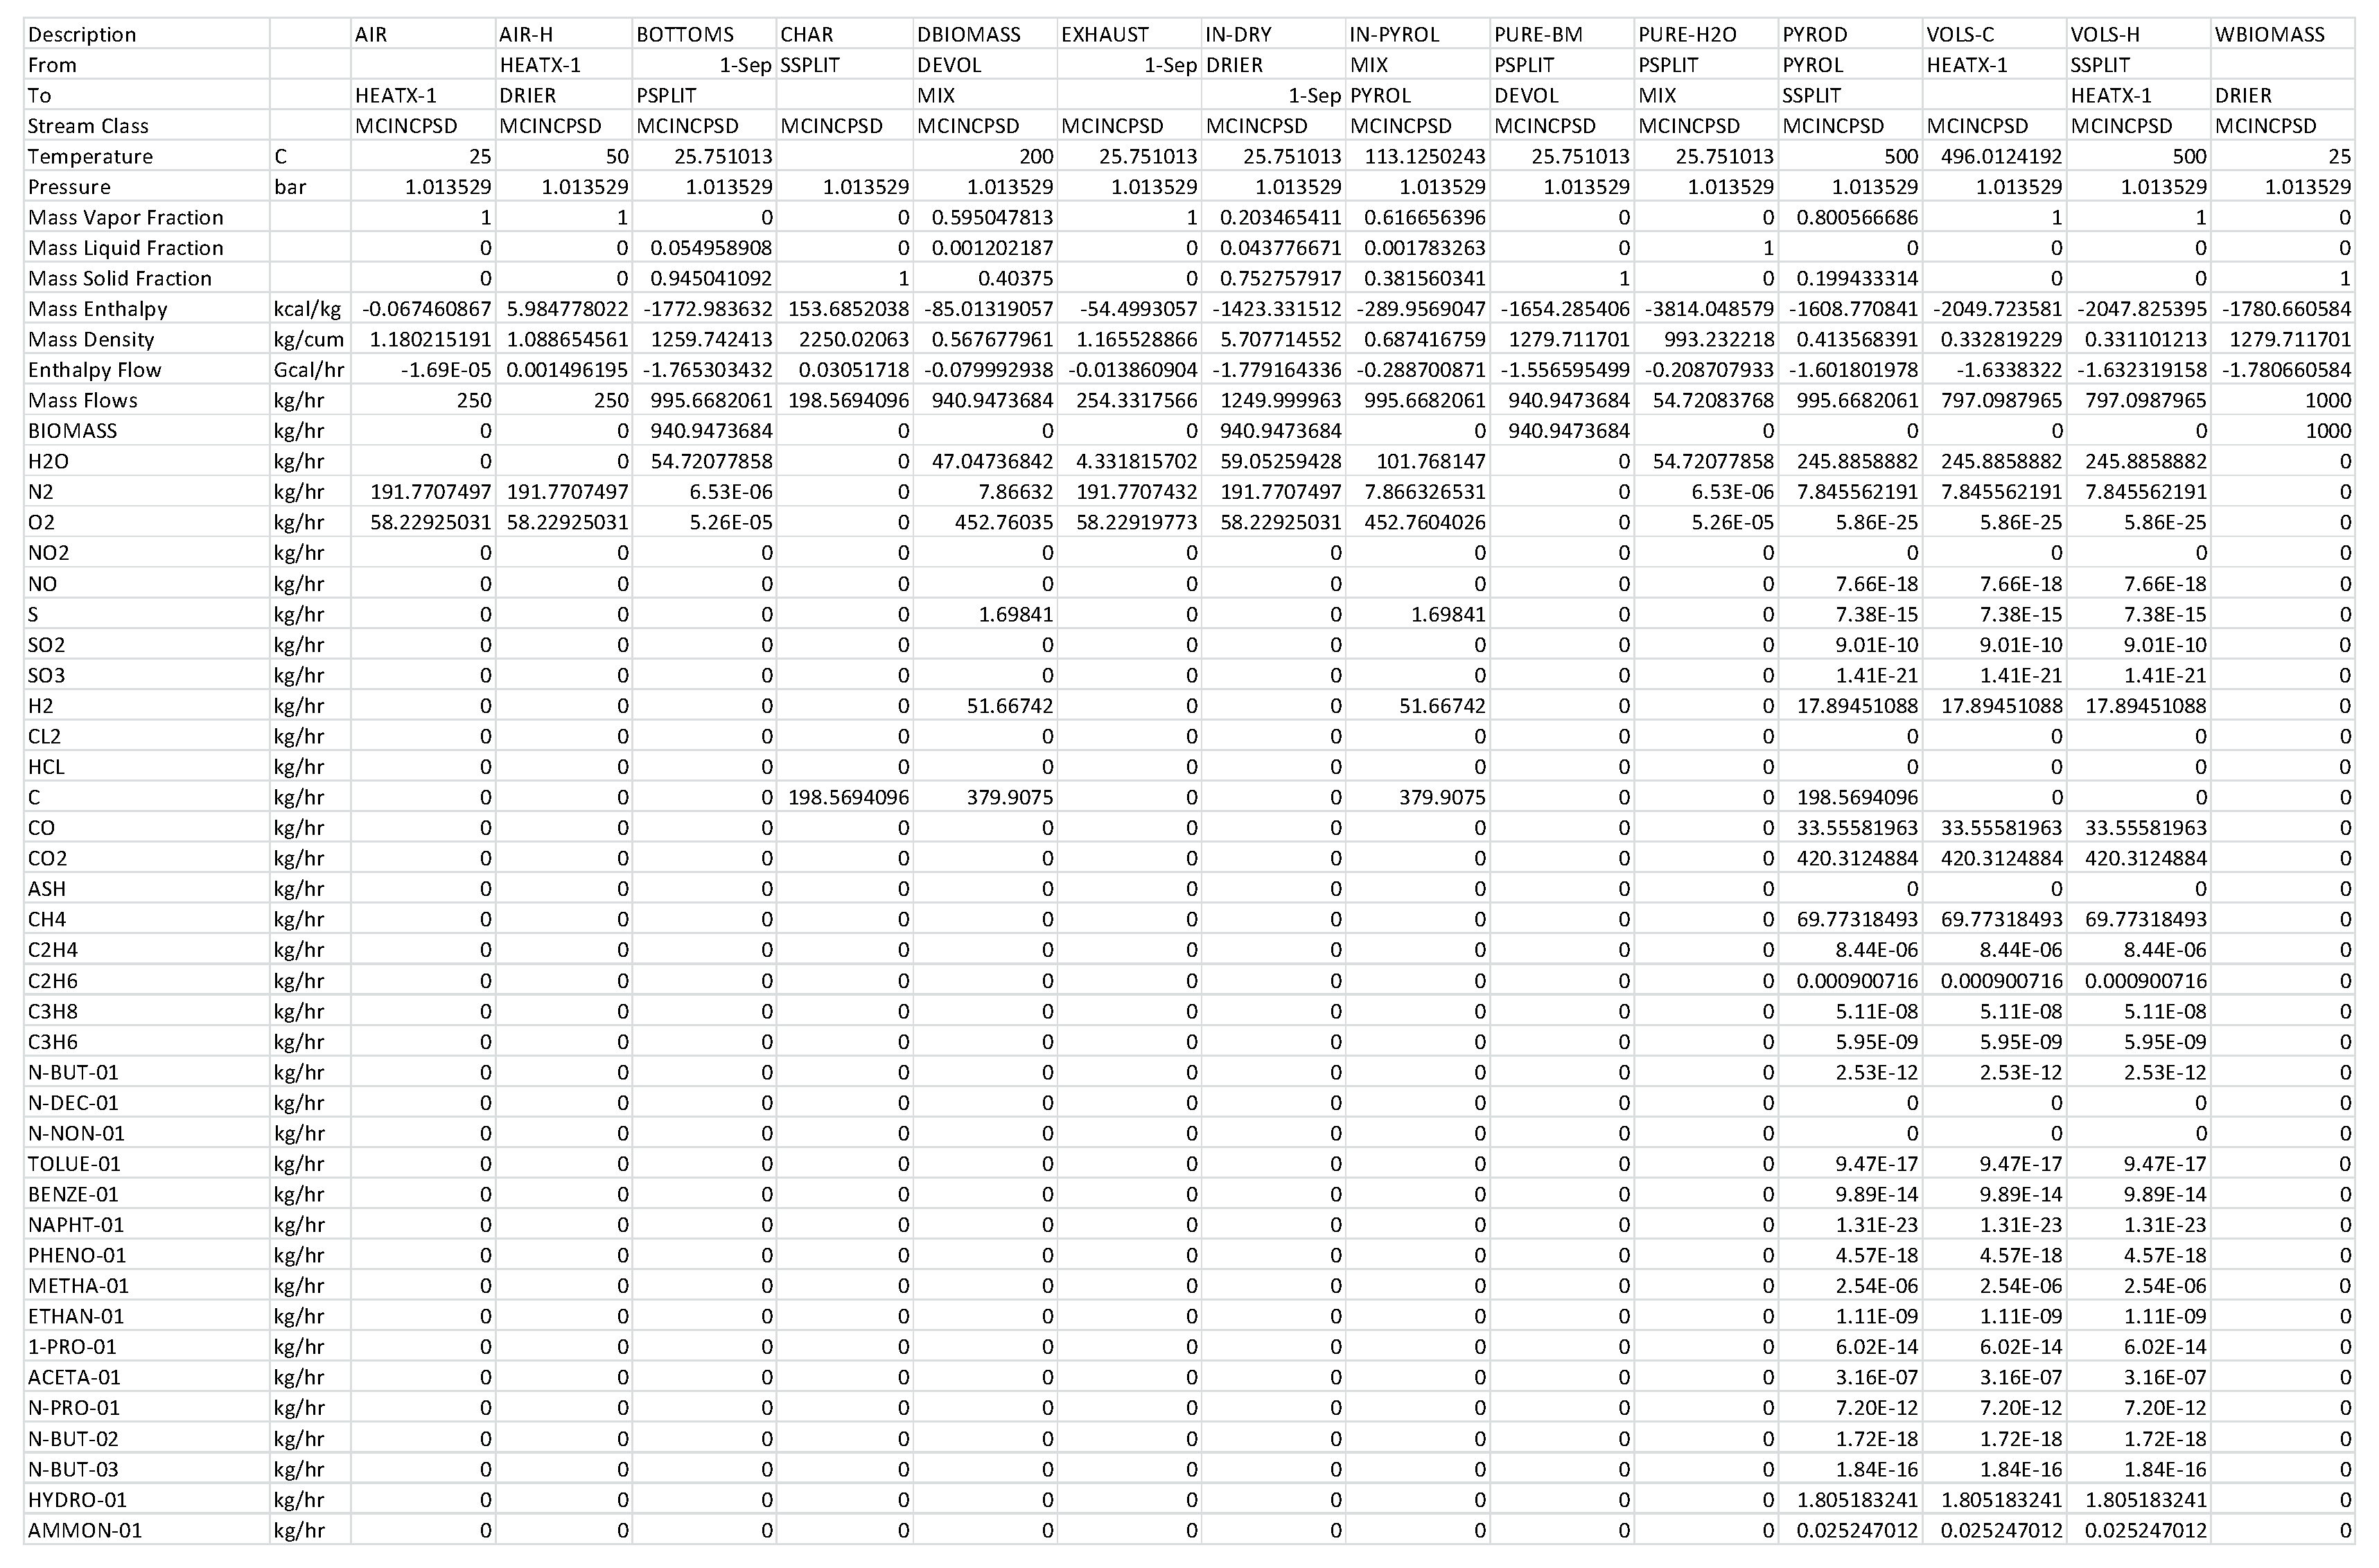
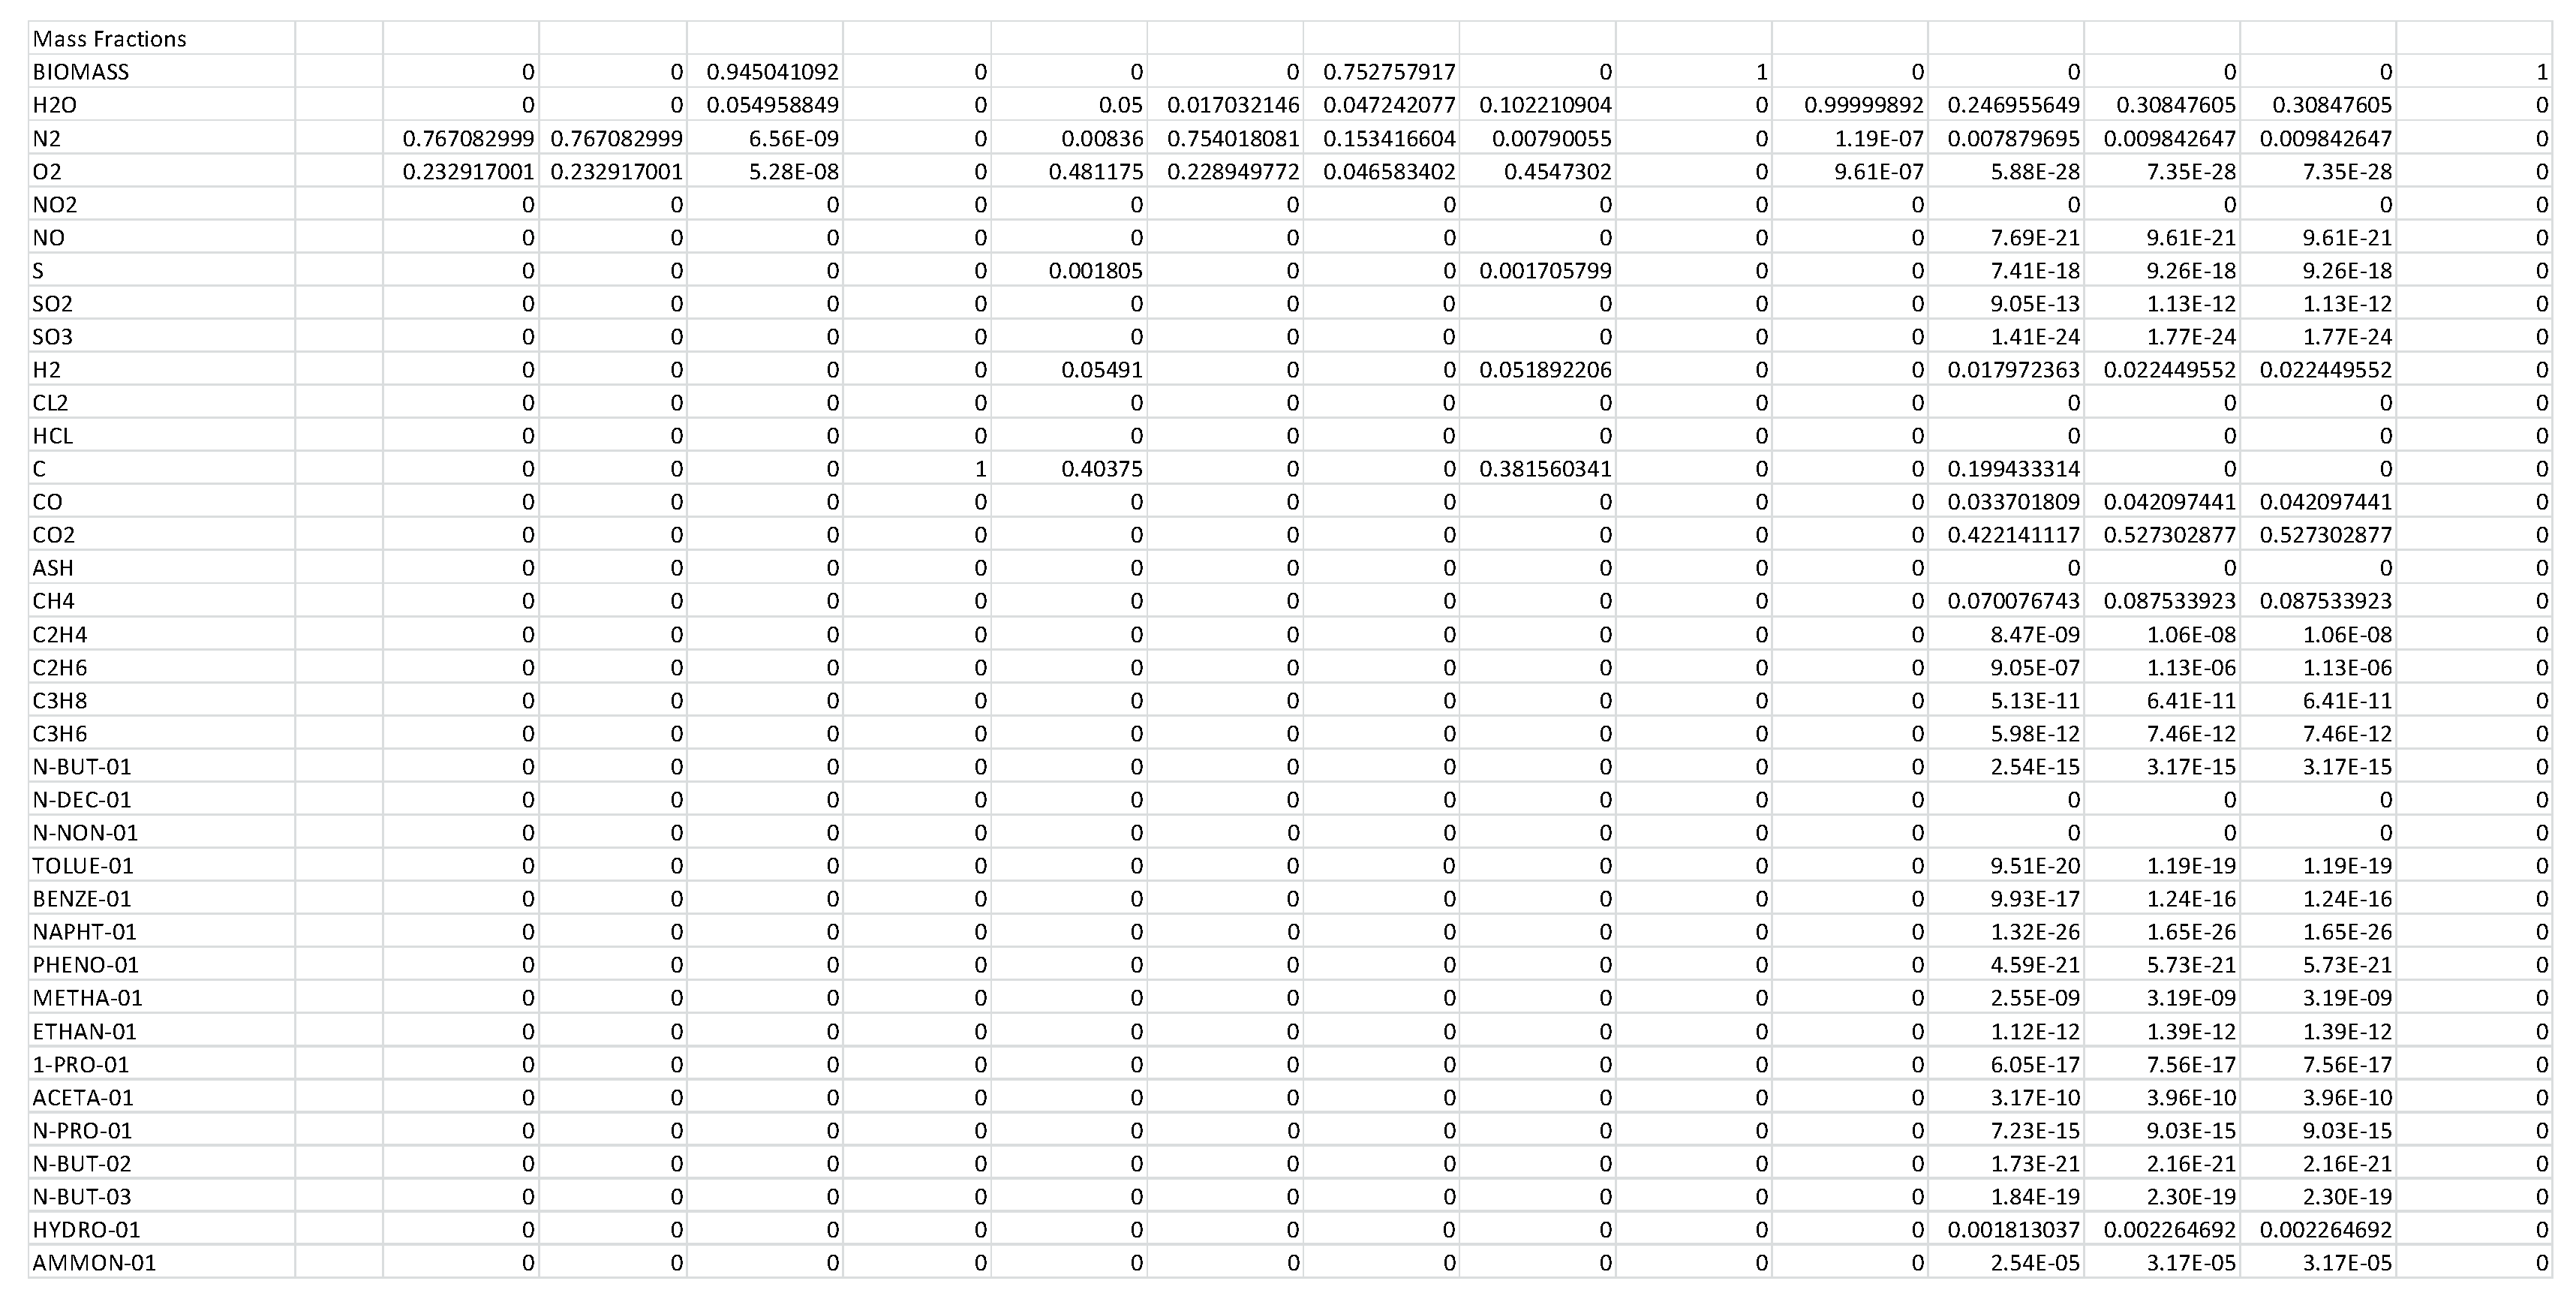
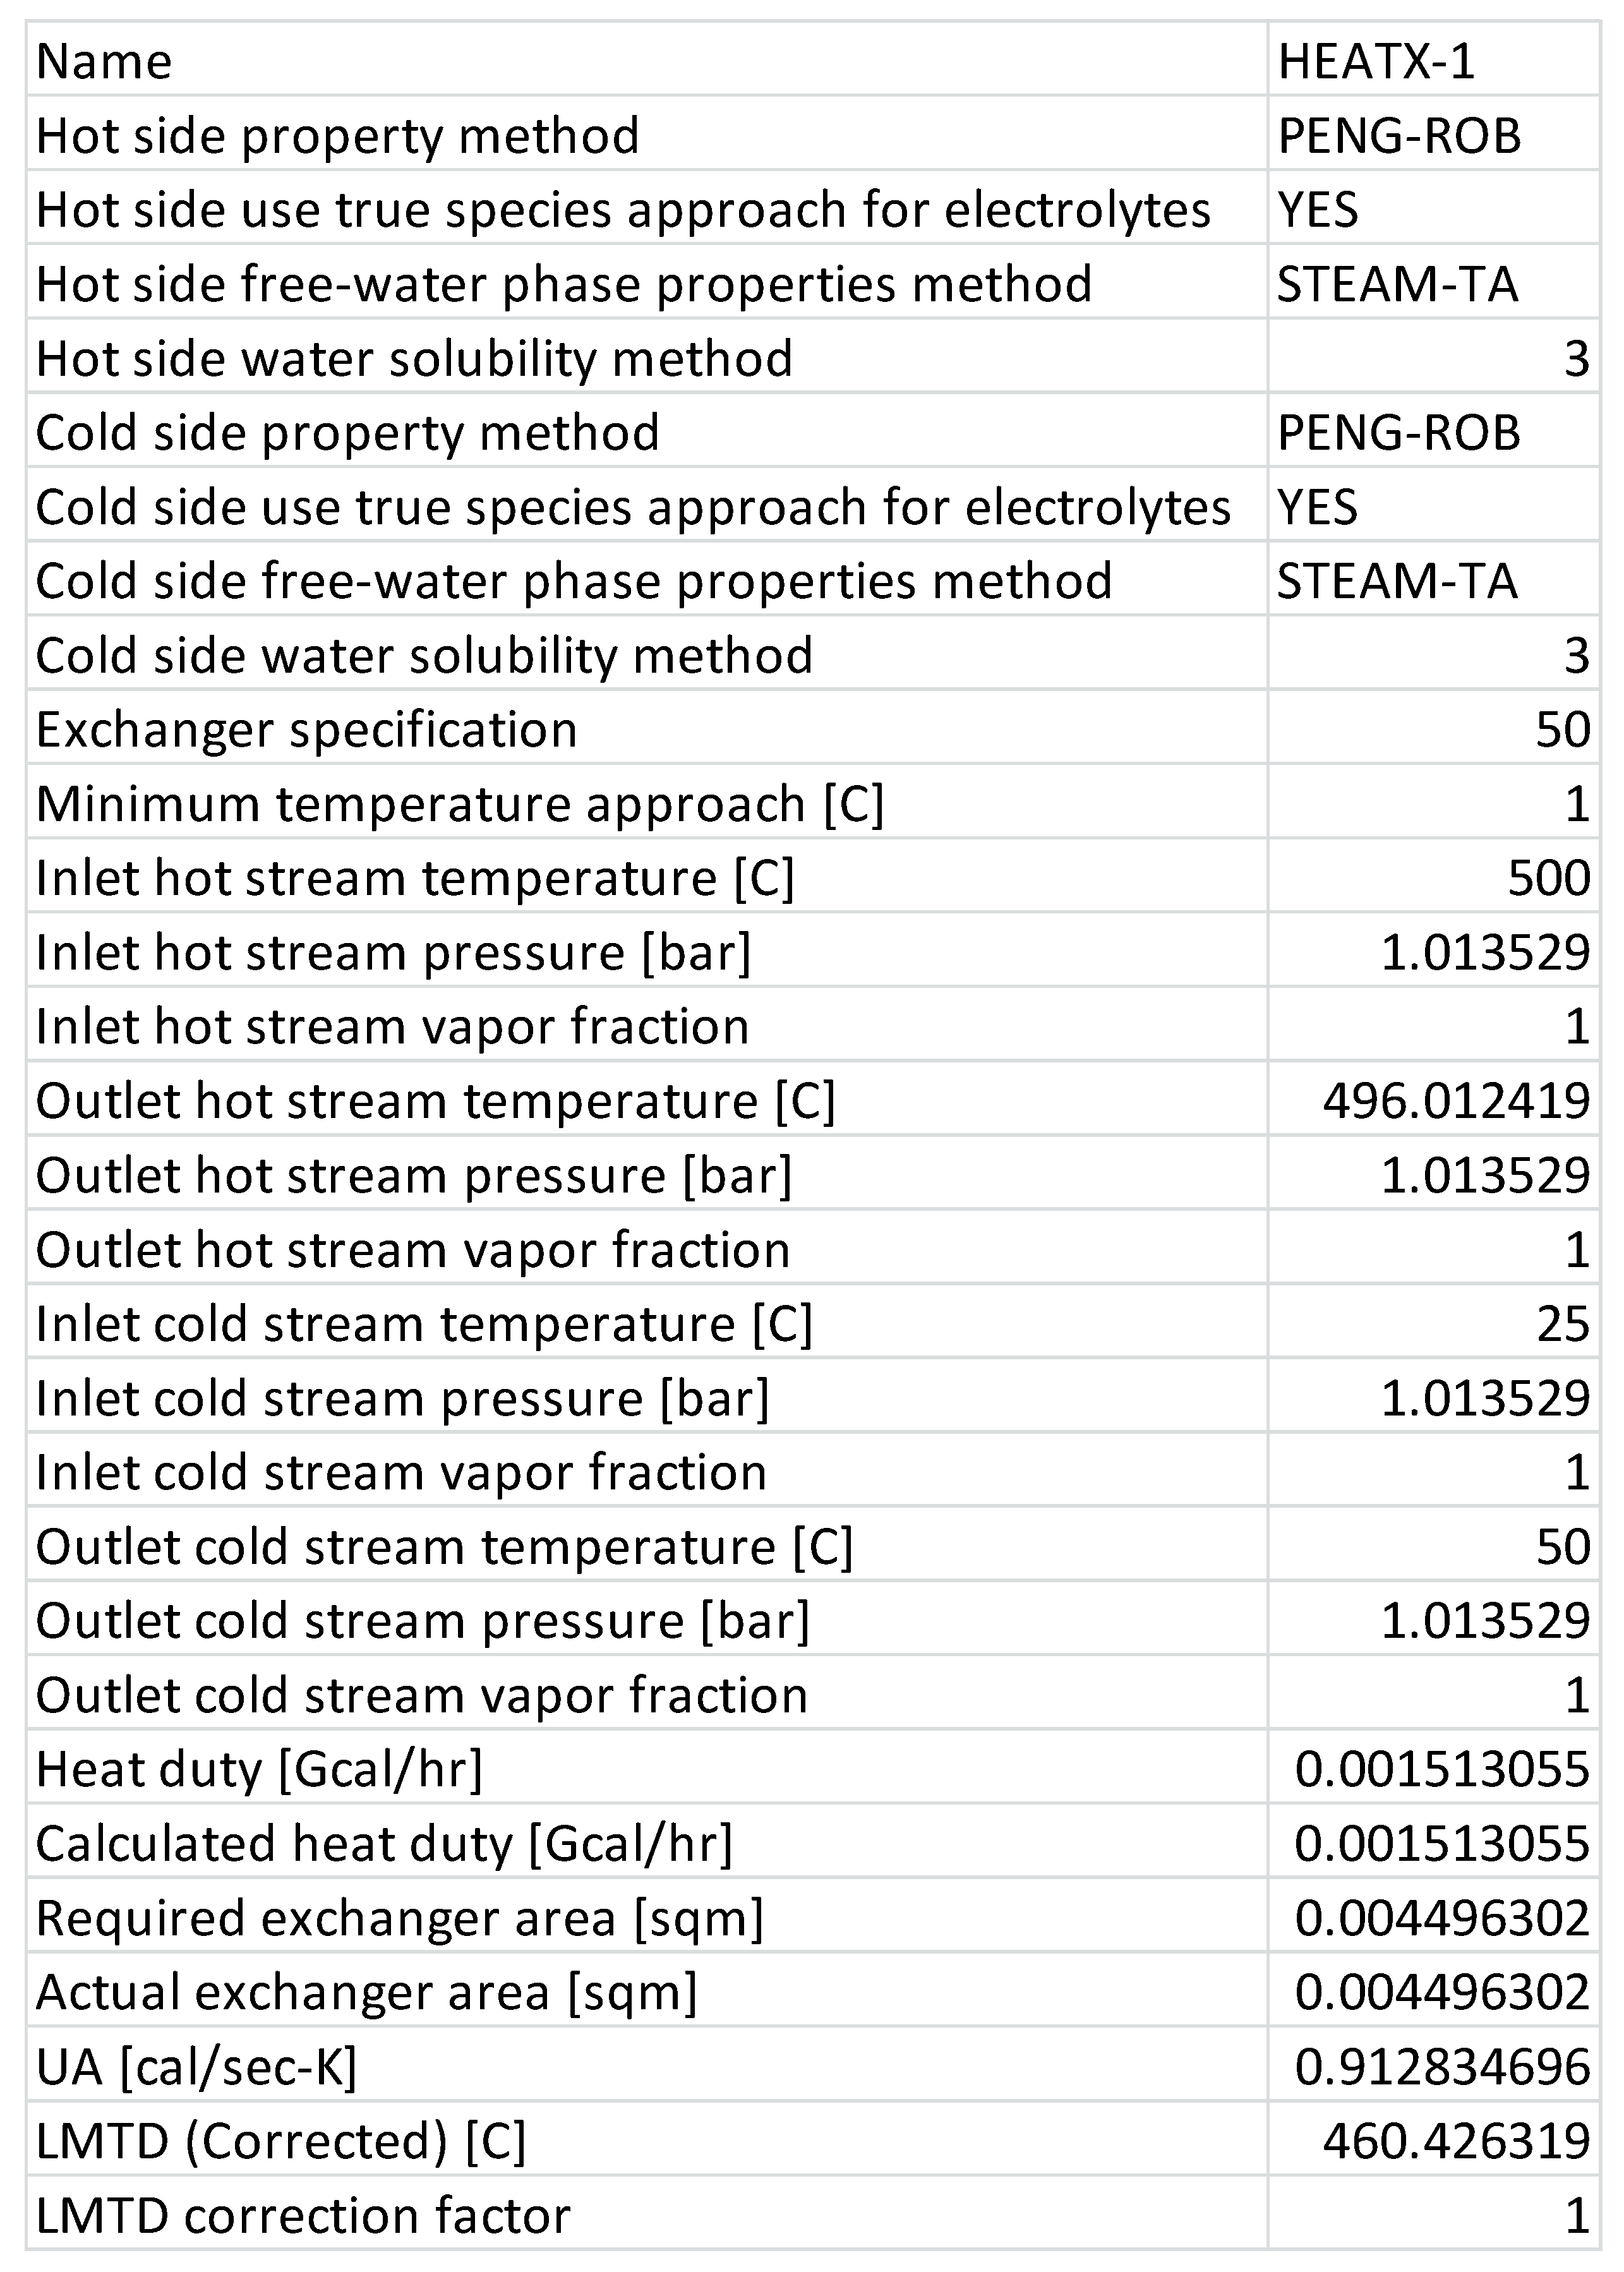
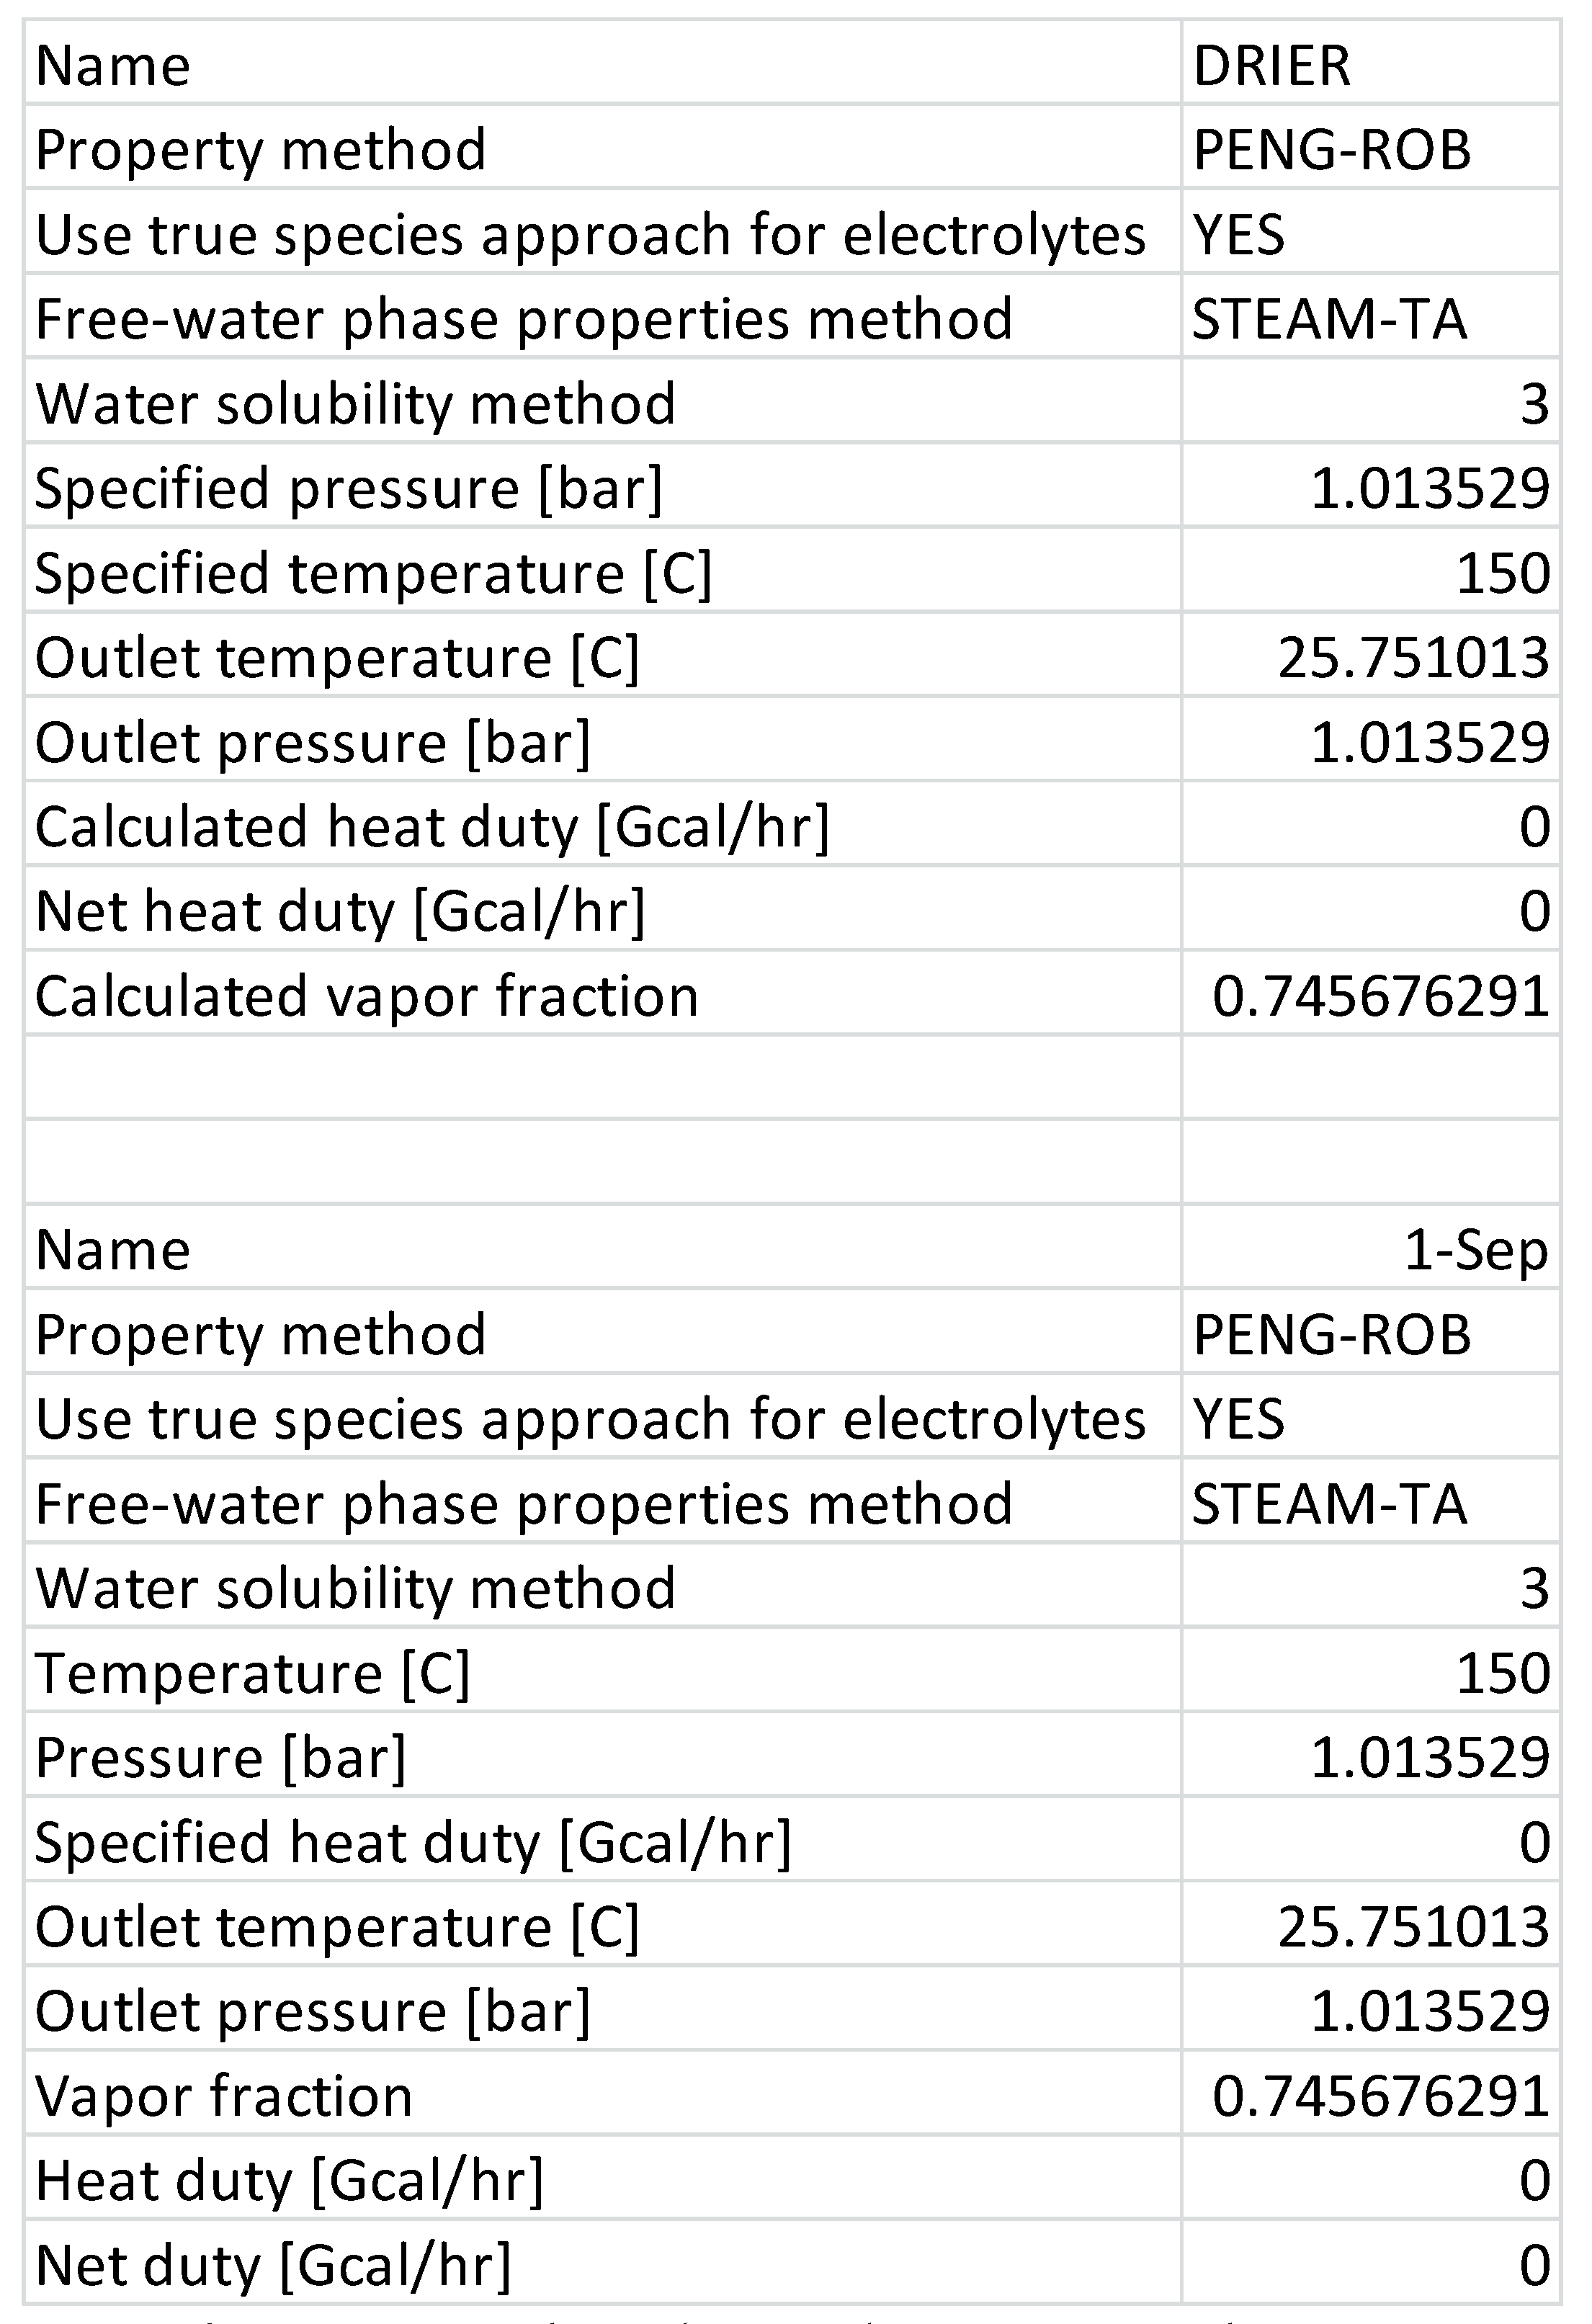
2.2. Pyrolysis Model
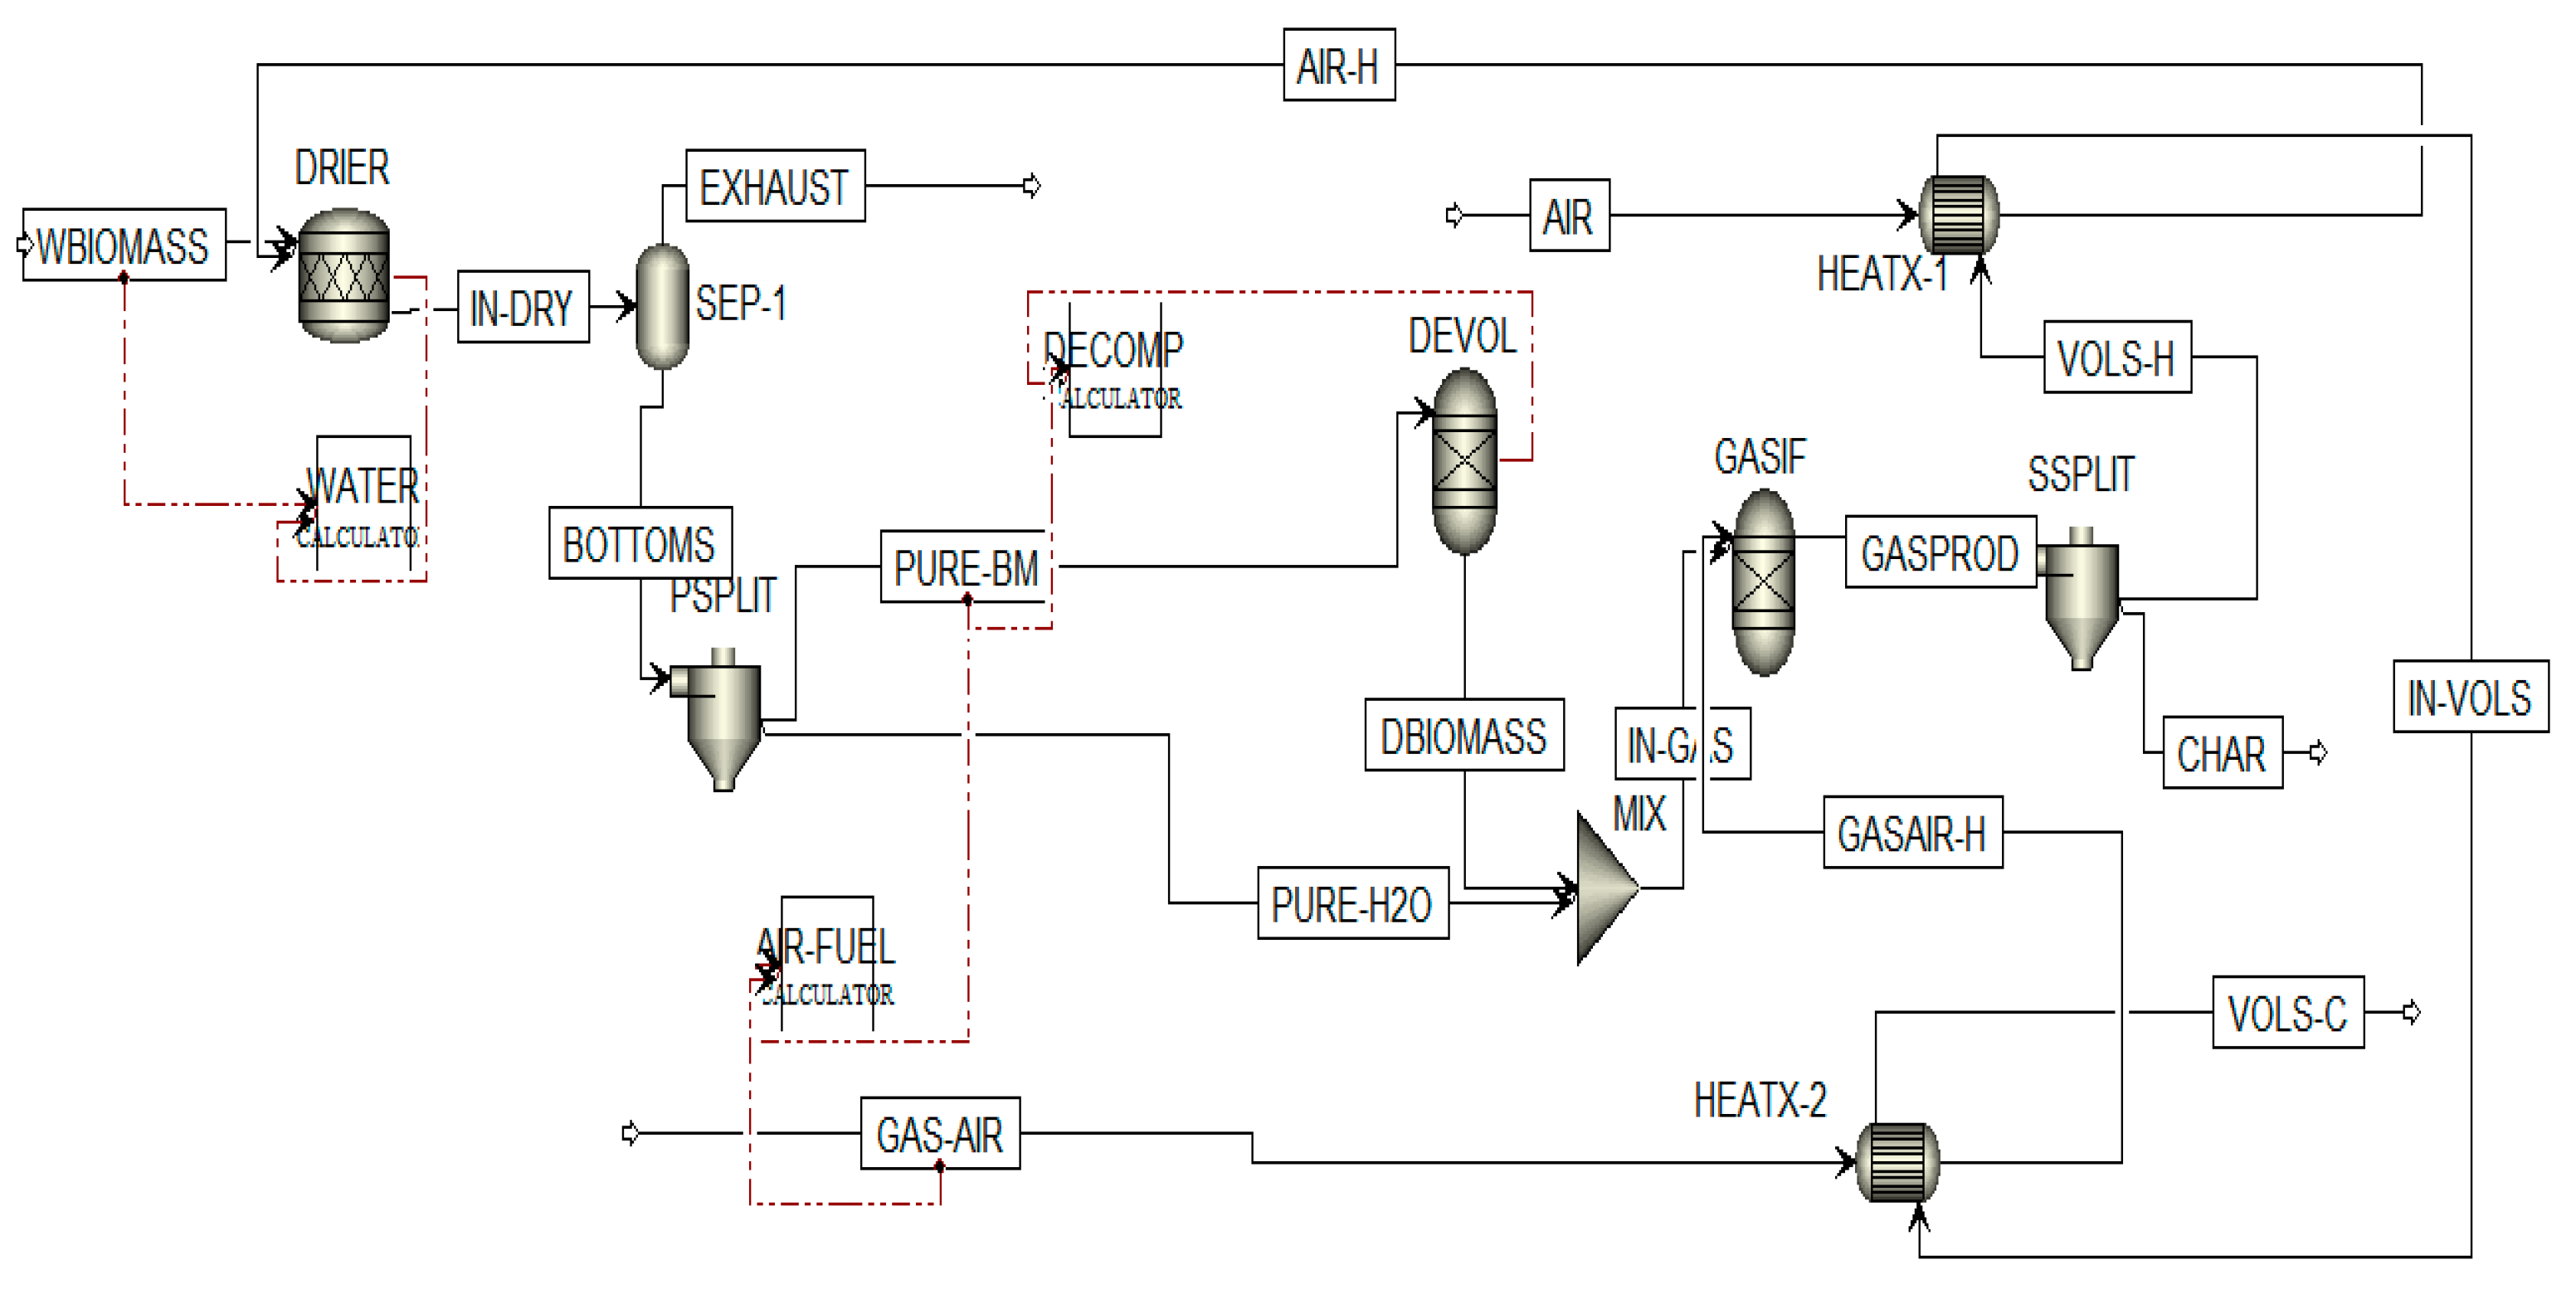
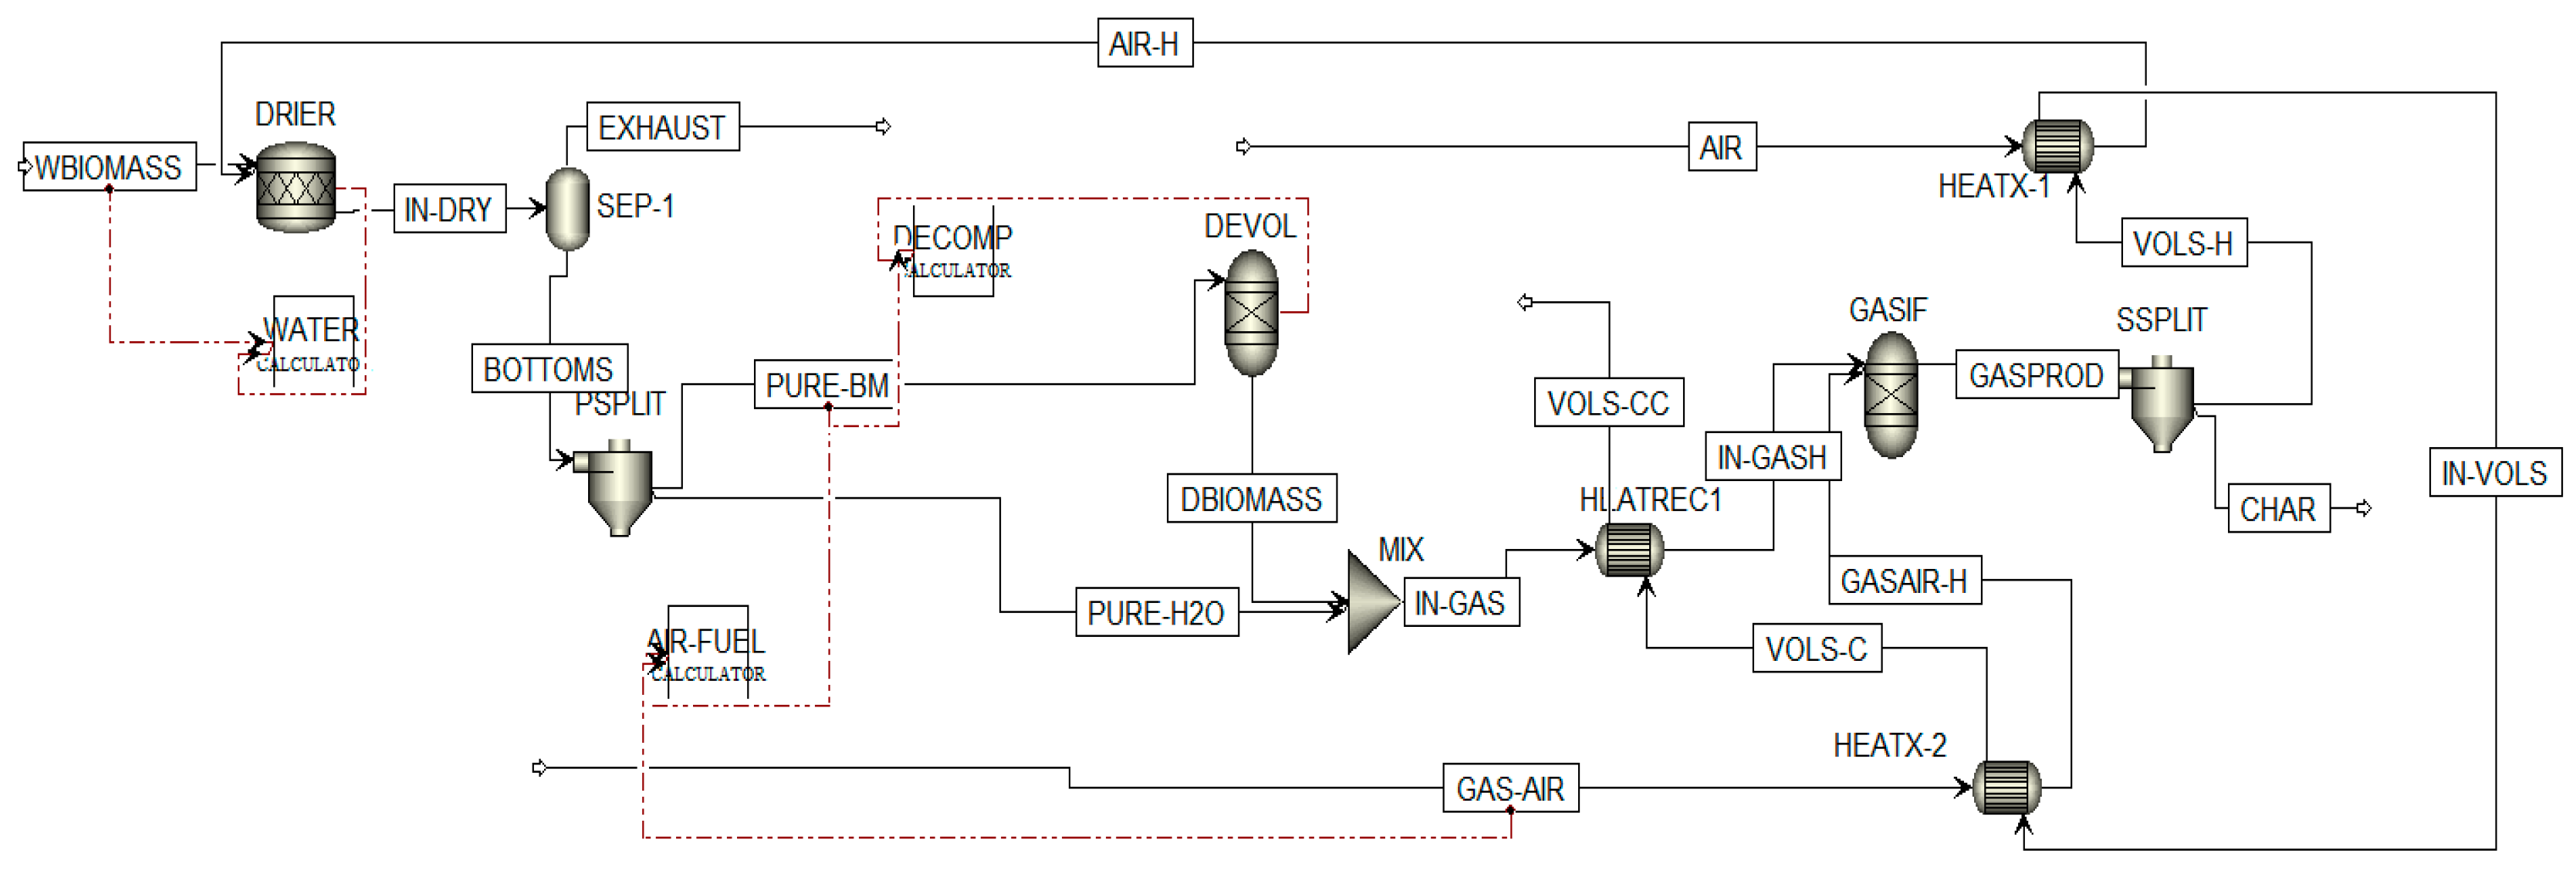
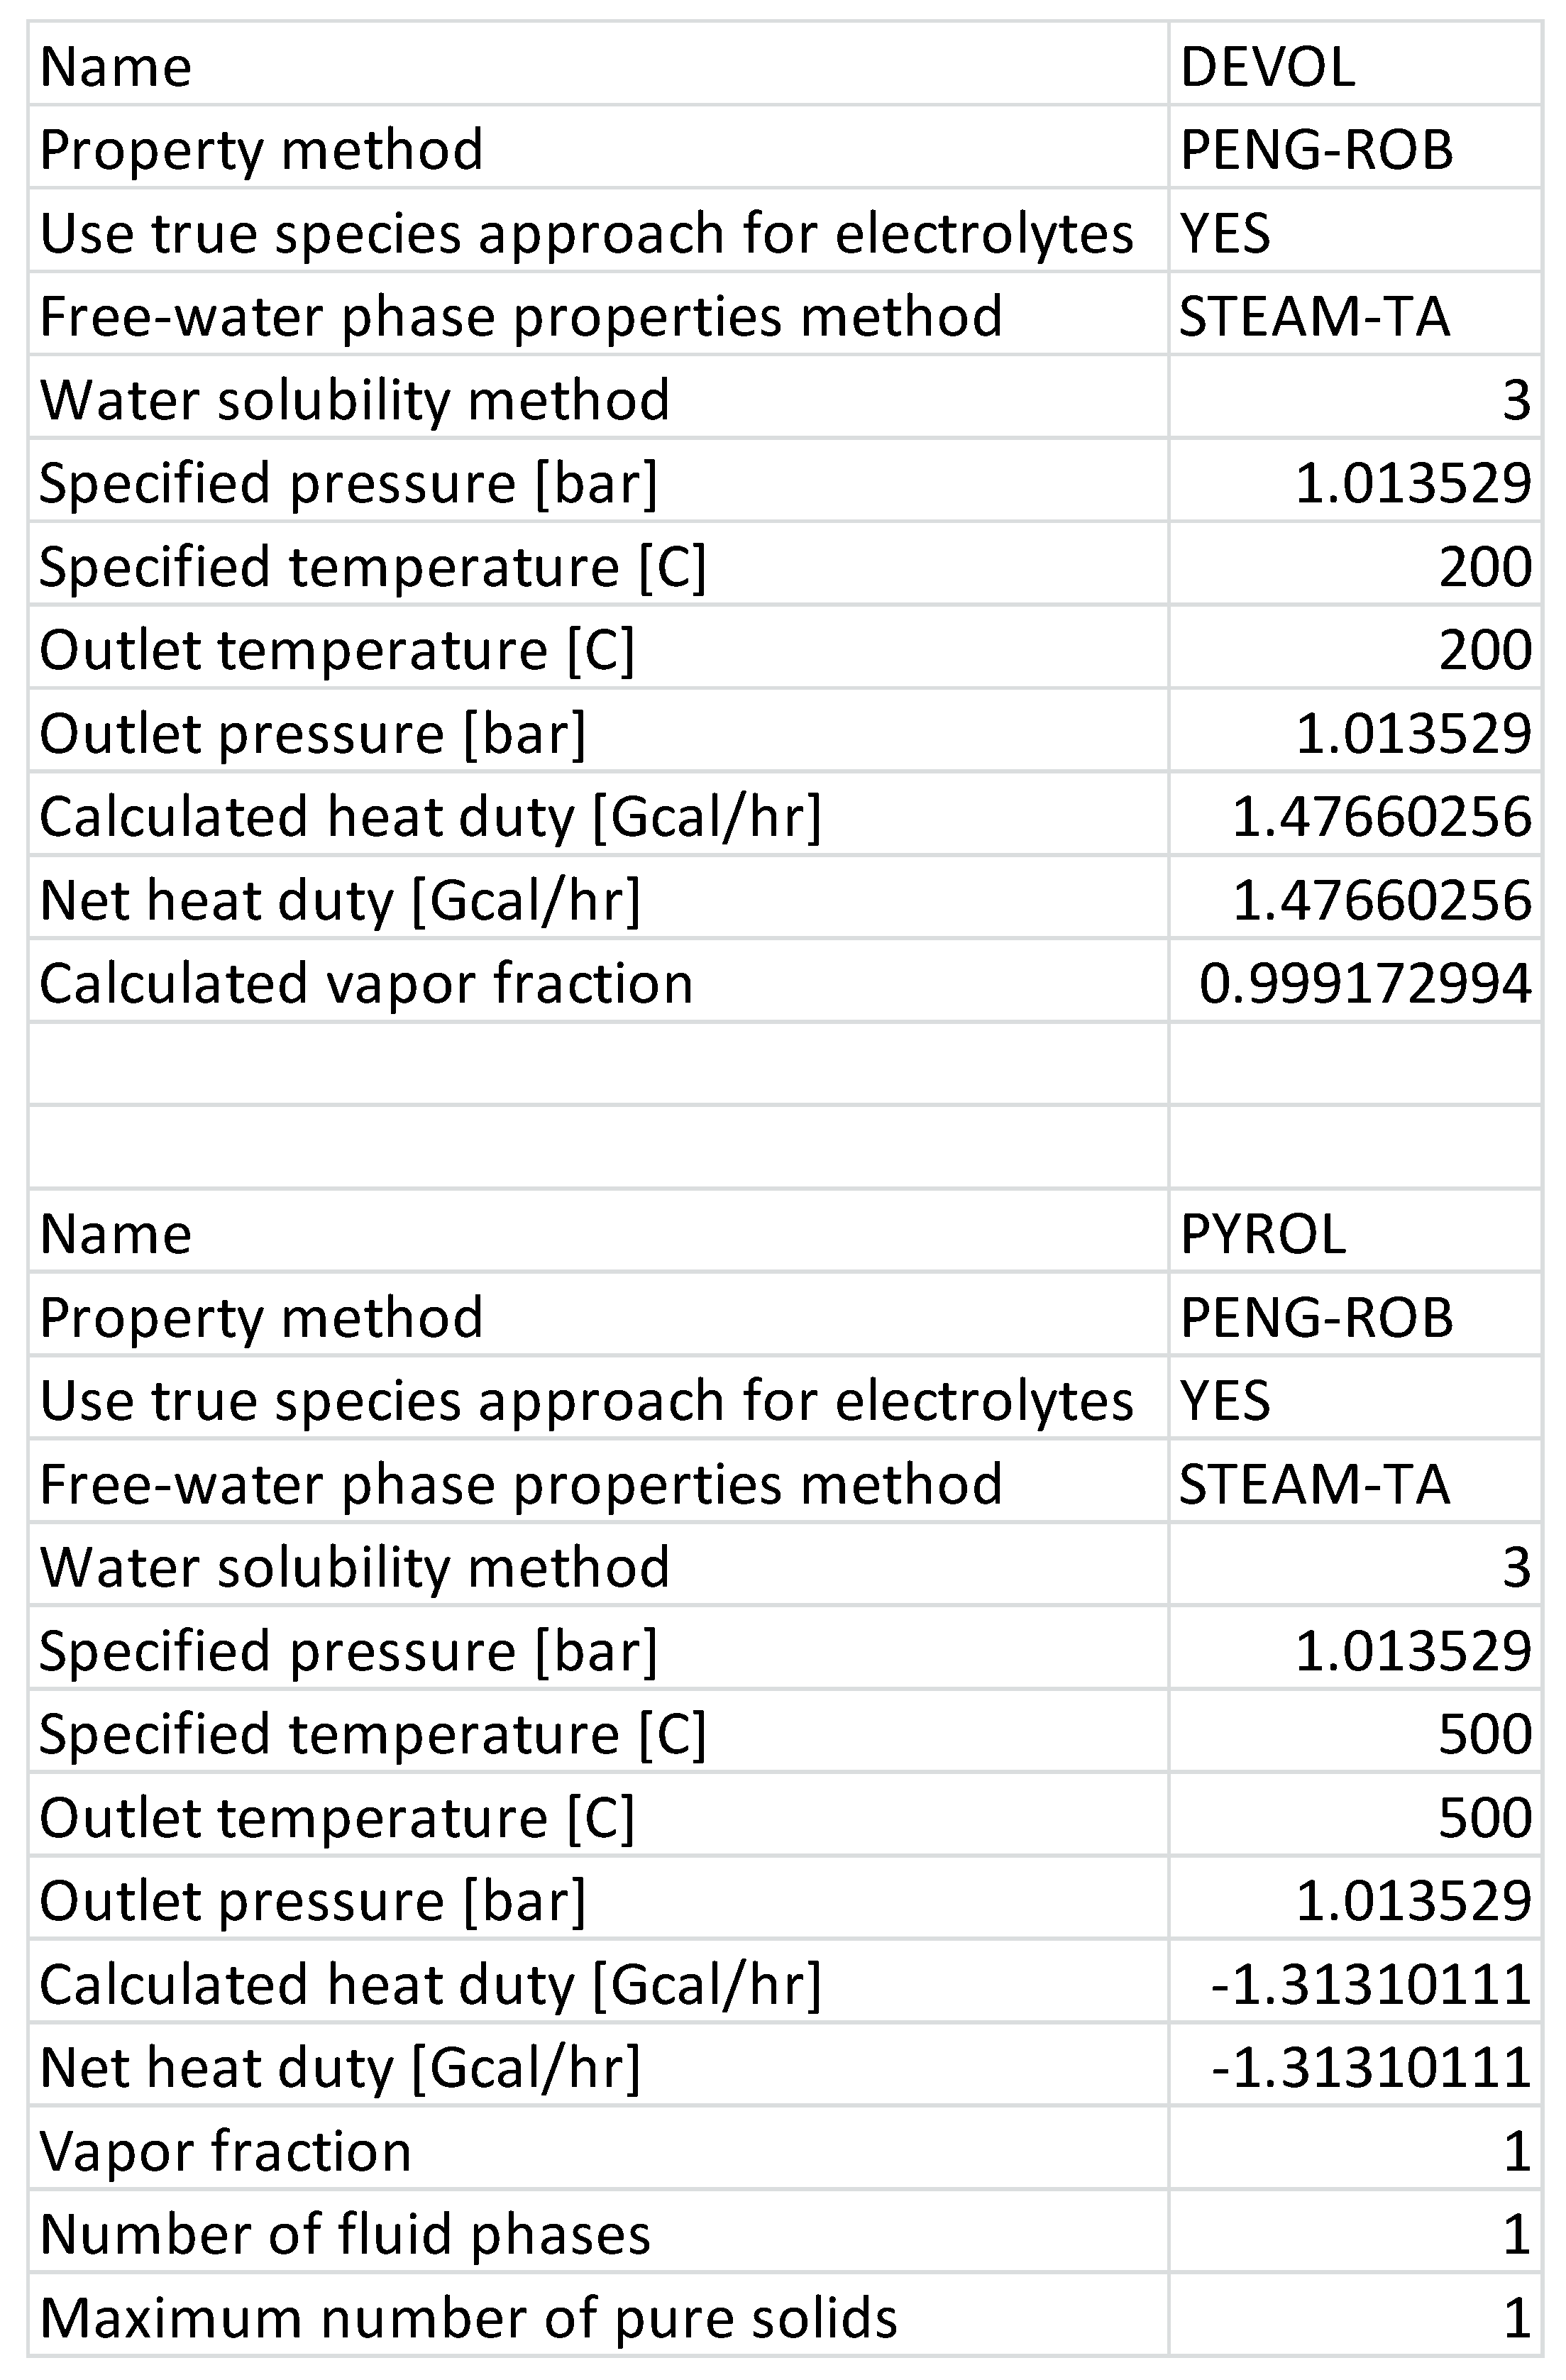
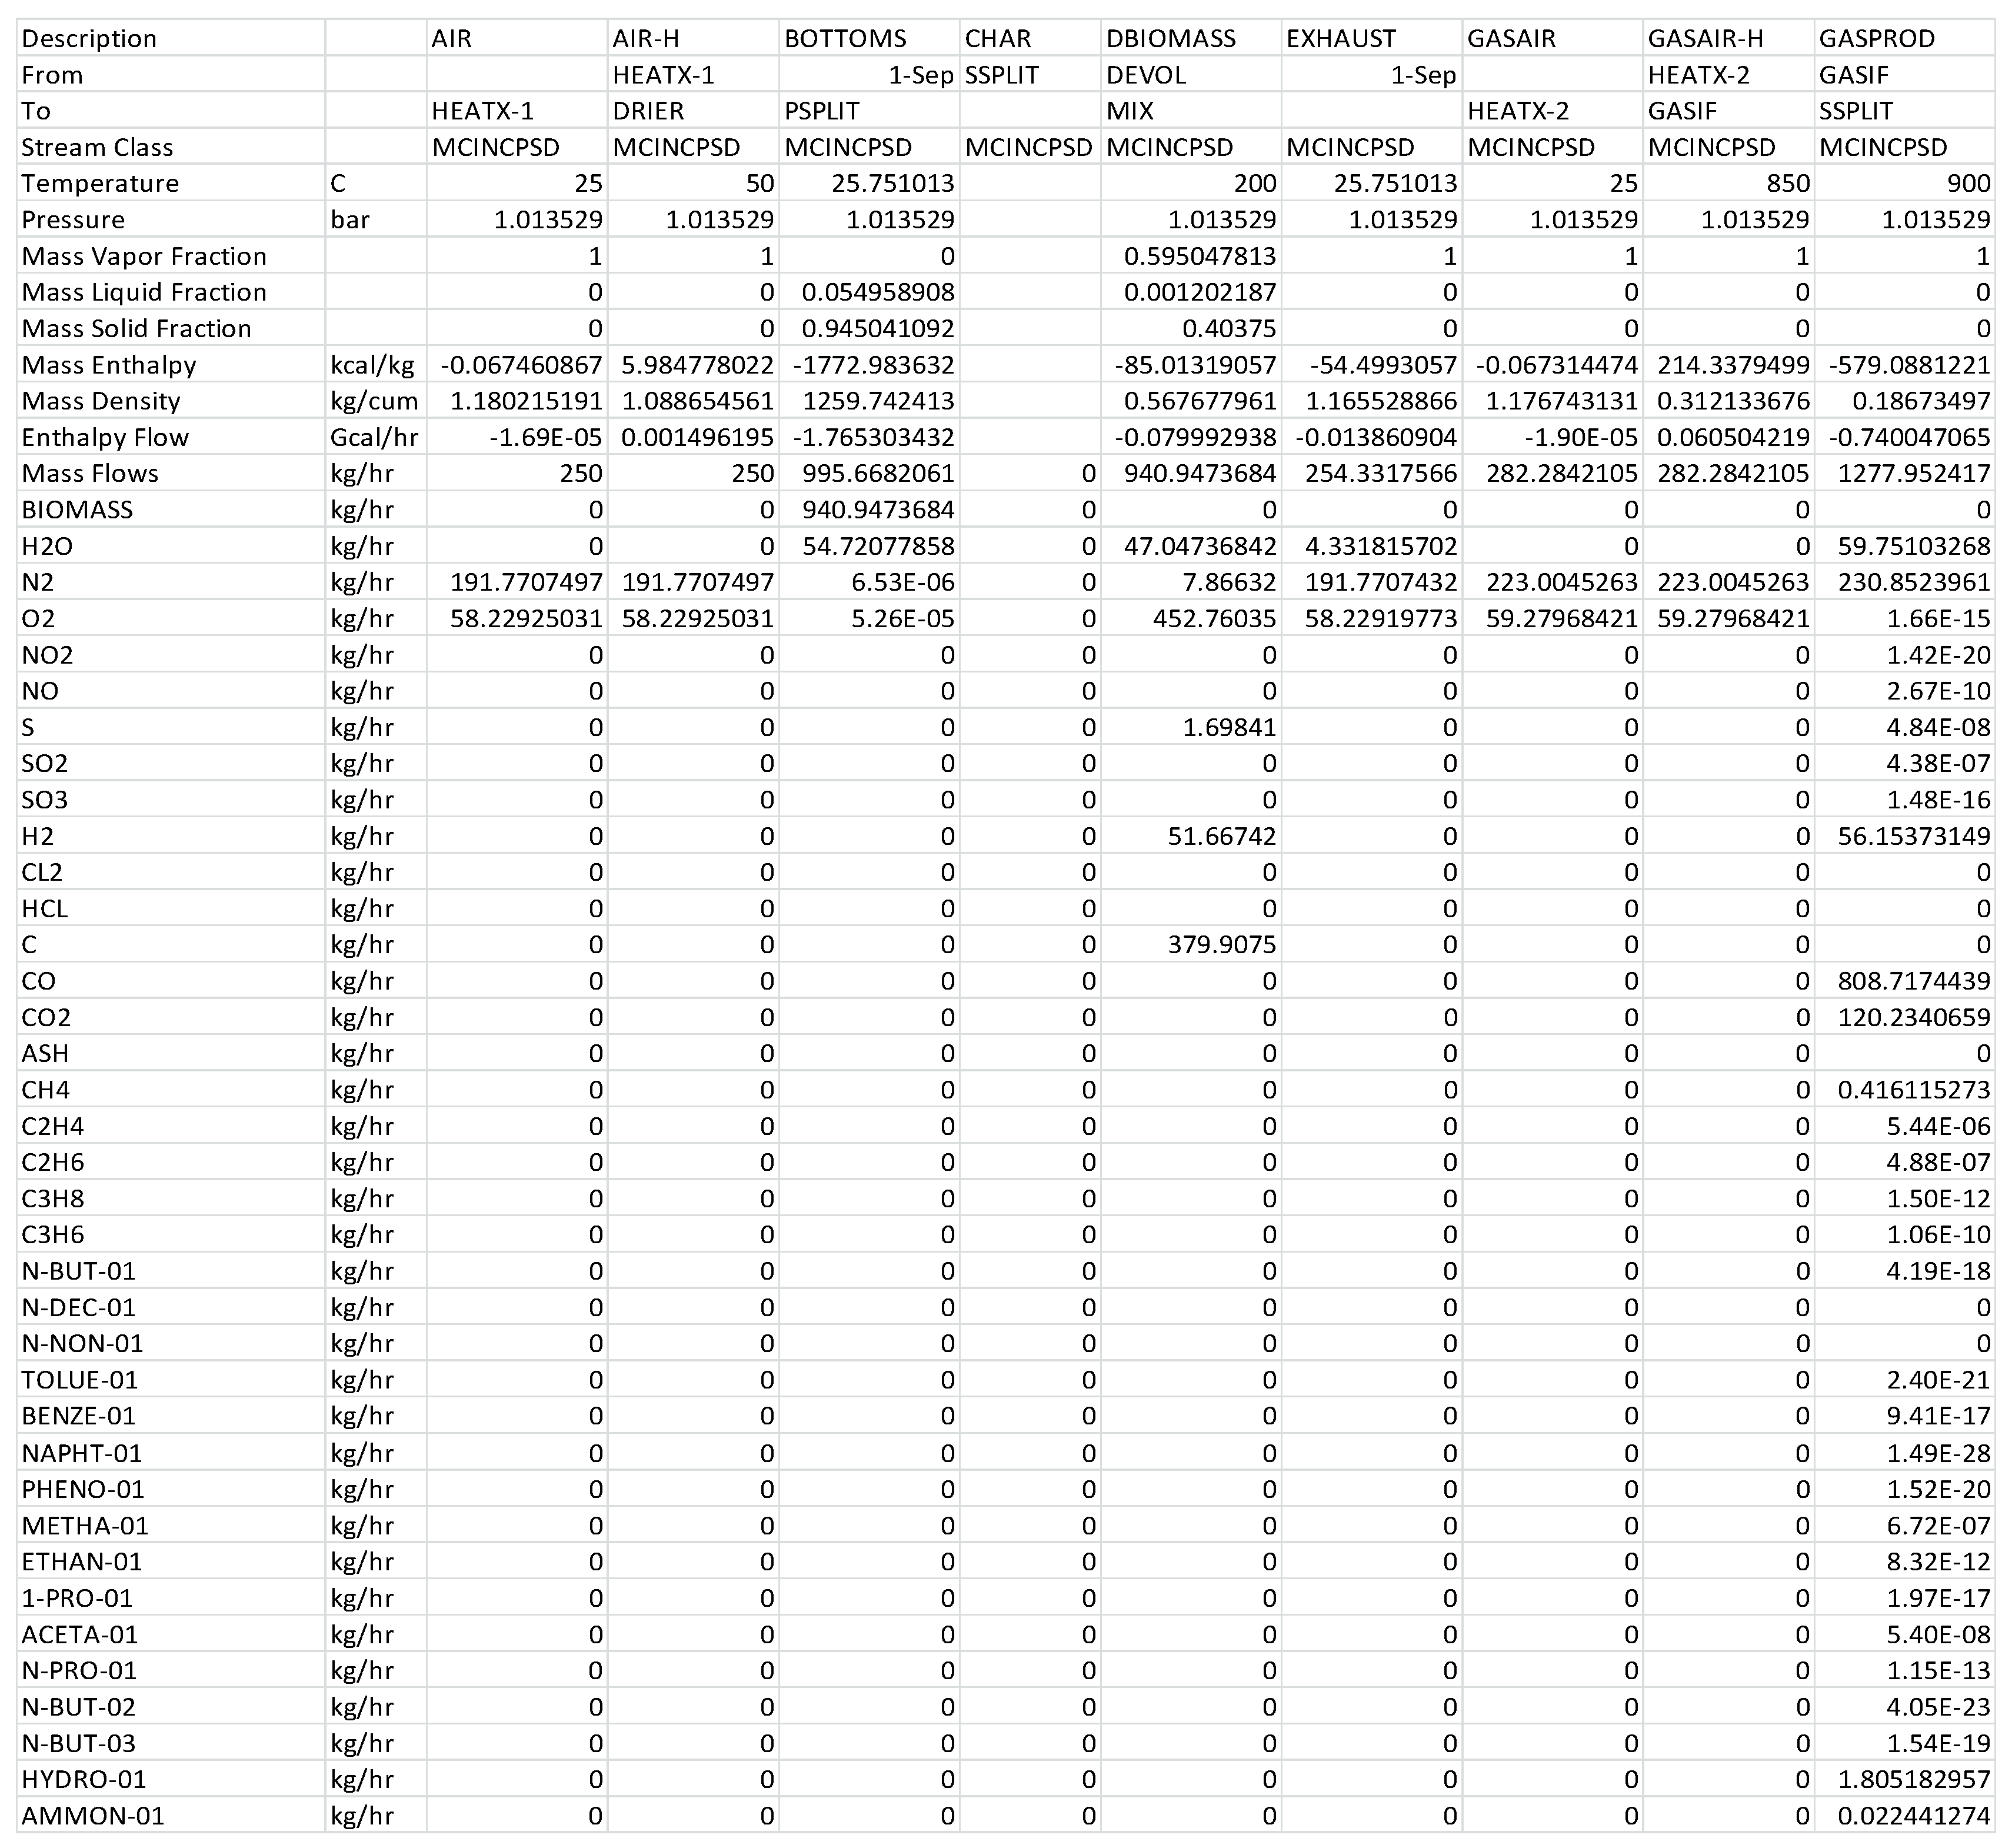
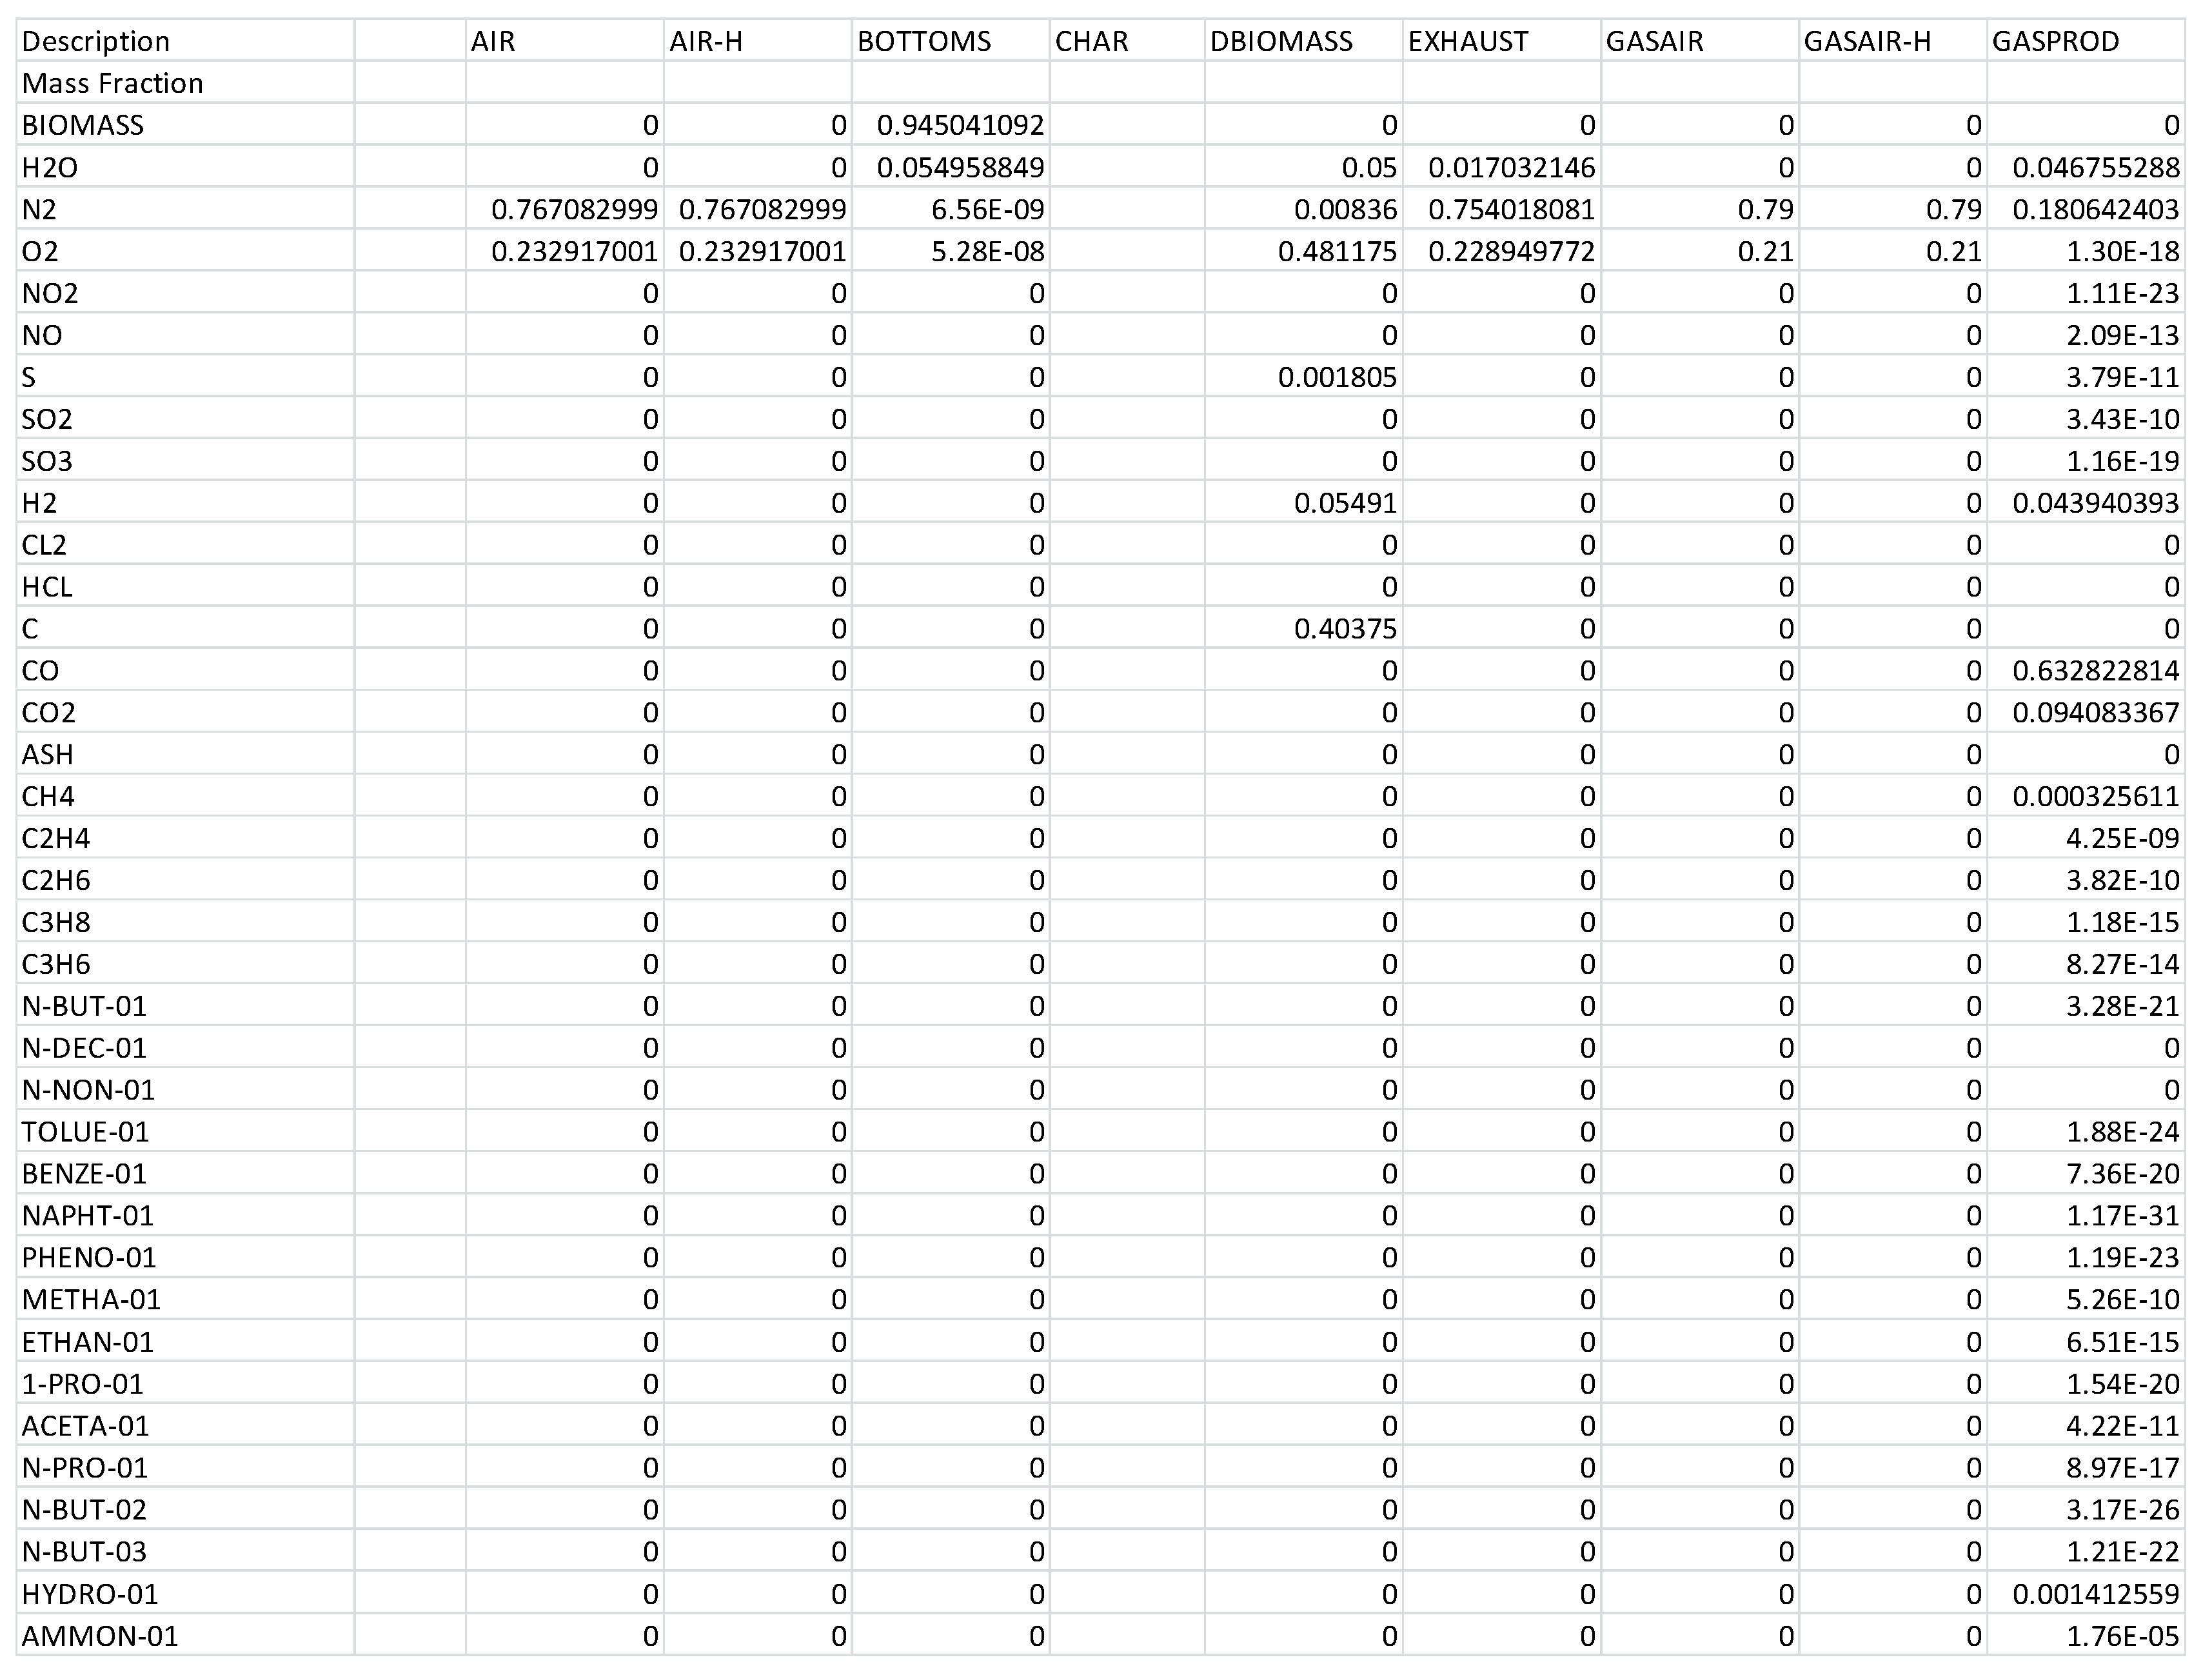
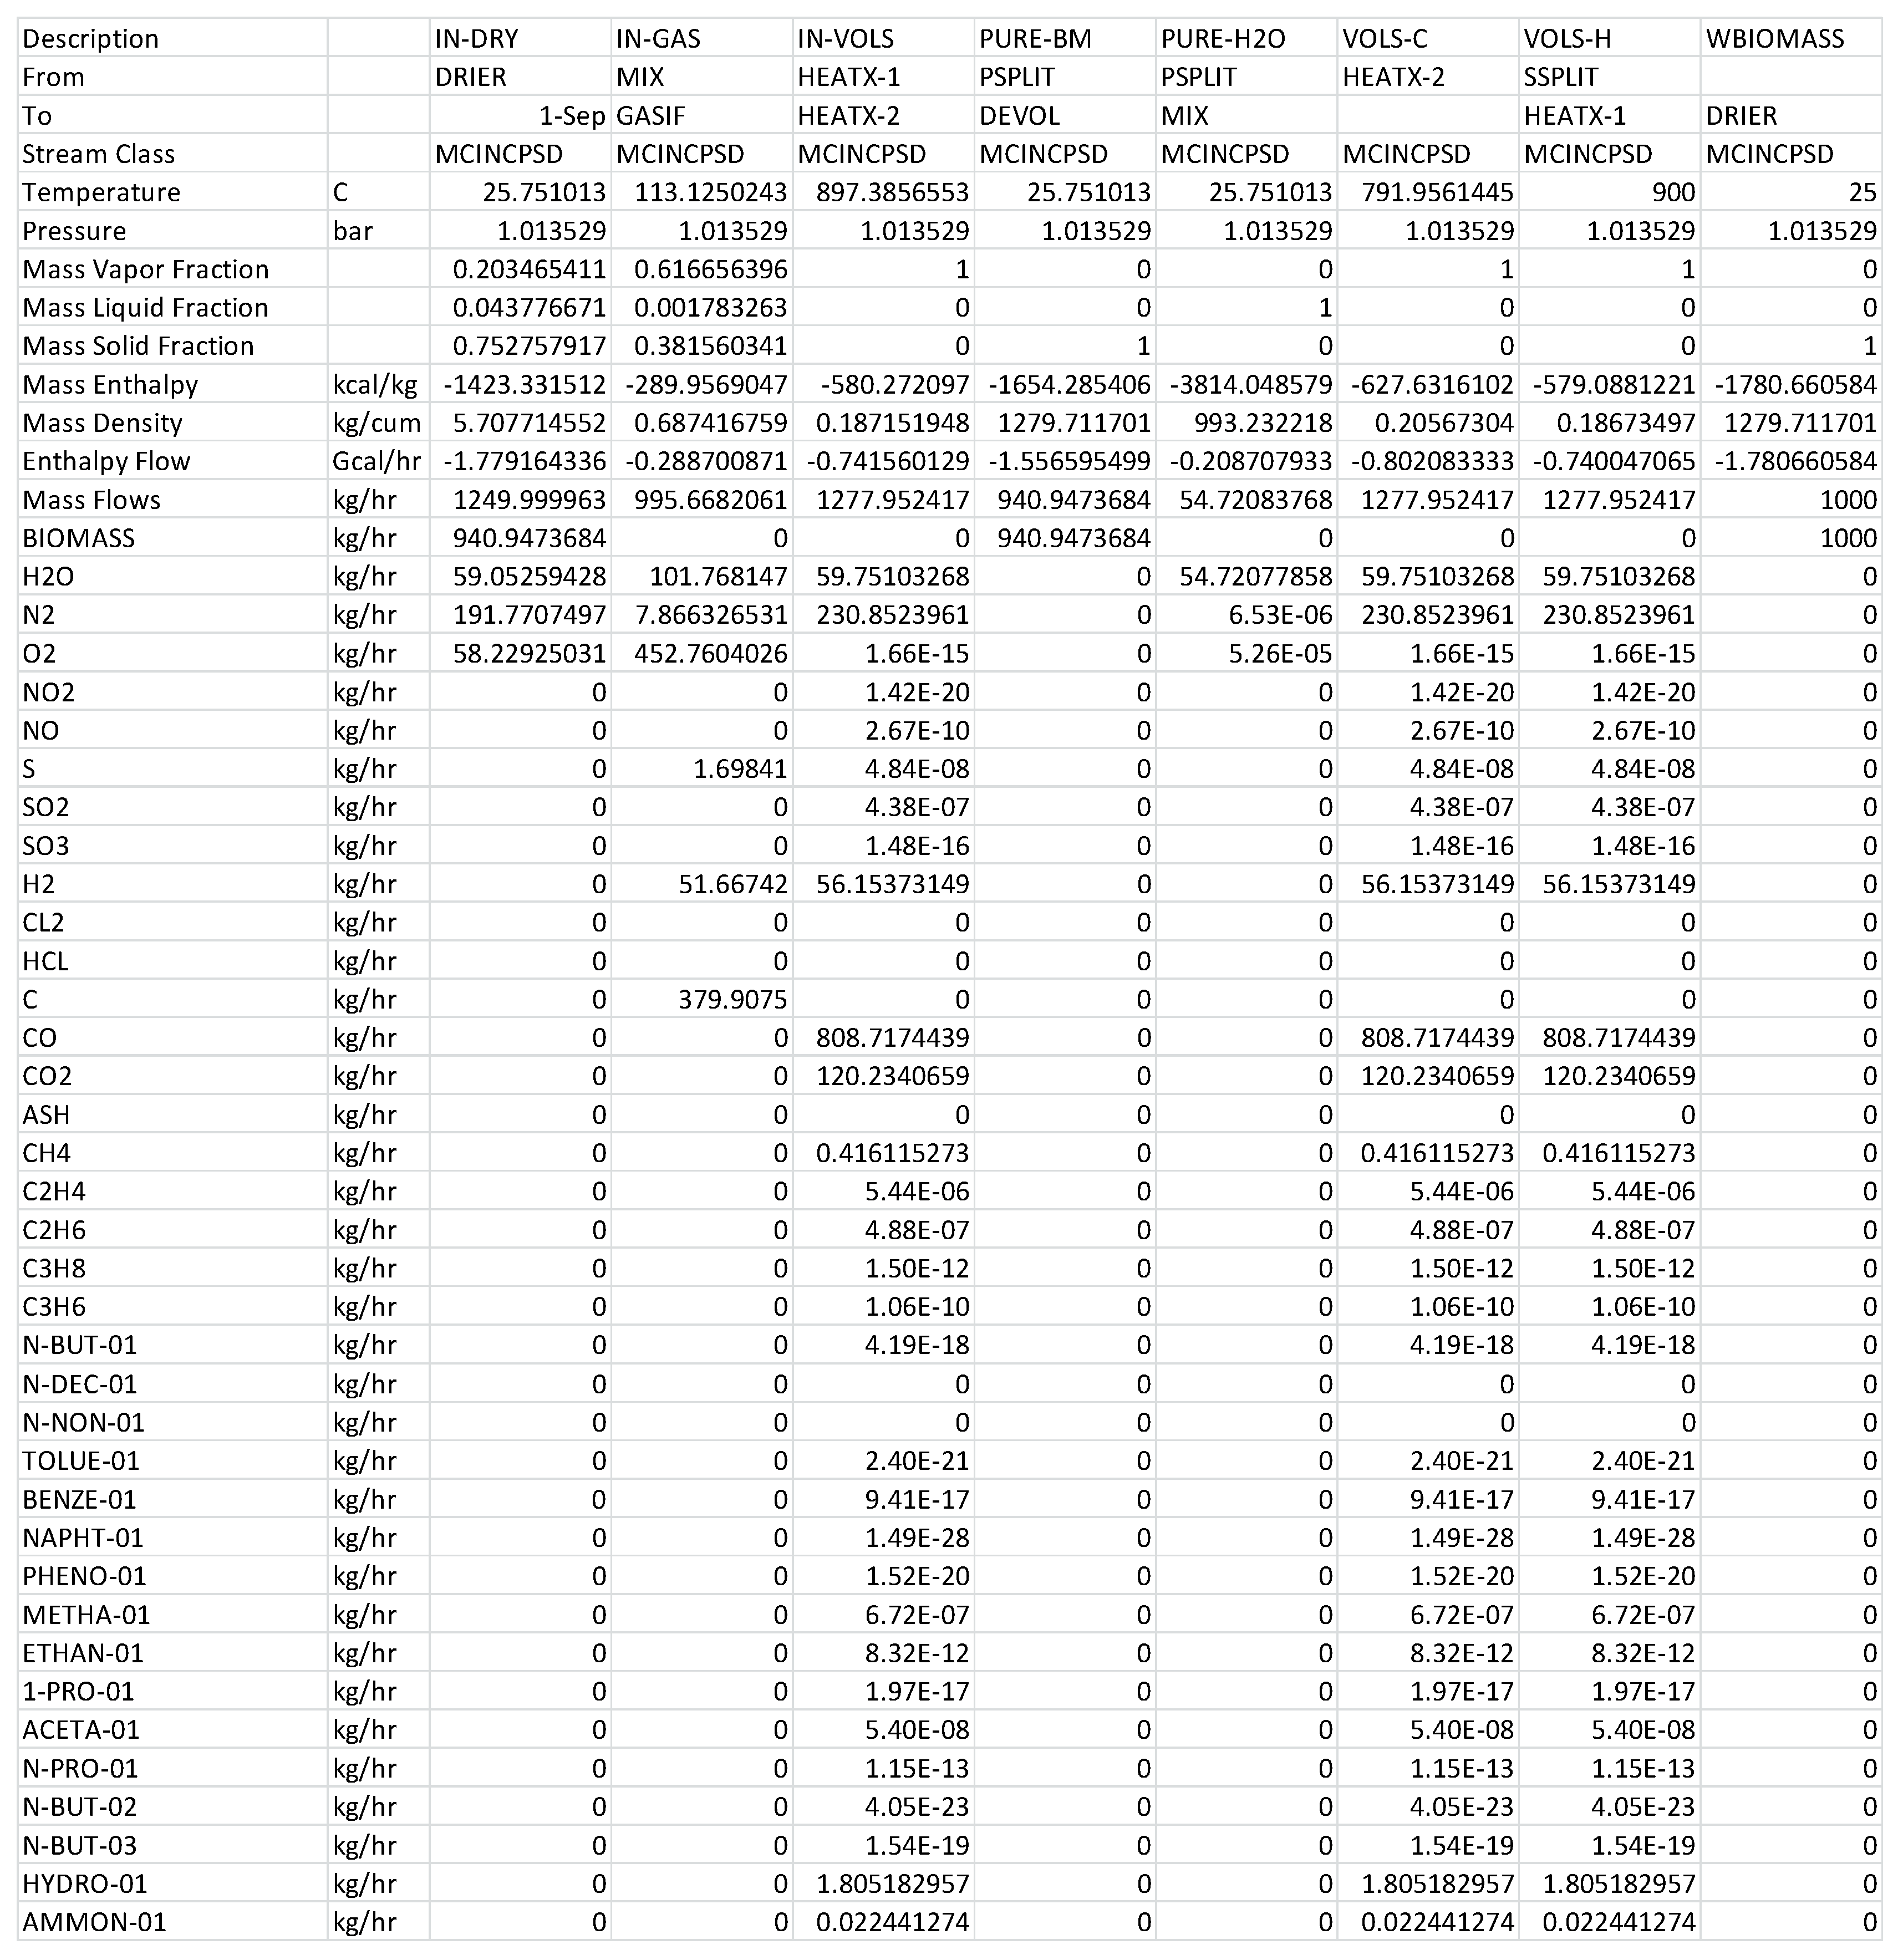
2.3. Gasification Model
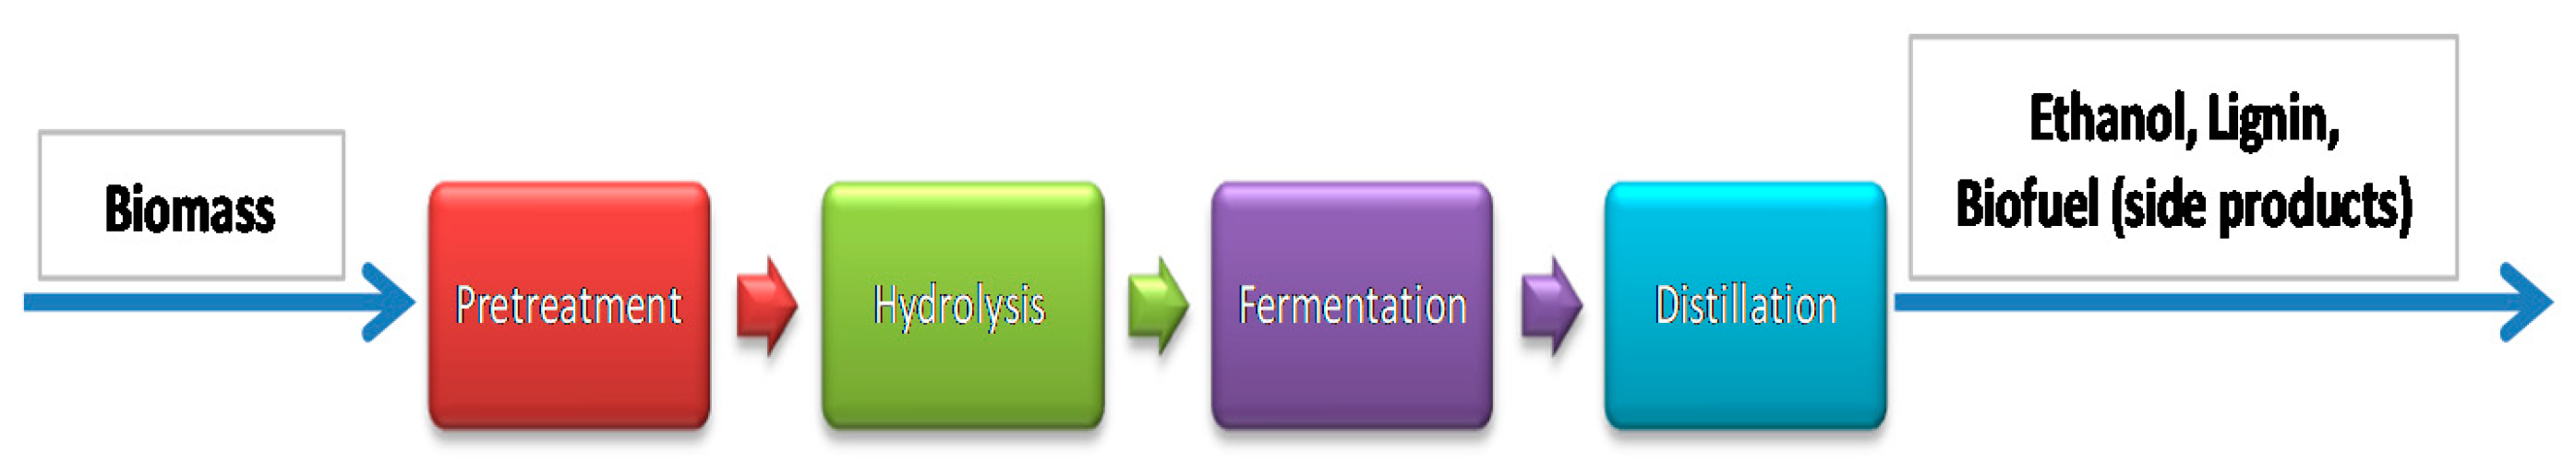
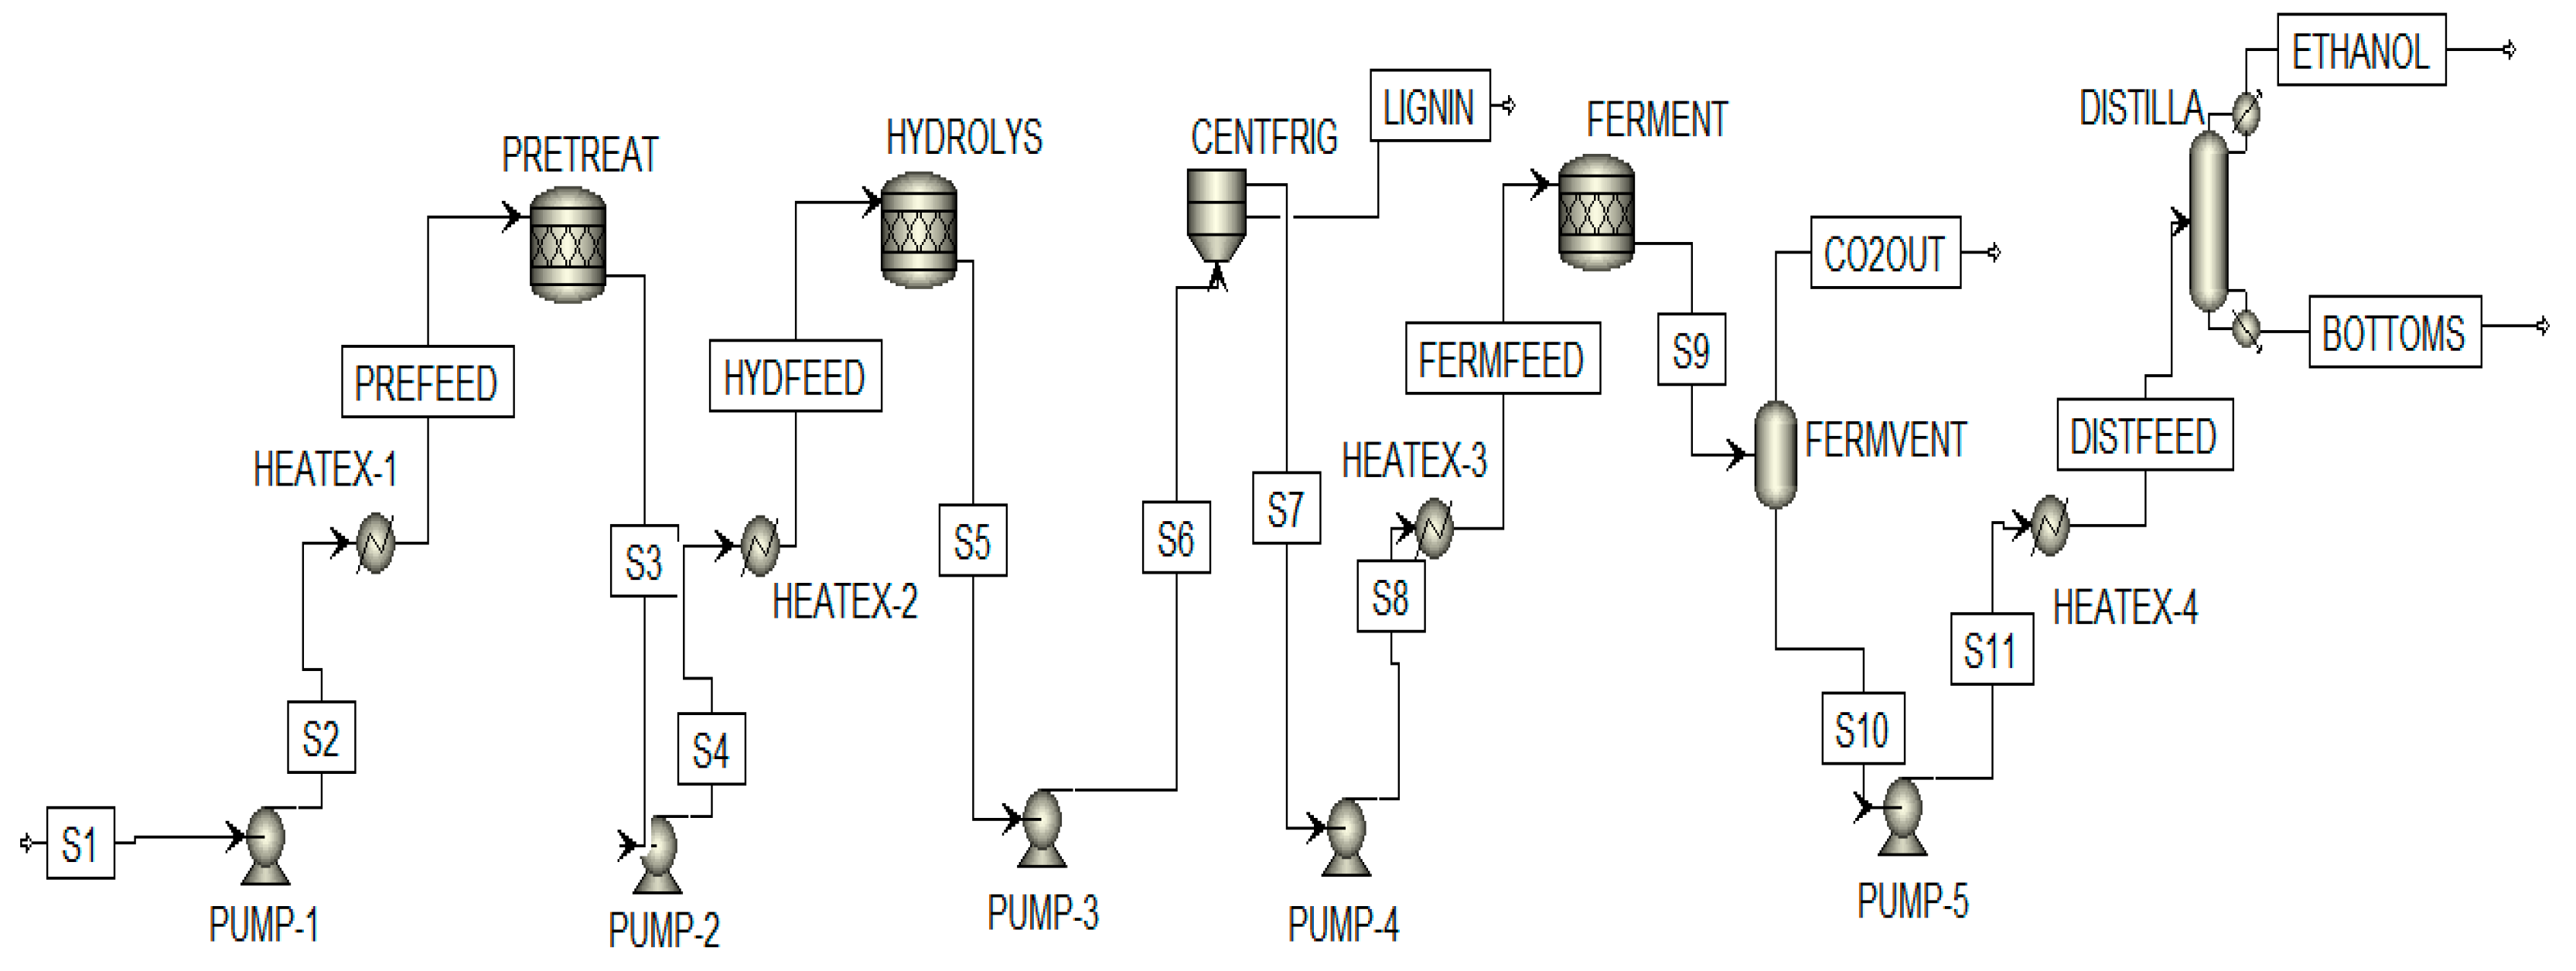
2.4. Fermentation Model
2.5. Calculator Blocks for Pyrolysis and Gasification Models
2.5.1. WATER Calculator
2.5.2. DECOMP Calculator
2.5.3. AIR-FUEL Calculator
3. Results
3.1. Pyrolysis Results
3.2. Gasification Results
3.3. Fermentation Results
3.4. Heat Balance Analysis
3.5. Simulation Economic Evaluation
4. Conclusions
Author Contributions
Funding
Conflicts of Interest
Appendix A

| FORTRAN Statements | |
|---|---|
| H2ODRY = 5.0 FCONV = (H2OIN − H2ODRY)/(100 − H2ODRY) | |
| Variable | Description |
| H2ODRY | Wt% of moisture in dry biomass. Value is set to 5% as it is expected that even after drying, biomass will retain some of its moisture content |
| H2OIN | Wt% of moisture in wet biomass |
| FCONV | Fractional conversion of moisture |
| FORTRAN Statements | |
|---|---|
| FACT = (100 − WATER)/100 H2O = (((WATER/100))) ASH = ((ULT(1)/100) * FACT) CARB = ((ULT(2)/100) * FACT) H2 = ((ULT(3)/100) * FACT) N2 = ((ULT(4)/100) * FACT) CL2 = ((ULT(5)/100) * FACT) SULF = ((ULT(6)/100) * FACT) O2 = ((ULT(7)/100) * FACT) | |
| Variable | Description |
| FACT | Factor to convert the ultimate analysis to a wet basis |
| ULT | Vector to store biomass ultimate analysis component data |
| WATER | Water content in dry biomass taken from proximate analysis |
| H2O | Calculated wt% of water exiting DEVOL |
| ASH | Calculated wt% of ash exiting DEVOL |
| CARB | Calculated wt% of carbon exiting DEVOL |
| H2 | Calculated wt% of hydrogen exiting DEVOL |
| N2 | Calculated wt% of nitrogen exiting DEVOL |
| CL2 | Calculated wt% of chlorine exiting DEVOL |
| SULF | Calculated wt% of sulfur exiting DEVOL |
| O2 | Calculated wt% of oxygen exiting DEVOL |
| FORTRAN Statements | |
|---|---|
| AIR = 0.3 * FUEL | |
| Variable | Description |
| AIR | Mass flow of air to be fed to the gasifier |
| FUEL | Dry biomass in stream PURE-BM |
Appendix B


Appendix C


Appendix D


References
- Tawalbeh, M.; Al-Ismaily, M.; Kruczek, B.; Tezel, F.H. Modeling the transport of CO2, N2, and their binary mixtures through highly permeable silicalite-1 membranes using Maxwell−Stefan equations. Chemosphere 2021, 263, 127935. [Google Scholar] [CrossRef] [PubMed]
- Alami, A.H.; Hawili, A.A.; Tawalbeh, M.; Hasan, R.; al Mahmoud, L.; Chibib, S.; Mahmood, A.; Aokal, K.; Rattanapanya, P. Materials and logistics for carbon dioxide capture, storage and utilization. Sci. Total Environ. 2020, 717, 137221. [Google Scholar] [CrossRef] [PubMed]
- Kazim, A.; Veziroglu, T.N. Utilization of solar-hydrogen energy in the UAE to maintain its share in the world energy market for the 21st century. Renew. Energy 2001, 24, 259–274. [Google Scholar] [CrossRef]
- Al-Othman, A.; Darwish, N.N.; Qasim, M.; Tawalbeh, M.; Darwish, N.A.; Hilal, N. Nuclear desalination: A state-of-the-art review. Desalination 2019, 457, 39–61. [Google Scholar] [CrossRef]
- Demirbaş, A. Mechanisms of liquefaction and pyrolysis reactions of biomass. Energy Convers. Manag. 2001, 24, 259–274. [Google Scholar] [CrossRef]
- Almomani, F.; Al Ketife, A.; Judd, S.; Shurair, M.; Bhosale, R.R.; Znad, H.; Tawalbeh, M. Impact of CO2 concentration and ambient conditions on microalgal growth and nutrient removal from wastewater by a photobioreactor. Sci. Total Environ. 2019, 662, 662–671. [Google Scholar] [CrossRef] [Green Version]
- Lee, J.; Yu, S.; Park, J.; Jo, H.; Park, J.; Ryu, C.; Jeong, Y.-G. Reduction of Unburned Carbon Release and NOx Emission from a Pulverized Wood Pellet Boiler Retrofitted for Fuel Switching from Coal. Energies 2020, 13, 5077. [Google Scholar] [CrossRef]
- Jain, N.; Bhatia, A.; Pathak, H. Emission of Air Pollutants from Crop Residue Burning in India. Aerosol Air Qual. Res. 2014, 14, 422–430. [Google Scholar] [CrossRef] [Green Version]
- Sharma, A.R.; Kharol, S.K.; Badarinath, K.V.S.; Singh, D. Impact of agriculture crop residue burning on atmospheric aerosol loading—A study over Punjab State, India. Ann. Geophys. 2010, 28, 367–379. [Google Scholar] [CrossRef] [Green Version]
- Fedenko, J.R.; Erickson, J.; Woodard, K.; Sollenberger, L.; Vendramini, J.; Gilbert, R.; Helsel, Z.; Peter, G. Biomass production and composition of perennial grasses grown for bioenergy in a subtropical climate across Florida, USA. Bioenergy Res. 2013, 6, 1082–1093. [Google Scholar] [CrossRef]
- Cardona, C.A.; Rincón, L.E.; Jaramillo, J.J. Integral analysis of feedstocks and technologies for biodiesel production in tropical and subtropical countries. In Proceedings of the World Renewable Energy Congress—Sweden, Linköping, Sweden, 8–13 May 2011; pp. 216–223. [Google Scholar]
- Almomani, F.; Baranova, E.A. Electro-oxidation of two reactive azo dyes on boron-doped diamond electrode. Water Sci. Technol. 2012, 66, 465–471. [Google Scholar] [CrossRef] [PubMed]
- Huang, J.J. Life cycle analysis of hybrid poplar trees for cellulosic ethanol. Bachelor’s Thesis, Massachusetts Institute of Technology, Cambridge, MA, USA, 2007. [Google Scholar]
- Hill, J. Environmental costs and benefits of transportation biofuel production from food-and lignocellulose-based energy crops: A review. In Sustainable Agriculture; Springer: Dordrecht, The Netherlands, 2009; pp. 125–139. [Google Scholar]
- Gurram, R.; Al-Shannag, M.; Knapp, S.; Das, T.; Singsaas, E.; Alkasrawi, M. Technical possibilities of bioethanol production from coffee pulp: A renewable feedstock. Clean Technol. Environ. Policy 2016, 18, 269–278. [Google Scholar] [CrossRef]
- Bani-Melhem, K.; Al-Qodah, Z.; Al-Shannag, M.; Qasaimeh, A.; Qtaishat, M.R.; Alkasrawi, M. On the performance of real grey water treatment using a submerged membrane bioreactor system. J. Memb. Sci. 2015, 476, 40–49. [Google Scholar] [CrossRef]
- Al-Qodah, Z.; Al-Shannag, M.; Amro, A.; Bob, M.; Bani-Melhem, K.; Alkasrawi, M. Impact of surface modification of green algal biomass by phosphorylation on the removal of copper (II) ions from water. Turk. J. Chem. 2017, 41, 190–208. [Google Scholar] [CrossRef]
- Pacheco, R.; Silva, C. Global Warming Potential of Biomass-to-Ethanol: Review and Sensitivity Analysis through a Case Study. Energies 2019, 12, 2535. [Google Scholar] [CrossRef] [Green Version]
- Naik, S.N.; Goud, V.V.; Rout, P.K.; Dalai, A.K. Production of first and second generation biofuels: A comprehensive review. Renew. Sustain. Energy Rev. 2010, 14, 578–597. [Google Scholar] [CrossRef]
- Al-Bsoul, A.; Al-Shannag, M.; Tawalbeh, M.; Al-Taani, A.A.; Lafi, W.K.; Al-Othman, A.; Alsheyab, M. Optimal conditions for olive mill wastewater treatment using ultrasound and advanced oxidation processes. Sci. Total Environ. 2020, 700, 134576. [Google Scholar] [CrossRef]
- Salameh, T.; Tawalbeh, M.; Al-Shannag, M.; Saidan, M.; Melhem, K.B.; Alkasrawi, M. Energy saving in the process of bioethanol production from renewable paper mill sludge. Energy 2020, 196, 117085. [Google Scholar] [CrossRef]
- Jambo, S.A.; Abdulla, R.; Mohd Azhar, S.H.; Marbawi, H.; Gansau, J.A.; Ravindra, P. A review on third generation bioethanol feedstock. Renew. Sustain. Energy Rev. 2016, 65, 756–769. [Google Scholar] [CrossRef]
- Tawalbeh, M.; Al-Othman, A.; Singh, K.; Douba, I.; Kabakebji, D.; Alkasrawi, M. Microbial desalination cells for water purification and power generation: A critical review. Energy 2020, 209, 118493. [Google Scholar] [CrossRef]
- Alkasrawi, M.; Rajangam, A.S.; Tawalbeh, M.; Kafiah, F.; Al-Othman, A.; Al-Asheh, S.; Sun, Q. Techno-economic analysis and a novel assessment technique of paper mill sludge conversion to bioethanol toward sustainable energy production. Int. J. Energy Res. 2020, 5667. [Google Scholar] [CrossRef]
- Tawalbeh, M.; Rajangam, A.S.; Salameh, T.; Al-Othman, A.; Alkasrawi, M. Characterization of paper mill sludge as a renewable feedstock for sustainable hydrogen and biofuels production. Int J. Hydrog. Energy 2020, in press. [Google Scholar] [CrossRef]
- Bensidhom, G.; Ben Hassen-Trabelsi, A.; Alper, K.; Sghairoun, M.; Zaafouri, K.; Trabelsi, I. Pyrolysis of Date palm waste in a fixed-bed reactor: Characterization of pyrolytic products. Bioresour. Technol. 2018, 247, 363–369. [Google Scholar] [CrossRef]
- Weiss, E.; Zohary, D.; Hopf, M. Current State of the Art. In Domestication of Plants in the Old World—The Origin and Spread of Domesticated Plants in South-west Asia, Europe, and the Mediterranean Basin, 3rd ed.; Oxford University Press: Oxford, UK, 2011; pp. 1–8. [Google Scholar]
- Tengberg, M. Beginnings and early history of date palm garden cultivation in the Middle East. J. Arid Environ. 2012, 86, 139–147. [Google Scholar] [CrossRef]
- Chao, C.T.; Krueger, R.R. The Date Palm (Phoenix dactylifera L.): Overview of Biology, Uses, and Cultivation. HortScience 2007, 42, 1077–1082. [Google Scholar] [CrossRef] [Green Version]
- Manickavasagan, A.; Essa, M.M.; Sukumar, E. Dates: Production, Processing, Food, and Medicinal Values; CRC Press: Boca Raton, FL, USA, 2012. [Google Scholar]
- Food and Agriculture Organization of the United Nations. Crop Statistics; FAO: Rome Italy, 2018. [Google Scholar]
- Food and Agriculture Organization of the United Nations. FAO Renews Support to Date Palm Production; FAO: Rome, Italy, 2018. [Google Scholar]
- Al-Sadi, A.M.; Al-Wehaibi, A.N.; Al-Shariqi, R.M.; Al-Hammadi, M.S.; Al-Hosni, I.A.; Al-Mahmooli, I.H.; Al-Ghaithi, A.G. “Population genetic analysis reveals diversity in Lasiodiplodia species infecting date palm, Citrus, and mango in Oman and the UAE. Plant Dis. 2013, 1363–1369. [Google Scholar] [CrossRef] [PubMed] [Green Version]
- Al-Khayri, J.M.; Naik, P.M.; Jain, S.M.; Johnson, D.V. Advances in Date Palm (Phoenix dactylifera L.) Breeding. In Advances in Plant Breeding Strategies: Fruits; Springer International Publishing: Cham, Switzerland, 2018; pp. 727–771. [Google Scholar]
- Al-Muaini, A.; Green, S.; Dakheel, A.; Abdullah, A.-H.; Abdelwahid, W.; Dixon, S.; Kemp, P.; Clothier, B. Irrigation management with saline groundwater of a date palm cultivar in the hyper-arid United Arab Emirates. Agric. Water Manag. 2019, 211, 123–131. [Google Scholar] [CrossRef]
- El Hadrami, A.; Al-Khayri, J.M. Socioeconomic and Traditional Importance of Date Palm. Emir. J. Food Agric. 2013, 25, 371–385. [Google Scholar]
- Fatima, G.; Khan, I.A.; Buerkert, A. Socio-economic characterisation of date palm (Phoenix dactylifera L.) growers and date value chains in Pakistan. Springerplus 2016, 5, 1222. [Google Scholar] [CrossRef] [Green Version]
- Ibrahim, S.A.; Ayad, A.A.; Williams, L.L.; Ayivi, R.D.; Gyawali, R.; Krastanov, A.; Aljaloud, S.O. Date fruit: A review of the chemical and nutritional compounds, functional effects and food application in nutrition bars for athletes. Int. J. Food Sci. Technol. 2020, 14783. [Google Scholar] [CrossRef]
- Alkasrawi, M. Development of Simultaneous Saccharification and Fermentation for Production of Ethanol from Softwood. Ph.D. Thesis, Lund University, Lund, Sweden, 2004. [Google Scholar]
- Liu, C.-G.; Xiao, Y.; Xia, X.X.; Zhao, X.Q.; Peng, L.; Srinophakun, P.; Bai, F.W. Cellulosic ethanol production: Progress, challenges and strategies for solutions. Biotechnol. Adv. 2019, 37, 491–504. [Google Scholar] [CrossRef] [PubMed]
- Tahir, A.H.F.; Al-Obaidy, A.H.M.J.; Mohammad, F.H. Biochar from date palm waste, production, characteristics and use in the treatment of pollutants: A Review. In Proceedings of the 4th International Conference on Buildings, Construction and Environmental Engineering, Istanbul, Turkey, 7–9 October 2019; IOP Publishing Ltd.: Bristol, UK, 2020. [Google Scholar]
- Ranzi, E.; Cuoci, A.; Faravelli, T.; Frassoldati, A.; Migliavacca, G.; Pierucci, S.; Sommariva, S. Chemical Kinetics of Biomass Pyrolysis. Energy Fuels 2008, 22, 4292–4300. [Google Scholar] [CrossRef]
- McKendry, P. Energy production from biomass (part 1): Overview of biomass. Bioresour. Technol. 2002, 83, 37–46. [Google Scholar] [CrossRef]
- Makkawi, Y.; Yu, X.; Ocone, R. Parametric analysis of biomass fast pyrolysis in a downer fluidized bed reactor. Renew. Energy 2019, 143, 1225–1234. [Google Scholar] [CrossRef]
- Makkawi, Y.; El Sayed, Y.; Salih, M.; Nancarrow, P.; Banks, S.; Bridgwater, T. Fast pyrolysis of date palm (Phoenix dactylifera) waste in a bubbling fluidized bed reactor. Renew. Energy 2019, 143, 719–730. [Google Scholar] [CrossRef]
- El May, Y.; Jeguirim, M.; Dorge, S.; Trouvé, G.; Said, R. Study on the thermal behavior of different date palm residues: Characterization and devolatilization kinetics under inert and oxidative atmospheres. Energy 2012, 44, 702–709. [Google Scholar] [CrossRef]
- Yu, X.; Blanco, P.H.; Makkawi, Y.; Bridgwater, A.V. CFD and experimental studies on a circulating fluidised bed reactor for biomass gasification. Chem. Eng. Process. Process. Intensif. 2018, 130, 284–295. [Google Scholar] [CrossRef] [Green Version]
- Al Afif, R.; Wendland, M.; Amon, T.; Pfeifer, C. Supercritical carbon dioxide enhanced pre-treatment of cotton stalks for methane production. Energy 2020, 194, 116903. [Google Scholar] [CrossRef]
- Chen, X.; Lin, Q.; Rizwan, M.; Zhao, X.; Li, G. Steam explosion of crop straws improves the characteristics of biochar as a soil amendment. J. Integr. Agric. 2019, 18, 1486–1495. [Google Scholar] [CrossRef]
- Steinbach, D.; Wüst, D.; Zielonka, S.; Krümpel, J.; Munder, S.; Pagel, M.; Kruse, A. Steam Explosion Conditions Highly Influence the Biogas Yield of Rice Straw. Molecules 2019, 24, 3492. [Google Scholar] [CrossRef] [Green Version]
- Millati, R.; Wikandari, R.; Ariyanto, T.; Putri, R.U.; Taherzadeh, M.J. Pretreatment technologies for anaerobic digestion of lignocelluloses and toxic feedstocks. Bioresour. Technol. 2020, 304, 122998. [Google Scholar] [CrossRef]
- Schneider, W.D.H.; Fontana, R.C.; Baudel, H.M.; de Siqueira, F.G.; Rencoret, J.; Gutiérrez, A.; de Eugenio, L.I.; Prieto, A.; Martínez, M.J.; Martínez, Á.T.; et al. Degradation and detoxification of eucalyptus wastes by on-site manufacturing fungal enzymes to enhance second-generation ethanol yield. Appl. Energy 2020, 262, 114493. [Google Scholar] [CrossRef]
- Ghorbannezhad, P.; Kool, F.; Rudi, H.; Ceylan, S. Sustainable production of value-added products from fast pyrolysis of palm shell residue in tandem micro-reactor and pilot plant. Renew. Energy 2020, 145, 663–670. [Google Scholar] [CrossRef]
- Samiran, N.A.; Jaafar, M.N.M.; Ng, J.-H.; Lam, S.S.; Chong, C.T. Progress in biomass gasification technique —With focus on Malaysian palm biomass for syngas production. Renew. Sustain. Energy Rev. 2016, 62, 1047–1062. [Google Scholar] [CrossRef]
- Khan, Z.; Yusup, S.; Ahmad, M.M.; Rashidi, N.A. Integrated catalytic adsorption (ICA) steam gasification system for enhanced hydrogen production using palm kernel shell. Int. J. Hydrogen Energy 2014, 39, 3286–3293. [Google Scholar] [CrossRef]
- Lahijani, P.; Zainal, Z.A. Gasification of palm empty fruit bunch in a bubbling fluidized bed: A performance and agglomeration study. Bioresour. Technol. 2011, 102, 2068–2076. [Google Scholar] [CrossRef] [PubMed]
- Atnaw, S.M.; Sulaiman, S.A.; Yusup, S. Syngas production from downdraft gasification of oil palm fronds. Energy 2013, 61, 491–501. [Google Scholar] [CrossRef]
- Shemfe, M.B.; Fidalgo, B.; Gu, S. Heat integration for bio-oil hydroprocessing coupled with aqueous phase steam reforming. Chem. Eng. Res. Des. 2016, 107, 73–80. [Google Scholar] [CrossRef] [Green Version]
- Tong, K.; Gleeson, M.J.; Rong, G.; You, F. Optimal design of advanced drop-in hydrocarbon biofuel supply chain integrating with existing petroleum refineries under uncertainty. Biomass BioEnergy 2014, 60, 108–120. [Google Scholar] [CrossRef]
- Marbe, Å.; Harvey, S. Opportunities for integration of biofuel gasifiers in natural-gas combined heat-and-power plants in district-heating systems. Appl. Energy 2006, 83, 723–748. [Google Scholar] [CrossRef]
- Salman, C.A.; Naqvi, M.; Thorin, E.; Yan, J. Impact of retrofitting existing combined heat and power plant with polygeneration of biomethane: A comparative techno-economic analysis of integrating different gasifiers. Energy Convers. Manag. 2017, 152, 250–265. [Google Scholar] [CrossRef]
- Andersson, V.; Heyne, S.; Harvey, S.; Berntsson, T. Integration of algae-based biofuel production with an oil refinery: Energy and carbon footprint assessment. Int. J. Energy Res. 2020, 44, 10860–10877. [Google Scholar] [CrossRef]
- van Dyk, S.; Su, J.; Mcmillan, J.D.; Saddler, J. Potential synergies of drop-in biofuel production with further co-processing at oil refineries. Biofuels Bioprod. Biorefin. 2019, 13, 760–775. [Google Scholar] [CrossRef] [Green Version]
- U.S. Department of Energy. Clean Cities Alternative Fuel Price Report; Allegheny Science and Technology: Bridgeport, WV, USA, 2020. Available online: https://afdc.energy.gov/files/u/publication/alternative_fuel_price_report_july_2020.pdf (accessed on 20 September 2020).
- Mathis, W.; Thornhill, J. Hydrogen’s Plunging Price Boosts Role as Climate Solution, Bloomberg. Available online: https://www.eea.europa.eu/themes/industry/industrial-pollution-in-europe/benefits-of-an-ambitious-implementation (accessed on 10 October 2020).
- García-Velásquez, C.A.; Cardona, C.A. Comparison of the biochemical and thermochemical routes for bioenergy production: A techno-economic (TEA), energetic and environmental assessment. Energy 2019, 172, 232–242. [Google Scholar] [CrossRef]
- Gonsalez, R.; Treasure, T.; Phillips, R.; Jameel, H.; Saloni, D. Economics of cellulosic ethanol production: Green liquor pretreatment for softwood and hardwood, greenfield and repurpose scenarios. BioResources 2011, 6, 2551–2567. [Google Scholar] [CrossRef]
- Olba-Zięty, E.; Gołaszewski, J.; Krzykowski, M.; Zięty, J.; van Klink, H. Economic and legal aspects of the direct processing of sugar beet to ethanol. IOP Conf. Ser. Earth Environ. Sci. 2019, 214, 012050. [Google Scholar] [CrossRef]
- Rocha-Meneses, L.; Raud, M.; Orupõld, K.; Kikas, T. Potential of bioethanol production waste for methane recovery. Energy 2019, 173, 133–139. [Google Scholar] [CrossRef]
- Ghofrani-Isfahani, P.; Baniamerian, H.; Tsapekos, P.; Alvarado-Morales, M.; Kasama, T.; Shahrokhi, M.; Vossoughi, M.; Angelidaki, I. Effect of metal oxide based TiO2 nanoparticles on anaerobic digestion process of lignocellulosic substrate. Energy 2020, 191, 116580. [Google Scholar] [CrossRef]
- Pangsang, N.; Rattanapan, U.; Thanapimmetha, A.; Srinopphakhun, P.; Liu, C.G.; Zhao, X.Q.; Bai, F.W.; Sakdaronnarong, C. Chemical-free fractionation of palm empty fruit bunch and palm fiber by hot-compressed water technique for ethanol production. Energy Rep. 2019, 5, 337–348. [Google Scholar] [CrossRef]
- Demırbas, A. The social, economic, and environmental importance of biofuels in the future. Energy Sources Part B Econ. Plan. Policy 2017, 12, 47–55. [Google Scholar] [CrossRef]
- Demirbas, A. Political, economic and environmental impacts of biofuels: A review. Appl. Energy 2009, 86, S108–S117. [Google Scholar] [CrossRef]
- Schneider, D.R.; Ragossnig, A.M. Biofuels from waste. Waste Manag. Res. 2013, 31, 339–340. [Google Scholar] [CrossRef] [PubMed] [Green Version]
- Beckman, J.; Hertel, T.; Taheripour, F.; Tyner, W. Structural change in the biofuels era. Eur. Rev. Agric. Econ. 2012, 39, 137–156. [Google Scholar] [CrossRef] [Green Version]


| Analysis Type | Component | wt% |
|---|---|---|
| Proximate Analysis | Moisture | 10.61 |
| Fixed Carbon | 14.63 | |
| Volatile Matter | 64.70 | |
| Ash | 10.06 | |
| Ultimate Analysis | Carbon | 42.5 |
| Hydrogen | 5.78 | |
| Nitrogen | 0.88 | |
| Chlorine | 0 | |
| Sulfur | 0.19 | |
| Oxygen | 50.65 | |
| Water | 0 | |
| Ash | 0 | |
| Sulfur Analysis | Pyritic | 0.05 |
| Sulfate | 0.1 | |
| Organic | 0.04 |
| Component | Mass Flow Rate (kg/h) | |
|---|---|---|
| Gas Phase | CHAR | |
| BIOMASS | 0 | 0 |
| WATER | 246 | 0 |
| NITROGEN | 8 | 0 |
| HYDROGEN | 18 | 0 |
| CARBON-GRAPHITE | 0 | 199 |
| CARBON-MONOXIDE | 34 | 0 |
| CARBON-DIOXIDE | 420 | 0 |
| ASH | 0 | 0 |
| METHANE | 70 | 0 |
| HYDROGEN-SULFIDE | 2 | 0 |
| AMMONIA | 0 | 0 |
| Total Flow Rate | 797 | 199 |
| Component | Mass Flow Rate (kg/h) |
|---|---|
| Gas Phase | |
| Biomass | 0 |
| Water | 60 |
| Nitrogen | 231 |
| Hydrogen | 56 |
| Carbon-Monoxide | 809 |
| Carbon-Dioxide | 120 |
| Ash | 0 |
| Hydrogen-Sulfide | 2 |
| Total flow rate | 1279 |
| Equipment | Net Duty (Watts) |
|---|---|
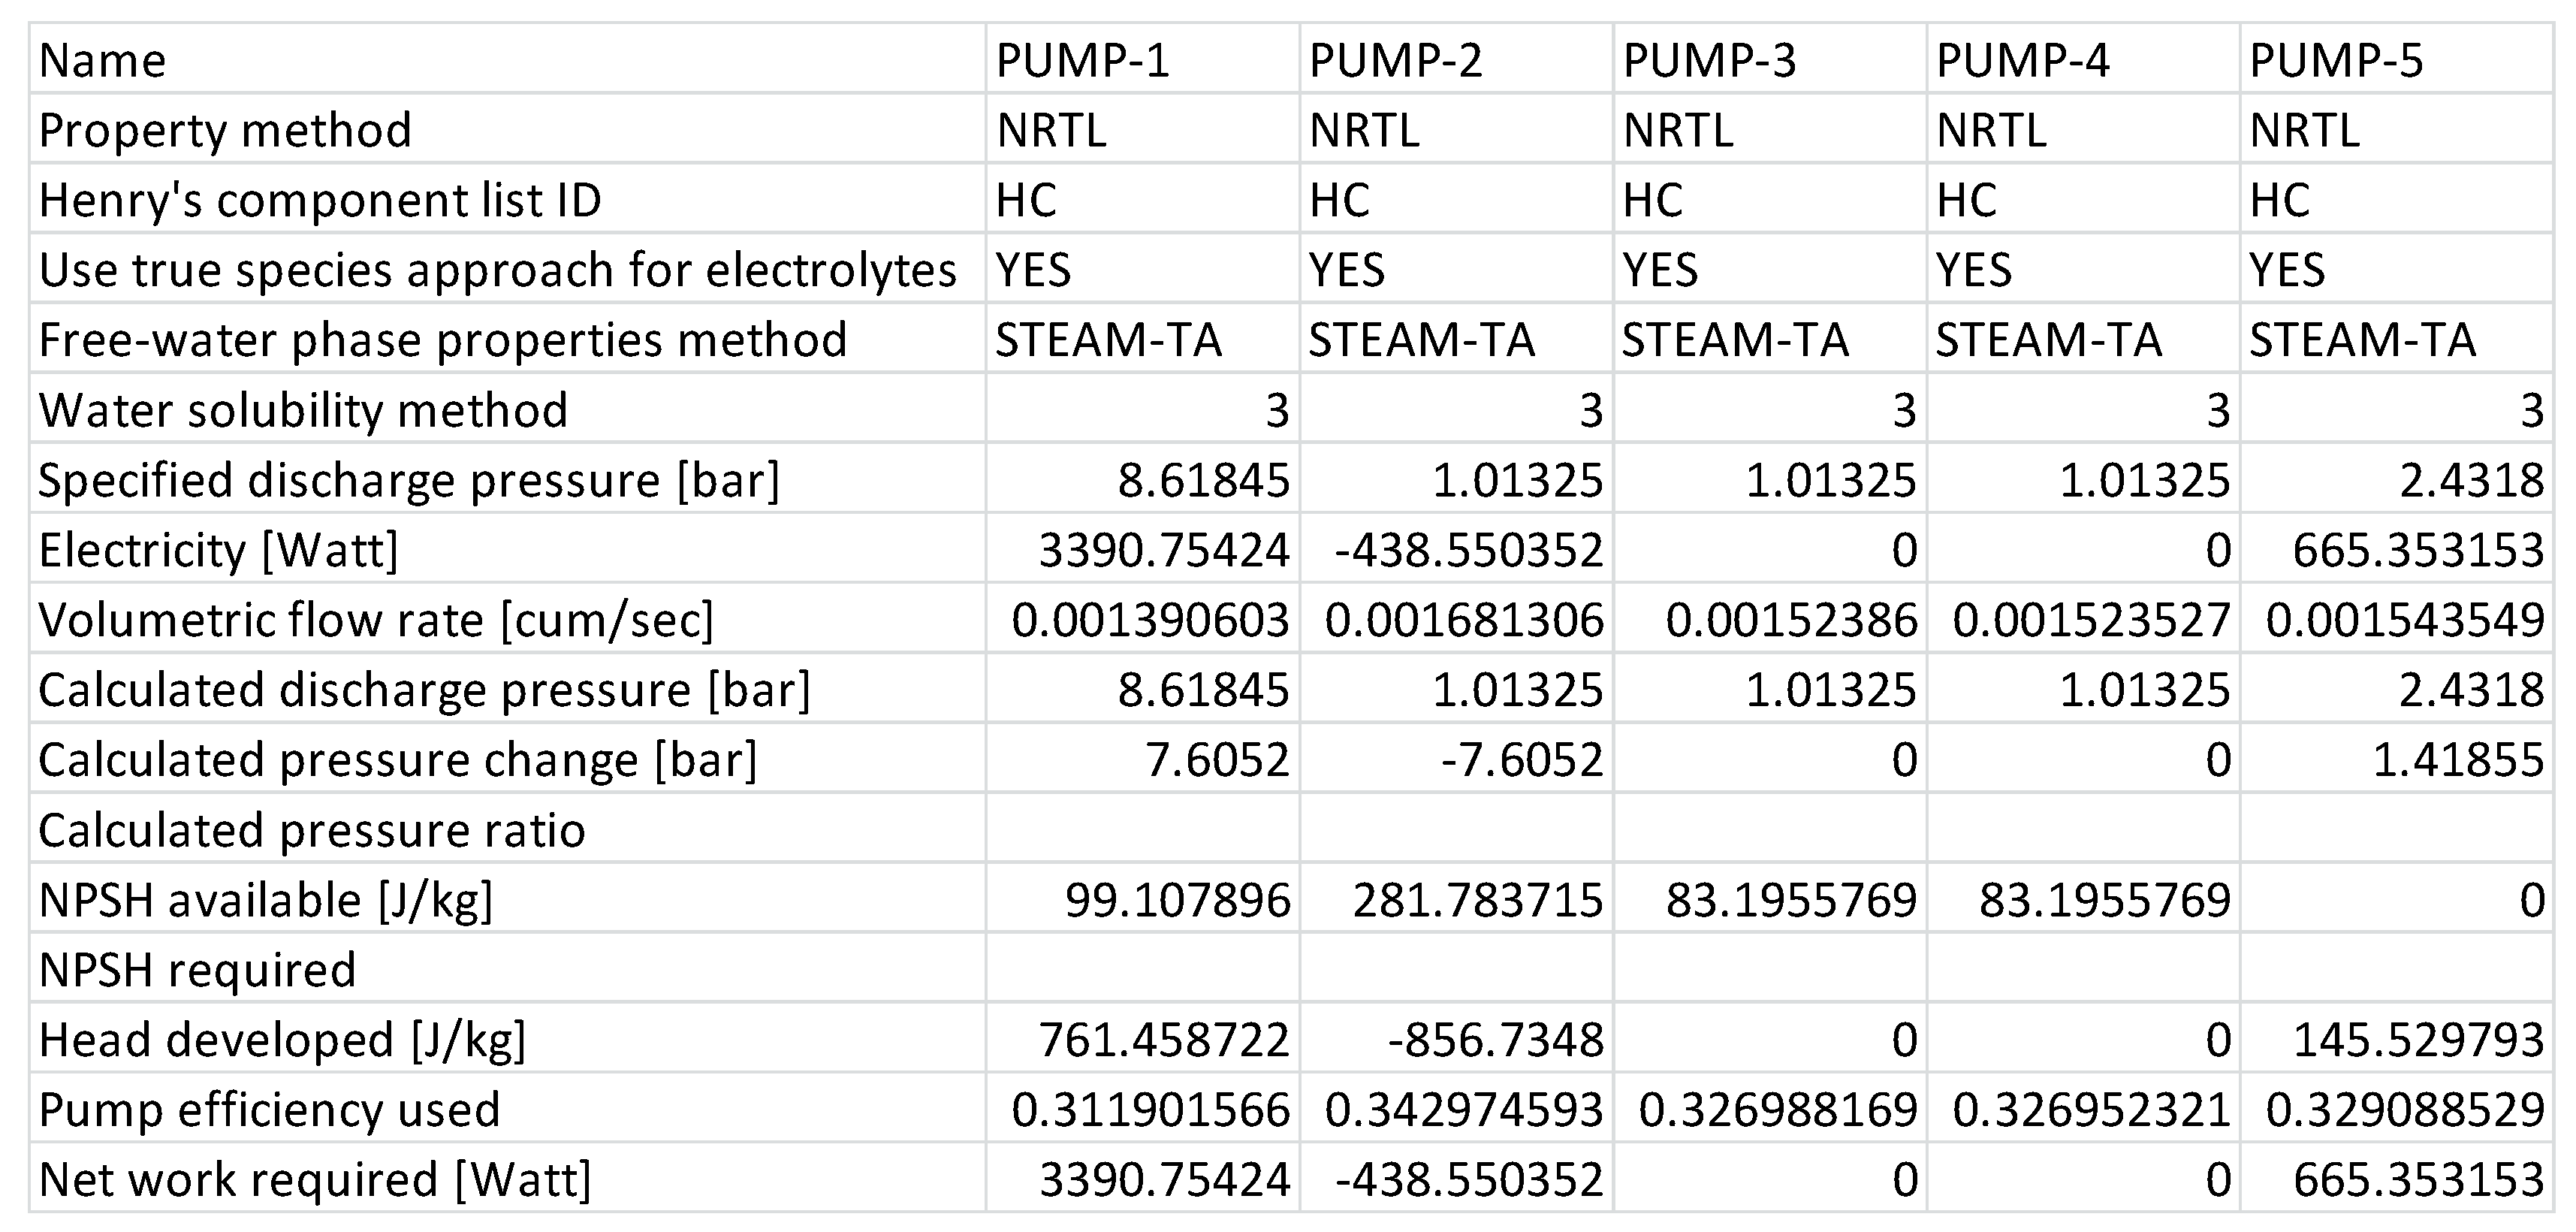
| Pumps | 3618 |
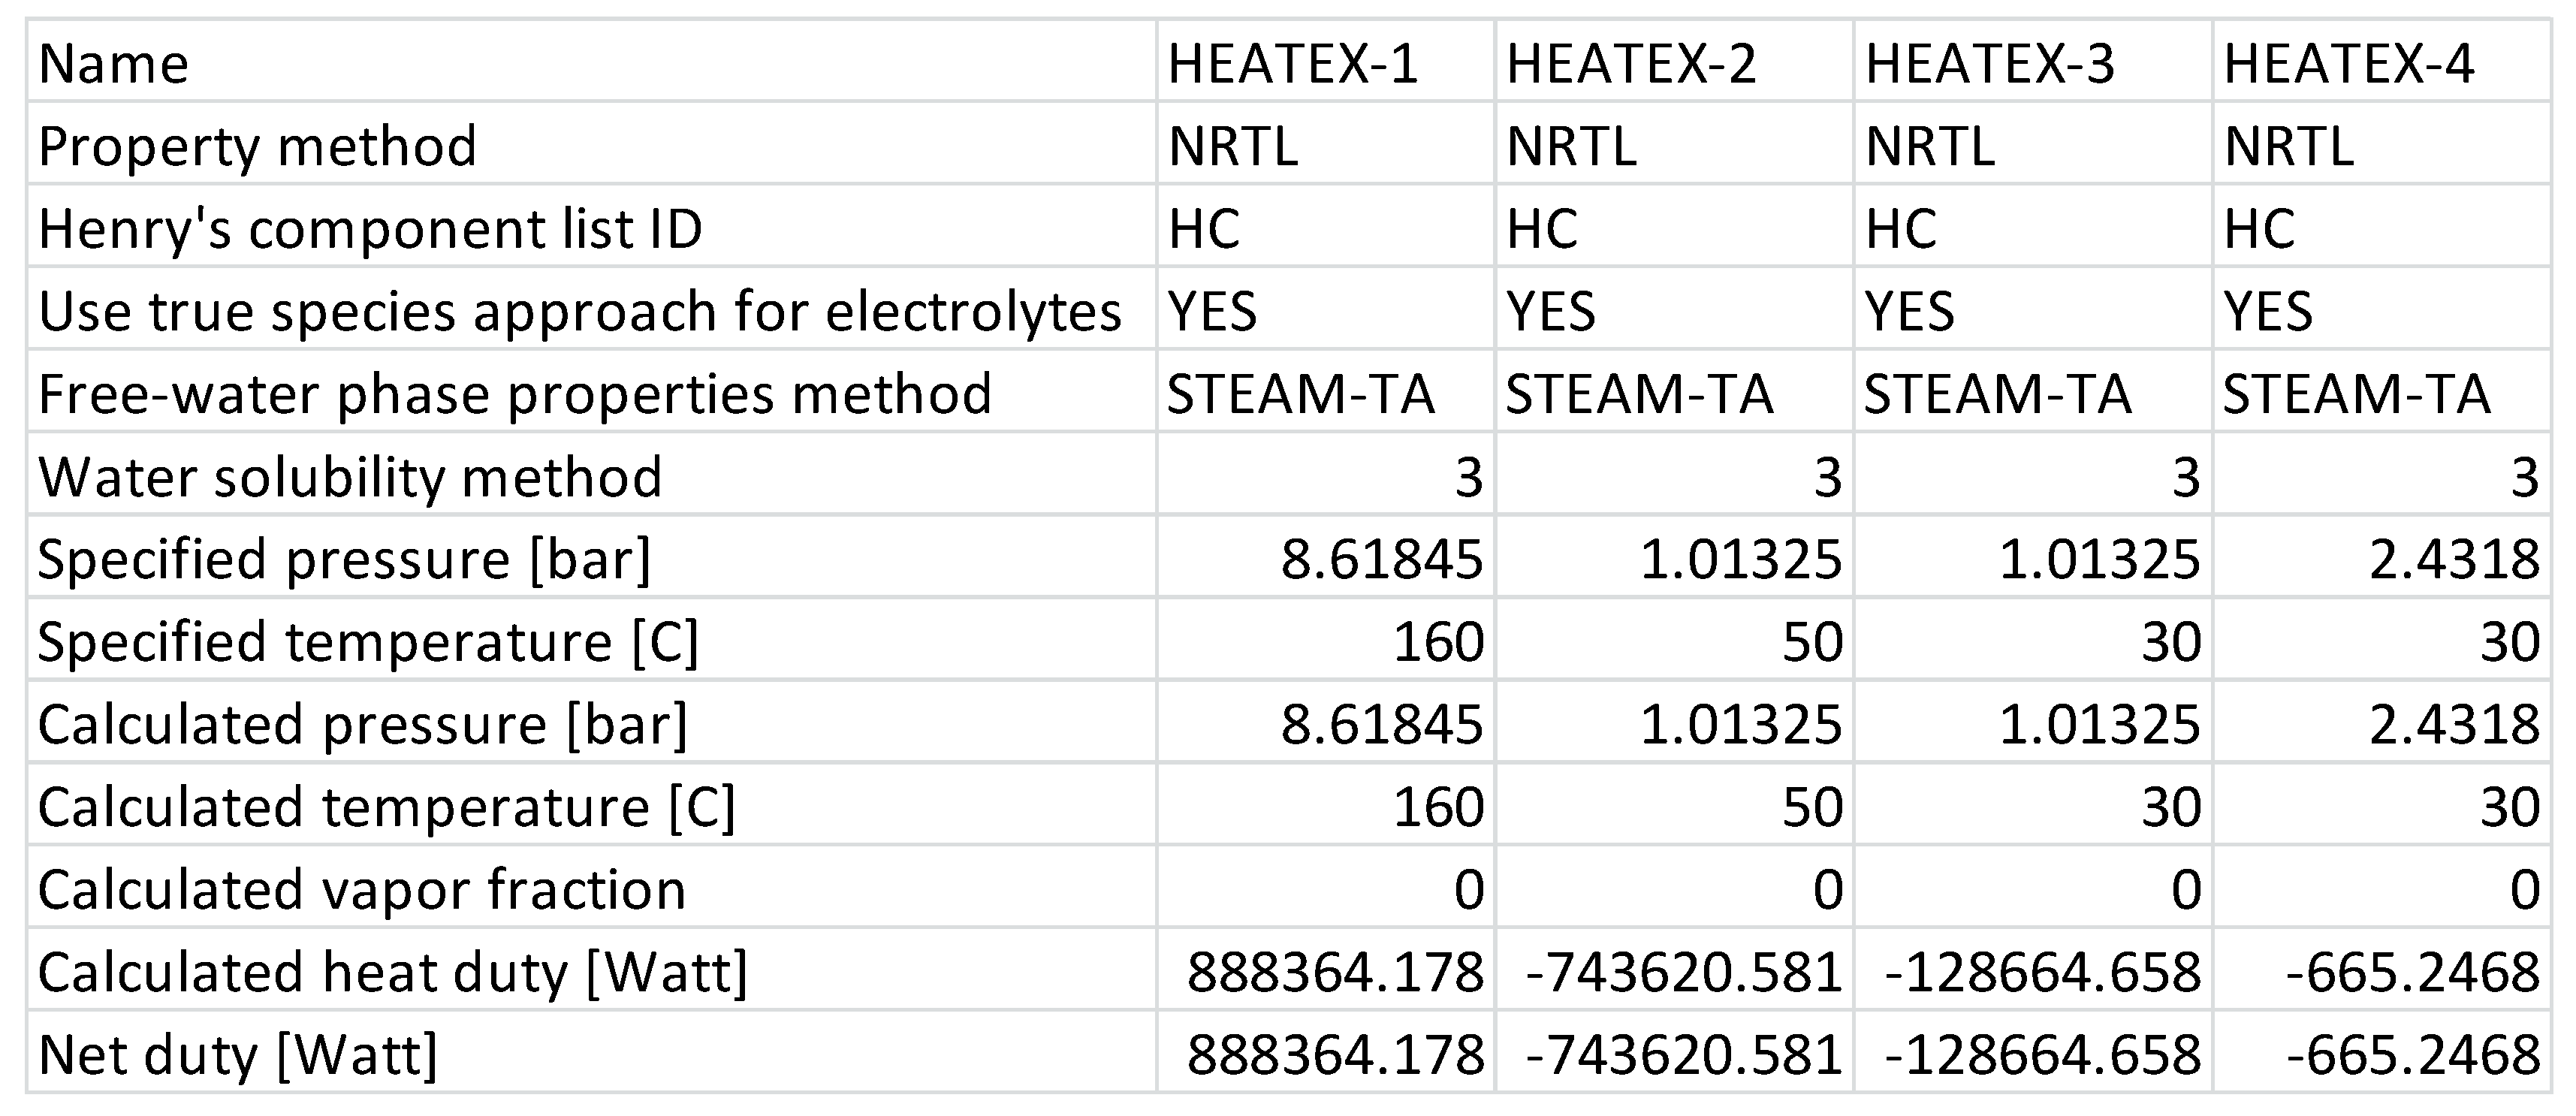
| Heat Exchangers | 15,415 |
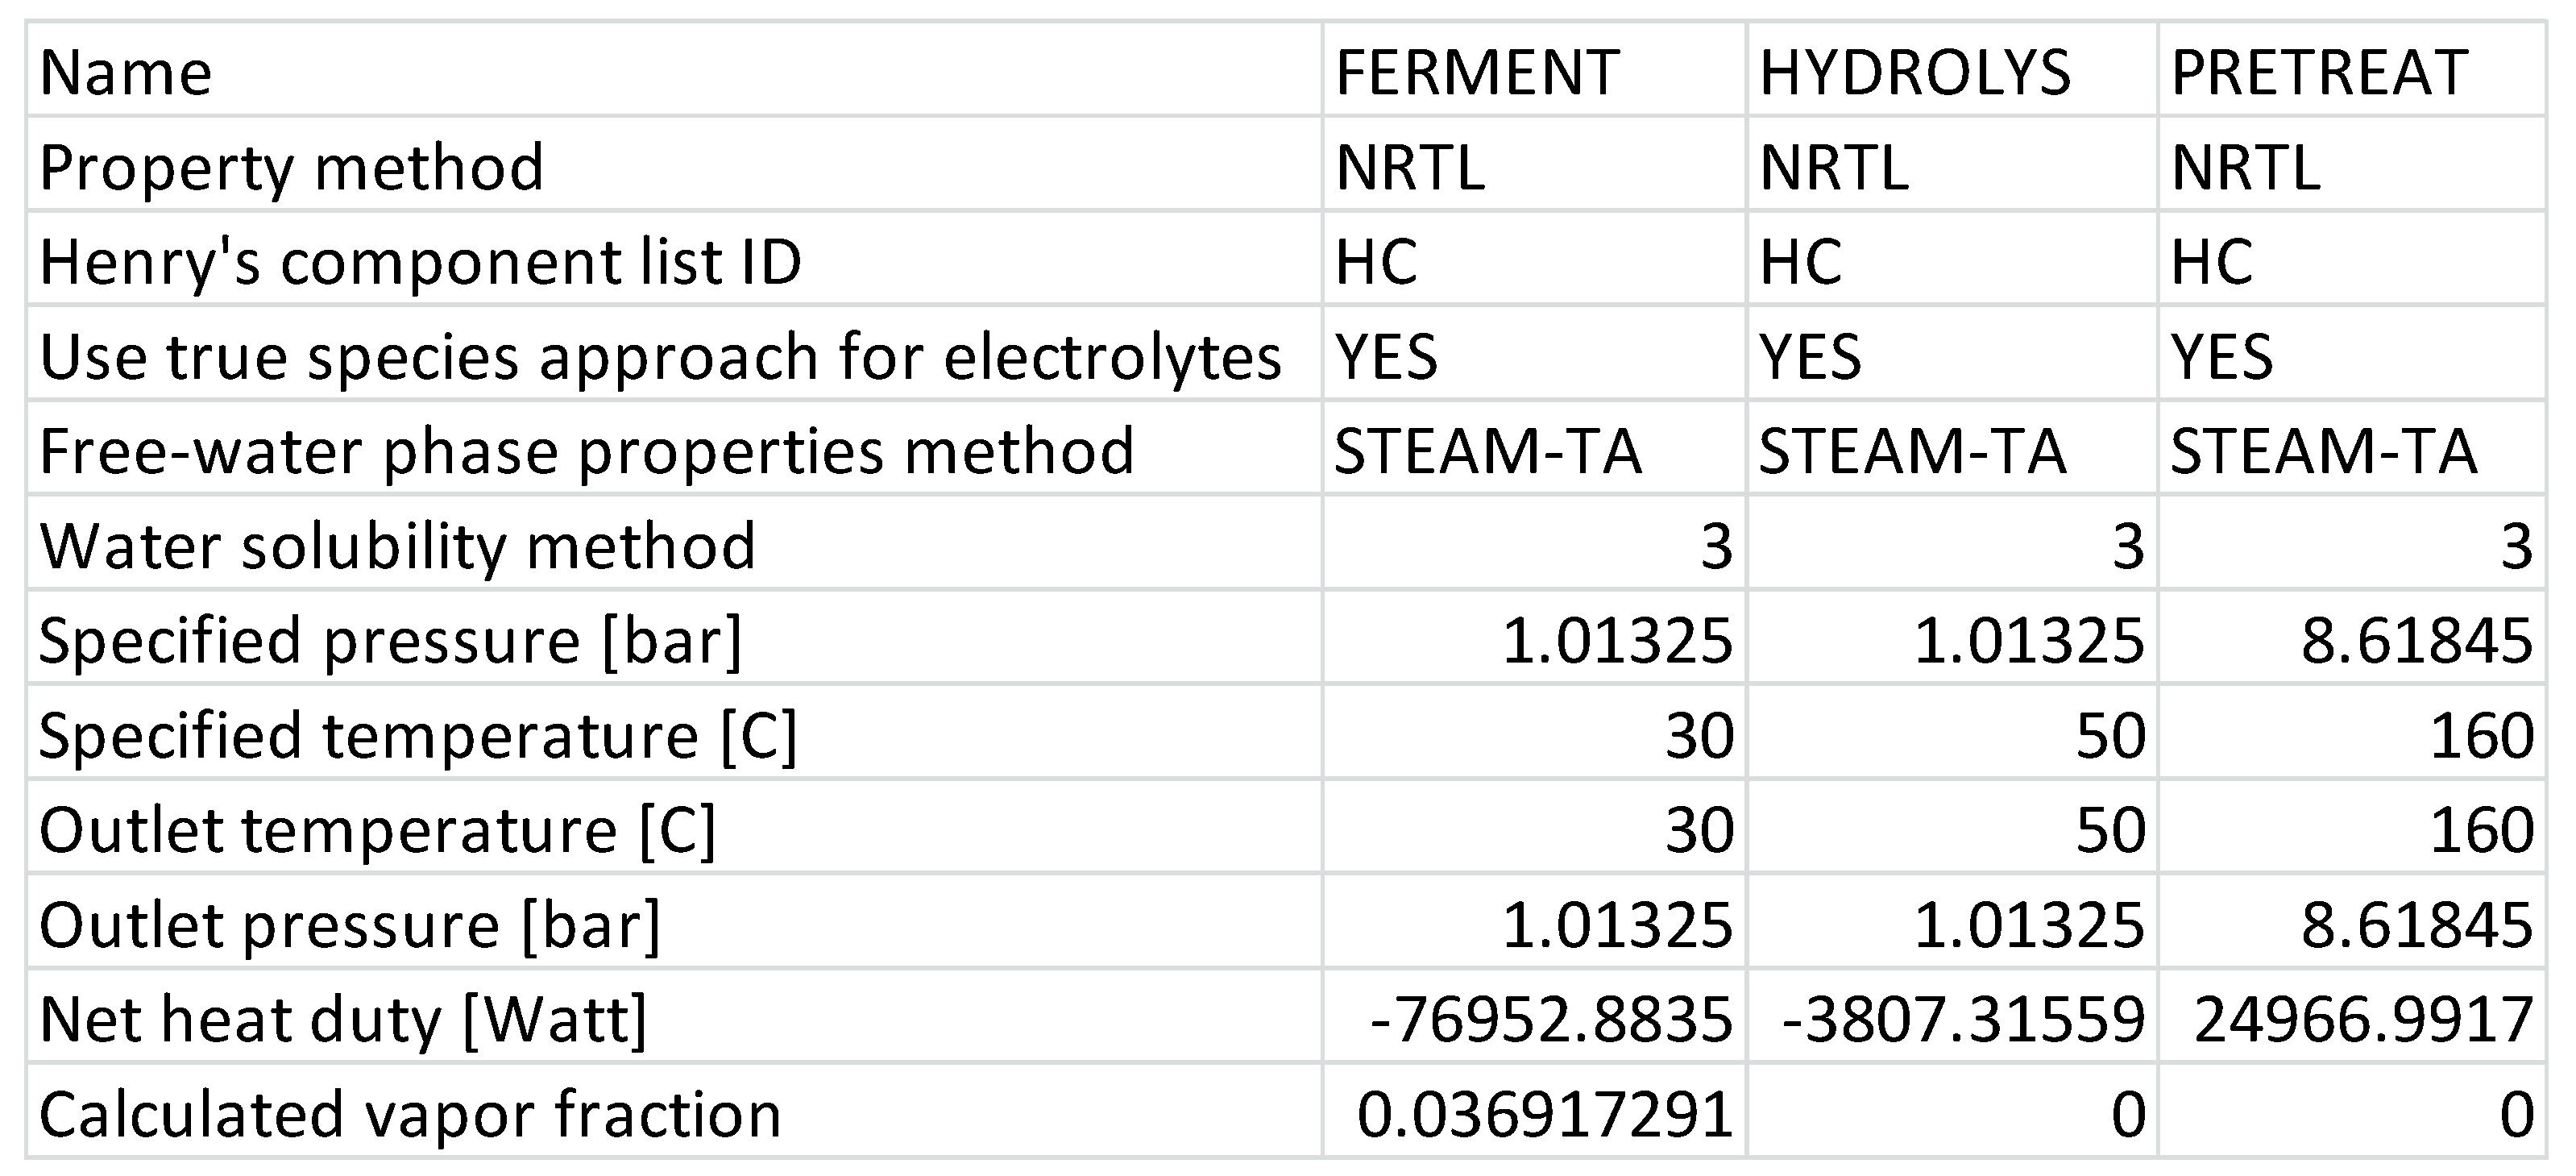
| Pretreat | 24,967 |
| Hydrolys | −3807 |
| Ferment | −76,953 |
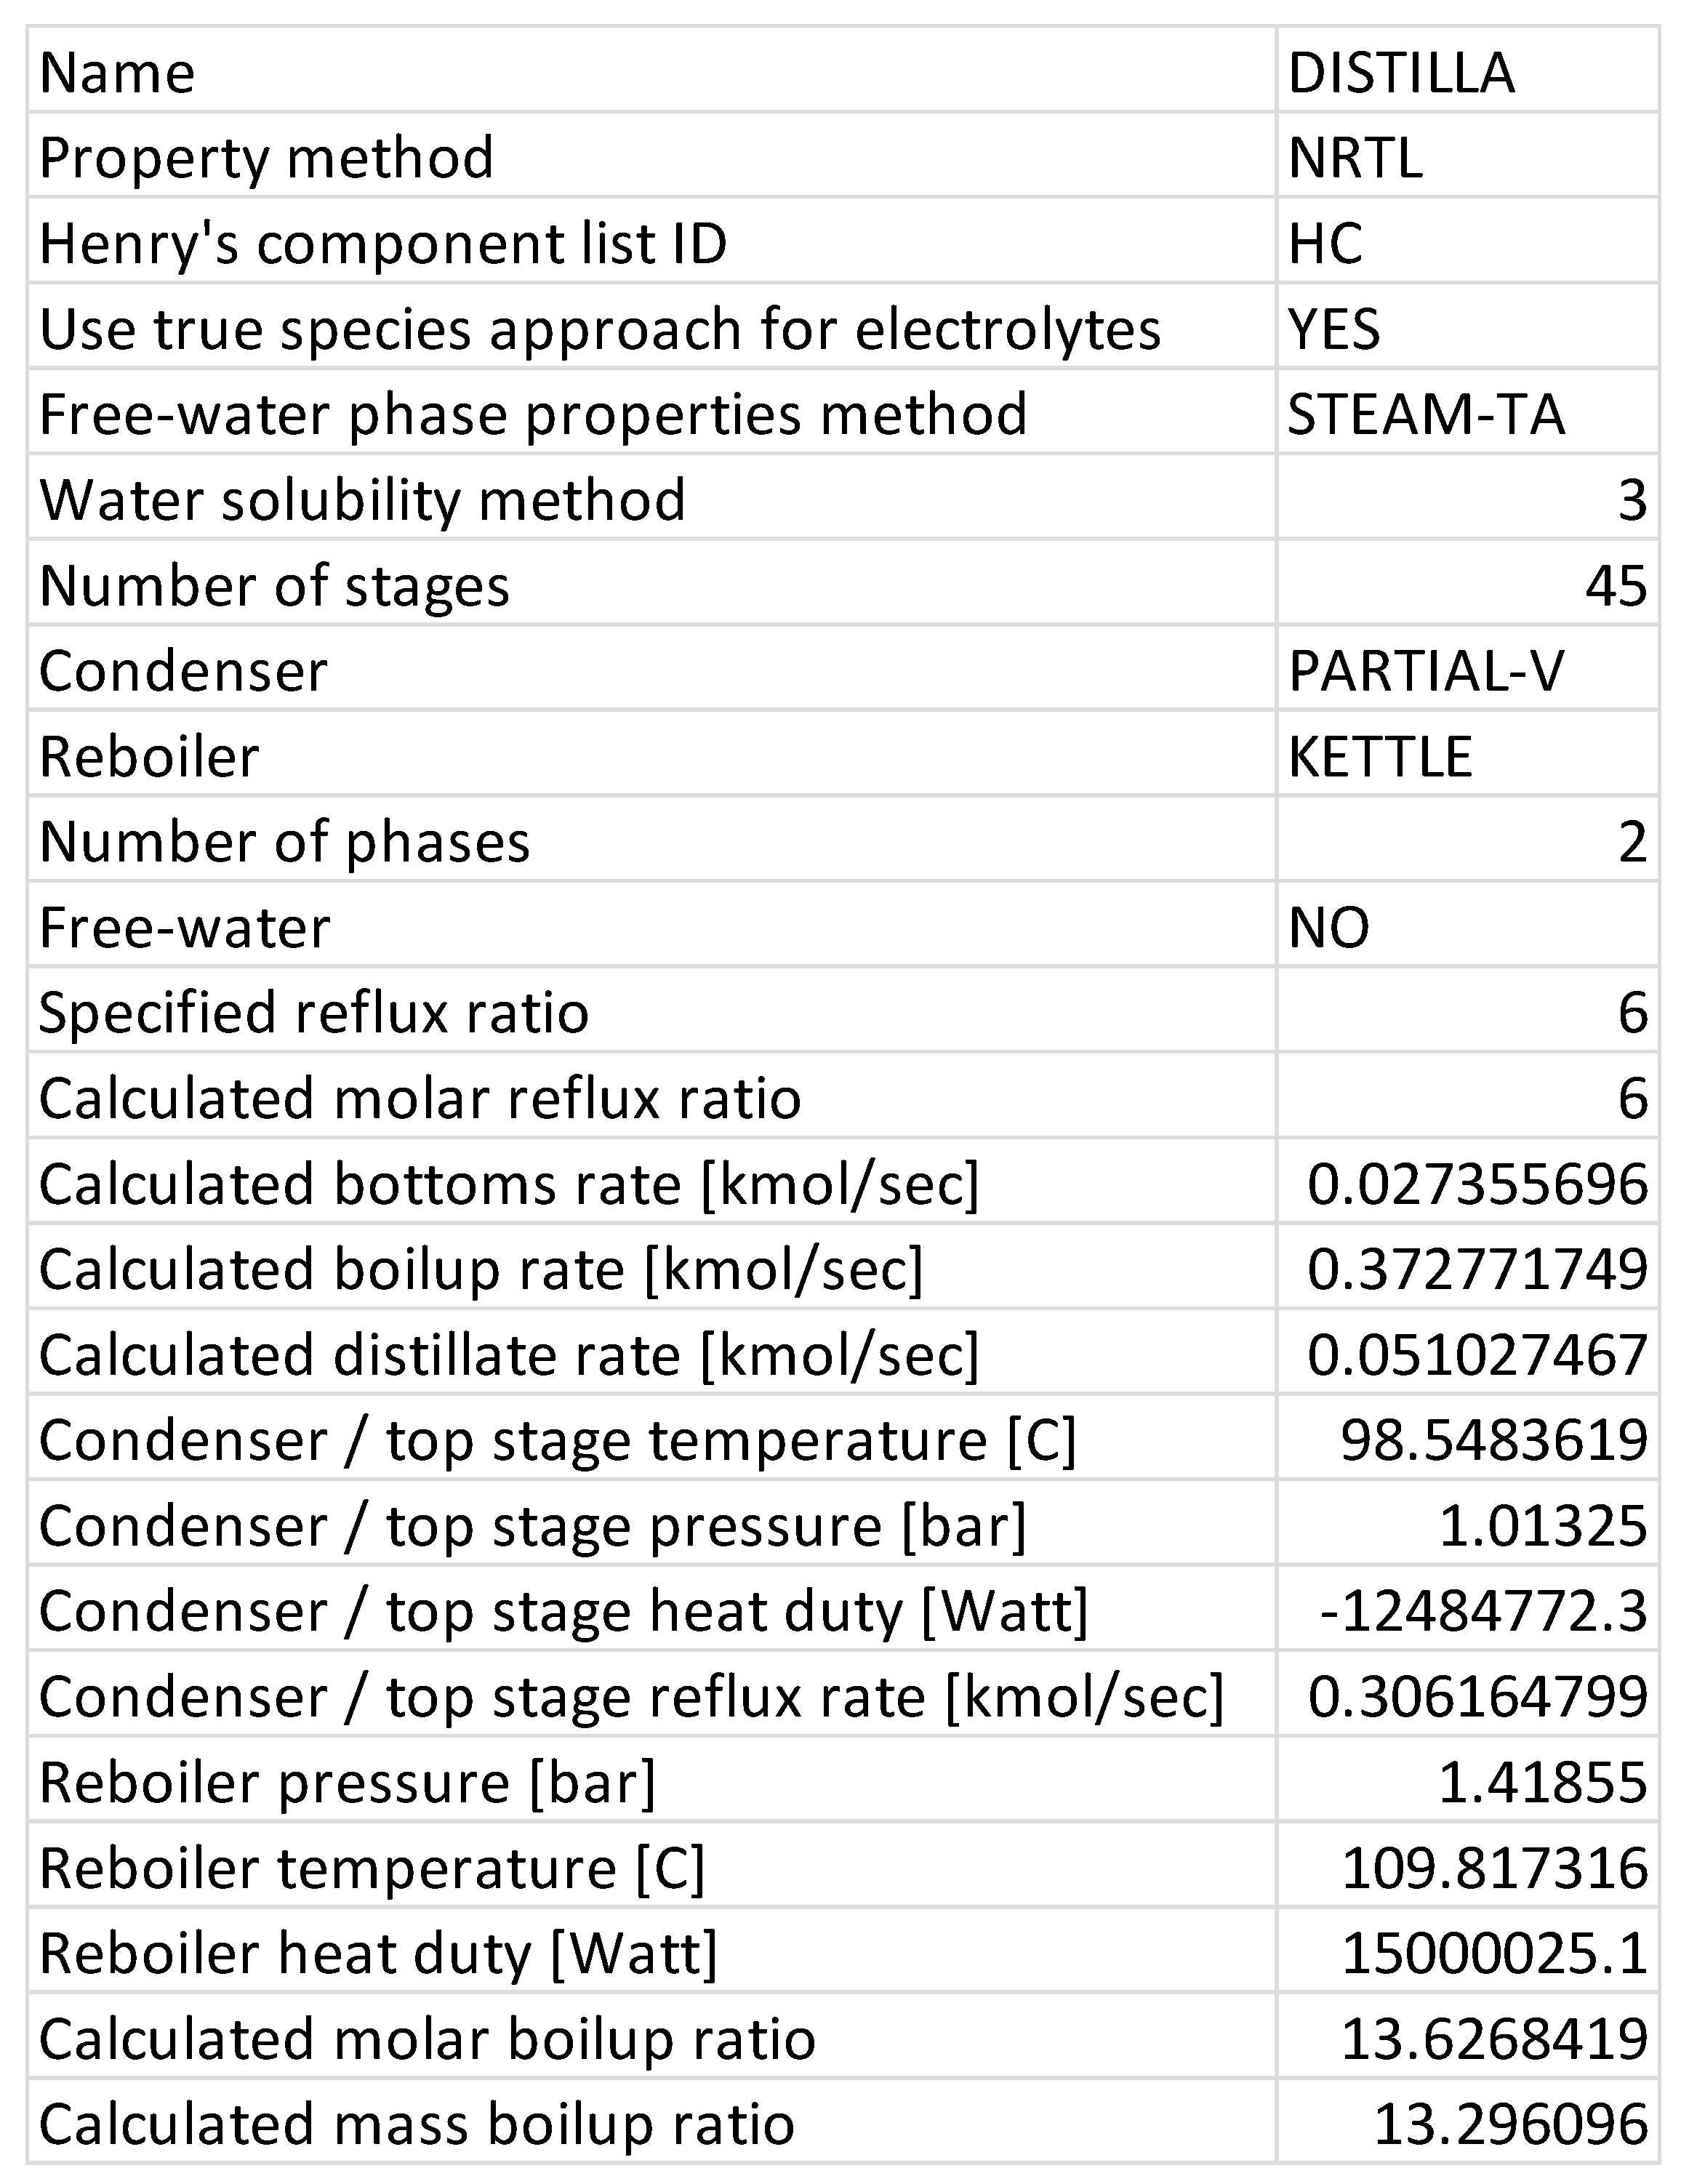
| Distilla Reboiler | 15,000,000 |
| Net Total | 14,963,240 |
| Fuel | Unit Price | Unit of Measure |
|---|---|---|
| Biodiesel (B20) | 2.89 | $/gallon |
| Biodiesel (B99-B100) | 3.72 | $/gallon |
| Electricity | 0.13 | $/kWh |
| Ethanol (E85) | 2.28 | $/gallon |
| Natural Gas (CNG) | 2.19 | $/gallon gasoline equivalent |
| Liquefied Natural Gas | 2.77 | $/diesel gasoline equivalent |
| Propane | 2.79 | $/gallon |
| Gasoline | 2.59 | $/gallon |
| Diesel | 3.05 | $/gallon |
| Hydrogen | 4.65 | $/kg |
| Pyrolysis | Gasification | Fermentation | |||||||
|---|---|---|---|---|---|---|---|---|---|
| Quantity | Unit | $/tonne of Biomass | Quantity | UOM | $/tonne of Biomass | Quantity | UOM | $/tonne of Biomass | |
| Net Duty W/O Heat Recovery | 191 | kJ/tonne biomass feed | 25 | 1126 | kJ/tonne biomass feed | 146 | 7481.5 | kJ/tonne biomass feed | 973 |
| Net Duty With Heat Recovery | 37 | kJ/tonne biomass feed | 5 | 725 | kJ/tonne biomass feed | 94 | - | - | - |
| Hydrogen Produced | 18 | kg | 84 | 56 | kg | 260 | - | - | - |
| Methane Produced | 70 | kg | 689 | 0 | kg | 0 | - | - | - |
| Bio-Char Produced | 199 | kg | - | 0 | kg | - | - | - | - |
| Water Produced | 246 | kg | - | 60 | kg | - | - | - | - |
| Bioethanol | - | - | - | - | - | - | 233 | kg | 209 |
| Fuel Yield per kg Feed | 8.8 | % | - | 5.6 | % | - | 23.3 | % | - |
| Process Cost ($) | - | - | 768 | - | - | 166 | - | - | −763 |
| Net Duty kJ/tonne Biomass | Process Cost $/tonne Biomass | Cost of Fuel $/gal | Cost of Fuel $/L |
|---|---|---|---|
| 7481.5 | 763 | 10.60 | 2.80 |
| 7000 | 701 | 9.91 | 2.62 |
| 6500 | 636 | 9.21 | 2.43 |
| 6000 | 571 | 8.50 | 2.25 |
| 5500 | 506 | 7.79 | 2.06 |
| 5000 | 441 | 7.08 | 1.87 |
| 4500 | 376 | 6.37 | 1.68 |
| Literature [68] | This Study @ 7481.5 kJ/tonne | This Study @ 6500 kJ/tonne | |
|---|---|---|---|
| Biomass Feedstock | Sugar beets | Date Palm Waste (Cellulose) | Date Palm Waste (Cellulose + Hemicellulose) |
| Feed Quantity | 83,333 kg | 1000 kg | 1000 kg |
| % Sugar | 66.8% | 44.4% | 68.7% |
| Sugar/Fermentable Content | 55,666 kg | 444 kg | 687 kg |
| Bioethanol Produced | 6227 kg | 233 kg | 306 kg |
| Bioethanol Yield (From Sugars Only) | 11% | 52% | 45% |
| Breakeven Fuel Price | 1.8 $/L | 2.80 $/L | 1.85 $/L |
Publisher’s Note: MDPI stays neutral with regard to jurisdictional claims in published maps and institutional affiliations. |
© 2020 by the authors. Licensee MDPI, Basel, Switzerland. This article is an open access article distributed under the terms and conditions of the Creative Commons Attribution (CC BY) license (http://creativecommons.org/licenses/by/4.0/).
Share and Cite
Martis, R.; Al-Othman, A.; Tawalbeh, M.; Alkasrawi, M. Energy and Economic Analysis of Date Palm Biomass Feedstock for Biofuel Production in UAE: Pyrolysis, Gasification and Fermentation. Energies 2020, 13, 5877. https://doi.org/10.3390/en13225877
Martis R, Al-Othman A, Tawalbeh M, Alkasrawi M. Energy and Economic Analysis of Date Palm Biomass Feedstock for Biofuel Production in UAE: Pyrolysis, Gasification and Fermentation. Energies. 2020; 13(22):5877. https://doi.org/10.3390/en13225877
Chicago/Turabian StyleMartis, Remston, Amani Al-Othman, Muhammad Tawalbeh, and Malek Alkasrawi. 2020. "Energy and Economic Analysis of Date Palm Biomass Feedstock for Biofuel Production in UAE: Pyrolysis, Gasification and Fermentation" Energies 13, no. 22: 5877. https://doi.org/10.3390/en13225877