Article

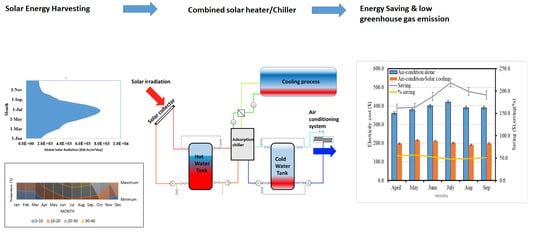
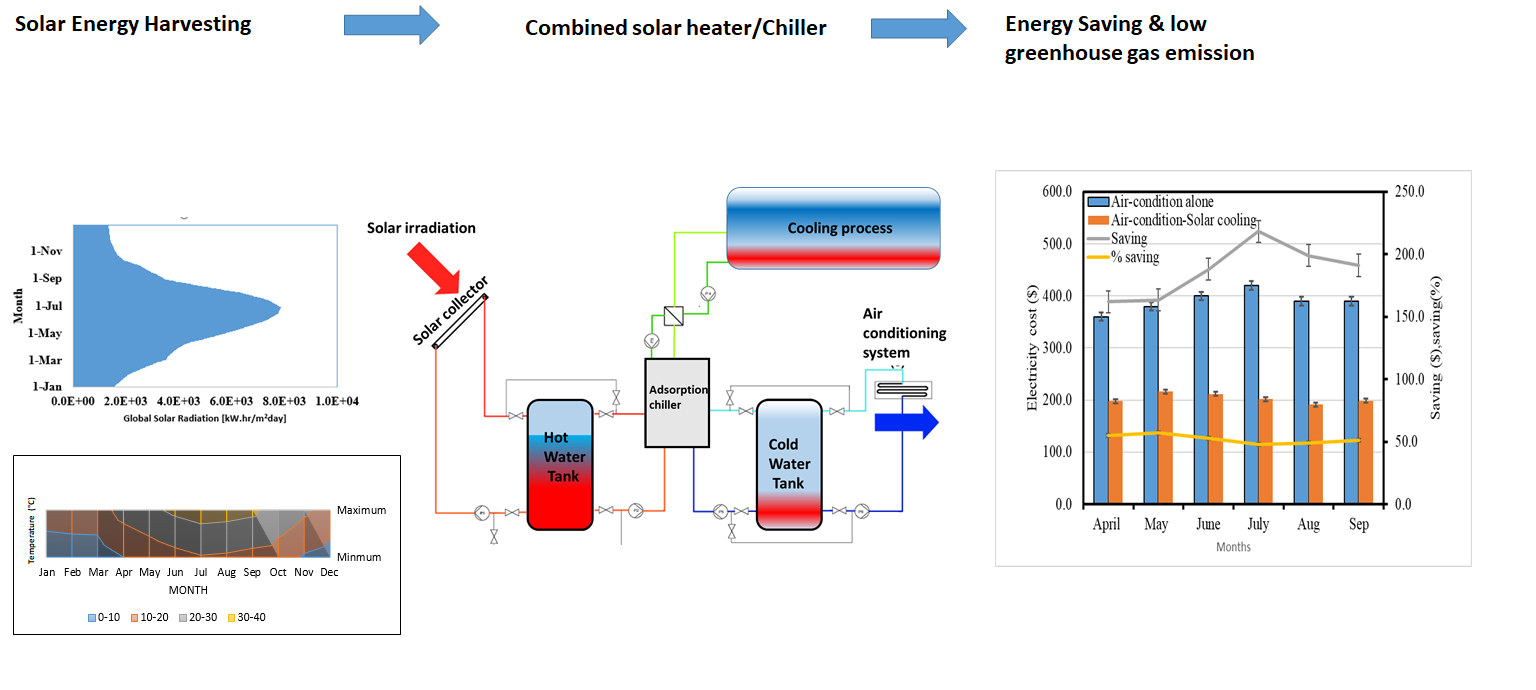
Techno-Economic Investigation of an Integrated Boiler–Solar Water Heating/Cooling System: A Case Study

by
Mohammad Al-Smairan
1,
Moayyad Shawaqfah
2 and
Fares AlMomani
3,*
1
Head, Renewable Energy Engineering Department, Faculty of Engineering, Al al-Bayt University, P.O. Box 130040, Mafraq 25113, Jordan
2
Civil Engineering Department, Engineering Faculty, Al al-Bayt University, Mafraq 25113, Jordan
3
Department of Chemical Engineering, Faculty of Engineering, Qatar University, Doha 2713, Qatar
*
Author to whom correspondence should be addressed.
Energies 2021, 14(1), 1; https://doi.org/10.3390/en14010001
Submission received: 9 November 2020 / Revised: 6 December 2020 / Accepted: 8 December 2020 / Published: 22 December 2020
(This article belongs to the Special Issue Technologies for Biofuels and Energy)

Abstract

:
With the increase in oil prices, developing nations end up paying expensive electricity and heating bill. This leading study investigates the experimental development of a new energy-saving system by integrating a solar water heater and solar cooling absorption cycle with a conventional boiler for domestic hot water and heating purposes. The heating and cooling load calculations for space heating of the building were calculated using TRNSYS 14.1 computer software and the results were used in calculating the energy-saving value. A 65 flat plate solar collector-chiller system with a total surface area of 130 m2 was integrated with the boiler and used to supply heating and cooling for a three-story building (1500 m2) in Al Bayt University, Jordan. The integrated system helped to save energy, reduced the emission of CO2 into the atmosphere, supplied hot water, and space heating/cooling requirements to the building year-round, and reduced the overall energy cost of heating and cooling by 55% and 48%, respectively. Moreover, the techno-economic analysis showed that the payback period of the combined system with a total cost of $18,650 is roughly 2.5-year. The solar water heating/cooling system has the potential to provide more than 50% of the house energy demand free of charge with a significant reduction in carbon footprint.

Graphical Abstract

1. Introduction

Primarily, crude oil is the main source of energy that is used for production and manufacturing processes and is a key element causing a rising global greenhouse gas emission footprint [1,2,3,4,5,6,7,8]. Middle Eastern countries, with a specific focus on Jordan, have faced a multitude of challenges importing and utilizing crude oil, including the shortage in local energy resources, the difficult economic situation, fluctuations in the prices of crude oil, and military conflicts in neighboring countries [9,10,11,12]. Jordan is amongst various developing nations that do not have enough stock of the conventional energy resource [13] and therefore depend on imported crude oil from neighboring Arab countries. Jordan’s imported energy resources represent more than 95% of the country’s total energy demand [14,15]. It is expected that the energy demand will significantly increase in comparison to the growth of the Jordanian economy. The country’s annual oil demand in 2015 was approximately 8.93 Mtoe and double this amount in 2020 [9]. This high–energy bill, which represents ~10.9% of the gross domestic product, 19.3% of the value of imports, and 35.9% of the value of exports dramatically increased the indebtedness of the country.
Much of Jordan’s imported gas and crude oil are used for the production of electrical energy, which was estimated to be about 3300 MW in 2015, and has since increased to 5980 MW in 2020, and is expected to increase to more than 8000 MW by 2025 [16,17]. Because of the war in 2013, Jordan witnessed the end of the cheap supply of crude oil from Iraq. Subsequently, the Jordanian government had to search for alternative sources to ensure their oil needs were met. The cost of importing fossil fuel in 2003 reached approximately $1091 million, which represents 36.4% of the value of exports for the same year.
An approaching priority and challenge in Jordan will be to minimize the dependency on imported energy resources to meet current and future needs and reduce its greenhouse gas emission (GHG) by 1.5 percent by 2030. As such, the government has had to search for alternative energy sources. Jordan has initiated various projects for oil and gas exploration in partnership with international companies. However, no promising results were achieved, except for minor natural gas production that is already used to generate a maximum of 5.5% of the country’s energy demand. It is expected that the production of natural gas and oil shale will increase by 2025 to 20% of the country’s energy requirements, which will only slightly reduce the necessary amount of imported crude oil [18,19,20]. To overcome these challenges, Jordan has been actively seeking to decrease its dependency on fossil fuels from 95% to ~61% by using sustainable renewable energy resources [21,22].
The National Energy Strategy Plan (NESP) of Jordan for the period between 2008–2025 is based on producing 29% of the country energy demand from natural gas, 14% from oil shale (which is abundant in Jordan), 10% from renewable energy resources, 6% from nuclear resources, and the rest from imported crude oil [23]. Jordan enjoys an abundant annual sunshine duration of 2900 h and an average solar radiation reception of 5.0 ± 1.1 Kwh/m2/day, which is one of the highest in the world. With this abundant solar irradiation, Jordan can produce large amounts of sustainable solar energy as resource assets. As such, to lessen the reliance on imported oil, the country’s goal is to utilize solar energy, as well as identify potential areas for using future technologies and recommending future courses of action to encourage the commercial use of these technologies [9,24]. The potential to harness solar energy for a wide scale of applications has received a great deal of attention in Jordan. Applications such as electrification of remote sites and pumping of groundwater are already in use. The NESP directive for 2013 recommended following a systematic plan to develop a wide range of applications based on the use of solar energy to decrease the country’s dependency on imported crude oil.
Solar energy can be employed in technologies such as solar water heaters, solar heating–cooling systems, and solar photovoltaic power generation [25]. Both solar water heaters and solar photovoltaic power generation are important for Jordan’s renewable energy development as they are both quite popular, have a simple implementation process, are commercially available, and economically mature [26,27,28,29]. Domestic solar water heating is an easy and simple system that has been used in cities and villages since the 1980s to provide energy to commercial buildings and homes [30,31,32].
Different energy analysis tools and software have been established to calculate the heating/cooling load of buildings. These comprised of rules of thumb, using the custom-made construction codes coupled with weather data and/or detailed energy-balanced calculations. Energy developed computer software such as DOE-2 (Version-2, University of Californiam Berkeley, Berkeley, CA 94720, U.S.A.) [33,34], BLAST (BLAST support office, University of Illinois, Champaign, IL, USA) [35,36], and TRNSYS (Version 14, Madison, WI, U.S.A.) [15,37,38,39] were successfully employed to determine the building energy requirements based on hourly annual simulated energy correlations. These programs are based on carrying out detailed mass and energy balance calculations taking into consideration the thermal properties of the materials/insulation used in building as well as local weather data to determine heating/cooling loads. Amongst all software, TRNSYS is considered the most suitable program as it considers the material of construction as well as the components of the building under consideration. The program also allows importing programs subroutines model that can be integrated into the program to simulate desired characteristics. This software can also perform the thermal dynamic calculations if detailed specific information is available from the user.
In addition to solar heating, different researchers recommended incorporating the solar cooling absorption cycle within the solar water heating system to enhance the overall system revenue. The theoretical aspect of the solar cooling absorption cycle and the influence of system parameters on the performance, design, and optimized conditions have been previously reported [40,41,42]. In addition, the practical and feasible application of solar energy has been established and recommended in different middle eastern and African countries [43,44,45,46,47]. These studies highlighted the importance of installing solar thermal and solar electricity systems and their impact on the implemented policies, energy security, and the reduction in GHG emissions. Martinopoulos and Tsalikis [43] confirmed the availability of different solar technologies that can adapt to different climatic conditions in different regions. Sami et al. [44] showed that the use of a solar water heating system contributes to the economic improvement of the Algerian energy sector. The study showed promising results that were correlated to the high solar irradiation in the studied regions and the availability of adequate funding to establish high competitiveness of solar energy against conventional technologies. Martinopoulos and Tsalikis [46] presented a techno-economic study that evaluates solar space and water heating systems designed to achieve high energy performance based on “Nearly Zero Energy Buildings (NZEB)”. The results revealed that the solar space and water heating system provides a viable solution toward NZEB, lower CO2 emissions in a reasonable discounted payback period of 4.5 years. Shirazi et al. [48] exemplified significant feasibility for employing solar absorption cooling systems with single, double, and triple-effect LiBr-H2O absorption chillers. Djelloul et al. [49] presented sealable absorption chillers as an auxiliary cooling system for residential dwellings. The system with 28 m2 of flat solar collectors generated a 10 kW of cooling capacity with a significant coefficient of performance (COP) of 73%. The generated cooling capacity met the air conditioning demand of 120 m2 house located in the hot climate region of Algeria.
Due to the high and reliable solar irradiation in Jordan (5.5 kWh/m2 a day and 330 sunny days/year) [50], there is a lot of potential to produce domestic hot water and provide heating/cooling to buildings using a simple solar configuration [51,52]. The use of a solar water heater/cooler is a cost-effective solution for residential and commercial buildings and is the most modernized system among other alternative technologies [53]. However, as a result of daily and seasonal variations in the solar irradiation intensities (SII), the solar water heater system is often combined with a conventional heating system to fulfill the required energy demand. The conventional system is often a boiler operated with fuel oil/diesel to cover the remaining required energy for a particular building. The idea of a combined solar–conventional system to provide domestic energy and reduce the reliance on imported expensive sources of energy is imperative though it requires further practical “real life” testing. Nonetheless, the integration of solar water heaters with solar cooling absorption cycle has not been widely investigated in developing countries in general and specifically in Jordan. The integration of a conventional boiler system with a solar heating/cooling system for domestic hot water and building heating/cooling can save energy, reduce CO2 emissions, and prompt sustainability [2].
An approved, feasible, and well-controlled technology is an innovative idea that can reach large segments of the market. As such, the present study aims to (a) investigate for the first time the techno-economic feasibility of developing a new energy-saving system that consists of integrating a conventional boiler with a solar heating/cooling system; (b) evaluate the possibility of utilizing solar collectors for domestic use; (c) evaluate the performance of the integrated system that includes the conventional boiler, solar water heated, and solar cooling absorption cycle systems in developing countries; (d) assess the reduction in energy cost before and after the integration; and (e) provide an environmental impact assessment to determine the reduction in the emissions of carbon dioxide before and after the process integration. This study considered the first experimental work performed in developing countries for an extended time. The trails of the solar heating/cooling system were performed in a three-story building with a total surface area of 1500 m2 located in Al al-Bayt University (AABU), Jordan. The results of this study although specified for Jordan can be adopted in different developed and developing countries with similar solar irradiation intensities.

2. Materials and Methods

2.1. Case Study

The present study was conducted using a combined conventional boiler–solar water heating/cooling system providing domestic hot water and space heating/cooling to a 3-story building with a total surface area of 1500 m2, located in Al al-Bayt University (AABU), Jordan. The university has faced a significant increase in their energy bill during the period 2003 to 2015 due to the increase in oil prices. In addition, the fuel consumption for heating purposes at AABU has increased during the period 2012 to 2016 from 17.9 m3/year (~7.4 Mtoe) to 19.5 m3/year (8.9 Mtoe). With the increase in oil prices and the difficulty importing crude oil from neighboring countries, the cost of heating has significantly increased, ultimately straining the university’s budget. Given this, it was decided to further investigate alternative energy resources to reduce the university’s er heated/cooling system used in this study consists of 65 flat plate solar collector equipped with storage taheating/cooling expenses and to take advantage of empty roof space to harness solar energy. The solar watnks, and an absorption chiller connected to a boiler. The combined system provides both hot water for domestic use and central heating/cooling for the entire building. The study was carried out for 12 months to evaluate the performance and the cost-saving ability achieved during different seasons.

2.2. Heating/Cooling Energy Calculations

The energy-saving calculations were carried out based on the monthly energy demand for both hot water and space heating/cooling. The recorded 12-month temperatures and solar irradiation intensities, the annual historical water consumption records, and the variation in the building temperature were used for calculations. The per capita water consumption was set at 45 L/day, comfortable building temperature of 25 °C. The monthly average heating/cooling loads were calculated using the TRNSYS 14.1 program. The annual hourly weather data, the characteristics of the buildings and the required material properties as per the Jordanian building code (windows, doors, ventilation, wall, ceiling, and insulation) as well as meteorological weather data (solar irradiation intensity, temperature, and wind speed) were used as an input to the program (Table 1). Building characteristics as per the Jordanian building code (Table 1) were also used in the calculations. The minimum and maximum temperatures for the heating and cooling, in relation to the comfortable temperature, were set at Tmin = 18 °C and Tmax = 27 °C, respectively. Calculations were made based on the required energy for heating or cooling of the building to the desired comfortable temperature. In other words, the energy required to reset the comfortable temperature during the summer and winter to the limits indicated above were determined. The humidification and dehumidification ratios were set at 25 ± 5% and 55 ± 5%, respectively. The latent loads were estimated based on these two values when the building humidity ratio decreased beyond the above-mentioned limits, with positive values assigned for dehumidification, while humidification was considered negative. Therefore, the rate of heat flux entering or leaving the building was determined as per Equation (1)
Q i ( k J m 2   ) =   J = 0 α j , i T , i , j   J = 0 β j , i T r e q , i , j   J = 0 γ i , i Q i , j  
where αj, βj, and γj are heat transfer coefficients for current and previous values, Tα,i,j is the building air temperature, Treq is the required building temperature and Q is the heat flux. Terms in Equation (1) attain a positive sign for cooling and negative for heating. The material of construction of the building as well as insulations with their corresponding heat transfer coefficients were used in determining the values of αj, βj, and γj. All heat gain/loss entering the building was accounted for in the calculations of the monthly average load.

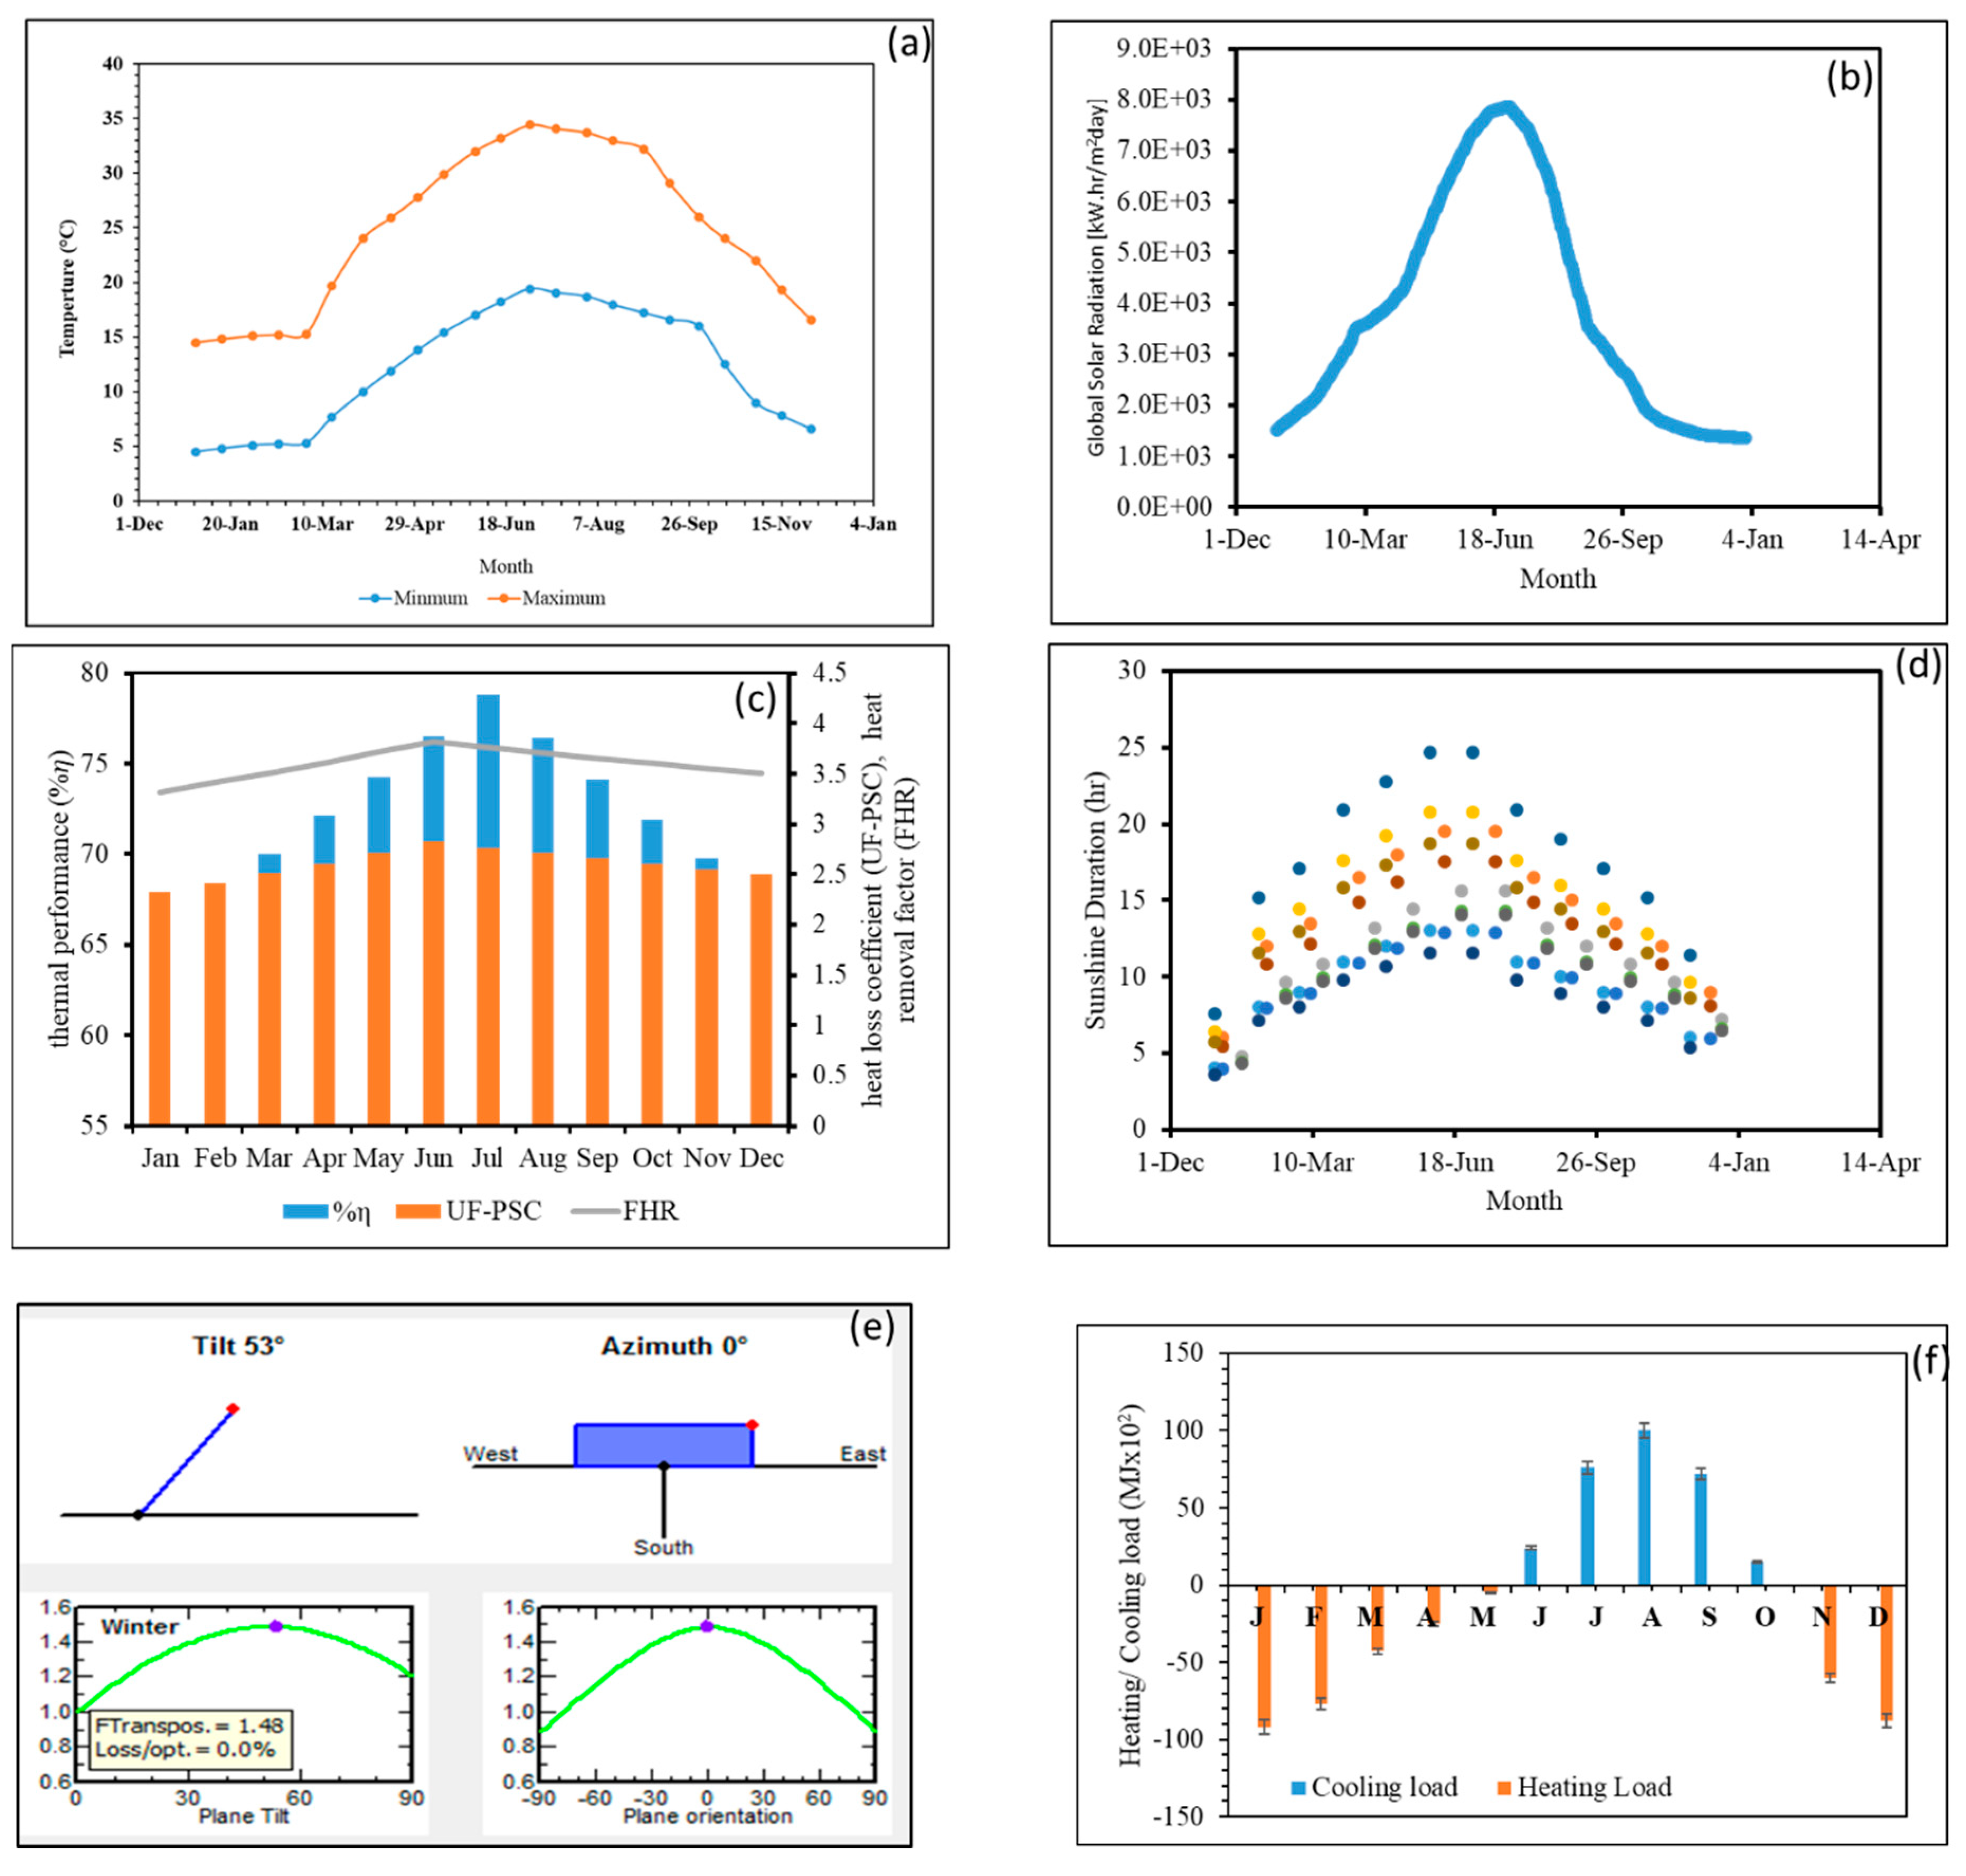
2.3. The Area of the Study

Jordan is a Middle Eastern country located between N. Latitudes 29°11′ and 33°22′ and E. Longitudes 34°59′ and 39°12′ with a total area of 89,206 km2 and geographical features that provide a diverse landscape of hills and mountainous regions. The study site, AABU, is located in a semi-dry climate with longitude and latitude of 32.3403° N, 36.2353° E, respectively. The climate of the study area is characterized by a clear division of the four seasons and has a moderate to high-temperature profile. The average annual temperature (Tav) is in the range of 8–10 °C during the winter and 28–35 °C during the summer. November to April is typically the rainy season with average annual rainfall between 150 and 200 mm. The solar energy utilization within this process at specific sites is primarily dependent upon the weather conditions, such as solar irradiation intensity (SII), the length of the day (i.e., sunny hours), sun movements, and intercepted irradiations. The SII represents the density of solar energy availability in a certain region and can be determined by measuring the total amount of solar irradiation received per unit area in a specific region during a specific period.
The weather data was collected and extracted from measurements done by the Energy Research Program of the National Centre for Research and Development between the years 2004–2015. As of the beginning of 2004, seven stations have been built in Jordan to measure the SII and temperatures in different cities including, Amman, Aqaba, Mudawara, Karak, Tafileh, Ruweished, and Mafraq–the study area. Figure 1a presents the average minimum and maximum monthly temperature profiles (Tavg.,m) in the study area. The Tavg.,m is segregated into three periods: the low-temperature profile months (LTPM) including, December, January, and February, which are characterized by Tavg.,m in the range of 4. to 15.3 °C; the medium temperature profile months (MTPM) including, March, April, October, and November with a Tavg.,m in the range of 5.5 to 29.6 °C; and the high-temperature profile months (HTPM) from May to September with Tavg.,m in the range of 15 to 35 °C. The Tavg.,m values in the HTPM suggest a considerable amount of available energy that can be used for the production of hot water and used in operating the SCAC. However, calculations indicated that both the LTPM and the MTPM could achieve up to 55% and 66.6% of energy with respect to the HTPM, respectively.
The temperature profile for the LTPM suggests that there is a chance to utilize this energy to support the combined boiler–heating/cooling system for at least 65–75% of the winter. Additionally, the temperature profiles in the MTPM and the HTPM can effectively provide the required energy for hot water and cooling systems. A literature review contains limited studies to compare results with, except for the work of Al-Salaymeh et al. [24,54] who suggested that space heating can be effective for Tavg.,m in the range of 17 to 21 °C, which was observed to occur for 9 months in the study area. Martinopoulos and Tsalikis [46] presented a similar temperature profile for four climatic zones in the Greek cities with a maximum of 25 °C. The same study showed that solar systems are capable of covering more than 42% of the total required energy demand.
Figure 1b shows that the average hourly solar irradiation intensity in AABU ranged from 4.6 to 7.3 kWh/m2. The corresponding average daily solar irradiation intensity (SIIavg.,d) were in the range of 1200 ± 50 to 2400 ± 20 kWh/m2/day for LTPM, 1450 ± 20 to 6500 ± 80 kWh/m2/day for MTPM, and 6500 ± 80 to 8100 ± 90 kWh/m2/day for HTPM. The abundance of solar energy in Jordan—the safest renewable energy source—confirms the possibility of using this form of energy for domestic applications.
Figure 1c presents the measured weather data, the thermal performance ( % η ), the overall heat loss coefficient (UF-PSC), and the heat removal factor (FHR) for the flat plate solar collectors. Calculations were made based on the average ambient temperature, the average daily solar irradiation intensity (SIIavg.,d), and an average wind speed of 3.5 ± 0.1 m/s. The % η ranged from 38 to 44%, 56 to 66%, and 71 to 74% for LTPM, MTPM and HTPM, respectively. While the values for UF-PSC ranged from 3.33 ± 0.5 to 3.66 ± 0.6, 3.00 ± 0.7 to 2.71 ± 0.2, and 2.55 ± 0.4 to 2.32 ± 0.5 W/m2.K, respectively. The values of FHR were in the range of 3.27 ± 0.07 to 2.73 ± 0.4. The thermal calculations confirm that the performance of the solar collectors is significant with a stable % η over the tested period. Figure 1d highlights the average number of sunny hours (tsun,m) per month for the area of study. The maximum tsun,m occur in July, with 12 h, and the least amount of sun occurs in December for 6.1 h. The variation in tsun,m, and the fluctuations in the SIIavg.,d indicate that the harnessed energy is subject to seasonal variation and economic analysis is required to conclude whether or not this technology should be used.
The optimal angle of solar collectors is another parameter that affects system performance and the collected solar energy. The software simulation program (PVSYST 6.5.2 and PVGIS) was used to determine the optimal angles to provide the maximum output energy. Figure 1e shows that the tilt and azimuth angles of 53° and 0°, respectively, provide the best energy output. Results indicated that the maximum energy output in winter months can be achieved using a tilt angle of 53°, which matches the heating load. Al-Salaymeh et al. [24] demonstrated that the SWH is most effective and provides hot water under winter conditions when the collectors are oriented to the south with a tilt angle around 45°. Rojas et al. [55] tested the performance of solar collectors in the incident angle range of 0 to 60°. Results indicated that the maximum intercepted energy occurs in the range between 45 and 55°. Other studies showed a tilt angle in the same range [46,56].
Figure 1f presents the monthly heating/cooling loads of the studied building. Calculations revealed that the heating season consists of seven months, January to the middle of May in addition to November and December. The heating load of the building ranged from 5 to 93 × 102 MJ (total 487 MJ), with an average value of 55.7 × 10² MJ. January and December were found to be the coldest month with a heating requirement of 93 × 102 and 88 × 102 MJ. The heating season starts in the middle of May with a heating load in the range of 15 to 100 × 102 MJ (total 402 MJ) and an average value of 57.4 MJ. Shariah et al. [39] reported the same order of magnitude results for building in nearby cities.

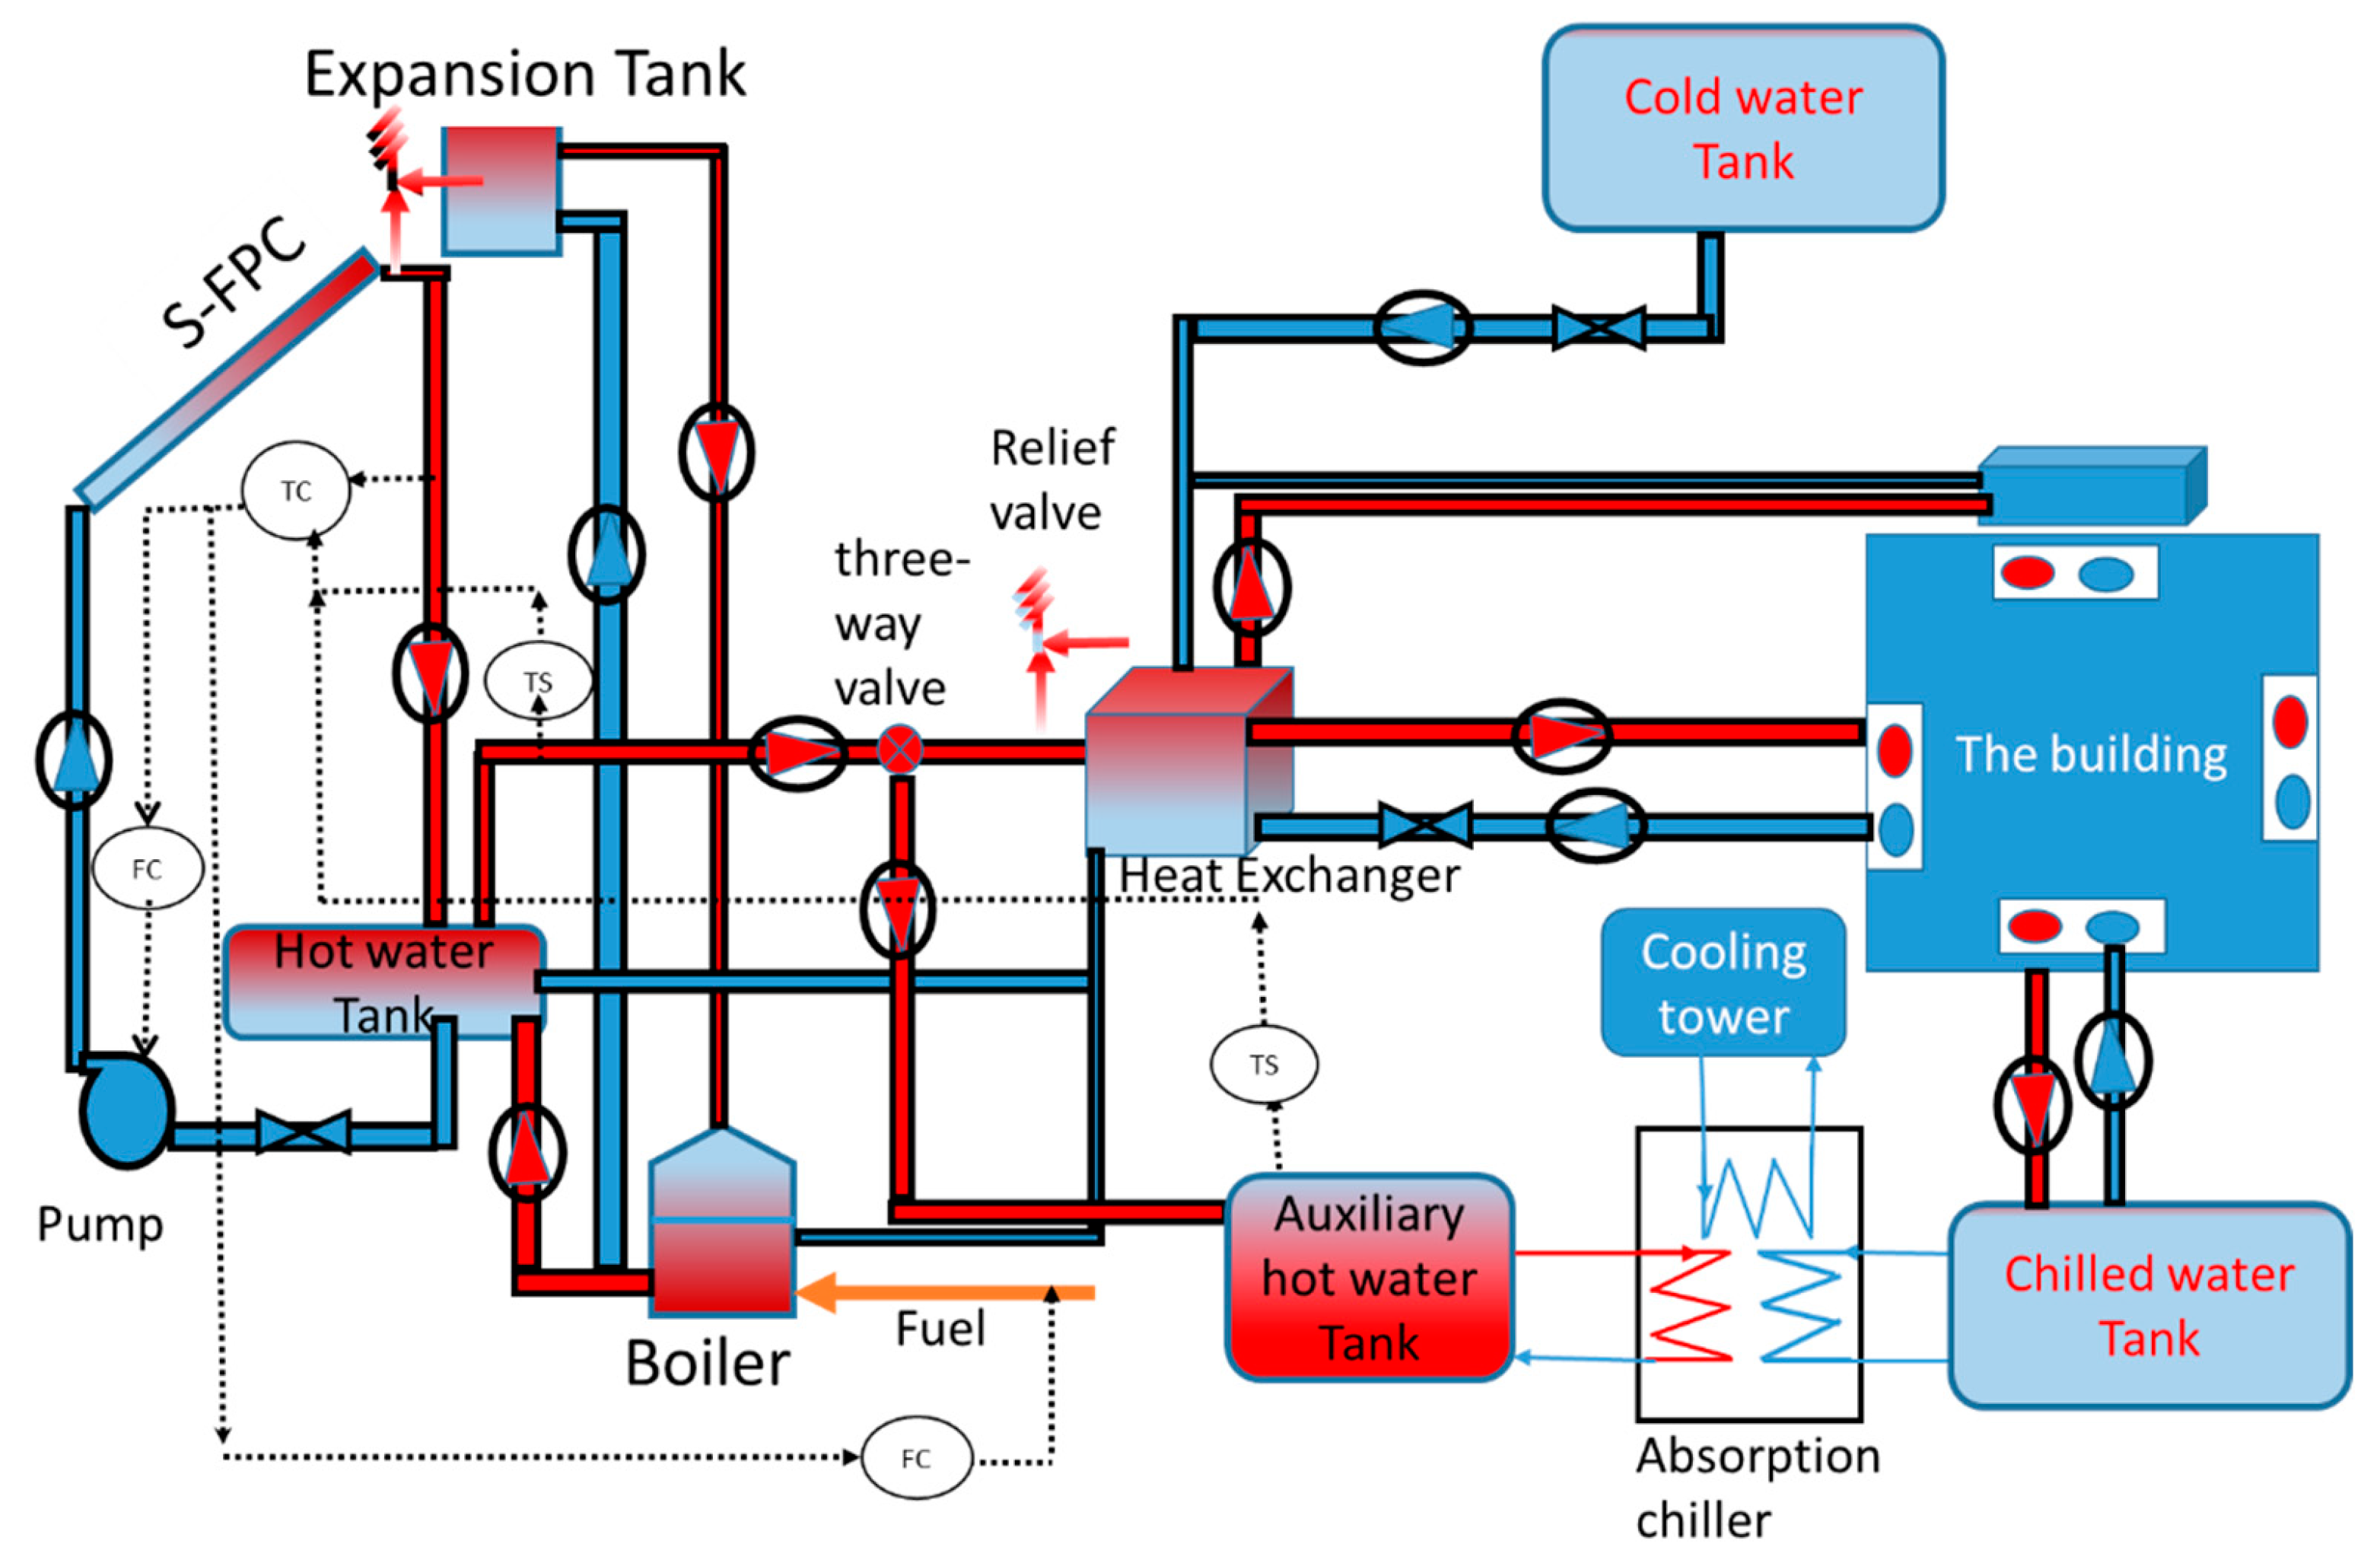
2.4. Experimental Set-Up

Figure 2 illustrates the combined conventional boiler–solar water heating/cooling system used in this study. The solar water heating system is made up of 65 flat plate solar collectors, a storage tank as the main heating element supported by a boiler operated on diesel fuel. The solar water heating setup is equipped with a control board, digital temperature sensors, pressure gauges, an expansion tank, and check and relieve valves for safe operation. The temperature within the system was controlled using a differential temperature controller (DTC). The DTC was connected to the water supply pumps and exhibited a significant accuracy in controlling the temperatures within the system, specifically, at the collector out and solar storage tank. The 65 flat plate solar collectors have a total surface area of 130 m2, a storage capacity of 9.75 m3, and were arranged in parallel with 3.4 m spacing in-between the collectors. The flow rate of the heating medium (water) was set at 0.02 (L/s/m2). The collectors were directed towards the South (i.e., azimuth angle is 0°) and tilt with an angle of 53°. The tilted angle was optimized using a computer simulation program (PVSYST version 6.5.2 (Maison-Carrée 30, 1242 Satigny, Switzerland) and PVGIS online calculator) (Version 5.1, Energy Efficiency and Renewables, E. Fermi 2749, TP 450, I-21027 Ispra, Italy) based on the optimal angles vs. maximum SII that give the maximum output in both winter and summer. The piping layout was arranged with the hot water outlet piping shorter than the cold pipes to reduce heat loss.
The solar cooling absorption cycle is comprised of an auxiliary hot water tank, an absorption chiller, a cooling tower, with chilled ammonia used as a refrigerant, and ammonia used as an absorbent. The solar energy heats the water that was then sent to the auxiliary hot water tank which subsequently reached the absorber. In the absorber, heat is exchanged by convection with a cooling fluid leading to partial evaporation. This process transfers heat to the condenser where the heat gets rejected to produce saturated water. The water then flows through a throttling valve wherein the pressure is decreased in an isenthalpic process achieving the required cooling.

2.5. Process Performance and Energy Saving

There are several factors to consider when evaluating the performance of the boiler–solar water heating/cooling system, including life expectancy, integration into buildings, and heating performance under extreme conditions. The percentage thermal performance ( % η ) of the solar water heating system was determined using Equation (2). The energy efficiency curves were constructed from the instantaneous measured efficiencies based on average incident solar irradiation intensity (Savg w/m2), water flow rate (Qw), ambient temperature (Tam), water (Tw) temperature, and wind speed (Ws) [24,30,57].
% η =   C o l l e c t e d   p o w e r   s o l a r   i r r a d i a t i o n   i n t e n s i t y   = P c S I I =   m ˙ C p ( T o u t T i n ) I a v g . A
where Pc is the collected power (W), SII is the instantaneous solar irradiation intensity (W/m2), m ˙ is the water mass flow rate (kg/s), Cp is the specific heat of the water (J/kg·°C), Tout is the outlet temperature of the water leaving the collector, Tin is the inlet temperature of the water entering the collector, Iavg is the incident SII per unit area (W/m2), and A is the total area of the collector (m2). Due to the change in solar irradiation intensity during the day and to eliminate and exclude time dependencies, Equation (2) was integrated based on the average period time following Equation (3).
% η =     t 1 t 2 m ˙ C p ( T o u t T i n )   d t t 1 t 2 I a v g . A
The coefficient of performance of the solar cooling absorption cycle (COPcooling) [58,59] was determined using Equation (4).
C O P c o o l i n g     = f ( Q i ,   U ,   Δ T m ,   Q r ,   A ,   Q r e f )
where Q i is the absorbed solar energy (kJ) calculated using Equation (5)
Q i   =   I a v g . K c o l
where Kcol is the solar collector absorption coefficient calculated by multiplying the transmittance and absorption coefficient, U is the overall heat transfer coefficient of the collector expressed as U = N T U   C m i n A , and Δ T m is the log mean temperature calculated as per Equation (6).
Δ T m =   ( T h i T c o )   ( T h o T c i ) ln { ( T h i T c o ) ( T h o T c i ) }
Qr is the heat removed from a cold room was calculated using Equation (7).
Q r = m p c p ( T R o o m   T R i f )
Qref is the heat removed by refrigerant calculated using Equation (8).
Q r e f = m e Δ h
where me is the flow rate of refrigerant (ammonia) and Δ h is the change in cooling fluid enthalpy. The cooling efficiency ( η cooling ) was calculated using Equation (9)
η cooling   =   C O P A c t u a l   C O P S y s t e m    
The percentage of energy-saving in solar water heating/cooling (%Es) was calculated using Equation (10).
( % E s ) = Energy   collected   from   F PSCs   T o t a l   r e q y u i r e d   I n p u t   e n e r g y  

2.6. Economic Analysis

The economic analysis of the combined boiler–solar water heating/cooling system is based on the payback period of the system using cumulative cash flow (CCF) and cumulative discounted cash flow (CDCF) at an interest rate of 2%. These two parameters are significantly influenced by the inputs and data employed. The data that was collected throughout this study was incorporated into the economic model and used to determine the saving that was achieved by the combined solar–conventional system.

3. Results and Discussion

3.1. Economic Analysis

Figure 3a presents the cost of fuel when the boiler was operated alone, monthly cost-saving for combined boiler–solar water heating, and the percentage saving the boiler alone in comparison to the combined boiler–solar water heating. The economic analysis regarding the use of solar energy in the combined boiler–solar water heating/cooling system to substantially reduce energy costs based on the fixed capital (FC) and operating cost. As such, it is important to note that heating of the building represents a complex trade-off between different parameters including the building architect, insulation, surface area, and the number of doors and windows. Although the fixed capital cost of the heating system represents only a small portion of the building’s total cost, poor management of this system can lead to unnecessary costs. The proposed heating system uses solar energy that can effectively supply the required energy nearly free of cost. The solar energy system can be used for heating purposes with minimal support from the boiler system. The primary difference between the winter and summer months is because of the low energy demand for heating in the summer. The total annual amount of the fuel required for space heating of the building and to supply the domestic hot water was determined to be 15.67 m3. Given that the fuel price in Jordan is 0.42 JD/L ($0.59/L), the annual cost of heating using the conventional boiler was determined to be 6581.5 JD ($9279.90). Using the combined boiler–solar water heater system decreased the heat duty of the boiler. It was observed that the boiler was not operational during the period between April–November as the generated energy in the solar water heater was sufficient to provide the required energy demand. The total annual fuel consumption for the combined boiler–solar heater decreased to 7.03 m3 achieving a 55% (3629 JD) annual saving in fuel cost. The savings can be used to cover the installation cost of the system. Moreover, the harnessed solar energy reduced fuel consumption in the LMTP (January, February, November, and December).
The combined system achieved fuel cost savings of 40, 43, and 50% in January, February, and March. Additionally, the savings increased to 55.6% in April and reached up to 99.9% from May to September. The savings ranged from 60 to 90% from October to December. Figure 3a demonstrates that the solar system provides the required energy for the hot water supply in the MTPM and the HTPM without the need for the boiler. Similarly, the LTPM heating requirements were supported by the solar system. The percentage of energy-saving reported in the present study is higher than the results reported by Abd-ur-Rehman and Al-Sulaiman [47] who reported 50% savings in electrical energy demand by using domestic solar water heating (SWH) in ten different cities in Saudi Arabia. Sami et al. [44], showed that solar energy production reached a maximum value in August and then decreased to a minimum in December–January in different zones of Algeria. The observed behavior was related to the influence of the meteorological quantities in each zone mainly the temperature and solar irradiation. Kalogirou [56] reported up to 70% saving for electricity by using the solar energy system
Figure 3b illustrates the monthly fuel cost required for space heating and domestic hot water using the conventional boiler and integrated boiler–solar water heating system. The combined system exhibited significant fuel cost savings that were required for hot water supply and heating services. The fuel cost for heating was reduced from $1657.60, $1049.30, and $1296.20 to $994.50, $629.60, and $648.10 in January, February, and March, respectively, which achieved >50% saving. Similar trends were observed for the fuel cost required to supply hot water. The cost went from $184.20, $116.60, and $144.00 to $110.50, $70.00, and $72.00, respectively, for the aforementioned three-month period. Moreover, it was observed that the boiler was non-operational during the period from mid-April to mid-October, as all of the required hot water was provided by the solar system. As such, the total fuel cost for heating and hot water to the specified building was significantly decreased. The previous cost analysis was based on a fixed price of fuel cost, considering the expected energy inflation rate of 3.58% and the difference in interest rate between the nominal and inflation rate (~ of 1.75%), the saving is expected to be 1.1-fold higher.

3.2. Solar Cooling

The potential use of the solar system combined with the absorption chiller was investigated in the HTPM and the MTPM as this is the period that required building cooling. The results indicated that both the ambient temperature and solar irradiation intensity directly affect the system’s cooling performance. Increasing the SIIavg.,d from 1450 ± 20 to 8100 ± 90 Kwh/m2/day improved the efficiency of the solar cooling system from 45% to 55%. This occurred because the SIIavg.,d has a direct effect on the evaporation of the refrigerant which subsequently enhanced the heat removal from the building and improved the system’s cooling performance. The highest efficiency that the system achieved was 55% with an SII of 8100 ± 90 Kwh/m2/day, which confirms the potential of the solar cooling system to achieve the required cooling in the building. At solar radiation of 1800 ± 35 and 3950 ± 20 kWh/m2/day—representing the average solar radiation in Jordan during the MTPM and the HTPM—the cooling rate of the system was calculated to be at 22.5 and 30.1 kW/m2, respectively. The ambient temperature (Tamb) exemplified a negligible effect on the efficiency and cooling rate of the solar system. The unit efficiency and cooling rates decreased from 55%, and 30.9 kW/m2 to 53% and 26.9 kW/m2 as the Tamb correspondingly decreased from 35 to 25 °C. Results demonstrated that increasing the Tamb simultaneously increased the temperature of the components of the system (temperature of cooling fluids, glass temperature, and the inlet of the evaporator); also improving the performance of the refrigeration cycle by enhancing the evaporation of the refrigerant, which is a key parameter in the cooling cycle. Furthermore, it was observed that (a) as the Tamb increased the heat loss from the system reduced and the performance and cooling capacity of the system similarly increased, and that (b) as the Tamb increased the temperature components of the system steadily increased at approximately the same rate.
Figure 4 highlights the evolution of the absorption chiller’s efficiency (%Echiller) and the COPcooling of the cooling process as a function of the generator inlet temperature and ambient temperature. As such, it was observed that the percentage of energy saving of the chiller (%Echiller) decreased by increasing the heat source temperature and cooling water supply temperature. This is advantageous for the proposed process as it is expected that the temperature will be high in both the MTPM and the HTPM. The obtained results are compatible with similar cooling units presented by Aman et al. [47]. By maximizing the efficiency of the ammonia–water absorption chiller—even at a low solar irradiation temperature—the cooling system is enhanced and there is a distinct improvement in the residential air conditioning. The obtained results indicated that the cooling cycle is more thermodynamically efficient at a low absorption temperature (i.e., Tamb) rather than high-temperature heat sources. Sencan et al. [21] explained this trend by relating input energy to energy losses. Increasing the input solar energy to the cooling system can increase the energy loss, ultimately leading to a significant decrease in the observed performance. However, the absorption of the chiller exhibited better performance with lower chilled-water temperatures because of the high potential to create a cooling effect at lower temperatures. It was observed that the maximum Echiller of 91.5% and a COP of 61.5 were achieved at an inlet generator temperature of 65 °C and an inlet ambient temperature of 25 °C. These results are consistent with those presented by Sencan et al. [21]. Though, the Echiller and COP changed with evaporator outlet temperatures. A temperature higher than 40 °C significantly decreased the COP.
The energy savings were determined based on the decrease in electrical energy consumption use of the air condition operation. The total cost of electricity during the MTPM and the HTPM were determined using historical data from previous years (2340 JD or $3299). Using the solar cooling system greatly reduced the need for the conventional air conditioner system and reduced the total cost to 1218 JD ($1717) which is an overall saving of 48%. Figure 5 demonstrates that the solar cooling system can cover up to 53% of the electrical requirement in the HTPM and 45% in the MTPM. The cost of electricity decreased from roughly $360–420/month to $191–216/month. This represents a considerable saving in fuel consumption, as well as reduces the amount of CO2 emissions released into the atmosphere (which is to be discussed further in the following section).

3.3. CO2 Emission Benefit

The combined boiler–solar heating/cooling system is a viable solution to reduce the emission of CO2 into the atmosphere. The reduction in CO2 emissions was estimated using Equation (9), as proposed by the International Energy Agency [60].
Mass of CO2 (kg) = 0.95 × Energy requirement production (in Kwh)
Results indicated that the combined boiler–solar heating/cooling system reduced the CO2 emissions by 53%. The estimated CO2 emissions decreased from 3.5 ton/year with the conventional heating/cooling system to 1.64/ton/year with the combined system. The integrated boiler–solar heating/cooling system, which substantially reduces the energy cost, decreases the need for fossil fuels for domestic use and space heating, as well as lowers the cost of electricity that is used to heat the water. If a widespread implementation of this solar heating/cooling system occurs, the significant reduction in CO2 emissions will have a major contribution to environmental sustainability and clean air. Martinopoulos and Tsalikis showed that the use of a solar water heater system resulted in decreasing the annual CO2 emission in two Greek cities, Thessaloniki, and Athens by 50 to 58 t. Although the CO2 emissions from building and single houses might look insignificant (≤1.8 tCO2/year), using a solar water heating/cooling system could contribute to the global GHG emission which must be taken into consideration. Kalogirou [56] confirmed this by showing a total reduction of 160,835 t of CO2 by implementing a solar heating system in Cyprus. Solar water heating system showed a CO2 emission reduction in the range of 15 to 28% in 10 cities of Saudi Arabia [47].

3.4. Cost Analysis and Payback Period

The total cost of the system was calculated using the initial cost of the system, including installation costs and accessories. The initial cost for each piece of 2 m2 was $500. The installation cost was 10% of the total initial cost and the accessories cost was 5% of the total initial cost. Thus, the cost of the collectors, installation, accessories, and total overall cost were estimated to be $16,000, $1600, $1043, and $18,650, respectively.
Figure 6 present the cumulative cash flow (CCF) and cumulative discounted cash flow (CDCF) at an interest rate of 2%. Although the project was built with an industrial loan with an interest rate of 2%, the CDCF indicates that the price of the system can be recovered within 55 months (4.23 years). The reduced dependency on fossil fuels, the reduction in CO2 emissions, and the overall cost recovery make this project highly sustainable and desirable. The calculated payback period is in good agreement with different studies carried out in middle eastern and African countries. The reported payback period was 4.5 year or project installed in Greece [46], 3 to 6 years in Saudi Arabia [47], and 2.7 years in Cyprus [56].
The economic analysis of the same combined boiler–solar water heating/cooling system was analyzed in different climate zones (Romania and Algeria), the weather data were extracted from the work of Sami et al. [44] and Paraschiv et al. [61]. The CCF analysis of the system showed a payback period of 6.5 and 3.5 years in Romania and Algeria, respectively. It is likely that the low temperature profile (−10 to 23 °C) and limited solar irradiation (1.320 to 1.410 kWh/m2) in Romania compared with Algeria (9.6 to 33 °C and 6.2 to 6.7 kWh/m2 and in Jordan (9.6 to 38 °C and 4.6 to 7.3 kWh/m2) contributed to the long payback period. In addition, it was observed that the contribution of solar cooling to the process economy in Romania is limited due to very low temperature even in summer.

4. Conclusions

This techno-economic study demonstrated that the combined conventional boiler–solar water heating/cooling system can provide space heating/cooling and domestic water supply to private and public buildings. Furthermore, the integrated system significantly reduced the cost of a rising energy bill and greatly reduced the need for fossil fuels, while also contributing to a reduction in CO2 emissions (of approximately 53%). Moreover, under the studied solar irradiation intensities, the solar heating/cooling system achieved an excellent efficiency of 55 and 73%, respectively. The reported fuel savings and GHG emissions reduction by implementing solar water heating/cooling technology showed significant economic and eco-environmental benefits. The CO2 reduction per house can contribute to the global CO2 footprints reduction and reserves fossil fuel supply. The economic analysis showed that the combined system is a cost-effective solution—with a payback period of 4.5 years—that reduced the fuel cost for space heating and cooling by 55 and 48%, respectively. Lastly, the combined system provided free hot water during the whole year that it was operational. It is highly recommended to establish a government financial incentive program to support this important energy sector. Providing carbon tax benefits to individuals, lowering the capital cost, availability of local supplier are the major factors influencing the popularization of this system

Author Contributions

The corresponding author Fares AlMomani confirms the contributions of the authors to this manuscript were as follow: M.A.-S.: Conceptualization, Methodology, Modeling, and experimental trial, M.S.: Conceptualization, Methodology, Modeling, Figures preparation, software, pre-Writing-Original draft preparation and F.A.: Figures preparation, software, pre-Writing-Original draft preparation, data manipulation, kinetics Data curation, Discussion, Validation, Tables preparation Writing-Reviewing and Editing. All authors have read and agreed to the published version of the manuscript.

Funding

The APC was funded by Qatar University, International Research Collaboration Co-funds (IRCC-2020-011).

Acknowledgments

The authors acknowledge the financial support from Qatar University, International Research Collaboration Co-funds (IRCC-2020-011). The statements made herein are solely the responsibility of the authors. The APC was funded by Qatar University, International Research Collaboration Co-funds (IRCC-2020-011).

Conflicts of Interest

The authors declare no conflict of interest.

Nomenclature

QiAbsorbed solar energy (kJ)
TamAmbient temperature (°C)
TavAverage annual temperature (°C)
SIIavg.,dAverage daily solar irradiation intensity (Kwh/m2/day)
tsun,mAverage monthly number of sunny hours (h)
Tavg., mAverage monthly temperature (°C)
COPcoolingCoefficient of performance of the solar cooling absorption cycle
Pc Collected power (W),
η cooling   Cooling efficiency (%)
CCF Cumulative cash flow
CDCFCumulative discounted cash flow
DTCDifferential temperature controller
me Flow rate of refrigerant (L/s)
FHRHeat removal factor
Qref Heat removed by refrigerant (kJ)
Qr Heat removed from a cold room (kJ)
HTPMHigh temperature profile months
Iavg Incident solar irradiation per unit area (W/m2)
Ti inlet temperature of the water entering the collector (°C)
Δ T m Log mean temperature (K)
LTPMLow temperature profile months
MTPMMedium temperature profile months
Tout Outlet temperature of water leaving the collector (°C)
UF-PSCOverall heat loss coefficient (W/m2K)
U Overall heat transfer coefficient (W/(m2K))
%EsPercentage energy saving (%)
%EchillerPercentage of energy saving of the chiller (%)
Percentage thermal performance (%)
T R i f Refrigerant Temperature (°C)
T R o o m Room Temperature (°C)
KcolSolar collector absorption coefficient
SIISolar irradiation intensities (W/m2)
Cp Specific heat of the water (J/kg.°C),
∆hThe enthalpy cooling fluid (kJ/kg)
A Total area of the collector (m2).
QwWater flow rate (L/s)
m ˙ Water mass flow rate (kg/s)
TwWater temperature (°C)
Wswind speed (m/s)

References

  1. Al-Qodah, Z.; Al-Shannag, M.; Amro, A.; Assirey, E.; Bob, M.; Bani-Melhem, K.; Alkasrawi, M. Impact of surface modification of green algal biomass by phosphorylation on the removal of copper(II) ions from water. Turk. J. Chem. 2017, 41, 190–208. [Google Scholar] [CrossRef]
  2. Al-Shannag, M.; Al-Qodah, Z.; Nawasreh, M.; Al-Hamamreh, Z.; Bani-Melhem, K.; Alkasrawi, M. On the performance of Ballota undulata biomass for the removal of cadmium(II) ions from water. Desalin. Water Treat. 2017, 67, 223–230. [Google Scholar] [CrossRef]
  3. Abdelsalam, E.; Kafiah, F.; Tawalbeh, M.; Khraisheh, M.; Azzam, A.; Alzoubi, I.; Alkasrawi, M. Performance analysis of hybrid solar chimney–power plant for power production and seawater desalination: A sustainable approach. Int. J. Energy Res. 2020. [Google Scholar] [CrossRef]
  4. Almomani, F.; Al Ketife, A.; Judd, S.; Shurair, M.; Bhosale, R.R.; Znad, H.; Tawalbeh, M. Impact of CO2 concentration and ambient conditions on microalgal growth and nutrient removal from wastewater by a photobioreactor. Sci. Total. Environ. 2019, 662, 662–671. [Google Scholar] [CrossRef] [PubMed] [Green Version]
  5. Znad, H.; Al Ketife, A.M.; Judd, S.; Almomani, F.; Vuthaluru, H.B. Bioremediation and nutrient removal from wastewater by Chlorella vulgaris. Ecol. Eng. 2018, 110, 1–7. [Google Scholar] [CrossRef]
  6. Mohammed, H.; Al-Othman, A.; Nancarrow, P.; Tawalbeh, M.; Assad, M.E.H. Direct hydrocarbon fuel cells: A promising technology for improving energy efficiency. Energy 2019, 172, 207–219. [Google Scholar] [CrossRef]
  7. Bhosale, R.R.; Kumar, A.; Khraisheh, M.; Ghosh, U.; AlNouss, A.; Scheffe, J.; Gupta, R.B. CO2 Capture Using Aqueous Potassium Carbonate Promoted by Ethylaminoethanol: A Kinetic Study. Ind. Eng. Chem. Res. 2016, 55, 5238–5246. [Google Scholar] [CrossRef]
  8. Ashok, A.; Kumar, A.; Bhosale, R.; Saad, M.A.S.; Khraisheh, M.; Tarlochan, F. Study of ethanol dehydrogenation reaction mechanism for hydrogen production on combustion synthesized cobalt catalyst. Int. J. Hydrogen Energy 2017, 42, 23464–23473. [Google Scholar] [CrossRef]
  9. Al-Smairan, M.H. Investigation of a Hybrid Wind-Photovoltaic Electrical Energy System for a Remote Community. Ph.D. Thesis, Coventry University, Coventry, UK, 2006. [Google Scholar]
  10. Baumeister, C.; Kilian, L. Forty Years of Oil Price Fluctuations: Why the Price of Oil May Still Surprise Us. J. Econ. Perspect. 2016, 30, 139–160. [Google Scholar] [CrossRef] [Green Version]
  11. Al-Maamary, H.M.; Kazem, H.A.; Chaichan, M.T. The impact of oil price fluctuations on common renewable energies in GCC countries. Renew. Sustain. Energy Rev. 2017, 75, 989–1007. [Google Scholar] [CrossRef]
  12. Khatib, H. Oil and natural gas prospects: Middle East and North Africa. Energy Policy 2014, 64, 71–77. [Google Scholar] [CrossRef]
  13. Bhattacharyya, S.C.; Timilsina, G.R. Modelling energy demand of developing countries: Are the specific features adequately captured? Energy Policy 2010, 38, 1979–1990. [Google Scholar] [CrossRef]
  14. Akash, B.A.; Mohsen, M.S. Current situation of energy consumption in the Jordanian industry. Energy Convers. Manag. 2003, 44, 1501–1510. [Google Scholar] [CrossRef]
  15. Al-Ghandoor, A. Evaluation of energy use in Jordan using energy and exergy analyses. Energy Build. 2013, 59, 1–10. [Google Scholar] [CrossRef]
  16. Al-Ghandoor, A.; Al-Hinti, I.; Jaber, J.; Sawalha, S. Electricity consumption and associated GHG emissions of the Jordanian industrial sector: Empirical analysis and future projection. Energy Policy 2008, 36, 258–267. [Google Scholar] [CrossRef]
  17. Al-Bajjali, S.K.; Shamayleh, A.Y. Estimating the determinants of electricity consumption in Jordan. Energy 2018, 147, 1311–1320. [Google Scholar] [CrossRef]
  18. Siddiqi, A.; Anadón, L.D. The water–energy nexus in Middle East and North Africa. Energy Policy 2011, 39, 4529–4540. [Google Scholar] [CrossRef]
  19. Taib, M. The mineral industry of Jordan. In Minerals Yearbook: Area Reports: International Review 2012 Africa and the Middle East; U.S. Geological Survey: Reston, VA, USA, 2015; Volume 3, p. 43. [Google Scholar]
  20. Hrayshat, E.S. Oil Shale—An Alternative Energy Source for Jordan. Energy Sources Part A 2008, 30, 1915–1920. [Google Scholar] [CrossRef]
  21. Ali, H.H.; Al Nsairat, S.F. Developing a green building assessment tool for developing countries–Case of Jordan. Build. Environ. 2009, 44, 1053–1064. [Google Scholar] [CrossRef]
  22. Badeeb, R.A.; Lean, H.H.; Clark, J. The evolution of the natural resource curse thesis: A critical literature survey. Resour. Policy 2017, 51, 123–134. [Google Scholar] [CrossRef]
  23. Mason, M.; Al-Muhtaseb, M.A.; Al-Widyan, M. The Energy Sector in Jordan–Current Trends and the Potential for Renewable Energy. In Renewable Energy in the Middle East; Springer Science and Business Media LLC: Berlin/Heidelber, Germany, 2009; pp. 41–54. [Google Scholar]
  24. Al-Salaymeh, A.; Al-Rawabdeh, I.; Emran, S. Economical investigation of an integrated boiler–solar energy saving system in Jordan. Energy Convers. Manag. 2010, 51, 1621–1628. [Google Scholar] [CrossRef]
  25. Mohammed, H.; Al-Othman, A.; Nancarrow, P.; Elsayed, Y.; Tawalbeh, M. Enhanced proton conduction in zirconium phosphate/ionic liquids materials for high-temperature fuel cells. Int. J. Hydrogen Energy 2019. [Google Scholar] [CrossRef]
  26. Mamlook, R.; Akash, B.A.; Nijmeh, S. Fuzzy sets programming to perform evaluation of solar systems in Jordan. Energy Convers. Manag. 2001, 42, 1717–1726. [Google Scholar] [CrossRef]
  27. Badran, O. Study in industrial applications of solar energy and the range of its utilization in Jordan. Renew. Energy 2001, 24, 485–490. [Google Scholar] [CrossRef]
  28. Al-Soud, M.S.; Hrayshat, E.S. A 50 MW concentrating solar power plant for Jordan. J. Clean. Prod. 2009, 17, 625–635. [Google Scholar] [CrossRef]
  29. Al-Nimr, M.A.; Kiwan, S.; Sharadga, H. Simulation of a novel hybrid solar photovoltaic/wind system to maintain the cell surface temperature and to generate electricity. Int. J. Energy Res. 2018, 42, 985–998. [Google Scholar] [CrossRef]
  30. Hernandez, P.; Kenny, P. Net energy analysis of domestic solar water heating installations in operation. Renew. Sustain. Energy Rev. 2012, 16, 170–177. [Google Scholar] [CrossRef]
  31. Ruicheng, Z.; Tao, H.; Xinyu, Z.; Zhulian, H.; Yu, D. Developing Situation and Energy Saving Effects for Solar Heating and Cooling in China. Energy Procedia 2012, 30, 723–729. [Google Scholar] [CrossRef] [Green Version]
  32. Xuan, W.; Min, W.; Tao, H.; Ruicheng, Z.; Zhong, L.; Xinyu, Z.; Airong, F. Simulation of Annual Energy Saving Benefit of Solar Collector. Energy Procedia 2012, 30, 172–176. [Google Scholar] [CrossRef] [Green Version]
  33. Birdsall, B.; Buhl, W.F.; Ellington, K.L.; Erdem, A.E.; Winkelmann, F.C. Overview of the DOE-2 Building Energy Analysis Program, Version 2.1 D; Lawrence Berkeley National Laboratory: Berkeley, CA, USA, 1990. [Google Scholar]
  34. Winkelmann, F.C.; Selkowitz, S. Daylighting simulation in the DOE-2 building energy analysis program. Energy Build. 1985, 8, 271–286. [Google Scholar] [CrossRef] [Green Version]
  35. Crawley, D.B.; Lawrie, L.K.; Winkelmann, F.C.; Pedersen, C.O. EnergyPlus: New Capabilities in a Whole-Building Energy Simulation Program. In Proceeding of the 7th International IBPSA Conference, Rio de Janeiro, Brazil, 13–15 August 2001; pp. 51–58. [Google Scholar]
  36. Fisher, D.E.; Pedersen, C.O. Convective Heat Transfer in Building Energy and Thermal Load Calculations; American Society of Heating, Refrigerating and Air-Conditioning Engineers: Atlanta, GA, USA, 1997. [Google Scholar]
  37. Pagliarini, G.; Corradi, C.; Rainieri, S. Hospital CHCP system optimization assisted by TRNSYS building energy simulation tool. Appl. Therm. Eng. 2012, 44, 150–158. [Google Scholar] [CrossRef]
  38. Asadi, E.; Da Silva, M.G.; Antunes, C.H.; Dias, L. A multi-objective optimization model for building retrofit strategies using TRNSYS simulations, GenOpt and MATLAB. Build. Environ. 2012, 56, 370–378. [Google Scholar] [CrossRef]
  39. Shariah, A.; Tashtoush, B.; Rousan, A. Cooling and heating loads in residential buildings in Jordan. Energy Build. 1997, 26, 137–143. [Google Scholar] [CrossRef]
  40. Yin, Y.; Song, Z.; Li, Y.; Wang, R.; Zhai, X. Experimental investigation of a mini-type solar absorption cooling system under different cooling modes. Energy Build. 2012, 47, 131–138. [Google Scholar] [CrossRef]
  41. Xu, Z.; Wang, R.; Wang, H. Experimental evaluation of a variable effect LiBr–water absorption chiller designed for high-efficient solar cooling system. Int. J. Refrig. 2015, 59, 135–143. [Google Scholar] [CrossRef]
  42. Lin, L.; Tian, Y.; Luo, Y.; Chen, C.; Jiang, L. A novel solar system integrating concentrating photovoltaic thermal collectors and variable effect absorption chiller for flexible co-generation of electricity and cooling. Energy Convers. Manag. 2020, 206, 112506. [Google Scholar] [CrossRef]
  43. Martinopoulos, G.; Tsalikis, G. Diffusion and adoption of solar energy conversion systems—The case of Greece. Energy 2018, 144, 800–807. [Google Scholar] [CrossRef]
  44. Sami, S.; Semmar, D.; Hamid, A.; Mecheri, R.; Yaiche, M. Viability of integrating Solar Water Heating systems into High Energy Performance housing in Algeria. Energy 2018, 149, 354–363. [Google Scholar] [CrossRef]
  45. Benli, H. Potential application of solar water heaters for hot water production in Turkey. Renew. Sustain. Energy Rev. 2016, 54, 99–109. [Google Scholar] [CrossRef]
  46. Martinopoulos, G.; Tsalikis, G. Active solar heating systems for energy efficient buildings in Greece: A technical economic and environmental evaluation. Energy Build. 2014, 68, 130–137. [Google Scholar] [CrossRef]
  47. Abd-Ur-Rehman, H.M.; Al-Sulaiman, F.A. Optimum selection of solar water heating (SWH) systems based on their comparative techno-economic feasibility study for the domestic sector of Saudi Arabia. Renew. Sustain. Energy Rev. 2016, 62, 336–349. [Google Scholar] [CrossRef]
  48. Shirazi, A.; Taylor, R.A.; White, S.D.; Morrison, G.L. A systematic parametric study and feasibility assessment of solar-assisted single-effect, double-effect, and triple-effect absorption chillers for heating and cooling applications. Energy Convers. Manag. 2016, 114, 258–277. [Google Scholar] [CrossRef]
  49. Djelloul, A.; Draoui, B.; Moummi, N. Simulation of a solar driven air conditioning system for a house in dry and hot climate of Algeria. Courr. Savoir 2013, 15, 31–39. [Google Scholar]
  50. Alrwashdeh, S.S.; Alsaraireh, F.M.; Saraireh, M.A. Solar radiation map of Jordan governorates. Int. J. Eng. Technol. 2018, 7, 1664–1667. [Google Scholar] [CrossRef]
  51. Kiwan, S.; Venezia, L.; Montagnino, F.; Paredes, F.; Damseh, R. Techno-Economic Analysis of a Concentrated Solar Polygeneration Plant in Jordan. JJMIE 2018, 12, 1–6. [Google Scholar]
  52. Alrwashdeh, S.S.; Alsaraireh, F.M. Investigation of solar radiation distribution over three zones north, middle and south of Jordan. Int. J. Eng. Technol. 2018, 7, 5047–5050. [Google Scholar]
  53. Kong, W.; Wang, Z.; Fan, J.; Perers, B.; Chen, Z.; Furbo, S.; Andersen, E. Investigation of Thermal Performance of Flat Plate and Evacuated Tubular Solar Collectors According to a New Dynamic Test Method. Energy Procedia 2012, 30, 152–161. [Google Scholar] [CrossRef] [Green Version]
  54. Al-Salaymeh, A.; Al-Salaymeh, M.; Rabah, M.; Abdelkader, M. Enhancement of the coefficient of performance in air conditioning systems by utilizing free cooling. In Proceeding of the 2nd International Conference on Thermal Engineering Theory and Applications, Al Ain, UAE, 3–6 January 2006; pp. 3–6. [Google Scholar]
  55. Rojas, D.; Beermann, J.; Klein, S.; Reindl, D. Thermal performance testing of flat-plate collectors. Sol. Energy 2008, 82, 746–757. [Google Scholar] [CrossRef]
  56. Kalogirou, S. Thermal performance, economic and environmental life cycle analysis of thermosiphon solar water heaters. Sol. Energy 2009, 83, 39–48. [Google Scholar] [CrossRef]
  57. Howell, J.R.; Bannerot, R.B.; Vliet, G.C. Solar-Thermal Energy Systems: Analysis and Design; Mcgraw-Hill College: New York, NY, USA, 1982. [Google Scholar]
  58. Stanciu, C.; Stanciu, D.; Gheorghian, A.-T. Thermal Analysis of a Solar Powered Absorption Cooling System with Fully Mixed Thermal Storage at Startup. Energies 2017, 10, 72. [Google Scholar] [CrossRef]
  59. Rahman, S.M.A.; Said, Z.; Issa, S. Performance evaluation and life cycle analysis of new solar thermal absorption air conditioning system. Energy Rep. 2020, 6, 673–679. [Google Scholar] [CrossRef]
  60. International Energy Agency. Emissions per kWh of Electricity and Heat Output; International Energy Agency: Paris, France, 2015. [Google Scholar]
  61. Paraschiv, S.; Bărbuţă-Mişu, N.; Paraschiv, L.S. Technical and economic analysis of a solar air heating system integration in a residential building wall to increase energy efficiency by solar heat gain and thermal insulation. Energy Rep. 2020, 6, 459–474. [Google Scholar] [CrossRef]
Figure 1. (a) Minimum and maximum ambient temperature distribution during different months in the study area (Mafraq); (b) The average daily solar irradiation intensity profile (SIIavg.,d) in the study area (Mafraq); (c) Thermal performance ( % η ) the overall heat loss coefficient (UF-PSC), and heat removal factor (FHR) for the F-PSC; (d) Average number of sunny hours (tsun,m) per month for the study area, (e) Optimization of tilt and azimuth angles of the solar collectors and (f) monthly average heating/cooling loads of the building.
Energies 14 00001 g001
Figure 2. Block flow diagram of the combined boiler–solar water heating/cooling system.
Energies 14 00001 g002
Figure 3. Energy cost analysis (a) The cost of heating using boiler alone and combined boiler–solar water heater, and (b) Monthly fuel cost of domestic hot water and space heating using boiler alone and combined boiler–solar water heater.
Energies 14 00001 g003
Figure 4. Evolution of the absorption chiller’s efficiency (Echiller) and the coefficient of performance (COP) of the cooling process as a function of (a) Generator inlet temperature, and (b) Ambient.
Energies 14 00001 g004
Figure 5. The monthly cost of space cooling using air-conditioner (AC) and combined AC-solar cooling system.
Energies 14 00001 g005
Figure 6. Cumulative cash flow (CCF) and cumulative discounted cash flow (CDCF) at an interest rate of 2%.
Energies 14 00001 g006aEnergies 14 00001 g006b
Table 1. Building heat transfer parameters and the input to TRNSYS 14.1 program.
Building Heat Transfer ParametersValue (Std. Dev.)
Absorbance of the building (α)0.55 ± 0.05 (1.20)
Average area of the windows 3.5 ± 0.05 (0.88)
Heat capacity of furniture (Cfur)2200 ± 20 (0.58) kJ/°C
Heat transfer coefficient of windows (hc,w)45 ± 5 (1.10) kJ/h.m2.°C
Heat loss coefficient through windows (Wl,win)25 ± 5 (2.5) kJ/h.m2.°C
Internal room diminution (L:W:H)12:8:3.5 m
Insight equipment heating duty (Qin)300 ± 30 (1.1) kJ/h
Internal reflection coefficient (Refin) 0.65 ± 0.06 (0.09)
Input to TRNSYS 14.1 programValue (Std. Dev.)
Heat capacity of air (Cair)2000 ± 20 (1.18) kJ/°C
Space heat gained- non-radiative (Qgain)500 ± 25 (0.88) kJ/h
Dehumidification coefficient (ωmax)0.55 ± 0.05 (0.19)
Humidification coefficient (ωmin)0.25 ± 0.05 (0.11)
Set point heating Temperature (TSp,C, °C)18 ± 0.5 (0.18)
Set point cooling Temperature (TSp,H, °C)27 ± 0.5 (0.18)
Radiation transmissivity of glass (Tg, °C)0.8
Wind Speed (Swind, m/s )3.5 ± 0.1 (0.23)
Std. Dev.—standard deviation.
Publisher’s Note: MDPI stays neutral with regard to jurisdictional claims in published maps and institutional affiliations.

