Article

Single-Chamber Microbial Fuel Cells’ Behavior at Different Operational Scenarios

1
Department of Chemical Engineering, American University of Sharjah, Sharjah 26666, UAE
2
Rochester Institute Technology, Dubai 341055, UAE
*
Author to whom correspondence should be addressed.
Energies 2020, 13(20), 5458; https://doi.org/10.3390/en13205458
Submission received: 13 September 2020 / Revised: 30 September 2020 / Accepted: 14 October 2020 / Published: 19 October 2020
(This article belongs to the Special Issue Technologies for Biofuels and Energy)

Abstract

:
A Microbial Fuel Cell (MFC) is a process in which a microorganism respires and captures the electrons that normally passes through the electron transport system of the organism and produces electricity. This work intends to present the different operating parameters affecting the efficiency of a Microbial Fuel Cell (MFC) process. To study the performance of the process, various materials for the cathode and anode rods with similar size and chape including, copper, aluminum, carbon cloth, steel and brass were considered to determine the combination that leads to the best results. Moreover, different oxidizing agents such as Copper Sulphate and Potassium Hexacyanoferrate were considered. Furthermore, the effects of shapes, sizes and distance between electrodes on the current and voltage were investigated. The power outputs between electrochemical and microbial cells were recorded. In addition, the power, whether expressed as voltage or current, was measured at different conditions and different cell combinations. The power is directly related to the area, volume of the bacterial solution and supplying air and stirring.

1. Introduction

It is well known that excessive burning of fossil fuels contributes to global warming and leads to the ever-existing energy crisis. Therefore, it has become an inevitability to develop renewable sources of energy that are eco-friendly and durable. In addition, wastewater emanating from various industries contains significant amounts of inorganic substances such as solvents and insoluble materials causing contamination of the environment if not well-treated [1]. As a result, and to track together the issues of the energy crisis and water pollution, fuel cell technology is a promising alternative to fossil fuels that could lead to a cleaner environment and reduced CO2 emissions [2]. Power devices convert the vitality contained in electron producing organic materials into electricity utilizing a chemical catalyst. With the help of biocatalysts, biological fuel cells (biofuel cells) can achieve the anodic, the cathodic or both reactions. This results in enzymatic power devices or Microbial Fuel Cells (MFCs).
A Microbial Fuel Cell (MFC) is a developing technique for the production of power via biodegradable organic matter using microorganisms [3]. Even though the concepts of creating electricity from microorganisms have been prevalent since 1911, there were not many practical applications of this process for around 55 years [3]. MFC is a device that uses bacteria, as a fuel source, to breakdown organic materials and thereby generate electricity. Living creatures metabolize food to provide them with energy [4]. In a single-celled microorganism, this process is rather an intricate one involving many enzyme-catalyzed reactions [5]. It involves successive oxidation-reduction changes, and in this manner resembles an electrochemical process [6]. The studies showed that electron transports (mediators) are required to convey electrons from inside the cell to the anode [
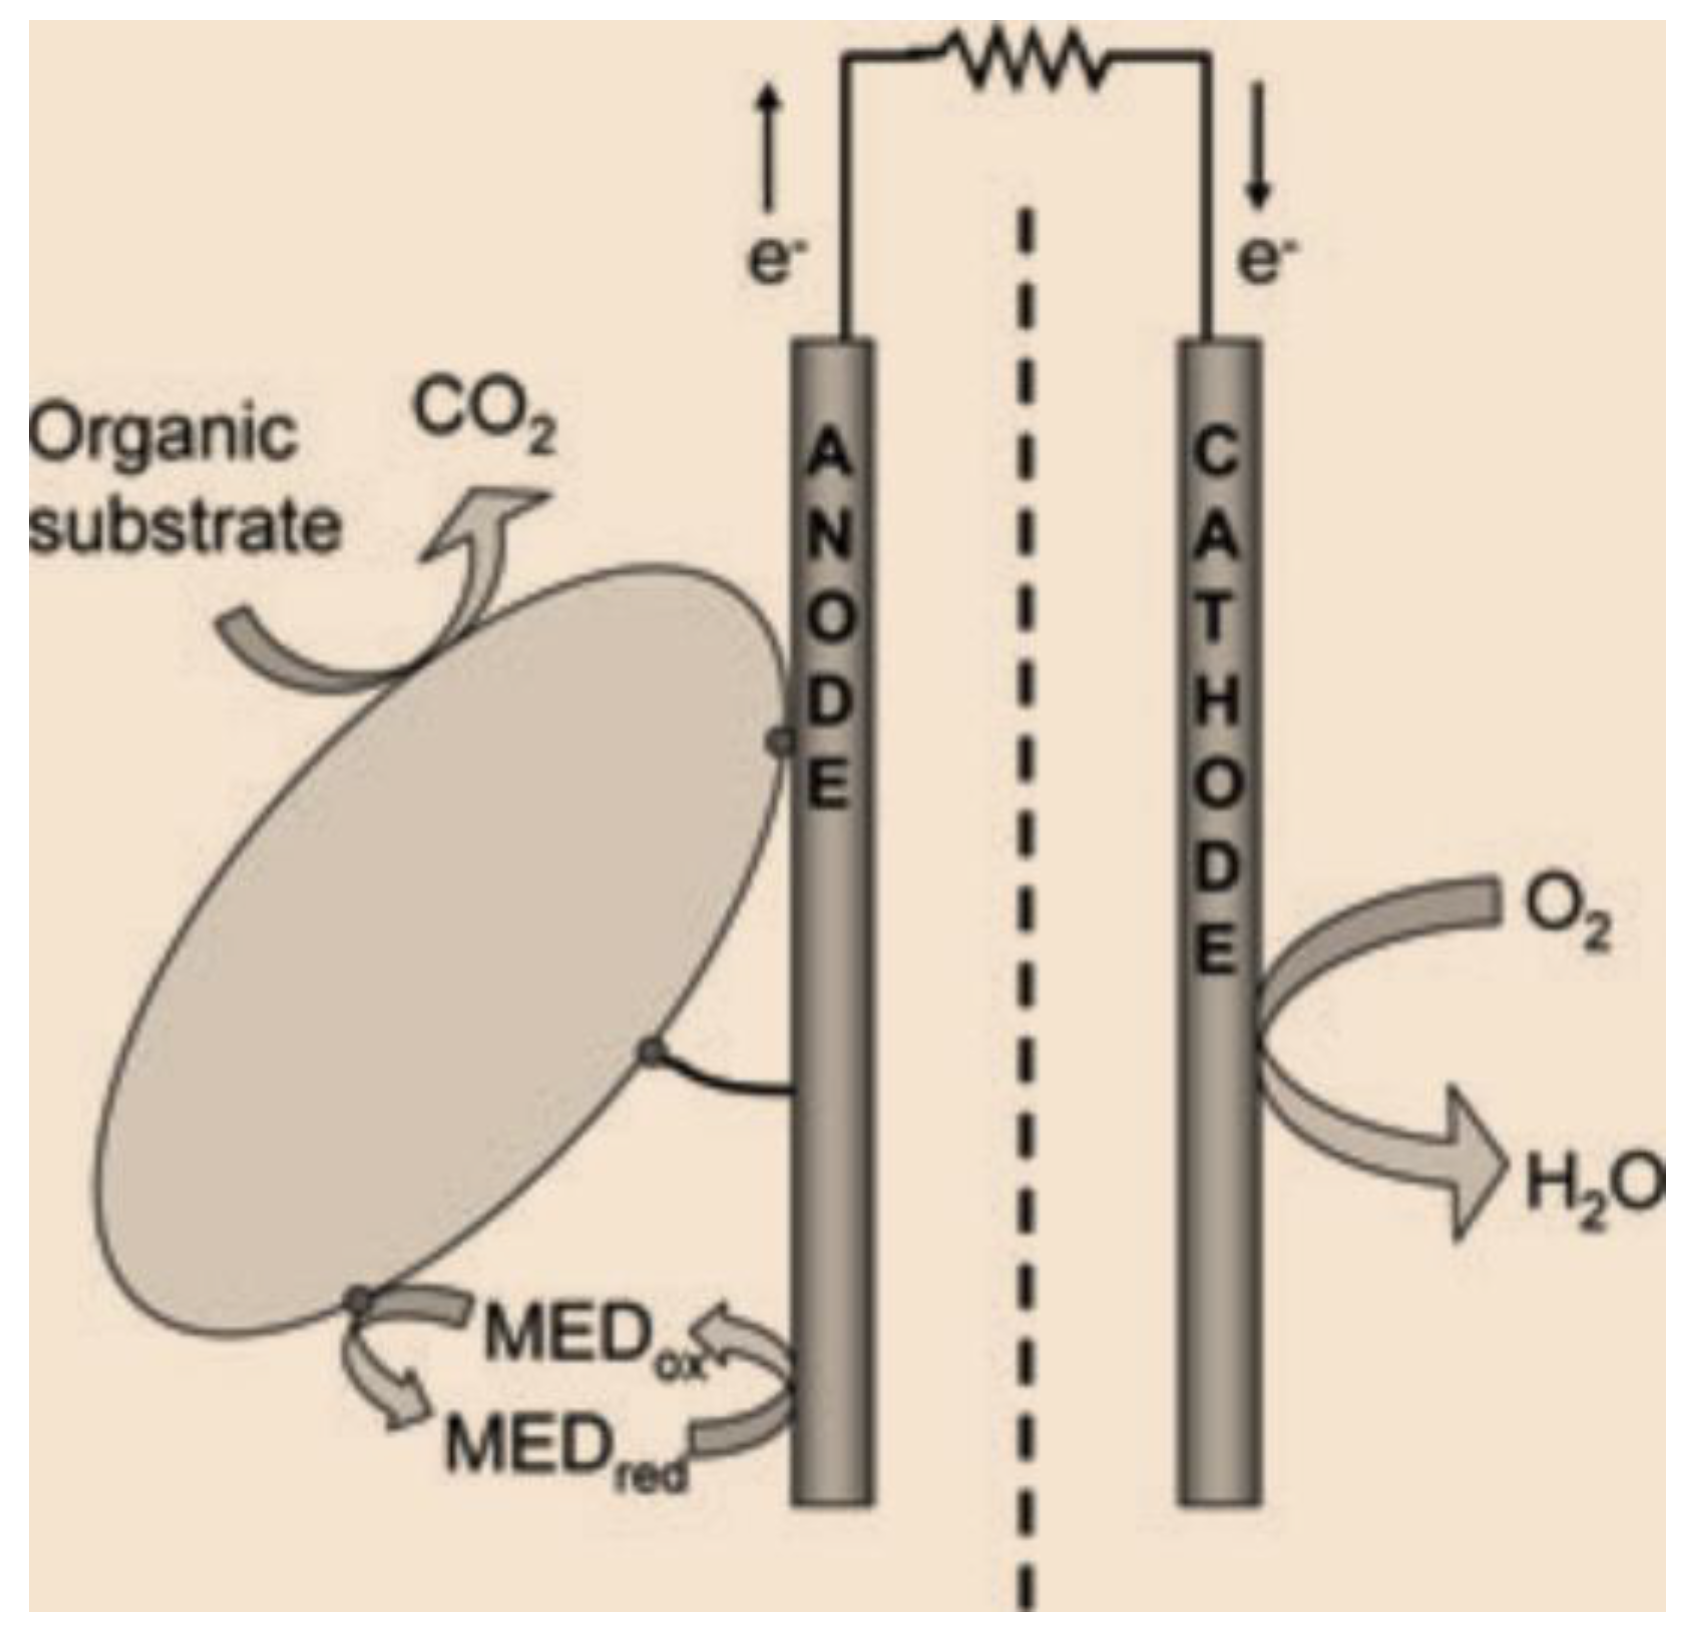
7]. A simple schematic representation of an MFC is shown in Figure 1.
The MFC is composed of two compartments, the cathode and the anode, separated by a conducting membrane. The microorganisms fed on the carbon substrate within the anode chamber. The electrons at the anode move through an external circuit to the cathode. To tolerate this process, electro-neutrality needs to be observed, i.e., transport of electrons to the cathode needs to be compensated by transport of an equal amount of positive charge to the cathode chamber [9]. The potential difference between the respiratory system and the cathode chamber produces a voltage and current which in turn gives bioelectricity [10].
The electrons produced during the respiratory cycle move through a sequence of respiratory enzymes in the cell, thus producing power in the form of ATP. These electrons within the cell are transferred and made available to the anode by mediators. Performance of MFC using three different mediators was investigated in terms of power density and internal resistance by Taskan et al. [11], where they used methylene blue (MB), neutral red (NR) and 2-hydroxy-1,4-naphthoquinone (HNQ) mediators at different concentrations and found that internal resistance changed with mediator concentration. However, certain bacteria called exoelectorgenic bacteria are capable of directly transferring the electrons outside the cell [7] without the mediator, in spite of the fact that they have been depicted utilizing different terms, for example, electrochemically dynamic microorganisms [12], anode respiring microscopic organisms and electricigens. A mediator-less microbial fuel cell was developed by Herrero-Hernandez et al. [13] using Escherichia coli bacteria and platinized titanium mesh as electrodes, producing a maximum power density of 627 mW m−2.
Though various kinds of microorganisms produce electrical current in MFCs, huge numbers of these strains show low power densities when developed as pure organisms [3]. It is thusly indistinct whether these microorganisms exist as exoelectrogenic oligotrophs among more quickly developing contenders, or whether a low degree of current generation gives some different advantages through interactions [14]. For instance, a Gram-positive bacterium (Brevibacillus sp. PTH1) that was copious in a blended network in an MFC created little force as an unadulterated culture except if a Pseudomonas sp. was additionally present or supernatant from an MFC with this bacterium was included [5]. Toczyłowska-Mamińska et al. [15] studied the bacterial communities that evolve in single-chamber air-cathode MFCs fed cellulose; they examined the changes in the bacterial consortium in an MFC fed cellulose over time and found that the most predominant bacteria shown to be capable electron generation was Firmicutes, with the fermenters decomposing cellulose Bacteroidetes.
It is trusted that one day MFC will be utilized as an individual technique for power generation; however, its latest applications are that of energy recovery during wastewater treatment and remote power production [16]. Through this energy recovery processes from wastewater, it is likely that this will guarantee the energy sustainability of the water foundation. It is assessed that local wastewater contains 9.3 times as much energy as that right now used to treat the wastewater through energy-intensive aeration-based processes [17]. The development of these MFCs, however, has its limitations. Practical full-scale MFC application in wastewater treatment and electricity production design has been long delayed by the instability of full-scale engineered systems, low achieved power densities and output voltages practically achievable so far [18]. Huggins et al. [19] attempted to directly compare the wastewater treatment efficiency and energy consumption and generation among three reactor systems—a traditional aeration process, a simple submerged MFC configuration and a control reactor acting similar as natural lagoons.
Many parameters can influence the efficiency of a microbial fuel cell. These may include, the rate of fuel oxidation and electron transfer to the anode by the microorganisms, the circuit resistance, the oxygen supply and the proton transport to the cathode through the membrane [20]. Furthermore, the type of electrode has significant effect of the performance of MFC [21,22,
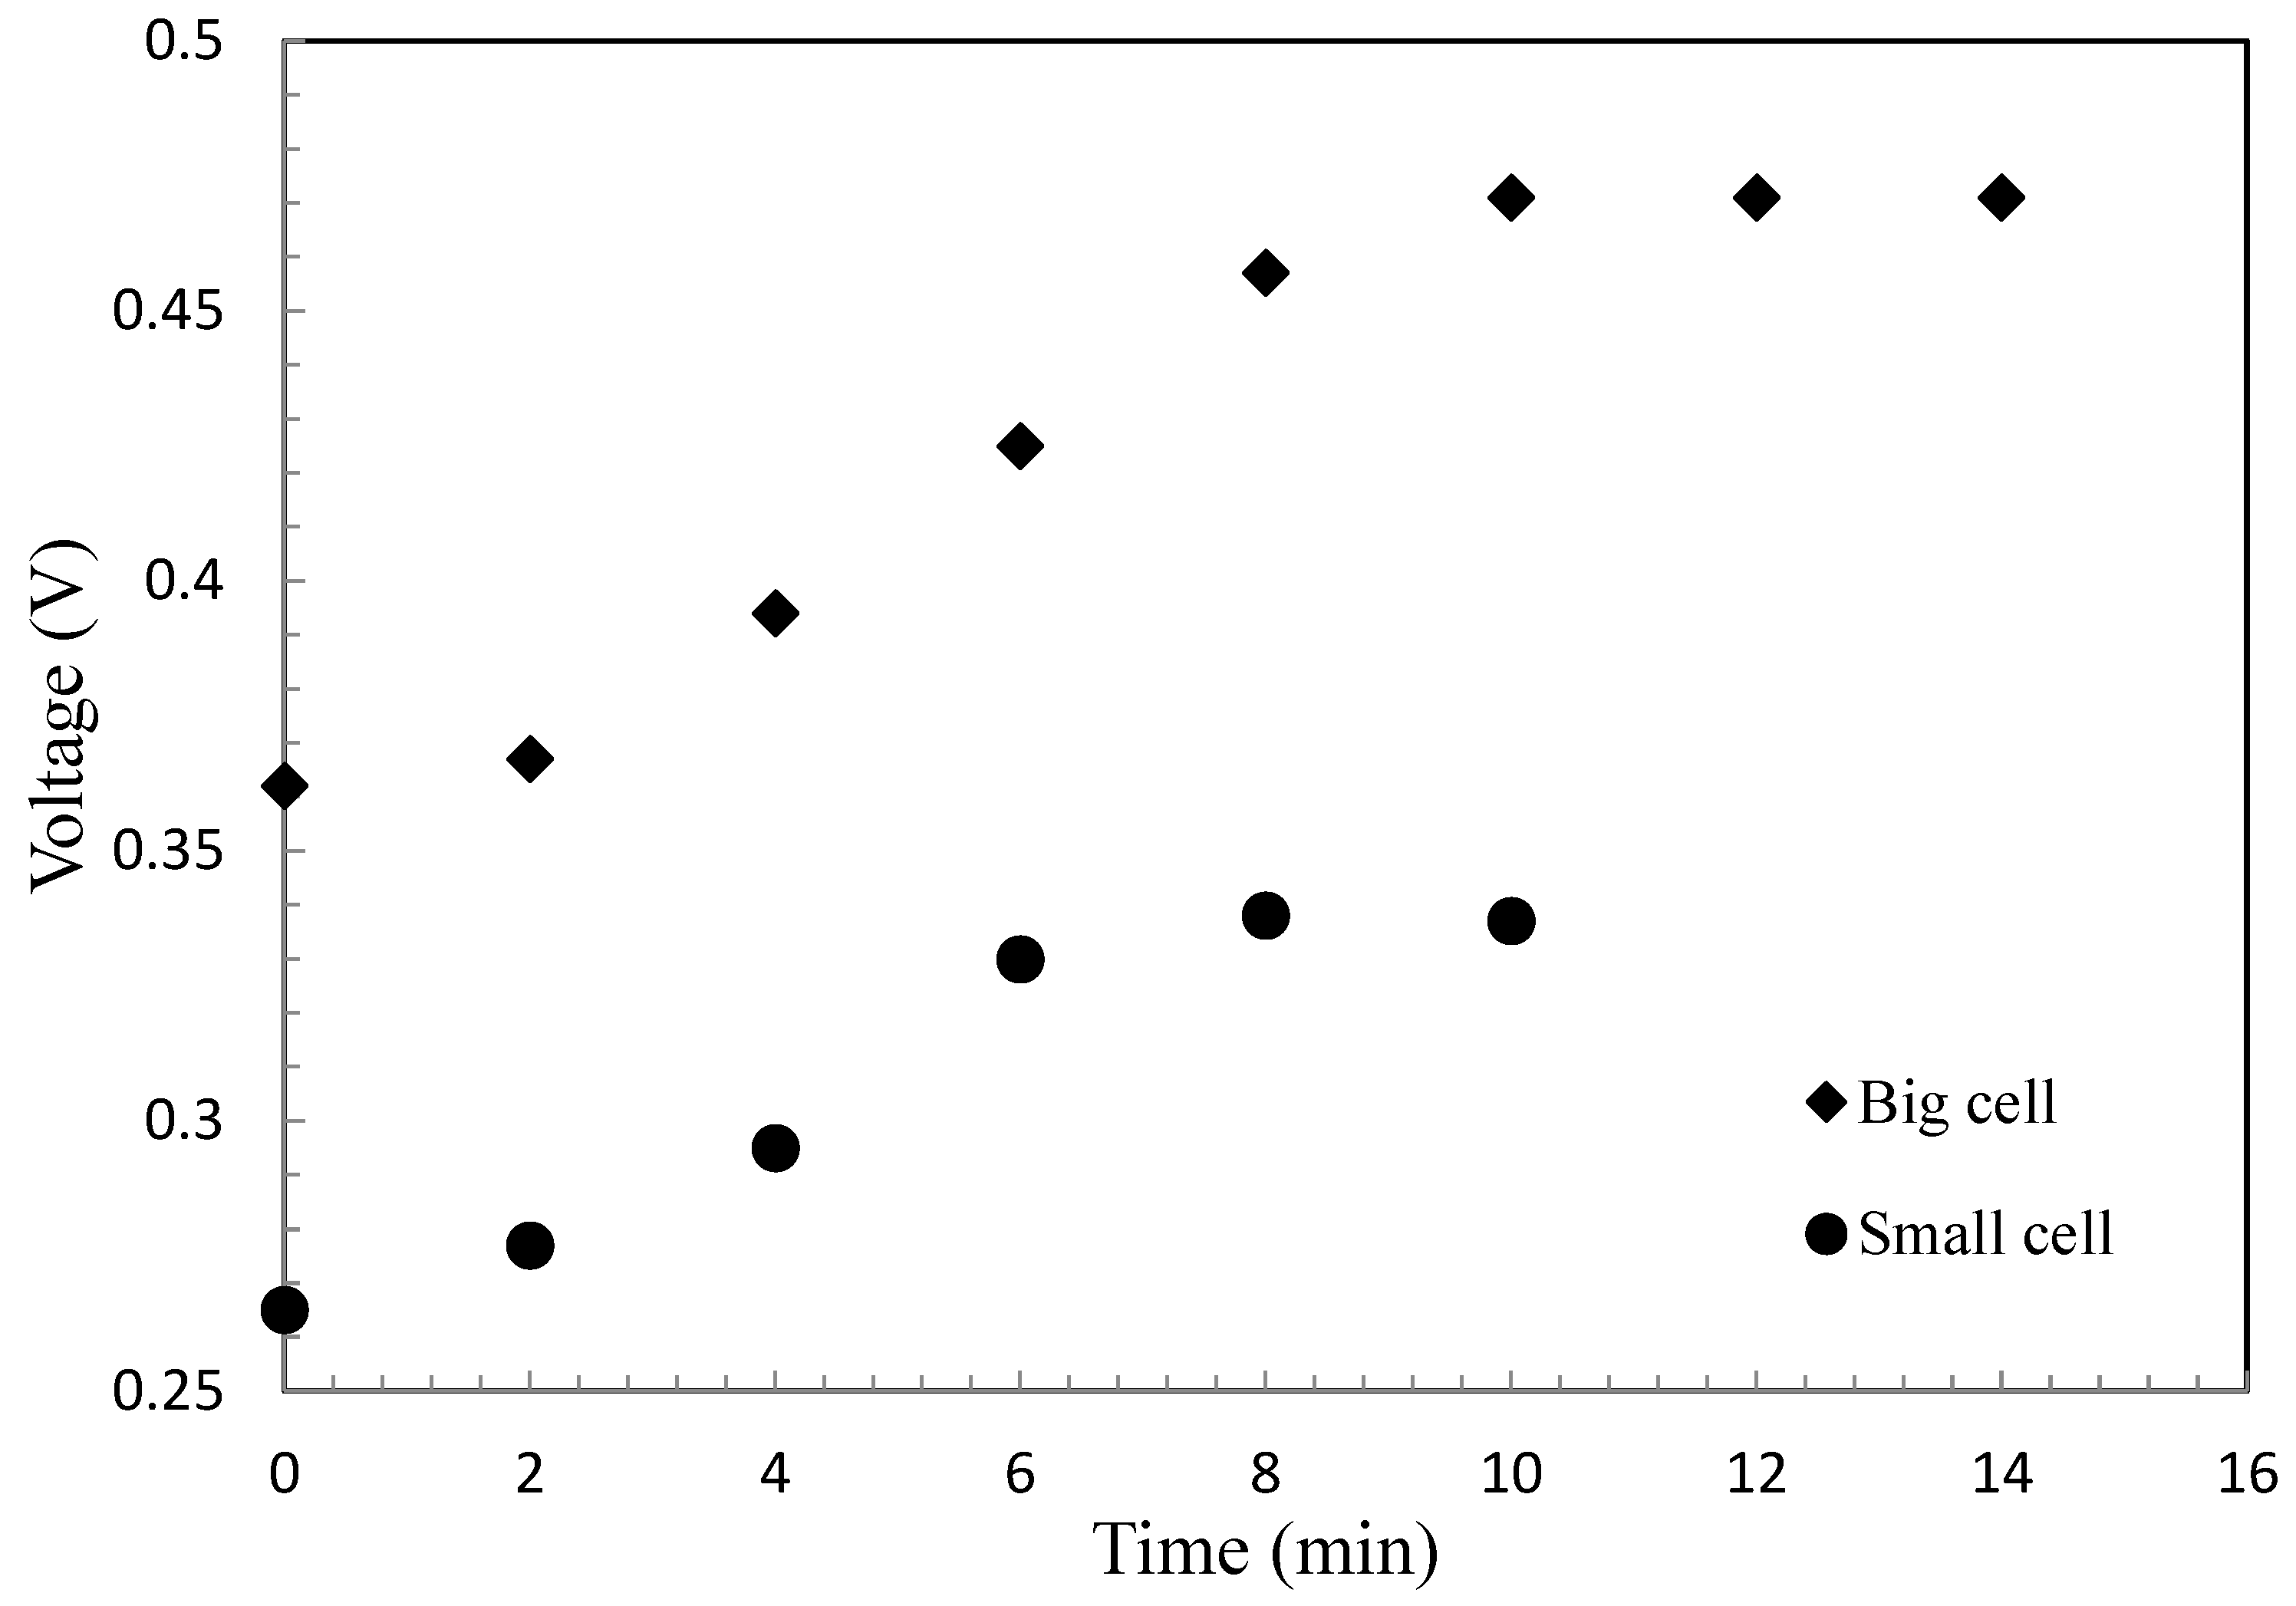
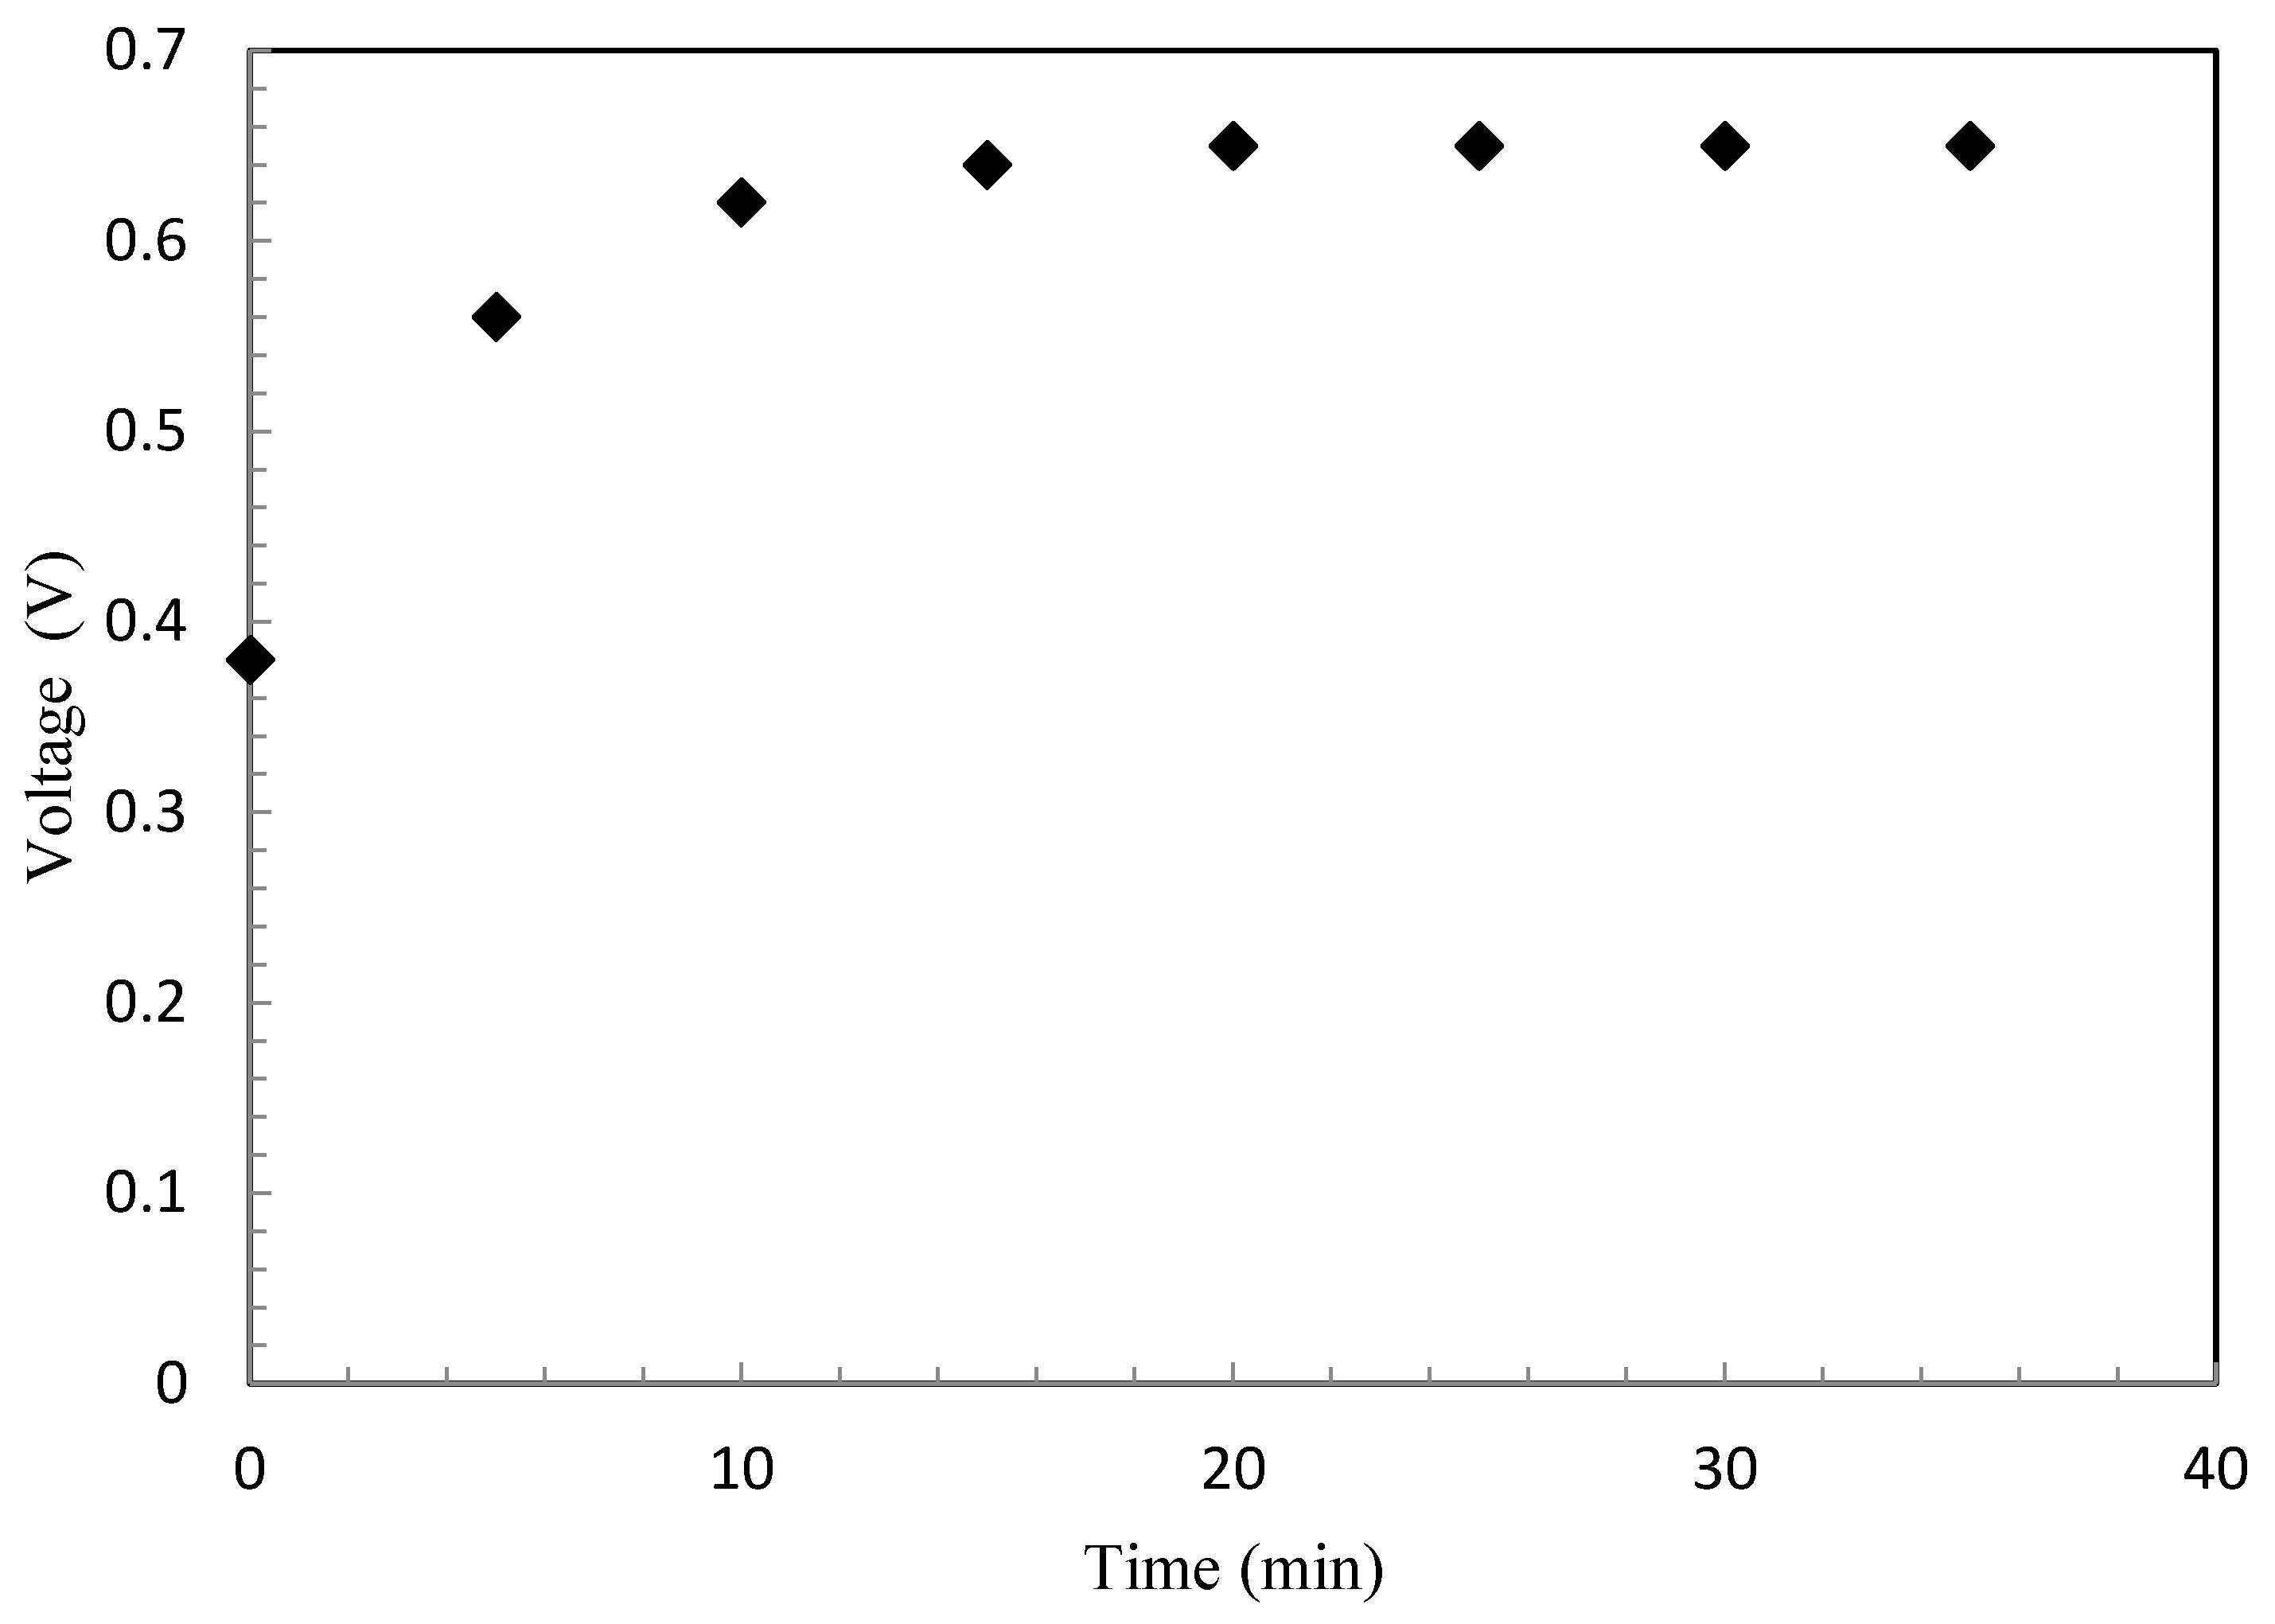
23]. The present work attempts to consider various cathodic and anodic materials, with two different MFC sizes, and test their influence on the generated power density of the MFC. The use of the different combinations of copper, aluminum, carbon cloth, steel and brass for the anode and cathode was also considered. The use of different oxidizing agents such as copper sulphate and potassium hexacyanoferrate is also investigated. Furthermore, the size and distance between the electrodes was investigated. The power outputs between electrochemical and microbial cells were studied.

2. Materials and Methods

2.1. Materials

The constructed MFC cell consists of two chambers (double-chambered cell) held together by acrylic glass plates. A semi permeable membrane used to separate each chamber: cationic and anionic membranes. Cation Exchange Membranes (CEM) are usually comprised of a fluorinated polymer with sulfonic acid sites and have excellent ionic conductivity and thermal/chemical durability (FuelCellStore, USA). Electrodes made of carbon cloth were inserted in each chamber. To prevent contacting the electrodes with the membrane, a cloth insulator is used (FuelCellStore, USA). A schematic representation of the MFC assembly utilized in this work is shown in Figure 2. Yeast bacterial, Saccharomyces cerevisiae, solution was pre-cultured at room temperature and different biomass concentrations. The tests were operated for 50 min, but were noticed to be stabilized in 20 min.
To investigate the effect of cell size on energy generation, two cells of different sizes were used. The smaller and larger cell compartments were designed with inner dimensions of 3.8 cm × 2.9 cm × 0.9 cm and 7.9 cm × 6 cm × 0.9 cm, respectively. Two ports were fixed in each compartment; one for inserting the electrode, and the other to feed the cell with the solution. Potassium hexacyanoferrate solution was added to the cathode as the oxidizing agent. The anode was filled with equal volumes of prepared yeast solution and methylene blue; methylene blue serves as a mediator (i.e., it takes the electrons from the respiratory cycle of bacteria and makes it available at the anode). It is worth mentioning that the hexacyanoferrate is a toxic material to the biomass, but it is used here as an oxidizer in the oxidizer chamber with no interaction with the biomass. Methylene blue is used as a mediator; however, it is not considered toxic to the biomass

2.2. Methodology

The unit can be worked in either modes: open circuit voltage (OCV), and closed circuit with various outer loads. A multi-meter is utilized to peruse the open circuit voltage, while a National instruments device (NID) is utilized for closed circuit voltage data aquisition. The IID (Austin, TX, USA) utilizes LabVIEW 2013 programming. It incorporates data aquisition that empowers distinctive framework designs that converts signals into numeric values. Voltage and current can be recognized in the the blockdiagram as graphical source code. The numeric values of the current are acquired at a given voltage at certain resistance. Voltage and current data are then pooled in a separate data sheet. Collection list and selector input are utilized for exchanging between the channels under several resistances. Other features can also be observed in the block diagram, for example, the discontinue capacity to stop running the while loop. With respect to the clock, it permits adjusting the time interims for data logging, which is fixed at 5 s. Input and output ports used to trade data between the front board and block diagram. The front board is the user interface for the VI. It can be assured that the trend of the current is comparable to that of the voltage; the current is determined from Ohm’s law (I = V/R; I is the current in Ampere (A), V is the voltage in volts (V) and R is the resistance in ohms). The power P is calculated by:
P = V × I = V 2 R
The tests were carried out in triplicate and average results are presented. A maximum relative error of 7% is considered accepted in this work. Thus, experimental results with relative error greater that 7% were rejected and tests were repeated.

3. Results and Discussion

3.1. Cell Size and Voltage Variation

The variation of voltage with time was measured with both types of cells, smaller and larger; the results are shown in Figure 3. The small cell of the anode chamber was 10 cm3 in size, while the large cell was 42 cm3 in size; the oxidizer chamber is of similar size to the anodic chamber. The types of cationic and anionic membranes were the same for both small and large cells with same size of electrodes in both cells. The results revealed that when using the smaller cell size, the voltage started with a value of 0.277 V across the cathode and the anode and gradually increased until it reached a constant value of 0.337 V in 10 min. While using the larger cell size, the voltage increased gradually from an initial value of 0.362 to 0.47 V in approximately 10 min. However, in terms of voltage per unit volume, the smaller cell produces a higher voltage than the larger cell due to lower overpotentials. This is in consistent with the results obtained by Stantoro et al. [24] when they investigated MFCs with paper separators and liquid containing elements in super-capacitive mode using 15 mL size-MFCs in a supercapacitive configuration, which consisted of a plain wrapped carbon veil anode (negative) and conductive latex cathode (positive).

3.2. Effect of Cathode Solution

The effect of using different cathode solutions on the power produced by the MFC was studied by changing potassium hexacyanoferrate to copper sulphate solution (at concentration of 10 g/L) in the cathode chamber. The experiment was conducted using the larger cells. The carbon cloth electrode was shaped as a cylinder with a dimension of 10 cm long and 1 cm diameter. It is known that the redox chemicals of the yeast cells present in their external membrane are suitable to the cathode surface and can contribute to current generation in a mediator [25]. The suspension was prepared by adding 10 g of yeast to 500 mL of distilled water, and oxygen was pumped into it for about 10 minutes to speed up bacterial growth. It is seen that the copper sulphate solution resulted in higher voltage (Figure 4) compared to that when using potassium hexacyanoferrate as the cathode solution (Figure 3). This could be due to the higher conductivity of copper sulphate compared to potassium hexacyanoferrate. The results of Kong et al. [26] showed that the internal resistance of MFC with DO depends on the catalyst and is higher than that of MFC with potassium permanganate and potassium ferricyanide solution.

3.3. Effects of Culture Age and Air Supply

To study the effect of the culture age on the MFC performance, fresh and old cultures were utilized. The fresh culture was prepared by adding 5 g of dried yeast to 500 mL of distilled water. The culture was kept for about 10 min and air was pumped into it. The spent culture was considered in which 25 mL of a previously used microbial culture was implemented. Another 25 mL of the freshly prepared bacterial culture was placed in another cell (cell 2). A few drops of mediator (methylene blue) was added to both of the cells (cell 1 and cell 2) in order to enhance the process and obtain certain voltage at the beginning. In both cells (cell 1 and cell 2), carbon cloth (C) and aluminum sheet (Al-sheet) electrodes were used in the anodic and cathodic chambers, respectively. For the purpose of comparing the types of electrodes, in another test a copper rod and aluminum rod were used in the anodic and cathodic chambers, respectively, for the case of freshly used culture (cell2). The effect of stirring the solution and supplying air on the voltage and current was also studied. The results are displayed in Table 1.
The results shown above demonstrate no significant change observed when using an old or freshly prepared culture in terms of voltage. However, the current produced by using a spent culture is much higher than the current produced by using a fresh culture. It is also observed that changing the electrodes did not result in a significant difference in the potential drop; however, the current increased significantly. In addition, stirring the culture and supplying air did not affect the voltage significantly, but it resulted in an increase in the current due to the oxidation resulted from air provision and mixing.

3.4. Anaerobic Cell Operation

To determine what can happen when the cell is operated under anaerobic conditions, 50 mL of the freshly prepared bacterial solution (10 g/L biomass) was transferred into a beaker. Copper and brass rods of the same size were used as electrodes. The mouth of the beaker was covered using a polyethylene sheet. It was observed that the cell delivered a voltage of 0.592 V and a current of 0.39 mA. The values of the voltage and current were maintained as the same for several weeks of operation. However, after one week, it was observed that there were white powdery deposits on the bottom of the beaker, and tiny bubbles were formed around the electrodes electroplating. This would indicate that the presence of air does not affect the process significantly, but it is necessary for bacterial aeration. Thus, this single cell can operate under either aerobic or anaerobic conditions.

3.5. Series and Parallel Arrangements

To study the effect of various arrangements, 10 beakers of 100 mL each were filled with equal volume of bacterial solutions. Each system contained 10 g/L of biomass. The beakers were used in this experiment instead of the MFC cell as it is easier to be connected in various arrangements than the MFC cells. Copper and aluminum rods were used as electrodes. The copper electrode in one cell was directly connected to the aluminum electrode, which is placed in the other cell resulting in series arrangement. Tests were conducted at room temperature. For parallel arrangement, the copper electrode in one cell was connected to the copper electrode in the other cell. Upon operating the MFC with these two arrangements, results were collected and are summarized in Table 2.
The voltage of the series and parallel arrangements are the same; however, the series arrangement resulted in a higher current initially. When using series and parallel in one arrangement, the values for voltage and current were lower than individual series and parallel arrangements. Therefore, operating the MFC in series arrangement would be a better option. The performance of serially and parallelly connected MFC was studied by Gurung and Oh [27]; they found an increase in power generation when two individual microbial fuel cells were stacked together either in series or in parallel.

3.6. Effect of Spacing Between Electrodes and Biomass

The dependence of current (I) and voltage (V) on the spacing between the electrodes and the amount of biomass (bacterial solution) was investigated. In this case, fresh bacterial cultures were prepared by adding approximately 35 g of yeast into beakers containing either 50, 100, 150, 200 or 250 mL of distilled water, for purpose of studying effect of biomass concentration. Air was provided into each of these cultures, and then each was kept aside for 15 minutes to allow bacterial cultivation. Fifty mL from each these cultures were transferred into the cell; tests were repeated at different biomass concentration. The cell was covered with a cardboard piece containing holes at a distance of 2.2 cm and 4.4 cm apart. Through these openings, copper and aluminum rods of equal sizes were inserted. The holes were used to control the spacing between the electrodes. The recorded current emitted from the cell at each of the two spacing and at different biomass concentrations are summarized in Table 3. It is seen that the current increases with the decrease in biomass concentration; such a trend is the same for both spacing. It is also noticeable that a slight increase in the current when using 4.4 cm spacing appeared compared to that of 2.2 cm spacing. This could be due the increase in potential difference upon increasing the spacing between the two electrodes.

3.7. Electrochemical Cell Versus Microbial Cell

To verify whether the cell acts as an electrochemical one or a microbial one, the conductivity of distilled water was made equal to that of bacteria. This was done by adding ultrapure sodium chloride solution (Aldrich, USA) to a double distilled water until the conductivity became the same as the microbial culture. In both cases, the small cell size (3.8 cm × 2.9 cm × 0.9 cm) was used and operated at room temperature (20 °C). Copper and aluminum rods were used as electrodes, the same sizes as mentioned before (10 cm × 1.0 cm), and the current was measured over time. Table 4 shows values of the current measured over time for the microbial and electrochemical cells. The current increases steadily for both types of cells; however, in case of bacterial solution higher current values are noticed compared to that of the salt solution. This shows that electricity is generated due to the microbial activity rather the salty cell, i.e., the bacterial solution is indeed aiding the transport of electrons.

3.8. Effects of the Yeast Concentration

To examine the effects of the yeast concentration on the cell performance, the voltage and current were measured with time using cells operated with different concentrations of yeast. Tests were done using the smaller cell size. Carbon cloth electrodes were used in both anodic and cathodic chambers. The results in terms of average voltage and current are displayed in Table 5. It can be seen that both voltage and current increase as yeast concentration increased from 5 to 20 g/100 mL. This is an expected result due to enhanced degradation of organic matter with higher cell content and thus more release of electrons [15,28].

3.9. Effect of Membrane Type

During the performance of an MFC, not only protons but also other cation species are responsible for maintaining electro-neutrality; this includes transporting the positive charge through the membrane. This might result in an increase in conductivity of the cathode chamber due to accumulation of the cations which is controlled by membrane type. Therefore, it is important to determine which membrane incorporates a higher proton transfer [9]. To inspect the effect of the type of the membrane, three different membranes were tested. The term old cell refers to the cell with the rough side of the membrane facing the anode, which is the cell used in all previous tests; while the term new cell refers to the cell with the smooth side of the membrane facing the anode. In all cases, the tests were conducted with a solution of 15 g yeast in 100 mL distilled water. The results are shown in Table 6. According to these data, the new cell, which has the arrangement of the smooth side facing the bacteria (anode), results in a higher value of current. It is obvious that membrane (3) shows the highest value of current amongst the rest. Therefore, it can be concluded that membrane (3) with the smooth side facing the anode allows for easier transfer of protons.

4. Conclusion

The different operational scenarios considered in this works showed different functionality of the MFC operation in terms of voltage and current. The power, whether as voltage or current, was measured in different conditions and cells. According to the experiments performed in this work, the power increases with increasing the area, increasing the volume of the bacterial solution, supplying air and stirring. The previously used microbial culture gave better results than the fresh one. Better performance was obtained when using series arrangement compared to that of other arrangements. Furthermore, the use of the Cu-Al cathode resulted in better MFC performance than with the carbon cloth cathode. The arrangement sides (smooth versus rough) of the membranes resulted in different current and voltage outputs; the best output is obtained when the inner side is faced toward the anode. Based on the results presented in this study, it is recommended to use smaller MFC cells operated aerobically, with smooth membranes facing the chambers using Cu-Al probes and the largest amount of biomass.

Author Contributions

Conceptualization: A.A. and Y.A.-A.; Methodology, validation and analysis—S.A.-A., A.A. and Y.A.-A.; writing, review and editing—S.A.-A. All authors have read and agreed to the published version of the manuscript.

Funding

The work in this paper was supported, in part, by the Open Access Program from the American University of Sharjah.

Conflicts of Interest

The authors declare no conflict of interest. This paper represents the opinions of the authors and does not mean to represent the position or opinions of the American University of Sharjah.

References

  1. Behera, M.; Jana, P.S.; More, T.T.; Ghangrekar, M.M. Rice mill wastewater treatment in microbial fuel cells fabricated using proton exchange membrane and earthen pot at different pH. Bioelectrochemistry 2010, 79, 228–233. [Google Scholar] [CrossRef] [PubMed]
  2. Ghasemi, M.; Shahgaidi, S.; Ismail, M.; Yaakob, Z.; Wan Daud, W. New generation of carbon nanocomposite proton exchange membranes in microbial fuel cell systems. Chem. Eng. J. 2012, 184, 82–89. [Google Scholar] [CrossRef]
  3. Logan, B. Graphite fibre brush anodes for increased power production in air-cathode microbial fuel cells. Environ. Sci. Technol. 2007, 41, 3341–3346. [Google Scholar] [CrossRef] [PubMed]
  4. Rabaey, K.; Verstraete, W. Microbial fuel cells: Novel biotechnology for energy generation. Trends Biotechnol. 2005, 23, 291–298. [Google Scholar] [CrossRef]
  5. Permana, D. Performance of Single Chamber Microbial Fuel Cell (SCMFC) for biological treatment of tofu wastewater. In Proceedings of the IOP Conference Series: Earth and Environmental Science, Saint Petersburg, Russia, 17–18 April 2019; Volume 277. [Google Scholar]
  6. Bennetto, H.P. Microbial Fuel Cell; Pargaman Press PLC: London, UK, 1990. [Google Scholar]
  7. Logan, B. Scaling up microbial fuel cells and other bioelectrochemical systems. Appl. Microbiol. Biotechnol. 2010, 85, 1665–1671. [Google Scholar] [CrossRef]
  8. Schamphelaire, L.; Rabaey, K.; Boeckx, P.; Boon, N.; Verstraete, W. Outlook for benefits of sediment microbial fuel cells with two bio-electrodes. Soc. Appl. Microbiol. Blackwell Publ. 2008, 1, 446–462. [Google Scholar] [CrossRef] [Green Version]
  9. Rozendal, A.; Hamelers, V.H.; Buisman, J. Effects of Membrane Cation Transport on pH and Microbial Fuel Cell Performance. Environ. Sci. Technol. 2006, 40, 5206–5211. [Google Scholar] [CrossRef]
  10. Rahimnejada, M.; Najafpoura, G.D.; Ghoreyshia, A.A.; Shakerib, M.; Zarea, H. Methylene blue as electron promoters in microbial fuel cell. Int. J. Hydrogen Energy 2011, 36, 13335–13341. [Google Scholar] [CrossRef]
  11. Taskan, E.; Ozkaya, B.; Hasar, H. Effect of different mediator concentrations on power generation in MFC using TiO2 electrode. Int. J. Energy Sci. 2014, 4, 9–11. [Google Scholar] [CrossRef]
  12. Chang, I.S.; Moon, H.; Brestschger, O.; Jang, J.K.; Park, H.I.; Nealson, K.H.; Kim, B.H. Electrochemically active bacteria. J. Microbiol. Biotechnol. 2007, 16, 163–177. [Google Scholar]
  13. Herrero-Hernandez, E.; Greenfield, D.; Smith, T.; Akid, R. Evaluation of the performance of a mediatorless microbial fuel cell by electrochemical impedance spectroscopy. Electroanalysis 2019, 31, 1189–1194. [Google Scholar] [CrossRef]
  14. Grzebyk, M.; Pozniak, G. Microbial fuel cells (MFCs) with interpolymer cation exchange membranes. Sep. Purif. Technol. 2005, 41, 321–328. [Google Scholar] [CrossRef]
  15. Toczyłowska-Mamińska, R.; Szymona, K.; Król, P.; Gliniewicz, K. Evolving microbial communities in cellulose-fed microbial fuel cell. Energies 2018, 11, 124. [Google Scholar] [CrossRef] [Green Version]
  16. Flores-Cadengo, C.; Soavi, F.; Kodali, M.; Jimenez, I.; Gajda, I.; Greenman, J.; Ieropoulos, I.; Atanassov, P. Ceramic microbial fuel cells stack: Power generation in standard and supercapacitive mode. Sci. Rep. 2018, 8, 3281. [Google Scholar]
  17. Shizas, I.; Bagley, D. Experimental determination of energy content of unknown organics in municipal wastewater streams. J. Energy Eng. 2004, 130, 45–53. [Google Scholar] [CrossRef]
  18. Capodaglio, A.G.; Cecconet, D.; Molognoni, D. An Integrated Mathematical Model of Microbial Fuel Cell Processes: Bioelectrochemical and Microbiologic Aspects. Processes 2017, 5, 73. [Google Scholar] [CrossRef] [Green Version]
  19. Huggins, T.; Fallgren, P.H.; Jin, S.; Ren, Z.J. Energy and performance comparison of microbial fuel cell and conventional aeration treating of wastewater. J. Microb. Biochem. Technol. 2013, 6, 1–5. [Google Scholar]
  20. Gil, G.-C.; Chang, I.-S.; Kim, B.; Kim, M.; Jang, J.; Park, H.S.; Kim, H.J. Operational parameters affecting the performance of a mediator-less. Biosens. Bioelectron. 2003, 18, 327–334. [Google Scholar] [CrossRef]
  21. Włodarczyk, P.P.; Włodarczyk, B. Preparation and analysis of Ni–Co catalyst use for electricity production and COD reduction in microbial fuel cells. Catalysts 2019, 9, 1042. [Google Scholar] [CrossRef] [Green Version]
  22. Włodarczyk, P.P.; Włodarczyk, B. Wastewater treatment and electricity production in a microbial fuel cell with Cu–B alloy as the cathode catalyst. Catalysts 2019, 9, 572. [Google Scholar] [CrossRef] [Green Version]
  23. Włodarczyk, P.P.; Włodarczyk, B. Microbial fuel cell with Ni-Co cathode powered with yeast wastewater. Energies 2018, 11, 3194. [Google Scholar] [CrossRef] [Green Version]
  24. Santoro, C.; Winfield, J.; Theodosiou, P.; Ieropoulos, I. Supercapacitive paper based microbial fuel cell: High current/power production within a low cost design. Bioresour. Technol. Rep. 2019, 7, 1–7. [Google Scholar] [CrossRef] [PubMed]
  25. Prasad, D.; Arun, S.; Murugesan, M.; Padmanaban, S.; Satyanarayanan, R.; Berchmans, S.; Yegnaraman, V. Direct electron transfer with yeastcells and construction of a mediatorless microbialfuelcell. Biosens. Bioelectron. 2007, 22, 2604–2610. [Google Scholar] [CrossRef] [PubMed]
  26. Kong, X.; Sun, Y.; Qi, W.; Li, Y. Effect of cathode electron-receiver on the performance of microbial fuel cells. Int. J. Hydrogen Energy 2010, 35, 7224–7227. [Google Scholar] [CrossRef]
  27. Gurung, A.; Oh, S. The performance of serially and parallelly connected microbial fuel cells. Energy Sources Part A Recovery Util. Environ. Eff. 2012, 34, 1591–1598. [Google Scholar] [CrossRef]
  28. Sekrecka-Belniak, A.; Toczyłowska-Maminska, R. Fungi-based microbial fuel cells. Energies 2018, 11, 2827. [Google Scholar] [CrossRef] [Green Version]
Figure 1. Scheme of a microbial fuel cell (MFC) in which an organic substrate is oxidized at the anode [8].
Energies 13 05458 g001
Figure 2. Schematic diagram of fuel cell assembly: (1) cell body, (2) cation exchange membrane, (3) electrodes, (4 and 5) nuts and screws.
Energies 13 05458 g002
Figure 3. Voltage versus time for small and large cells using 10 g/L of biomass at room temperature. Small cell: 10 cm3 size; large cell: 42 cm3 size.
Energies 13 05458 g003
Figure 4. Current versus time using 10 g/L copper sulphate solution in the cathode chamber and 20 g/L of biomass at room temperature.
Energies 13 05458 g004
Table 1. Summary results for different cultures, electrodes and the effect of supplying air. Cell 1: 10 cm3 size; Cell 2: 42 cm3 size: both at room temperature.
CellElectrodesVoltage (V)CurrentAfter Supplying Air
V (V)I (mA)
1C-Al sheets0.41.06 mA0.56.46
2C-Al sheets0.430.4 µA--
Cu-Al0.5324.70 mA--
Table 2. Comparison between series and parallel arrangements.
ArrangementVoltage (V)Current (mA)
Series5.370.58 max → <0.35
Parallel5.370.38
Series + Parallel2.720.25
Table 3. Variation of current with respect to solution volume and electrode spacing.
Initial Biomass Concentration (g/L)Current I (mA)
Electrodes 2.2 cm ApartElectrodes 4.4 cm Apart
7000.110.21
3500.330.39
2330.430.58
1751.051.25
1401.251.34
Table 4. Comparison of current output obtained from the bacterial cell and the saline cell.
Time (min)Bacterial Cell (mA)Saline Cell (mA)
00.080
40.10.02
70.120.03
100.140.03
130.150.04
160.160.04
190.170.05
220.170.05
250.180.06
310.170.07
Table 5. Effect of yeast concentration on MFC performance.
Concentration (g/100 mL)Voltage (mV)Current (mA)
50.13410.23
1041.5011.87
15100.1354.53
20183.5719.77
Table 6. Effect of membrane type in MFC performance.
Membrane 1Membrane 2Membrane 3
Current (mA)Current (mA)Current (mA)
Time (min)New CellOld CellNew CellOld CellNew CellOld Cell
048.226.150.030.072.462.3
551.225.295.912.184.348.6
1046.416.872.56.8127.546.3
1542.811.251.91.0105.055.0
2039.76.147.39.8110.054.5
2537.30.044.018.4112.053.4
3036.7-46.928.0104.054.1
3536.1-46.327.999.654.5
Publisher’s Note: MDPI stays neutral with regard to jurisdictional claims in published maps and institutional affiliations.

