Article

Technological Progress and Supply Base under Uncertain Market Conditions: The Case Study of the Taiwanese c-Si Solar Industry 2016–2019

Industrial Engineering and Management Department, National Kaohsiung University of Science and Technology No. 415, Jiangong Road, Sanmin District, Kaohsiung City 807, Taiwan
*
Author to whom correspondence should be addressed.
Energies 2020, 13(21), 5841; https://doi.org/10.3390/en13215841
Submission received: 11 September 2020 / Revised: 27 October 2020 / Accepted: 30 October 2020 / Published: 9 November 2020
(This article belongs to the Special Issue Research and Business in Renewable Energy Sources 2020)

Abstract

:
The recent years of the PV industry have been demarcated by a severe imbalance of manufacturing capacities versus demand. The goal of our research was to assess the technological progress and evolution of the Taiwanese c-Si PV supplier industry structure during the period of 2016 to 2019 when the end-product experienced price volatility. The analysis was conducted based on data derived from Taiwanese manufacturers and industry sources with regard to current technological and market trends. We illuminate two main conclusions: the industry is advancing consolidation, and it is decreasing the pace of technological advancements, especially in comparison to its Chinese counterparts. The study suggests there is a need for improving efficiencies in the production processes, and shifting toward downstream segments in order to maximize the utilization of resources in the segments with the highest profit margins.

Graphical Abstract

1. Introduction

The rapid changes in the global industry have occupied scholars since its inception. Numerous publications have approached the issue from various perspectives such as national policy [1,2], knowledge transfer [3,4], or technological advancement and sector’s performance [5,6,7]. As far as Taiwan is concerned, the literature is less abundant even though one should acknowledge the findings of Liou (2010), Lo et al. (2013), Hu and Yeh (2013), Wang and Chiu (2014), Hu and Mathews (2016), Jia et al. (2016), Liu et al. (2016) [8,9,10,11,12,13,14], among others. Due to the dynamic nature of the PV industry, which reshapes the manufacturing base and imposes the accelerated technological (re)evolution, there is a need for updated research that addresses the most recent market events, especially from the Taiwanese perspective.
In order to fill this gap, the objective of this article is to assess the impact of market shocks on the structural and technological advancements of Taiwanese PV modules and cell supply base, and draw conclusions about its competitive advantages under the current market conditions. The main contribution of the paper is the in-depth insight into the 2016–2019 transformation of Taiwanese PV that is based on the unique up-to-date market data that was collected in both 2016 and 2019, involving 30 companies in Taiwan and 5 in Mainland China.
To deliver the right context, the article establishes a brief introduction to the Global and Taiwanese PV industry, focusing on the growing market imbalance resulting in the permanent uncertainty. In the research sections, the authors investigated and characterized two shock waves with a special focus on their impact on the local industry, from the stock market valuation perspective. Equipped with the background market events, the authors present product data that is derived directly from the suppliers’ offers and industry sources. Based on this data, the paper discusses the Taiwanese PV industry’s analysis of the local entities’ recent technological advancements in relation to global trends and the competition of Chinese producers. The article produces conclusions on the competitive advantages of Taiwanese PV supply base on the world market.

2. Global PV Market Dynamics: The Taiwanese Perspective

Due to a long-term national plan, Taiwanese companies have started being present in the global PV value chain since the beginning of the new millennium, strongly benefiting from incentives of Western countries, which were driving up the demand. The PV supply evolution was dynamic, especially when yearly installed capacities were relatively small. Before 1998, the United States held the leadership to be eventually surpassed by Japan. The introduction of the generous subsidies in Europe marked the dramatic increase of capacities required to meet the demand, which, eventually, elevated Germany to the second position in 2001, and then to surpassing Japan in 2003. During that time, the end-products were mostly uniform with the poly c-Si as a standard while the production facilities operated often on the turn-key solution supplied by the Western equipment developers. Taiwan adopted the fast follower strategy already mastered in the 1990s and 2000s with the rise of the semiconductor and FDP industries that were supported by its established National Innovation System [8,11,15]. Taiwan, and later China, managed to utilize the vast stream of subsidies in Western countries to create their PV supply chains greatly benefitting from the lower manufacturing costs, technology transfer, and capital injection from the governmental sector. Already in 2007, China became the world’s leading solar cells supplier with the total capacity of 1 GW to reach even 21 GW in 2011. In only one decade, China’s market share of PV production grew from about 1% in 2001 to around 45% of the world total in 2010. In the aftermath of the financial crisis, the Western countries decreased the scale of the subsidies significantly, which sparked market shock and forced many Western PV manufacturers to exit unprofitable production. In consequence, the module and cell supply shifted mainly to Taiwan and China [15].
To assure the demand for its products, Taiwan set its support policies under the “Renewable Energy Development Act” with recognized “Million Rooftops’ PV Promotion Project” and, in the earlier stage, the Feed-in Tariff scheme. In 2016, President Tsai’s administration announced the ambitious goal of 20 GW installed by the year 2025, which stands for half of the current electric power capacity from all sources [8]. Apart from the demand side, the Taiwanese PV supply position has also been strategically outlined in the same document, and its recent versions stressing the main R&D direction of the first generation cell’s efficiency increase through the nano-technological experience of the similar technologies [11]. In effect, the structure of the manufacturing supply chain was not fully developed, leaving Taiwan sensible for the market volatility. Literature points here at the lack of the upstream segment responsible for a silicon supply. This segment was traditionally dominated by Western companies such as Wecker Chimie AG, Hemlock Semiconductor in the US, or REC in Norway. The sophisticated technology was mastered later on by Asian companies such as GCL and OCL [10]. Locally, Taiwan Polysilicon Corp. terminated production in 2015, stating the lack of profitability and scale competitive advantage [16]. In consequence, the Taiwanese did not possess control over the supply of polysilicon, which is the first raw material in the solar cell manufacturing process. Moreover, the wafer production had a limited scale with only two sizeable companies – Green Energy Technology and Sino-American Silicon Products Incorporation. Unlike the upstream, the midstream segment developed the handful of leaders in the cell and module manufacturing. According to the industry report and surveys conducted by the GTM research, in 2010, two Taiwanese companies were included in the list of the world’s 10 biggest cell suppliers, namely, Gintech and Motech, with the capacity of, respectively, 800 and 850 MW. Both companies shared a significant part of the global supply since 2010′s total shipments reached only 17.4 GW. In the following four years, the line capacities grew strongly. In 2014, the ranking again included two Taiwanese manufacturers, adding NeoSolar instead of Gintech (both merging into URE), on position number five with the total shipments of 2.17 GW (Motech 1.63 GW). That year, the total world shipments reached already 40 GW, and one could conclude the firm position of the local producers. They operated mostly on the pure-play cell supply side and a significantly less developed module as well as downstream chain [17].
Taiwanese PV companies started losing ground in 2015 when global shipments reached over 50 GW. Simultaneously, the manufacturing capacities of competitors, especially in Mainland China, increased exponentially, which was followed by the know-how flow, which led to the imbalance, low line utilization, and further withdrawals from the business across the global supply chain, especially in the West [18]. As a consequence, Taiwanese producers were able to buffer the market imperfections by turning to domestic demands while benefiting from governmental support. Quality-wise, Taiwanese products were still considered technologically superior to its Chinese counterparts. Therefore, ASPs were granted with premium [19]. The situation was attributed to accumulated technological capacities for innovation, which were shown in the intensified patenting activities in the nascent period of the PV industry [14,20].
The brief introduction to the global PV industry indicates, aside from the robustness and fierce competition, the volatile nature that has always been a leading characteristic of the market. This imbalance has cumulated, resulting in the exogenous shocks that have had a tremendous impact on the local supply base. This subject, and, in general terms, was extensively presented in literature on the complex matter of interaction between uncertain market conditions and companies’ strategic choices reflected in the product development [5,21], innovation [22], or technological shifts [6,7]. In order to fill the existing gap in literature, the authors of this article focused on the transformative period between the second half of 2016 and the second half of 2019. The authors presume that the two price shocks during that period were mostly related to the Chinese industrial and energy policies that had a severe impact on the technological learning curve and competitive edge of the local producers. The period instigated trends toward more diverse and efficient offerings as well as reshaped the Taiwanese manufacturing base structure while possibly undermining its former strength.
From a broader perspective, the origins of the PV market dynamic changes, before and after 2016, could be grouped in the three main interrelated domains:
(1)
Lagging technological progress. An absence of adequate supervision results in low standards, which lead to nonspecific demand. Particular members of the industry network were weakly affiliated, which negatively affected R&D diffusion. Although impressive in scale, the industry was underdeveloped from the technological aspect, leading to low-end processing. The main reason for this situation was the uncontrolled pace of growth and the lack of consistent national policies for manufacturers. In effect, the industry relied on technology transfers, which positioned China behind the EU, the US, Japan, and also Taiwan. In the later stages, due to the leapfrogging strategy, the technological gap gradually diminished. Therefore, the technological advancements of Chinese companies became acknowledged [23].
(2)
Overcapacity. A chaotic system led to structural imperfections. Chinese companies witnessed a negative correlation between the scale effect and profit. The production capacities overlapped since the products competed mostly with the lower costs obtained through improved managerial and production efficiency. The diffusion of the innovation was too low, and the products were rather homogeneous than diversified [24]. Overall, in 2014, PV manufacturing in China was composed of around 1000 entities in which a majority were active in the low entry barrier module assembling. Although the total capacity was estimated at around 70 GW, the line utilization did not surpass 50% [25]. In their research, Zhao and Zhang concluded that growth relied on cheap labour rather than on the positive average level of the frontier technological progress while the growth rate of the total productivity was negative until 2013 [7].
(3)
The local markets of the underdeveloped capacities absorbed the number of installations, which could not ensure the producers’ profits. As a result, Chinese and Taiwanese PV companies were overexposed to significant business risks associated with fluctuations in demand. Previous literature mainly focuses on the aftermath of the financial crisis of 2008 (followed by the relative stabilization), and the uncertainty caused by the anti-dumping regulations introduced by the EU and the US in 2014 at a time when Taiwan exported around 90% of its PV output [12].
With an increase in capacity, there was a parallel push toward more efficient technologies. New production lines enabled upgraded bulk portfolios, which is a shift that was particularly evident in Mainland China since Chinese entities could undertake most of the investment efforts. Industrial sources reveal that the main trend is the accelerated transition toward monocrystalline and PERC cells within mono segments and multi segments. Due to the declining production cost, improvements in bifacial and back-contact cells have gained in importance. In the domain of modules, the technologies of half-cut, smart wiring, or glass-glass aesthetics and durable solutions won the interest of the installers [26]. These dynamic transitions continued to undermine the technological lead of Taiwanese manufacturers, especially while the limited financial resources did not enable local companies to acquire sufficient CAPEX to compete with the scale of Chinese conglomerates. Consequently, Taiwan experienced two severe waves of sharp price declines between 2016 and 2019. Furthermore, it could not adjust to the rapidly changing conditions with significant manufacturing cost reductions [27]. The local PV industry members have displayed net losses for several consecutive years. Therefore, the help of the Taiwanese government was needed [12].

3. Taiwanese PV Industry under Uncertain Market Conditions

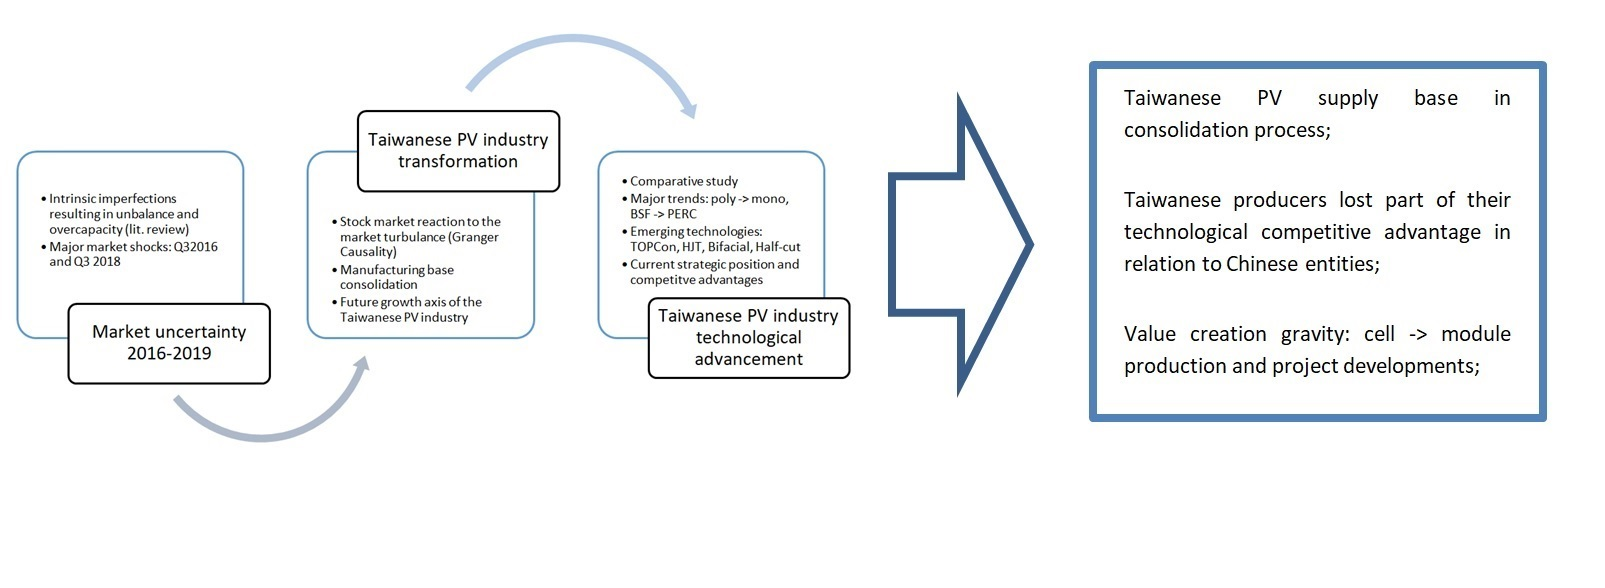
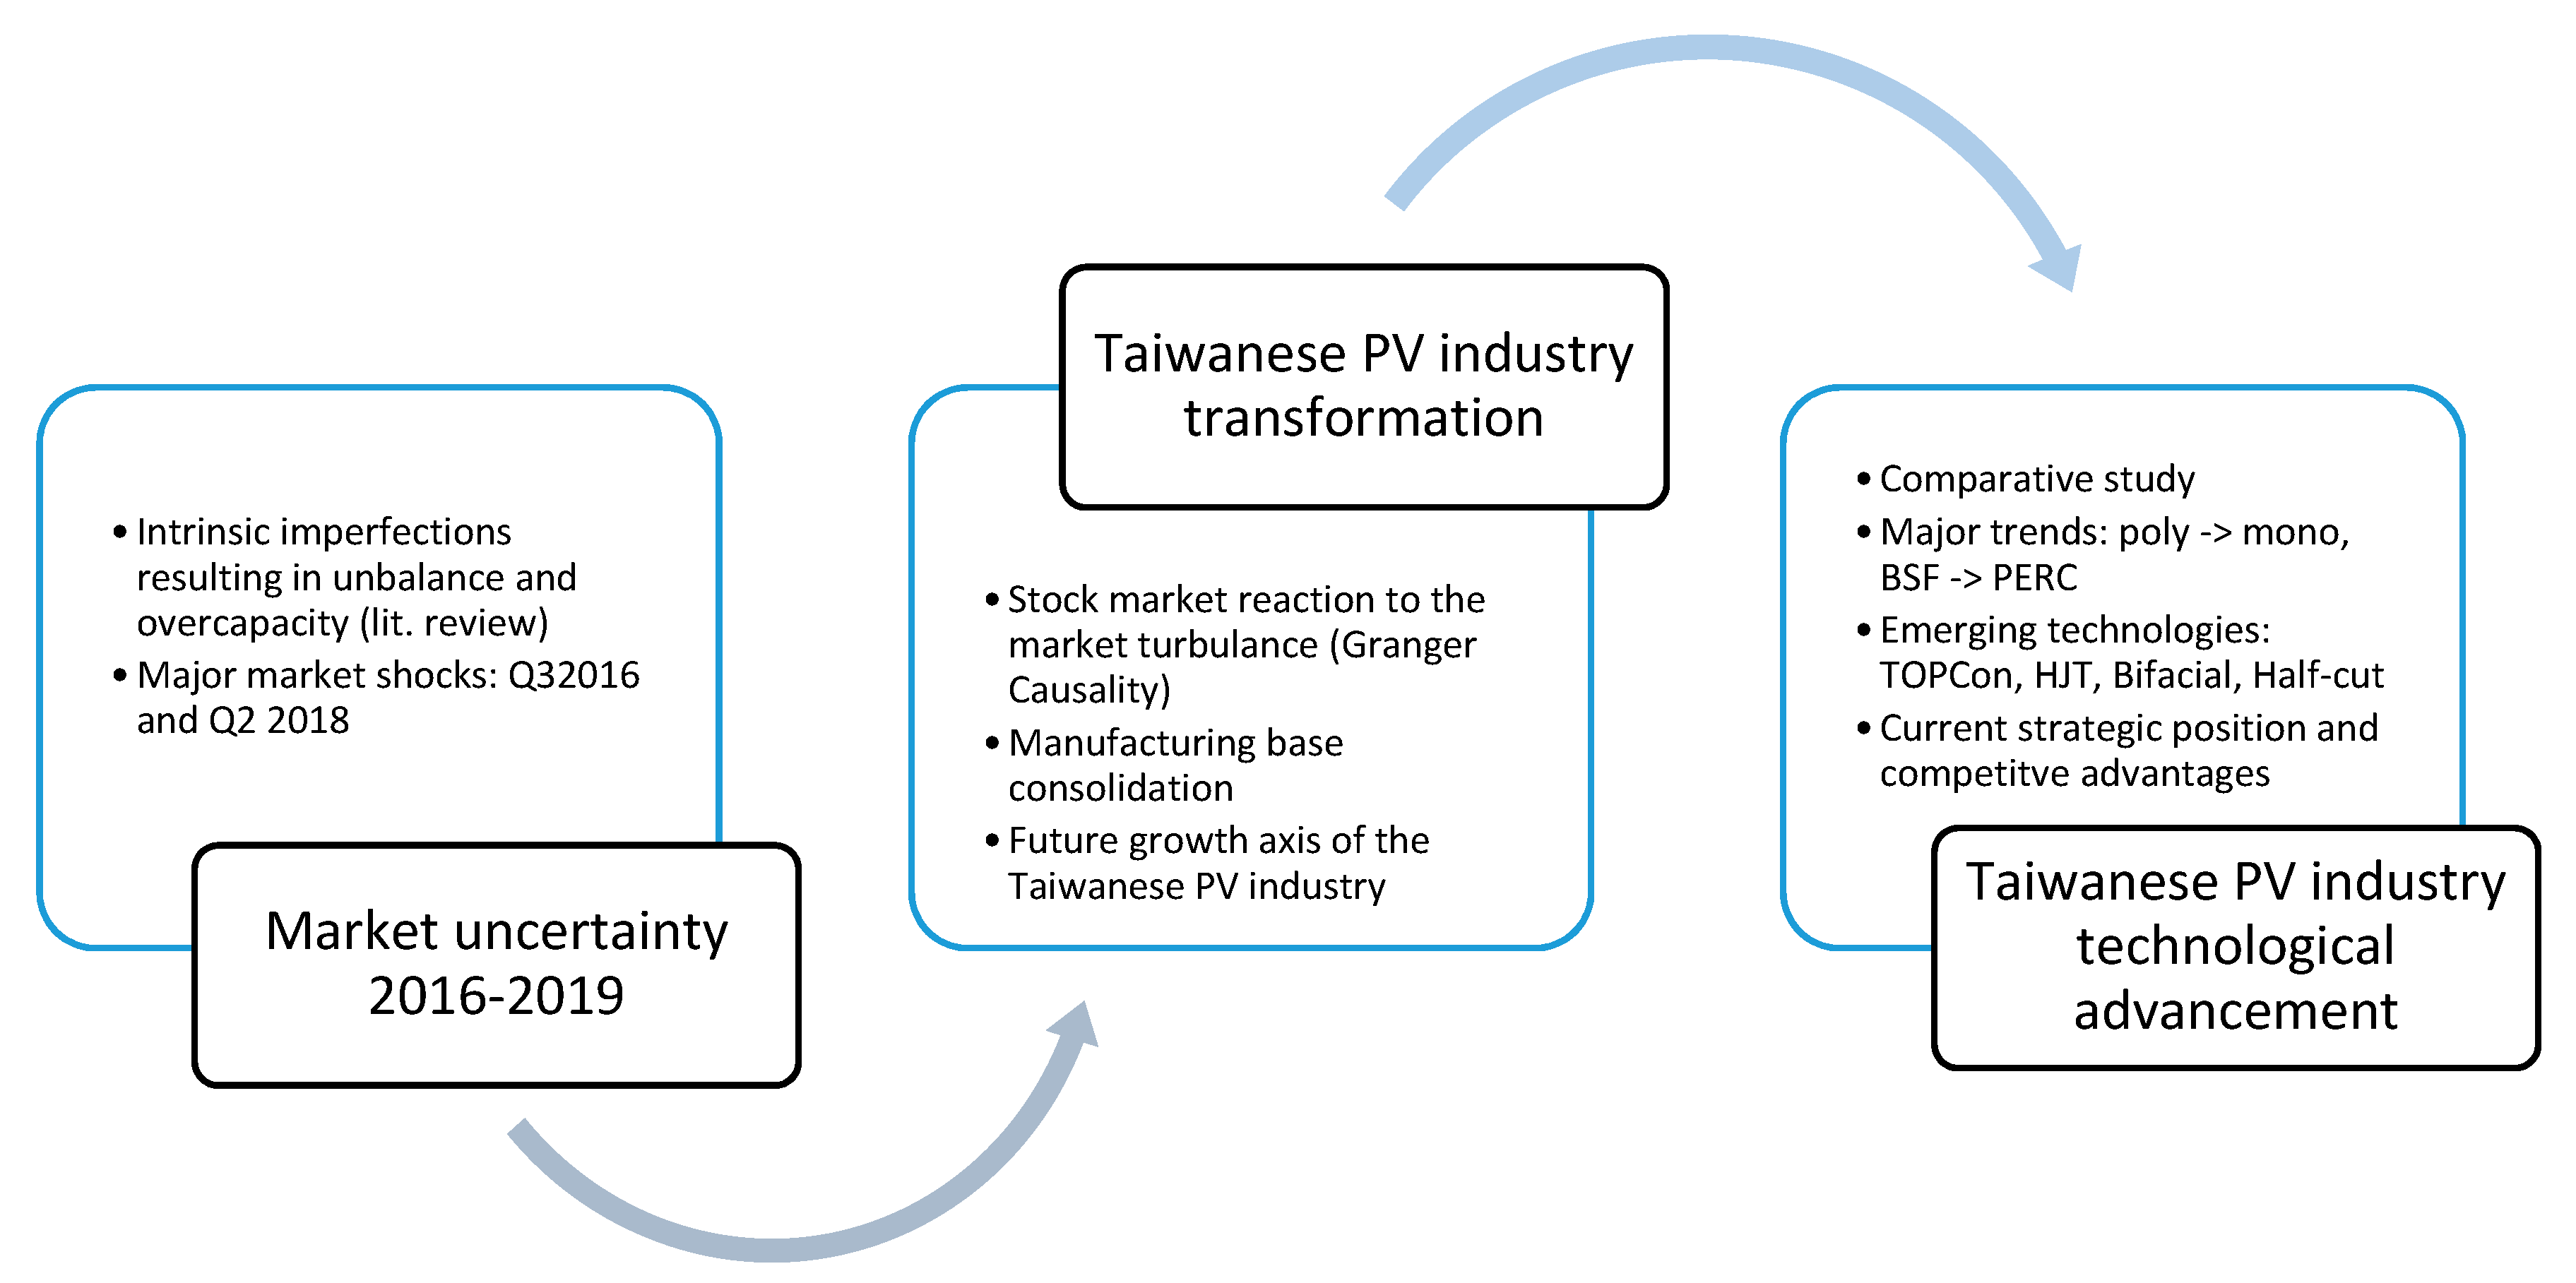
3.1. Research Logic and Objective

In order to mitigate the revenue losses and survive the fierce competition, companies strived to provide the most efficient products available. It became crucial to upgrade cell output and shift toward more prospectus technologies. Such advances maximized the marginal profit from each unit sold. There were a number of research studies done on the R&D and technological evolutions of the PV industry based on patents or manufacturing aggregated data. In this paper, the authors proposed to analyse the actual offer by local suppliers in the dynamic market approach. As an objective, the authors aimed to assess the impact of the market shocks on the structural and technological advancements of the Taiwanese PV module and cell supply (mid-stream) base to draw conclusions about its competitive advantages under the most recent market conditions.
The research provides up-to-date characteristics of the technological advancements of the Taiwanese industry members in the domain of first-generation PV. Such premises could be only discussed in the right context. Therefore, the top-down system was employed (Figure 1). First, the authors examined the scale of the market turbulence observed during the research period. Then, under assumption of the impact of the market turbulence on the Taiwanese c-Si manufacturing base, the potential impact on the sector at the companies’ level was investigated. Being equipped with an understanding of the local industry’s transformation, the technological progress was analyzed, indicating its potential directions. The findings were confronted with the current industry roadmaps and literature.

3.1.1. Market Uncertainty 2016–2019

The literature review pointed at the dynamic nature of the PV supply base while the period of 2016 and 2019 was characterized by the great uncertainty of the price of PV commodities trending downward. Aside from the negative price trend en gross, the manufacturers experienced two price shocks: first at the end of 2016 and the second in the middle 2018. In our case, one could relate the notion of the shock to the sudden disruption of market equilibrium, leading to the market adjustments and price volatility, caused by a change in a demand (the unexpected cut on subsidies in China, in 2018), or/and supply (uncontrolled expansion of the manufacturing capacities).
Factoring the data of this research, the authors focused on the local market evolution, global trends, and direct competition, which is, here, exemplified by the reference data of those most relevant to the research, known as Chinese manufacturers from the Tier-1 category. The scale of the market uncertainty was pictured with the module and cell prices gathered from well-established industrial sources of: pv-magazine [28,29,30], NREL [31,32].

3.1.2. Taiwanese PV Industry Transformation

The market uncertainty had undeniable impact on the Taiwanese c-Si supply chain. According to authors’ assumptions, this impact on companies could be observed on the three levels: sales and operation, stock market performance, and industry consolidation. The sales and operation impact was exemplified with export and revenue data sourced from Taiwanese Stock Exchange, and Taiwanese External Trade Development Council. The industry consolidation assumption was derived based on the industry news sources like pv-magazine, pv-tech, energytrends (also in Chinese edition), and the data collected regarding the technological advancement of the local industry analysis (Table A1 and Table A2).
The stock exchange performance, as a result of market uncertainty, was assessed with the quantitative model of Granger Causality, which is often employed to test the interdependence of the selected factor and the valuation of the stocks, meaning companies [33]. In the authors’ idea, the Granger causality test helps not only in discovering whether the Taiwanese PV stocks were Granger Caused by the abrupt change of module market price, but also it enabled the comparative analysis with the interdependence test results conducted on the Mainland Chinese PV stocks. In authors’ assumptions, the possible differences in extend to module price–stock valuation interdependences in Taiwan and China could be explained in the latter part of the research by the industry structure and technological advancements. In order to run tests, authors followed the VAR model based on the stationary market data.
X ( t ) = i = 1 p π 11 i X t i + j = 1 p π 12 i Y t j + ε 1 t
Y ( t ) = i = 1 p π 21 i Y t i + j = 1 p π 22 i X t j + ε 2 t
where X denotes module price evolution and X stand for the evolution of the index taken into analysis, where p is the maximum number of lagged observations included in the model (the model order), where the π contains the coefficients of the model, and ε stand for error residuals. Authors examined a total of six pairs (three for Taiwanese market and three for Chinese one), adding the TAIEX, NYSE, NASDAQ, and Shenzhen indices as control variables. In each pair, there were two possible hypotheses of Granger Causality.
-
Null Hypothesis: X does not Granger Cause Y
-
Alternative Hypothesis: Y does Granger Cause X
Authors rejected the null hypothesis with the probability staying below 0.05 (p-value 0.05). By rejecting the null hypothesis, it is stated that one variable does Granger cause the other variable (alternative hypothesis). In this case, when probability is higher than the p-value equal to 0.05, authors could not reject the null hypothesis, meaning that the null hypothesis is statistically significant and there is no Granger Causality between variables. The Granger causality test was performed on three Taiwanese PV company stocks: URE (merge of NeoSolar, Gintech, and Solartech), Motech, and TSEC. On the Chinese side, authors focused on three main competitors mentioned in the further parts of the research, namely, Jinko Solar, JA Solar, and Canadian Solar. The data employed for the test followed the monthly interval and addressed the period of October 2016 to March 2019.

3.1.3. Taiwanese PV Industry Technological Advancement

In the last part of the research, the technological evolution was further investigated with data collected from 30 local manufacturers in the categories of the cells and the modules, derived both in the beginning and the end of the period (Q32016 and Q22019). The data was sourced directly from company webpages or industry news for verification. Due to the relative standardization of the industry output, this data could be grouped into two general sets.
(1)
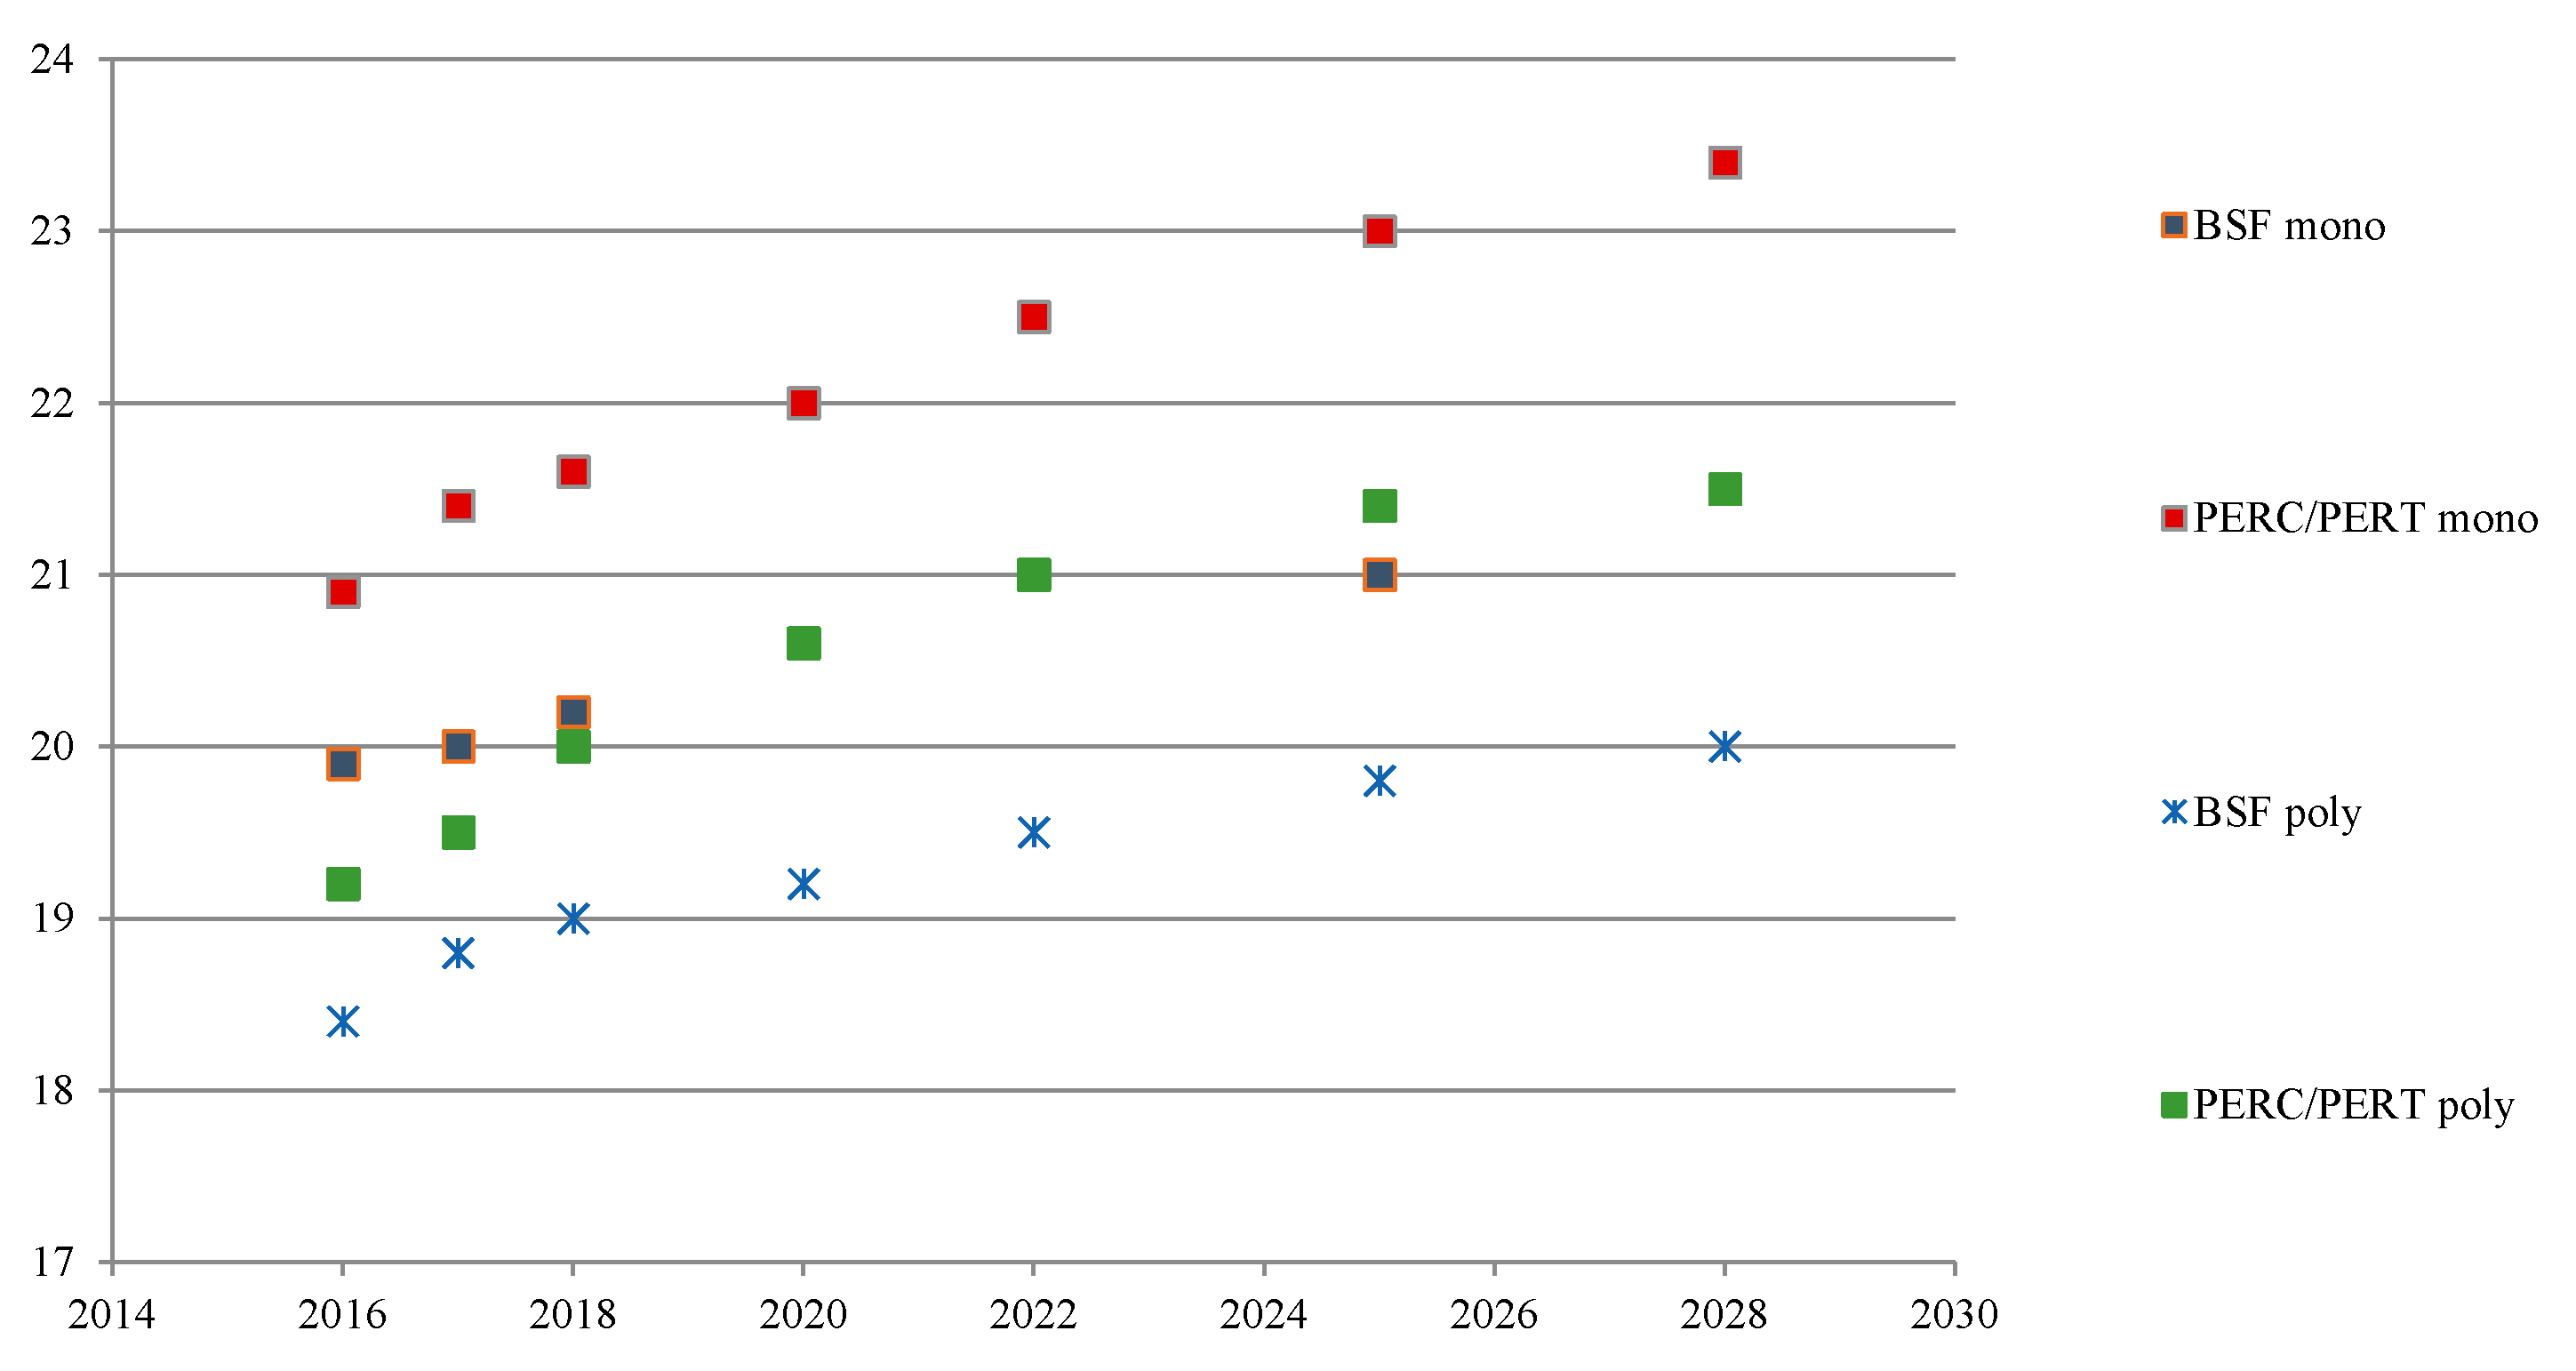
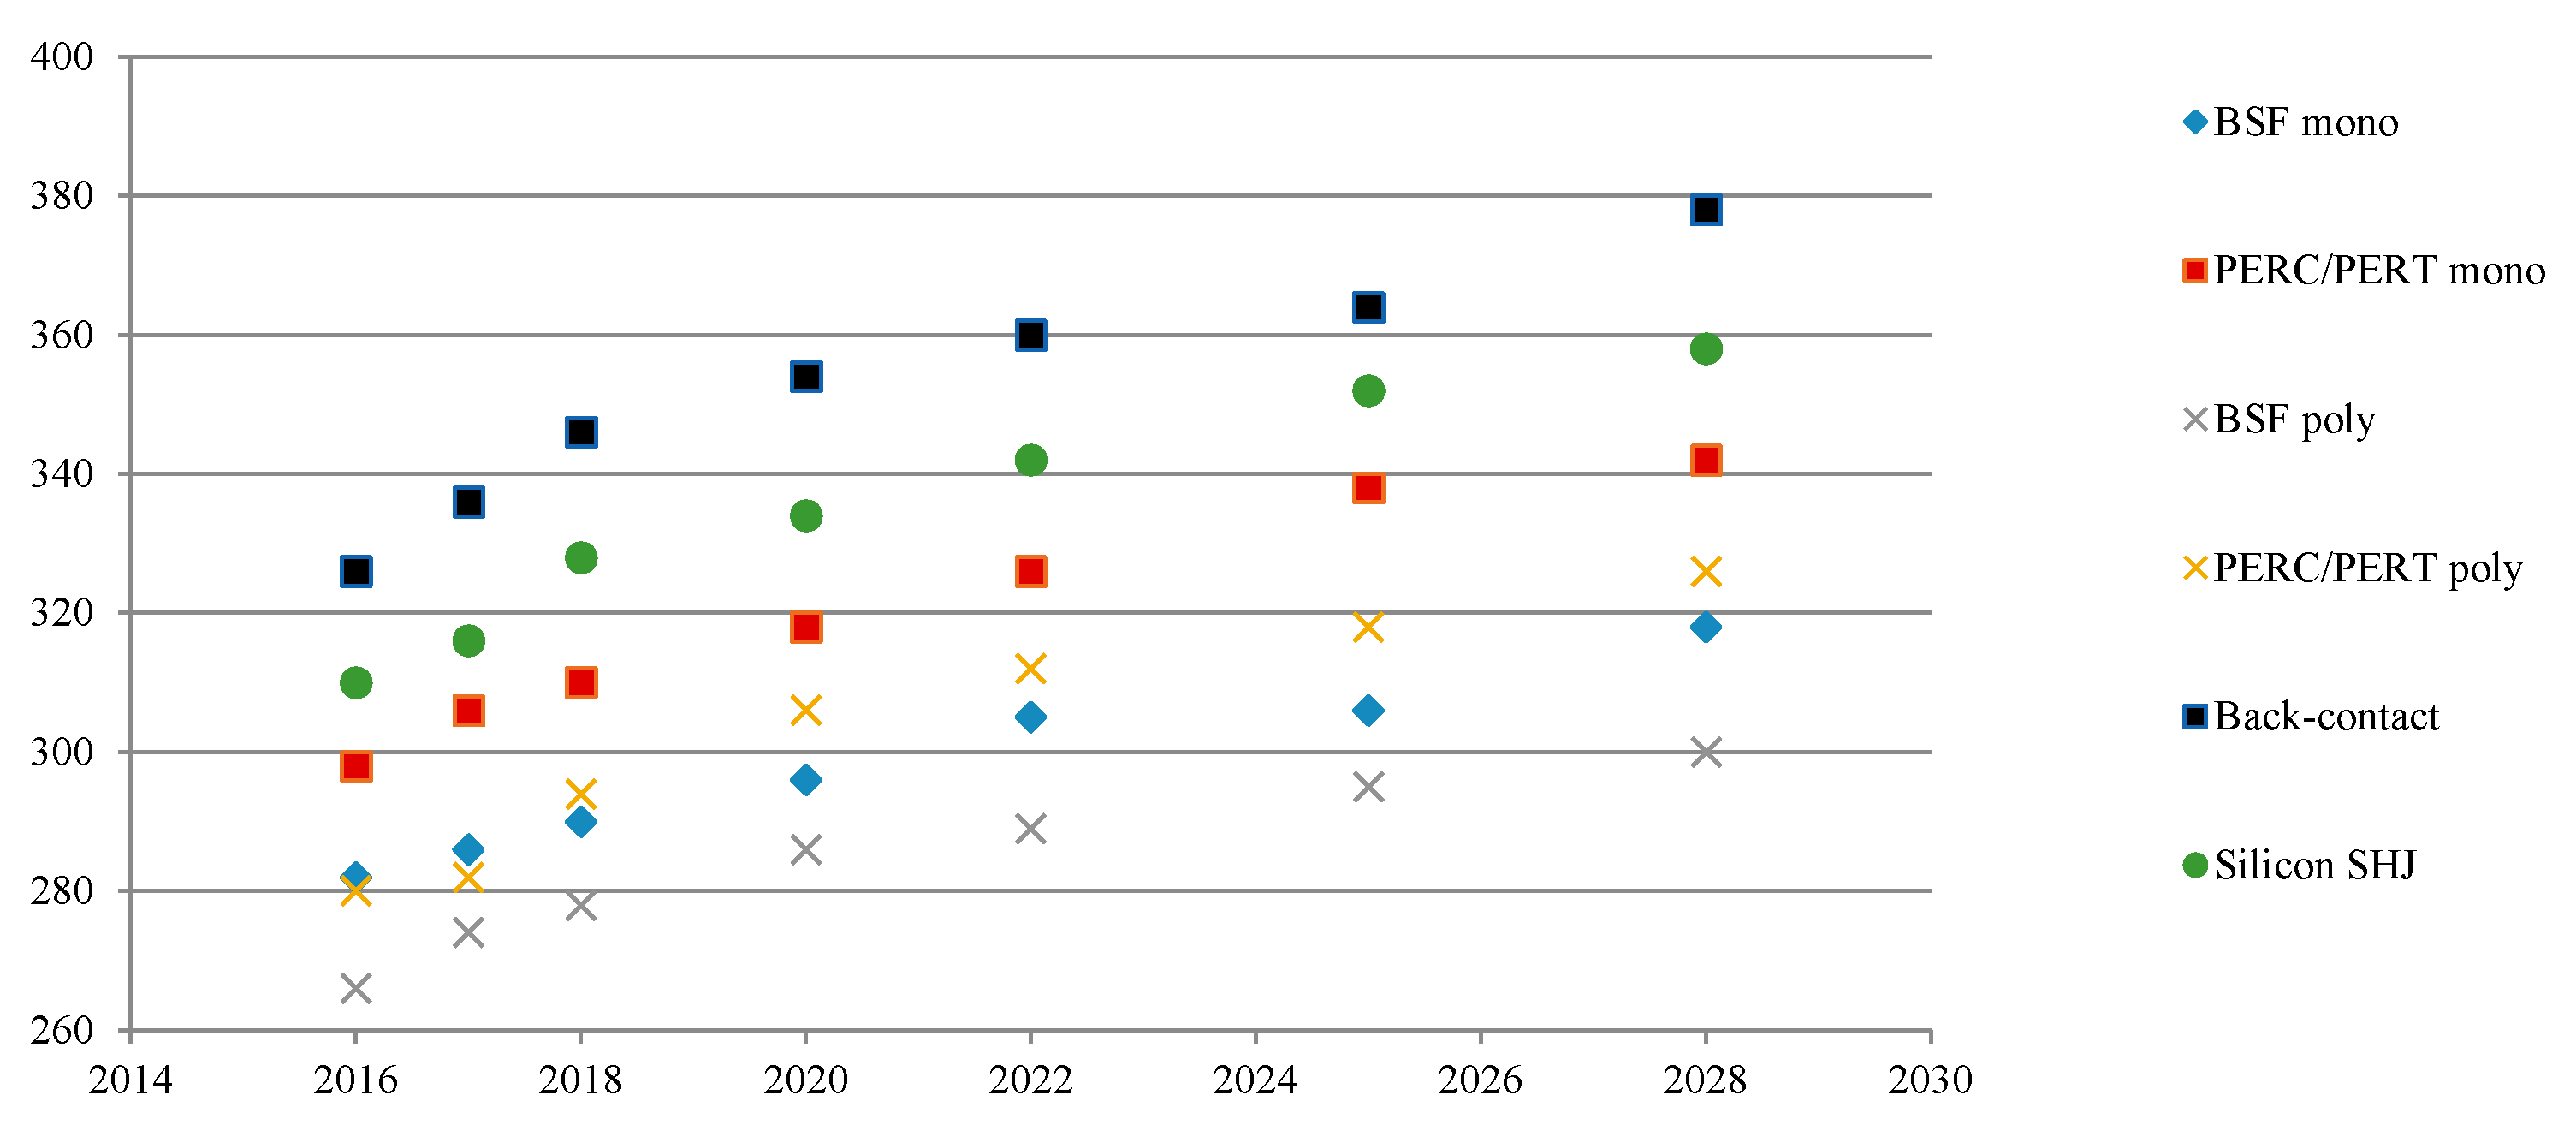
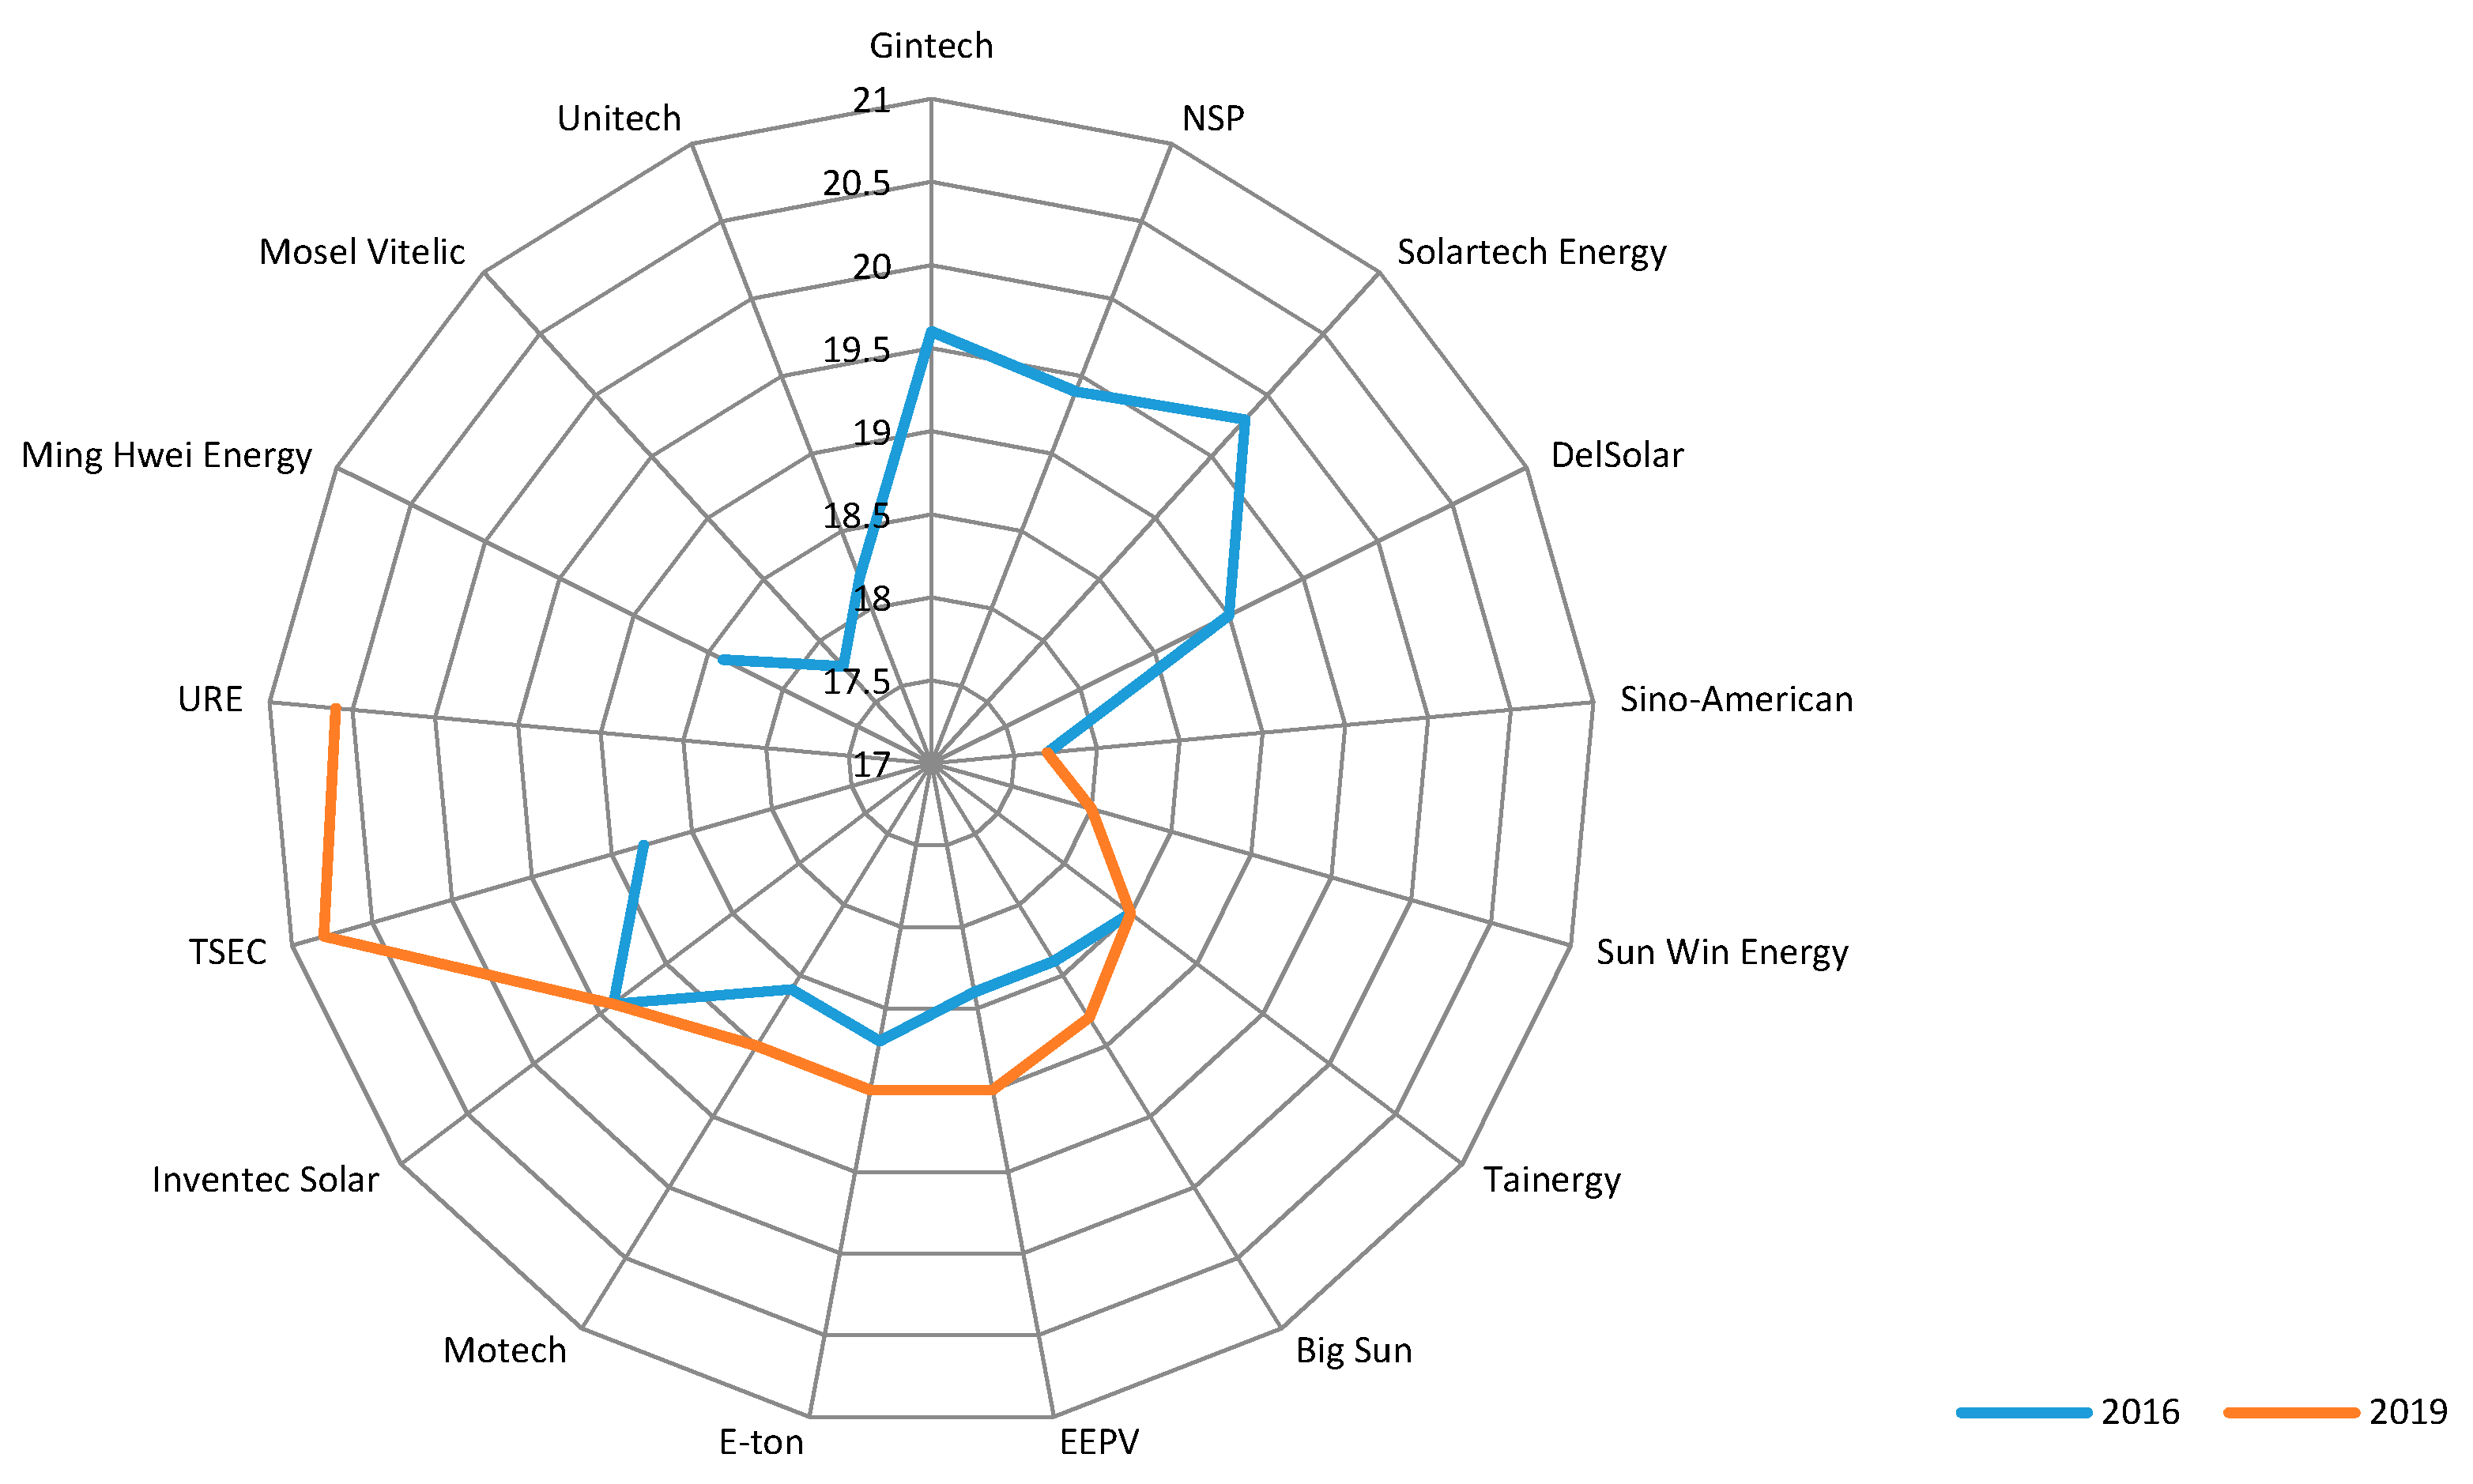
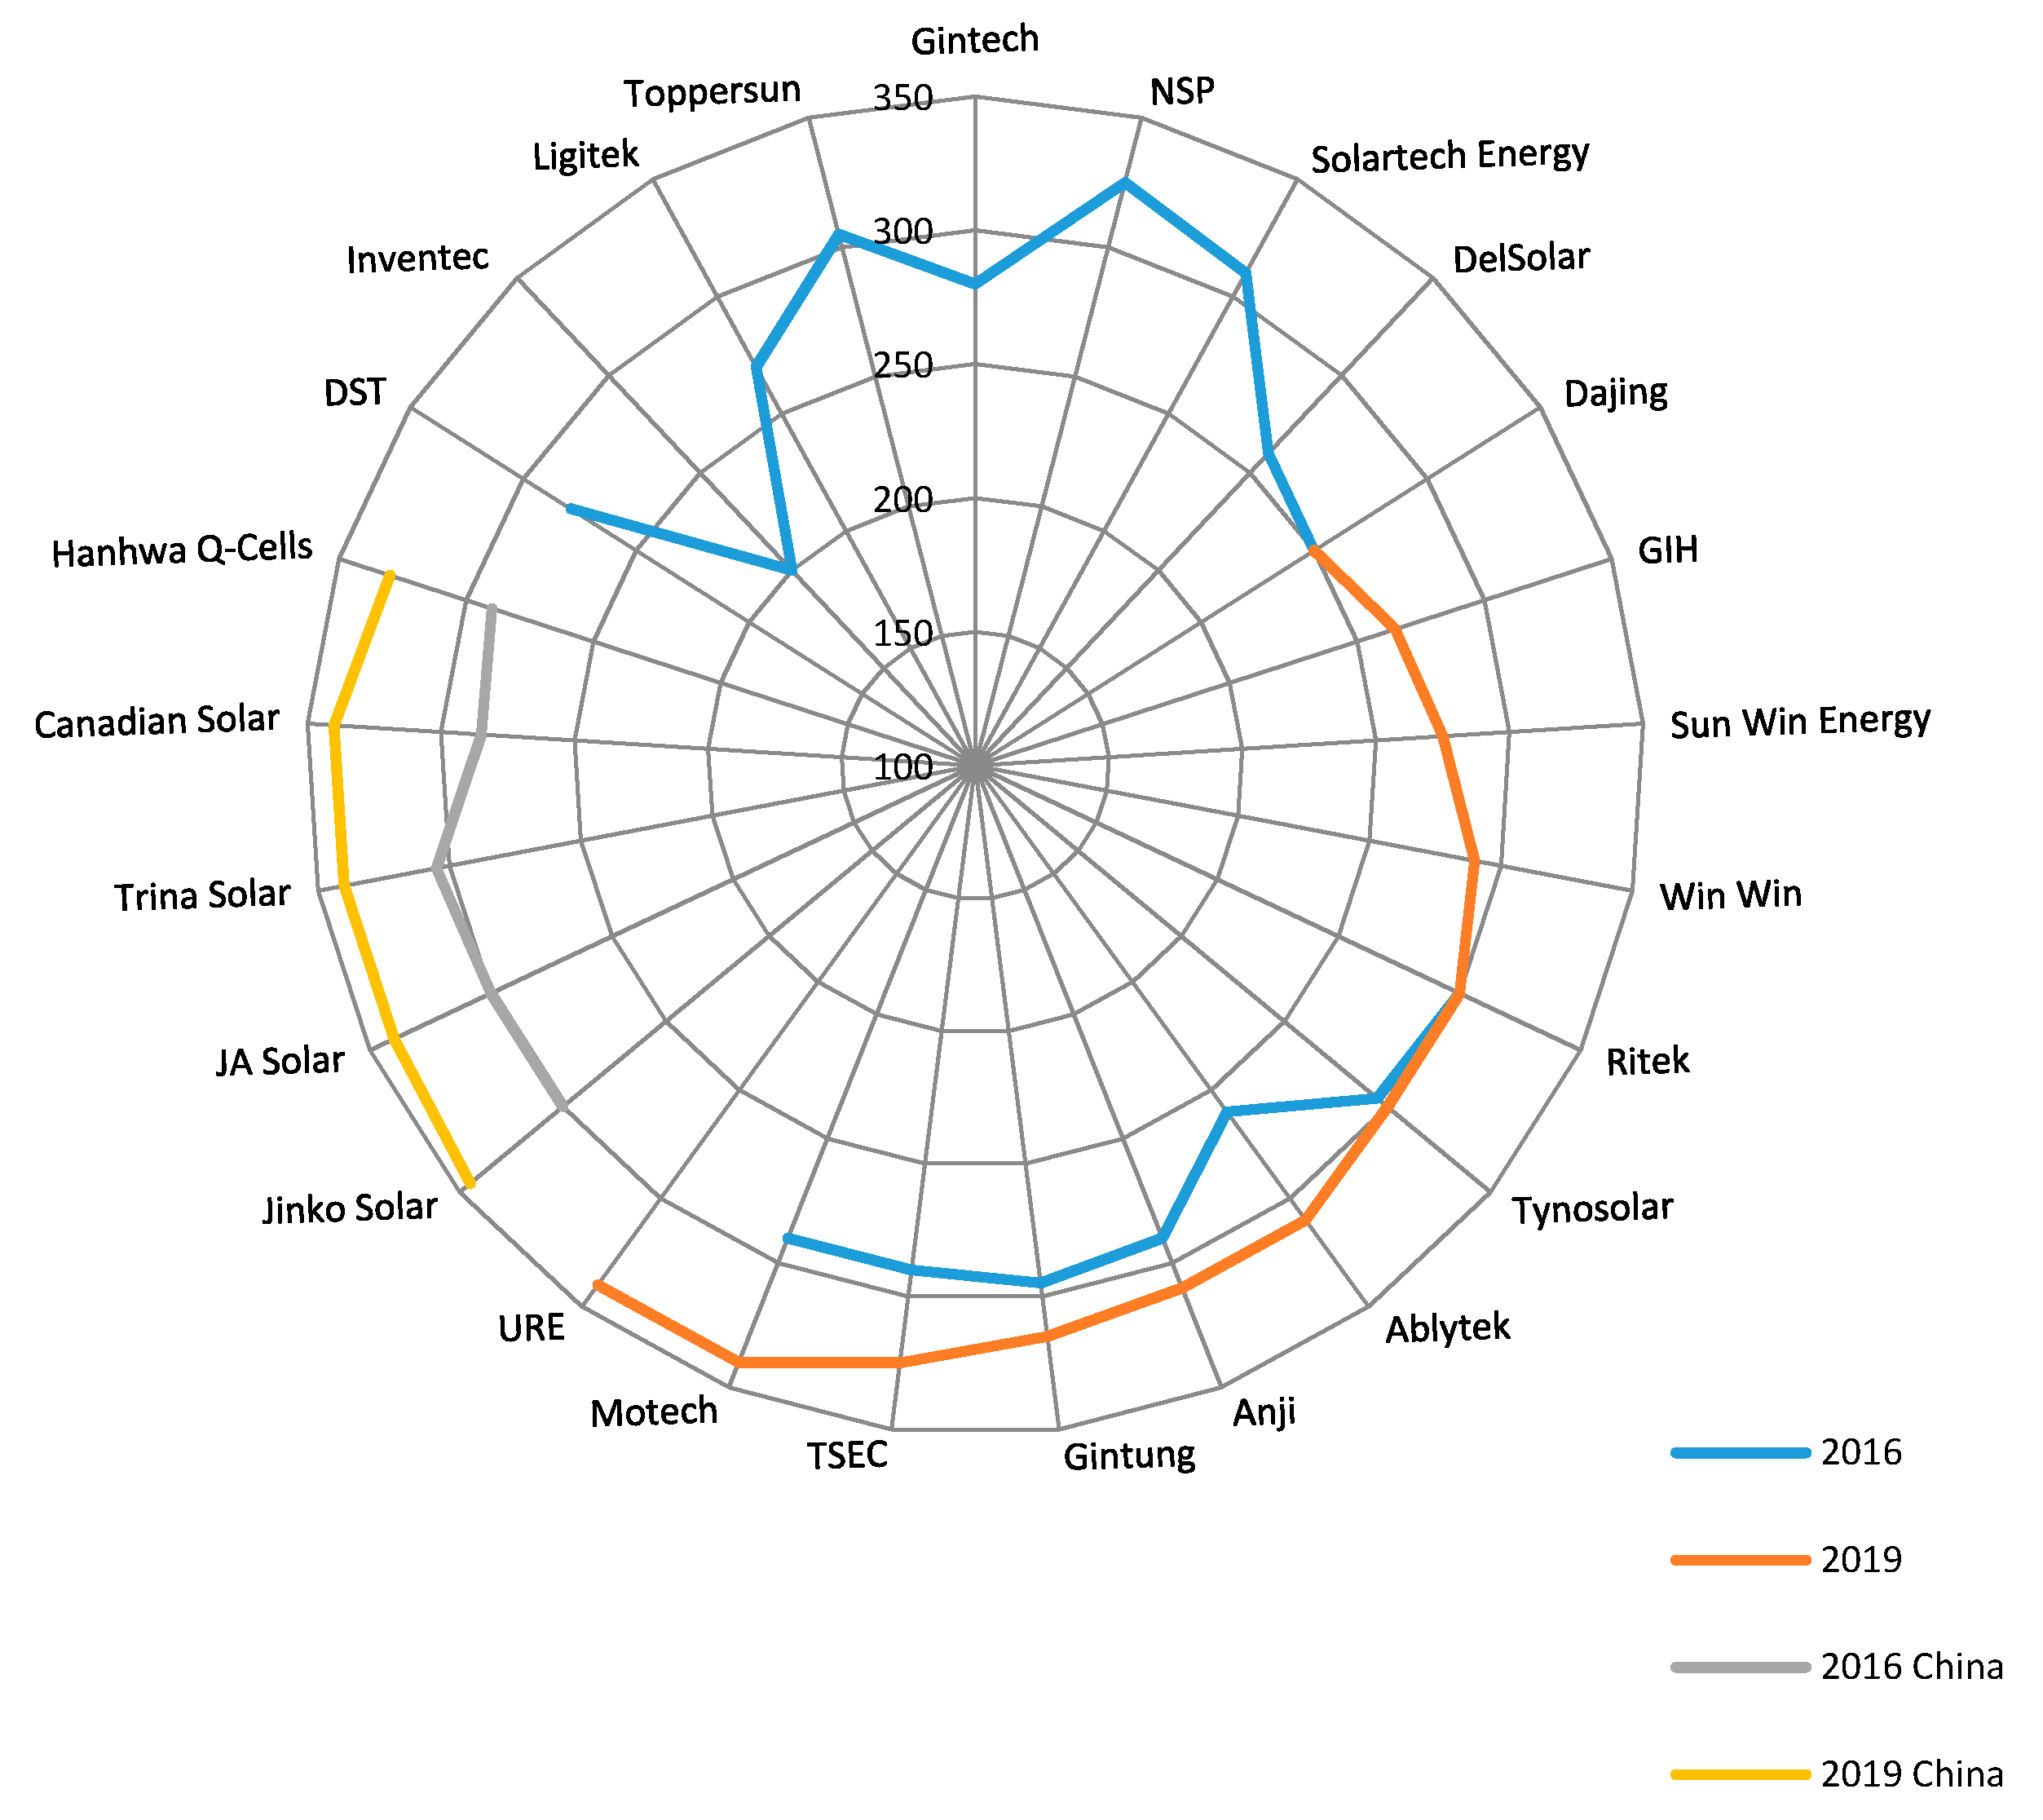
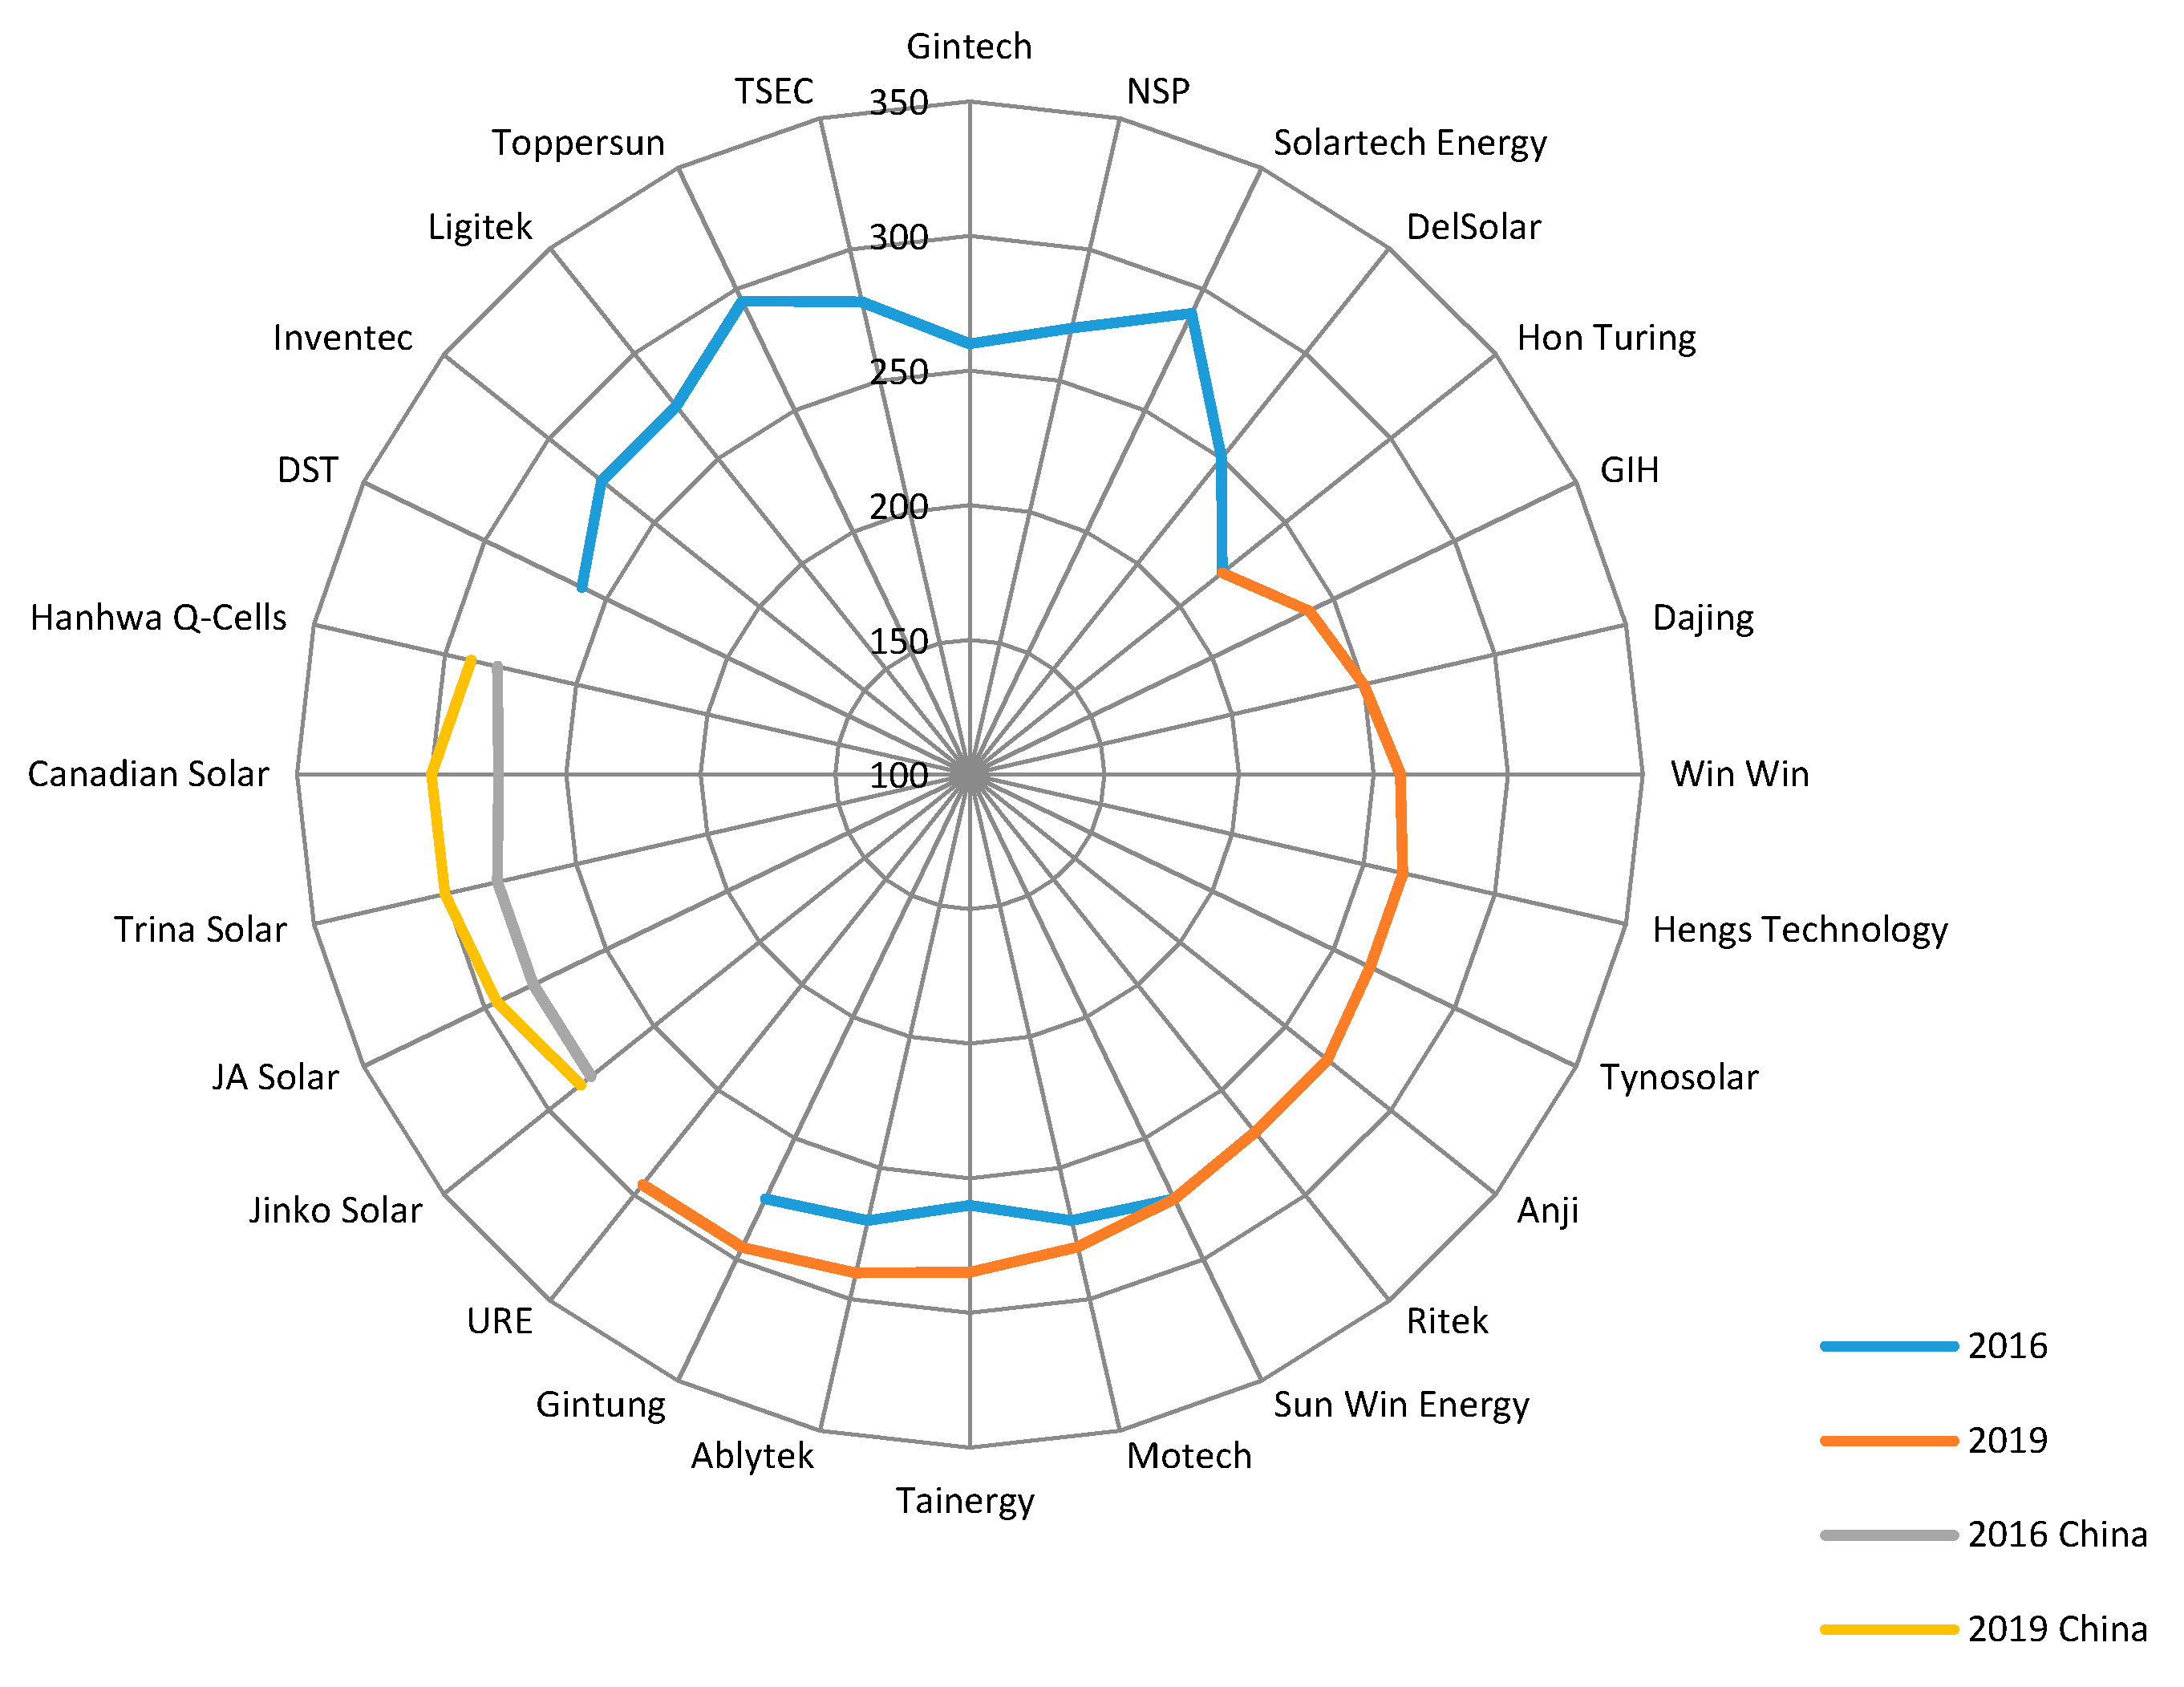
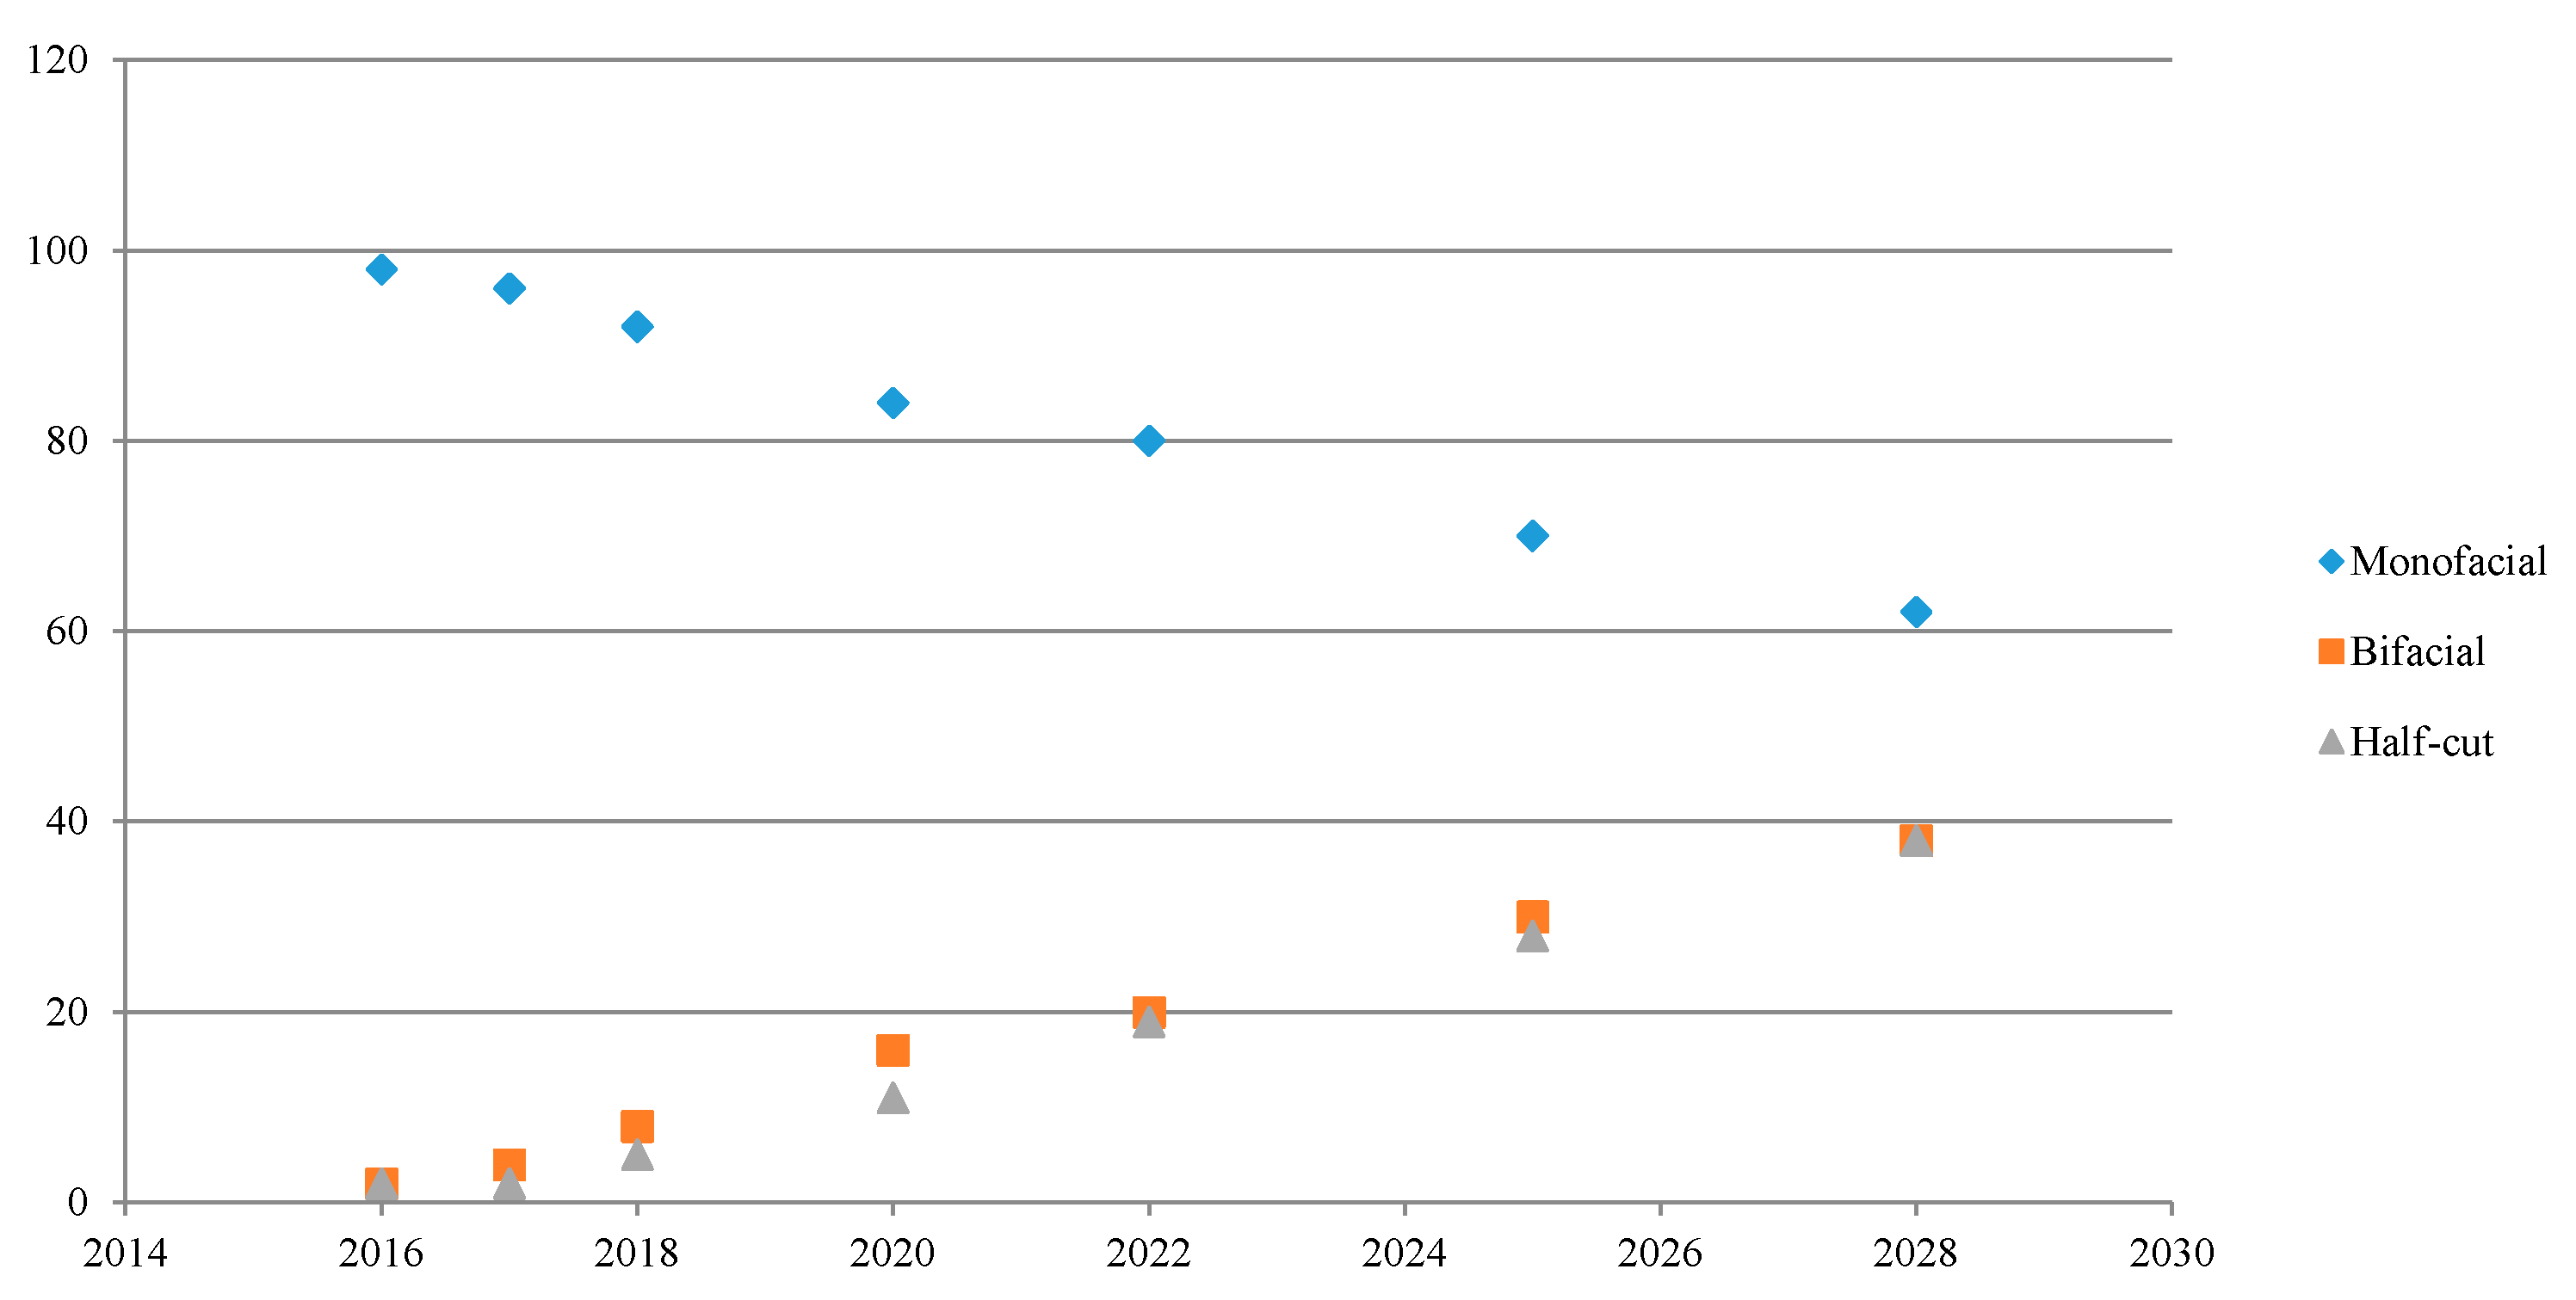
Quantitative: cell and module efficiencies, efficiency, and power progress noted in cell and module categories.
(2)
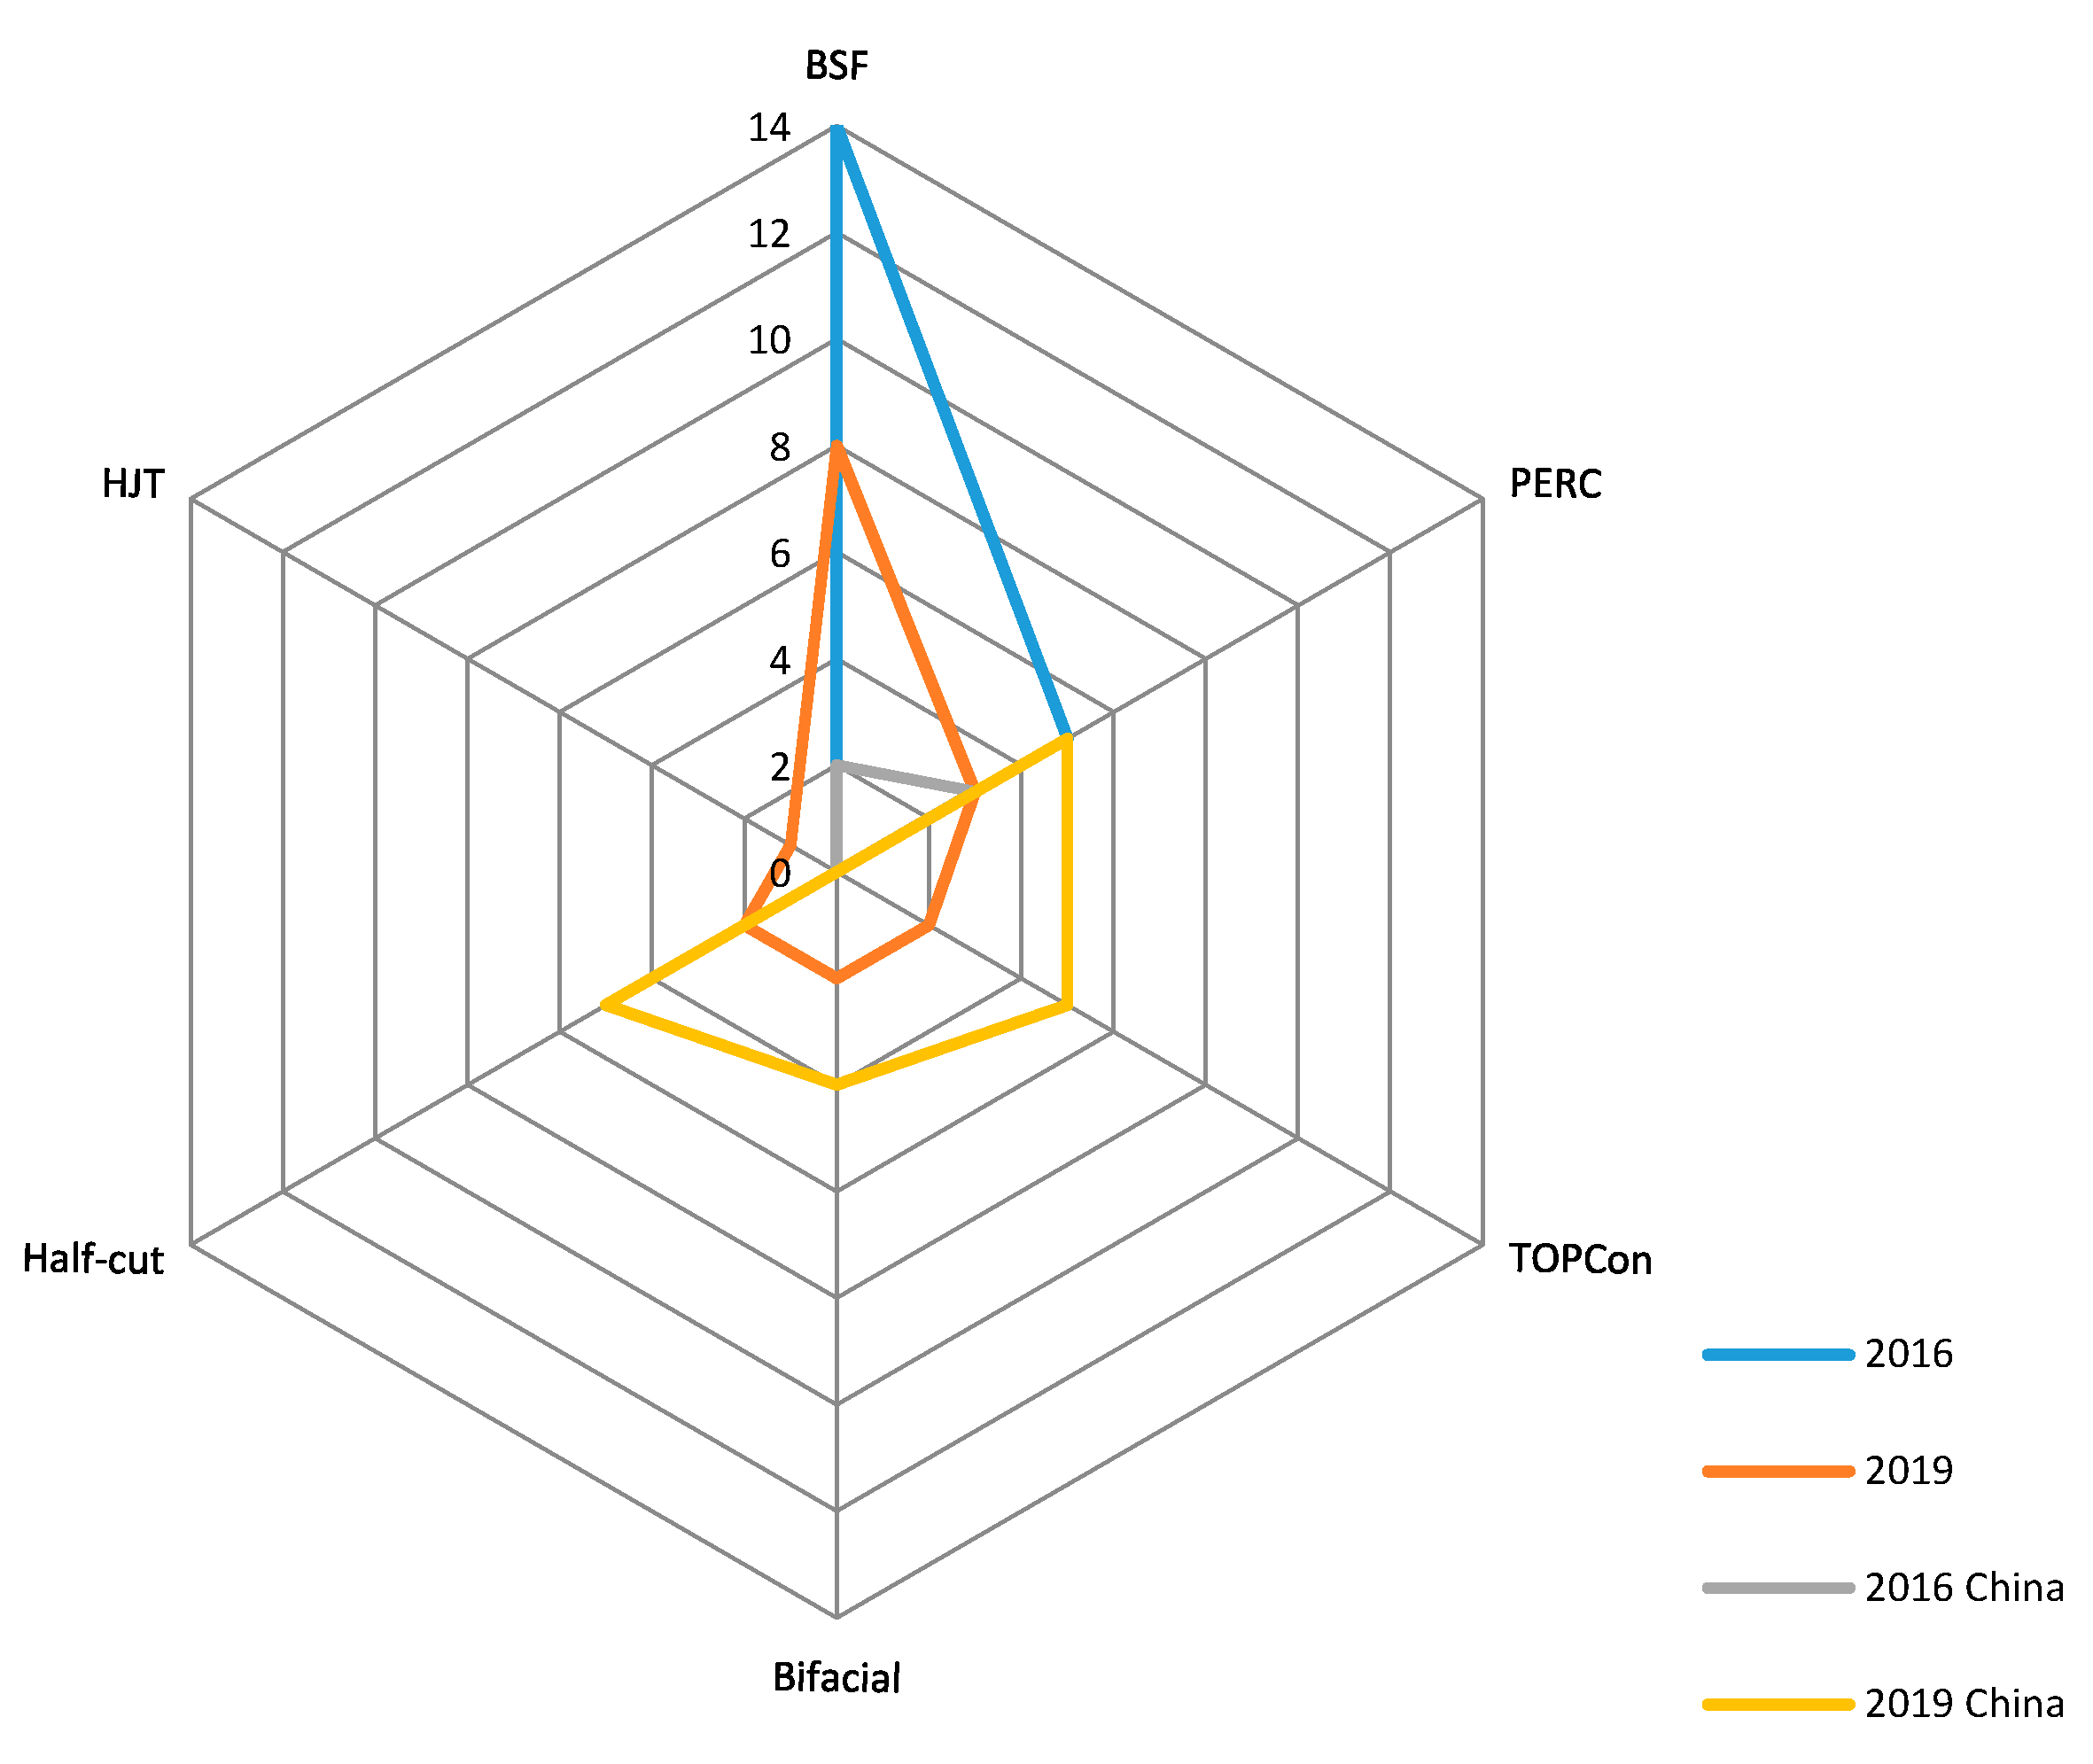
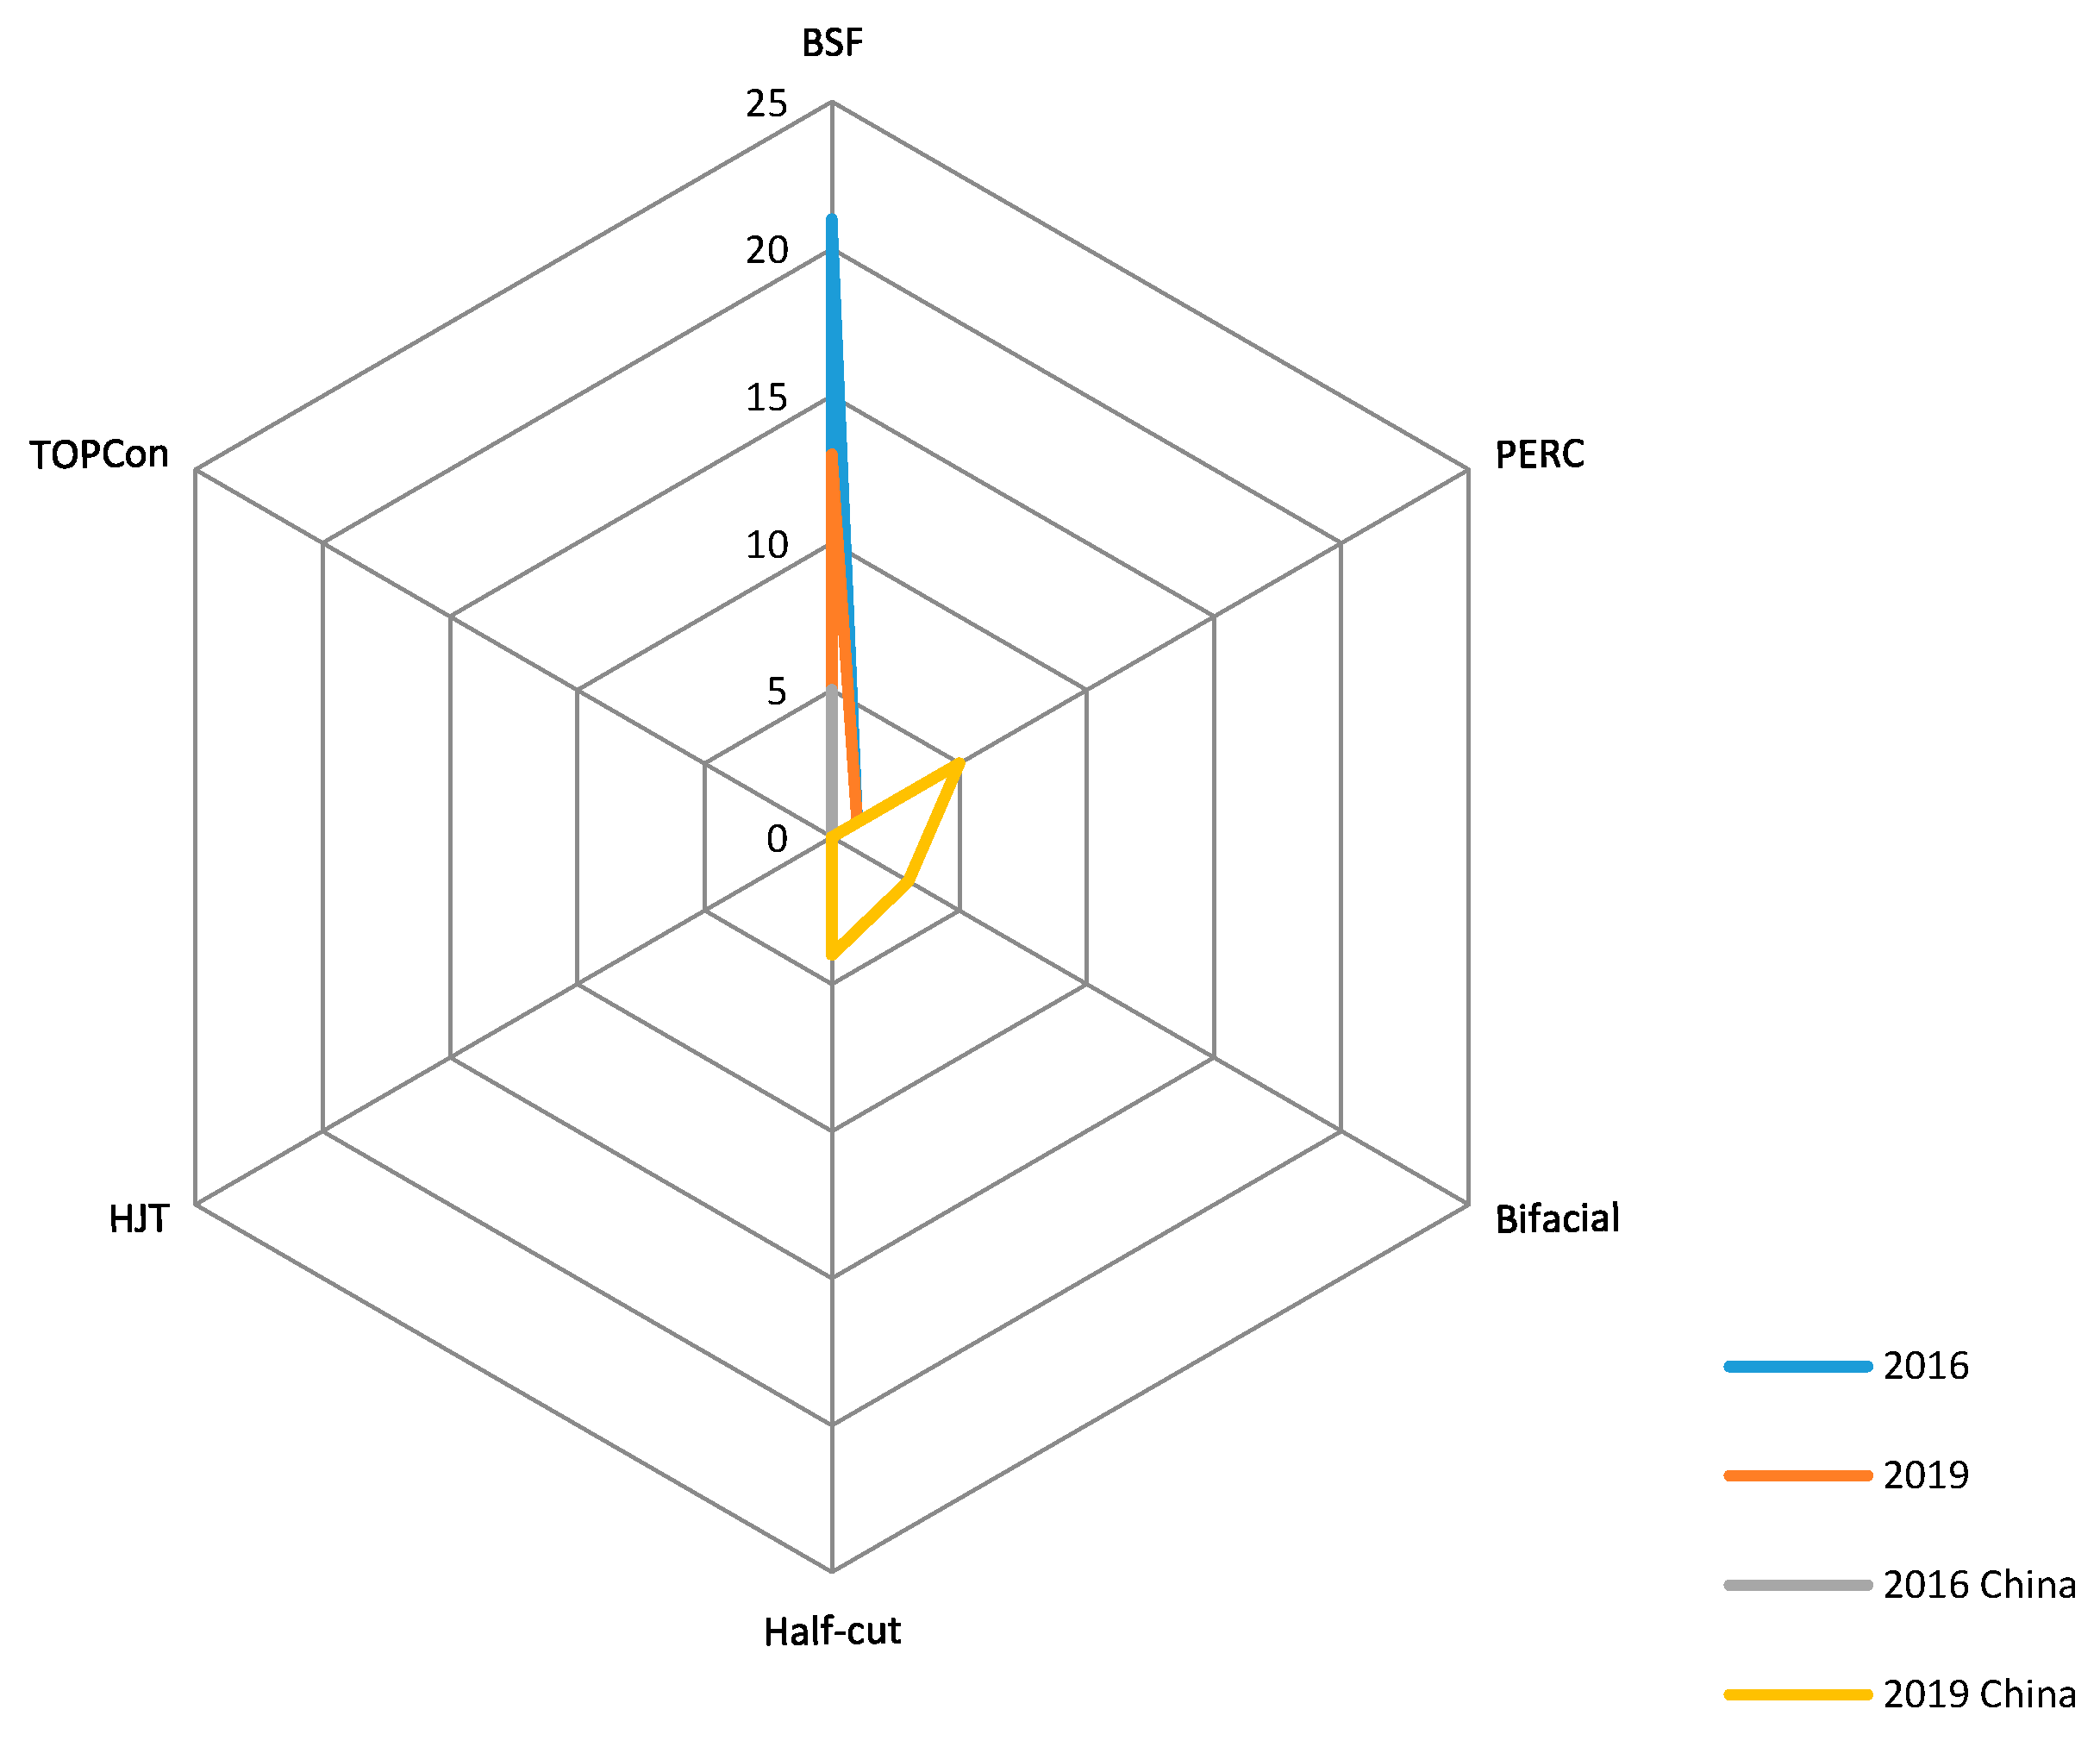
Qualitative: cell and module technologies of the main categories of mono and poly, cell, and module technologies of the sub-categories of PERC, TOPCon, HJT, Bifacial, and Half-cut.
According to industry trends, many cell manufacturers also expanded their offerings in the module category. In addition, a significant number of companies were purely dedicated to either cell or module delivery. For these reasons, the authors decided to divide the analysis into two groups (modules and cells). Therefore, the results remained consistent.

3.2. Results

3.2.1. Market Uncertainty 2016–2019

During the analysed period, the market experienced disruptive price volatility, including two shocks, first at the end of 2016 and the second in the middle 2018, which were followed by the technological shifts of unprecedented pace. According to NREL [31,32] and the pv-magazine Module Price Index [28,29,30] data (Figure 2), the prices dropped by around 26% for cells and 30% for modules in 2016. Searching for the causes of the abrupt price adjustments, one could charge the excessive expansion of the manufacturing capacities, including the delocalization from China, which mitigated the negative impact of anti-dumping regulations in the Western countries. As far as the 2018 shock wave is concerned, the spark originated from the Chinese authority’s announcement regarding the amendments in the PV policy [34]. Well within the analysed period, the industry prices sunk over 60% in each category (Figure 2), and the market was flooded by an abundance of products previously designated for Asian installations [35]. Already in short term, the sinking prices lead to the elevated number of projects, and, as a result, to the record high capacities installed elsewhere, except China and US (Figure 3). The total global amount installed in 2018 was still slightly higher when compared to those in 2017. Therefore, the manufacturers operated on the markets driven by the steep demand without a chance to benefit from the PV rush income-wise.

3.2.2. Taiwanese PV Industry Transformation
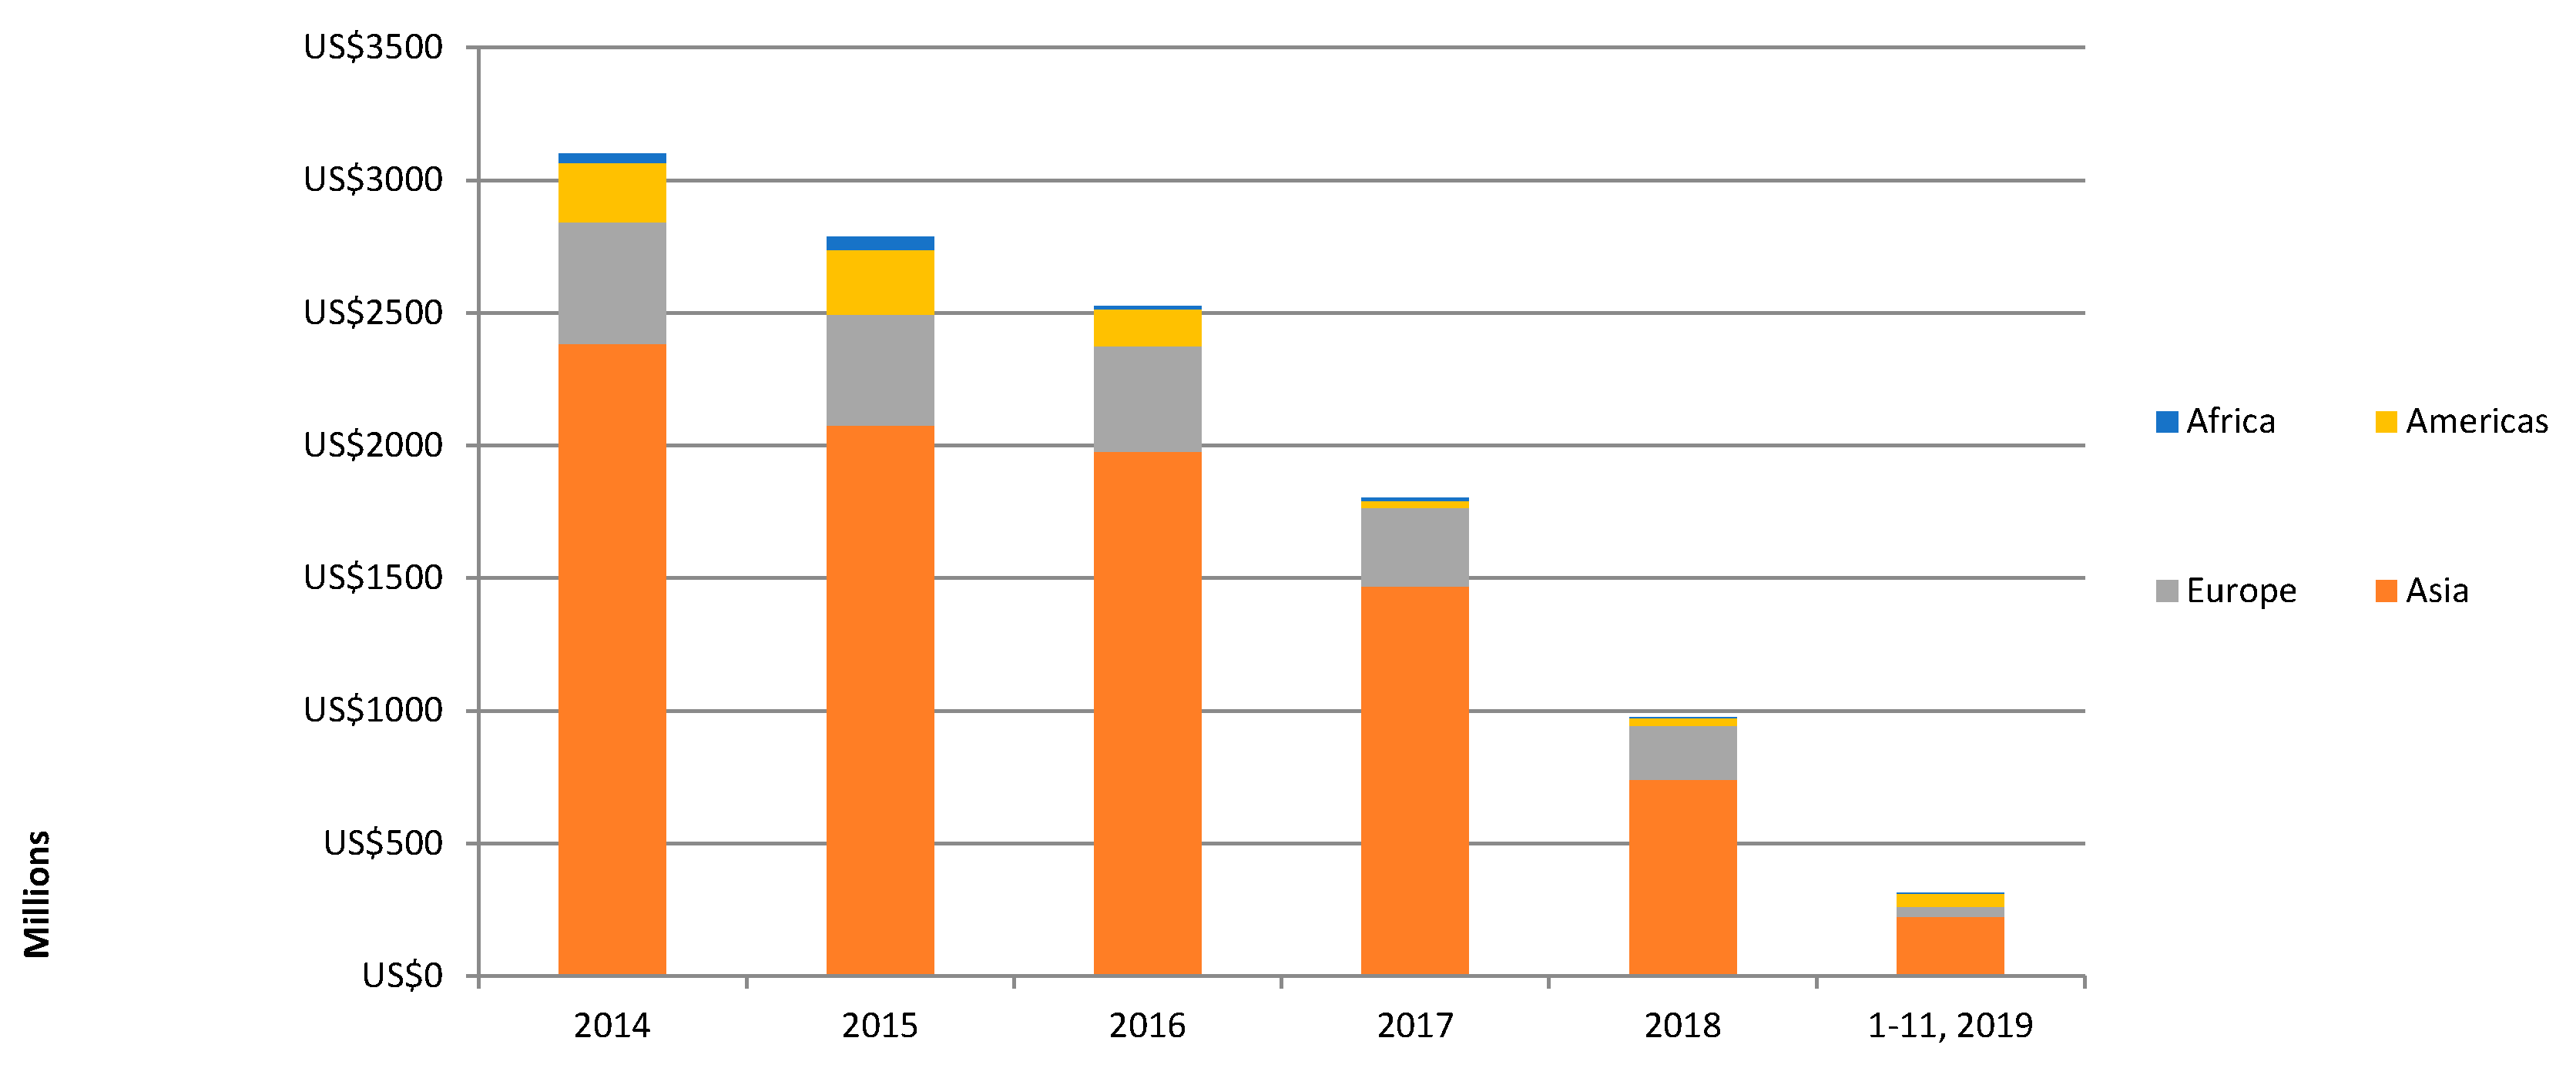
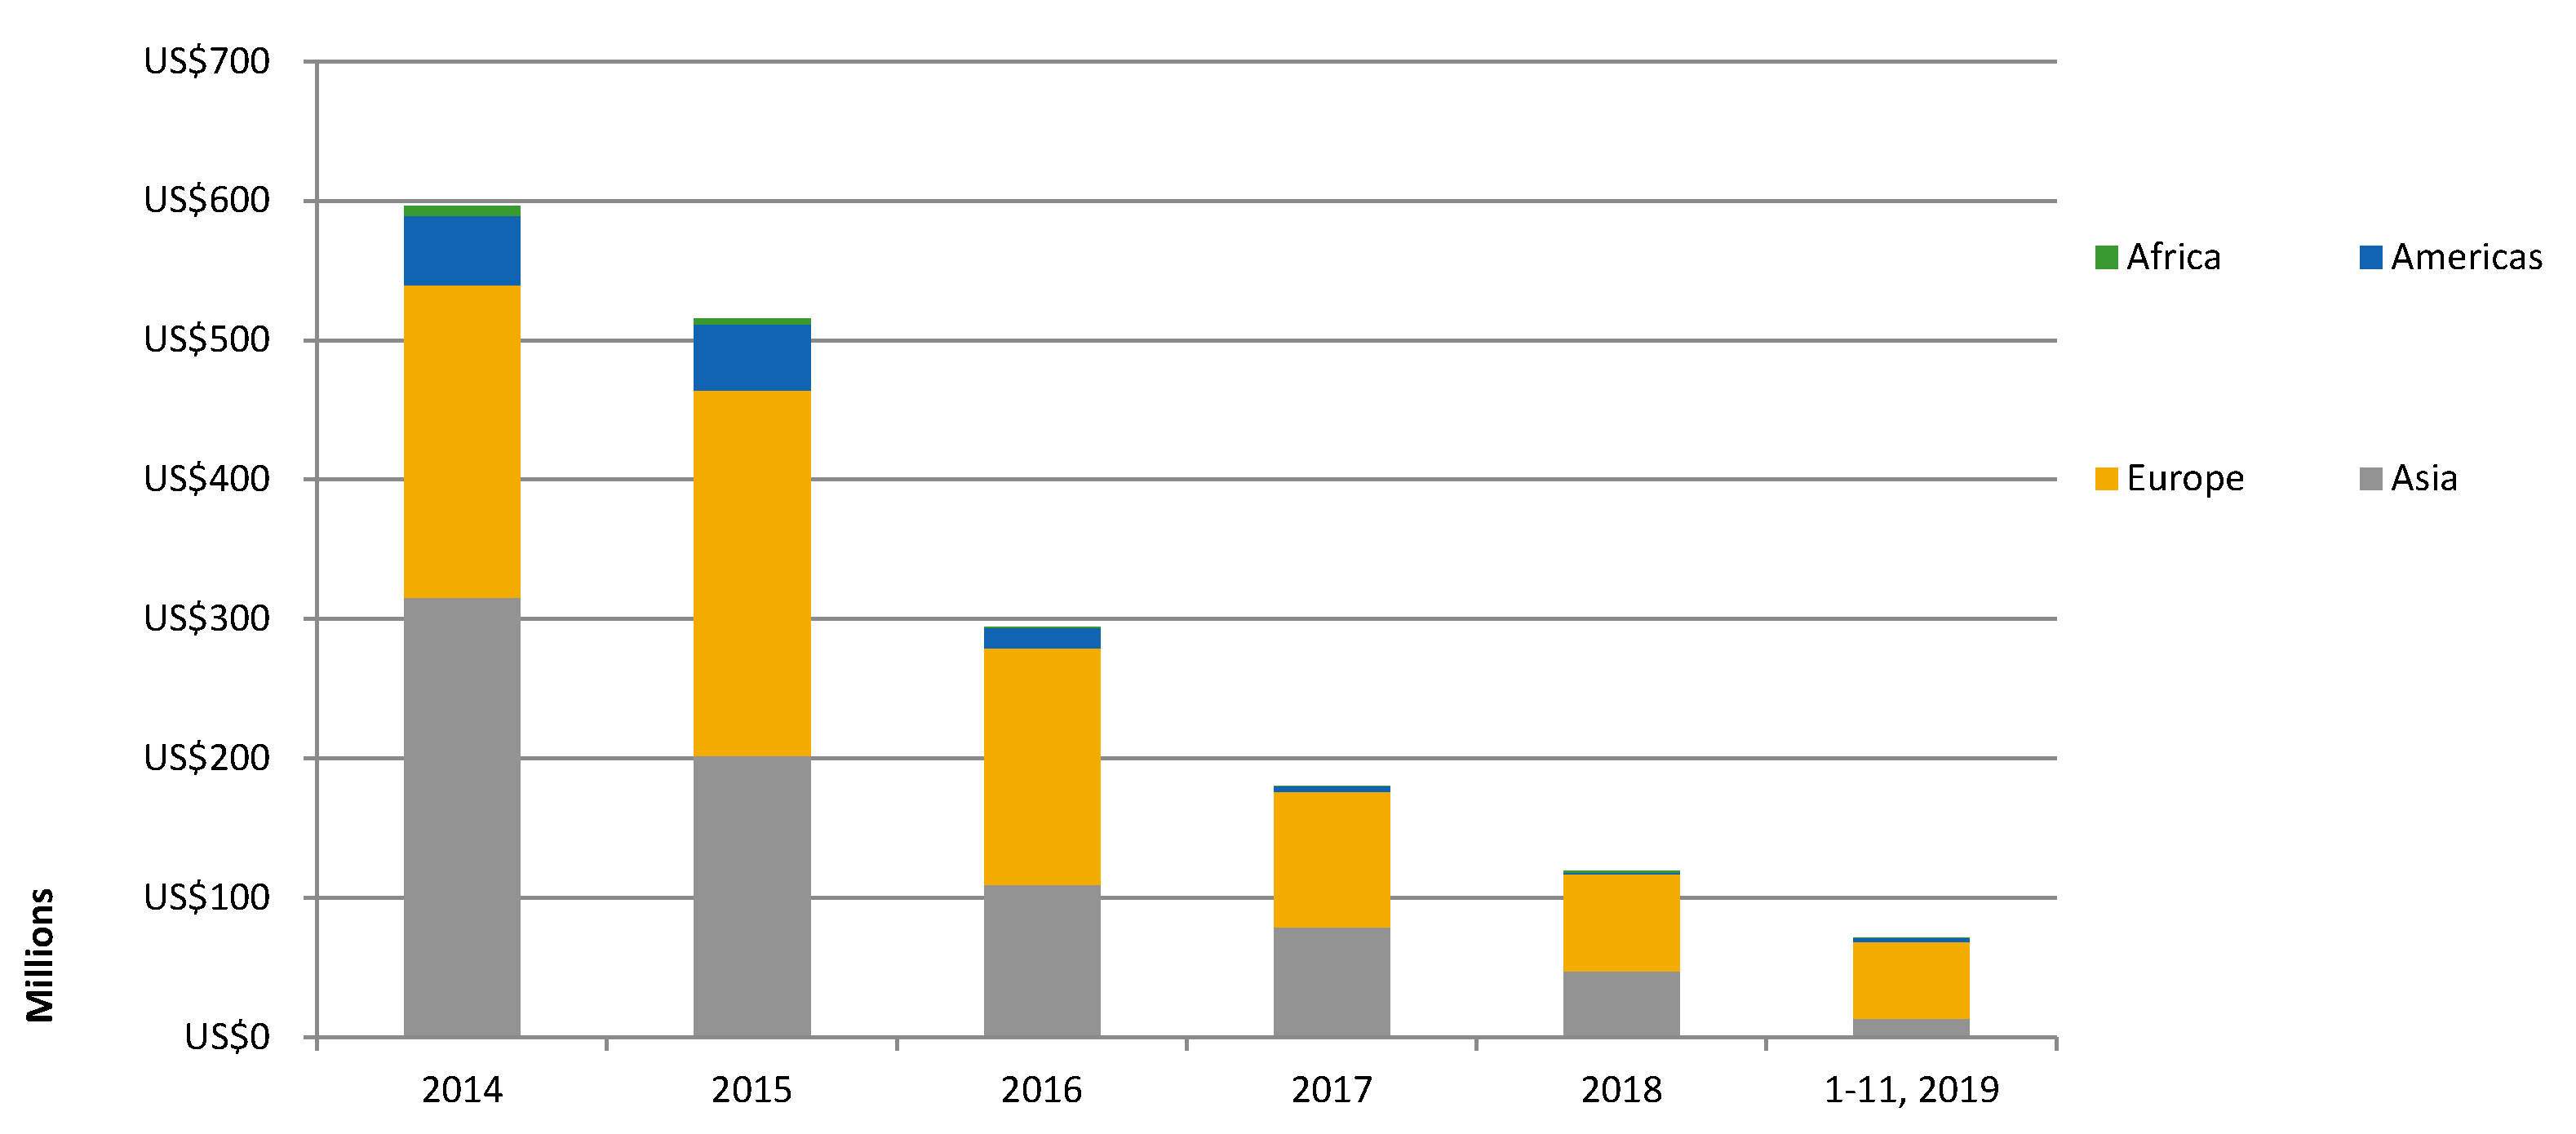
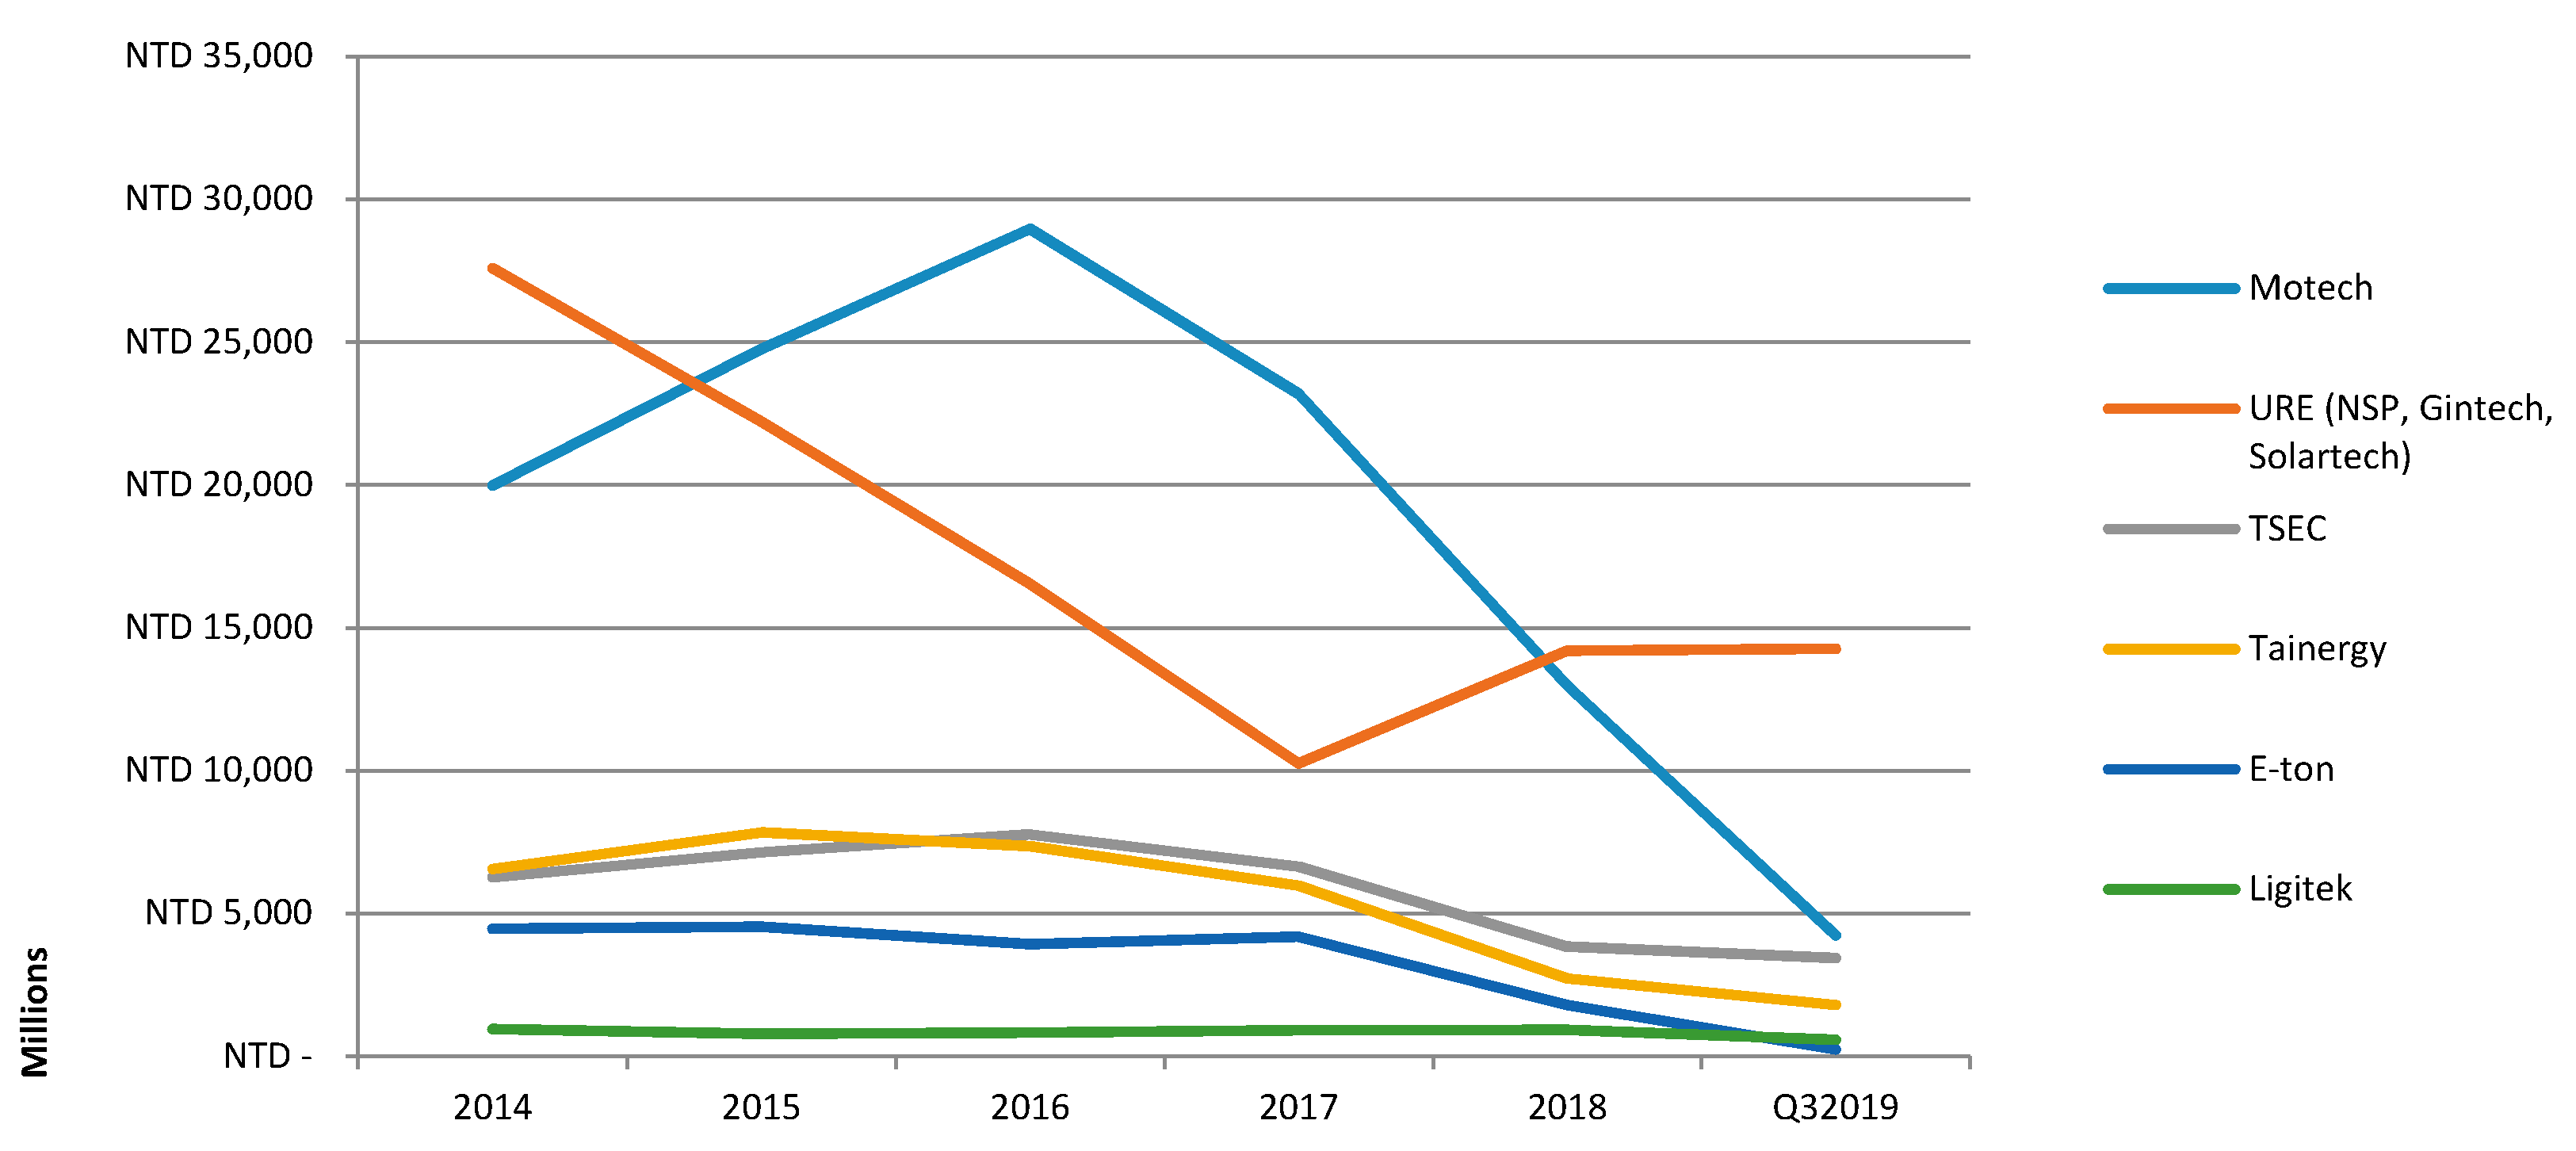
Sales and Operation

During the period, the Taiwanese PV companies experienced a drastic drop in revenue. Paradoxically, such a situation brought on new business opportunities to well-exposed and globally recognized Tier-1 manufacturers experienced in international distribution. The Tier-2 and Tier-3 suppliers found themselves in the demanding market of improving quality and technological expectations, where unreachable Tier-1 producers supplied 70% of the goods. Although one could name a few Tier-1 companies located in Taiwan, due to the high manufacturing costs, their competitive advantages shrunk drastically, which was reflected on the industry level through the export volumes (Figure 4 and Figure 5), and on the company level through the revenue drop within the analysed period (Figure 6).

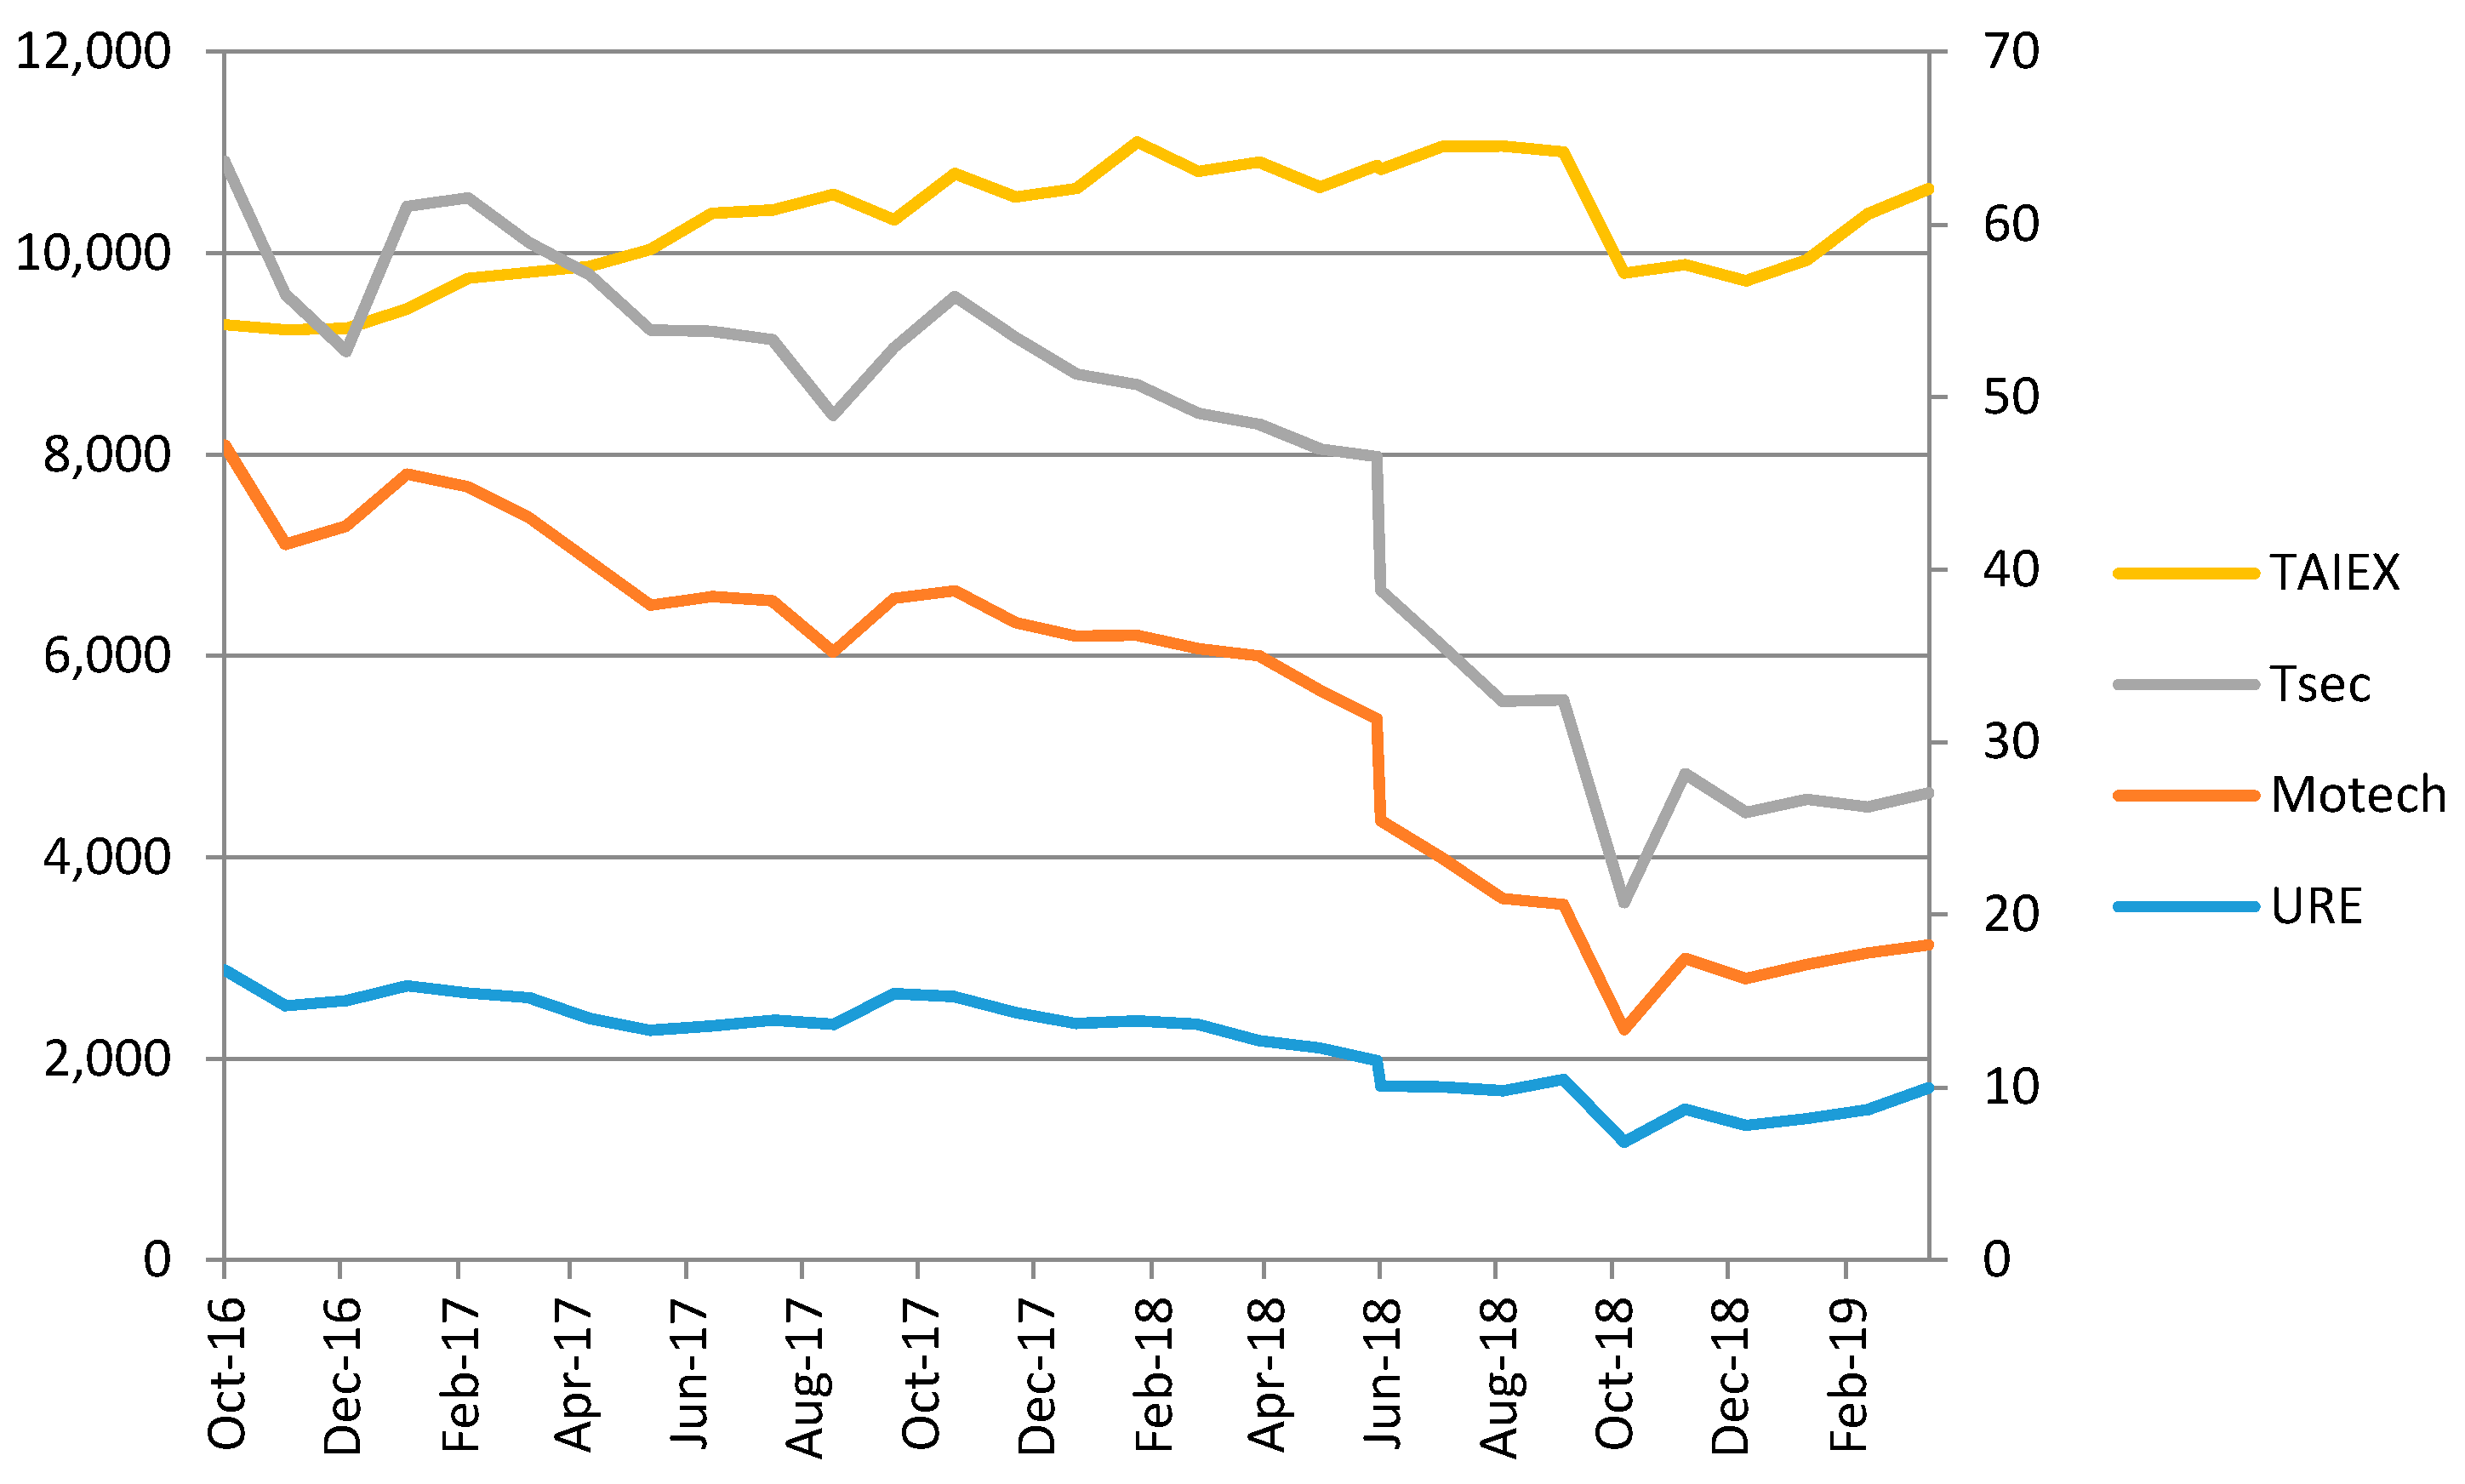
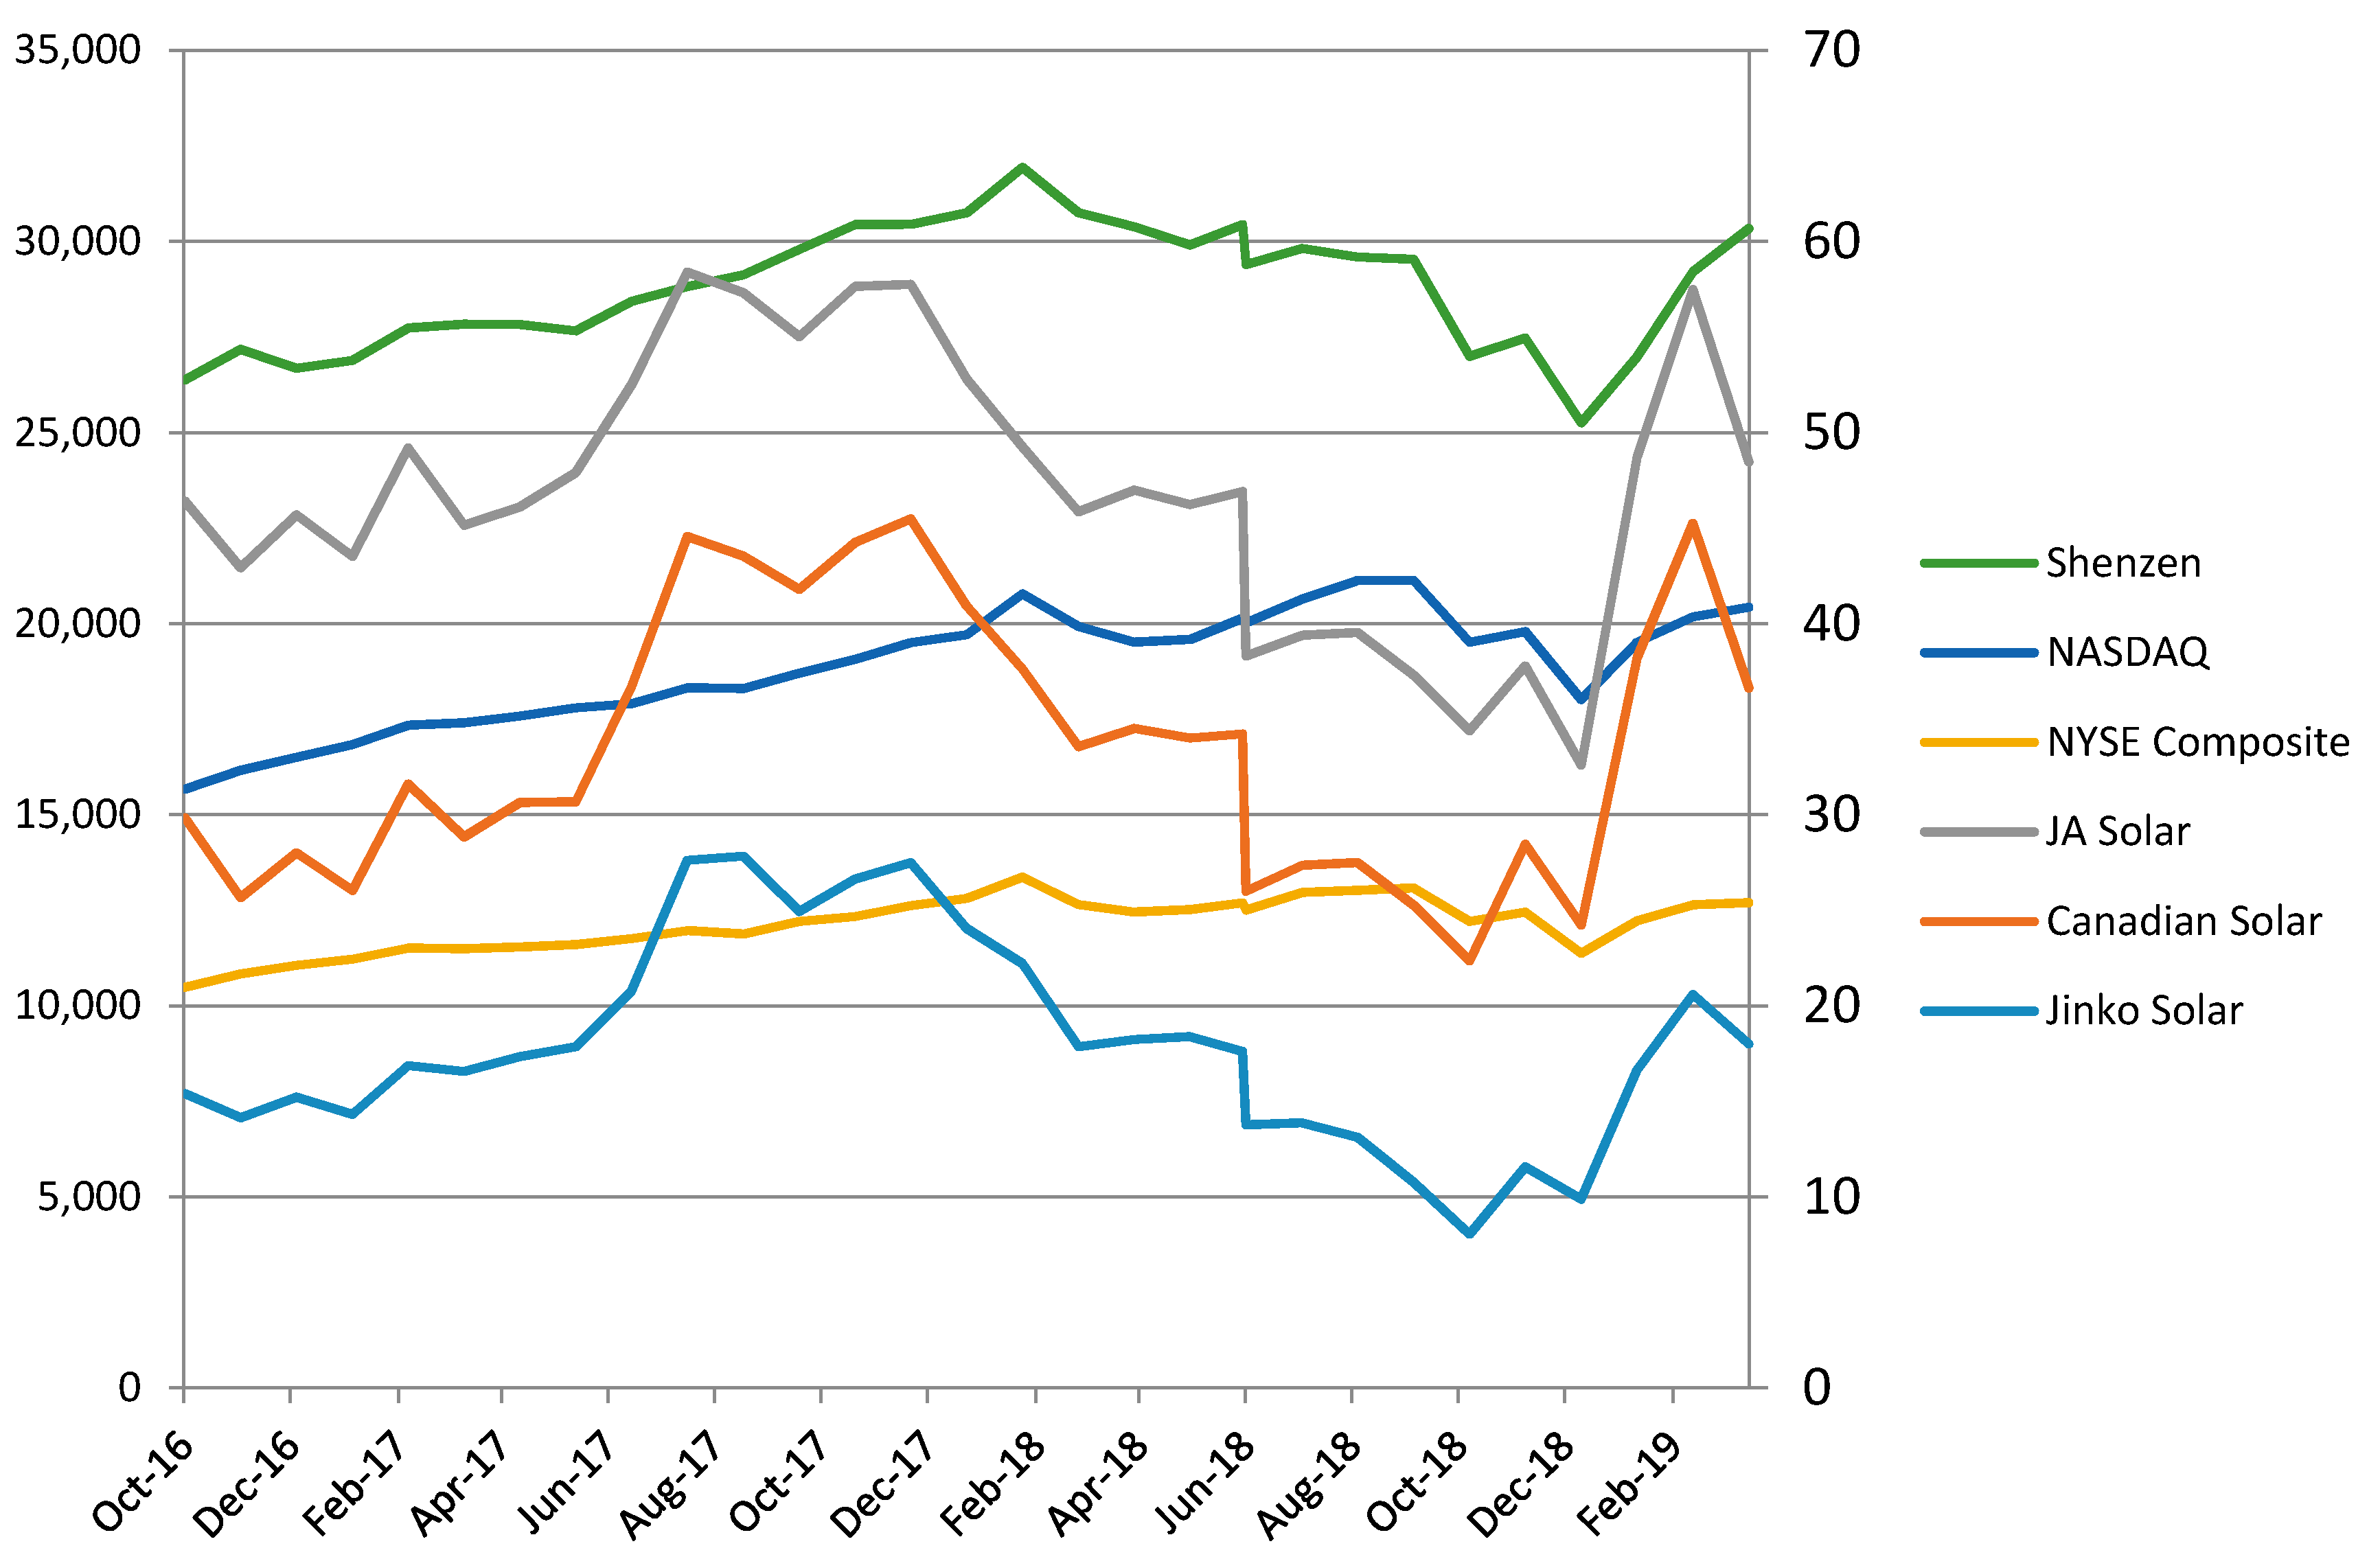
Stock Market Performance

In the consequence of the end-product negative trends, local entities not only experienced the substantial drops in the revenues but also faced a situation where the manufacturing costs could not justify the prices expected by the end customers. Within a relatively short period of time, the companies lost their capacity to generate incomes, which stands for a crucial factor in the eyes of financial markets. Although PV energy is considered to be the future and the PV companies experience a rather stable growth on the stock markets, the chances of entities are assessed not only under a period of uncertainty, but also as a derivative of the capacity to swing to profits over mid-term or long-term. Briefly speaking, companies hit by the shocks should deliver to investors the faith in the strong business foundation for the future. This foundation could be constituted by the possessed space to decrease the costs, reinvent with the novel technology, or reorient the activity. In case of Taiwanese PV suppliers, stock markets did not have the clear picture of the future. The stocks of three major entities: Motech, URE, and TSEC dropped sharply (Figure 7) with the relatively strong performance of the local index: TAIEX.
As one could assess from the graphs, the stocks of the Chinese producers, unlike those of Taiwanese producers, experienced greater volatility moving sideways (Figure 8). The downward trend is not easily drawn. Furthermore, the Granger causality results clearly indicate the major differences in module price drop and cell price drop with stock valuation interdependencies (Table 1).
As presented in the table, the null hypothesis about a lack of Granger causality of module or cell prices on the Taiwanese PV stocks was rejected in multiple cases. First, as far as the mainstream module price was concerned, one could state the inter-dependency for URE, Motech, and TSEC. Secondly, in case of the solar cell independent variable, the inter-dependency took place for URE and TSEC. There was no Granger causality found for the TAIEX index.
As for the Chinese stocks, not a single inter-dependency was observed, meaning that either the module price or cell price drops could not serve as predictors to the valuation of the PV stocks in a Chinese set. With the similar market conditions and exposition to the harsh volatility of the end-product quotations, investors did not react with the sell-off symmetric to the Taiwanese market.

Industry Consolidation

The substantial revenue decrease valuated by the market could have a direct impact on the industry structure itself. Recent literature indicates that, under the uncertain market circumstances, the PV supply base, both in Taiwan and China, is said to consolidate, so the obsolete and redundant lines do not weigh on the future growth of the companies [37,38]. This statement appears to be confirmed in our investigation. According to the data in 2016, in the cell category, authors enlisted 16 entities. However, the number of companies active in 2019 was significantly lower and dropped to 10. Most importantly, one should mention the merger of NSP (with its subsidiary DelSolar), Gintech, and Solartech, which nowadays operates under the brand of United Renewable Energy (URE) as the biggest entity in Taiwan. Furthermore, the consolidation trend could be observed in the module producers’ category as well. From a total of 22 entities at the beginning of the period, only 16 displayed the offers at the end of the period.

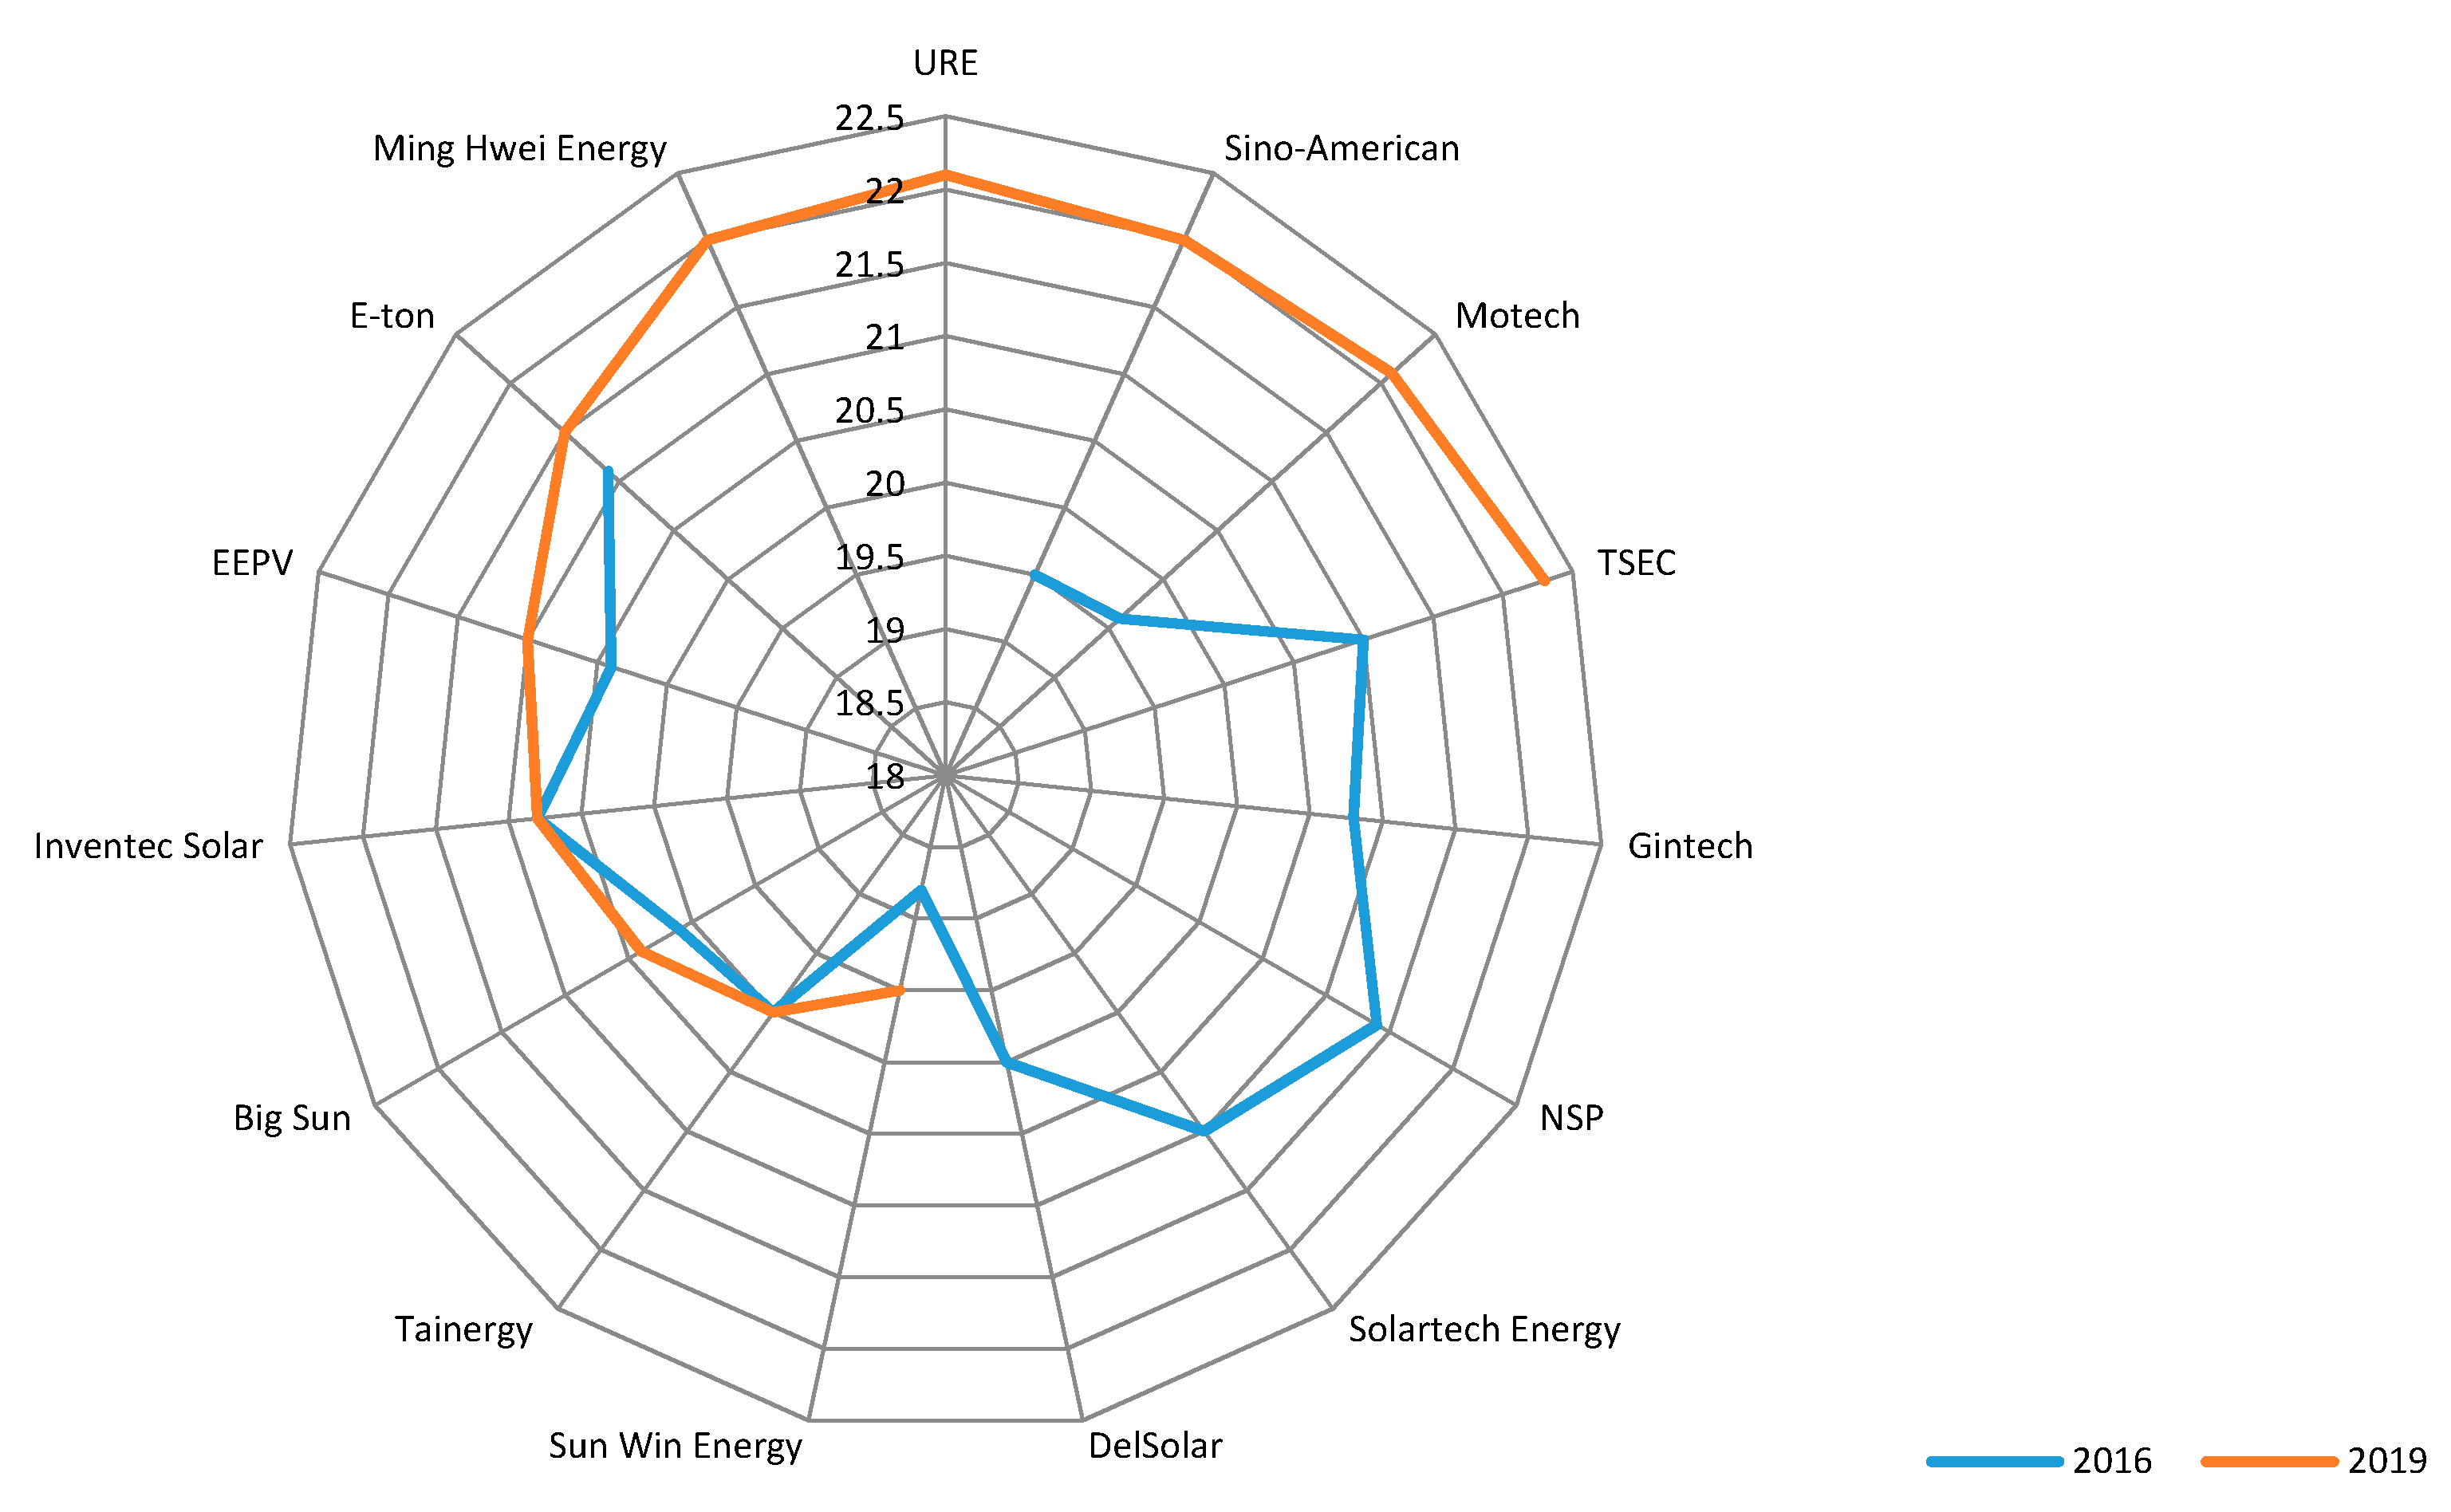
3.2.3. Taiwanese PV Industry Technological Advancement

The healthy industry’s structure leads to the possibility of technologically advanced output. In this research, authors examined the progress values through the technological levels of the products offered in the beginning, and at the end of the target period. The comparisons were developed for the local market, as well as with its Chinese counterparts to reflect the current standards.
The solar cell is the crucial component of the module, and, therefore, it represents the quality of the final product. According to the Solar Cell Efficiency Tables 53 [39], the current efficiency record belongs to Kaneka and its n-type IBC cell of 26.7%. However, the cell has not yet been commercialized. In June 2019, JinkoSolar demonstrated its cheetah n-type cell with the maximum efficiency of 24.58%, which was already incorporated into the module structure of nearly 470 Wp for 72 cells. Considering Jinko’s advanced manufacturing capacities, one could expect a product in their offerings relatively soon [40]. The race toward better performance will undoubtedly continue, especially as a response to the demand from developed markets where the space for PV projects is scarce and expensive [41]. The estimation of the future upgrades of the c-Si cells and modules in a short-term and mid-term perspective are presented in Figure 9 and Figure 10.
Quoting industry sources [26], as far as the mass production state-of-art solutions were concerned, in 2016, the maximum mono PERC efficiency reached nearly 21% and mono BSF reached nearly 20%. For poly, the levels were, accordingly, around 19.2% and 18.4%. 2019 brought the progress of mono PERC 21.8%, mono BSF 20.4%, poly PERC 20.3%, and poly BSF 19.1%. Confronting these levels with the data of this research, one could presume there will be high technological advancements regarding leading Taiwanese manufacturers. The average efficiency in the mono category equaled 20.39% while equaling 18.67% for poly. Importantly, in mono and poly segments, a handful of the Taiwanese manufacturers managed to surpass the levels indicated as the benchmark in the industry.
In the data set, the authors found the average efficiency increase of 0.84% in mono. As far as the highest achievements were concerned, we could point at TSEC, URE (Gintech, NSP, Solartech), and Motech with their cells that are nearly above 22% (Figure 11). In this set, the authors also found MingHwa, a company located outside of the PV clusters of Hsinchu and Tainan Science Parks. Within two years, MingHwa managed to restructure its activity by embracing the mono cells with a maximum of 22% entirely and abandoning their endeavors with poly. Earlier, the same path was undertaken by Inventec. Regardless of its financial condition, Inventec’s and MingHwa’s transition could serve as an example for other companies trapped in the low margin poly production of the uncertain demands of the future market.
At the beginning of the research period, there were 16 manufacturers of poly cells. However, the number decreased to 9 by 2019 (including the URE merger). The average efficiency growth reached 0.42%, which is notably lower when compared to mono (Figure 12). This is a result of the parallel shift of the industry paradigm, which accepted the dominant role of mono with the gradual reversal away from poly products. Industry sources indicate that the efficacy of poly PERC and mono BSF cells will even out by 2020.
As a crucial quality factor, the authors also included PERC availability within this analysis. Starting from the mono-type, the research identified six producers offering the technology in 2016. Although the number, due to the consolidation process, decreased to five in 2019, one could claim that PERC was accepted as the standard. In the case of the poly-type cells, there were four companies with a PERC offer, but their number lowered to three in 2019.
Besides the PERC, constant technological upgrades in the PV segment left some space to maneuver within relatively uncharted solutions. The market consensus suggests TOPCon as the big trend to follow in c-Si manufacturing and possibly widely adoptable due to the relatively high compatibility with existing manufacturing lines. The solution was already implemented by SAS, which perceived TOPCon as a chance for the Taiwanese manufacturers to re-enter the high-margin markets with the cell efficiencies of up to 23.5% in mass production. By far, SAS managed to introduce the cells (n-type) of 22% efficiency [43]. A similar approach was undertaken by Motech, which received the know-how support from the Industry Technology Research Institute, which is the leading governing body of this kind in Taiwan and Asia [44,45].
In contrast, URE focused on the n-type HJT cells following Japanese Panasonic. It was part of a company reorganization, which assumes the employment of only future technologies in order to turn profitable [46]. Globally, the n-type should gradually gain ground after 2020, reaching around 14 GW of world capacity, and even 26 GW by 2023. Although HJT is currently considered as more capitally intensive and technologically demanding, it also requires fewer production steps, which enable it to reach slightly higher efficiencies when compared to TOPCon, offering the prospective module manufacturing cost below 0.30 USD/Wp soon [47]. This trade-off will certainly weigh on the competitive advantages of the early adopters. Here, Taiwanese companies will face a threat not only from Chinese giants, but also Japanese, US, and Korean brands [48].
As the authors observed, while many local and foreign manufacturers of solar cells assembled their products into the modules, they did not display the full specification of the cells employed. Given that, in order to provide the full picture of the technological shift, research included the results regarding the specifications of the final product of the value chain as well. In 2016, in the mono category, the leadership of NSP was able to provide the modules of 325 Wp (Figure 13). The other URE members, Solartech included, achieved 310 Wp, which placed the brands above the competition on the other side of the Chinese strait. The leading Chinese producers reached at that time only 300–305 Wp. A significant number of manufacturers crowded around 295 and 290 Wp–the levels of Canadian Solar or Hanhwa Q-Cells. Few of the less known suppliers developed lower-end offers that hovered around 250 Wp from Dajing. In the poly segment, the Taiwanese competitive advantage was less articulated and identified (Figure 14). The local companies oriented toward high-margin products, and these were developed in the mono segment due to the relative scarcity on the market.
In 2016, similarly to the cell segment, the high technological level of industrial output was observed for the modules. As was reflected in the data, the situation changed throughout the analysed three years. The industry standards were upgraded while Chinese companies became new leaders. In the mono category, their current offer reached 340–345 Wp (Jinko Solar), and the progress within the period was estimated at 35–55 Wp (Canadian Solar). Confronting the results with Taiwanese competitors, one should indicate Motech’s performance of 50 Wp of upgrade to the 340 Wp module. URE and TSEC proposed, respectively, 335 Wp and 325 Wp, which was followed by few manufacturers positioned at 315 Wp and below. For poly, the gains were narrower and reached a maximum of 25 Wp in both China and Taiwan. The top-notch offer could range from 285 to 300 Wp – here with URE, Gintung, and Ablytek. Importantly, a number of companies did not report any progress or even proposed any offer, which indicated the growing technological inequalities and lack of space for the strategic shifts for some entities.
Although efficiencies remained at the center of the interest, the growing importance of versatility and usability factors were recognized. Here, one could mention that innovations such as black cells, bifacial cells, back contact cells, and half-cut cells are all incorporated into the modules designed for installations requiring better durability and appealing aesthetics. Authors could point at two companies providing such a product in 2019: Motech and URE. To conclude, bifaciality did not find its position among smaller and medium-sized local producers (Figure 15 and Figure 16).
Next to bifaciality, leading industrial manufacturers tend to expand their offerings with the half-cut cell modules. Gradually, the world-leading suppliers adopt the half-cut modules to their offer, while some of them, including Hanwha Q-cells and Longi, turned solely to the new design. In the case of Taiwanese companies, there were no suppliers of half-cut in 2016 and only two by 2019, namely URE and TSEC. The authors could assume that, together with bifaciality, the half-cut trend did not yet reach Taiwanese manufacturers with the magnitude observed in the world PV high-end segment.

3.3. Discussion

3.3.1. Industry Transformation

The picture revealed by the gathered data provides a clear conclusion about the Taiwanese PV c-Si industry in implosion, rather than in expansion. On every stage of the analysis, the performance of the companies was far from being perfect while the market conditions and uncertainty posed the great challenge, and even a danger for the further existence of many entities. The abrupt module and cells price drops, impacted the revenues, stock valuations, and investors sentiments. Moreover, the technological edge over the Chinese competitors vanished, which decreased the capacity to generate the income on the high-margin products in the near-term.
In order to face the rising competition, Taiwanese c-Si midstream supply base inevitably heads toward consolidation with the URE as a prime example. The company inherited the most advanced technological park on the island with a capacity of around 5 GW in cell production (PV Status 2018). The merger enabled it to align R&D efforts while sparing operation costs. URE’s business strategy was reoriented to escape the fierce price competition through a shift toward being downstream of the PV sector, where the company focused on manufacturing modules and, in consequence, the system and project development. A similar path was followed by leading Chinese entities like Risen, Canadian Solar, GCL New Energy, and First Solar in the USA.
Apart from URE, the other cell manufacturers reduced their scale, sourced their cells from abroad, or even exited the segment fully with Motech as a major example. The Tier-1 manufacturer did not manage to find the appropriate answer to the ever-dropping cell prices and, in effect, closed its facilities in the Southern Taiwan Technological Park in Tainan. Motech became a nagging issue ever since it displayed losses for several consecutive years, even though it still possessed cutting-edge technology [44,45]. In cases of much smaller suppliers, Mosel Vitelic, Unitech, and E-ton (Inventec Corporation), cell manufacturing was discontinued, and the product offers were not accessible anymore.
It is, therefore, apparent that Taiwan lost a portion of its manufacturing base in the midstream segment of the supply chain. The origins of this situation were precisely described in the research of Liu and Lin [49] where the authors employed the ”Smile Curve” in order to analyze the evolution of the value-added tracking of the gross profit rate. The research was conducted on the data produced by 66 companies from the upstream, midstream, and downstream of the Chinese PV value chain between 2015 and 2017. Initially, the ”Smile Curve” was proposed in 1992 by the founder of Acer Group in Taiwan–Shi Zhenrong and illustrated the value chain of the IT industry by dividing it into three domains: R&D, manufacturing, and marketing. Liu and Lin aligned the model to the PV realm. The upstream segment, which is technologically and capitally intensive, was associated with the R&D end of the curve. The midstream segment, represented by the cell and module production, counted for the middle-bottom part of the curve. This area was characterized by the low entry barrier due to the limited know-how and capital requirements. Finally, the marketing–right end of the curve stood for the downstream segment with high capital inputs and demanding know-how to run projects. The scholars pointed at two leading industry trends that were revealed by the data. The first one identified the growing average profit margins of the industry in general. The second trend disclosed the worsening situation and, actually, declining gross profit margin in the midstream subset. The innovation, operational efficiency, and scale of operation contributed the most to the gross margins of the companies in the data set, followed by external market conditions. These observations were earlier outlined by [9] in their research on the value migration in the Taiwanese PV, while they relate to the current research as well, since the unpredictable market within the period 2016–2019 greatly impacted the operational efficiency, which is the main contributor to the gross profit margin that was midstream entities.
According to the conclusions of Liu and Lin, in order to escape from the increasingly hostile competition, midstream companies should search for integration and either enter the high value-added segments and reach the effect of synergy and/or increase the scale of operation through consolidation. In Taiwan, this transition path was undertaken by Gintech, NSP, and Solartech and their merger into URE. The core of the operations was shifted toward module branding and project development, so the combined resources could deliver higher added value. On the other side of the spectrum, the authors could find struggling companies slowly exiting manufacturing due to the lack of capital to expand the capacities or reach the technological breakthroughs under uncertain market conditions. Like in China, the Taiwanese PV industry has been under the process of consolidation. Unlike in China, this research did not observe the growth of the cumulative manufacturing capacities. Therefore, the process could be equally classified as the improvement of operational efficiencies. A scale of momentum shifted to China in unseen proportions, so the economics turned into an indicator of an unfavorable environment rather than a sound strategy for the industry’s revitalization in Taiwan. More importantly, the outcome of such expansion with regard to the Chinese manufacturing base is still unclear. As Zhang and Zhao (2018) found [7], the overcapacity in the global value chain, typical for China, marked the declining marginal effect of the line’s expansion. The scale economy has reached its adequate critical level, so further additions would not lead to growth performance. On the contrary, the annual rate of return on scale economics turned negative, marking the drop in productivity in 2014. The crucial role in the industrial growth was attributed to the frontier technological progress while the resource allocation efficiency was a result of industry exposure to the free market (here, understood as internally). Corwin and Johnson (2019) [50] reached similar conclusions in their research on the evolution of Chinese PV in the context of the role of the local governments. The pre-existent overcapacity originated from a shortage of synchronized policies at the national and local levels. The scale economies could only bring a positive impact once the transmission infrastructure combined with the mechanism of the marketised energy trading, which created a new space to foster the employment ratio of the idle manufacturing lines. Although, as underlined by the authors, China has the potential of evolving into a healthy and balanced PV market, it is unlikely to happen in a short-term perspective.
Such a situation forces other global manufacturers, Taiwan included, to pursue other strategies besides scale expansion. Operational efficiencies focus on the process innovation that tends to be a valid solution, especially while the PV manufacturing holds many similarities with the other electronic industries. Observing the current levels of the worldwide manufacturing capacity paralleled by the consolidation of the supply base, in terms of organization and technology, one could conclude there is a growing maturity in the industry. At this stage, the literature indicates process innovation rather than product innovation as the primary driver of pricing policies within the companies. It is crucial to note that the data displays an accelerated technological progress while the ASP drops substantially. Since the product quality sector could not be a decisive factor in shaping the price curve, the priority has been given to innovating the process of manufacturing. Over the product’s life cycle, the process innovation has gained further importance, enabling improvements in operational efficiency and, as a result, cost leadership. This scheme proved to be valid in other technological industries such as automobile, airplane, electronic, and, especially, semi-conductors [51]. Furthermore, under uncertain dysfunctional market environments, cost leadership was found to foster the innovation efforts of the companies, which focused on efficient utilization of their internal resources. In the following phases, these companies should rely on customer-oriented strategies since the competitor-oriented approach has been found to be less effective. For the competitor-oriented strategy, to have comparatively substantial technological progress, firms must be able to anticipate the competitors’ actions and stay ahead of them by working out their competitive advantages. In the hostile and dynamic market, such anticipation cannot be accurately predicted, leading to wasted resources and higher costs. In the case of the Taiwanese PV segment, these costs would have its origin in risky manufacturing line expansions while the industry seeks the margin in the still not fully defined, high-end segments [52]. It is undoubtedly too early to assess the outcome of the Gintech, NSP, and Solartech merger. Still, their effort to optimize their operations while profiting from possessed technologies has brought improvements and, product-wise, the company has presented a firm offer in the high-end market benefiting from R&D, and the marketing end of the smile curve. As far as other local producers are concerned, one could assume there will be further consolidation of the supply base in Taiwan. Taking into consideration the uneven technological levels within the industry, some firms will follow the example of Mosel Vitelic, E-Ton, or Unitech, among others, and exit the market completely.

3.3.2. Technological Advancement

From the technological perspective, the local industry shifted from the leader to the follower. However, the distance for the best producers is not far. Taiwan is still regarded as a high-quality manufacturing hub, with the established safety standards. From the manufacturers’ perspective, the gains in efficiency still leave the margin to assimilate the ever-dropping price of watt peaks and to boost the demand. Due to the scale disadvantages, this strategy is particularly valid for local suppliers. Due to the increasingly diverse product offer on the market, authors could quote the two main directions for higher marginal profits. The first direction is related to the constant improvement of cell quality within mono, PERC, and, further, the TOPCon, HJT, IBC, and other technologies (mentioned in the results section). According to ITRPV, within the analysed three year period, the proportion of mono global output grew by 100%, from 24% to around 50%. Due to the limited technological potential of poly and low ASP, the trend will most likely continue, so the companies involved in both mono and poly might gradually phase out their excess poly capacities. Moreover, the PERC upgrades would only gain importance. In 2016, their share did not exceed 20% of the market, while the technology was implemented exclusively by top-tier manufacturers. The PERC offer targeted the most mature markets of Europe and the US. In China, PERC was required to meet strict criteria of the Top-runners program. Within the research period, PERC had already won over half of the market, and the total output of mono PERC reached over 60 GW [26]. Importantly, the poly segment did not embrace PERC as the standard, possibly for the reasons quoted above in our research. The role of multi PERC is set to vanish because of the benefit of mono-type. Chinese manufacturers operate capacities of dozens of gigawatts per company, so the ability of the Taiwanese counterparts to develop valid strategies in poly c-Si seems to be a daunting task.
Secondly, the market fluctuations fostered the global competition, while the requirements on the demand side became more specific. Compared to the beginning of the analyzed period, the market offers became visibly diversified especially at the introduction of bifacial cells and modules that marked the trend (Figure 17). In 2016, only around 2% of the global shipments included bifacial cells, while the niche is expected to expand to more than 20% in 2020. The manufacturing process does not require significant changes, while the introduction of the modules resulted from the advancements concerning other non-cell components like transparent back-sheets. Under favorable conditions, bifacial 60 cell equipment rates could be over 400 Wp, and the gain on power could reach up to 30% [53]. By favorable conditions, the authors understand that the areas with the potent albedo are locations surrounded by sand, water, or snow. The primary markets for bifacial modules are, therefore, utility projects, which are driven by decreasing LCOE even if the market has not yet found an accurate method to assess the LCOE in particular locations. What is missing are the standards, while the simulation tools employ the existing scarce database of past projects. Still, there is little doubt about the usability of this new approach, and one should expect new solutions in the coming future [54,55]. As far as the research data set was concerned, the bifaciality was offered only by two local manufacturers in 2019.
Next to bifaciality, leading industrial manufacturers tend to expand their offerings with the half-cut cell modules. Their growing market share was reported at 2% in 2016 but is estimated to reach 11% in 2020. The consequences of the advantages of such design, especially in the mitigation of cell-to-module incurred losses, are under discussion. The half-cut cells halve the current in the cell connectors, and, therefore, reduce their resistive losses. Moreover, the position of the cell’s gap improves the light collection. Both effects contribute to the cell-module power gain of 4.7%, even though the reliability of the products is still to be examined under long-term operational conditions [56]. Regardless of the clear trend, the half-cut cells were offered by only two local producers. There is little doubt that, if the local suppliers wish to compete with Chinese manufacturers in high-margin markets, both the bifaciality and half-cut cells should be embraced in the near future.

4. Conclusions

Recent years in the PV industry have been marked with a severe imbalance of manufacturing capacities and demand, which led to abrupt market shocks and end-product price volatility. Such conditions had a significant impact on the Taiwanese manufacturing base, and, as a consequence, the technological advancement of the solar cells and modules. One could infer the notion that Taiwanese fast-followers was outpaced by Chinese fast-followers. The purpose of this article was to investigate the scale and direction of the local industry under uncertain market conditions. The particular focus was devoted to the consolidation trends and the level of technological progress reflected in the end products.
After analyzing the product and market data, the authors concluded two main findings. The first is that the Taiwanese PV supply base is in the consolidation process, shifting the value creation gravity from the cell to module production and project developments. Second, Taiwanese producers fell behind their rival Chinese competitors. As for the former, the trend was articulated two-fold. The merger of the three local leading companies into one major company of integrated manufacturers and project development – URE – was followed by the exit of the less technologically advanced suppliers. In both cases, the local scale disadvantages pushed suppliers to search the edge within upgrading the process efficiencies through optimal resource utilization and new technologies that would enable entering the high-value-added segments. This solution requires the access of capital, which is hardly doable for the smaller entities that were eventually forced to exit the competition.
As far as the end-products are concerned, Taiwanese producers lost part of their technological competitive advantage in relation to Chinese entities. The relative decline occurred in all analysed segments. The poly and mono cells and modules data sets displayed lower product efficiencies, while the penetration of the recent innovations of TOPCon, HJT, bifaciality, and half-cut was more prevailing for the leading Chinese suppliers. These trends are continuing since the R&D expenses of Mainland companies significantly outweigh those of Taiwanese counterparts. As a consequence of, in the mid-term, less advanced suppliers might have exited the Taiwanese market, leaving the space for the strongest companies that can face the strategic choices of embracing the prospectus technologies.
The findings of this article point to the importance of addressing the right industrial policy by the Taiwanese authorities in the period of the irregular world PV market. In the case of Taiwan, the strong local demand fostered by favorable irradiation conditions could offset the uncertainties in foreign countries. The current targets of PV employments on the island are certainly ambitious, but there is a strong commitment of the local authorities to reach them, not only to foster the energy transition but also to win the time for local manufacturers to reinvent their operations. As far as the supply side is concerned, following the ”Smile Curve” implications, one might opt for further shift from pure-play to down-stream activities related to products’ brand awareness and, in the later stage, also expand into project developments, based already on the self-manufactured equipment. The potential disadvantage of the higher manufacturing costs might be recovered through the EPC margins, especially while the high and complex know-how is involved. It is worth it to underline the unlimited market of the PV capacity expansions in the world and, mainly, in Asia and South-East Asia. After IRENA’s estimations, only until 2030, the continent will cumulate over 1800 GW, and almost 5000 GW in 2050. It is clear that the large-scale energy revolution is about to commence. Moreover, as stated in the research, the technologies increasingly differentiate, which leaves space to maneuver. The R&D end of the ”Smile Curve” could indicate further directions of technology innovation, mainly within the lagged categories of TOPCon, HJT, IBC, bifacial, and half-cut and others to come. The growing technological diversification can open new opportunities to enter, and operate within lucrative, emerging segments with the BIPV as an example. These segments require focus and specialization, so they are often neglected by the multi-GW conglomerates from China, regardless of their relatively high pricing per watt peak. As far as the Taiwanese perspective is concerned, the scale advantage may not be the solution. Therefore, the specialization seems to be a valid choice.

Author Contributions

conceptualization, W.L.W.; methodology, W.L.W. and M.K.; formal analysis, M.K.; software, M.K.; validation; W.L.W. and M.K.; investigation, M.K.; resources, W.L.W.; data curation, M.K.; writing—original draft preparation, M.K.; writing—review and editing, M.K.; visualization, M.K.; supervision, W.L.W.; project administration, M.K.; All authors have read and agreed to the published version of the manuscript.

Funding

This research received no external funding.

Conflicts of Interest

The authors declare no conflict of interest.

Abbreviations

PVPhotovoltaics
FDPForeign Direct Investment
R&DResearch and Development
PERCPassivated Emitter and Rear Cell
ASPAverage Selling Price
BSFBack Surface Field
HJTHeterojunction Technology
TOPConTunnel Oxide Passivated Contact
IBCInterdigitated Back Contact
LCOELevelized Cost of Electricity

Appendix A

Table A1. c-Si cell product output over the period Q32016–Q22019.
Company NameCell TypeQ32016Q22019Efficiency Progress (%)
Cell TechnologyPower/Cell (W)Top Efficiency (%)Cell TechnologyPower/Cell (W)Top Efficiency (%)
Big SunMonoBSF4.9120.1BSF4.98420.40.3
PolyBSF4.4818.4BSF4.61918.80.4
DelSolarMonoBSF4.7820BSF4.78200
PolyBSF4.6219BSF4.62190
EEPVMonoBSF4.9820.4BSF5.13210.6
PolyBSF4.4818.4BSF4.67190.6
E-tonMonoPERC4.5521.1PERC5.2521.50.4
PolyBSF5.1618.7BSF4.67190.3
GintechMonoPERC5.5521.44PERC5.3521.90.46
PolyPERC4.7719.6BSF4.6218.8-0.8
Inventec SolarMonoPERC4.9420.8PERC, Bifacial4.9420.80
PolyPERC4.6419.4PERC4.6419.40
Ming Hwei EnergyMono PERC5.68222
PolyBSF4.4818.4
Mosel VitelicMono
PolyBSF4.3417.79
MotechMonoBSF4.6819.6PERC, Bifacial5.422.12.5
PolyBSF4.5318.6BSF4.67190.4
NSPMonoPERC5.22821.4PERC, Bifacial5.35121.90.5
PolyPERC4.72119.4PERC4.914200.6
Sinco american MonoBSF4.6519.5TOPcon4.65220
PolyBSF4.317.7BSF4.317.70
Solartech Energy MonoPERC5.1121PERC5.32621.90.9
PolyPERC4.7919.8PERC, Half-cut5.03720.60.8
Sun Win EnergyMonoBSF4.50518.8BSF4.6619.50.7
PolyBSF4.3818BSF4.38180
Tainergy MonoBSF4.8620BSF4.86200
PolyBSF4.518.5BSF4.518.50
TSECMonoPERC5.1321PERC5.4522.31.3
PolyBSF4.5818.8PERC5.1120.82
UnitechMono
PolyBSF4.3818.2
Table A2. c-Si module product output over the period Q32016–Q22019.
Company NameTypeQ32016Q22019Module Power Progress (W)
Cell TechnologyPower/Module (W)Top Efficiency (%)Cell TechnologyPower/Module (W)Top Efficiency (%)
AblytekMonoBSF26015.93BSF31019.0550
PolyBSF27016.59BSF29017.8320
AnjiMonoBSF29017.9BSF31019.920
PolyBSF27016.6BSF27016.60
DajingMonoBSF25015.26BSF25015.260
PolyBSF25015.26BSF25015.260
DelSolarMonoBSF26015.9BSF26015.90
PolyBSF25015.3BSF25015.30
DSTMonoBSF27916.57
PolyBSF26015.95
GIHMonoBSF26516.17BSF26516.170
PolyBSF24014.64BSF24014.640
GintechMonoBSF28017.2
PolyBSF26016
GintungMonoBSF29518.31BSF31519.5520
PolyBSF27517.07BSF29518.3120
Hengs TechnologyMono
PolyBSF26516.29BSF26516.290
Hon TuringMono
PolyBSF22013.26BSF22013.260
Inventec MonoPERC30018.4
PolyPERC27516.9
LigitekMonoBSF27016.8
PolyBSF27517.1
MotechMonoBSF29017.5PERC, Bifacial34019.650
PolyBSF27016.5BSF28017.210
NSPMonoPERC32520PERC, Bifacial, Half-cut33520.210
PolyBSF27016.6PERC29518.125
RitekMonoBSF30018.44BSF30018.440
PolyBSF27016.6BSF27016.60
Solartech MonoPERC31018.91PERC310
PolyBSF29017.69PERC295 5
Sun Win EnergyMonoBSF27516.87BSF27516.870
PolyBSF27516.87BSF27516.870
Tainergy Mono
PolyBSF26016.4BSF28517.525
ToppersunMonoBSF30518.7
PolyBSF29518.1
TSECMonoPERC29020.23PERC, Half-cut32519.935
PolyBSF28019.53
TynosolarMonoBSF29518.1BSF30018.445
PolyBSF26516.18BSF26516.290
Win WinMonoPERC29017.46PERC29017.460
PolyBSF26015.65BSF26015.650
Jinko Solar (CN)MonoPERC30018.33PERC, Half-cut, Bifacial34520.4545
PolyBSF28017.11PERC, Half-cut, Bifacial28517.415
JA Solar (CN)MonoPERC30018.35PERC, Half-cut, Bifacial34020.240
PolyBSF28017.2PERC, Half-cut, Bifacial29517.515
Trina Solar (CN)MonoPERC30518.6PERC, Half-cut, Bifacial34019.935
PolyBSF28017.1PERC, Half-cut, Bifacial30017.620
Canadian Solar (CN)MonoBSF28517.41PERC, Half-cut34019.8655
PolyBSF27516.8PERC30018.0525
Hanhwa Q-Cells (KR)MonoBSF29017.7PERC, Half-cut33019.640
PolyBSF28017.1PERC, Half-cut29017.410

References

  1. Cao, J.; Groba, F. Chinese Renewable Energy Technology Exports: The Role of Policy, Innovation and Markets. SSRN Electron. J. 2013, 60, 243–283. [Google Scholar] [CrossRef] [Green Version]
  2. Xiong, Y.; Yang, X. Government subsidies for the Chinese photovoltaic industry. Energy Policy 2016, 99, 111–119. [Google Scholar] [CrossRef]
  3. Wu, C.-Y.; Mathews, J.A. Knowledge flows in the solar photovoltaic industry: Insights from patenting by Taiwan, Korea, and China. Res. Policy 2012, 41, 524–540. [Google Scholar] [CrossRef]
  4. Zhang, F.; Gallagher, K. Innovation and technology transfer through global value chains: Evidence from China’s PV industry. Energy Policy 2016, 94, 191–203. [Google Scholar] [CrossRef]
  5. Calantone, R.J.; Garcia, R.; Droge, C. The Effects of Environmental Turbulence on New Product Development Strategy Planning. J. Prod. Innov. Manag. 2003, 20, 90–103. [Google Scholar] [CrossRef]
  6. Yun, S.; Lee, J.; Lee, S. Technology development strategies and policy support for the solar energy industry under technological turbulence. Energy Policy 2019, 124, 206–214. [Google Scholar] [CrossRef]
  7. Zhao, X.; Zhang, Y. Technological progress and industrial performance: A case study of solar photovoltaic industry. Renew. Sustain. Energy Rev. 2018, 81, 929–936. [Google Scholar]
  8. Hu, M.; Mathews, J. Taiwan’s Green Shift—Prospects and Challenges. Asia Pac. J. Jpn. Focus 2016, 14, 4960. [Google Scholar]
  9. Hu, J.-L.; Yeh, F.-Y. The Value Migration and Innovative Capacity of Taiwan’s Photovoltaic Industry. Energy Sources Part B Econ. Plan. Policy 2013, 8, 190–199. [Google Scholar] [CrossRef]
  10. Jia, F.; Sun, H.; Koh, L. Global solar photovoltaic industry: An overview and national competitiveness of Taiwan. J. Clean. Prod. 2016, 126, 550–562. [Google Scholar] [CrossRef]
  11. Liou, H.M. Policies and legislation driving Taiwan’s development of renewable energy. Renew. Sustain. Energy Rev. 2010, 14, 1763–1781. [Google Scholar] [CrossRef]
  12. Liu, C.-S.; Hsiao, C.-T.; Chang, D.-S.; Hsiao, C.-H. How the European Union’s and the United States’ anti-dumping duties affect Taiwan’s PV industry: A policy simulation. Renew. Sustain. Energy Rev. 2016, 53, 296–305. [Google Scholar] [CrossRef]
  13. Lo, C.-C.; Wang, C.-H.; Huang, C.-C. The national innovation system in the Taiwanese photovoltaic industry: A multiple stakeholder perspective. Technol. Forecast. Soc. Chang. 2013, 80, 893–906. [Google Scholar] [CrossRef]
  14. Wang, C.-T.; Chiu, C.-S. Competitive strategies for Taiwan’s semiconductor industry in a new world economy. Technol. Soc. 2014, 36, 60–73. [Google Scholar] [CrossRef]
  15. Ruhang, X. Characteristics and prospective of China׳s PV development route: Based on data of world PV industry 2000–2010. Renew. Sustain. Energy Rev. 2016, 56, 1032–1043. [Google Scholar] [CrossRef]
  16. Available online: m.energytrend.com/news/20150515-8776.html (accessed on 6 October 2019).
  17. Available online: renewableenergyworld.com/articles/2015/02/the-top-ten-pv-manufacturers-in-2014-and-why-this-list-can-lack-meaning.html (accessed on 6 October 2019).
  18. Quitzow, R.; Huenteler, J.; Asmussen, H. Development trajectories in China’s wind and solar energy industries: How technology-related differences shape the dynamics of industry localization and catching up. J. Clean. Prod. 2017, 158, 122–133. [Google Scholar] [CrossRef]
  19. Chen, W.-M.; Kim, H.; Yamaguchi, H. Renewable energy in eastern Asia: Renewable energy policy review and comparative SWOT analysis for promoting renewable energy in Japan, South Korea, and Taiwan. Energy Policy 2014, 74, 319–329. [Google Scholar] [CrossRef]
  20. Mathews, J.A.; Hu, M.-C.; Wu, C.-Y. Fast-Follower Industrial Dynamics: The Case of Taiwan’s Emergent Solar Photovoltaic Industry. Ind. Innov. 2011, 18, 177–202. [Google Scholar] [CrossRef]
  21. Tsai, K.-H.; Yang, S.-Y. Firm innovativeness and business performance: The joint moderating effects of market turbulence and competition. Ind. Mark. Manag. 2013, 42, 1279–1294. [Google Scholar] [CrossRef]
  22. Zheng, C.; Kammen, D.M. An innovation-focused roadmap for a sustainable global photovoltaic industry. Energy Policy 2014, 67, 159–169. [Google Scholar] [CrossRef]
  23. Wang, Y.-H.; Luo, G.-L.; Guo, Y.-W. Why is there overcapacity in China’s PV industry in its early growth stage? Renew. Energy 2014, 72, 188–194. [Google Scholar] [CrossRef]
  24. Zou, H.; Du, H.; Ren, J.; Sovacool, B.; Zhang, Y.; Mao, G. Market dynamics, innovation, and transition in China’s solar photovoltaic (PV) industry: A critical review. Renew. Sustain. Energy Rev. 2017, 69, 197–206. [Google Scholar] [CrossRef] [Green Version]
  25. Wu, Y. Analysis and reflection on the situation of Chinese PV industry. Energy Technol. 2016, 58. [Google Scholar]
  26. VDMA. International Technology Roadmap for Photovoltaics 2018, Ninth Edition, September 2018. Available online: pv.vdma.org/documents/105945/26776337/ITRPV%20Ninth%20Edition%202018%20including%20maturity%20report%2020180904_1536055215523.pdf/a907157c-a241-eec0-310d-fd76f1685b2a (accessed on 13 October 2019).
  27. Chen, S. Supply Barriers and Supply Distribution under Trend of Market Decentralization. [in Chinese]. Energytrend, 9 April 2019. Available online: www.energytrend.com.tw/research/20190403-14314417.html (accessed on 1 October 2019).
  28. Schachinger, M. August 2017: Origin Must Not Be a Factor—Only Quality Should Count! pv-Magazine, Module Price Index, August 2017. Available online: www.pv-magazine.com/module-price-index/ (accessed on 5 October 2019).
  29. Schachinger, M. August 2018: Greetings from the Madhouse…, pv-Magazine, Module Price Index, August 2018. Available online: www.pv-magazine.com/module-price-index/ (accessed on 5 October 2019).
  30. Schachinger, M. July 2019: Everyone’s Talking about Higher Module Prices…, pv-Magazine, Module Price Index, August 2019. Available online: www.pv-magazine.com/module-price-index/ (accessed on 5 October 2019).
  31. Feldman, D.; Hoskins, J.; Margolis, R. Q4 2017/Q1 2018 Solar Industry Update, National Renewable Energy Laboratory, May 2018. Available online: www.nrel.gov/docs/fy18osti/71493.pdf (accessed on 15 October 2019).
  32. Hoskins, J.; Margolis, R. Q4 2018/Q1 2019 Solar Industry Update, National Renewable Energy Laboratory, May 2019. Available online: www.nrel.gov/docs/fy19osti/73992.pdf (accessed on 15 October 2019).
  33. Engle, R.F.; Granger, C.W.J. Co-Integration and Error Correction: Representation, Estimation, and Testing. Econ. 1987, 55, 251. [Google Scholar] [CrossRef]
  34. Chinese National Renewable Energy Center (CNREC). Chinese Energy Policy Newsletter: June 2018. Available online: http://boostre.cnrec.org.cn/wp-content/uploads/2018/06/China-Energy-Policy-Newsletter_June-2018.pdf (accessed on 1 October 2019).
  35. European Commission. Commission Decides Not to Extend Trade Defense Measures on Solar Panels from China. Brussels, August 2018. Available online: www.trade.ec.europa.eu/doclib/press/index.cfm?id=1904 (accessed on 3 October 2019).
  36. Available online: https://www.irena.org/statistics.html (accessed on 2 October 2019).
  37. Shuai, J.; Chen, C.-F.; Cheng, J.; Leng, Z.; Wang, Z. Are China’s solar PV products competitive in the context of the Belt and Road Initiative? Energy Policy 2018, 120, 559–568. [Google Scholar] [CrossRef]
  38. Zhu, L.; Xu, Y.; Pan, Y. Enabled comparative advantage strategy in China’s solar PV development. Energy Policy 2019, 133, 110880. [Google Scholar] [CrossRef]
  39. Green, M.A.; Hishikawa, Y.; Dunlop, E.D.; Levi, D.H.; Hohl-Ebinger, J.; Yoshita, M.; Ho-Baillie, A.W. Solar cell efficiency tables (Version 53). Prog. Photovoltaics: Res. Appl. 2018, 27, 3–12. [Google Scholar] [CrossRef] [Green Version]
  40. JinkoSolar. JinkoSolar Breaks World Record for Cell Efficiency and Module Output., 3 June 2018. Available online: www.jinkosolar.com/press_detail_1821.html?lan=en (accessed on 4 November 2019).
  41. Parnel, J. PV Innovation Can Drive European Market Forward, Says JA Solar. pv-Tech, 3 July 2019. Available online: www.pv-tech.org/news/pv-innovation-can-drive-european-market-forward-says-ja-solar (accessed on 7 November 2019).
  42. Fraunhofer Institute for Solar Energy Systems, ISE. Photovoltaics Report. Freiburg, 14 March 2019. Available online: https://www.ise.fraunhofer.de/content/dam/ise/de/documents/publications/studies/Photovoltaics-Report.pdf (accessed on 12 October 2019).
  43. Sino-American Silicon Products Inc. (SAS). SAS Launches "CelcoN" N-type High-efficiency Solar Cell/60-cell Modules Output Achieves 350W, 27 June 2019. Available online: www.saswafer.com/pages/sas/en/news/detail.aspx?ArticleId=9E190A4E32974E2F9548B1E70AA29D04 (accessed on 8 November 2019).
  44. Motech. Motech Announces Organization Optimization Plan, 28 November 2018. Available online: http://www.motechsolar.com/en/latestnews_20181128.php (accessed on 4 November 2019).
  45. Motech. Enhancing Financial Structure through Non-cash Impairment Adjustment., 18 March 2019. Available online: http://www.motechsolar.com/en/latestnews_20190318.php (accessed on 4 November 2019).
  46. Energy Metal News. SAS Reportedly to Invest in TOPCon Solar Cell Production. 24 December 2018. Available online: www.energymetalnews.com/2018/12/24/sas-reportedly-to-invest-in-topcon-solar-cell-production/ (accessed on 23 October 2019).
  47. Louwen, A.; Van Sark, W.; Schropp, R.R.; Faaij, A. A cost roadmap for silicon heterojunction solar cells. Sol. Energy Mater. Sol. Cells 2016, 147, 295–314. [Google Scholar] [CrossRef] [Green Version]
  48. Lin, C. Market Outlook of N-Type Technology. Infolink Report, December 2018. Available online: www.en.pvinfolink.com/userfiles/files/20181205-PVInfoLink-Market%20Outlook%20of%20N-Type%20Technology_En.pdf (accessed on 4 November 2019).
  49. Liu, J.; Lin, X. Empirical analysis and strategy suggestions on the value-added capacity of photovoltaic industry value chain in China. Energy 2019, 180, 356–366. [Google Scholar] [CrossRef]
  50. Corwin, S.; Johnson, T.L. The role of local governments in the development of China’s solar photovoltaic industry. Energy Policy 2019, 130, 283–293. [Google Scholar] [CrossRef]
  51. Chenavaz, R. Dynamic pricing, product and process innovation. Eur. J. Oper. Res. 2012, 222, 553–557. [Google Scholar] [CrossRef]
  52. Liu, W.; Atuahene-Gima, K. Enhancing product innovation performance in a dysfunctional competitive environment: The roles of competitive strategies and market-based assets. Ind. Mark. Manag. 2018, 73, 7–20. [Google Scholar] [CrossRef]
  53. Sun, H.; Zhi, Q.; Wang, Y.; Yao, Q.; Su, J. China’s solar photovoltaic industry development: The status quo, problems and approaches. Appl. Energy 2014, 118, 221–230. [Google Scholar] [CrossRef]
  54. Zoco, E. The Sun Rises on the Bifacial Module Market, pv-Magazine, IHS Markit, 10 June 2019. Available online: www.pv-magazine.com/2019/06/10/the-sun-rises-on-the-bifacial-module-market/ (accessed on 15 November 2019).
  55. Sun, X.; Khan, M.R.; Deline, C.; Alam, M.A. Optimization and performance of bifacial solar modules: A global perspective. Appl. Energy 2018, 212, 1601–1610. [Google Scholar] [CrossRef] [Green Version]
  56. Qian, J.; Thomson, A.; Blakers, A.; Ernst, M. Comparison of Half-Cell and Full-Cell Module Hotspot-Induced Temperature by Simulation. IEEE J. Photovoltaics 2018, 8, 834–839. [Google Scholar] [CrossRef]
Figure 1. Research logic.
Energies 13 05841 g001
Figure 2. c-Si cell and module price (Euro/Wp, USD/Wp) evolution on the European and American markets [28,29,30,31,32].
Energies 13 05841 g002
Figure 3. PV capacity (GW) installed globally in recent years [36].
Energies 13 05841 g003
Figure 4. Taiwanese export of c-Si cells 2014–2019 (TAITRA).
Energies 13 05841 g004
Figure 5. Taiwanese export of c-Si modules 2014–2019 (TAITRA).
Energies 13 05841 g005
Figure 6. The revenue decrease of selected stock listed Taiwanese PV entities (Sourced: Digitmes, based on Taiwan Stock Exchange databases).
Energies 13 05841 g006
Figure 7. The stock valuation of TSEC, Motech, URE (NTD), and TAIEX index (points) (Sourced: based on Taiwanese Stock Exchange database).
Energies 13 05841 g007
Figure 8. The stock valuation of Jinko Solar (USD), JA Solar (CNY), Canadian Solar (USD), and NYSE, NASDAQ, Shenzhen index (points) (Sourced: based on yahoo finance database).
Energies 13 05841 g008
Figure 9. c-Si solar cell efficiency gain trend (%) [26,42].
Energies 13 05841 g009
Figure 10. c-Si module power gain trend (Wp) [26,42].
Energies 13 05841 g010
Figure 11. c-Si mono cell efficiency (%) of Taiwanese manufacturers within the period.
Energies 13 05841 g011
Figure 12. c-Si poly cell efficiency (%) of Taiwanese manufacturers within the period.
Energies 13 05841 g012
Figure 13. c-Si mono module power (Wp) of Taiwanese manufacturers within the period.
Energies 13 05841 g013
Figure 14. c-Si poly module power (Wp) of Taiwanese manufacturers within the period.
Energies 13 05841 g014
Figure 15. Number of companies in the sample offering selected technologies—mono c-Si module category.
Energies 13 05841 g015
Figure 16. Number of companies in the sample offering selected technologies—poly c-Si module category.
Energies 13 05841 g016
Figure 17. c-Si module/cell technology market share (%) forecast [11,42].
Energies 13 05841 g017
Table 1. Granger causality test of interdependency of the mainstream module and solar cell price on stock valuation of local and Chinese companies.
Company Mainstream Module Price Granger Cause Test on Stock ValuationCell Price Granger Cause Test on Stock Valuation
Taiwan
UREp-value0.0020.005
F-value11.9119.258
MOTECHp-value0.0220.148
F-value5.9022.224
TSECp-value0.0060.001
F-value9.01013.602
TAIEXp-value0.8870.484
F-value0.0210.504
China
Jinkop-value0.4910.599
F-value0.4880.284
NYSEp-value0.6540.980
F-value0.2050.001
Canadian Solarp-value0.1320.171
F-value2.4151.979
NASDAQp-value0.4530.966
F-value0.5810.002
JA Solarp-value0.1500.659
F-value2.1960.199
Shenzhenp-value0.3860.313
F-value0.7771.059
Based on data collected from the Taiwanese Stock Exchange, yahoo finance number of observations = 27
lag = 1 based on ACF
Publisher’s Note: MDPI stays neutral with regard to jurisdictional claims in published maps and institutional affiliations.

