1. Introduction
The Food and Agriculture Organization of the United Nations (FAO) estimates that by 2050, food production must increase by 70% to sustain the predicted population. At the same time, the FAO forecasts a 30% energy production increase [
1]. The expected increase in food demand is thus disproportionate to the forecasted increase in energy capacity [
2]. Therefore, it is essential to progress in energy efficiency in food production systems. The goal is to produce more or the same amount of food using less energy [
3]. In other words, energy efficiency can be defined as the ratio between the production process and the energy input into that process [
4].
The energy consumption in the food systems can come from direct energy use associated with activities performed on the farm, the processing of raw materials, and consumption at different stages of production. It can also come from indirect energy consumption, which is accumulated energy needed in the processes performed prior to production and supply of inputs consumed on the farm or in processing [
5]. The efficient use of energy resources is crucial to increasing agricultural production, the competitiveness of agriculture and the food industry, and environmental sustainability. There is a need to reduce dependence on more and more limited fossil-based energy resources by understanding energy consumption patterns and analyzing the energy balance [
6]. Therefore, better energy efficiency in food production systems contributes to two fundamental issues, namely increasing food production and environmental sustainability.
The goal of an increase in food production is crucial considering the projected growth of the world population [
7]. As stated by United Nations, by 2050 world population will grow by around two billion and could grow by as much as three billion by 2100 [
8]. Aside from limitations in the ability to produce sufficient amount of energy to meet the demand for food production and thus fulfill human nutritional requirements, increased energy consumption usually lowers environmental sustainability [
9,
10]. Therefore, energy consumption is usually used as a proxy for environmental performance [
11]. In the food production system, the mutual exclusion of the goals of increasing production and environmental sustainability is particularly evident in the use of fertilizers, which is a key factor in increasing yields [
12]. Stewart et al. [
13] claim that 30–50% of yield should be accredited to the use of fertilizers, especially nitrogen fertilizers. At the same time, their production is about ten times more energy-consuming than phosphorus and potassium fertilizers [
14]. Although the improvement in energy efficiency of nitrogen fertilizer production is observed over time [
15] it remains the most energy-intensive aspect of modern intensive agriculture [
16]. Therefore, improvement in the energy efficiency of the food production system is one of the main methods of reducing the environmental footprint without reducing food production itself.
The study aimed to compare the economic energy efficiency of food production systems in selected countries of the world and identify the sources of diversification in this field. Studies concerning energy efficiency in food production systems are usually conducted for one or a few countries simultaneously. This often results in inconsistencies in boundary setting, allocation choices, and other methodological decision points. Greater standardization is desirable to improve the consistency and comparability of energy analyses [
17]. Also, the results can differ significantly depending on the data aggregation level [
18]. We developed a method of calculating food production energy use from input-output tables using the cross-national World Input-Output Database (WIOD) as a data source, which guarantees the comparability of results between countries. Therefore, the main contribution of the conducted research is the measurement of the energy efficiency of food production systems in a way that is comparable between countries and the development of such a method of measurement based on input-output tables and compatible energy use accounts. Moreover, we want to focus on the economic energy efficiency of the entire food production system and the distribution of energy use in the food production chain, differentiating between energy use caused by agricultural activities, food industry activities, and related inputs.
The overall increase in energy efficiency may result primarily from the use of more efficient production technologies or the use of modern components of fixed capital (buildings, machines), or simply from changes in the structure of the economy towards a greater share of less energy-consuming sectors [
19]. Within the food production system, in addition to technological and technical improvements, changes in energy efficiency may be due to for example: the structure of intermediate consumption (especially fertilizer and pesticide use, machinery use which are responsible for direct energy consumption), farmers’ decision (changes in the structure of production or cultivation practices), weather conditions, the type and variety of food processed as well as energy mix used in processing [
17].
Existing food systems energy efficiency research focuses on a variety of aspects, starting with the assessment of various crops, such as wheat [
20,
21,
22], rice [
23,
24,
25], maize [
26,
27,
28], vegetables [
29,
30], fruits [
31,
32], and others [
33,
34]. Also, the literature of the energy efficiency of food manufacturing deals with specific product groups, particularly meat [
35,
36] and dairy [
37,
38]. A great deal of research investigates the potential of specific technologies to improve the energy efficiency of food manufacturing [
39,
40,
41]. Some studies also focused on the energy efficiency of organic farming as compared to conventional farming. Lynch et al. [
42] argue that organic agriculture is characterized by lower energy consumption and is especially visible per hectare of land; however, the results per kilogram of product are the opposite. Due to the lower yields obtained [
43], organic farming, given the current technology, cannot feed the world in a sustainable manner [
44].
In their early work, Steinhart and Steinhart [
45] investigated energy use in the US food system from 1920 to 1970. They argued that energy use increases food production; however, the relationship between energy use and production has the shape of a logistic growth curve. Therefore, increases in food production due to increased energy inputs are becoming more and more difficult to obtain. Canning [
46], who also investigated energy use in United States food system, found that from 1997 to 2002, per capita energy use in the US declined 1.8 percent, while per capita food-related energy use increased by 16.4 percent. The largest contribution to this growth was food processing activities. However, Gallaher et al. [
47] found that there are many ways to increase energy efficiency in US food system through improvements in the technology used in agriculture.
Investigating the energy return on energy invested in agriculture at the farm gate in the US and Canada, Hamilton et al. [
48] found that the energy efficiency of US agriculture has more than doubled, from 0.8:1 in 1970 to 2.3:1 by 2009. In turn, the energy efficiency of Canadian agriculture has varied about a mean of 2:1 from 1981 to 2009. Similarly, Cao et al. [
49] found that the ratio in Chinese agriculture decreased from 2:1 in 1978 to 1.5 in 2004. Despite increases in agricultural production in China, the decrease of the energy return on energy invested ratio was observed due to significant increases in fossil fuel use.
In turn, Martínez [
50] used energy intensity ratio (energy used per EUR of output) as a proxy for energy efficiency in the German and Colombian food industries. In the period from 1998 to 2005, energy consumption in the German food industry increased by an average of 1.3 percent per year, whereas the Colombian food industry reduced its energy consumption by an average of 1.9 percent per year. However, the energy intensity in the food industry decreased in both countries, in Germany by 7 percent and in Columbia by 11 percent. At the same time, the Colombian food industry required 2.2 times more energy than the German food industry to produce a unit of output. This shows the complexity of the issue, and as Martínez [
50] claims, there is the relative lack of attention paid to this kind of analysis in the relevant literature.
Our study included 14 countries selected from the WIOD, those with the highest agricultural production. According to the FAO data, all the analyzed countries are in the top 20 in terms of world agricultural production, and together, they represent 65% of world production. These are China, India, the United States, Brazil, Indonesia, Russia, France, Turkey, Mexico, Germany, Spain, Canada, Italy, and Australia. Such a selection is intended to analyze countries that are important in terms of food production in the world market. The study was conducted for the years 2000, 2007, and 2014, that is, for the first, middle, and last years included in the WIOD, to follow changes over a long period. The nature of the analysis is such that there is no need to analyze the entire period because energy consumption is not subject to rapid changes.
Following this introduction,
Section 2 presents the data sources and the research methodology used. The results of the research are presented and discussed in
Section 3.
Section 4 summarizes the most important conclusions from this study.
2. Materials and Methods
Energy consumption in food production process and energy intensity (seen as the inverse of energy efficiency [
50]), have been analyzed on the basis of the WIOD, Release 2016 [
51]. The advantage of the WIOD lies in the publication of methodologically standardized national input-output tables constructed on the basis of the Supply and Use tables. Moreover, special emphasis is placed on the quality of the data, so the figures best reflect the official national statistics. The WIOD stores cross-nationally comparable annual data from 2000 to 2014 for 56 sectors classified according to the International Standard Industrial Classification, Revision 4 (ISIC Rev. 4). The tables follow the 2008 version of the System of National Accounts (SNA). Detailed information on the structure of the tables can be found in Dietzenbacher et al. [
52], Timmer et al. [
51], and Timmer et al. [
53]. Above that, World Input–Output Database Environmental Accounts Update 2000–2016 [
54], which are fully compatible with the WIOD, Release 2016, were used. The database provides information on energy use from 13 sources, which were grouped by 56 sectors as in the input–output tables. The sources include the following: Coal, Coke and crude oil; Jet fuel; Diesel; Gasoline; Fuel oil; Other petroleum products; Municipal waste; Renewables and nuclear; Natural gas; Other gases; Electricity and heat production; Biofuels; and Other sources.
Lifecycle assessment (LCA) has become the most frequently used methodology in analyzing energy consumption in food systems from the perspective of the supply chain [
17,
55]. Within the LCA approach, inputs can be traced to the primary resource. This means that it is possible to determine both the direct and indirect energy consumption contributing to a given process, for example, food production. In LCA two main approaches are used: process analysis, a bottom-up method that uses detailed descriptions of individual production processes [
56], and input-output analysis, a top-down method [
57]. Hybrid approaches, combining the advantages of both bottom-up and top-down approaches, are also in use [
58].
First, we analyzed energy consumption in the food production process. The applied method is based on the assumptions of input-output life-cycle assessment. It involves the use of data retrieved from input-output tables to quantify the amount of energy used at every stage of food production [
59]. Therefore, we use a framework known as input-output material flow analysis [
46]. We employed data on emissions-relevant energy use by sector and energy commodity; this matrix is related to gross energy use but excludes the non-energy use of energy commodities and the input of energy commodities for transformation in order to avoid double-counting [
60]. The two most important sectors involved in food production are agriculture and the food industry. In line with the ISIC Rev. 4, agriculture is assumed to be represented by Sector A01: Crop and animal production, hunting, and related service activities. In turn, the food industry is best represented by Sectors C10–C12: Manufacture of food products, beverages, and tobacco products. The energy consumed directly in food production stems from activities performed in agriculture and the food industry and, indirectly, from those parts of all other economic sectors that supply agriculture and the food industry with inputs. Therefore, food production may be divided into three aggregates:
supply (inputs from all sectors to agriculture and the food industry);
agriculture-based aggregate;
food industry-based aggregate.
For the purpose of the study, the energy consumption of Aggregate I was divided into those stemming from the supply of agriculture and those stemming from the supply of the food industry because there may be significant differences between countries in this respect. The first step in the calculation was to determine the energy consumption coefficients for each sector, which was done separately for each of the 13 sources of energy consumption:
where
CEUi is the energy use coefficient of sector
i,
EUi is energy use of sector
i, and
Xi is output of sector
i.To calculate the energy use of Aggregate I, the proportion of energy use in the various sectors that contributes to aggregate I, must be determined and summarized. To do this, the
CEUs were multiplied by the value inputs provided by the sectors corresponding to agriculture and the food industry, according to data obtained from the input-output tables. To avoid double counting, the energy use that results from self-supply in agriculture and the food industry has been subtracted from the amount calculated. The energy consumption of Aggregate I was thus calculated as the total of energy consumption resulting from the supply of agriculture (
EUas) and from the supply of the food industry (
EUfs):
where
EUas is the energy use resulting from the supply to agriculture,
i = 1, 2, ... ,
n are the economic sectors,
zia is the value of input from sector
i to the agriculture sector
a,
zaa is the value of input from agriculture sector
a to itself,
CEUa is the agriculture energy use coefficient, the remaining variables were defined previously:
where
EUfs is the energy use resulting from the supply to the food industry,
zif is the value of input from sector
i to the food industry sector
f,
zff is the value of input from the food industry sector
f to itself,
CEUf is the food industry energy use coefficient, the remaining variables were defined previously.
The energy use in Aggregate II was computed as a sum of the energy consumed by agriculture activities. Double counting problem was avoided by subtracting the agriculture energy use that resulted from supplying the food industry (this energy use is counted as a part of Aggregate I):
where
EUII is the energy use of agriculture sector
a,
zaf is the value of input from agriculture sector
a to food industry sector
f, the remaining variables were defined previously.
Similarly, the energy use of Aggregate III was calculated as a sum of energy consumed by food industry activities and, to avoid double counting, the food industry energy use that resulted from the supply to agriculture was subtracted:
where
EUIII is the energy use of food industry sector
f,
zfa is the value of input from food industry sector
f to agriculture sector
a, the remaining variables were defined previously.
The second step was to calculate the energy intensity of food production systems as a ratio between the energy use of food production and food production system GDP at 2010 constant prices. Calculated this way, energy intensity is a measure of the energy inefficiency of an economy. It indicates a price or cost of converting energy into GDP. An inverse way of looking at this indicator would be how many economic units of GDP are produced by the consumption of units of energy, which is a definition of economic energy efficiency—the indicator commonly used in national statistics and energy efficiency research [
61]. In order to calculate the energy intensity of food production systems, we followed Mrówczyńska-Kamińska and Bajan’s [
62] method, which is consistent with the developed method of calculating food production energy use. It allows us to calculate the GDP of each of three food production aggregates. The first stage in calculating the GDP of a food production system from the WIOD national input-output tables, which are given in basic prices, consists of determining the value added at producer prices in the input-output tables. According to the 2008 version of SNA, the value added at producer prices is the total value added at basic prices plus net taxes on products:
where
VAPP is the value added at producer prices,
VABP is the value added at basic prices, and
NTOP is the net value of taxes on products.
The next steps rely on approach consistent with energy use calculations. First, the coefficients of value-added flows for each sector were calculated by dividing the value added at producer prices in the given sector by the corresponding output:
where
CVAi is the coefficient of value-added of sector
i,
VAPPi is the value added at producer prices of sector
i, the remaining variables were defined previously.
Second, the GDP of each food production system aggregate was calculated. The GDP for aggregate I, was calculated as follows:
where
GDPI is the gross domestic product of aggregate I,
CVAa is the coefficient of value-added of agriculture sector
a,
CVAf is the coefficient of value-added of food industry sector
f, the remaining variables were defined previously.
The GDP of Aggregate II was estimated as follows:
where
GDPII is the gross domestic product of aggregate II,
VAPPa is the value added at producer prices for agriculture sector
a, the remaining variables were defined previously.
Finally, the GDP of Aggregate III was determined as follows:
where
GDPIII is the gross domestic product of Aggregate III,
VAPPf is the value added at producer prices for food industry sector
f, the remaining variables were defined previously.
When analyzing the results, a few assumptions and limitations that occur in the study should be taken into account. First, the method used measures the energy efficiency of a food production system, which means that energy consumption at a household level is not taken into account in the calculations. The boundary is set at the food industry activity level. The second important assumption relates to the accounting of energy used in the production of inputs used by agriculture and the food industry as part of the energy consumption in the food production system. In the existing literature, the energy used to produce inputs for the food industry tend to be omitted in many food system calculations. Therefore, attention should be paid to the comparability of the results with other studies in this aspect. Some limitations also lie in the level of data aggregation, which causes that fluctuations in the structure of food production may have an impact on the final aggregated energy efficiency results. Ideally, the energy efficiency could be calculated for each product separately. However, there is no database that would allow this type of comparable calculation for several countries. Therefore, it is necessary to take into account the conditions typical for the analyzed countries and check whether there were any clear changes in the production structure. Finally, the comparison of absolute values of energy efficiency between different countries is biased by natural conditions affecting both energy consumption and production volume, however, observing changes in energy efficiency over time allows correct conclusions to be drawn.
3. Results and Discussion
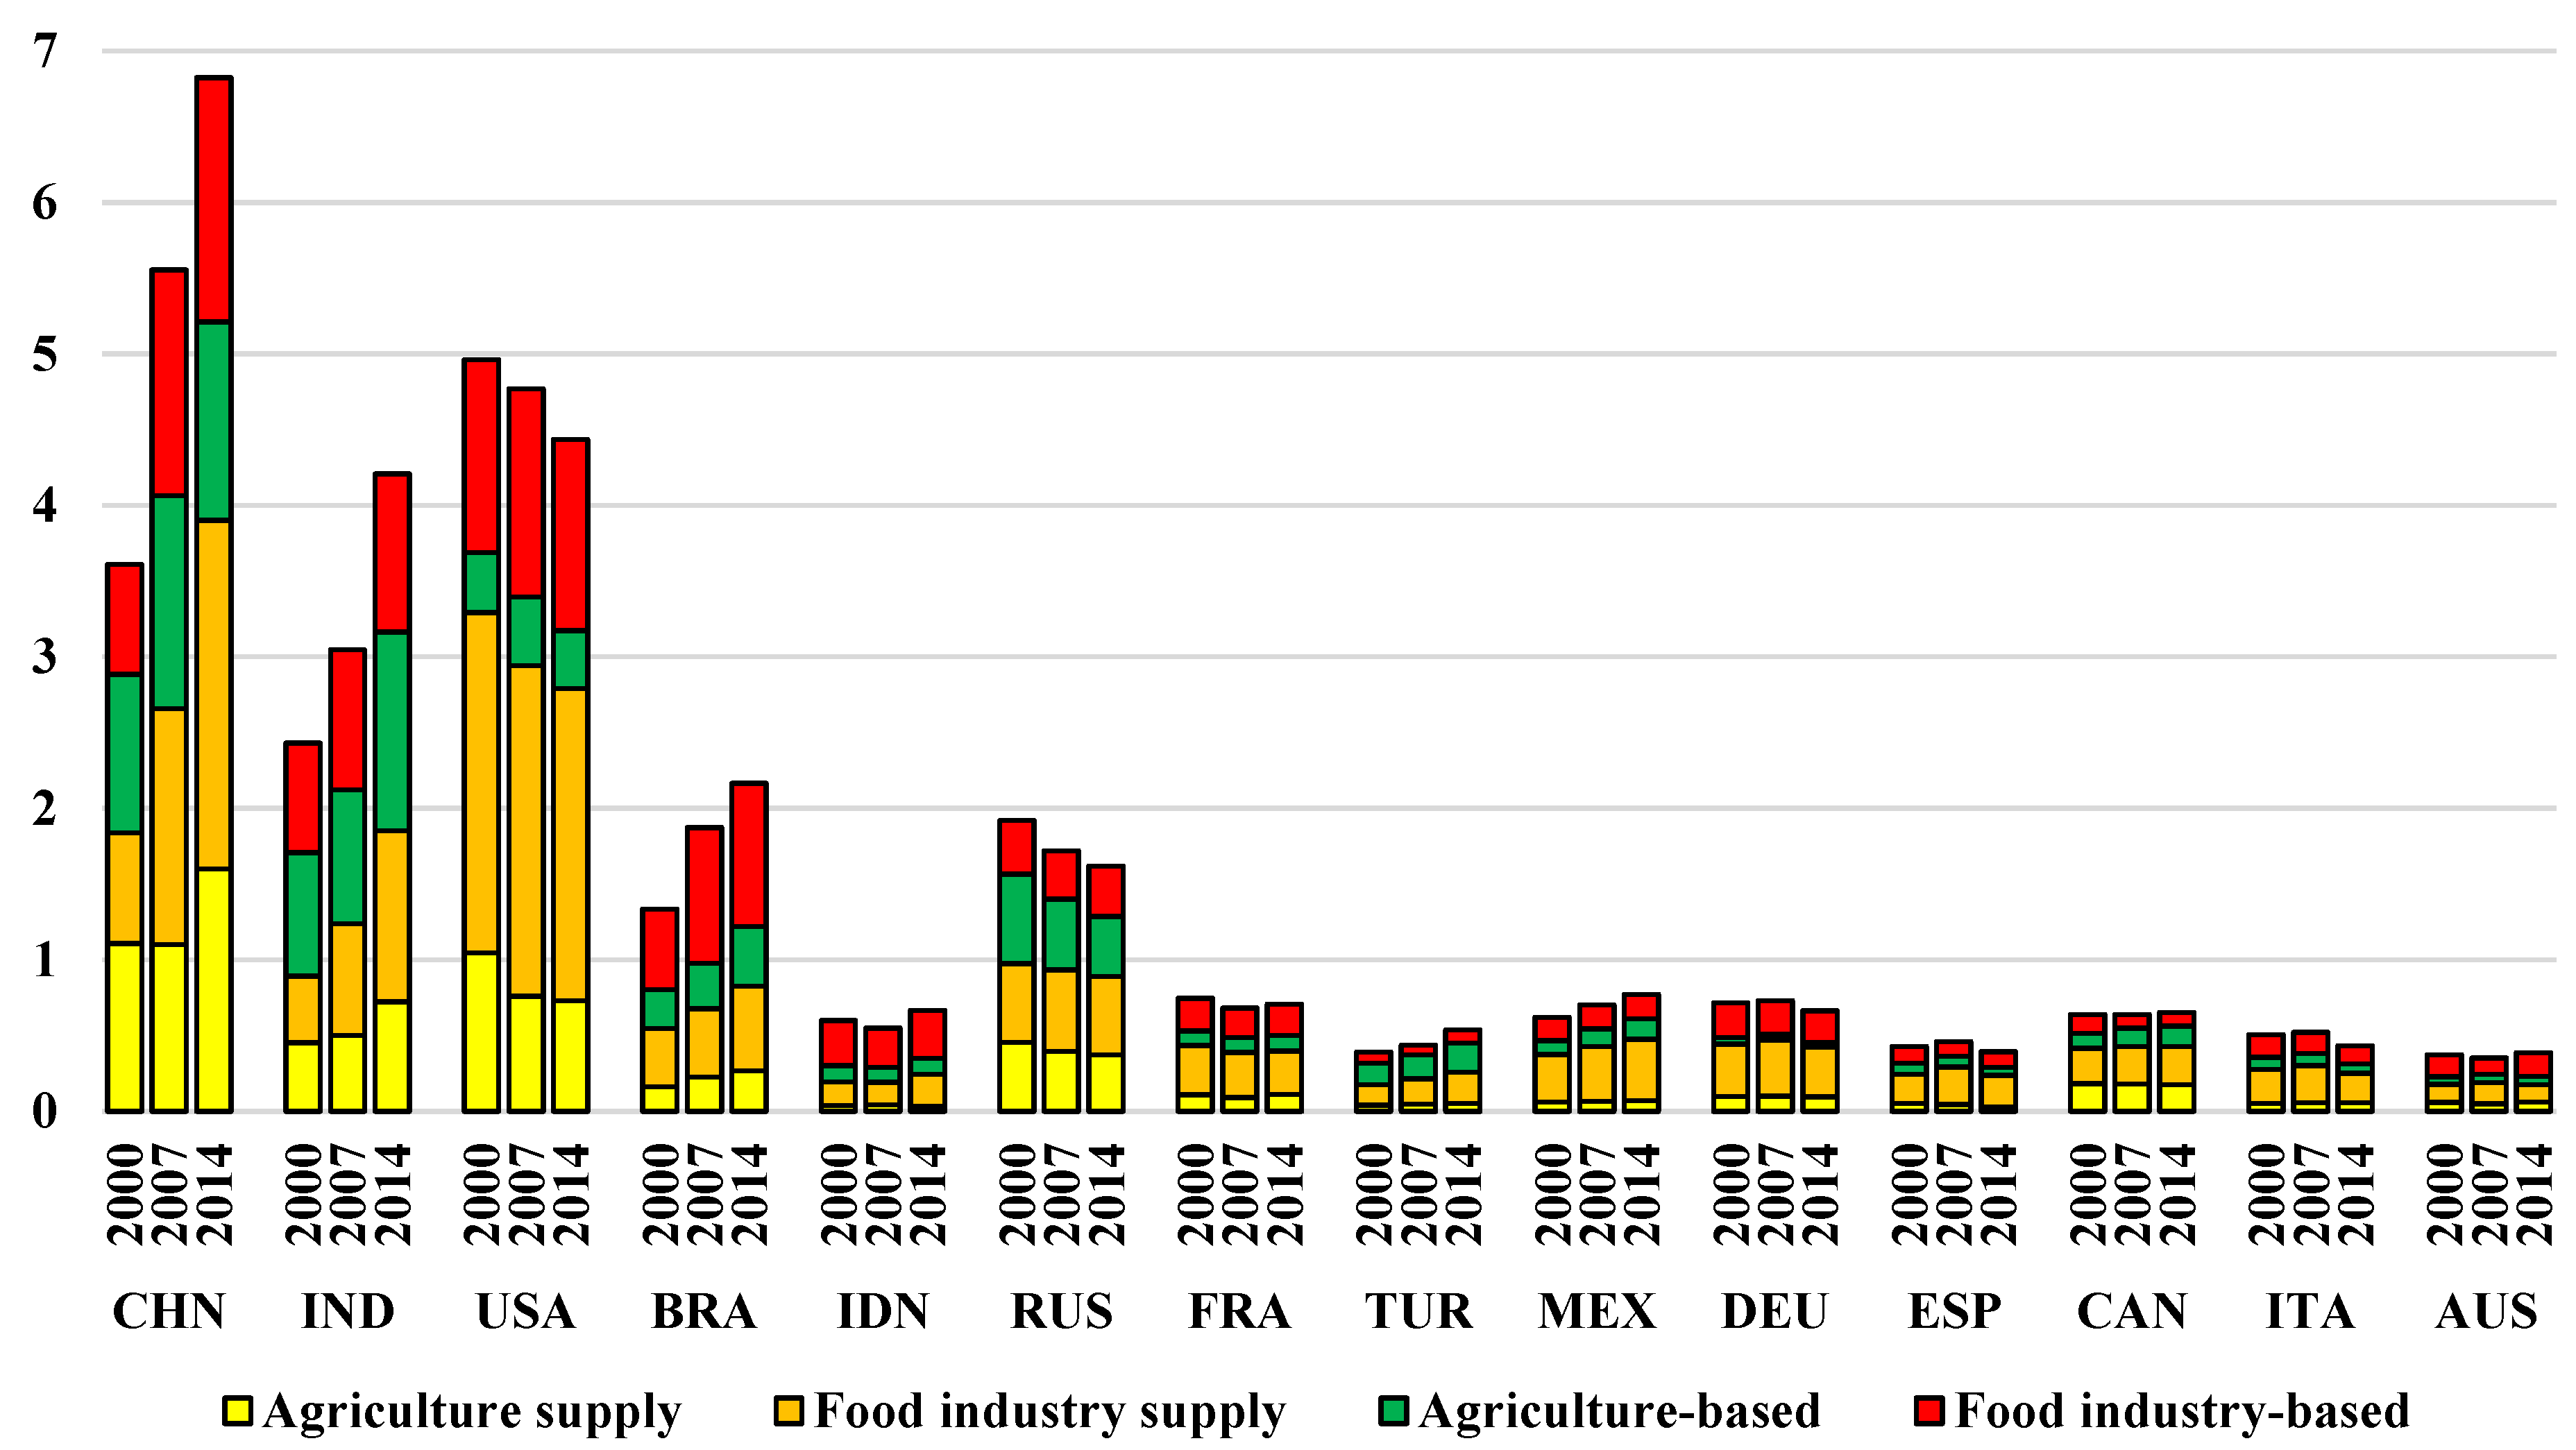
According to the calculations carried out, there has been a general increase in energy consumption in the food production systems of the analyzed countries over the years under review, from over 19 EJ (exajoule = 10
18 J) in 2000 to over 22 EJ in 2007 and nearly 24.5 EJ in 2014. This results in an average increase of 27% over the analyzed period. However, not all countries experienced an increase in energy consumption (see
Figure 1). In Russia and the US, there were 15.5% and 10.5% decreases, respectively, in energy consumption related to food production over the entire period, while in the European Union countries analyzed (France, Germany, Spain, and Italy), this decrease was visible when comparing 2014 to 2000, with the highest value being recorded in Italy, at over 14%. The greatest increase in energy consumption in food production systems was recorded in developing countries, particularly in China, by as much as 89%; in India, by 73%; and Brazil, by 62%. The calculations show that from 2000 to 2014, developed countries reduced energy consumption in the food production process or maintained it at a similar level, while developing countries increased such energy consumption. Over the period analyzed, the average increase in energy consumption in the food industry-based aggregate of the countries analyzed was 30%, an increase from 5.1 EJ to 6.6 EJ. The higher increase, at 38%, from 6.4 EJ in 2000 to 8,8 EJ in 2014, came only from indirect energy consumption in the food production process due to the food industry supply. Energy consumption in the agriculture-based aggregate increased, on average, by almost 20%, from 3.9 EJ to 4.7 EJ, while consumption resulting from the supply of agriculture increased by almost 12%, from 3.9 EJ to 4.4 EJ, over the analyzed period.
The largest part of the analyzed energy consumption by country comes from the food industry or its supply. The only exceptions in this respect are Indonesia and Russia, where about 50% of consumption comes from agriculture and its supply. The overall trend is that in highly developed countries, in food production, the indirect energy consumption from Aggregate I (supply) prevails, with the exception of Australia, where energy consumption in the food industry is clearly higher than in other developed countries. By contrast, in developing countries, most of the energy consumed in food production is consumed directly by agriculture or the food industry, with the exception of Mexico, mainly because of the high energy consumption of the food industry supply. A detailed analysis of the input-output table and energy accounts shows that Mexico is the only country among those analyzed where almost 50% of the indirect energy consumption in the food industry is due to the raw materials provided by agriculture. In the remaining developing and developed countries, this is a significantly smaller percentage, which explains the existing difference. In other words, a much larger proportion of agricultural production in Mexico, as compared to other developing countries, is intended for processing, which results in clearly greater indirect energy use as compared to direct energy use in agriculture. Additionally, China is undergoing a rapid transformation toward the trends observed in developed countries. The greater share of energy consumption in agriculture in the food production chain observed in less developed countries is mainly caused by the greater share of the agricultural sector in the final food production of these countries, as indicated by Bajan and Mrówczyńska-Kamińska [
63]. In turn, the relatively high direct energy consumption in the food industries of developing countries, as compared to their indirect energy consumption in the food production system, is often caused by technological differences in food processing [
40].
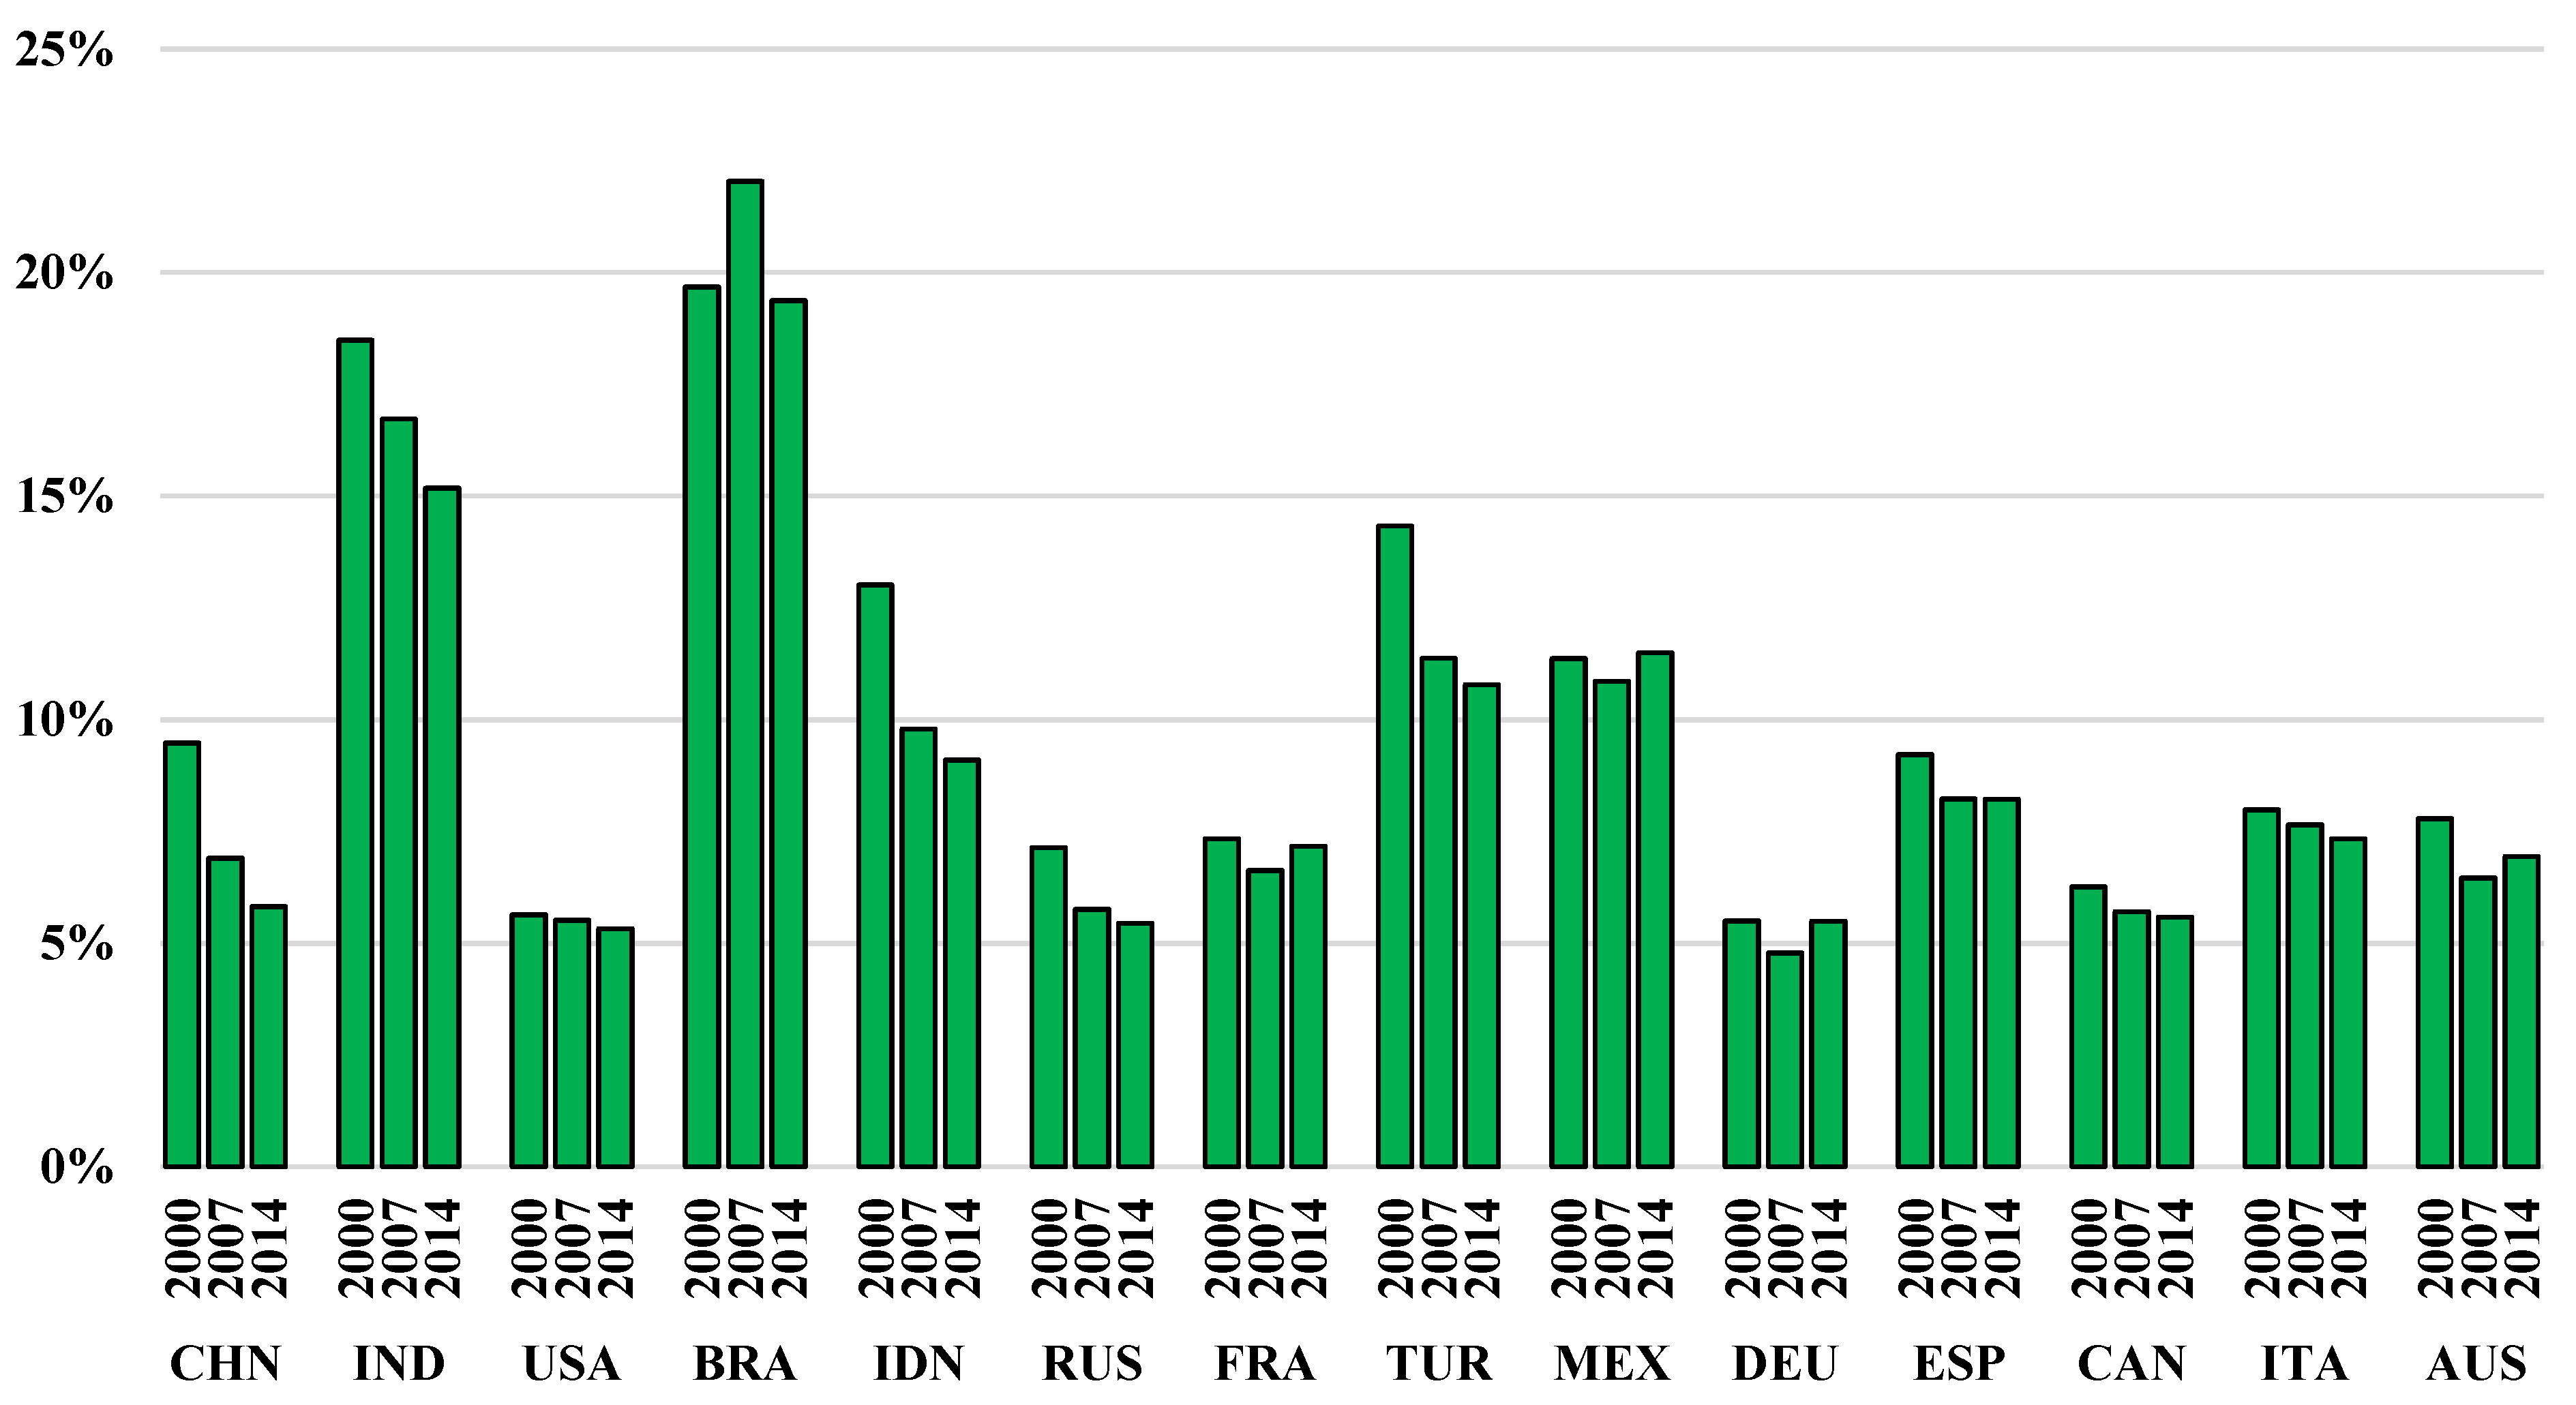
Despite the fact that in the analyzed countries, in general, the energy consumption related to food production is increasing, its share in total industrial activities’ energy use is decreasing (
Figure 2). At the same time, this means that the energy consumption in other sectors of the analyzed economies is growing more quickly, on average, than in food production. The average share of food production in the industrial energy consumption of the analyzed countries in 2000 was 8.2%, which decreased to 7.5% in 2007 and to 7.2% in 2014. In developing countries, this percentage was larger, mainly due to the higher share of the food sector in the output of these countries. This phenomenon was also observed by other researchers [
2,
3]. In contrast, our calculations show that China is the exception. There, because of rapid industrialization, which causes high energy consumption in other economic sectors, the share of food production in energy consumption is lower [
64]. The only country where the percentage of energy consumption from the food production system increased was Mexico; however, the increase was only 0.1 percentage point. In the remaining countries, this percentage has clearly decreased or remained at a similar level, when comparing 2014 to 2000. The highest decreases were recorded in Indonesia, 3.9 percentage points; China, 3.7 percentage points; Turkey, 3.5 percentage points; and India, 3.3 percentage points.
Differences between countries in energy use, as well as in energy efficiency itself, may be caused by differences in production structure, climate or cultivation practices. Such conditions may also change within a country over time. In order to take these changes into account,
Table 1 presents selected production and cultivation indicators in analyzed countries. On the one hand, an increase in the yield of cereals may indicate an improvement in the income situation, but in this respect, supply-price relations play a significant role. Certainly, clear drops in yields indicate unfavorable weather conditions, which may affect both the energy consumption side and the profitability of production. However, with a few exceptions, in the analyzed countries, cereal yields are generally growing steady, or their fluctuations are not significant. Clearly lower than average yields were observed only in Australia in 2007. Yield drops were also recorded in Germany and France in 2007 which, however, were still high and Spain in 2014.
The second selected indicator is the share of organic soil in total cultivated cropland. On the one hand, the production of organic food uses less energy than conventional production, and on the other hand, the products of organic farming are more expensive. Therefore, when the use of land for organic farming increases, one should expect an increase in the economic energy efficiency index, however, such an increase does not result from improvements in energy efficiency per se. The share of organic soil in total cropland in the analyzed countries is low, usually not exceeding 1%. Moreover, this share hardly changes in the analyzed years. The exception is Indonesia, where organic soil accounted for about 9% of cropland, which may result in a relatively higher energy efficiency index. Above that, in Germany organic soil accounts for over 4% of cropland and in Canada almost 3%.
The last selected indicator is the share of livestock in the value of agricultural production. The energy consumption of livestock production is usually significantly higher than that of agricultural crops due to feed conversion inefficiencies and a higher energy requirement for fat and muscle gain [
17]. Also in the case of this indicator, there was no significant variability in the analyzed years. The exception among the analyzed countries was Russia, where the indicator decreased significantly, and Turkey, where it increased. However, the share of livestock in the value of agricultural production differed noticeably between countries. Moreover, one-year changes in the index value can be observed in the case of Canada in 2014, where the index decreased, and Australia in 2007, where the index increased. However, it should be associated with inversely proportional values of cereal yields in these two countries.
The calculations carried out have shown that despite the average increase in energy consumption in the food production systems of the analyzed countries, their average energy intensity is decreasing. Therefore, energy efficiency is increasing, which is essential in the context of the forecasted increase in global food demand. The average energy intensity in the analyzed countries was 8.5 MJ (megajoule = 10
6 J) per USD 1 worth of GDP at 2010 constant prices in 2000, and this decreased to 8.1 MJ/USD in 2007 and then to 6.9 MJ/USD in 2014. This means that an increase in energy consumption in food production systems does not rule out an increase in their economic energy efficiency. In the 1970s, Steinhart and Steinhart [
45] questioned the opinion advanced by the technological optimist, that food production can always be increased as long as more energy is supplied to the system, claiming that such a possibility exists only until a certain threshold point. As the obtained results show, such a possibility still exists because a decrease in energy intensity given increasing energy consumption means an even faster increase in the value added and thus in production. Of course, since the 1970s, there has been a huge technological leap. More attention is paid to the issue of sustainability, and in addition, the possibilities for fossil-based energy production are limited, which forces the economy to move toward the improvement in energy efficiency.
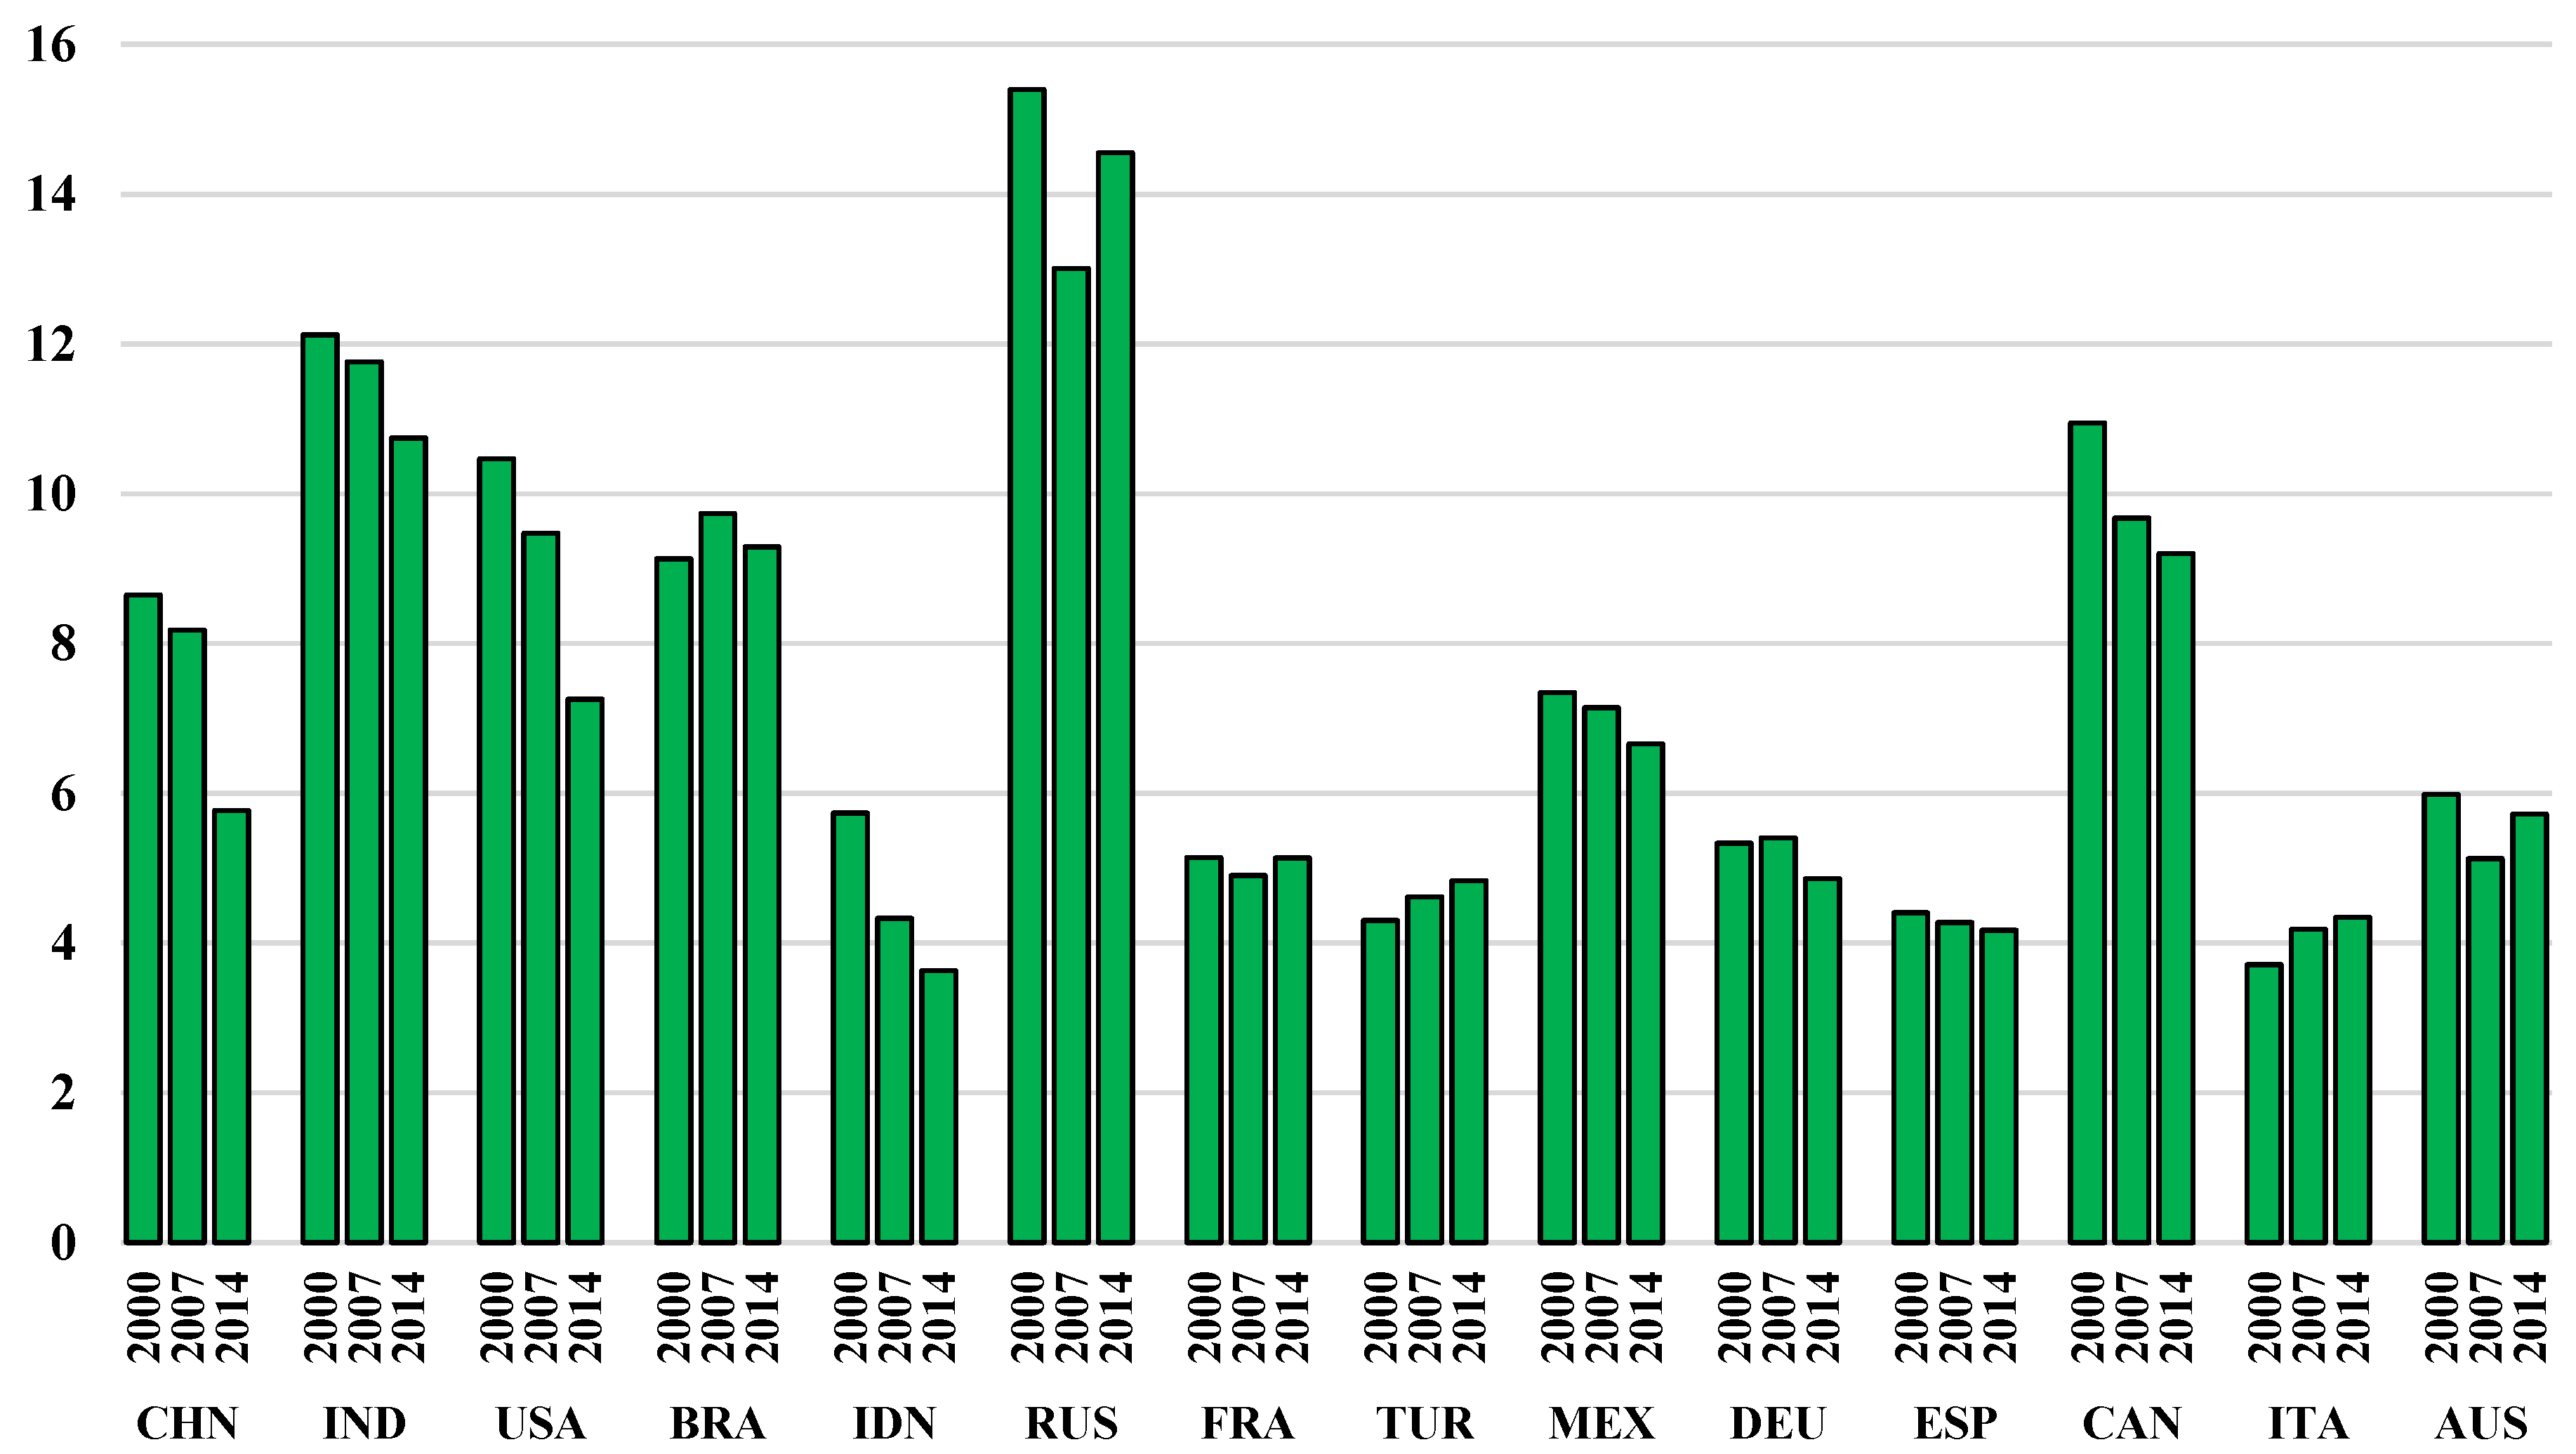
The highest energy intensities for food production systems during the analyzed period were observed in Russia, India, Canada, and Brazil (
Figure 3). In India and Canada, this indicator decreased by 11% and 16%, respectively, while in Russia and Brazil, no clear direction of change was observed. A high-energy-intensity food production system, at the level of 10.5 MJ/USD, was also observed in the US in 2000. However, the indicator decreased by more than 30% over the analyzed years, to 7.3 MJ/USD in 2014. This was the highest increase in energy efficiency among the analyzed countries, along with Indonesia, at 36.5%, and China, at 33%. It is worth mentioning that such a large increase in efficiency in China was achieved with the highest increase in energy consumption among the analyzed countries. Increases in the energy intensity of the food production system over the entire analyzed period occurred in Turkey and Italy, by 12% and 17%, respectively. The energy intensity results in the entire food production system are caused by the energy intensity in particular aggregates. As detailed calculations show, high-inefficiency energy consumption in the food production systems of developed countries takes place in the case of the agriculture-based aggregate, while in developing countries, higher energy intensity takes place in the food industry-based aggregate (
Table 2). Mexico and Australia are the exceptions, which is due to the previously mentioned sources of energy consumption in these countries.
The highest energy inefficiency was in the food industry-based aggregate in India, where more than 55 MJ was consumed to obtain USD 1 GDP in 2000. Energy intensity improved by almost 30% over the analyzed period and reached 39 MJ/USD in 2014. This is still the greatest result among all analyzed aggregates in all countries. Such a high inefficiency results mainly from the very low value added in the Indian food industry, which is, on average, the lowest among the analyzed countries. In addition, Goyal et al. [
65] indicate high energy inefficiency in rice processing, which constitutes the largest part of the food industry in India. This inefficiency results from the use of a large part of the rice mills of old energy-intensive technology. The food industry-based aggregate in Brazil and Russia is also characterized by low energy efficiency. In Brazil, on average, 16 MJ were needed to achieve USD 1 GDP in the years analyzed, while in Russia almost 10 MJ were needed. In both of these countries, the energy intensity of the food industry-based aggregate did not show a clear trend. The energy intensity of this aggregate decreased significantly in Indonesia and China, by 40.5% and 42.5%, respectively. However, the decrease in China took place only after 2007, and since, this value has reached almost 48%. Over the entire analyzed period, low energy intensity values for the food industry-based aggregate were observed in Germany, on average, 4.1 MJ/USD. As Martínez [
50] claimed, the German food industry is a world leader in energy efficiency, but our results do not support this claim. Although the energy intensity of the German food industry is low, lower results were observed in technologically similar France, Italy, or Spain, as well as in Mexico and Turkey. In all of these cases, the energy intensity of the food industry-based aggregate was, on average, 3.2 to 3.8 MJ/USD in the analyzed years.
In the case of the agriculture-based aggregate, the lowest energy efficiency was recorded in Canada and Russia, with average energy intensities of 11.5 MJ/USD and 11.4 MJ/USD, respectively, over the analyzed period. In Russia and Canada, a relatively high percentage of energy consumption comes from agriculture, which is caused by severe weather conditions for cultivation over a large area of both countries. Which seems to be the main reason for such a high energy intensity compared to other countries. The largest decrease in the energy intensity of the agriculture-based aggregate took place in the US, from the 9.5 MJ/USD in 2000 to 5.3 MJ/USD in 2014, which constitutes a decrease of 44.5%. A high decrease over the analyzed period was also recorded in Indonesia, at 35%, and China, at 29.5%, where the index values were already at a relatively low level in 2000. In the group of highly developed countries belonging to the European Union, where the energy intensity of the agriculture-based aggregate is relatively low, high increases have been recorded. In Germany, this value was 50%, reaching 6.2 MJ/USD in 2014. In Spain, it was 47%, reaching 4.6 MJ/USD. In France, it was 30%, reaching 4.9 MJ/USD. In Italy, it was more than 27%, reaching 3.3 MJ/USD. The increase in energy intensity in these countries was caused mainly by the decrease of the GDP value in the discussed aggregate but also, with the exception of Spain, due to maintaining relatively high cereals yield. Based on the results for energy intensity in the agriculture-based aggregate, it can also be noted that in general, higher efficiency occurs in countries characterized by relatively better climatic conditions for cultivation. This thesis is confirmed by the results of studies that indicate lower coefficients for the material intensity of agriculture are obtained in countries with better climatic conditions [
66]. This results from the fact that lower inputs also cause lower energy consumption. These countries are also generally more focused on crop production, which requires fewer inputs than animal production [
67].
In most of the analyzed countries, significant inefficiencies occur in the case of Aggregate I - supply. Both in the structure of the agricultural supply and the food industry, the energy consumption caused by the power supply of machines or transport dominates. A large part of the energy is also due to the production of fertilizers for agriculture and packaging for products of the food industry, and these are the areas where the lowest energy efficiency should be seen. As in the case of the agriculture-based aggregate, the highest average energy intensity indicators in Aggregate I, were observed in Russia and Canada over the analyzed period, 20.3 MJ/USD and 13.7 MJ/USD, respectively, which is presumably associated with the need for higher inputs in more difficult weather conditions. Contrary to the agriculture-based aggregate, these indicators decreased during the analyzed period, especially in Canada, where the decrease was almost 14%, while in Russia it was less than 12%. A decrease in energy intensity or at least no change in the supply aggregate can be noted in all the analyzed countries apart from Turkey and Italy, where the indicators are, however, relatively low. The largest decreases in energy intensity in Aggregate I, were observed in China, the US, and Indonesia, 49%, 37.5% and 35%, respectively. Among the analyzed countries, it is these three countries that have improved the energy efficiency of food production system the most during the analyzed period, and China and Indonesia were the most effective in this respect at every stage of the production chain, that is, in all three aggregates. The US also improved energy efficiency at every stage of the food production chain in the analyzed period, but in the case of the food industry-based aggregate, the improvement was relatively low. It should be noted that in each of the three mentioned countries the reasons for the increase in economic energy efficiency were slightly different. The main driver of the index improvement in China was the increase in food production and profitability from it, at the same time energy consumption was clearly increasing. Food production value has also increased in the United States, but clearly slower than in China, while energy consumption in the food production system has decreased. In Indonesia, on the other hand, the results are mixed. There has been a significant increase in the value of food production, with fluctuations in energy consumption.
The literature often indicates differences in the energy efficiency of particular types of food, especially the low efficiency of animal products [
68,
69]. However, a low energy efficiency can also be caused by highly processed foods or foods with low nutritional value [
70]. However, Pelletier et al. [
17] point out that in the context of developing countries, such dependencies do not always arise. The energy efficiency of food may differ significantly, even in the same product group, due to the multitude of factors affecting the final indicator values [
15]. Our results confirmed this statement in the case of economic energy efficiency, calculated using energy intensity indicators expressed per unit of GDP. For example, there is no clear correlation between the achieved values for the energy intensity indicator and the share of animal production in agricultural production in the analyzed countries. The FAO data (see
Table 1) indicate that Indonesia has the lowest percentage of animal production among the analyzed countries, 11%, on average, and at the same time, its food production system had the lowest energy intensity. However, other countries, such as France and Germany, with the highest share of animal production, together with Australia, are also characterized by low energy intensity. In contrast, China, which along with Indonesia, has reduced the energy intensity of the food production system the most, is also characterized by a low percentage of animal production, 33%, on average, which may suggest that it is easier to improve economic energy efficiency in crop production than in animal production. However, in the US, which has also significantly increased the energy efficiency of the food production system, a high share of animal production has been recorded over the analyzed period, at an average level of 45%, which again indicates the influence of many factors on the final efficiency achieved.
Making entirely correct conclusions would require a thorough analysis in terms of the energy intensity of particular groups of food products, but the level of data aggregation makes it impossible to carry out this type of study. In other words, there is no database in which such detailed energy accounts (at the appropriate level of disaggregation) could be found and drawn up in a uniform manner for many countries, allowing the comparison of energy intensity results for particular product groups. It should also be mentioned that in our study, the level of aggregation of sectors in the WIOD database results in part of the agricultural production taken into account in the calculation being the non-food production. However, the FAO data show that this is around 3% of the value of the agricultural production in the analyzed countries, which does not have a significant influence on the results for energy consumption and energy intensity in the entire food production system, allowing full comparability of the results obtained between the countries.


