Polymer Electrolyte Fuel Cell Degradation Mechanisms and Their Diagnosis by Frequency Response Analysis Methods: A Review


Abstract
:
1. Introduction
2. Faulty Conditions and Degradation Mechanisms
2.1. Performance Losses and Degradation Mechanisms Associated to Flooding
2.2. Performance Losses and Degradation Mechanisms Associated to Drying Out
2.3. Performance Losses and Degradation Mechanisms Associated to Starvation of Reactants
2.4. Performance Losses and Degradation Mechanisms Associated to Impurities
3. FRA Methodologies Applied to PEMFCs
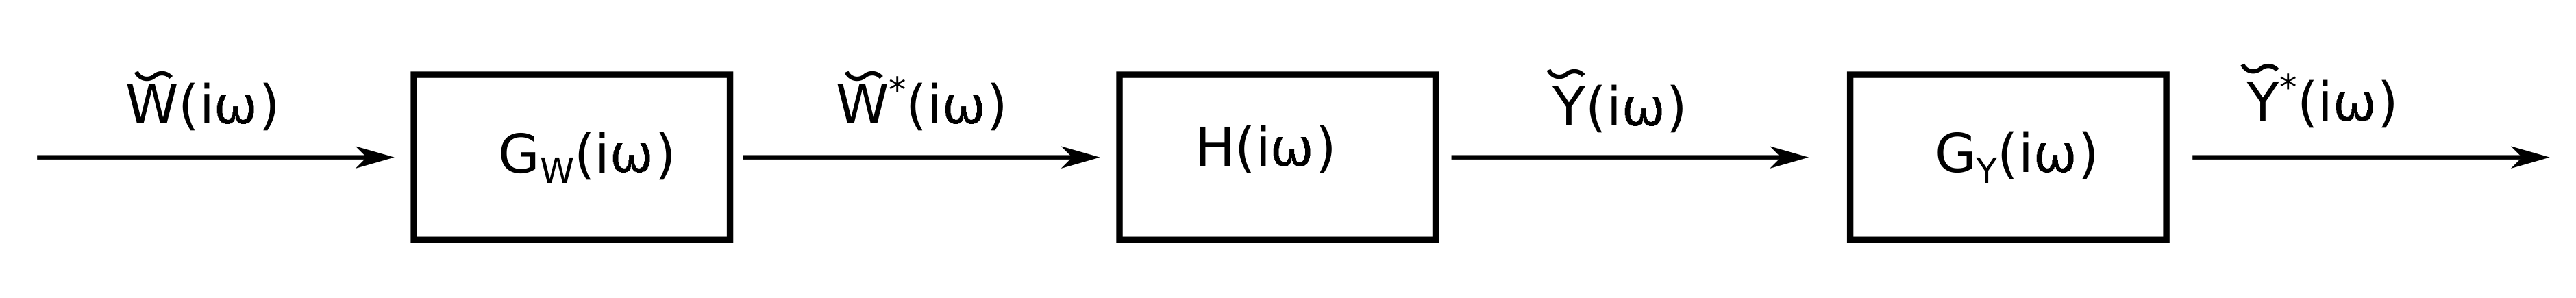
3.1. Theoretical Background
3.2. EIS: Use and Limitations of the Most Used FRA Method in Fuel Cell Science
3.3. Frequency Response Methodologies Based on Nonelectrical Quantities
4. Critical Remarks and Conclusions
Author Contributions
Funding
Conflicts of Interest
Abbreviations
| cFRA | Concentration-alternating Frequency Response Analysis |
| CL | Catalyst Layer |
| EC | Equivalent Circuit |
| ECSA | Electrochemically Active Surface Area |
| EHD | Electro-hydrodynamical Impedance |
| EIS | Electrochemical Impedance Spectroscopy |
| EPIS | Electrochemical Pressure Impedance Spectroscopy |
| ETIS | Electrochemical Temperature Impedance Spectroscopy |
| FRA | Frequency Response Analysis |
| GDL | Gas Diffusion Layer |
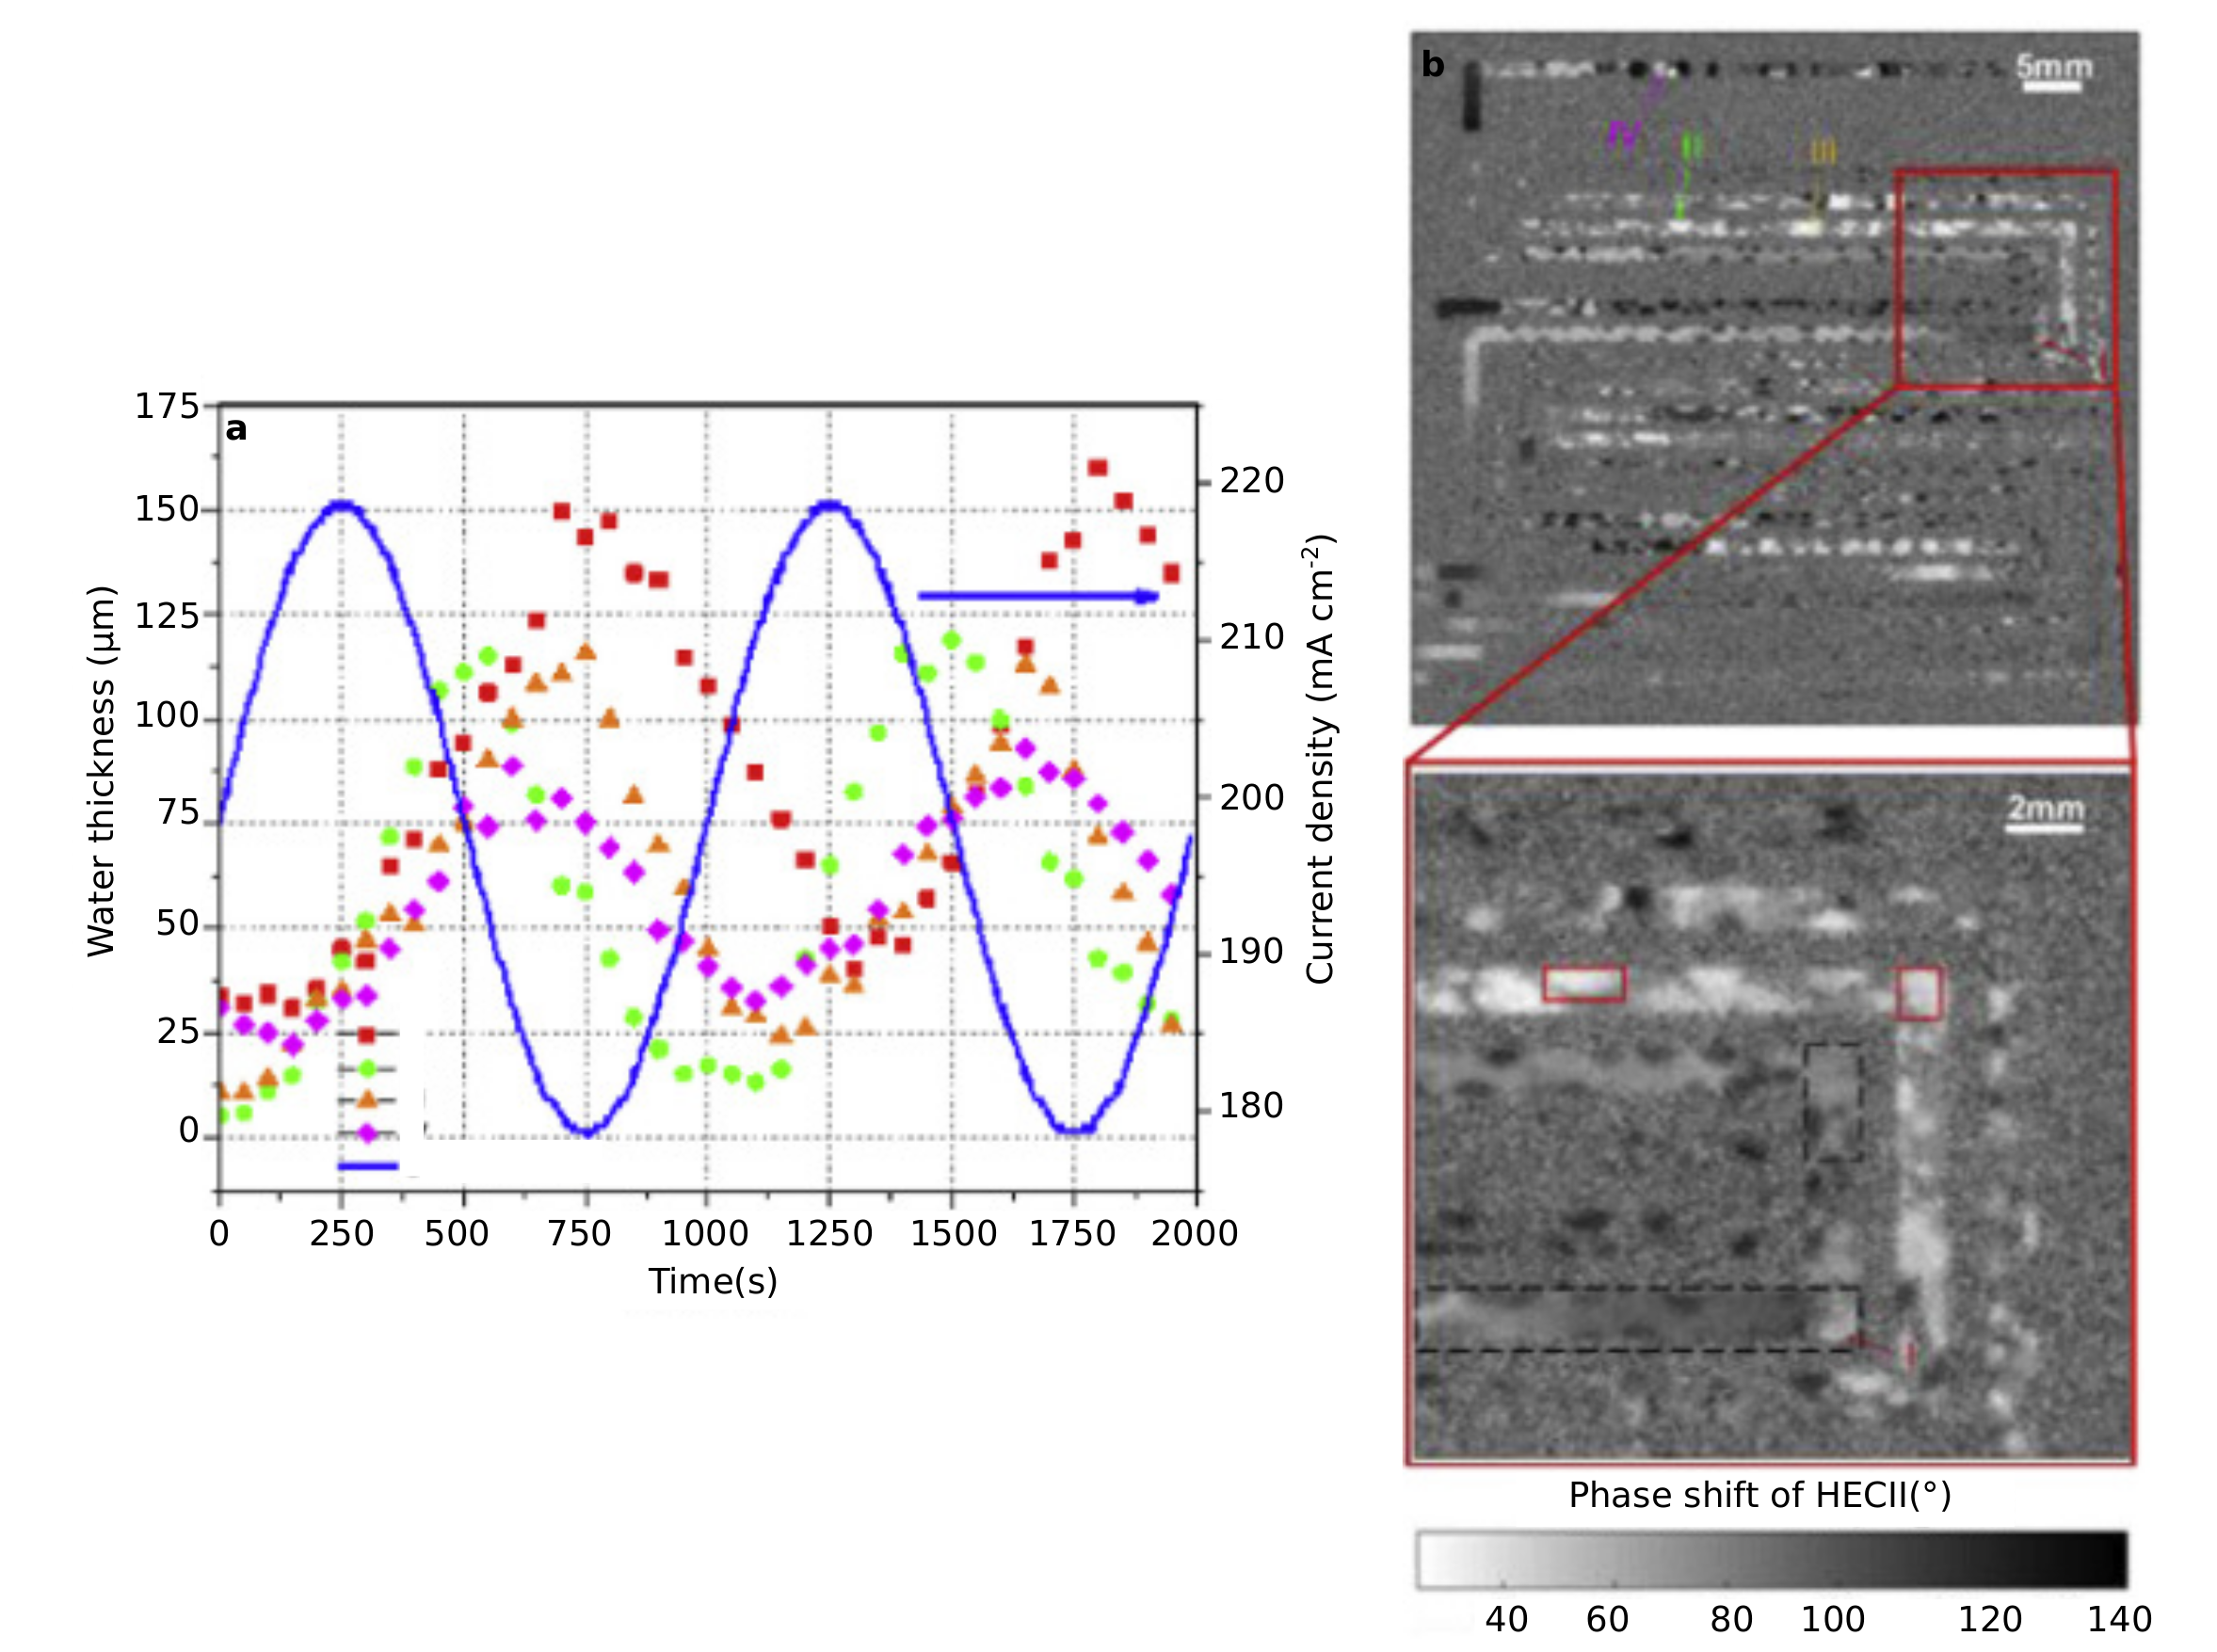
| HECII | Hydro-electrochemical Impedance Imaging |
| HOR | Hydrogen Oxidation Reaction |
| LIT | Lock-in Thermograpy |
| LST | Linear System Theory |
| MEA | Membrane Electrode Assembly |
| ORR | Oxygen Reduction Reaction |
| PEMFC | Polymer Electrolyte Membrane Fuel Cell |
| RTD | Relaxation Time Distribution |
List of Symbols
| A | state space matrix, - |
| B | observability matrix, - |
| C | controllability matrix, - |
| D | transmission matrix |
| F | generic function, - |
| G | generic function, - |
| H | generic transfer function, - |
| I | electrical current, A |
| P | pressure, Pa |
| Q | matrix of right eigenvectors, - |
| r | residual, - |
| water thickness, m | |
| T | temperature, K |
| V | potential, V |
| W | input vector, - |
| X | state variable vector, - |
| Y | output vector, - |
| Z | impedance, V A−1 |
| Greek Symbols | |
| β | normal input vector, - |
| normal output vector, - | |
| eigenvalue, - | |
| matrix of the eigenvalues, - | |
| angular frequency, Hz | |
| galvanostatic cFRA transfer function, V Pa−1 | |
| generic parameter, - |
| Indices | |
| i | raw index matrix |
| I | galvanostatic |
| inlet | |
| outlet | |
| m | index input vector |
| j | column index matrix |
| k | index state variable vector |
| surface | |
| V | voltastatic |
References
- Yuan, X.; Wang, H.; Sun, J.C.; Zhang, J. AC impedance technique in PEM fuel cell diagnosis—A review. Int. J. Hydrogen Energy 2007, 32, 4365–4380. [Google Scholar]
- Niya, S.M.R.; Hoorfar, M. Study of proton exchange membrane fuel cells using electrochemical impedance spectroscopy technique—A review. J. Power Sources 2013, 240, 281–293. [Google Scholar]
- Pivac, I.; Barbir, F. Inductive phenomena at low frequencies in impedance spectra of proton exchange membrane fuel cells A review. J. Power Sources 2016, 326, 112–119. [Google Scholar] [CrossRef]
- Tang, Z.; Huang, Q.A.; Wang, Y.J.; Zhang, F.; Li, W.; Li, A.; Zhang, L.; Zhang, J. Recent progress in the use of electrochemical impedance spectroscopy for the measurement, monitoring, diagnosis and optimization of proton exchange membrane fuel cell performance. J. Power Sources 2020, 468, 228361. [Google Scholar] [CrossRef]
- Weiss, A.; Schindler, S.; Galbiati, S.; Danzer, M.A.; Zeis, R. Distribution of Relaxation Times Analysis of High Temperature PEM Fuel Cell Impedance Spectra. Electrochim. Acta 2017, 230, 391–398. [Google Scholar] [CrossRef]
- Mao, Q.; Krewer, U. Total harmonic distortion analysis of oxygen reduction reaction in proton exchange membrane fuel cells. Electrochim. Acta 2013, 103, 188–198. [Google Scholar]
- Kadyk, T.; Hanke-Rauschenbach, R.; Sundmacher, K. Nonlinear frequency response analysis for the diagnosis of carbon monoxide poisoning in PEM fuel cell anodes. J. Appl. Electrochem. 2011, 41, 1021–1032. [Google Scholar]
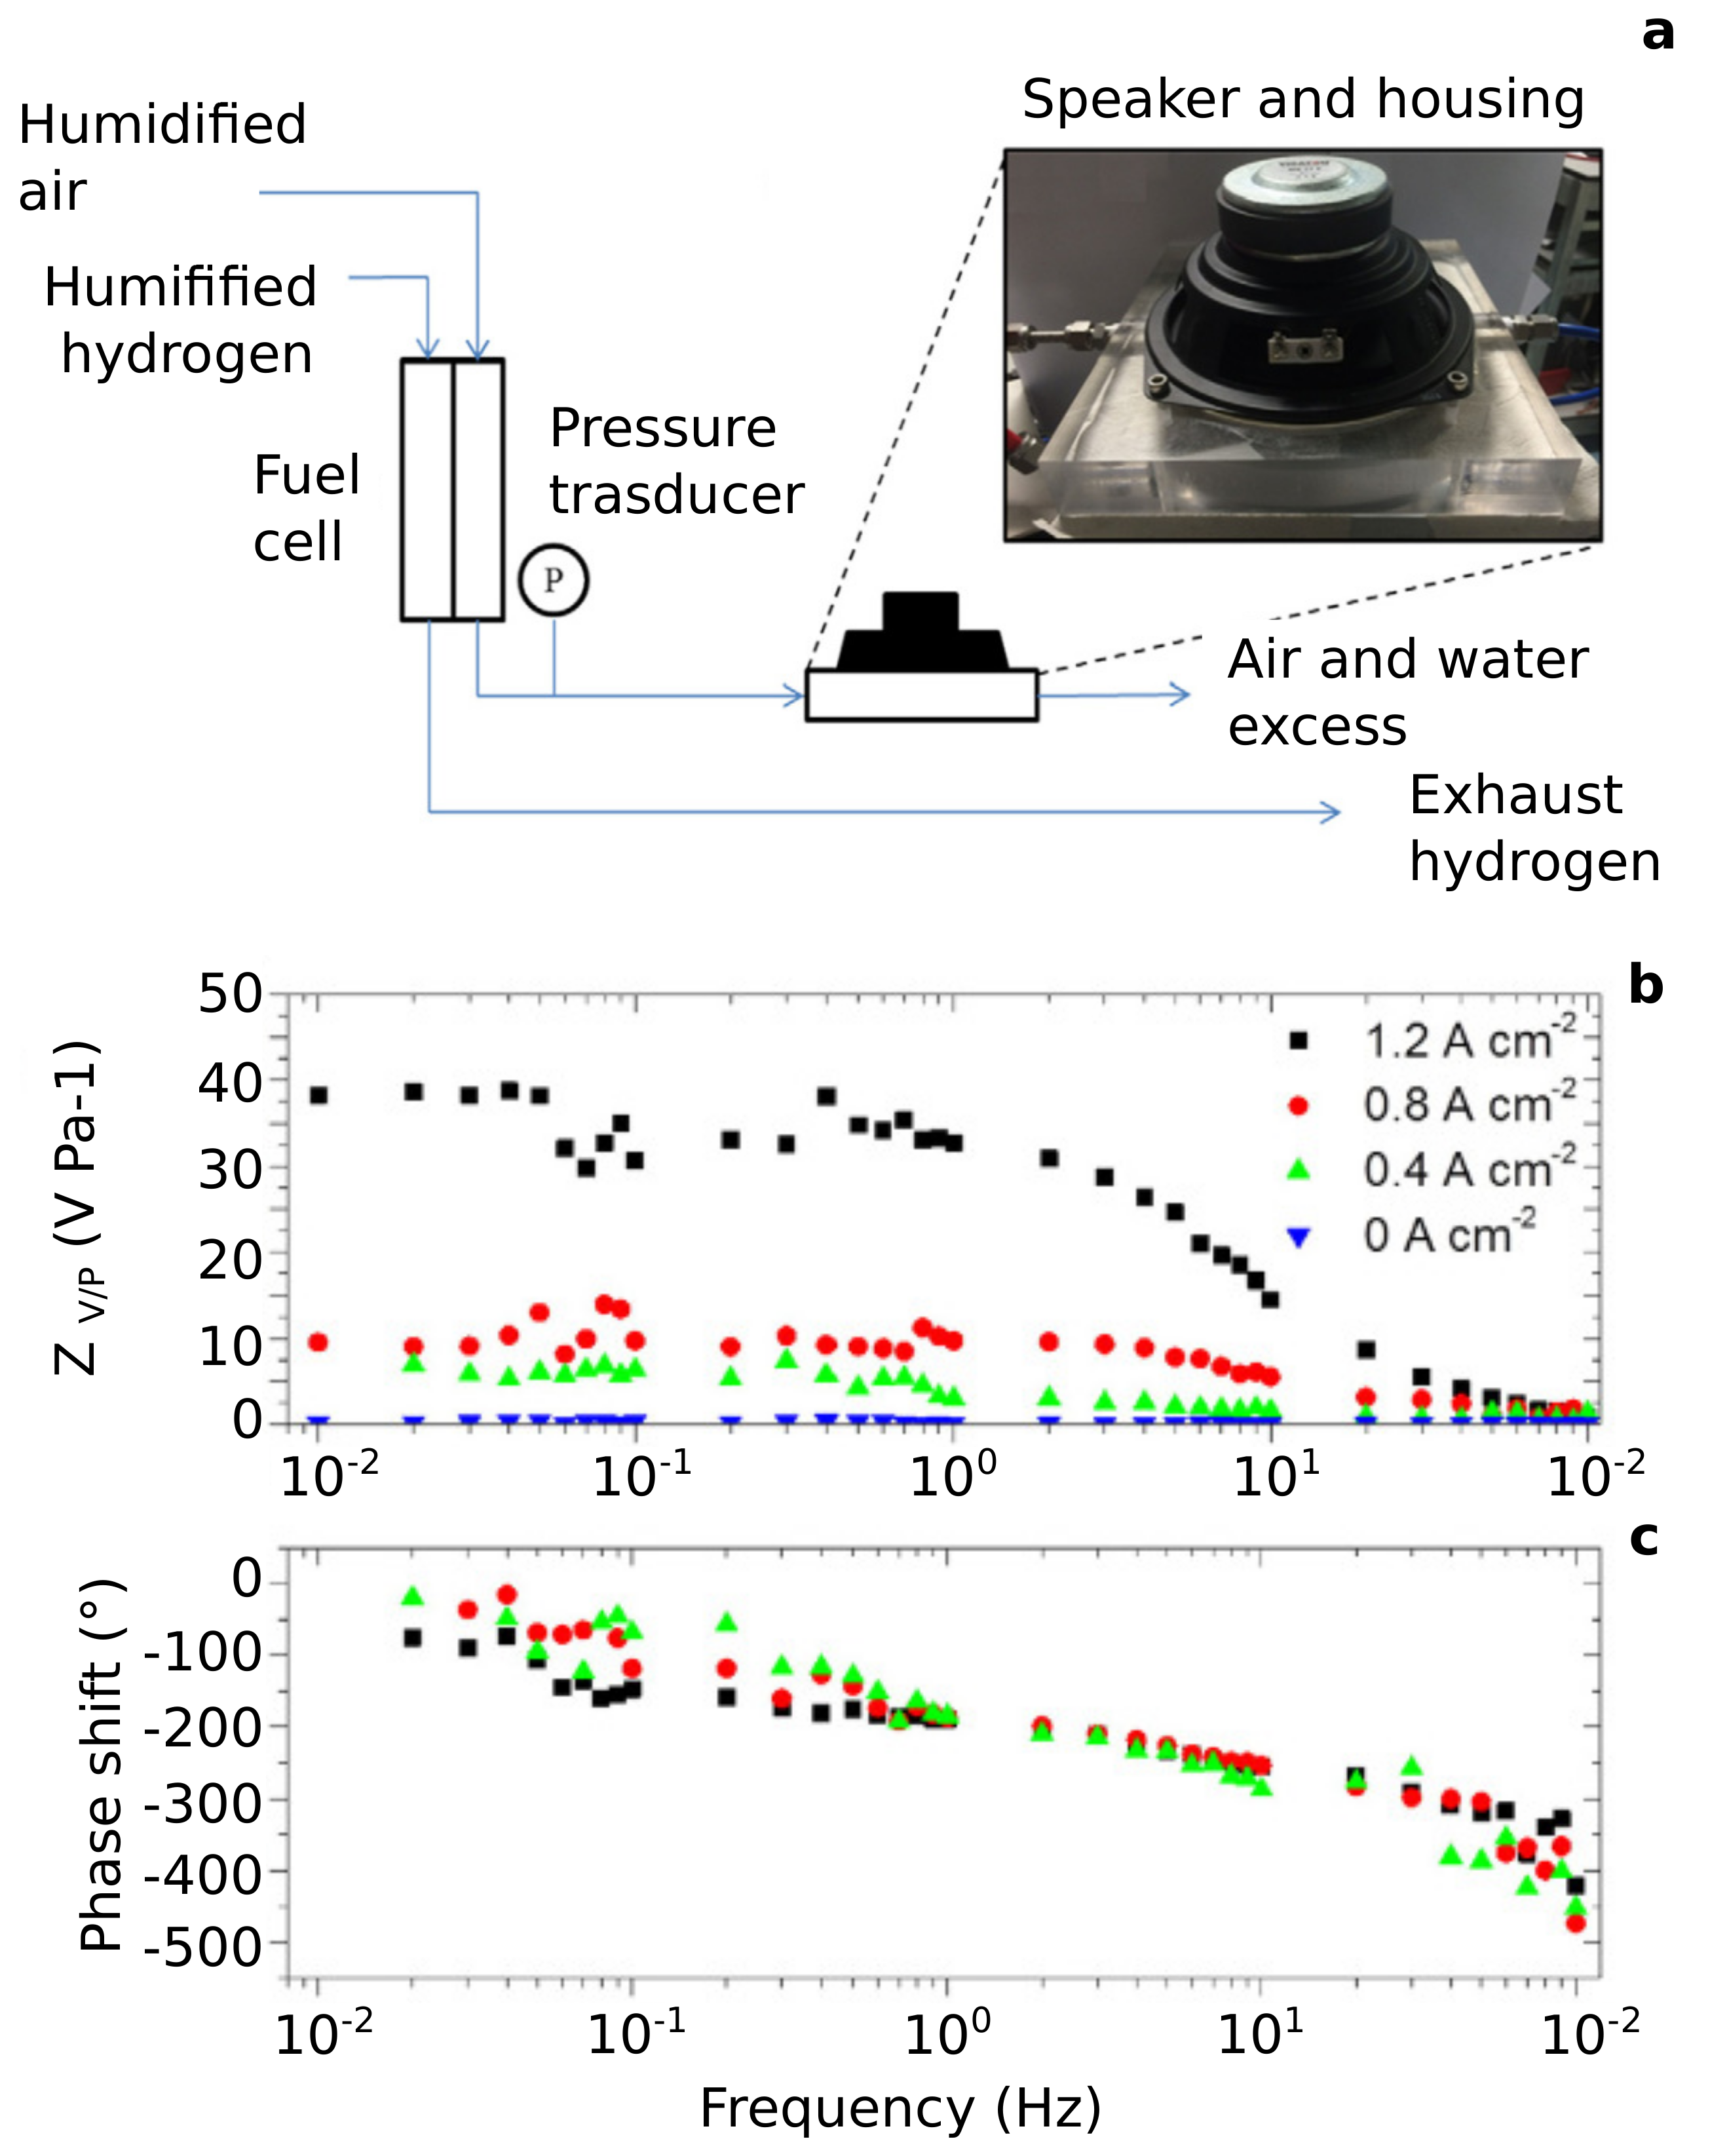
- Niroumand, A.M.; Merida, W.; Eikerling, M.; Saif, M. Pressure voltage oscillations as a diagnostic tool for PEFC cathodes. Electrochem. Commun. 2010, 12, 122–124. [Google Scholar] [CrossRef]
- Niroumand, A.M.; Merida, W.; Saif, M. PEM fuel cell low flow FDI. J. Proc. Control 2011, 21, 602–612. [Google Scholar] [CrossRef]
- Gruebl, D.; Janek, J.; Bessler, W.G. Electrochemical Pressure Impedance Spectroscopy (EPIS) as Diagnostic Method for Electrochemical Cells with Gaseous Reactants: A Model-Based Analysis. J. Electrochem. Soc. 2016, 163, A599–A610. [Google Scholar] [CrossRef]
- Hartman, P.; Sommer, H.; Gruebl, D.; Janek, J.; Bessler, W.; Adelhem, P. Pressure dynamics in metal oxygen batteries. J. Phys. Chem. C 2014, 118, 1461–1471. [Google Scholar]
- Engebretsen, E.; Mason, T.J.; Shearing, P.R.; Hinds, G.; Brett, D.J. Electrochemical pressure impedance spectroscopy applied to the study of polymer electrolyte fuel cells. Electrochem. Commun. 2017, 75, 60–63. [Google Scholar] [CrossRef]
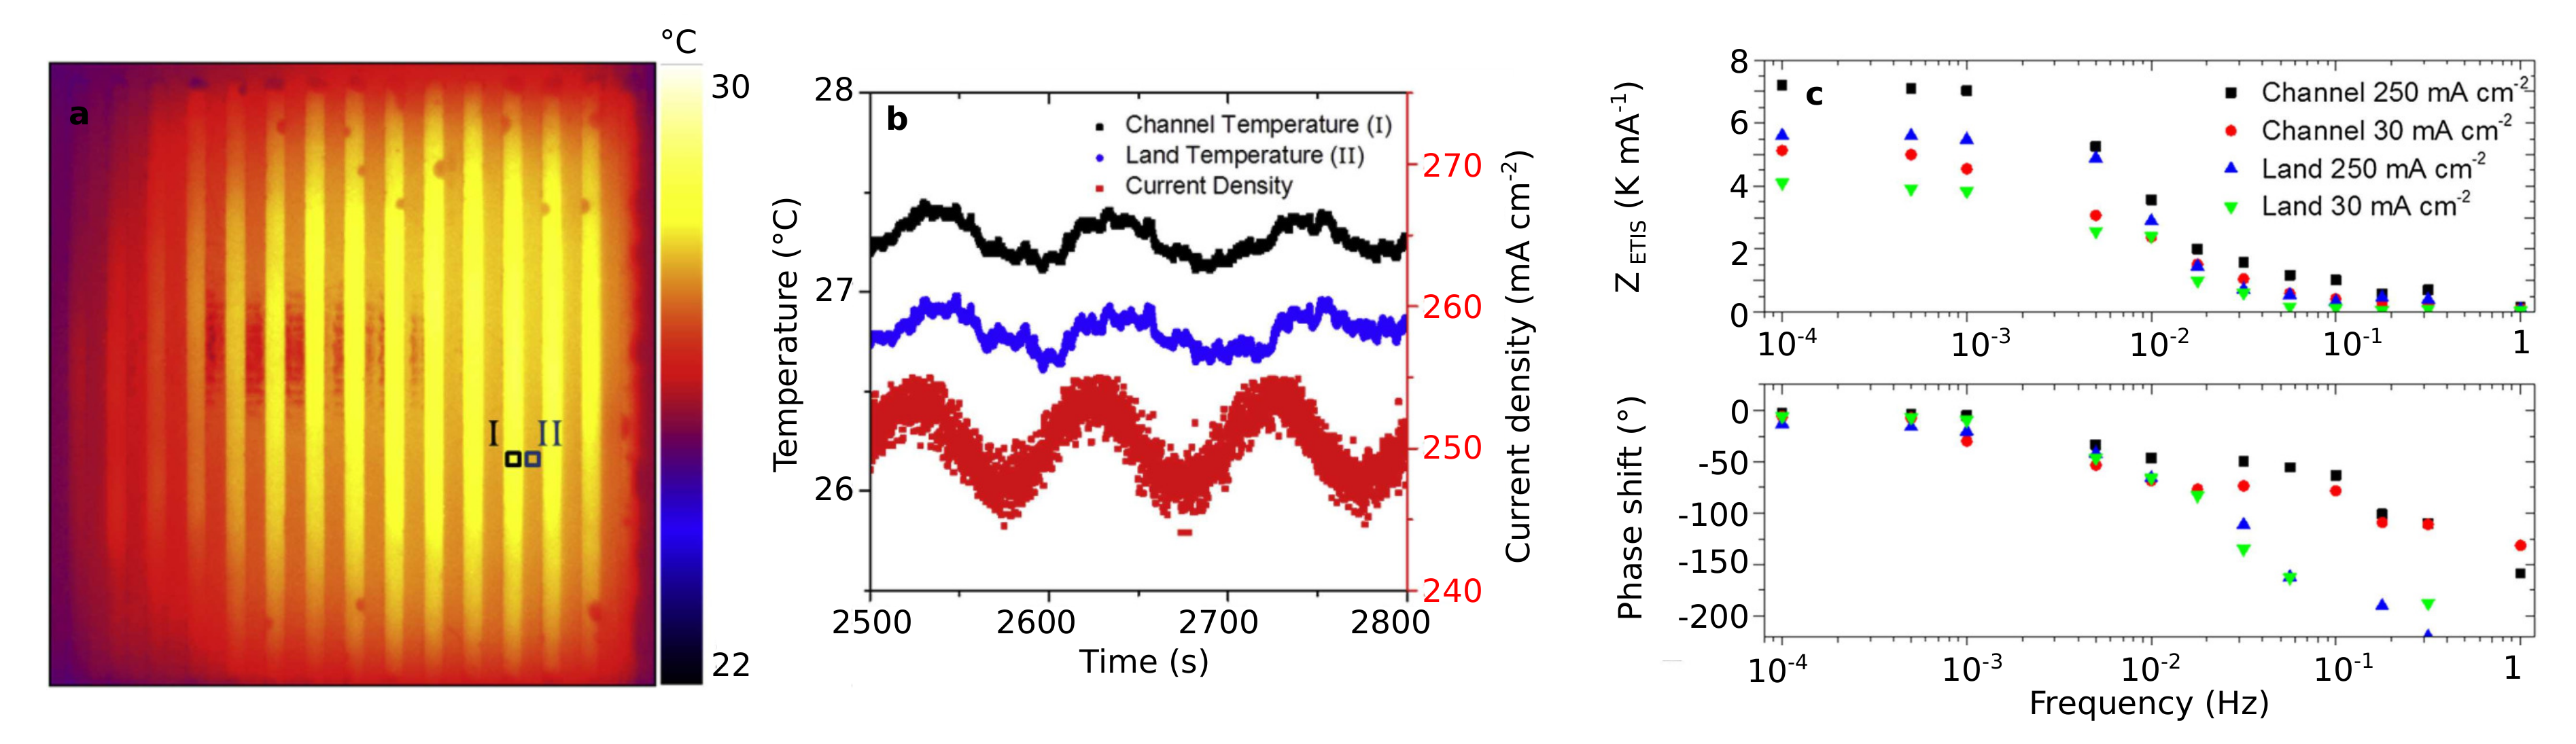
- Engebretsen, E.; Robinson, J.B.; Obeisun, O.; Mason, T.; Finegan, D.; Hinds, G.; Shearing, P.R.; Brett, D.J. Electrothermal impedance spectroscopy applied to an open-cathode polymer electrolyte fuel cell. J. Power Sources 2016, 302, 210–214. [Google Scholar] [CrossRef]
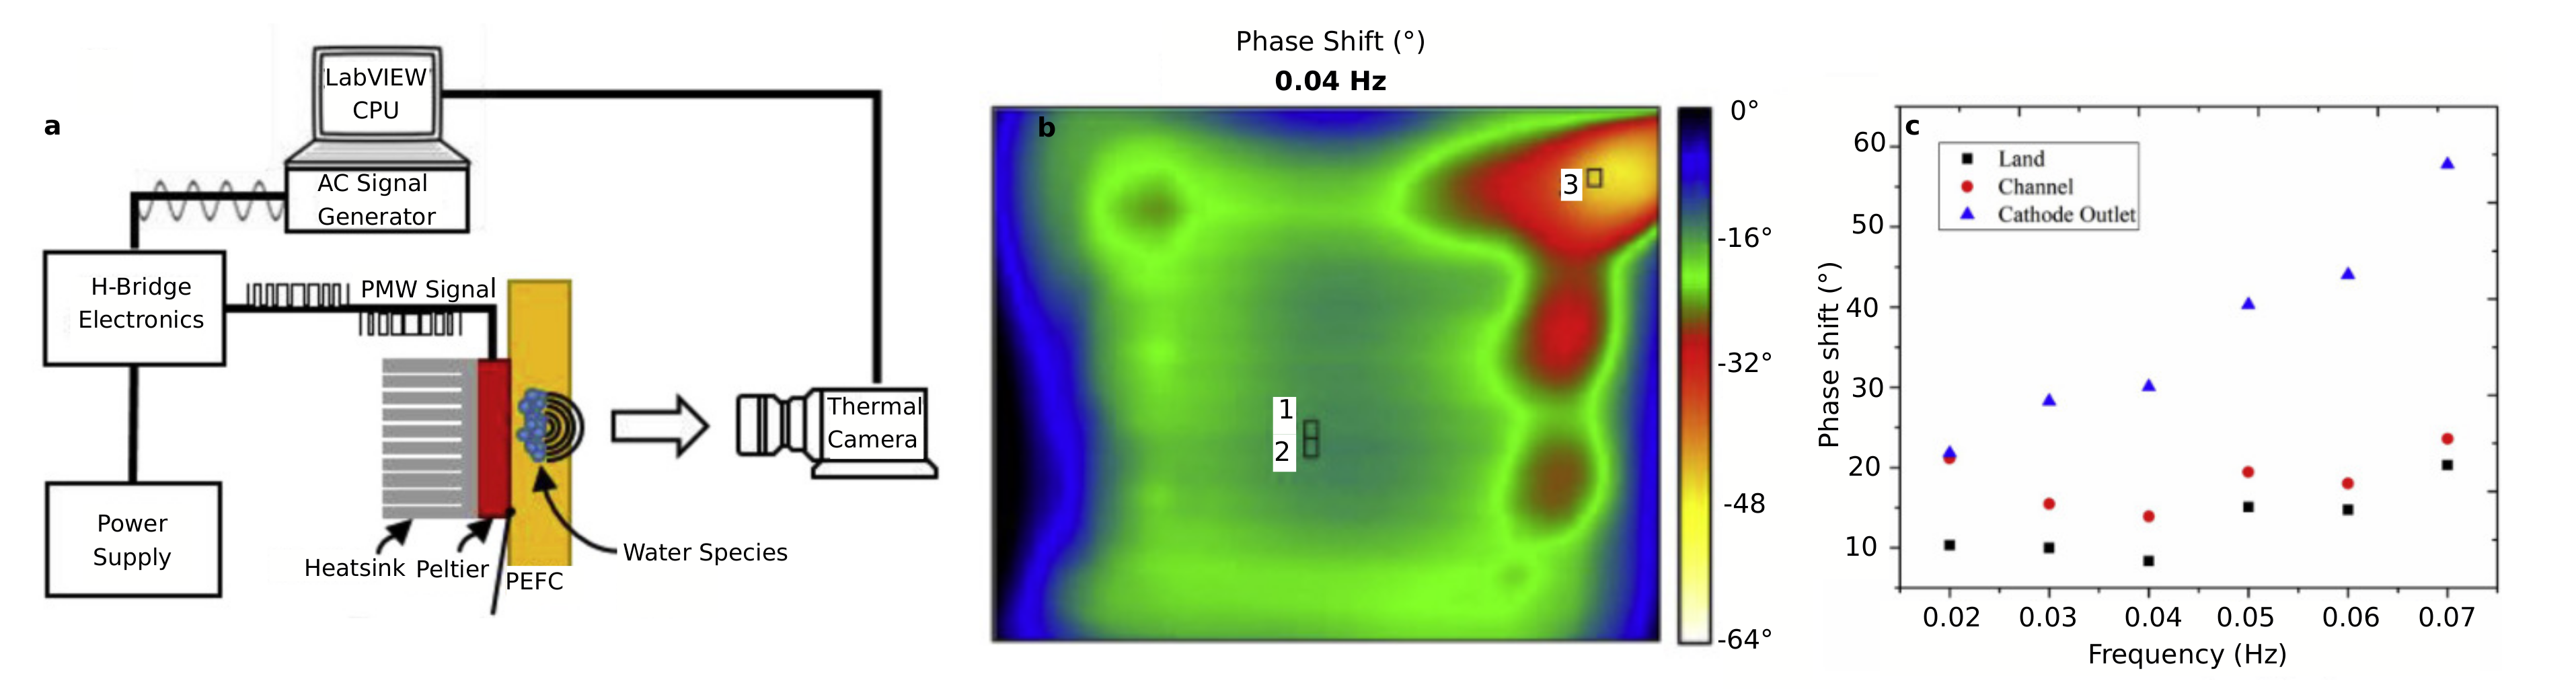
- Rasha, L.; Cho, J.; Neville, T.; Corredera, A.; Shearing, P.; Brett, D. Water distribution mapping in polymer electrolyte fuel cells using lockin thermography. J. Power Sources 2019, 440, 227160. [Google Scholar] [CrossRef]
- Wu, Y.; Meyer, Q.; Liu, F.; Rasha, L.; Cho, J.; Neville, T.; Millichamp, J.; Ziesche, R.; Kardjilov, N.; Boillat, P.; et al. Investigation of water generation and accumulation in polymer electrolyte fuel cells using hydroelectrochemical impedance imaging. J. Power Sources 2019, 414, 272–277. [Google Scholar] [CrossRef]
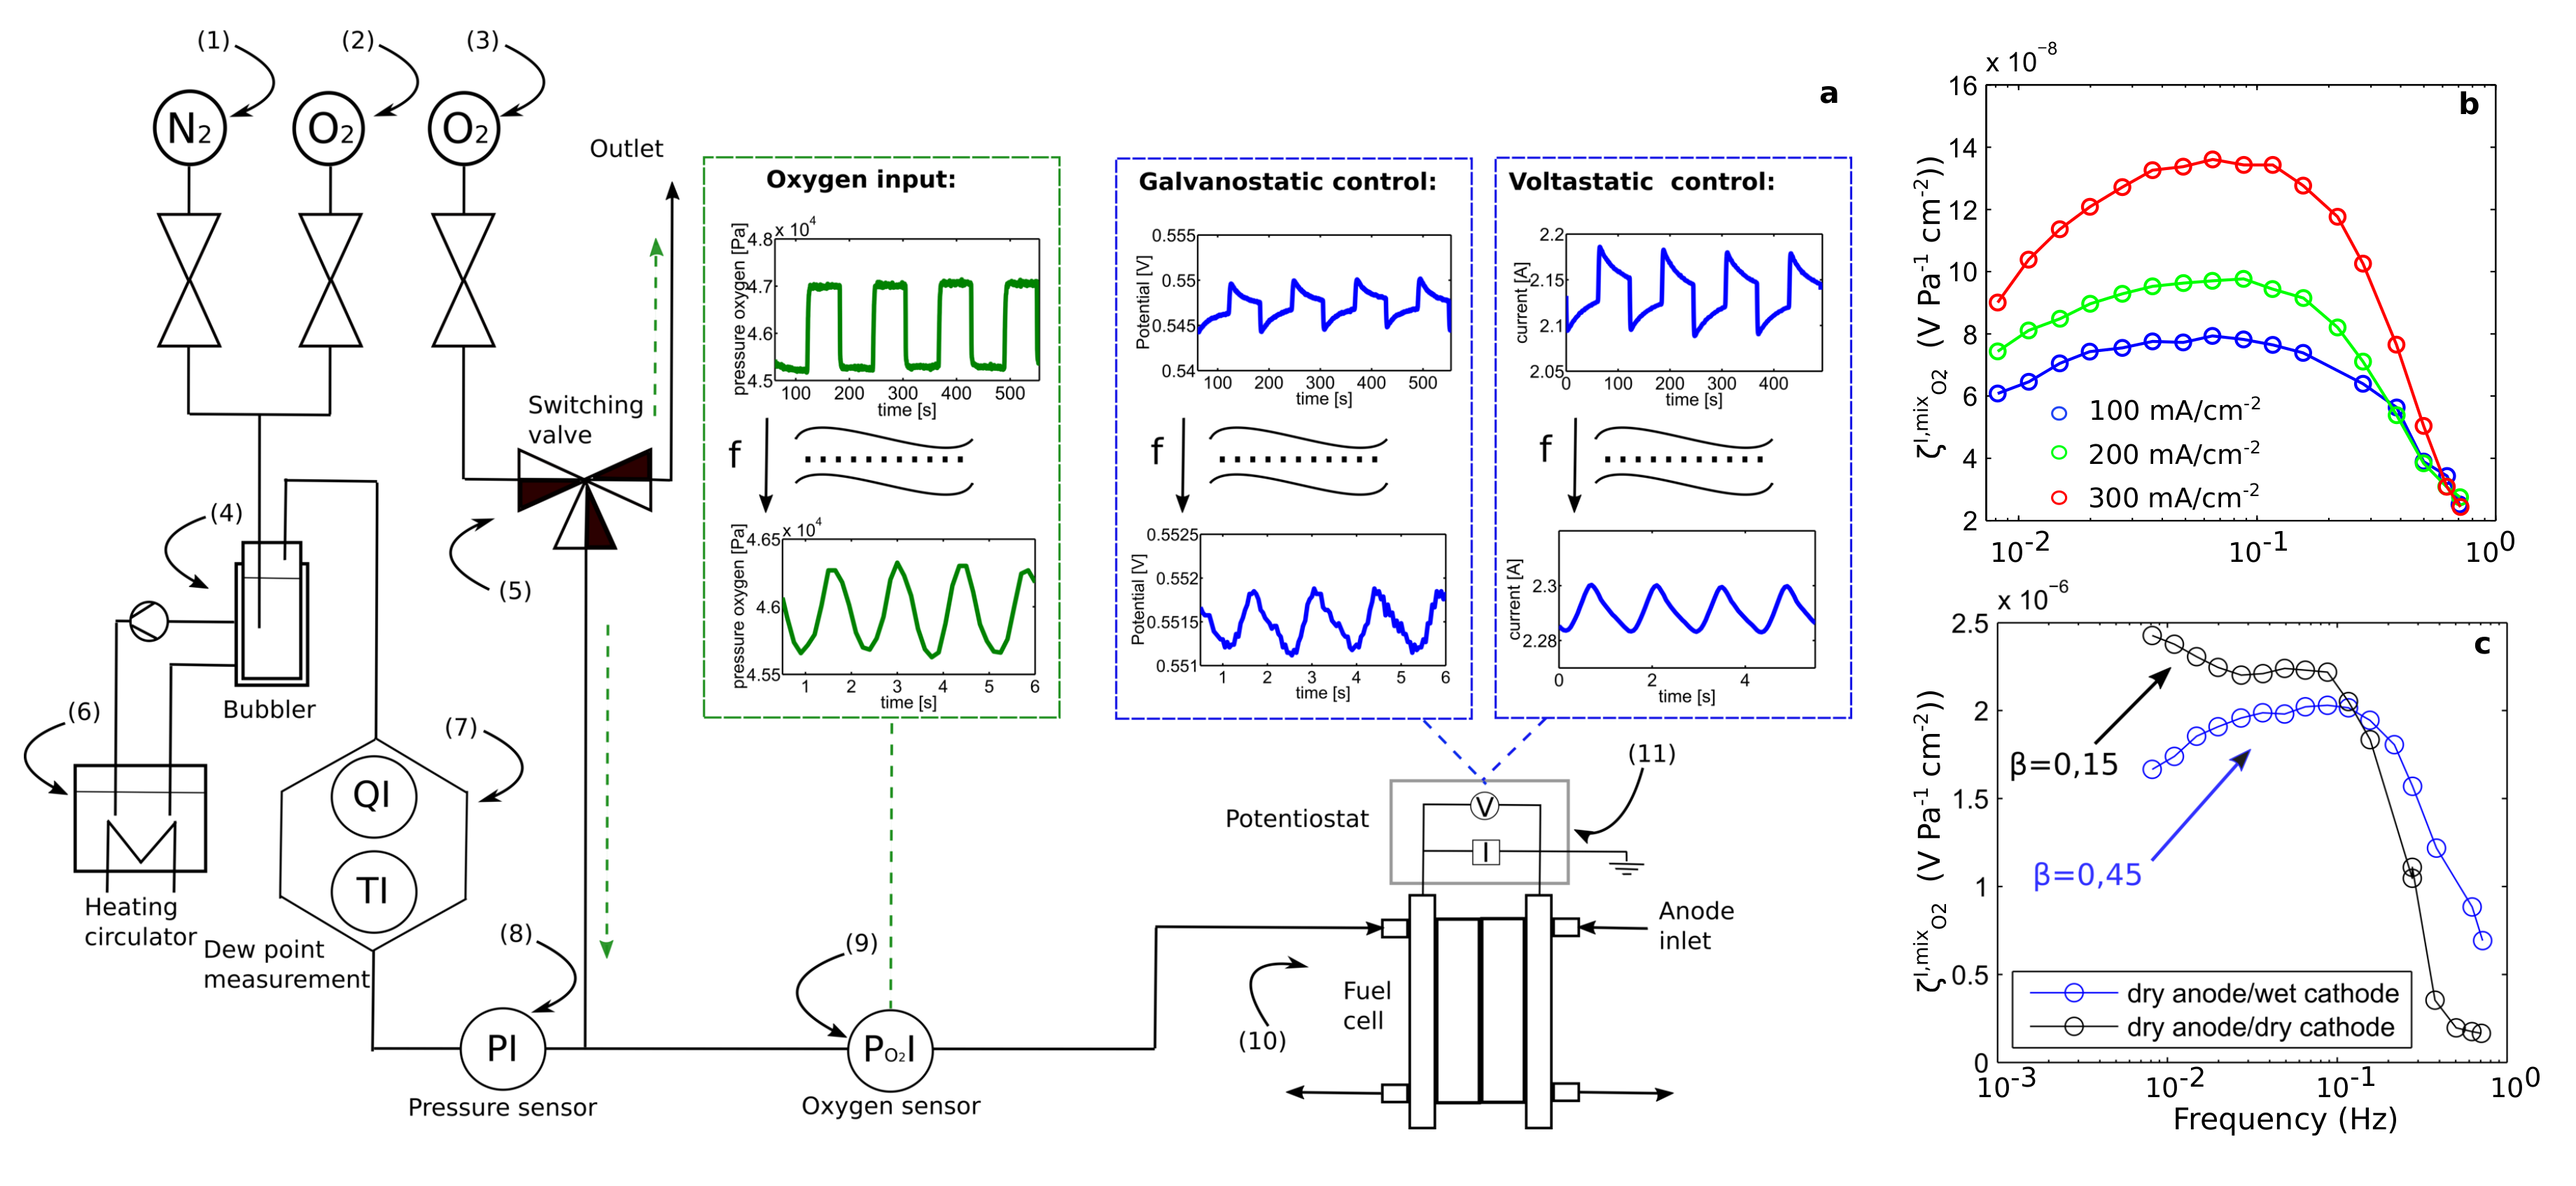
- Sorrentino, A.; Vidakovic-Koch, T.; Hanke-Rauschenbach, R.; Sundmacher, K. Concentration-alternating frequency response: A new method for studying polymer electrolyte membrane fuel cell dynamics. Electrochim. Acta 2017, 243, 53–64. [Google Scholar] [CrossRef] [Green Version]
- Sorrentino, A.; Vidakovic-Koch, T.; Sundmacher, K. Studying mass transport dynamics in polymer electrolyte membrane fuel cells using concentration-alternating frequency response analysis. J. Power Sources 2019, 412, 331–335. [Google Scholar] [CrossRef]
- Shirsath, A.; Raael, S.; Bonnet, C.; Schiffer, L.; Bessler, W.; Lapicque, F. Electrochemical pressure impedance spectroscopy for investigation of mass transfer in polymer electrolyte membrane fuel cells. Curr. Opin. Electrochem. 2020, 20, 82–87. [Google Scholar] [CrossRef]
- Li, H.; Tang, Y.; Wang, Z.; Shi, Z.; Wu, S.; Song, D.; Zhang, J.; Fatih, K.; Zhang, J.; Wang, H.; et al. A review of water flooding issues in the proton exchange membrane fuel cell. J. Power Sources 2008, 178, 103–117. [Google Scholar] [CrossRef]
- Ge, S.; Wang, C.Y. Liquid Water Formation and Transport in the PEFC Anode. J. Electrochem. Soc. 2007, 154, B998. [Google Scholar] [CrossRef]
- Holmström, N.; Ihonen, J.; Lundblad, A.; Lindbergh, G. The Influence of the Gas Diffusion Layer on Water Management in Polymer Electrolyte Fuel Cells. Fuel Cells 2007, 7, 306–313. [Google Scholar] [CrossRef]
- Baumgartner, W.; Parz, P.; Fraser, S.; Wallnoefer, E.; Hacker, V. Polarization study of a PEMFC with four reference electrodes at hydrogen starvation conditions. J. Power Sources 2008, 182, 413–421. [Google Scholar] [CrossRef]
- Borup, R.; Meyers, J.; Pivovar, B. Scientific Aspects of Polymer Electrolyte Fuel Cell Durability and Degradation. Chem. Rev. 2007, 107, 2904–3952. [Google Scholar] [CrossRef]
- Schulze, M.; Wagner, N.; Kaz, T.; Friedrich, K. Combined electrochemical and surface analysis investigation of degradation processes in polymer electrolyte membrane fuel cells. Electrochim. Acta 2007, 52, 2328–2336. [Google Scholar] [CrossRef]
- Taniguchi, A.; Akita, T.; Yasuda, K.; Miyazaki, Y. Analysis of degradation in PEMFC caused by cell reversal during air starvation. Int. J. Hydrogen Energy 2008, 33, 2323–2329. [Google Scholar] [CrossRef]
- Liu, Z.; Yang, L.; Mao, Z.; Zhuge, W.; Zhang, Y.; Wang, L. Behavior of PEMFC in starvation. J. Power Sources 2006, 157, 166–176. [Google Scholar] [CrossRef]
- Garland, N.L.; Benjamin, T.G.; Kopasz, J.P. Materials issues in polymer electrolyte membrane fuel cells. Mater. Matt. 2008, 3.4, 85. [Google Scholar]
- Patterson, T.W.; Darling, R.M. Damage to the Cathode Catalyst of a PEM Fuel Cell Caused by Localized Fuel Starvation. Electrochem. Solid-State Lett. 2006, 9, A183. [Google Scholar] [CrossRef]
- Darling, R.M.; Meyers, J.P. Kinetic Model of Platinum Dissolution in PEMFCs. J. Electrochem. Soc. 2003, 150, A1523. [Google Scholar] [CrossRef]
- Darling, R.M.; Meyers, J.P. Mathematical Model of Platinum Movement in PEM Fuel Cells. J. Electrochem. Soc. 2005, 152, A242. [Google Scholar] [CrossRef]
- Mayrhofer, K.J.; Meier, J.C.; Ashton, S.J.; Wiberg, G.K.; Kraus, F.; Hanzlik, M.; Arenz, M. Fuel cell catalyst degradation on the nanoscale. Electrochem. Commun. 2008, 10, 1144–1147. [Google Scholar] [CrossRef]
- Stevens, D.A.; Hicks, M.T.; Haugen, G.M.; Dahn, J.R. Ex Situ and In Situ Stability Studies of PEMFC Catalysts. J. Electrochem. Soc. 2005, 152, A2309. [Google Scholar] [CrossRef]
- Roen, L.M.; Paik, C.H.; Jarvi, T.D. Electrocatalytic Corrosion of Carbon Support in PEMFC Cathodes. Electrochem. Solid-State Lett. 2004, 7, A19. [Google Scholar] [CrossRef]
- Reiser, C.A.; Bregoli, L.; Patterson, T.W.; Yi, J.S.; Yang, J.D.; Perry, M.L.; Jarvi, T.D. A Reverse-Current Decay Mechanism for Fuel Cells. Electrochem. Solid-State Lett. 2005, 8, A273. [Google Scholar] [CrossRef]
- Andreaus, B.; McEvoy, A.J.; Scherer, G.G. Analysis of performance losses in polymer electrolyte fuel cells at high curren density by impedance spectroscopy. Electrochim. Acta 2002, 47, 2223–2229. [Google Scholar]
- Kinumoto, T.; Inaba, M.; Nakayama, Y.; Ogata, K.; Umebayashi, R.; Tasaka, A.; Iriyama, Y.; Abe, T.; Ogumi, Z. Durability of perfluorinated ionomer membrane against hydrogen peroxide. J. Power Sources 2006, 158, 1222–1228. [Google Scholar] [CrossRef]
- Laconti, A.; Liu, H.; Mittelsteadt, C.; McDonald, R. Polymer Electrolyte Membrane Degradation Mechanisms in Fuel Cells—Findings Over the Past 30 Years and Comparison with Electrolyzers. ECS Trans. 2019, 1, 199–219. [Google Scholar] [CrossRef]
- Natarajan, D.; Van Nguyen, T. Current distribution in PEM fuel cells. Part 1: Oxygen and fuel flow rate effects. AIChE J. 2005, 51, 2587–2598. [Google Scholar] [CrossRef]
- Perry, M.L.; Patterson, T.; Reiser, C. Systems Strategies to Mitigate Carbon Corrosion in Fuel Cells. ECS Trans. 2019, 3, 783–795. [Google Scholar] [CrossRef] [Green Version]
- Sung, L.Y.; Hwang, B.J.; Hsueh, K.L.; Tsau, F.H. Effects of anode air bleeding on the performance of CO poisoned proton exchange membrane fuel cells. J. Power Sources 2010, 195, 1630–1639. [Google Scholar] [CrossRef]
- Li, H.; Song, C.; Zhang, J.; Zhang, J. Catalyst Contamination in PEM Fuel Cells. In PEM Fuel Cell Electrocatalysts and Catalyst Layers: Fundamentals and Applications; Zhang, J., Ed.; Springer: London, UK, 2008; pp. 331–354. [Google Scholar] [CrossRef]
- Halseid, R.; Vie, P.J.; Tunold, R. Effect of ammonia on the performance of polymer electrolyte membrane fuel cells. J. Power Sources 2006, 154, 343–350. [Google Scholar] [CrossRef]
- Gabrielli, C.; Tribollet, B. A transfer function approach for a generalized electrochemical impedance spectroscopy. J. Electrochem. Soc. 1994, 141, 1147–1157. [Google Scholar]
- Macdonald, D.D.; Sikora, E.; Engelhardt, G. Characterizing electrochemical systems in the frequency domain. Electrochim. Acta 1998, 43, 87–107. [Google Scholar]
- Collet-Lacoste, J.R. The electrochemical impedance spectroscopy and associated transfer functions: Non-equilibrium thermodynamics consideration. Electrochim. Acta 2004, 49, 4967–4977. [Google Scholar]
- Gajic, Z. Linear Dynamic Systems and Signals; Prentice Hall: Upper Saddle River, NJ, USA, 1980. [Google Scholar]
- Kumar, K.S.S. Electric Circuits and Networks; Pearson Education: London, UK, 2008. [Google Scholar]
- Athans, M.; Kapasouris, P.; Kappos, E.; Spang, H.A. Linear-quadratic Gaussian with loop-transfer recovering methodology for the F-100 engine. J. Guid. Control Dyn. 1986, 9, 45–52. [Google Scholar]
- Baricci, A.; Mereu, R.; Messaggi, M.; Zago, M.; Inzoli, F.; Casalegno, A. Application of computational fluid dynamics to the analysis of geometrical features in PEM fuel cells flow fields with the aid of impedance spectroscopy. Appl. Energy 2017, 205, 670–682. [Google Scholar] [CrossRef]
- Yan, X.; Guan, C.; Zhang, Y.; Jiang, K.; Wei, G.; Cheng, X.; Shen, S.; Zhang, J. Flow field design with 3D geometry for proton exchange membrane fuel cells. Appl. Therm. Eng. 2019, 147, 1107–1114. [Google Scholar] [CrossRef]
- Bultel, Y.; Wiezell, K.; Jaouen, F.; Ozil, P.; Lindbergh, G. Investigation of mass transport in gas diffusion layer at the air cathode of a PEMFC. Electrochim. Acta 2005, 51, 474–488. [Google Scholar] [CrossRef]
- Atkinson, R.W.; Rodgers, J.A.; Hazard, M.W.; Stroman, R.O.; Gould, B.D. Influence of Cathode Gas Diffusion Media Porosity on Open-Cathode Fuel Cells. J. Electrochem. Soc. 2018, 165, F1002–F1011. [Google Scholar] [CrossRef]
- Ihonen, J.; Mikkola, M.; Lindbergh, G. Flooding of Gas Diffusion Backing in PEFCs. J. Electrochem. Soc. 2004, 151, A1152. [Google Scholar] [CrossRef] [Green Version]
- Liu, Y.; Ji, C.; Gu, W.; Baker, D.R.; Jorne, J.; Gasteiger, H.A. Proton Conduction in PEM Fuel Cell Cathodes: Effects of Electrode Thickness and Ionomer Equivalent Weight. J. Electrochem. Soc. 2010, 157, B1154. [Google Scholar] [CrossRef]
- Lai, Y.C.; Huang, K.L.; Tsai, C.H.; Lee, W.J.; Chen, Y.L. Sputtered Pt loadings of membrane electrode assemblies in proton exchange membrane fuel cells. Int. J. Energy Res. 2012, 36, 918–927. [Google Scholar] [CrossRef]
- Moghaddam, R.B.; Easton, E.B. Impedance spectroscopy assessment of catalyst coated Nafion assemblies for proton exchange membrane fuel cells. Electrochim. Acta 2018, 292, 292–298. [Google Scholar] [CrossRef]
- Haque, M.A.; Sulong, A.B.; Rosli, R.E.; Majlan, E.H.; Shyuan, L.K.; Mashud, M.A.A. Measurement of hydrogen ion conductivity through proton exchange membrane. In Proceedings of the 2015 IEEE International WIE Conference on Electrical and Computer Engineering (WIECON-ECE), Dhaka, Bangladesh, 19–20 December 2015; pp. 552–555. [Google Scholar]
- Abdel-Hady, E.; Abdel-Hamed, M.; Awad, S.; Hmamm, M. Characterization and evaluation of commercial poly (vinylidene fluoride)-g-sulfonatedPolystyrene as proton exchange membrane. Polym. Adv. Technol. 2018, 29, 130–142. [Google Scholar] [CrossRef]
- Petrone, R.; Zheng, Z.; Hissel, D.; Péra, M.; Pianese, C.; Sorrentino, M.; Becherif, M.; Yousfi-Steiner, N. A review on model-based diagnosis methodologies for PEMFCs. Int. J. Hydrogen Energy 2013, 38, 7077–7091. [Google Scholar] [CrossRef]
- Ciucci, F. Modeling electrochemical impedance spectroscopy. Curr. Opin. Electrochem. 2019, 13, 132–139. [Google Scholar] [CrossRef]
- Weber, A.Z.; Borup, R.L.; Darling, R.M.; Das, P.K.; Dursch, T.J.; Gu, W.; Harvey, D.; Kusoglu, A.; Litster, S.; Mench, M.M.; et al. A Critical Review of Modeling Transport Phenomena in Polymer-Electrolyte Fuel Cells. J. Electrochem. Soc. 2014, 161, F1254–F1299. [Google Scholar] [CrossRef] [Green Version]
- Chevalier, S.; Auvity, B.; Olivier, J.C.; Josset, C.; Trichet, D.; Machmoum, M. Detection of Cells State-of-Health in PEM Fuel Cell Stack Using EIS Measurements Coupled with Multiphysics Modeling. Fuel Cells 2014, 14, 416–429. [Google Scholar] [CrossRef]
- Goshtasbi, A.; Pence, B.L.; Chen, J.; DeBolt, M.A.; Wang, C.; Waldecker, J.R.; Hirano, S.; Ersal, T. A Mathematical Model toward Real-Time Monitoring of Automotive PEM Fuel Cells. J. Electrochem. Soc. 2020, 167, 024518. [Google Scholar] [CrossRef]
- Springer, T.E. Characterization of Polymer Electrolyte Fuel Cells Using AC Impedance Spectroscopy. J. Electrochem. Soc. 1996, 143, 587. [Google Scholar] [CrossRef]
- Pivac, I.; Bezmalinovic, D.; Barbir, F. Catalyst degradation diagnostics of proton exchange membrane fuelcells using electrochemical impedance spectroscopy. Int. J. Hydrogen Energy 2018, 43, 13512–13520. [Google Scholar] [CrossRef]
- Paganin, V.A.; Oliveira, C.L.F.; Ticianelli, E.A.; Springer, T.E.; Gonzalez, E.R. Modelistic interpretation of the impedance response of a polymer electrolyte fuel cell. Electrochim. Acta 1998, 43, 3761–3766. [Google Scholar]
- Ciurenau, M.; Roberge, R. Parameter identifiability analysis and visualization in large-scale kinetic models of biosystems. J. Phys. Chem. B 2001, 105, 3531–3539. [Google Scholar]
- Holmstroem, N.; Wiezell, K.; Lindbergh, G. Studying Low Humidity Effects in PEMFCS using EIS Experiments. J. Electrochem. Soc. 2012, 159, F369–F378. [Google Scholar] [CrossRef]
- Parthasarathy, A. The Platinum Microelectrode/Nafion Interface: An Electrochemical Impedance Spectroscopic Analysis of Oxygen Reduction Kinetics and Nafion Characteristics. J. Electrochem. Soc. 1992, 139, 1634. [Google Scholar] [CrossRef]
- Kurzweil, P.; Fischle, H.J. A new monitoring method for electrochemical aggregates by impedance spectroscopy. J. Power Sources 2004, 127, 331–340. [Google Scholar] [CrossRef]
- Mathias, M.F.; Grot, S.A. System and Method for Controlling Humidity Level of a Fuel Cell. U.S. Patent 6,376,111, 23 April 1990. [Google Scholar]
- Yumiya, H.; Kizaki, M.; Asai, H. Toyota Fuel Cell System (TFCS). World Electr. Veh. J. 2015, 7, 85–92. [Google Scholar] [CrossRef] [Green Version]
- Nitta, I.; Himanen, O.; Mikkola, M. Contact resistance between gas diffusion layer and catalyst layer of PEM fuel cell. Electrochem. Commun. 2008, 10, 47–51. [Google Scholar] [CrossRef]
- Uribe, F.A.; Gottesfeld, S.; Zawodzinski, T.A. Effect of Ammonia as Potential Fuel Impurity on Proton Exchange Membrane Fuel Cell Performance. J. Electrochem. Soc. 2002, 149, A293. [Google Scholar] [CrossRef]
- Asghari, S.; Mokmeli, A.; Samavati, M. Study of PEM fuel cell performance by electrochemical impedance spectroscopy. Int. J. Hydrogen Energy 2010, 35, 9283–9290. [Google Scholar] [CrossRef]
- Eikerling, M.; Kornyshev, A. Electrochemical impedance of the cathode catalyst layer in polymer electrolyte fuel cells. J. Electroanal. Chem. 1999, 475, 107–123. [Google Scholar] [CrossRef]
- Lefebvre, M.C. Characterization of Ionic Conductivity Profiles within Proton Exchange Membrane Fuel Cell Gas Diffusion Electrodes by Impedance Spectroscopy. Electrochem. Solid-State Lett. 1999, 2, 259. [Google Scholar] [CrossRef]
- Makharia, R.; Mathias, M.F.; Baker, D.R. Measurement of Catalyst Layer Electrolyte Resistance in PEFCs Using Electrochemical Impedance Spectroscopy. J. Electrochem. Soc. 2005, 152, A970. [Google Scholar] [CrossRef]
- Cimenti, M.; Bessarabov, D.; Tam, M.; Stumper, J. Investigation of Proton Transport in the Catalyst Layer of PEM Fuel Cells by Electrochemical Impedance Spectroscopy. ECS Trans. 2019, 28, 147–157. [Google Scholar] [CrossRef]
- Kuhn, H.; Wokaun, A.; Scherer, G. Exploring single electrode reactions in polymer electrolyte fuel cells. Electrochim. Acta 2007, 52, 2322–2327. [Google Scholar] [CrossRef]
- Wiezell, K.; Gode, P.; Lindbergh, G. Steady-State and EIS Investigations of Hydrogen Electrodes and Membranes in Polymer Electrolyte Fuel Cells. J. Electrochem. Soc. 2006, 153, A749. [Google Scholar] [CrossRef]
- Fouquet, N.; Doulet, C.; Nouillant, C.; Dauphin-Tanguy, G.; Ould-Bouamama, B. Model based PEM fuel cell state-of-health monitoring via ac impedance measurements. J. Power Sources 2006, 159, 905–913. [Google Scholar] [CrossRef]
- Canut, J.M.L.; Abouatallah, R.M.; Harrington, D.A. Detection of Membrane Drying, Fuel Cell Flooding, and Anode Catalyst Poisoning on PEMFC Stacks by Electrochemical Impedance Spectroscopy. J. Electrochem. Soc. 2006, 153, A857. [Google Scholar] [CrossRef]
- Schneider, I.A.; Kramer, D.; Wokaun, A.; Scherer, G.G. Oscillations in the Gas Channels—The Forgotten Player in Impedance Spectroscopy in Polymer Electrolyte Fuel Cells A. Exploring the Wave. ECS Trans. 2006, 3, 1001–1010. [Google Scholar] [CrossRef]
- Schneider, I.A.; Freunberger, S.A.; Kramer, D.; Wokaun, A.; Scherer, G.G. Oscillations in Gas Channels. J. Electrochem. Soc. 2007, 154, B383. [Google Scholar] [CrossRef]
- Schneider, I.A.; Kramer, D.; Wokaun, A.; Scherer, G.G. Oscillations in Gas Channels. J. Electrochem. Soc. 2007, 154, B770. [Google Scholar] [CrossRef]
- Kulikovsky, A. The effect of stoichiometric ratio on the performance of a polymer electrolyte fuel cell. Electrochim. Acta 2004, 49, 617–625. [Google Scholar] [CrossRef]
- Kulikovsky, A.; Shamardina, O. A Model for PEM Fuel Cell Impedance: Oxygen Flow in the Channel Triggers Spatial and Frequency Oscillations of the Local Impedance. J. Electrochem. Soc. 2015, 162, F1068–F1077. [Google Scholar] [CrossRef] [Green Version]
- Chandesris, M.; Robin, C.; Gerard, M.; Bultel, Y. Investigation of the difference between the low frequency limit of the impedance spectrum and the slope of the polarization curve. Electrochim. Acta 2015, 180, 581–590. [Google Scholar] [CrossRef]
- Keller, S.; Oezel, T.; Scherzer, A.C.; Gerteisen, D.; Gross, U.; Hebling, C.; Manoli, Y. Characteristic Time Constants Derived from Low Frequency Arc of Impedance of Fuel Cell Stack. J. Electrochem. Energy Convers. Storage 2018, 15, 1–10. [Google Scholar]
- Chevalier, S.; Josset, C.; Bazylak, A.; Auvity, B. Measurements of Air Velocities in Polymer Electrolyte Membrane Fuel Cell Channels Using Electrochemical Impedance Spectroscopy. J. Electrochem. Soc. 2016, 163, F816–F823. [Google Scholar] [CrossRef]
- Freire, T.J.P.; Gonzalez, E.R. Effect of membrane characteristics and humidification conditions on the impedance response of polymer electrolyte fuel cells. J. Electroanal. Chem. 2001, 503, 57–68. [Google Scholar]
- Wiezell, K.; Holmstroem, N.; Lindbergh, G. Studying Low Humidity Effects in PEMFCs using EIS Modeling. J. Electrochem. Soc. 2012, 159, F379–F392. [Google Scholar] [CrossRef]
- Antoine, O.; Bultel, Y.; Durand, R. Oxygen reduction reaction kinetics and mechanism on platinum nanoparticles inside Nafion. J. Electroanal. Chem. 2001, 499, 85–94. [Google Scholar]
- Roy, S.K.; Orazem, M.E.; Tribollet, B. Interpretation of Low-Frequency Inductive Loops in PEM Fuel Cells. J. Electrochem. Soc. 2007, 154, B1378. [Google Scholar] [CrossRef]
- Cruz-Manzo, S.; Cruz, C.P.; Greenwood, P.; Chen, R. An impedance model for analysis of EIS of polymer electrolyte fuel cells under platinum oxidation and hydrogen peroxide formation in the cathode. J. Electroanal. Chem. 2016, 771, 94–105. [Google Scholar] [CrossRef] [Green Version]
- Franco, A.A.; Tembely, M. Transient Multiscale Modeling of Aging Mechanisms in a PEMFC Cathode. J. Electrochem. Soc. 2007, 154, B712. [Google Scholar] [CrossRef]
- Inaba, M.; Yamada, H.; Tokunaga, J.; Tasaka, A. Effect of Agglomeration of Pt C Catalyst on Hydrogen Peroxide Formation. Electrochem. Solid-State Lett. 2004, 7, A474. [Google Scholar] [CrossRef]
- Wagner, N.; Schulze, M. Change of electrochemical impedance spectra during CO poisoning of the Pt and Pt Ru anodes in a membrane fuel cell (PEFC). Electrochim. Acta 2003, 48, 3899–3907. [Google Scholar] [CrossRef]
- Schneider, I.A.; Bayer, M.H.; Wokaun, A.; Scherer, G.G. Impedance Response of the Proton Exchange Membrane in Polymer Electrolyte Fuel Cells. J. Electrochem. Soc. 2008, 155, B783. [Google Scholar] [CrossRef]
- Bao, C.; Bessler, W.G. Two dimensional modeling of a polymer electrolyte membrane fuel cell with long flow channel. Part 2 Physics based electrochemical impedance analysis. J. Power Sources 2015, 278, 675–682. [Google Scholar] [CrossRef] [Green Version]
- Setzler, B.P.; Fuller, T.F. A Physics-Based Impedance Model of Proton Exchange Membrane Fuel Cells Exhibiting Low-Frequency Inductive Loops. J. Electrochem. Soc. 2015, 162, F519–F530. [Google Scholar] [CrossRef]
- Benito, D.; Gabrielli, C.; Jareno, J.G.; Keddam, M.; Perrot, H.; Vicente, F. An electrochemical impedance and ac electrogravimetry study of PNR films in aqueous salt media. Electrochem. Commun. 2002, 4, 613–619. [Google Scholar] [CrossRef]
- Gabrielli, C.; Jareno, J.G.; Keddam, M.; Perrot, H.; Vicente, F. Ac electrogravimetry study to electroactive thin films. J. Phys. Chem. B 2002, 106, 3182–3191. [Google Scholar]
- Deslouis, C.; Tribollet, B. Recent developments in the electro-hydrodynamic (EHD) impedance technique. J. Electroanal. Chem. 2004, 572, 389–398. [Google Scholar] [CrossRef]
- Sorrentino, A.; Sundmacher, K.; Vidakovic-Koch, T. Guide to Concentration Alternating Frequency Response Analysis of Fuel Cells. J. Visual. Exp. 2019, 154, e60129. [Google Scholar]
- Kulikovsky, A. A model for concentration impedance of a PEM fuel cell. eTransportation 2019, 2, 100026. [Google Scholar] [CrossRef]
- Olivier, A.; Merienne, E.; Chopart, J.P.; Aaboubi, O. Thermoelectrochemical impedances 1. A new experimental device to measure thermoelectrochemical transfer functions. Electrochim. Acta 1992, 37, 1945–1950. [Google Scholar]


| EIS Nyquist Plot Patterns | Associated Processes |
|---|---|
 | High frequency capacitive loop |
| |
 | Distortion of the high frequency loop |
| |
 | Low frequency capacitive loop |
| |
 | Low frequency inductive loop |
|
| Input | I | V | |||||||
|---|---|---|---|---|---|---|---|---|---|
| Output | |||||||||
| X | EIS | EPIS | cFRA(O2) | cFRA(H2O) | |||||
| EIS | X | EPIS | cFRA(O2) | cFRA(H2O) | |||||
| EPIS | EPIS | X | |||||||
| X | |||||||||
| X | |||||||||
| X | |||||||||
| ETIS | LIT | X | |||||||
| HECII | X | ||||||||
FRA Technique | Transfer Function | Processes Isolated |
|---|---|---|
EPIS | Mass transport gaseous reactants and liquid water in the channel, GDL and catalyst layer. | |
cFRA | Mass transport of oxygen in the channel. | |
Gas transport of oxygen in the channel.- Water sorption in the Nafion membrane. | ||
| Water mass transport in the channel. - Water sorption in Nafion | ||
| cFRA (mixed) | Mass transport gaseous reactants in the channel. Water sorption into the Nafion membrane. | |
ETIS | Heat transport along the flow fields.-Water generation. | |
LIT | Water accumulation along the flow fields and GDL. | |
HECII | Water generation. |
Publisher’s Note: MDPI stays neutral with regard to jurisdictional claims in published maps and institutional affiliations. |
© 2020 by the authors. Licensee MDPI, Basel, Switzerland. This article is an open access article distributed under the terms and conditions of the Creative Commons Attribution (CC BY) license (http://creativecommons.org/licenses/by/4.0/).
Share and Cite
Sorrentino, A.; Sundmacher, K.; Vidakovic-Koch, T. Polymer Electrolyte Fuel Cell Degradation Mechanisms and Their Diagnosis by Frequency Response Analysis Methods: A Review. Energies 2020, 13, 5825. https://doi.org/10.3390/en13215825
Sorrentino A, Sundmacher K, Vidakovic-Koch T. Polymer Electrolyte Fuel Cell Degradation Mechanisms and Their Diagnosis by Frequency Response Analysis Methods: A Review. Energies. 2020; 13(21):5825. https://doi.org/10.3390/en13215825
Chicago/Turabian StyleSorrentino, Antonio, Kai Sundmacher, and Tanja Vidakovic-Koch. 2020. "Polymer Electrolyte Fuel Cell Degradation Mechanisms and Their Diagnosis by Frequency Response Analysis Methods: A Review" Energies 13, no. 21: 5825. https://doi.org/10.3390/en13215825