Article

Impact Analysis of Large-Scale Wind Farms Integration in Weak Transmission Grid from Technical Perspectives

1
US-Pakistan Center for Advanced Studies in Energy (USPCAS-E), National University of Sciences and Technology (NUST), H-12, Islamabad 44000, Pakistan
2
Department of Engineering and Chemical Sciences, Karlstad University, 65188 Karlstad, Sweden
3
School of Chemical and Materials Engineering, National University of Sciences and Technology, Islamabad 44000, Pakistan
4
National Transmission and Dispatch Company (NTDC), Planning Branch, 514 Building, Lahore 54000, Pakistan
5
SungKyunKwan University (SKKU), Natural Science Campus, Suwon 16419, Korea
*
Authors to whom correspondence should be addressed.
Energies 2020, 13(20), 5513; https://doi.org/10.3390/en13205513
Submission received: 3 September 2020 / Revised: 12 October 2020 / Accepted: 13 October 2020 / Published: 21 October 2020
(This article belongs to the Special Issue Smart Grids and Flexible Energy Systems)

Abstract

:
The integration of commercial onshore large-scale wind farms into a national grid comes with several technical issues that predominately ensure power quality in accordance with respective grid codes. The resulting impacts are complemented with the absorption of larger amounts of reactive power by wind generators. In addition, seasonal variations and inter-farm wake effects further deteriorate the overall system performance and restrict the optimal use of available wind resources. This paper presented an assessment framework to address the power quality issues that have arisen after integrating large-scale wind farms into weak transmission grids, especially considering inter-farm wake effect, seasonal variations, reactive power depletion, and compensation with a variety of voltage-ampere reactive (Var) devices. Herein, we also proposed a recovery of significant active power deficits caused by the wake effect via increasing hub height of wind turbines. For large-scale wind energy penetration, a real case study was considered for three wind farms with a cumulative capacity of 154.4 MW integrated at a Nooriabad Grid in Pakistan to analyze their overall impacts. An actual test system was modeled in MATLAB Simulink for a composite analysis. Simulations were performed for various scenarios to consider wind intermittency, seasonal variations across four seasons, and wake effect. The capacitor banks and various flexible alternating current transmission systems (FACTS) devices were employed for a comparative analysis with and without considering the inter-farm wake effect. The power system parameters along with active and reactive power deficits were considered for comprehensive analysis. Unified power flow controller (UPFC) was found to be the best compensation device through comparative analysis, as it maintained voltage at nearly 1.002 pu, suppressed frequency transient in a range of 49.88–50.17 Hz, and avoided any resonance while maintaining power factors in an allowable range. Moreover, it also enhanced the power handling capability of the power system. The 20 m increase in hub height assisted the recovery of the active power deficit to 48%, which thus minimized the influence of the wake effect.

1. Introduction

The world is shifting away from fossil fuels towards renewable energy resources (RERs) due to advantages like availability, abundance in nature, and environment friendliness [1]. In recent years, the wind sector has seen a phenomenal growth due to manufacturing, technological advancements, economic feasibility, and easy accessibility, with which the cumulative installed capacity is expected to be around 1900 MW by the end of 2020 [2]. Onshore wind farms constitute 95% of the overall installations due to technology advancements, large-scale manufacturing, widespread installation, and reasonable maintenance expenses. Wind power expansion is a result of viable RERs that can realize sustainable development and combat the impact of climate change. However, the integration of large scale-wind farms (LSWF) into national transmission grids of various countries are subjected to several issues, as reported in the literature, such as technical, economic, environmental, etc. [2,3]. This paper focuses primarily on the technical issues.
Wind farm (WF) integration has been reviewed from various technical perspectives, i.e., resources integration, intermittency, power quality (PQ) as per grid codes, stability studies, reactive power compensation, wake effect, control, forecasting, etc. LSWF has also been assessed from the viewpoint of policy frameworks, economics, and the environment [4]. In [5], the wind turbine (WT) generator (WTG) integration assessment for various networks was reviewed in terms of type, size configurations, methods, models, and software tools. WTG integration and facilitation, as well as the impacts of wind energy conversion systems (WECS), power electronics (PE), components, and storage types have also been assessed in accordance with grid codes [6]. Moreover, LSWF integration into the transmission grids of association of south east Asian nations (ASEAN) countries [7] have also been reviewed from a policy perspective in terms of grid preparedness and challenges (i.e., grid reliability issues, electricity market accessibility, and forecasting).
Wind speed forecasting techniques and models can be broadly classified amongst physical, statistical, and hybrid methods [8,9]; however, factors and constraints like inter-farm wake effects are usually neglected, which results in deviations from the desired and expected outputs [9]. Other than the wake flow effects, uncoordinated LSWF design with less distance among each wind farm and respective growth can result in huge errors for power output predictions during forecasting [4]. The inter-farm wake effect for LSWF occurs when there is an unsymmetrical distance between WT due to land and cost constraints. Upstream WT produces a wake behind them and thus reduces downstream WT power production capacity, increasing electricity cost [10]. Several works have considered the inter-farm wake effect from the perspective of different models considering spacing across WTs, the deficit in wind speed from upstream WTs, percentage of generation loss, and overall LSWF efficiency [11,12].
Besides the wake effect, seasonal variations such as wind intermittency play a crucial role in fully harnessing RER within the national grid and other forecasting methods. The wind intermittency issue in WTs have been addressed from several dimensions, i.e., incorporation of hybrid wind and RERs (e.g., solar, electrical vehicle) and storage systems of various genre for smooth integration within the electrical grid [3,13]. Various numerical and software tools-based weather prediction models incorporated with wind uncertainty are now used for WT resource assessment [5]. In addition, a discrete Markovian approach in [14] addressed the wind intermittency in the context of grid integration, compared with the deterministic and stochastic approaches, and was evaluated under several scenarios across two test systems. The approach was computationally efficient compared with other approaches. In [15], severe wind speed variations have addressed with active (P) and reactive (Q) power-coordinated controls based on the multi-timescale model predictive control theory that was aimed at restricting voltage levels within limits. The issue of wind intermittency has been reviewed along with other impacts on system reserve, reliability, emission reduction, and operation costs; however, the mitigation solutions have been discussed along with upgraded methods aiming at forecasting, generation, demand, and various genre of storage-based assets [16].
The abovementioned concerns compliment power quality (PQ) issues that produce fluctuating output power in LSWF, which affect voltage stability [17,18], frequency stability [18], harmonics [17], fault ride through (FRT) [19], and the power factor (PF) [20]. RER and Q impact a point of common coupling (PCC) [21]. Power electronic converters (PECs) in wind turbines are responsible for producing harmonics that affect power quality [22,23]. PQ impacts consider wind system integration evaluated through a steady-state time series analysis with historical data and present an impact assessment in terms of cases and scenarios from a wide range of best to worst [8,18,21]. The study conducted in [20] presents a review regarding classification of wind technology classifications from PQ and grid code perspectives. The WTG is based on types such as the squirrel-cage induction generator (SCIG), wound rotor synchronous generator (WRSG), and doubly fed induction generator (DFIG) [2,6,20]. A study in [24] reviewed wind farm challenges and solution technologies predominately from the viewpoint of PQ, PF, insufficient Q, and power balance. Harmonic and Q compensation is shown in [25], whereas power characterization of various wind generator technologies in control scenarios aimed at speed variations and voltage stability is shown in [26]. Further, power profiling at PCC is shown in [27], wherein various scenarios were evaluated.
Apart from the abovementioned issues, integrating the LSWF into transmission grids causes a higher susceptibility to Q compensation issues, which have been evaluated across various scenarios of several applications but predominately in flexible AC transmission devices (FACTS) [15,17,20,23,25,26,27,28,29]. Internationally, on-load tap changers have been used as a first line of defense for the grid’s voltage stability; however, it has limitations regarding response speed [25]. Capacitor banks and reactor banks are conventionally used as reactive power compensators to maintain voltage and PF accordingly, yet they produce strong switching transients and high-frequency harmonics [26]. A static car compensator (SVC) provides real-time Q-control and stabilizes the grid’s voltage and PF, but does not possess any damping mechanisms. Therefore, voltage overshoots can lead to cascaded tripping of WTs [27]. The static synchronous compensator (STATCOM) exhibits a damping mechanism that addresses the concerning issues of SVC, which provides better stability and power quality [28]. The unified power flow controller (UPFC has the capability to control both active and reactive power flows, thus quickly and continuously improving the system’s stability [29]. Moreover, the static synchronous series compensator (SSSC), UPFC, and STATCOM all result in better Q compensations and have a positive impact on voltage profiles and load flows across various evaluation scenarios [19,30,31].
After years of research and development, developing countries have come up with innovative solutions and upgraded respective grid codes and infrastructure to accommodate wind uncertainties [7]. However, developing countries still struggle with weak grid infrastructure, especially from the perspective of LSWF integration. The PQ, Q balance and grid code issues for developing countries need attention on a medium-term basis, while the overall grid modernization should be a long-term solution [7,17]. International practices and case studies have unveiled different approaches to investigate the impacts of wind integration with respective mitigation strategies. A case study on the Greeley Substation in the U.S presented an approach to integrate REG using probabilistic load flows that represent the actual impact on the grid related to PQ, such as voltage imbalance and flickers [9]. The case study on the German distribution grid [20] proposed a concept to integrate DGs for high availability of Q reserve at the transmission-level to avoid the use of Q compensation devices. A study conducted on the Texas power system [12] investigated wind intermittency using Markov’s processes, which improved system stability and ensured better unit commitment. A study of Turkey’s grid [2] investigated the impacts of increasing wind penetration on voltage and frequency profiles, as well as the deployment of STATCOM as a reactive power compensator. A case study of Egypt presented an approach of using STATCOM as voltage support during faults for increasing the low voltage ride-through (LVRT) capability of wind farms, as well as for Q compensation [32]. A study of the Irish grid emphasized the use of time series analysis to find out the worst-case operating point and propose a control strategy as a solution [13]. The work in [33] investigated growing wind penetration in the Southwestern U.S.’s Power Pool’s grid, aiming at stability issues such as the steady-state voltage profiles, ride-through capability with application of fixed capacitors, and SVC as Q compensators.
In the reviewed work, a comprehensive study on LSWF integration in a weak transmission network of a developing country was partially established from the perspective of the inter-farm wake effect, seasonal variations, PQ impact, and VAR/Q compensation issues, which used FACTS devices. The reviewed literature shown in Table A1 in Appendix A is arranged based on works conducted to integrate the onshore wind turbine into the grid from the viewpoint of various applications and issues. Categories A-F represent the arrangement of nomenclature:
Category-A:
WT integration and associated technologies [1,2,3,4,5,6,7,8,13,14,15,16,17,18,19,20,21,22,23,24,25,27,28,29,33].
Category-B:
The inter-farm wake effect [4,8,10,11,12,22,33].
Category-C:
Wind intermittency impact [3,5,13,14,15,16].
Category-D:
The inter-farm wake effect and wind intermittency impact on PQ and grid codes [1,2,6,8,11,15,17,18,19,20,21,23,24,26,27,28,29,30,31,32,33].
Category-E:
Q compensation including FACTS devices [1,2,15,17,19,20,23,25,26,27,29,30,31,32,33].
Category-F:
Case and scenario-based evaluation [2,8,14,17,20,21,27,28,29].
We found that much of the reviewed work fell into Category-A, as it assessed wind technologies from the perspective of feasibility, applications, and enabling technologies. However, LSWF integration was moderately discussed. In Category-B, the inter-farm wake effect and associated impacts in LSWF from the viewpoint of grid integration were not comprehensively addressed. In Category-C, the wind intermittency and seasonal variation impact inclusion in LSWF needs further consideration. The PQ and grid codes (Category-D) and Q compensation, particularly for FACTS devices (Category-E), were partially discussed. Much of the literature discussed the FACTS devices pertaining to Category-E, yet their impact in a composite study needs further consideration. The proposed study (P) aimed to bridge those research gaps across categories A–E in LSWF and present a comprehensive study with the support of case/scenario-based methodology (in Category-F) in a weak transmission grid of a developing country such as Pakistan.
In the reviewed work, a huge research gap existed regarding the impacts of increasing wind penetration into the transmission network of Pakistan’s wind corridor and associated technical impacts. Pakistan is a relevant case study due to it being one of the few countries that has transformed itself from an energy deficient to an energy surplus country with a generation capacity of 36 GW against a maximum demand of 27 GW (30 June 2019) [34]. The only study conducted in [23] revealed that the PQ issues of an individual wind farm integrated into the Pakistan regional distribution company was named Hyderabad Electric Supply Company (HESCO). The study considered PQ and Q compensation of individual wind farms. In addition, the wake effect, wind intermittency, and seasonal variations were not considered. The PQ metrics—i.e., voltage profile, frequency stability, and PF at the PCC—were not studied under varying wind conditions during different seasons. Moreover, the comparative study in [23] was limited to address the power quality and compensation issues with a capacitor bank and STATCOM. Other notable FACTS devices (i.e., SVC, SSSC, and UPFC) need further evaluation from the viewpoint of application in LSWF under various scenarios.
This paper aimed to investigate and analyze the technical impacts of an LSWF comprised of three-wind farms that penetrated the transmission level considering the inter-farm wake effect, wind intermittency via seasonal variation, PQ via grid codes, and Q compensation with various FACTS devices. The wind farms in considered wind corridors were integrated into a distribution operator HESCO, which is a weak grid. LSWF integration resulted in technical complications and needed reinforcement. The objective of this study was to explore the application of FACTS devices in LSWF integration into the Nooriabad grid under HESCO (Pakistan) to study the impacts of a wind farm (49.5 MW) undergoing a power shortfall due to the presence of both intra- and inter-farm wake effects. The test case considers onshore LSWF with irregular spacing in utility-scales comprised of nearly a 70% wind generation capacity, located in Jhimpir, Nooriabad Grid (132 KV), HESCO Pakistan. The scope of the study also covered the wind intermittency impact and PQ issues due to wake effects in accordance with the national electric power regulatory authority (NEPRA) grid codes and international electrotechnical commission (IEC) standards.
Previous onshore LSWF grid integration studies ignored the combined impacts of the inter- and intra-farm wake effects due to an uncoordinated design. This study offered a technical guideline for FACTS devices to address wake effects, wind intermittency, PQ, and Q compensation issues. Capacitor banks and FACTS devices such as SVC, STATCOM, SSSC, and UPFC were employed to enhance power system stability and improve PQ through better reactive power control with comparative performance analysis. The study considered the wake effect as the wind passed by one wind farm to another and wind speed decreased due to energy from wind extraction. This phenomenon decreased the energy production of succeeding wind farms, which became the reason it replicated a real-time scenario. This paper could help tackle issues regarding wind penetration in a weak grid against voltage harmonics, current harmonics, voltage profiles, frequency stability, and power factor variations at PCC, which consider seasonal variations and extreme loading conditions. The core objectives of this study were intended to provide the following technical guidelines:
(a)
LSWF integration in a weak transmission grid, where Pakistan was the case study for the test setup.
(b)
Identify impacts of wake effects, wind intermittency, PQ, and Q compensation issues.
(c)
Performance analysis of capacitor banks and FACTS devices as the solution for issue mitigation.
(d)
Propose a case/scenario-based strategy for PQ and Q compensation issues with the most suitable FACTS devices and recovering power deficits by increasing hub height.
(e)
A comprehensive technical impact assessment of LSWF integration in terms of quantification.
The organization of the paper is as follows. Section 2 presents the test LSWF setup and information. Section 3 discusses the proposed case/scenario-based methodology aimed at LSWF integration and its associated impacts. Section 4 is comprised of simulations, results, and discussions. Section 5 presents a comparison and validation along with a special case with increased hub height. Section 6 concludes the paper.

2. LSWF Test Setup and Background Information

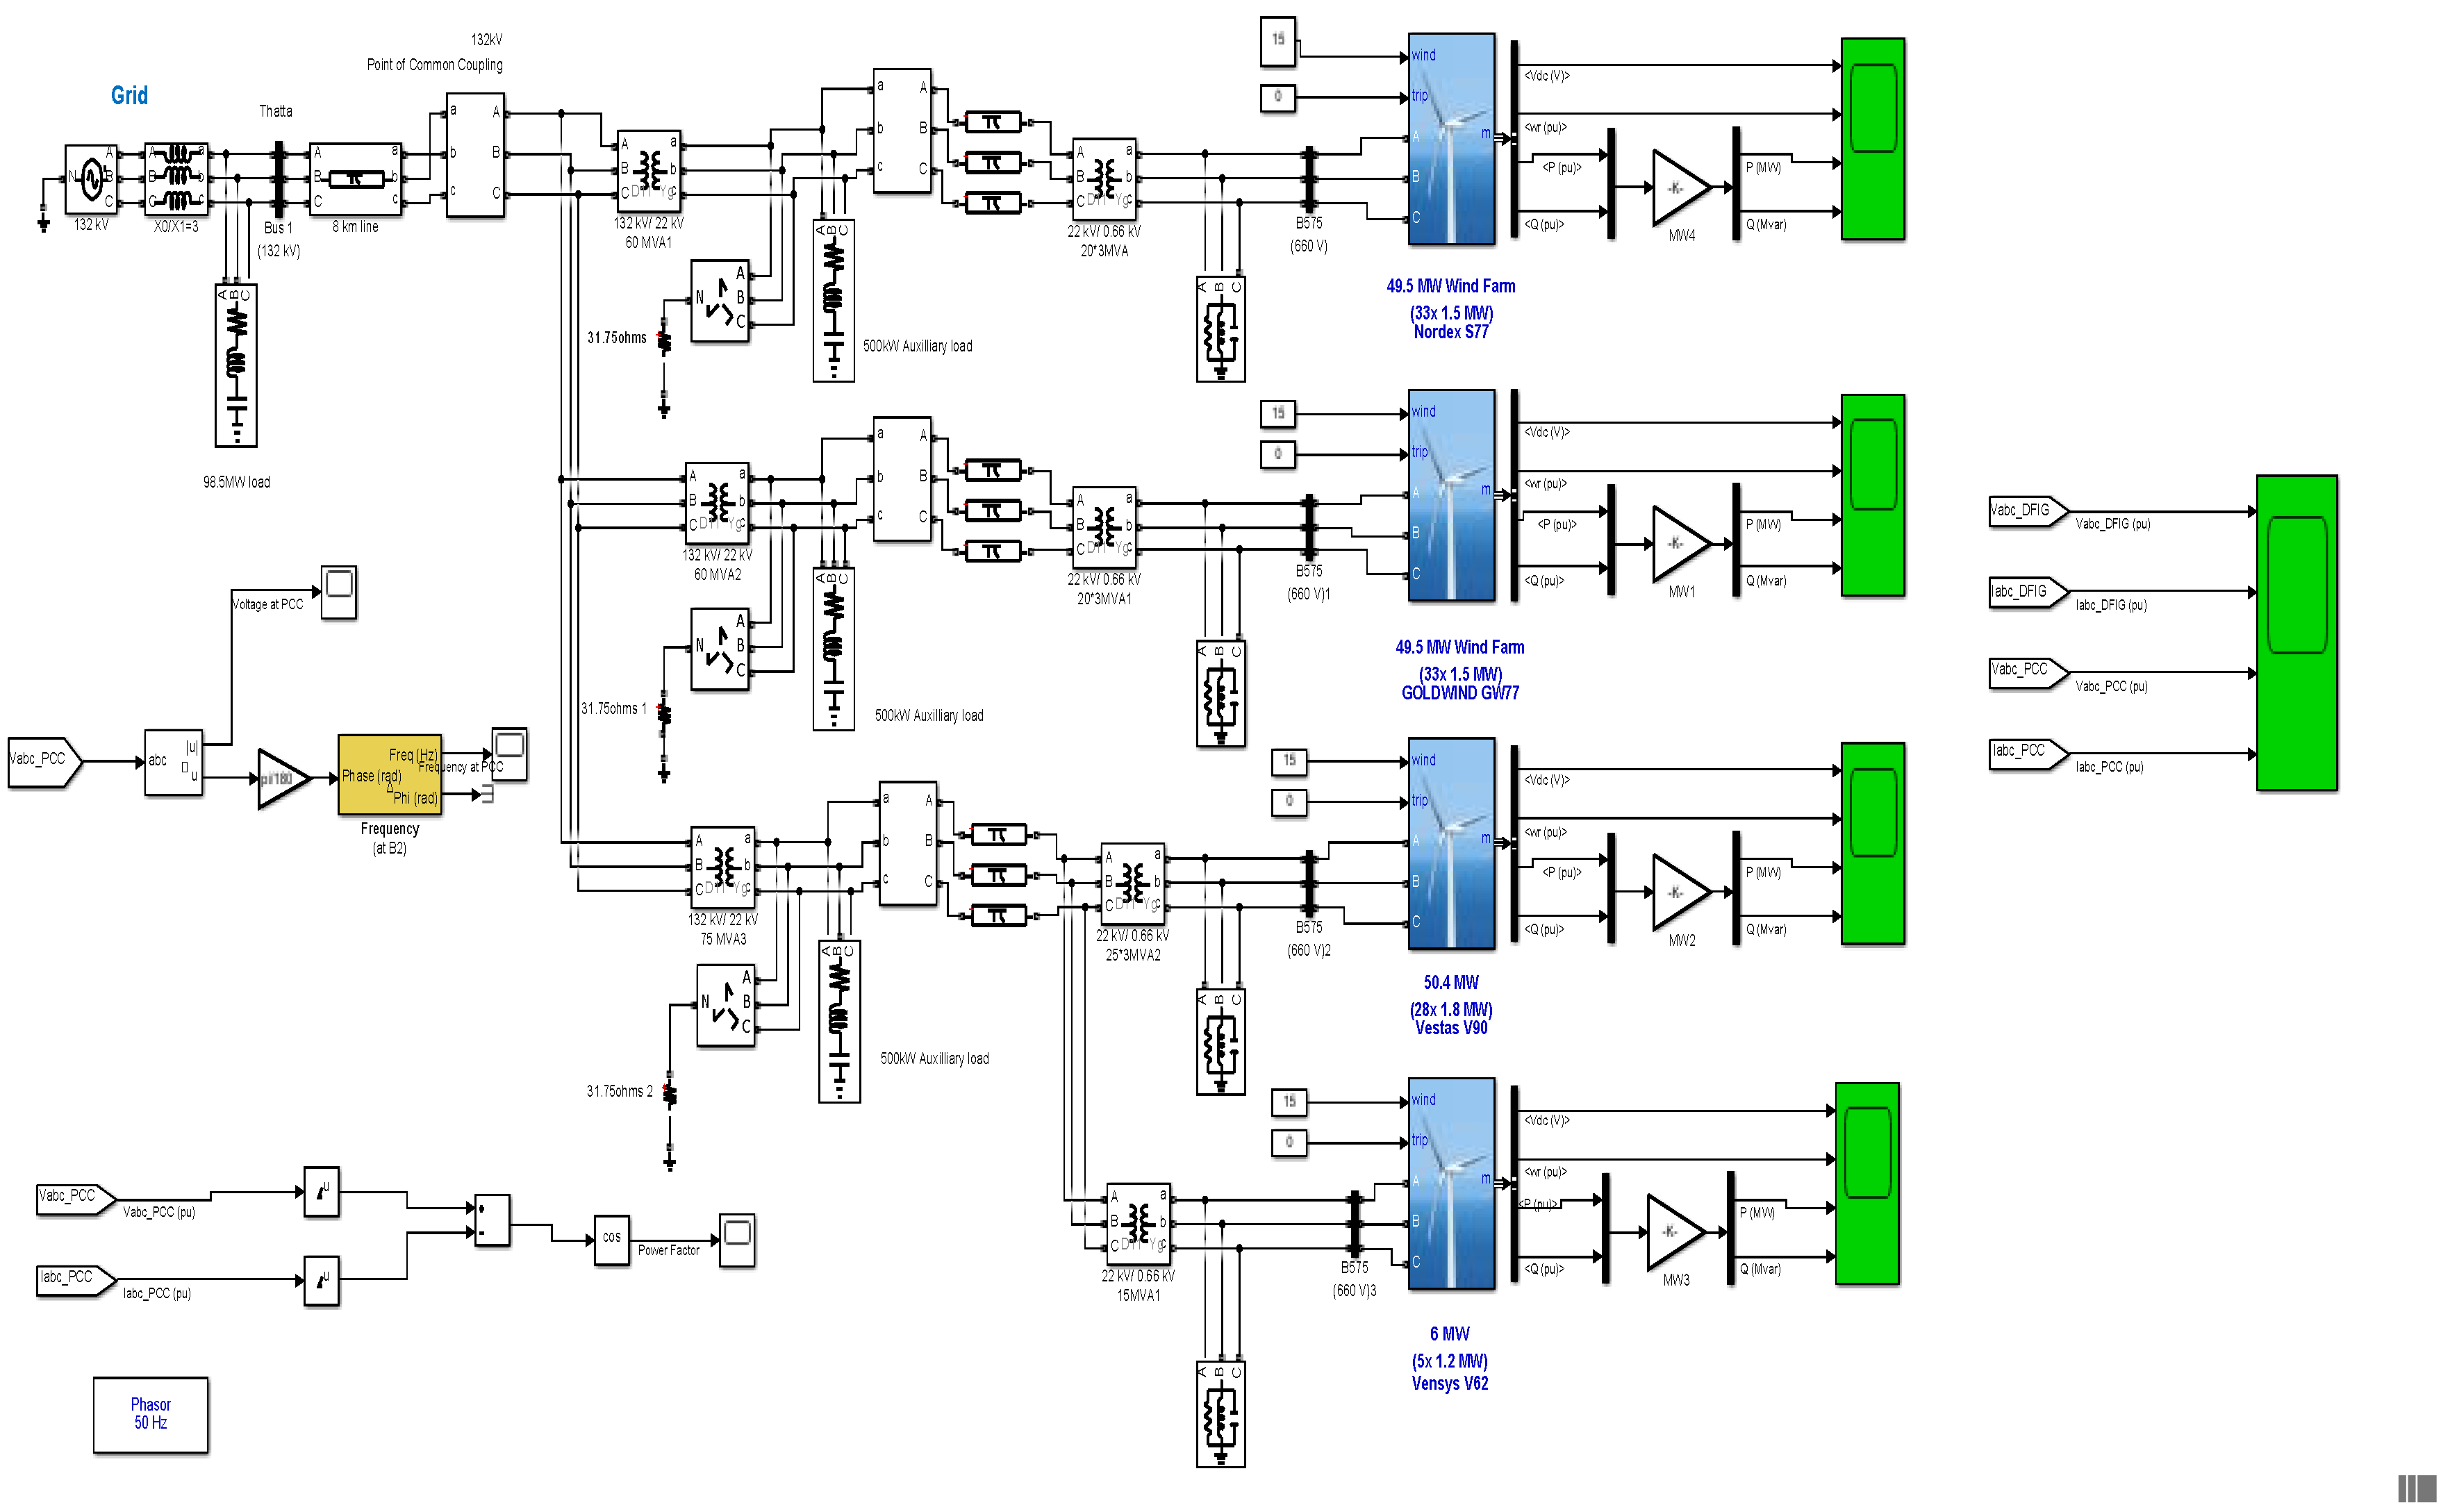
2.1. Simulation LSWF Test Setup

An existing Nooriabad grid operating at 132 kV was developed in SIMULINK/MATLAB—as shown in Figure 1—with 3 × wind power plants (WPP), including Fauji Fertilizer Company Energy Limited wind power plant (FFCEL), Zorlu Enerji (ZE) Pakistan WPP, and Three Gorges First (TGF) WPP integrated into it. The reason for selecting this specific node of the Nooriabad grid was to integrate three wind power plants into it and to investigate the impacts of LSWF integration on transmission networks in the wind corridor. The LSWF with its respective technical specifications is shown in Table 1. The FFCEL is considered as a test case and is downstream, whereas ZE and TGF are upstream. The reason for this consideration was to observe the impact of the inter-farm wake effect, which were responsible for deteriorating the active power output. As wind passed by upstream wind farms to downstream wind farms, it slowed down, which was the reason for the active power deficit.

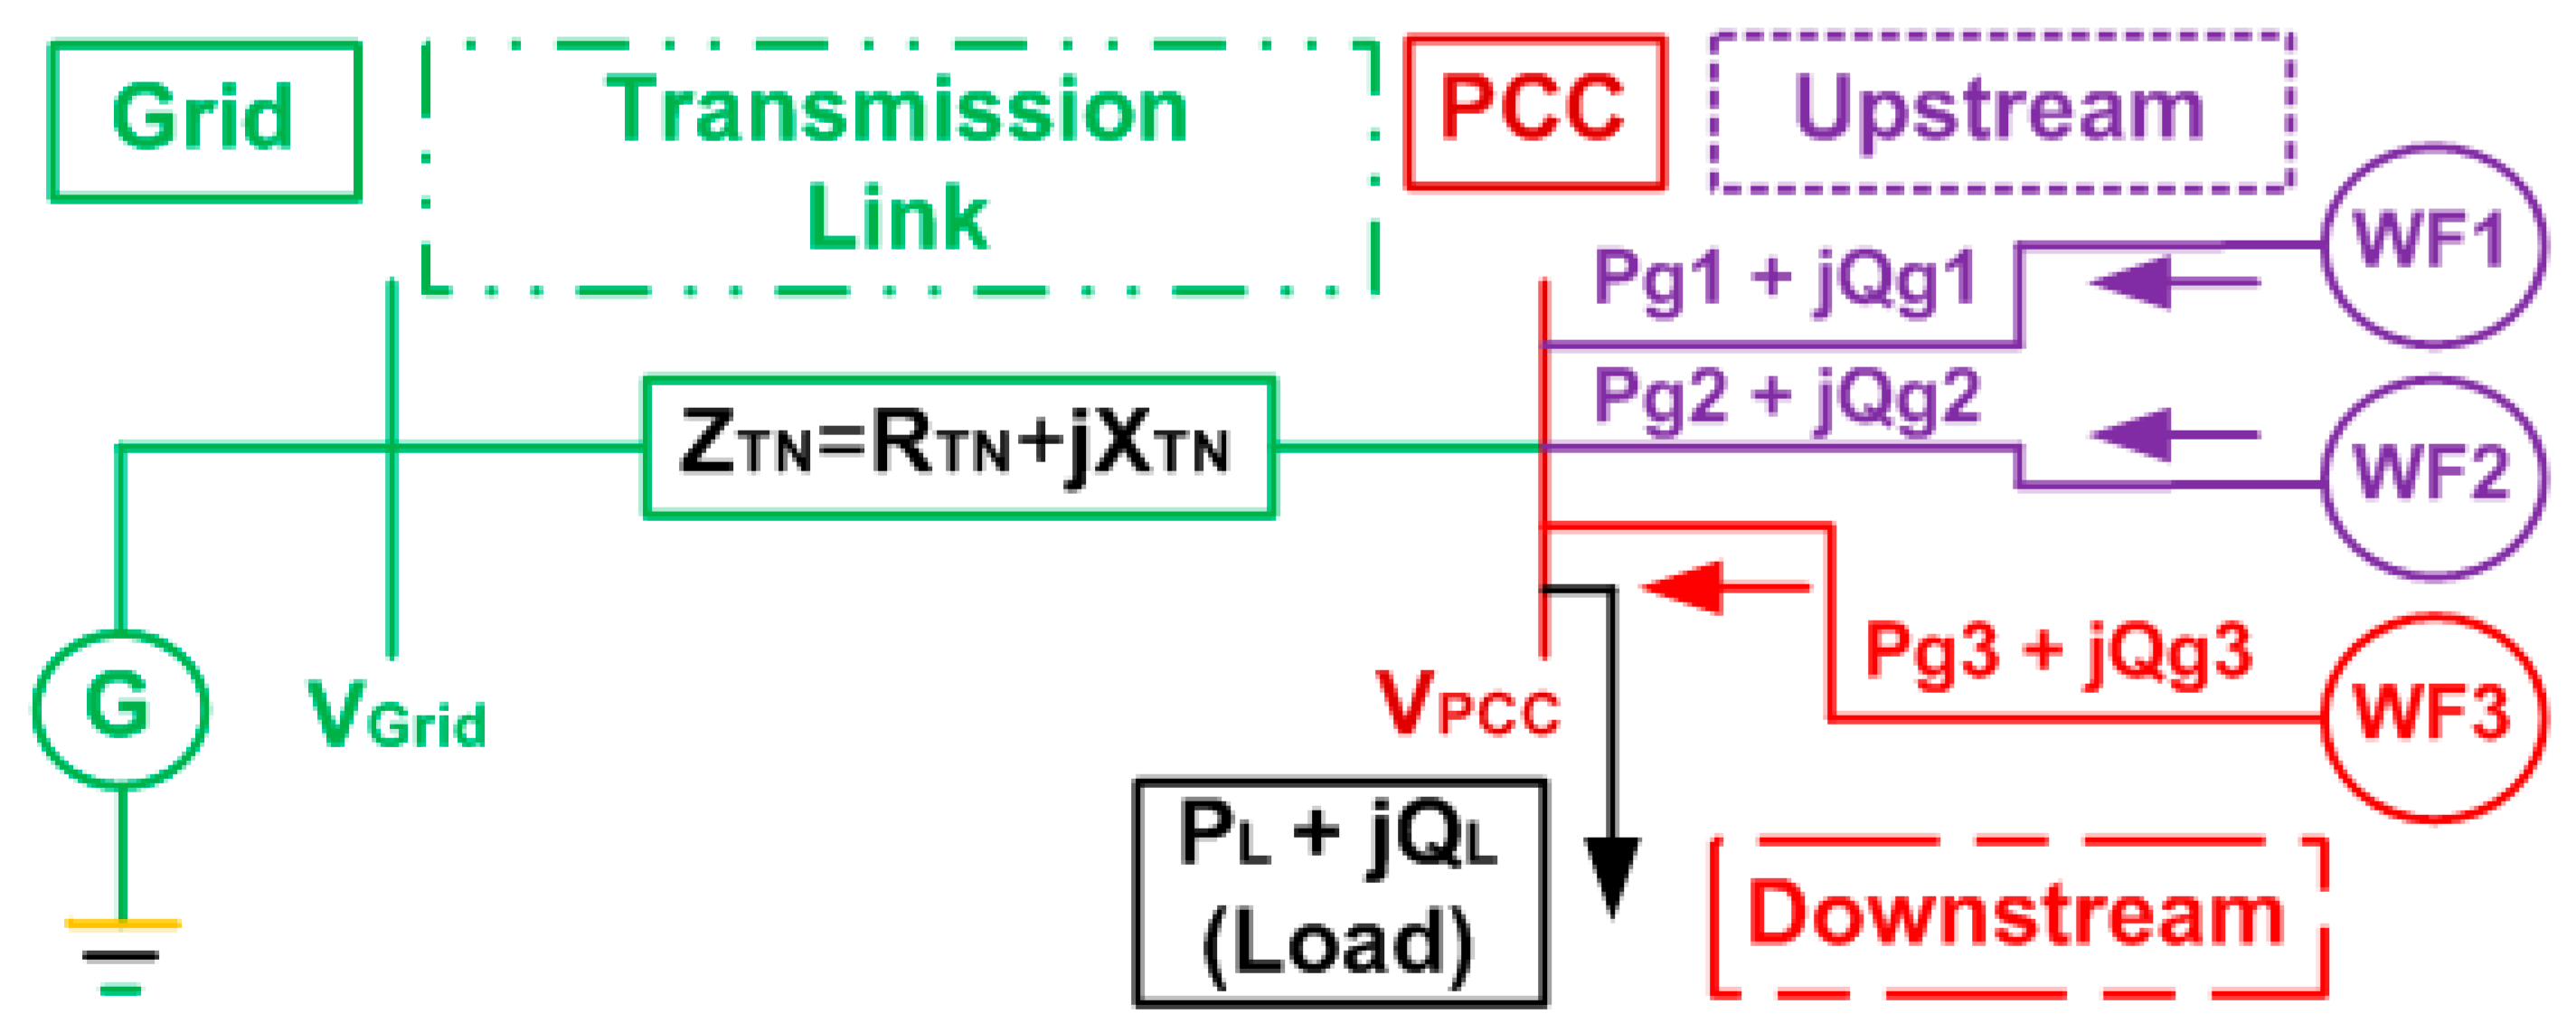
2.2. Equivalent LSWF Model with Grid Integration Issues

The DFIG with background mathematical equations and respective DFIG control setup is shown in detail in Appendix B. The LSWF integrated with the transmission network (TN) is susceptible to various issues such as the intermittent nature of the wind, asynchronous type of generators (i.e., DFIG), various stability (i.e., predominately voltage), and concerned PQ issues. Figure 2 shows the equivalent LSWF model connected with the TN. The weak TN exhibited impedance (ZTN) with the major contingent being that of resistance (RTN) in comparison with reactance (XTN), resulting in weak short circuit capacity (SCC) strength. Moreover, such a weak TN was not initially designed to cater to large sums of power originating from an LSWF.
With regard to reduced P production, there are additional factors at play here, such as inter-farm wake effects caused by a reduction in wind speed from upstream farms that impact downstream WFs. The decrease in wind speed results in a decrease in the mechanical torque of the turbine, which further results in a decreased electrical output P and output voltage at the terminals. Moreover, Q compensation issues were more noticeable in LSWF and had direct impact on the PQ of the overall system. As shown in Figure 2, upstream wind farms WF1 and WF2 showing ZE and TGF resulted in a decrease in the power output, whereas downstream wind farms WF3 showing FFCEL and the proposed methodology in this paper aimed to find out these impacts in the presence of the aforementioned issues. Due to the intra-farm wake effect, the voltage at PCC (VPCC) was expected to dip along with the other PQ and Q compensation issues across various wind intermittency scenarios such as seasonal variations. The performance evaluation in the following sections gives a composite big picture of the aforementioned issues. (For the technical test system details, consult [23].) VGrid or V1 represents the grid side voltage, whereas VPCC or V2 represents the PCC side voltage. The reactive power (Q/VAR) compensation devices and respective connections in the grid is separately shown in Appendix B.

2.3. Grid Codes for Power Quality
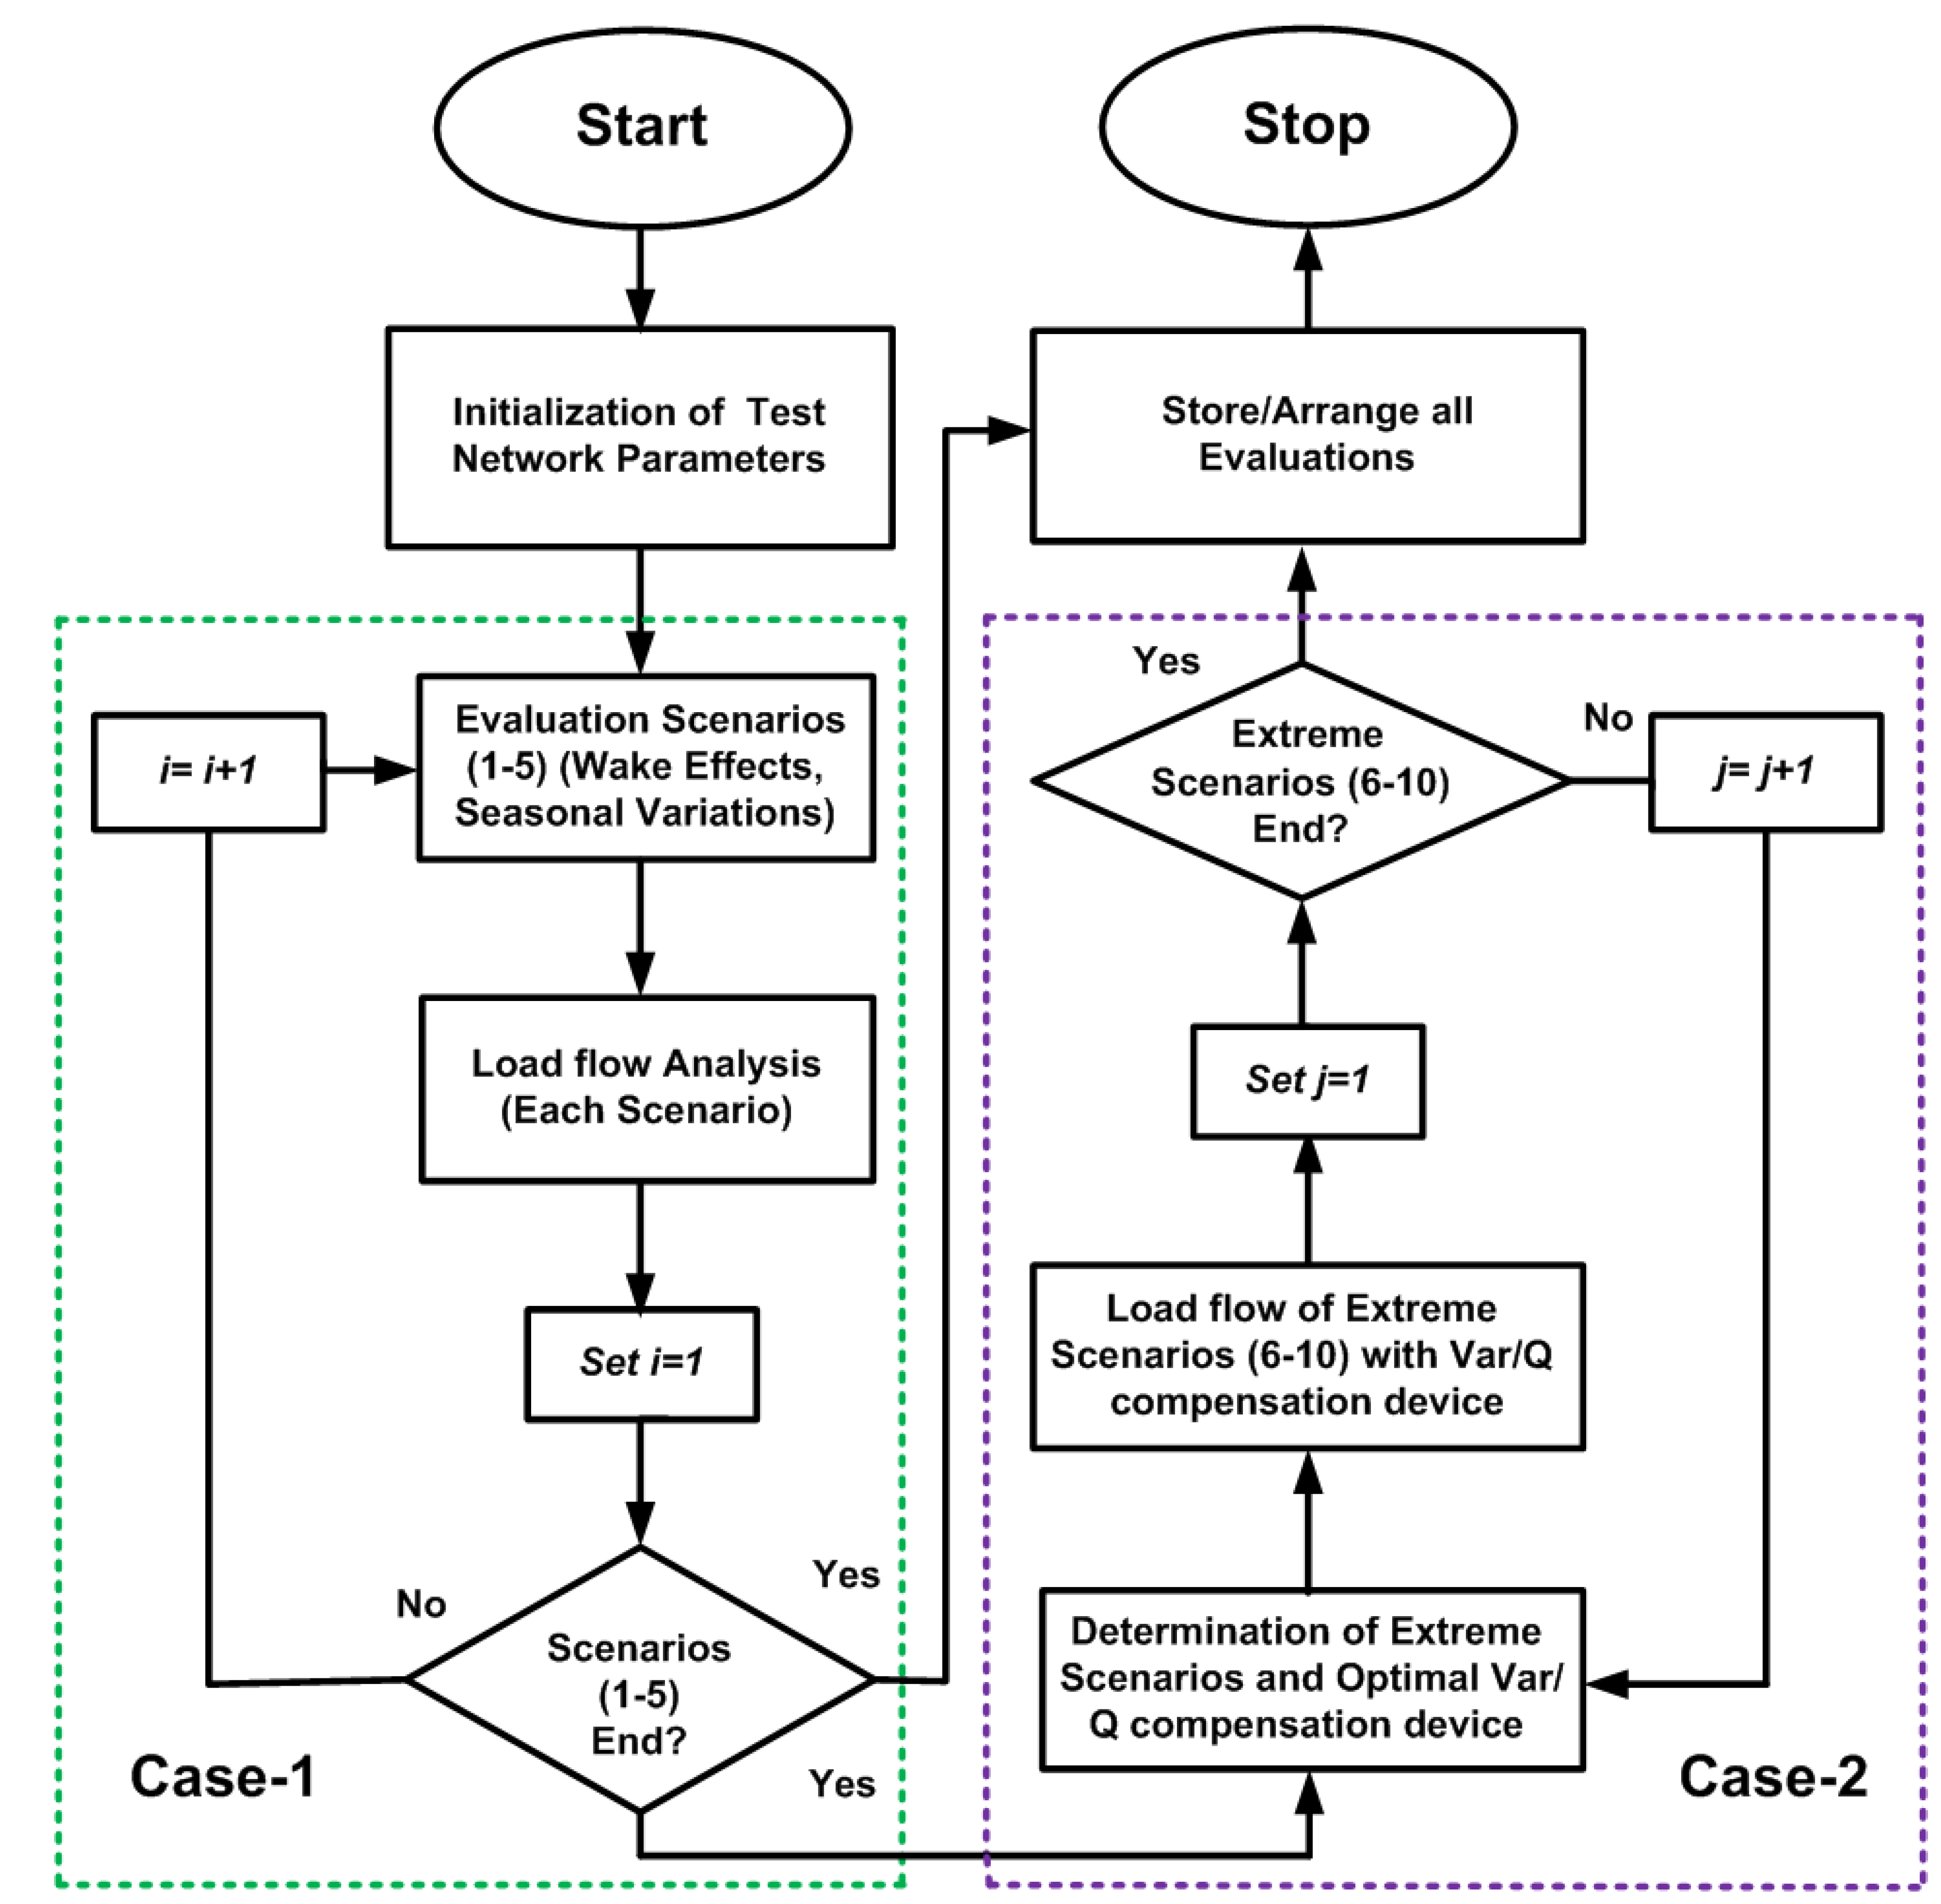
The national electric power regulatory authority (NEPRA) grid codes in Pakistan, as a case study, are given in [23] and summarized in Table 2, as follows:

3. Methodology

The proposed methodology aimed to bridge the research gaps of previous studies regarding onshore LSWF grid integration studies. In a previous study [23], a commendable effort was put forth to address PQ and Q compensation issues with capacitor banks and STATCOM for an individual WF. However, this study did not consider seasonal variations, the inter-farm wake effect, and the variety of FACTS devices used for evaluation. In addition, PF and frequency profiles at PCC were not considered, which played a significant role while integrating WF into TN. In addition, the resulting power deficit with limitations found from a comprehensive study was not evaluated in previous works.
The limitations included ignoring wake effects due to uncoordinated design, wind intermittency (i.e., seasonal variations), PQ issues, and Q compensation, all of which resulted from a variety of technologies such as capacitor banks and FACTS devices. The comparative performance assessment aims at addressing power shortages due to wake effects and seasonal variations along with improving PQ, enhancing system stability via capacitor banks and FACTS devices such as SVC, STATCOM, SSSC, and UPFC. The methodology was anticipated to provide a valuable midterm solution for costly long-term TN reinforcements on a technical basis.
The proposed methodology offers a more detailed evaluation aimed at reducing power quality and reactive power compensation issues associated with large-scale wind farm integration in weak transmission grids. The proposed approach was evaluated per grid codes and applied to an actual test system. To cater to Category-A, which was connected with WT integration and associated technologies, we examined LSWF integration in TN with 154.4 MW test system details, DFIG technology, concerned control strategy, and equivalent system model. To cater to Category-B, we incorporated associated with inter-farm wake effects and field data. To cater to Category-C, we considered wind intermittency impact, ground time, and four seasonal variations. To cater to Category D–F, we evaluated the inter-farm wake effect, wind intermittency impact on PQ, grid codes, and Q compensation devices across various cases and respective scenarios. The flow chart of the proposed approach is shown in Figure 3 and consists of two cases with respective scenarios.

3.1. Case-1: Base Case Scenarios Assessment

Case-1 included scenarios with and without wake effects and seasonal variations. Case-2 included extreme scenarios achieved from Case-1 and evaluated the Q/VAR compensation device assessment. The developed base case (Case-1) was simulated to observe the impact assessment of LSWF integration on TN across various PQ metrics. Case-1 with respective scenarios did not include any Q compensation device integrated into the system and was comprised of five scenarios, as follows:
Scenario 1a:
Impact assessment of the ideal base case without wake effects and seasonal variations. This scenario 1a falls into the categories of A, D, and F.
Scenario 1b:
Impact assessment of the base case with wake effects and without seasonal variations. This scenario 1b falls into the categories of A, B, D, and F.
Scenario 2:
Impact assessment with wake effects and seasonal variations of winter. The time stamping (December to February) considers data from 4 January 2018. This scenario covers the assessment categories, designated by A-D and F, except for Q support.
Scenario 3:
Impact assessment with wake effects and seasonal variations from spring 2018. Time stamping (March to April) considers data from 2 April 2018. This scenario covers the assessment categories of A–D and Fm except for Q support.
Scenario 4:
Impact assessment with wake effects and seasonal variations of summer 2018. Time stamping (May to September) considers data from 2 July 2018. This scenario covers the assessment categories of A–D and F, except for Q support.
Scenario 5:
Impact assessment with wake effects and seasonal variations from autumn 2018. Time stamping (October to November) considers data from 1 October 2018. This scenario covers the assessment categories of A–D and F, except for Q support.

3.2. Case-2: VAR Devices Based Scenario Assesment

In Case-2, the worst-case scenario from Case-1 was considered for further evaluation with Q compensation devices. Case-2 had five scenarios, as follows.
Scenario 6:
Impact assessment considering capacitor bank integration with inter-farm wake effects and seasonal variations. The scenario covers assessment categories of A–F.
Scenario 7:
Impact assessment considering SVC integration with inter-farm wake effects and seasonal variations. The scenario covers assessment categories of A–F.
Scenario 8:
Impact assessment considering STATCOM integration with inter-farm wake effects and seasonal variations. The scenario covers assessment categories of A–F.
Scenario 9:
Impact assessment considering SSSC integration with inter-farm wake effects and seasonal variations. The scenario covers assessment categories of A–F.
Scenario 10:
Impact assessment considering UPFC integration with inter-farm wake effects and seasonal variations. The scenario covers assessment categories of A–F.

4. Simulations, Results and Discussions

4.1. Case-1 Evaluation

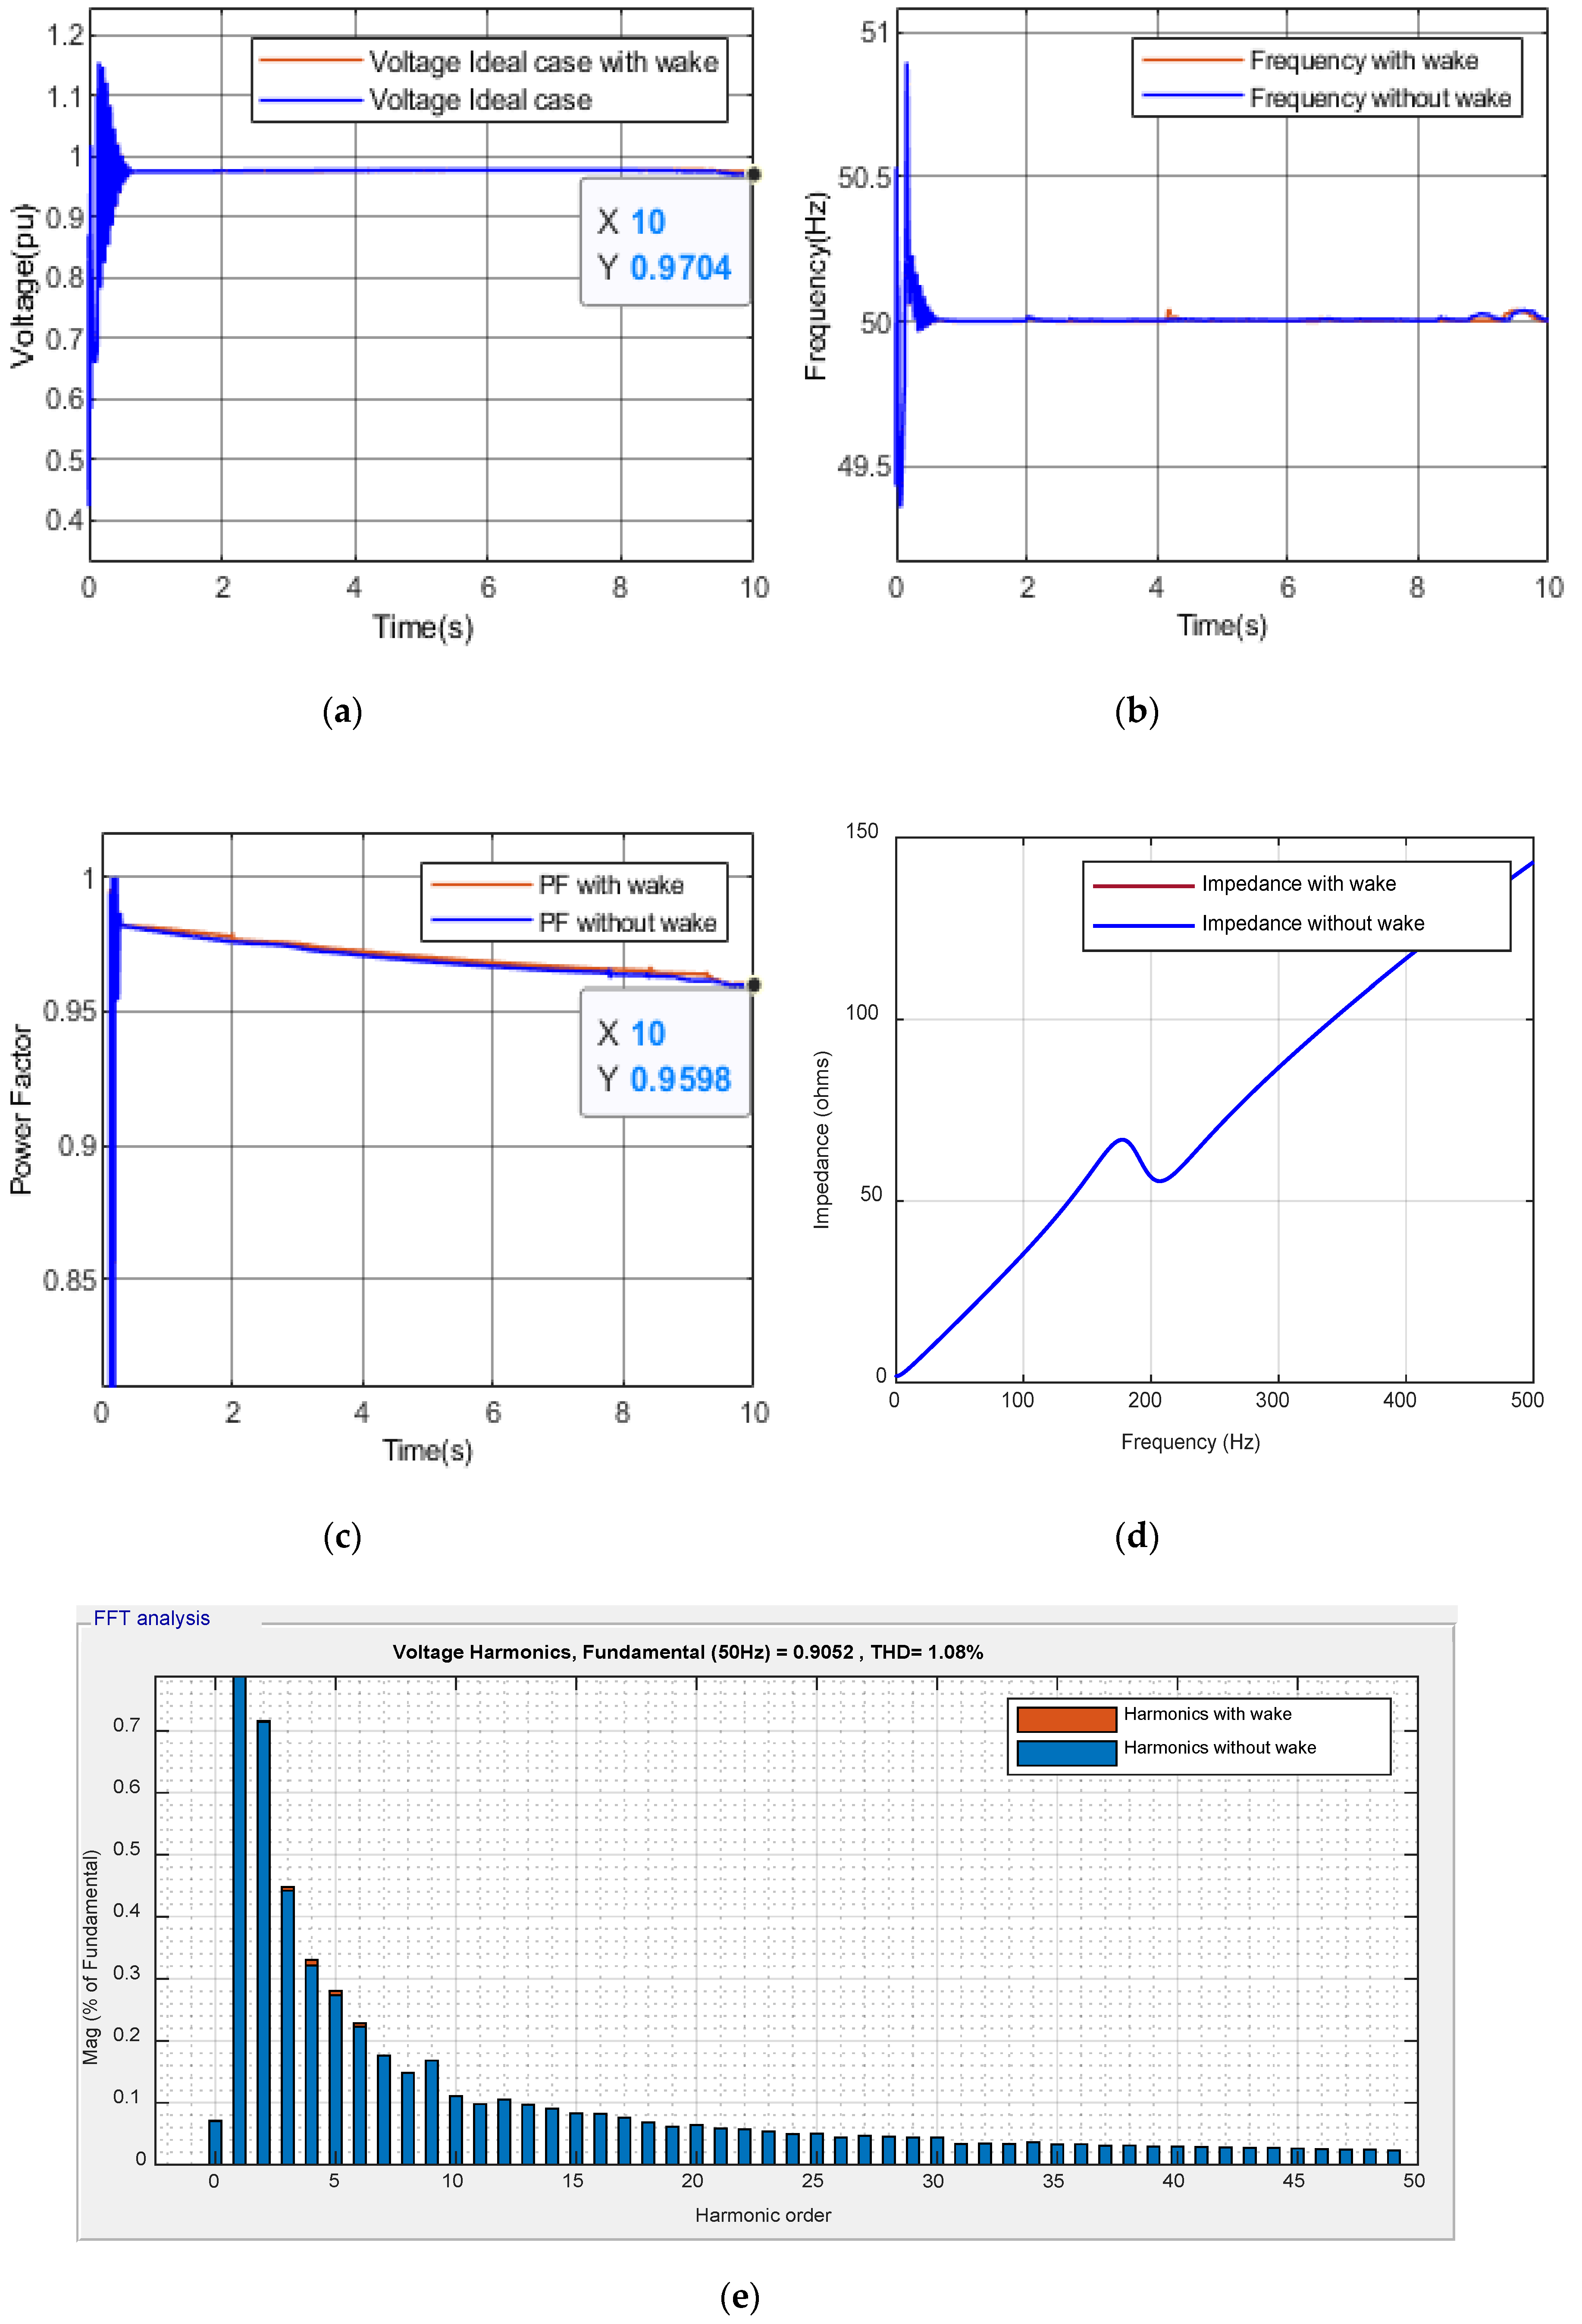
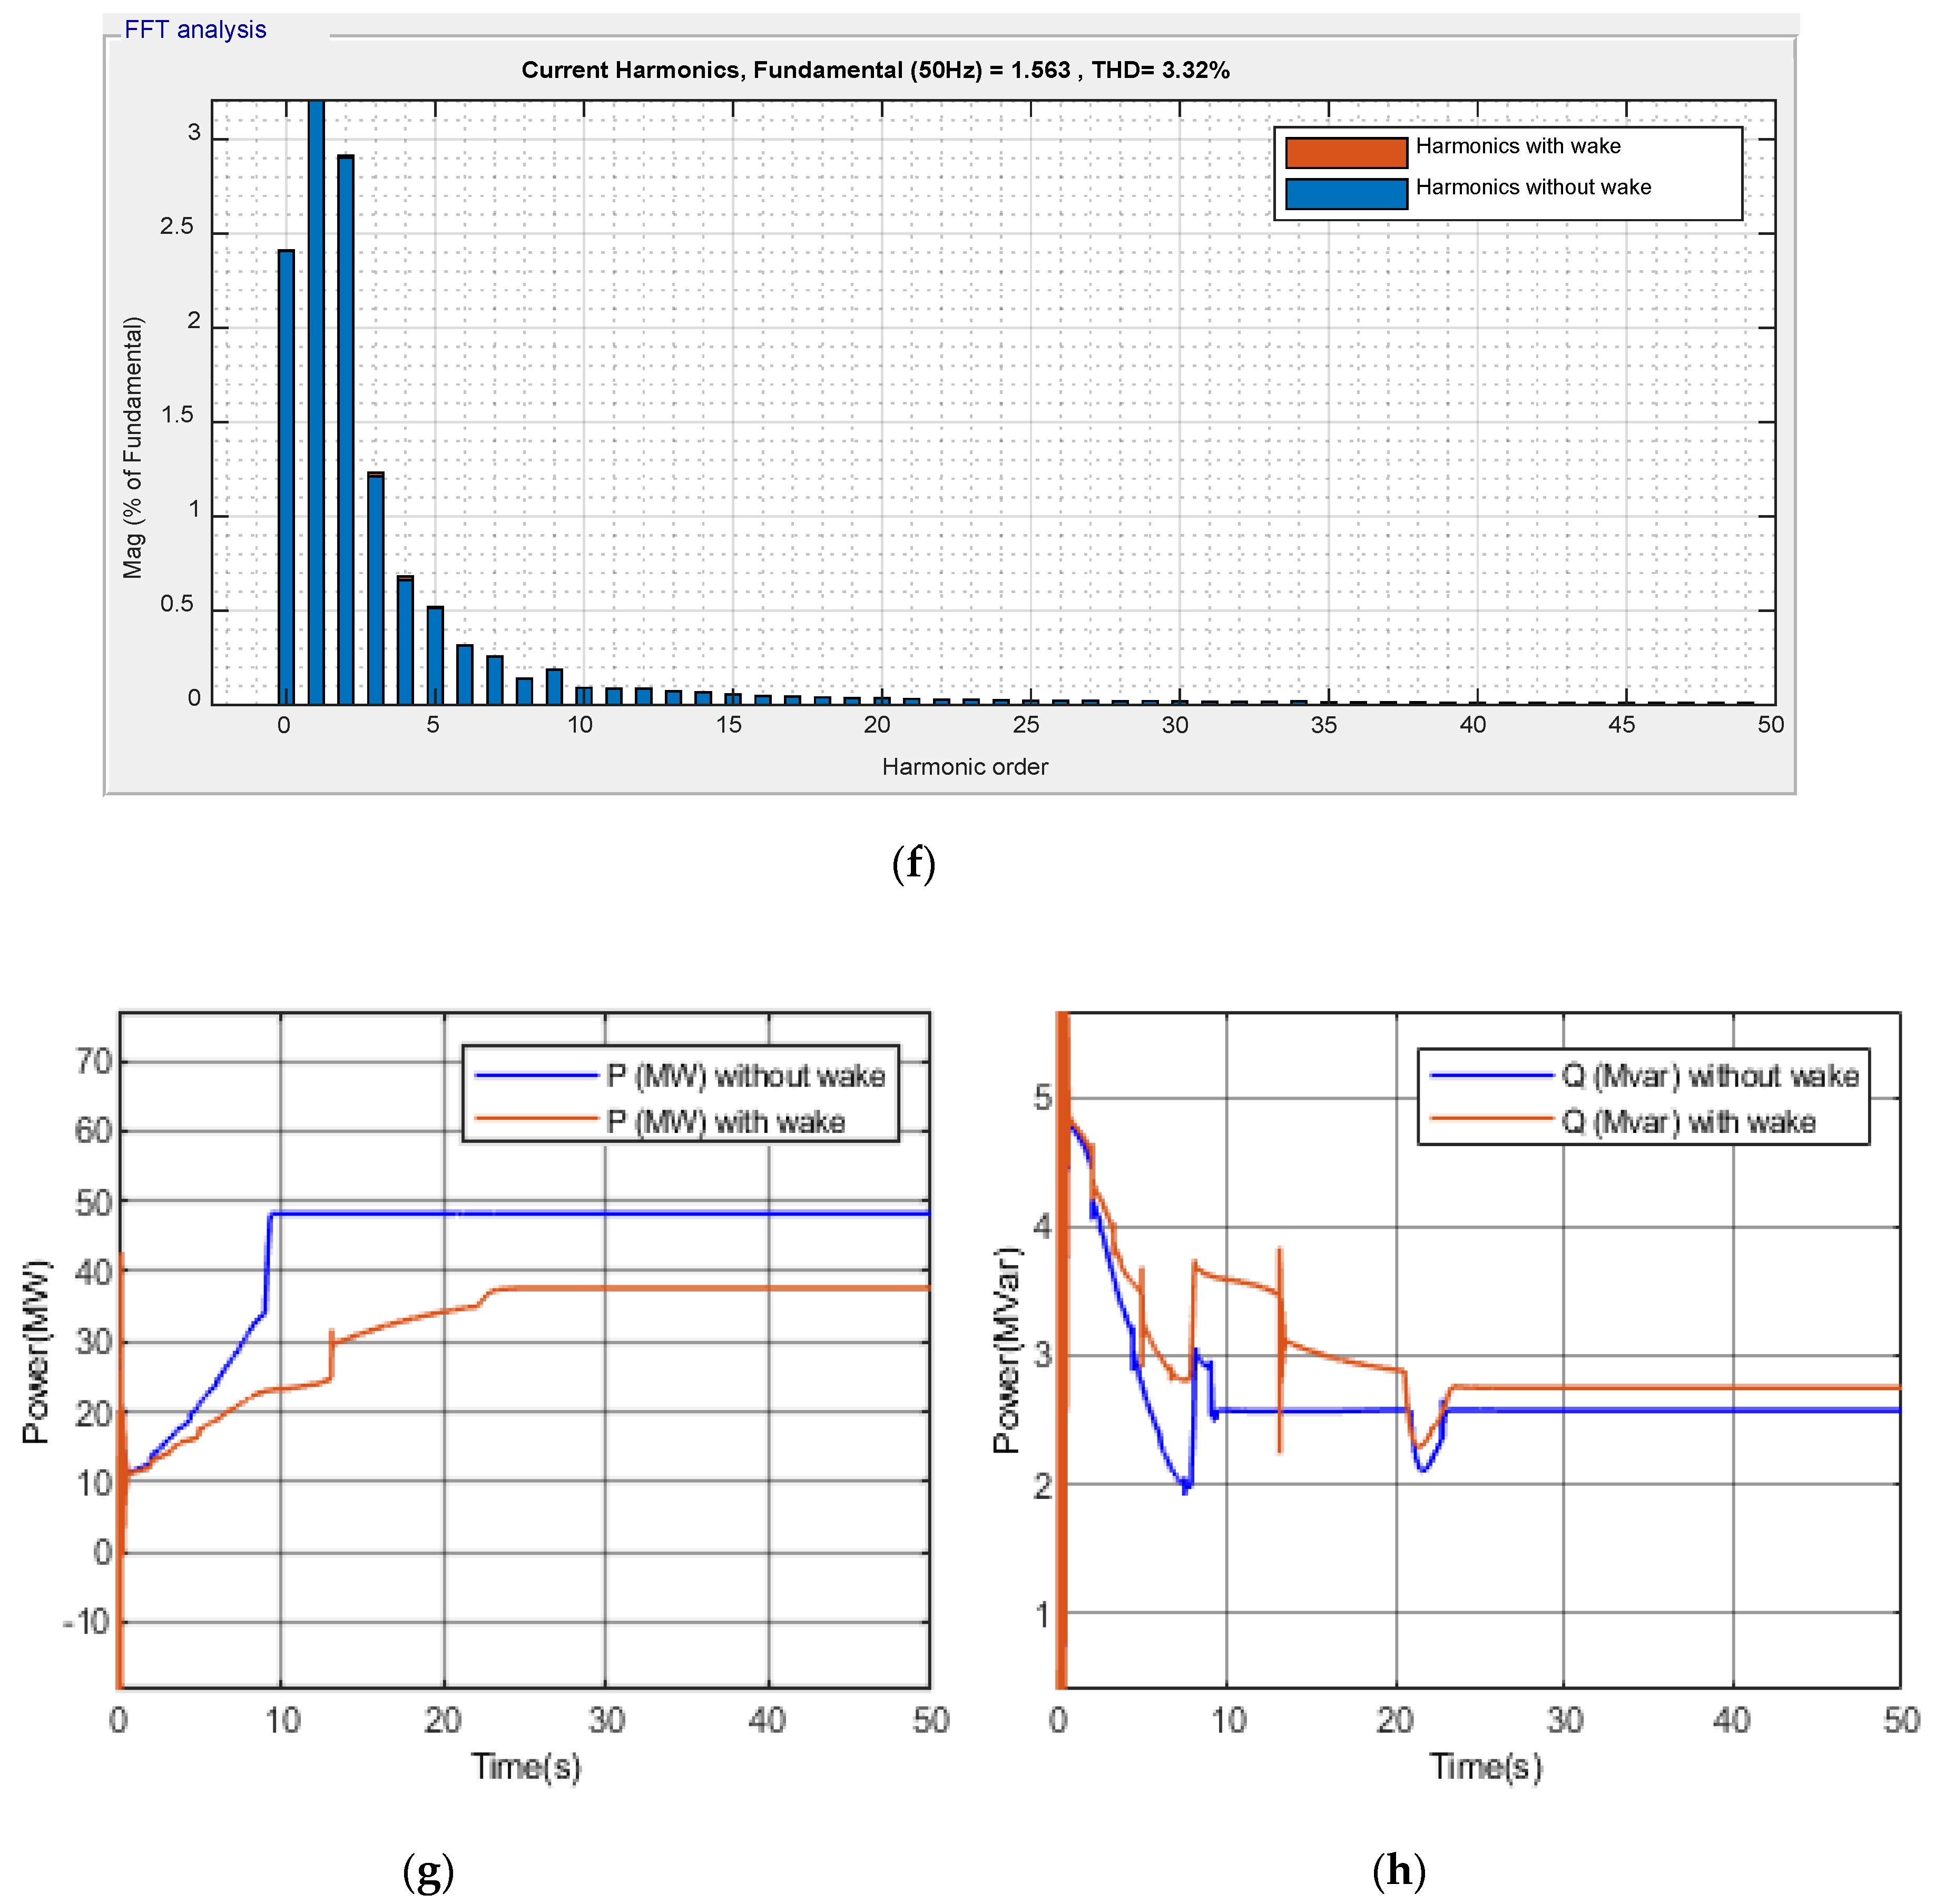
4.1.1. Case-1, Scenario-1: The Ideal Case with and without Wake Effect

The results of scenarios 1a and 1b are shown in comparison considering with and without wake effects. This scenario did not consider any seasonal variations. The voltages (V) at PCC in Figure 4a, were observed to be same i.e., 0.9704 pu. Figure 4b shows that the frequencies (F) overlapped with most of their portion and only fewer negligible notches of difference. PF curves were observed in Figure 4c to overlap at most of the points. Figure 4d shows the impedances (Z) to exactly overlap with each other against the frequency. Figure 4e represents the voltage harmonics (0.9052%) and it shows a minor difference at fewer points with most of the overlapped points (THD = 1.08%). Current harmonics (1.563%) are almost the same (THD = 3.32%), as shown in Figure 4f. All of these power system parameters were unchanged with and without wake effects. This is because if wind speed is less or more, the turbine maintains its terminal voltage and frequency with the difference in its load handling capability. The change in speed causes a change in energy or power output of a WT at a maintained voltage and frequency levels. Figure 4g depicts the significant change in P output of a wind farm with and without wake effects. The power deficit due to wake effects was found to be 22.05%, which was a major concern as power decreased from 48.28 MW to 37.63 MW. Figure 4h shows Q absorption increase by 6.76%, from 2.574 MVar to 2.748 MVar. From these results, we established that wake had a negligible effect on PS parameters while having a significant impact on the power output of the WF.

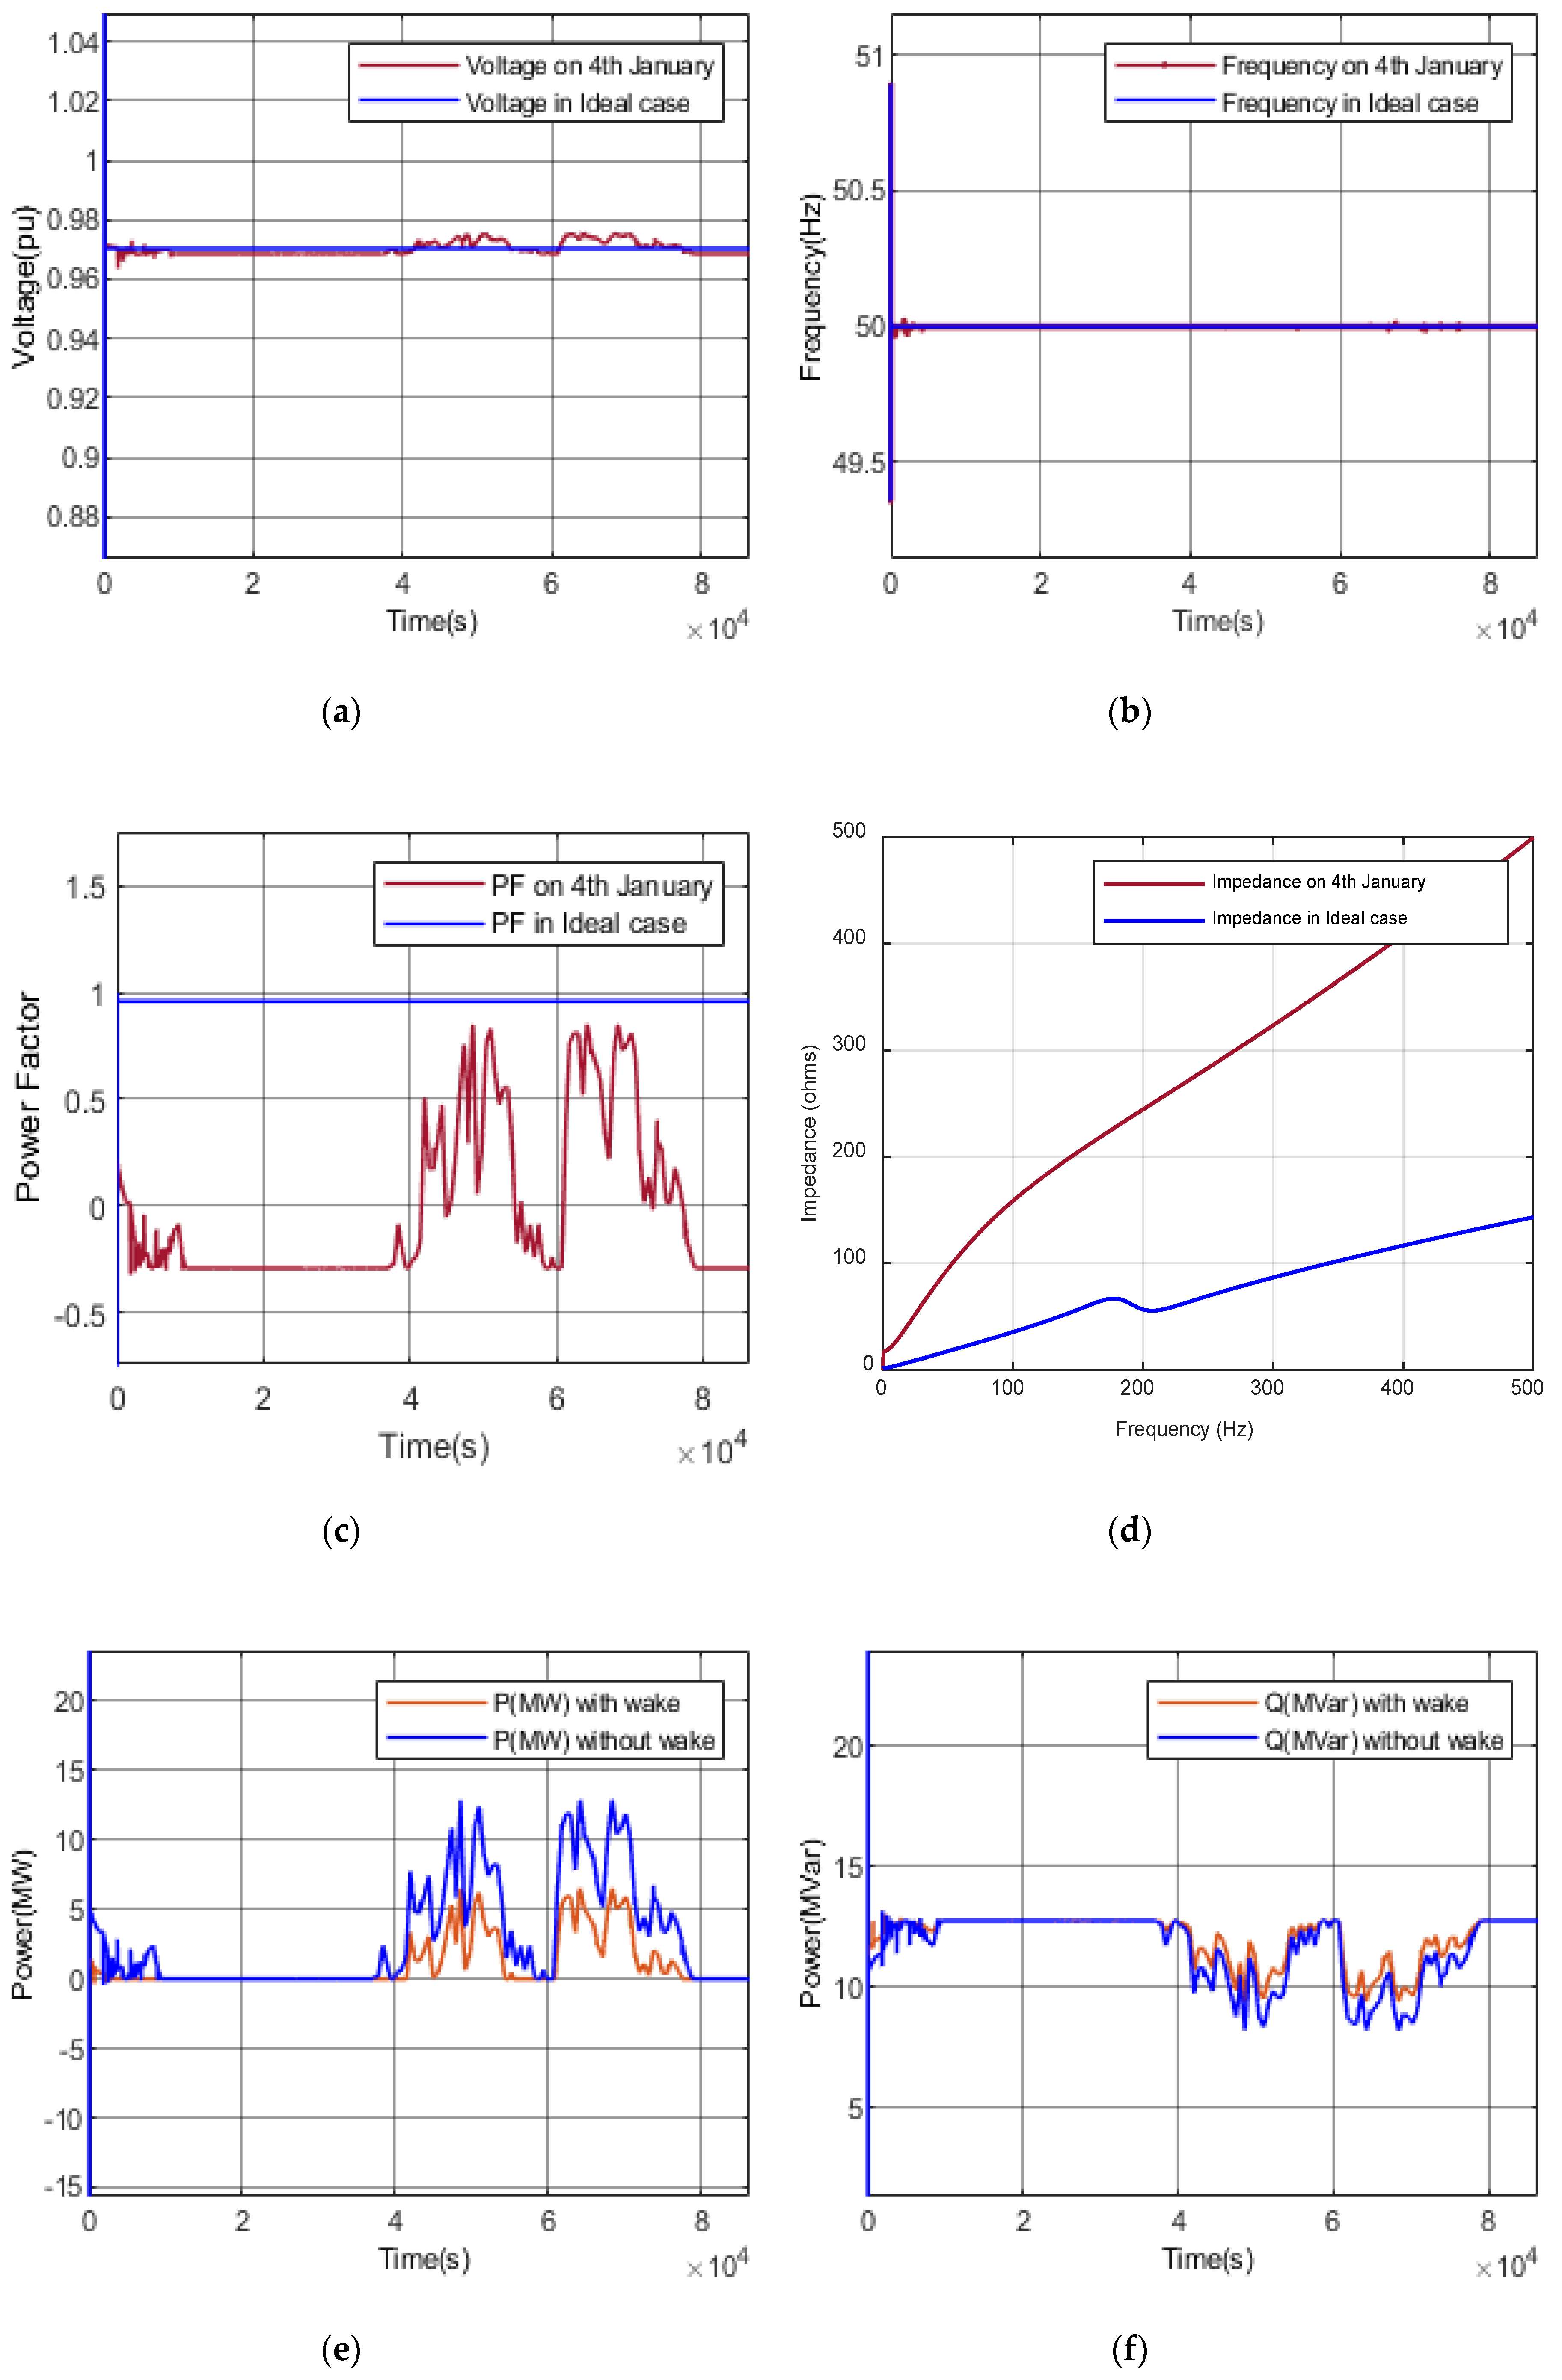
4.1.2. Case 1, Scenario 2: Seasonal Timestamp of January

The winter seasonal timestamp was taken on 4 January; its power system parameters are compared in the ideal scenario 1. The voltage (V) revolved around 0.97 pu (Figure 5a) and was overlapped with frequency (F) (Figure 5b). The change in the power output influenced the PF to vary according to wind speeds and was far beyond the ideal PF case (Figure 5c). The impedance (Z) curve was comparatively smooth with the high impedance of 500 ohms going against 500 Hz, at least when compared to the 143 ohms in the ideal case, as shown in Figure 5d.
P dropped about 30–45% at different points of the day when subjected to wake effects, as shown in Figure 5e. Q absorption increased about 10–15%, which can be seen in Figure 5f. During January, wind speed was the slowest and the wind turbine caused the wind turbine to be off for 40–45% of the day. WFs in this wind corridor were closed during this season because they became burden, absorbing huge amounts of Q from the grid. In fact, during lower wind speeds (2–7 m/s), it absorbed more Q than the required P amount. This was the reason for shutting down WFs during the winter, as it was not supported by the power system; rather, it disturbed the Q flows in the power system.

4.1.3. Case 1, Scenario 3: Seasonal Timestamp of April

The spring seasonal timestamp was taken on 2 April and its PS parameters were compared with ideal scenario 1. The voltage was maintained around 0.98 pu as compared to 0.9704 pu (Figure 6a).
The frequency was overlapped with a few minor scale notches in a steady state, i.e., 49.94 Hz and 50.05 Hz, as shown in Figure 6b. During low wind speeds, PF dropped from the allowable range while maintaining near nominal values during higher wind speeds, as shown in Figure 6c. The impedance curve was smooth, with a high impedance of 415 ohms in comparison with the ideal scenario of 143 ohms against 500 Hz, as shown by Figure 6d. Figure 6e shows a reduction in P due to wake effects. P dropped from 55–70% with varying wind patterns. Q absorption was doubled at most points due to wake effects, as observed in Figure 6f. April showed moderate wind speeds that varied from 6–12 m/s.

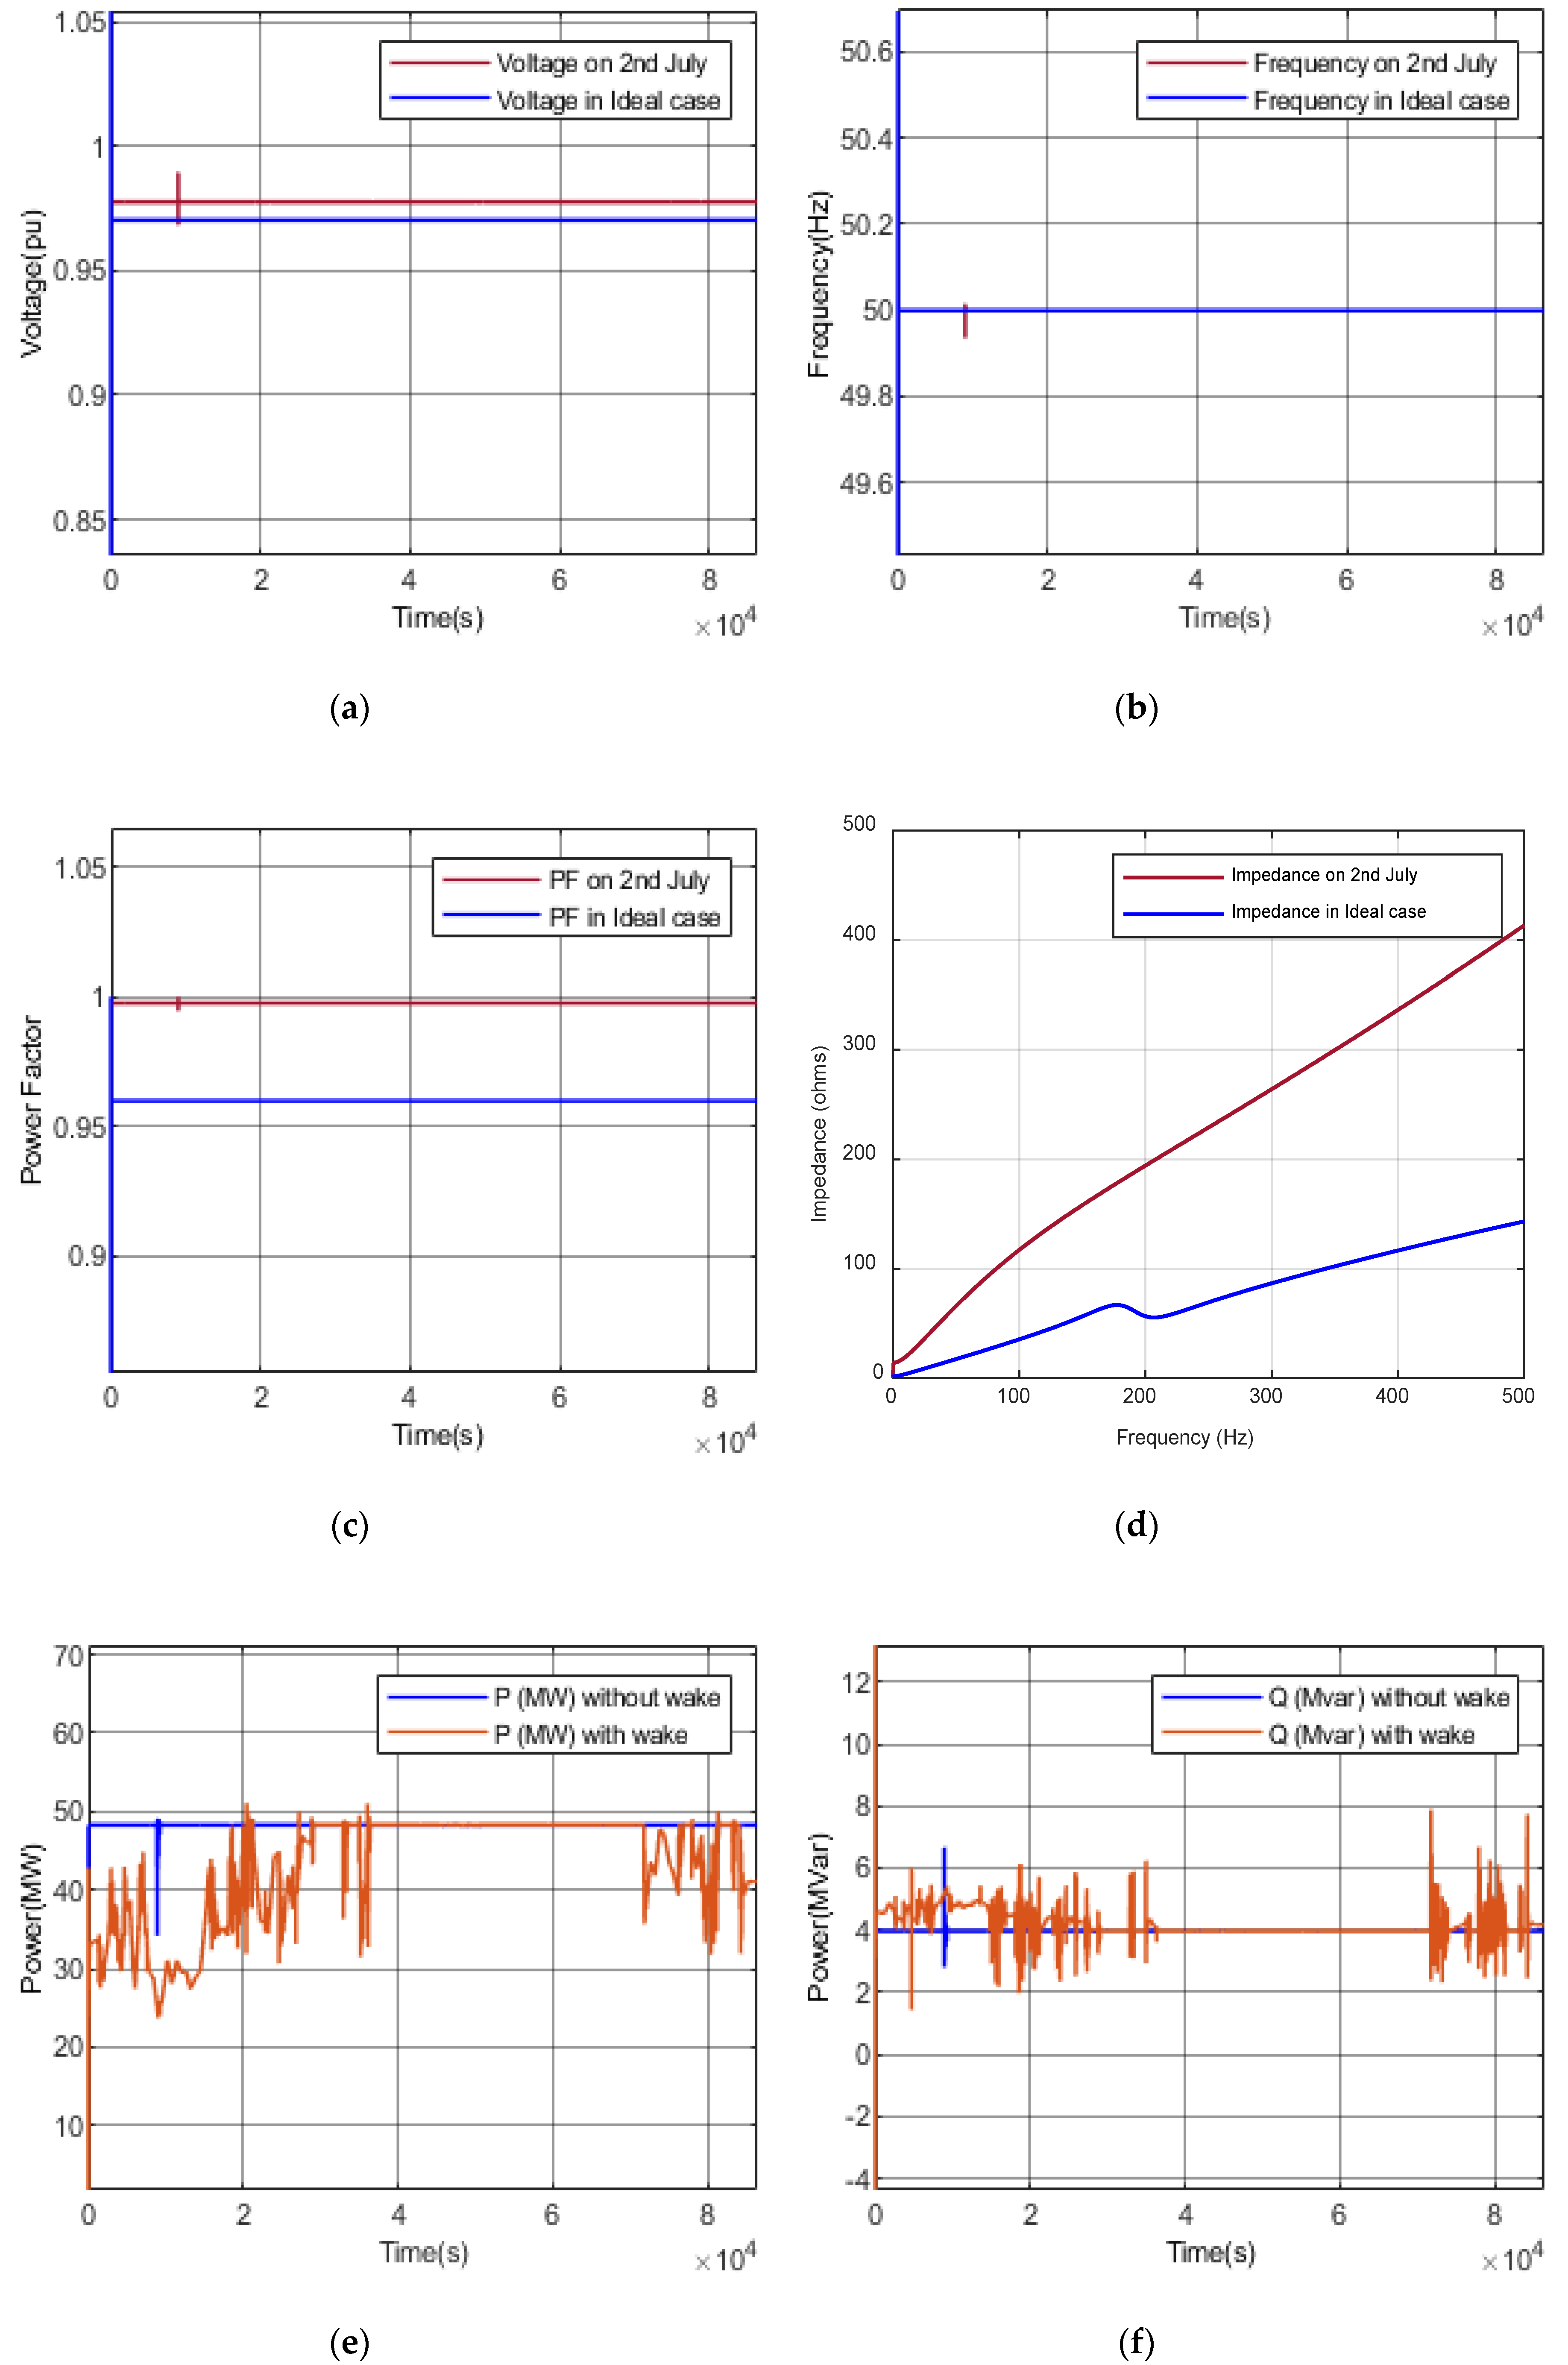
4.1.4. Case 1, Scenario 4: Seasonal Timestamp of July

The summer seasonal timestamp was taken on 2 July and its PS were are compared with ideal scenario 1. Wind speeds were highest during the July, i.e., 12 to 18 m/s. The voltage was quite stable at 0.98 pu, which was slightly above the ideal case voltage of 0.9704 pu, as shown in Figure 7a. The frequency was at a nominal value (50 Hz) during the steady state, as shown in Figure 7b. The PF was remarkably high, reaching up to 0.99. WF injected its maximum output into PS, as shown in Figure 7c. The impedance curve was smooth with a high impedance of 415 ohms going against 500 Hz, as shown in Figure 7d.
Figure 7e shows the impact of the wake effects on the P output. P dropped per varying wind pattern and wake combination, showing a maximum of 55% its original value before the wake. Q absorption increased and reached its limit of 8 MVar during the wake, which was previously restrained to 4 MVar, as shown in Figure 7f. Summer was the most suitable and highest yielding season for WF due to maximum wind speeds ensuring stability of PS parameters. This is why WFs are kept operational during the summer but not the winter.

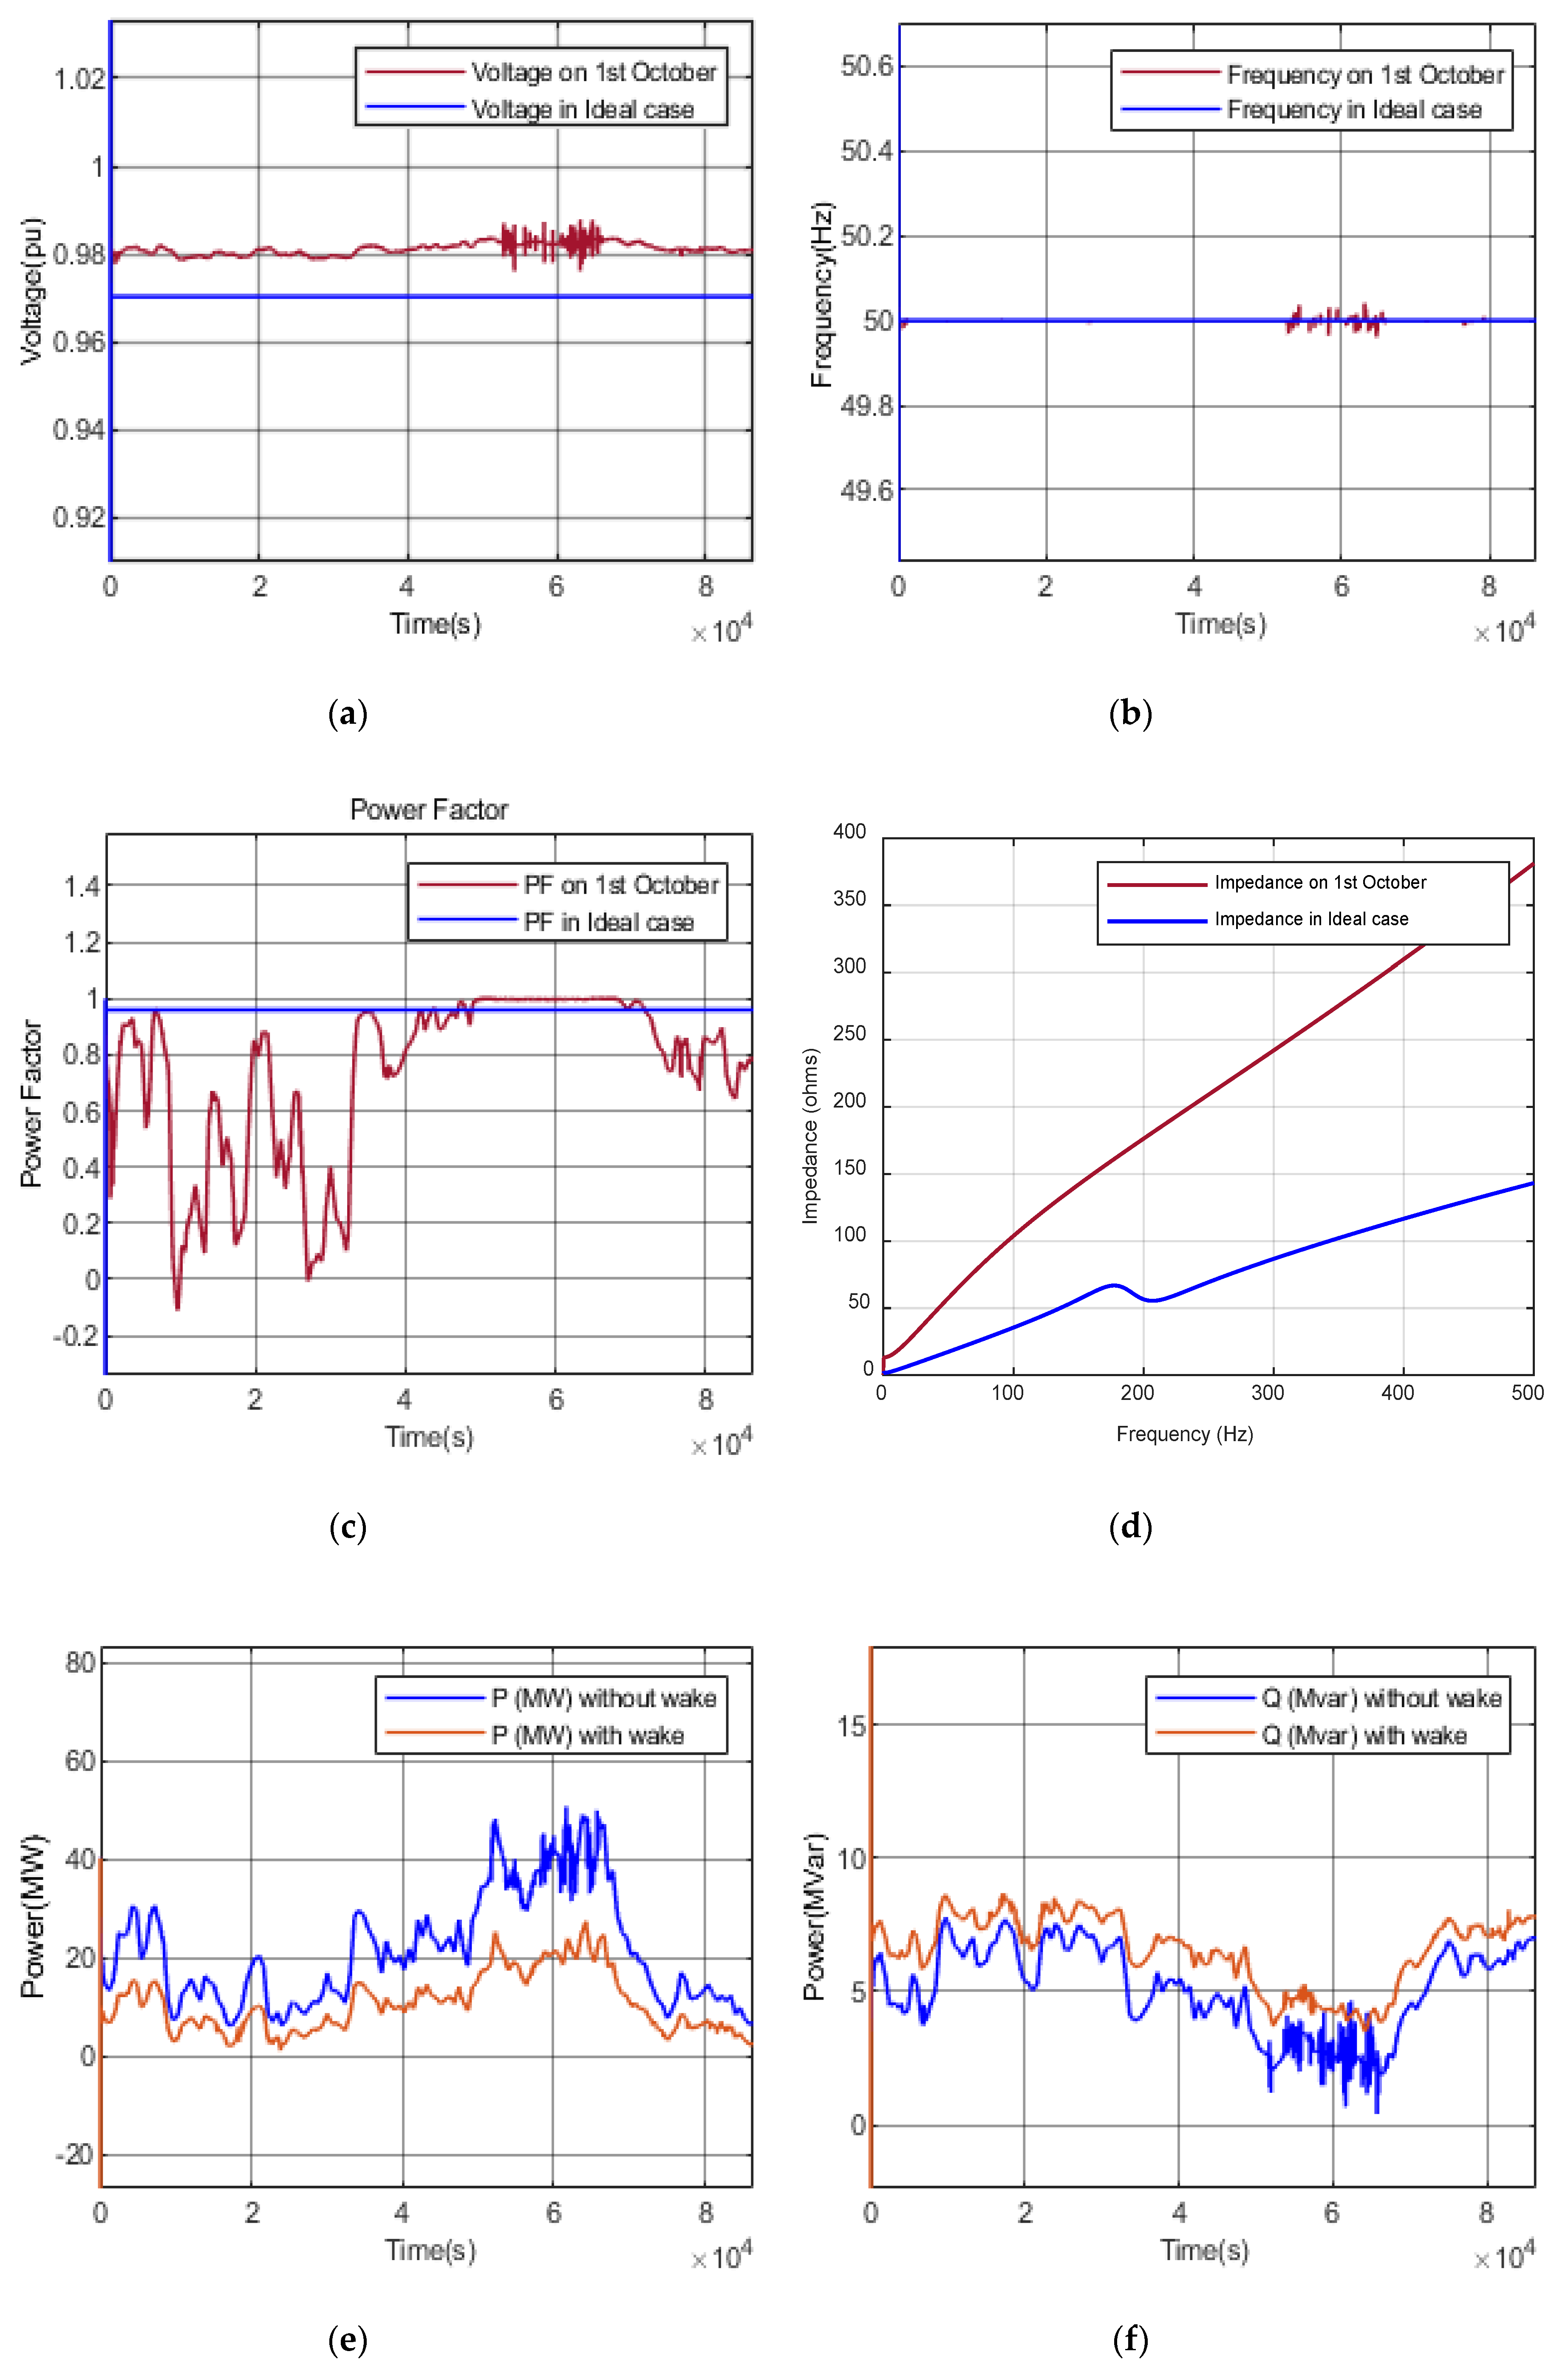
4.1.5. Case 1, Scenario 5: Seasonal Timestamp of October

The autumnal seasonal timestamp was taken on 1 October and the obtained PS parameters were compared with the ideal scenario 1. The voltage revolved around 0.98 pu throughout the day in comparison with 0.97 pu, as shown in Figure 8a. The frequency overlapped with negligible notches at some points, as shown in Figure 8b.
During low wind speed, the PF dropped from the allowable range during higher wind speeds. However, it was well maintained near nominal values and even unified for some interval of time, as shown in Figure 8c. The impedance curve was smooth, with a high impedance of 380 ohms going against 500 Hz, as shown in Figure 8d, which was normal from the perspective of a linear relationship. Figure 8e shows the P deficit caused by a wake varying with changing wind patterns. Figure 8f shows the raised Q absorption because of a 20–40% wake.
Active and reactive power outputs showed significant loss due to wake effects. This loss was aggravated when wind speed was already low and the wake effect was combined with it for a downstream wind farm. Hence, colder seasons in Pakistan’s wind corridor are not favorable for the constructive operation of WFs, as wind speed yields poor output profiles, which is not appreciable.

4.2. Case-2 Evaluation

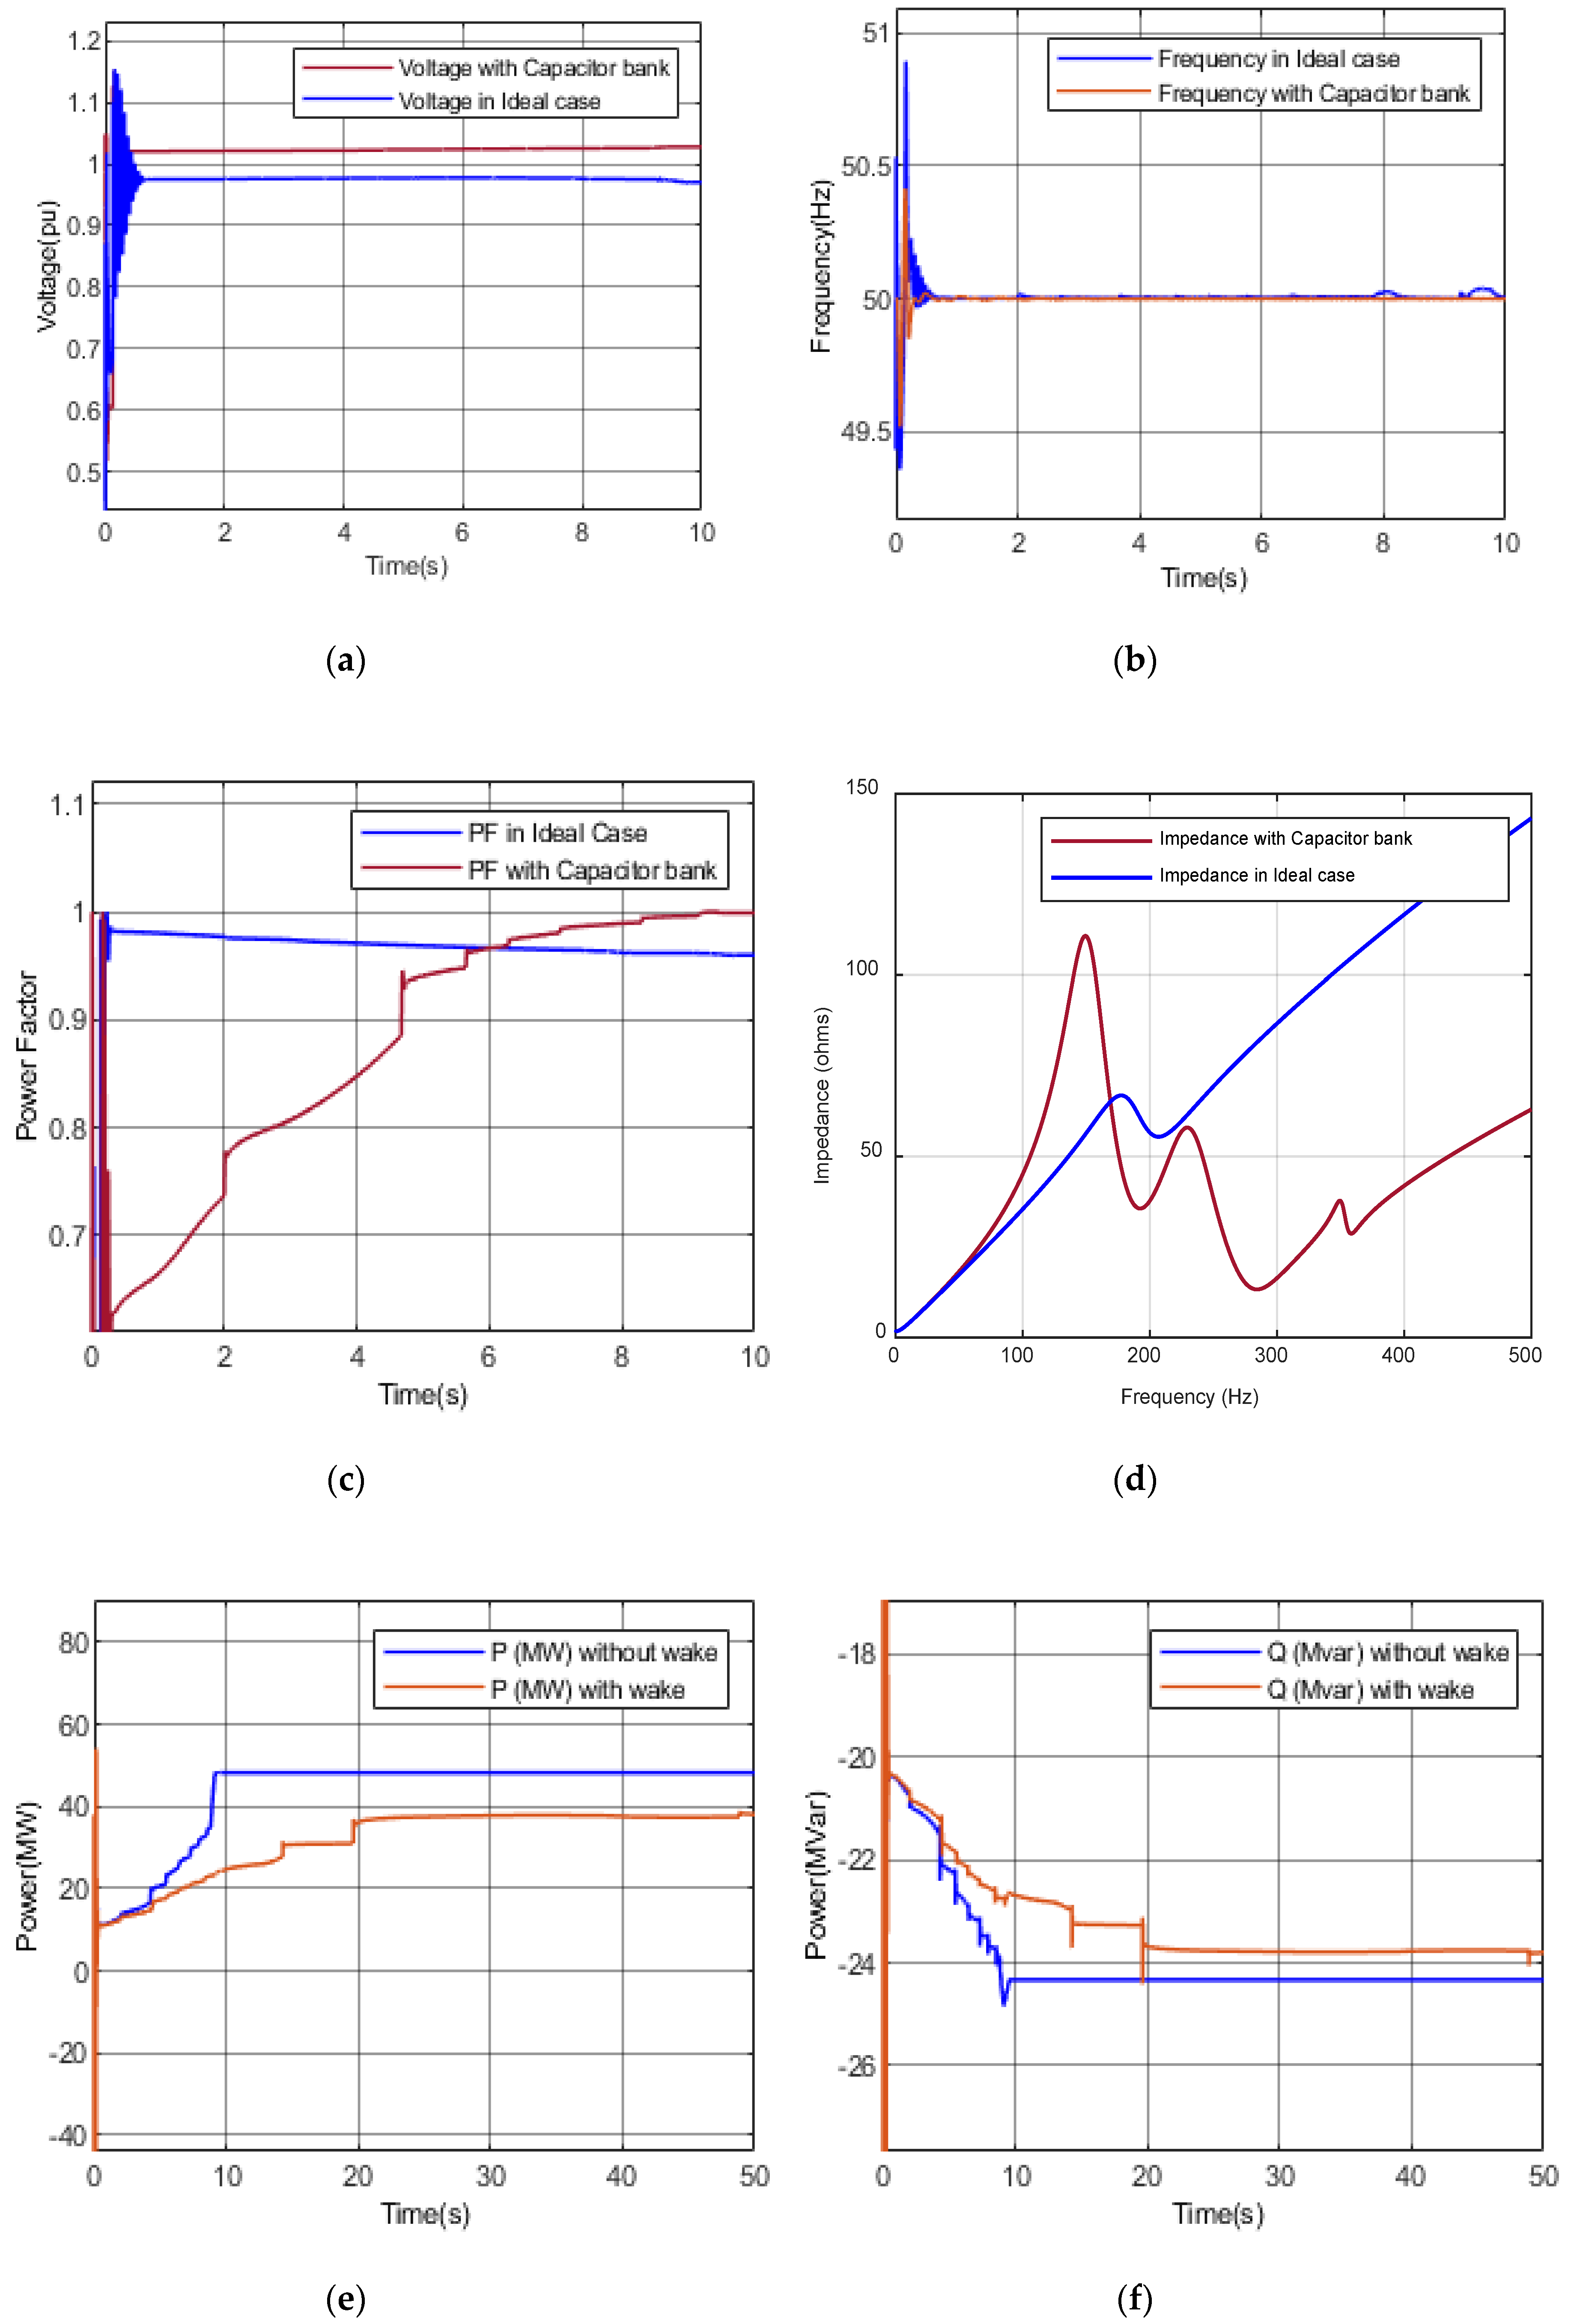
4.2.1. Case-2, Scenario 6: Impact Assessment Considering Capacitor Bank

Scenario 6 featured the capacitor bank utilization to consider wake effects in comparison with the power system parameters in the ideal scenario 1. As shown in Figure 9a, voltage rose by 5.94%, from 0.9704 to 1.028 pu. The frequency transient touched the lower allowable limit of 49.5 Hz, as shown in Figure 9b. PF improved by 4.08%, from 0.9598 to 0.999, as shown in Figure 9c, which was a significant improvement. The impedance curve showed resonance behavior on the 3rd, 5th, and 7th harmonic, as shown in in Figure 9d, among which the 3rd harmonic was of major concern. Resonance behavior due to the capacitor bank proved to be devastating for the power system. Capacitor banks are widely used for Var compensation, as they are the most economical option for Q support; however, if PQ is the main concern, then its application is inappropriate.
A wake formed a significant difference in P and Q when compared with the capacitor bank without wake, as shown in Figure 9e,f. P dropped from 48.25 MW to 38.07 MW, resulting in a power deficit of 21.10%. The Q supply before the wake was 24.33 MVar, which was reduced to 23.81 MVar, showing a decrease of 2.13%. An active power deficit was larger than the reactive power deficit because the wake effect had more influence on the active power output of the wind turbine.

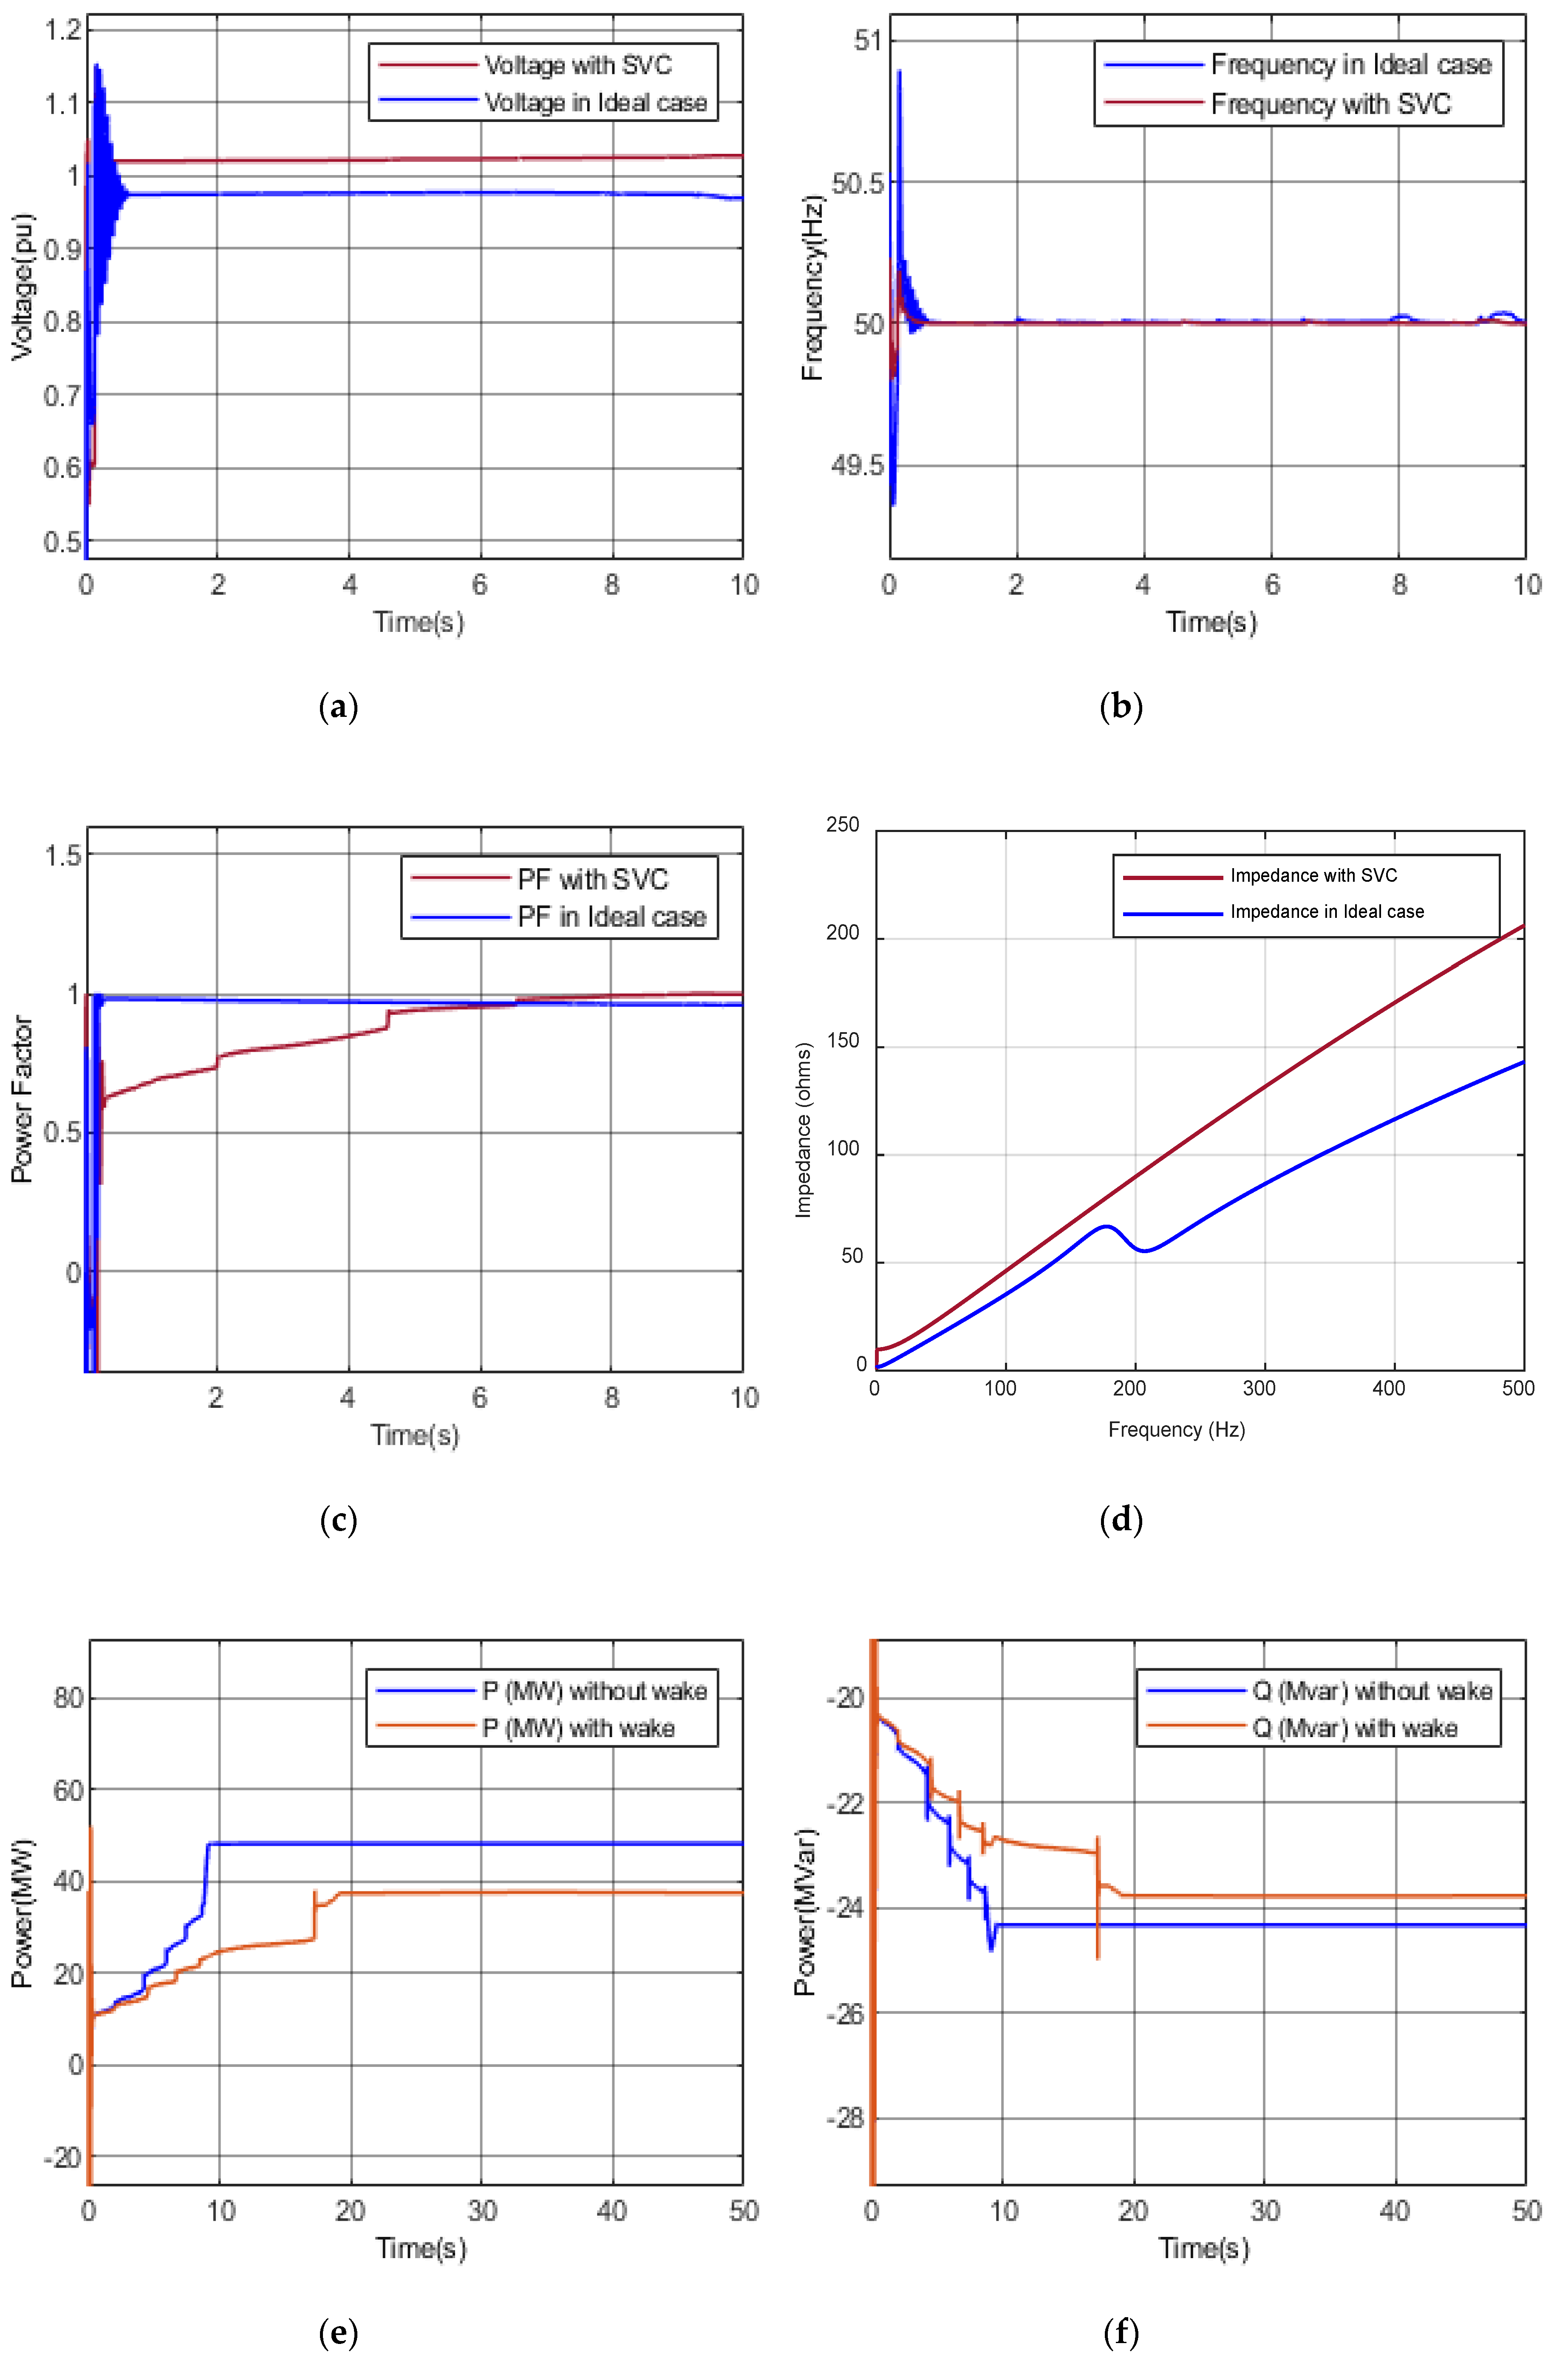
4.2.2. Case-2, Scenario 7: Impact Assessment Considering SVC

Scenario 7 employed SVC. Compared to the ideal scenario 1, the voltage increased up to 5.94%, from 0.9704 to 1.028 pu in Figure 10a. SVC restricted the upper transient to 50.2 Hz from 50.89 Hz, and the lower transient to 49.8 Hz from 49.36 Hz in Figure 10b.
PF remarkably improved from 0.9598 to 0.999 in Figure 10c. The Z vs. F curve showed linear behavior as desired to refrain resonance, as shown in Figure 10d. Figure 10e shows the P-output and Figure 10f shows the Q-output before and after considering the wake effect. P-output dropped from 48.25 MW to 37.55 MW, depicting a drastic decrease of 22.17%. Q supply was reduced from 24.33 MW to 23.77 MW, which was a decrease of 2.30%.

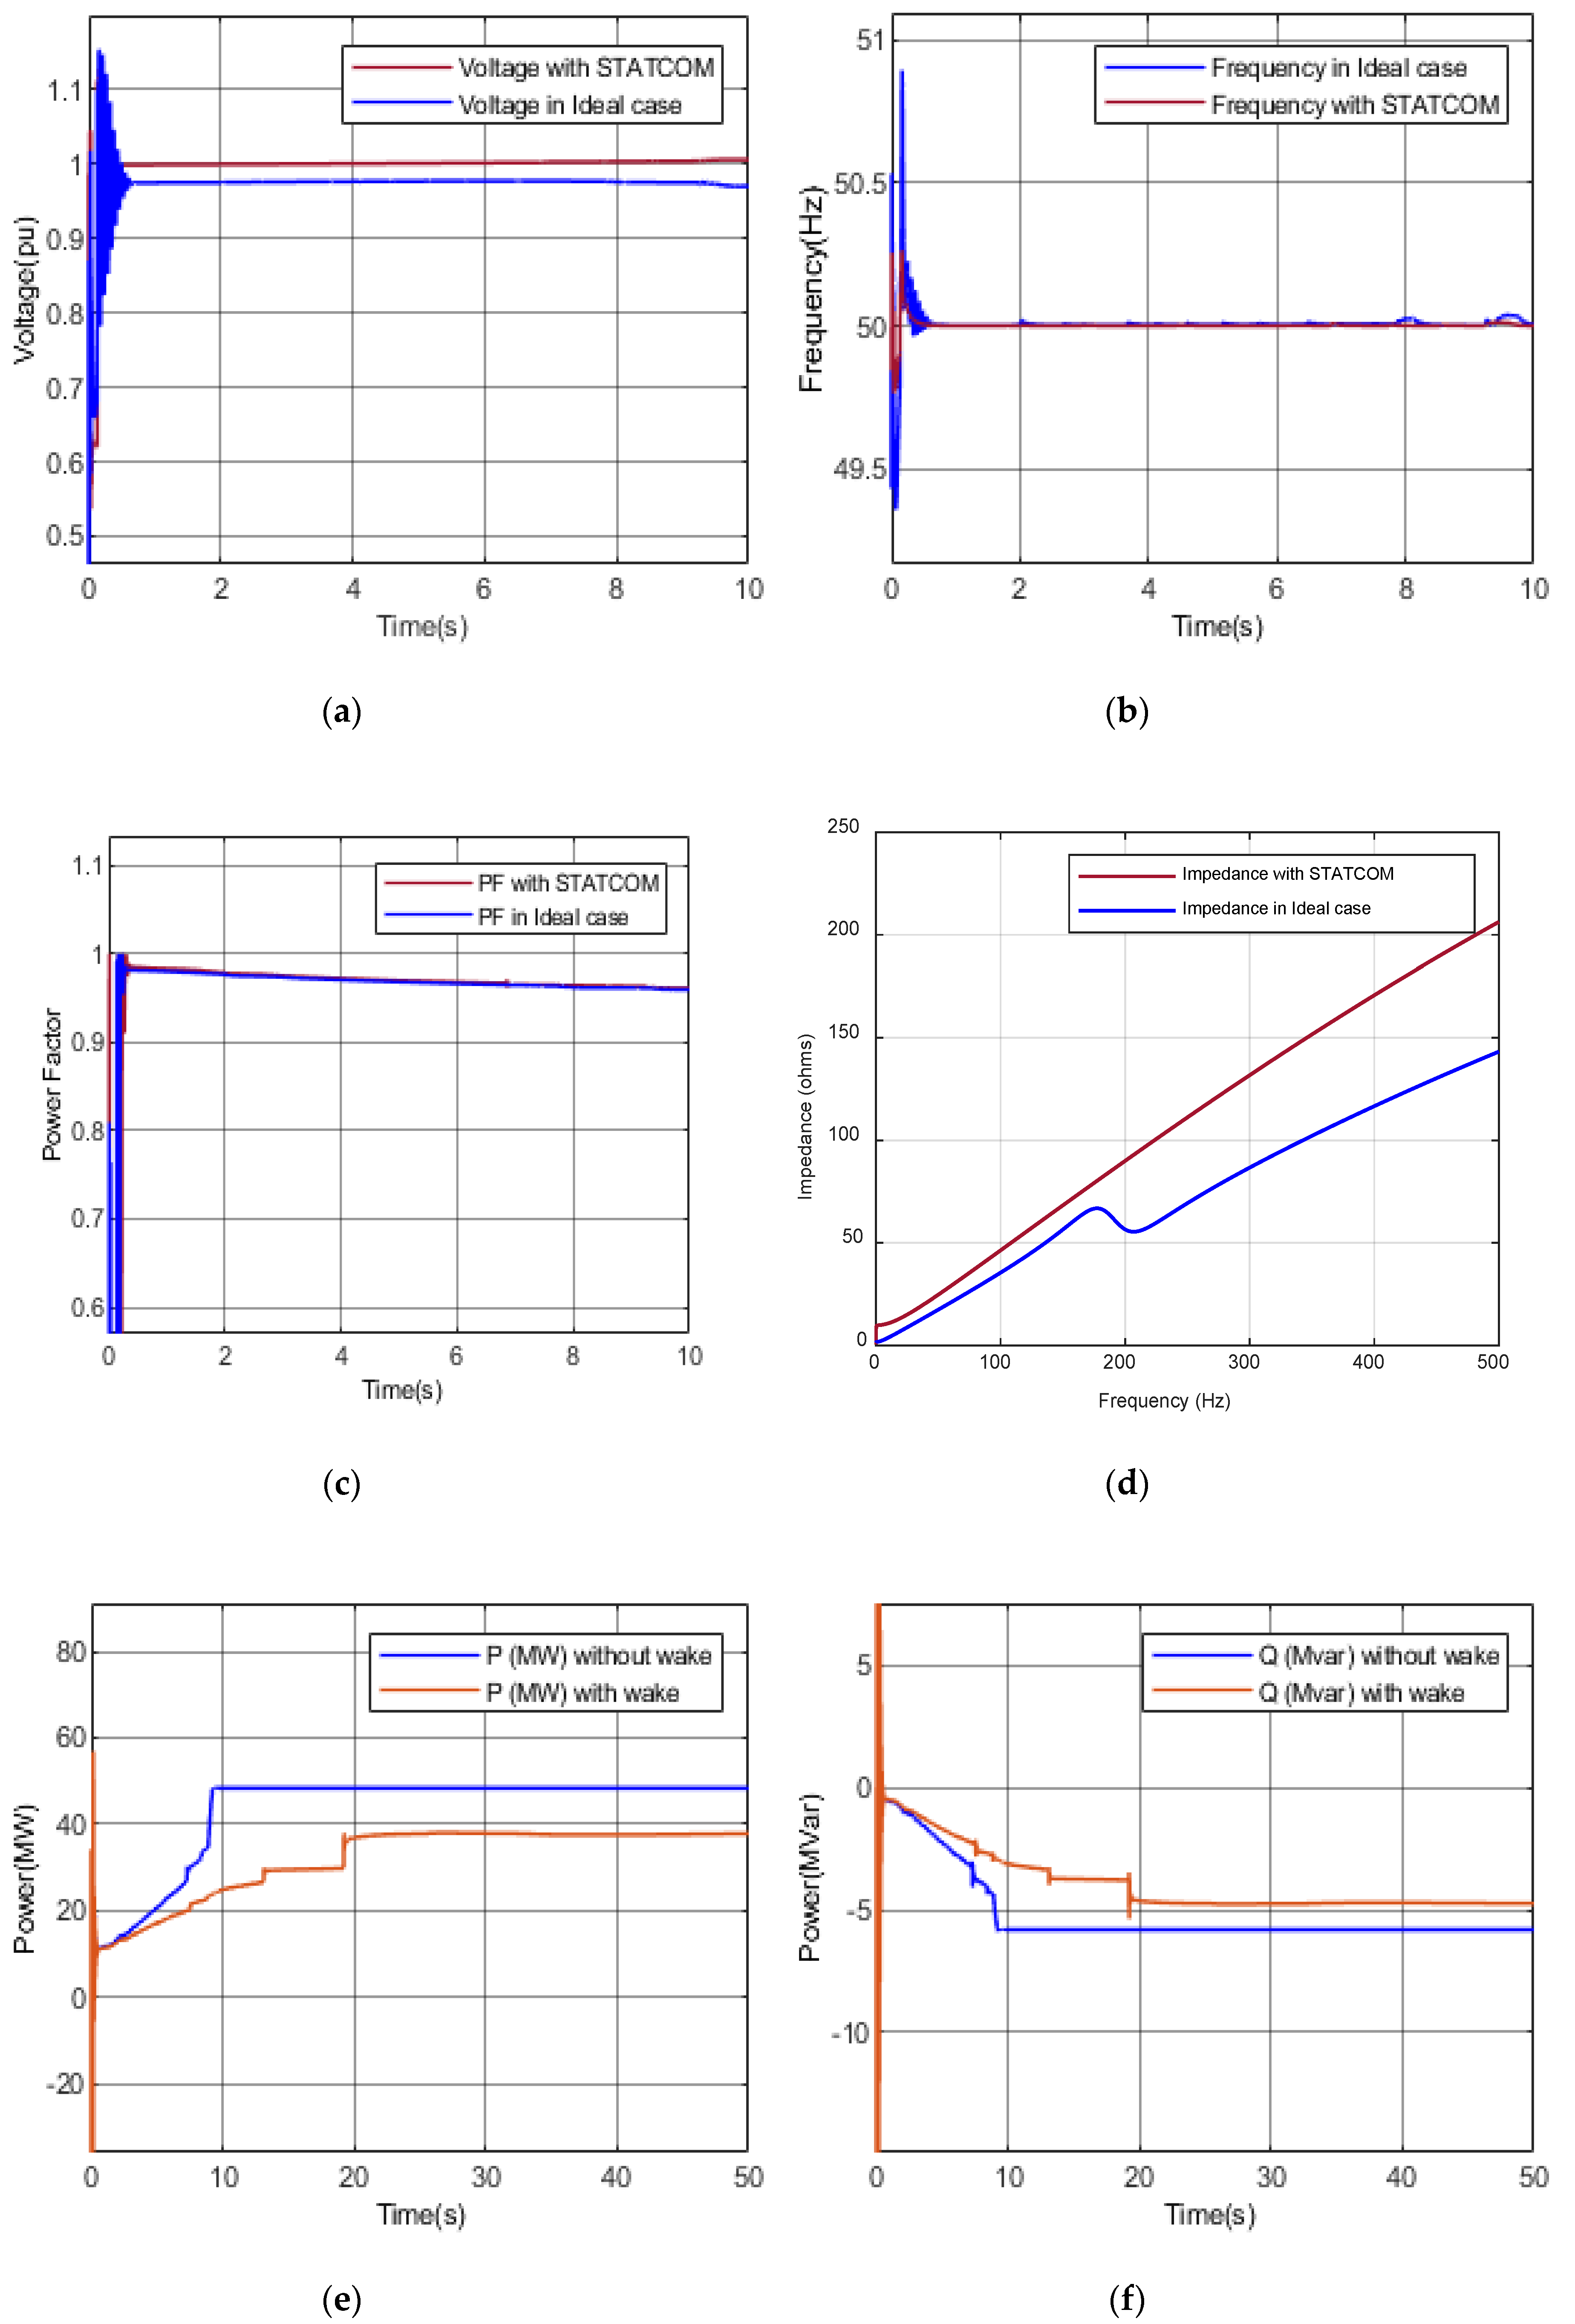
4.2.3. Case-2, Scenario 8: Impact Assessment Considering STATCOM

Scenario 8 considered STATCOM employment and compared its results with ideal scenario 1. The voltage was remarkably regulated to 1.006 pu from 0.9704 pu, as shown in Figure 11a, which was very close to a nominal value of 1 pu. The frequency transient was restricted to 50.26 Hz and 49.76 Hz, as shown in Figure 11b. A considerable improvement in the PF was observed, from 0.9598 to 0.9616, which was because it operated in voltage control mode, as shown in Figure 11c. The impedance was linearized with respect to the frequency, as shown in Figure 11d, which was desired for the healthy operation of a power system.
Figure 11e,f elaborates on the impact of wake effects for both the P and Q-output. P dropped from 48.3 MW to 37.79 MW, depicting a 21.76% decrease. The Q supply was reduced from 5.813 MVar to 4.751 MVar, showing a 18.27% decrease during the wake. Under the influence of the wake, STATCOM was capable of regulating Q in the power system. Resultantly, Var compensation played a role in maintaining the voltage at the PCC. STATCOM and SVC were used for power quality and power system parameter controls. STATCOM performed better than SVC, as it had more flexibility in balancing Q flows.

4.2.4. Case-2, Scenario 9: Impact Assessment Considering SSSC

Scenario 9 was concerned with the employment of SSSC. The obtained results were compared with the ideal scenario 1. The voltage was well maintained up to 1.004 pu, which was very close to the nominal value of 1 pu, as shown in Figure 12a. The frequency transient went beyond the limit and touched 49.35 Hz, as shown in Figure 12b. Hence, it failed to effectively respond to the frequency transients. PF was 0.96 with a minute improvement at 0.9598, as shown in Figure 12c. This was insignificant. The impedance curve against frequency were smooth, showing a linear relationship without any resonance, as shown in Figure 12d.
Figure 12e,f elaborates on the impact of the wake. P dropped from 44.04 MW to 37.16 MW, yielding a 15.62% decrease. The Q supply was reduced from 5.41 MVar to 2.007 MVar, depicting a 62.91% decrease during the wake. One notable point was that SSSC appeared to have a minimum P deficit, yet it produced 44.04 MW without the wake because of its series connection in the network, which was about 4 MW less than other scenarios without the wake. Therefore, the accumulative P deficit became 11.12 MW. This was responsible for the maximum P and Q deficit during the wake, which made it inappropriate for such a scenario. Besides voltage and impedance, it failed to maintain other PS parameters.

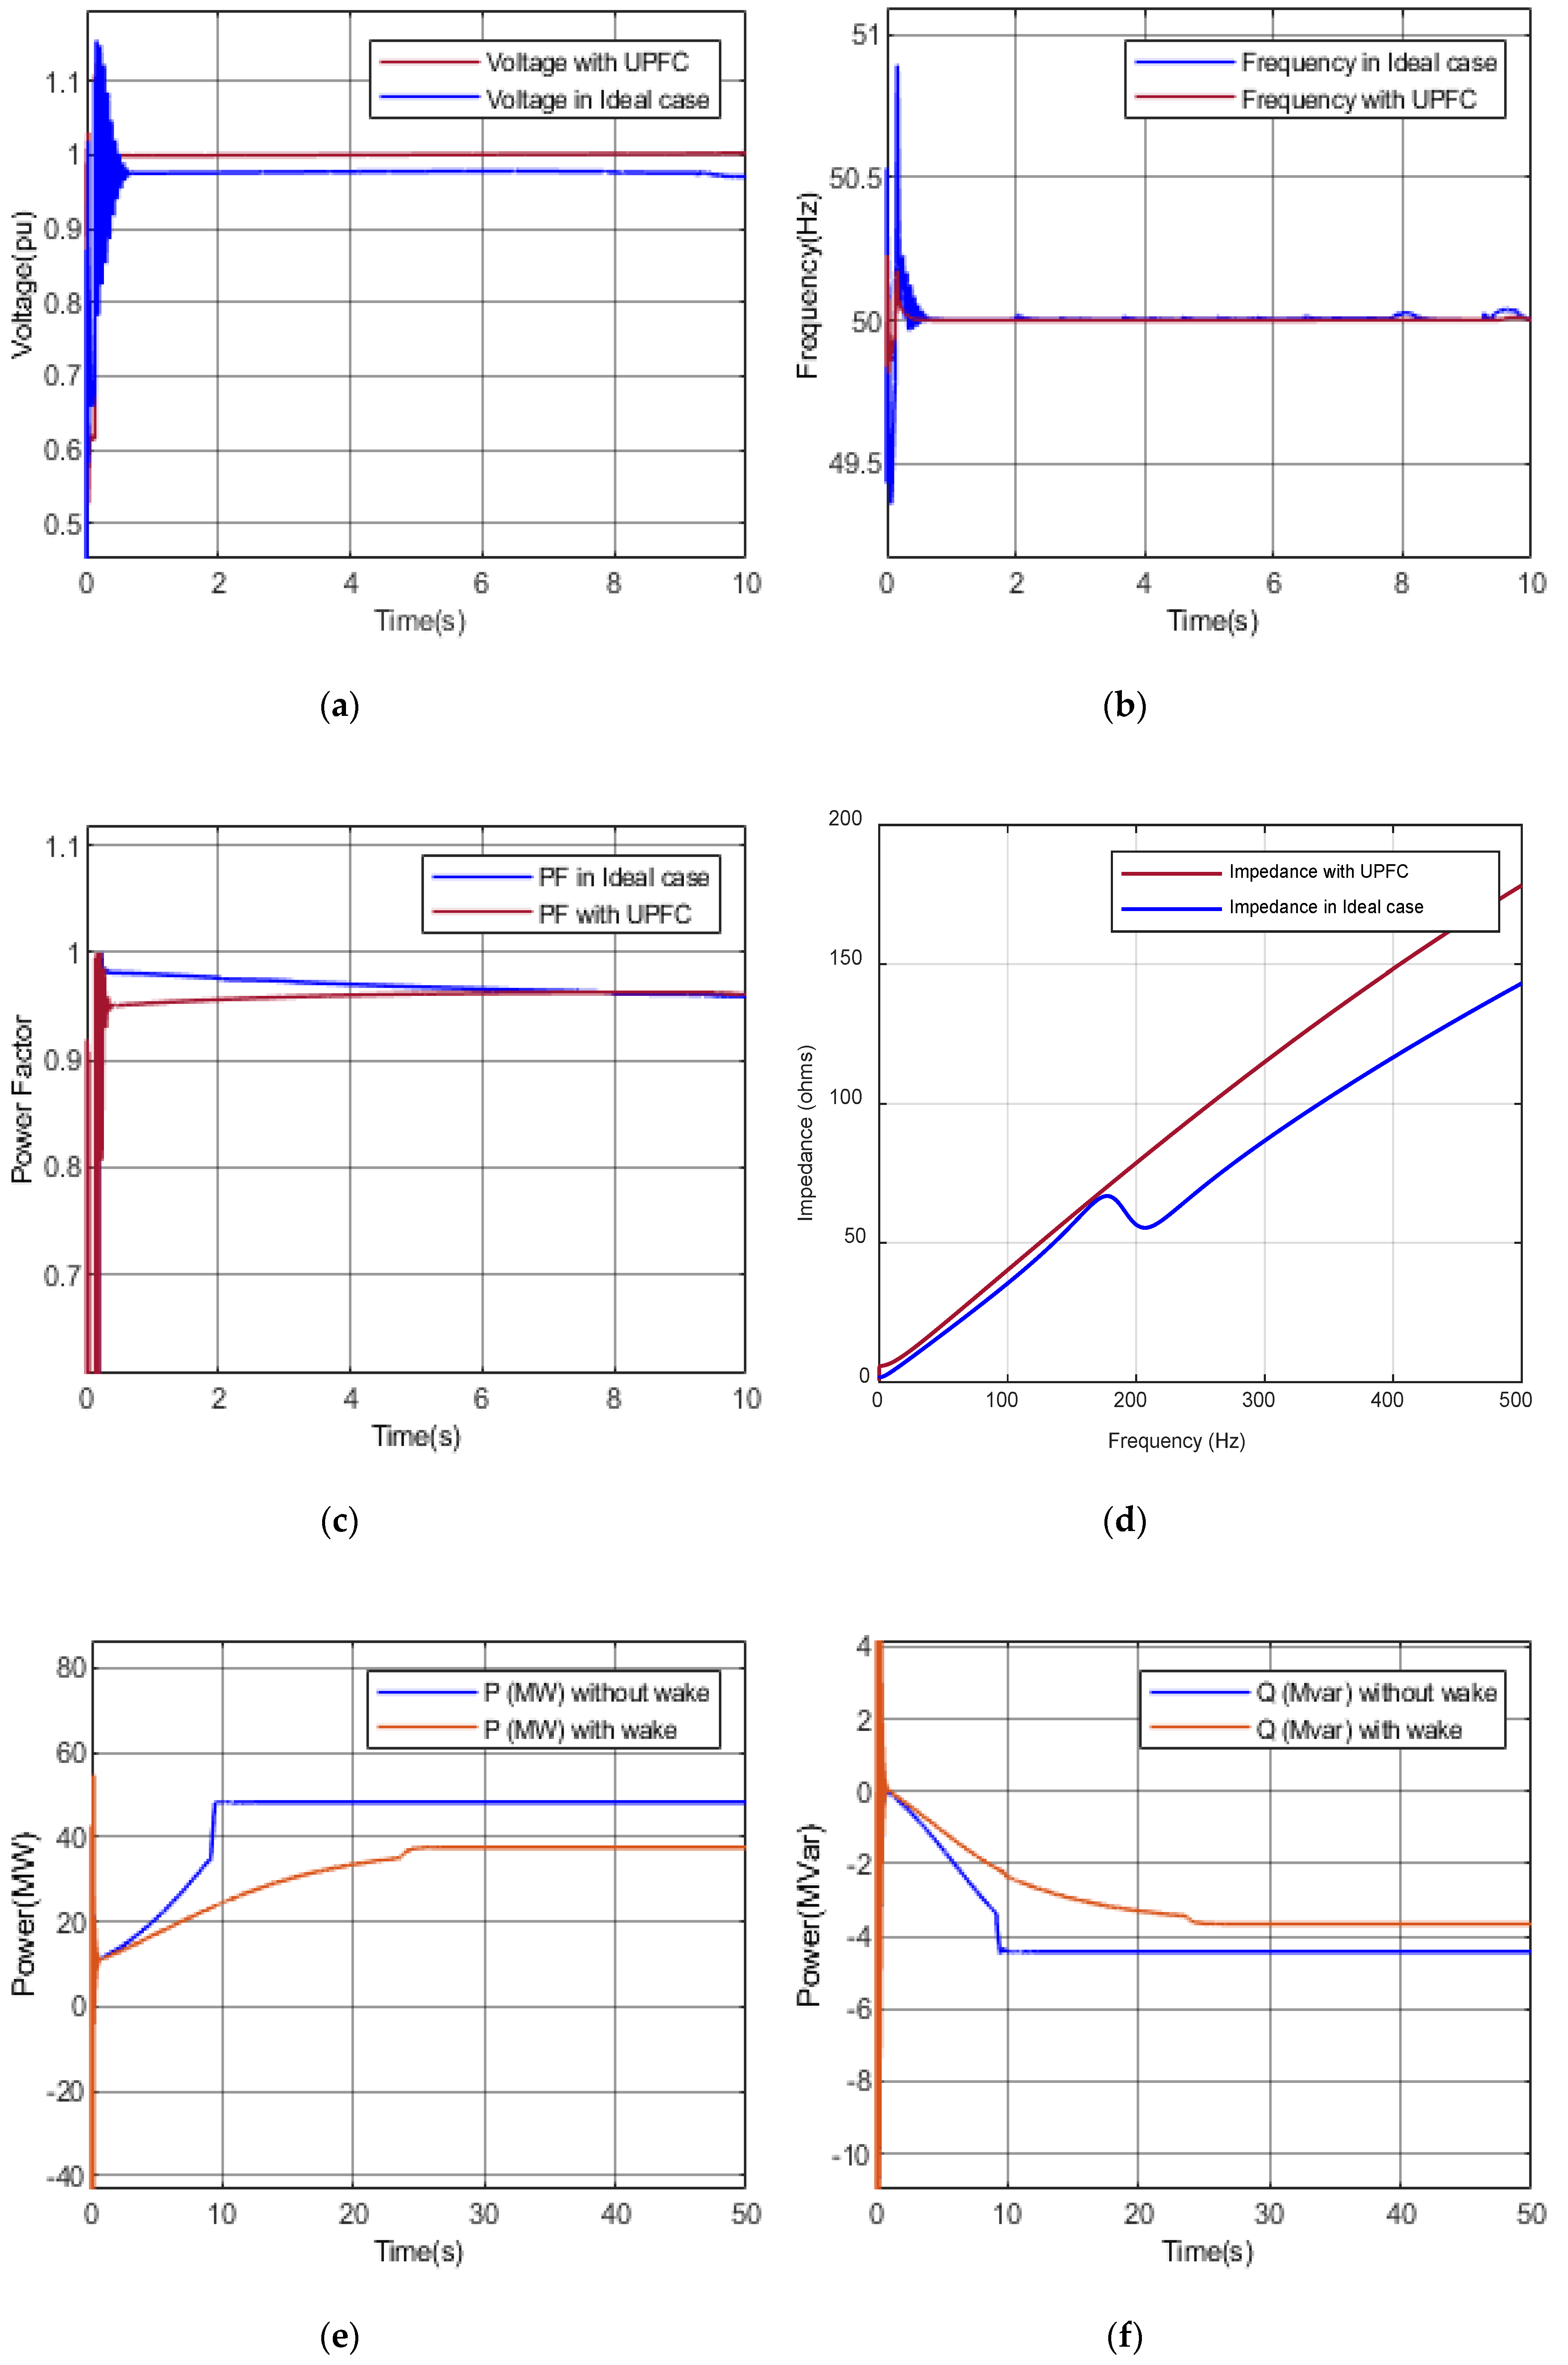
4.2.5. Case-2, Scenario 10: Impact Assessment Considering UPFC

The scenario 10 presents the employment of UPFC for improving PQ indicators and PS parameters. Moreover, the role of UPFC in maintain P and Q flows is observed under the influence of wake. This Scenario is employing UPFC and the obtained results are compared with ideal scenario 1. The voltage was remarkably improved to 1.002 pu, which is very close to the nominal value of 1 pu, as shown in Figure 13a. It is the best response seen in comparison with other compensation devices to maintain voltage at PCC to such a closer value to its nominal one. Upper frequency transient is restricted to 50.17 Hz and lower frequency transient to 49.88 Hz, as shown in Figure 13b. Again in frequency transient, it shows the best transient suppressing response as compared to other devices employed.
PF is improved to 0.9626 from 0.9598, as shown in Figure 13c. Impedance curve against frequency is smooth without showing any resonance as shown in Figure 13d, depicting a linear relationship. Figure 13e,f shows the difference of P and Q created by wake. P drops by 21.01% from 48.3 MW to 38.15 MW. Q supply reduces by 12% from 4.418 MVar to 3.888 MVar. UPFC shows the minimum P and Q deficit under the influence of wake, which proves it to be the best device to cope with the wake effect. Overall, UPFC is performing very well in improving PQ indicators, PS parameters as well as power flows in comparison with all other devices employed in our comparative study.

5. Results Validation

5.1. Comparative Analysis of Results via the Proposed Methodology

The ideal scenario 1 resulted from Case-1 and were compared with the results obtained from Case-2 and respective scenarios 6–10 with the employment of capacitor banks, SVC, STATCOM, SSSC, and UPFC. Every Q compensation device had its own pros and cons. Among these devices, UPFC was found to be the best, followed by STATCOM, SVC, SSSC, and the capacitor bank. We observed that UPFC maintained voltage and frequency nearest to the nominal values. It provided maximum power handling capability by modifying the impedance of the network the least. It also kept the power factor within the permissible range.
From the graphs presented in Case-2, we observed that UPFC as the best at suppressing the transients. The capacitor bank produced harmonic resonance and did not provide flexibility in its operation of maintaining voltage, as this can aggravate the existing over- and under-voltage condition sometimes. STATCOM provided better damping and improved the power quality better than the SVC. SSSC was good at maintaining power flow. UPFC is a combination of STATCOM and SSSC, and hence it provided combined characteristics of both and proved itself a better choice. Table 3 shows the quantitative analysis of PS parameters.
Compensation devices play an important role during wakes by ensuring the provision of Q to wind farms, resulting in strengthening and stabilizing PS. Now that we have reviewed the comprehensive quantitative analysis of P and Q with and without the wake in Cases-1 and 2, we recommend that devices opt to repower the PS with well-maintained PS parameters. Quantitatively, capacitor banks and SVC show a maximum reactive power supply that may, apparently, seem good; however, this is due to the inflexibility of these devices that they deliver the maximum of their values, making the system prone to swells and strong transients. A P deficit was highest in the SVC and lowest in the UPFC. The Q deficit was highest in STATCOM and lowest in UPFC. A compensation device was required, which flexibly injected Q into the PS, as per the system’s requirement. This maintained PS parameters up to nominal values. Therefore, UPFC was the device that collectively provided reactive power support to strengthen and stabilize the PS and maintain PS parameters nearest their nominal values with a minimum of P and Q deficit. For a particular parameter, one device can perform better than the other, or equivalently; however, the point of consideration here was to obtain a device capable of maintaining V, F, Z, and PF as per nominal values along with balanced Q compensation. This was the basis on which we declared UPFC the best compensation device.

5.2. Comparison between the Reference Case and the Proposed Base Case

A case study conducted on HESCO for the integration of individual wind farms was compared with the base case of our proposed study and the integration of three wind farms. In the referred case study [23], they considered wind speed to be constant at 15 m/s, and thus we took wind speed as 15 m/s for our proposed base case scenario.
The results for various parameters for both case studies are compared in Table 4. It was observed that an increasing number of wind farms raised the PCC voltage, which thus enhanced the power system’s stability. On the other hand, because of increased reactive power absorption of wind farms from the power system, PF fell at PCC. An increased number of wind farms was also responsible for greater THD. However, Case-2 showed that after compensation with UPFC, the voltage profile was followed by a sustained frequency profile. In addition, impedance and PF were modified and improved.

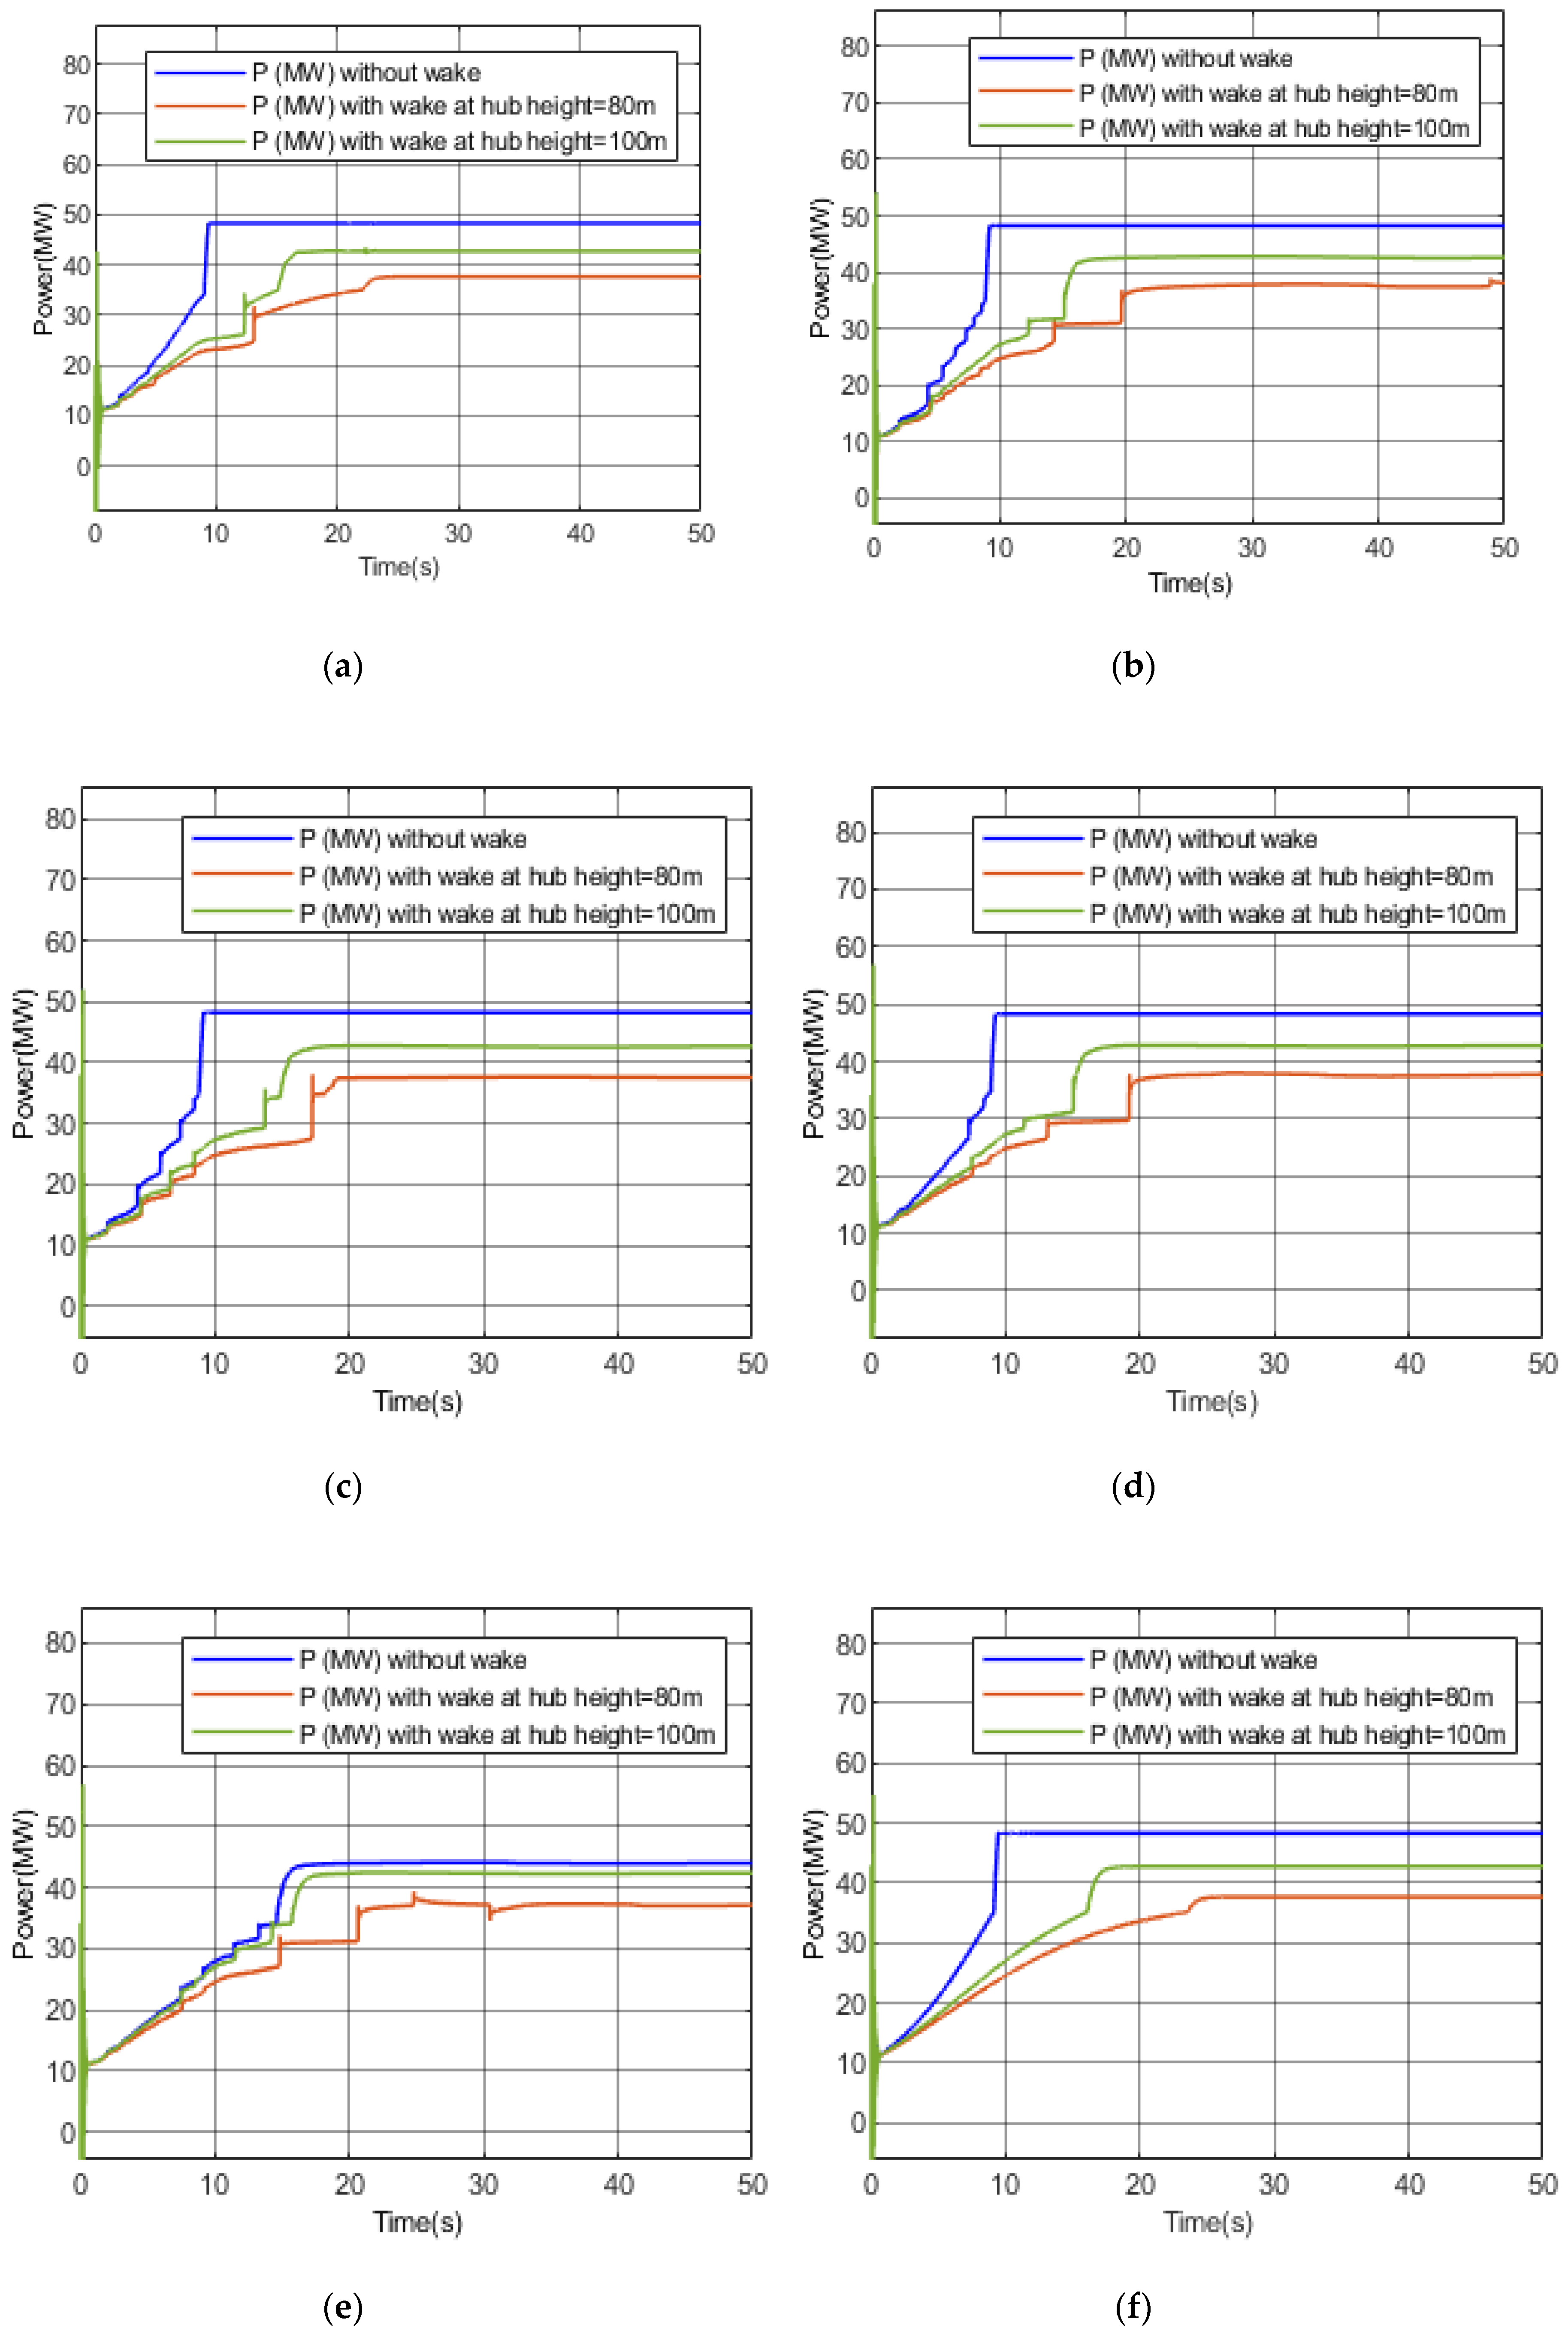
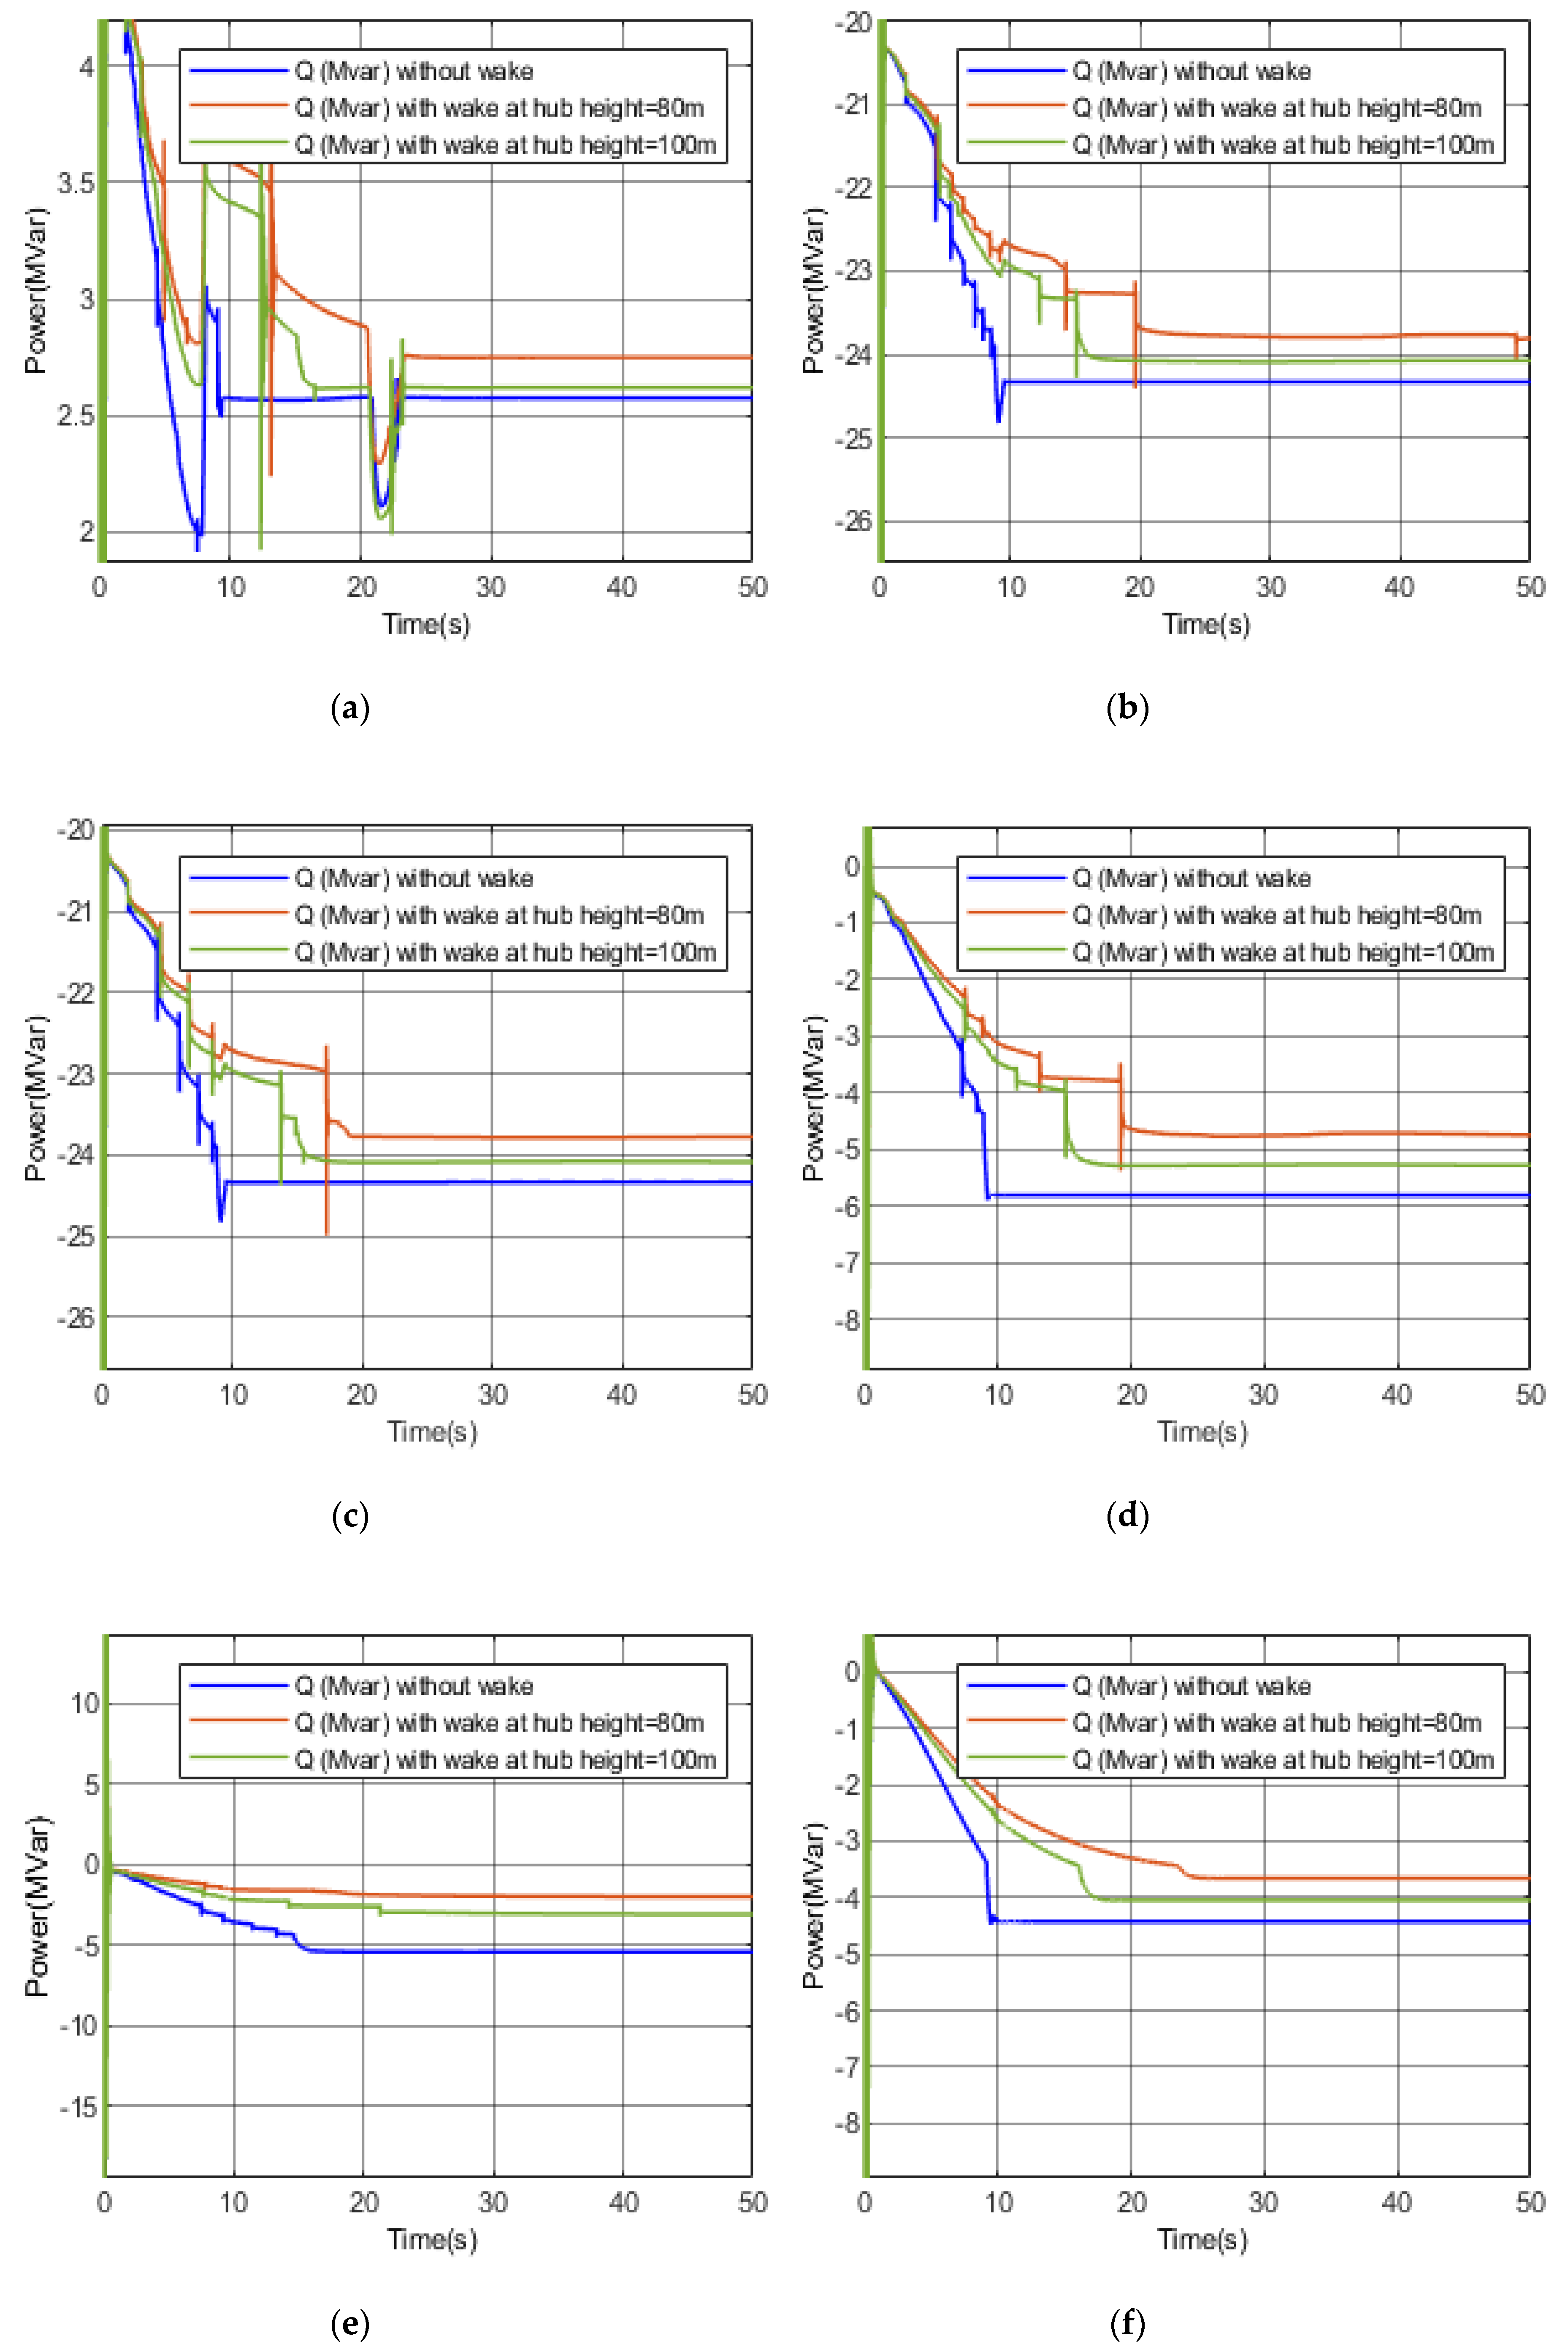
5.3. Special Case by Increasing the Hub Height of Wind Turbines

A former study in [35] presented an approach to minimize the impact of the wake by increasing the hub height of WTs. This concept was utilized for P and Q repowering in our research study. If the hub height increased from 80 m to 100 m, a considerable part of the hindrance was caused by upstream wind turbines, which could be avoided. Therefore, the wind speed profile became more favorable for the extraction of maximum of energy during the wake, which could overcome significant power deficits.
Figure 14 shows a comparison of P. Figure 15 shows a comparison of Q in various special case scenarios. By increasing the hub height, more wind potential was available to wind turbines for more P extraction. When DFIGs were installed, P increased and the Q supply also increased via turbines. P and Q were both dependent on the wind speed profile. The greater the wind speed, the greater the P and Q outputs were.
Table 5 shows P and Q deficits at increased hub heights of 100 m. Table 3 and Table 5 can be compared to find a reduction in P and Q deficits after increasing hub height to 20 m. The P deficit of 5.07 MW, 4.59 MW, 5.17 MW, 4.98 MW, 5.18 MW, and 4.63 MW was observed for scenario 1 and 6–10 by increasing hub height from 80 m to 100 m. Similarly, the Q deficit of −0.13 MVar, −0.27 MVar, −0.31 MVar, −0.531 MVar, 1.063 MVar, and 0.30 MVar was observed for scenario 1 and 6–10, respectively. This study established that by increasing WT hub height and collectively employing compensation devices helps recover a significant portion of the power deficit caused by the wake, thus providing strong reactive power support that results in efficient and stable PS.

6. Conclusions and Future Works

The conducted study characterized issues related to LSWF on a broader perspective and provides mitigation strategies to overcome or suppress such issues. Seasonal timestamps were considered for real-time analysis. The impact of the wake was considered to replicate real-time conditions and to understand the power deficit caused by wake effects. We performed a performance analysis for compensation devices in order to evaluate the best compensation device for improving PQ and PS parameters. We also sought to repower the WF during the wake with a 20 m increase in hub height. The major conclusions drawn from this research are as follows:
  • The increasing number of wind farms disturb PQ and PS parameters. For three wind farms integrated at optimal conditions, the voltage dropped to 0.97 pu. Further, the frequency transient went beyond an allowable range of 49.5–50.5 Hz, which can be observed with resonance behavior and decreased PF of up to 0.959. The cumulative active power output for three wind farms was 151 MW with the absorption of 7.05 MVar from PS without any compensation device.
  • Seasons affect the output power of wind farms differently due to varying wind profiles. We found wind speed to be highest during the summer and lowest during the winter.
  • The reactive power demand for wind farms was its lowest during the summer due to higher wind speeds and highest during the winter due to least wind speeds.
  • In winter, P supply was the lowest minimum and sometimes was cuts off. Q absorption was also the highest during winter, touching the value of 13 MW, which made it the worst season for wind farm operations. To avoid this burden, wind farms should be kept off during the winter, as they absorb reactive power and are not able to supply a considerable amount of P.
  • The wake as responsible for a significant active power deficit. It was also responsible for increased Q absorption. The P deficit for FFCEL was 10.65 MW for a maximum wake of 15%. The Q deficit for FFCEL due to wake effect was +0.174 MVar.
  • Q repowering was performed with various compensation devices. UPFC was found to be best for Q repowering along with maintaining PS parameters at PCC. However, our utmost target was to achieve a device that maintained V, F, Z, and PF at PCC for the nearest nominal values, which were of a major concern. Hence, UPFC maintained V up to 1.002 pu, suppressing frequency transient in the range of 49.88–50.17 Hz and avoiding any resonance while maintaining the power factor in an allowable range.
  • A special case study was performed by repeating ideal scenario 1 for both Case-1 and Case-2 scenarios with increasing WT hub height from 80 m to 100 m at FFCEL. A considerable amount of P repowering was seen during the maximum recovery of deficits due to a wake that was up to 48%.
Future studies should extend this work by including HVDC links into the PS with renewable energy generation systems. Moreover, a techno-economic analysis of the study with various technologies should also be presented.

Author Contributions

The authors S.R.A., S.A.A.K., M.N., A.J., S.R.N., K.U., T.-u.-R.K. and D.R.S. have presented the proposed study. The contributions of the authors are as follows: Conceptualization, S.R.A., S.A.A.K. and A.J.; methodology, S.R.A. and S.A.A.K.; software, S.R.A.; validation, S.R.A. and S.A.A.K.; formal analysis, K.U. and S.R.N.; investigation, S.R.A. and S.A.A.K.; resources, A.J., T.-u.-R.K. and D.R.S.; data curation, A.J. and K.U.; writing—original draft preparation, S.R.A. and S.A.A.K.; writing—review and editing, M.N.; visualization, A.J. and S.R.N.; supervision, S.A.A.K.; project administration, S.A.A.K. and D.R.S.; funding acquisition, M.N. All authors have read and agreed to the published version of the manuscript.

Funding

This research was conducted in the United States-Pakistan Center of Advanced Studies in Energy (USPCAS-E), National University of Science and Technology (NUST), Islamabad, Pakistan. The APC is funded by Karlstad University, Sweden.

Acknowledgments

This research is conducted and supported by USPCAS-E NUST. The authors are grateful and acknowledge the technical support provided by the subject wind power companies, especially FFCEL. The authors are also grateful to planning section of NTDC, Pakistan for utility data.

Conflicts of Interest

The authors declare no conflict of interest.

List of Abbreviations

dDirect axisSCCShort Circuit Capacity
DFIGDoubly Fed Induction GeneratorSCIGSquirrel Cage Induction Generator
DGDistributed GenerationSSSCStatic Synchronous Series Compensator
FFrequencySTATCOMStatic Synchronous Compensator
FACTSFlexible AC Transmission SystemsSVCStatic Var Compensator
FFCELFauji Fertilizer Company Energy LimitedTCRThyristor Controlled Reactor
FRTFault Ride ThroughTGFThree Gorges First
GSCGrid Side ConverterTHDTotal Harmonic Distortion
HESCOHyderabad Electric Supply CompanyTNTransmission Network
IECInternational Electro-technical CommissionTSCThyristor Switched Capacitor
LSWFLarge Scale Wind FarmsUPFCUnified Power Flow Controller
LVRTLow Voltage Ride ThroughVUnified Power Flow Controller
NEPRANational Electric Power Regulatory AuthorityVGridGrid Voltage
PActive PowerVPCCVoltage at PCC
PCCPoint of Common CouplingVSCVoltage Source Converter
PEPower ElectronicsWECSWind Energy Conversion Systems
PFPower FactorWFWind Farm
PQPower QualityWPPWind Power Plant
PSPower SystemWRSGWound Rotor Synchronous Generator
Q/VARReactive PowerWTWind Turbine
qQuadrature AxisWTGWind Turbine Generator
RERsRenewable Energy ResourcesXTNReactance of Transmission Network
RSCRotor Side ConverterZImpedance
RTNResistance of Transmission NetworkZEZorlu Energi
sSlipZTNImpedance of Transmission Network

Appendix A

Appendix A.1. Limitations in the Reviewed Work

The literature review in the introduction section is shown in Table A1. The proposed approach aims to bridge the limitations across all reviewed categories mentioned in the literature review.
Table A1. Literature review in this paper.
Ref:ABCDEFMiscellaneous
[1] Storage and PE control application
[2] -
[3] Storage and PE control application
[4] -
[5] Economics
[6] -
[7] Forecasting, policy, and economics
[8] -
[9] Forecasting
[10] -
[11] Economics
[12] Economics
[13] Policy and economics
[14] Economics
[15] Economics
[16] Economics and environment
[17] -
[18] -
[19] -
[20] Economics
[21] -
[22] -
[23] -
[24] -
[25] -
[26]
[27] -
[28] -
[29] -
[30] -
[31] -
[32] Economics
[33] -
[34] -
[P]Comprehensive technical study

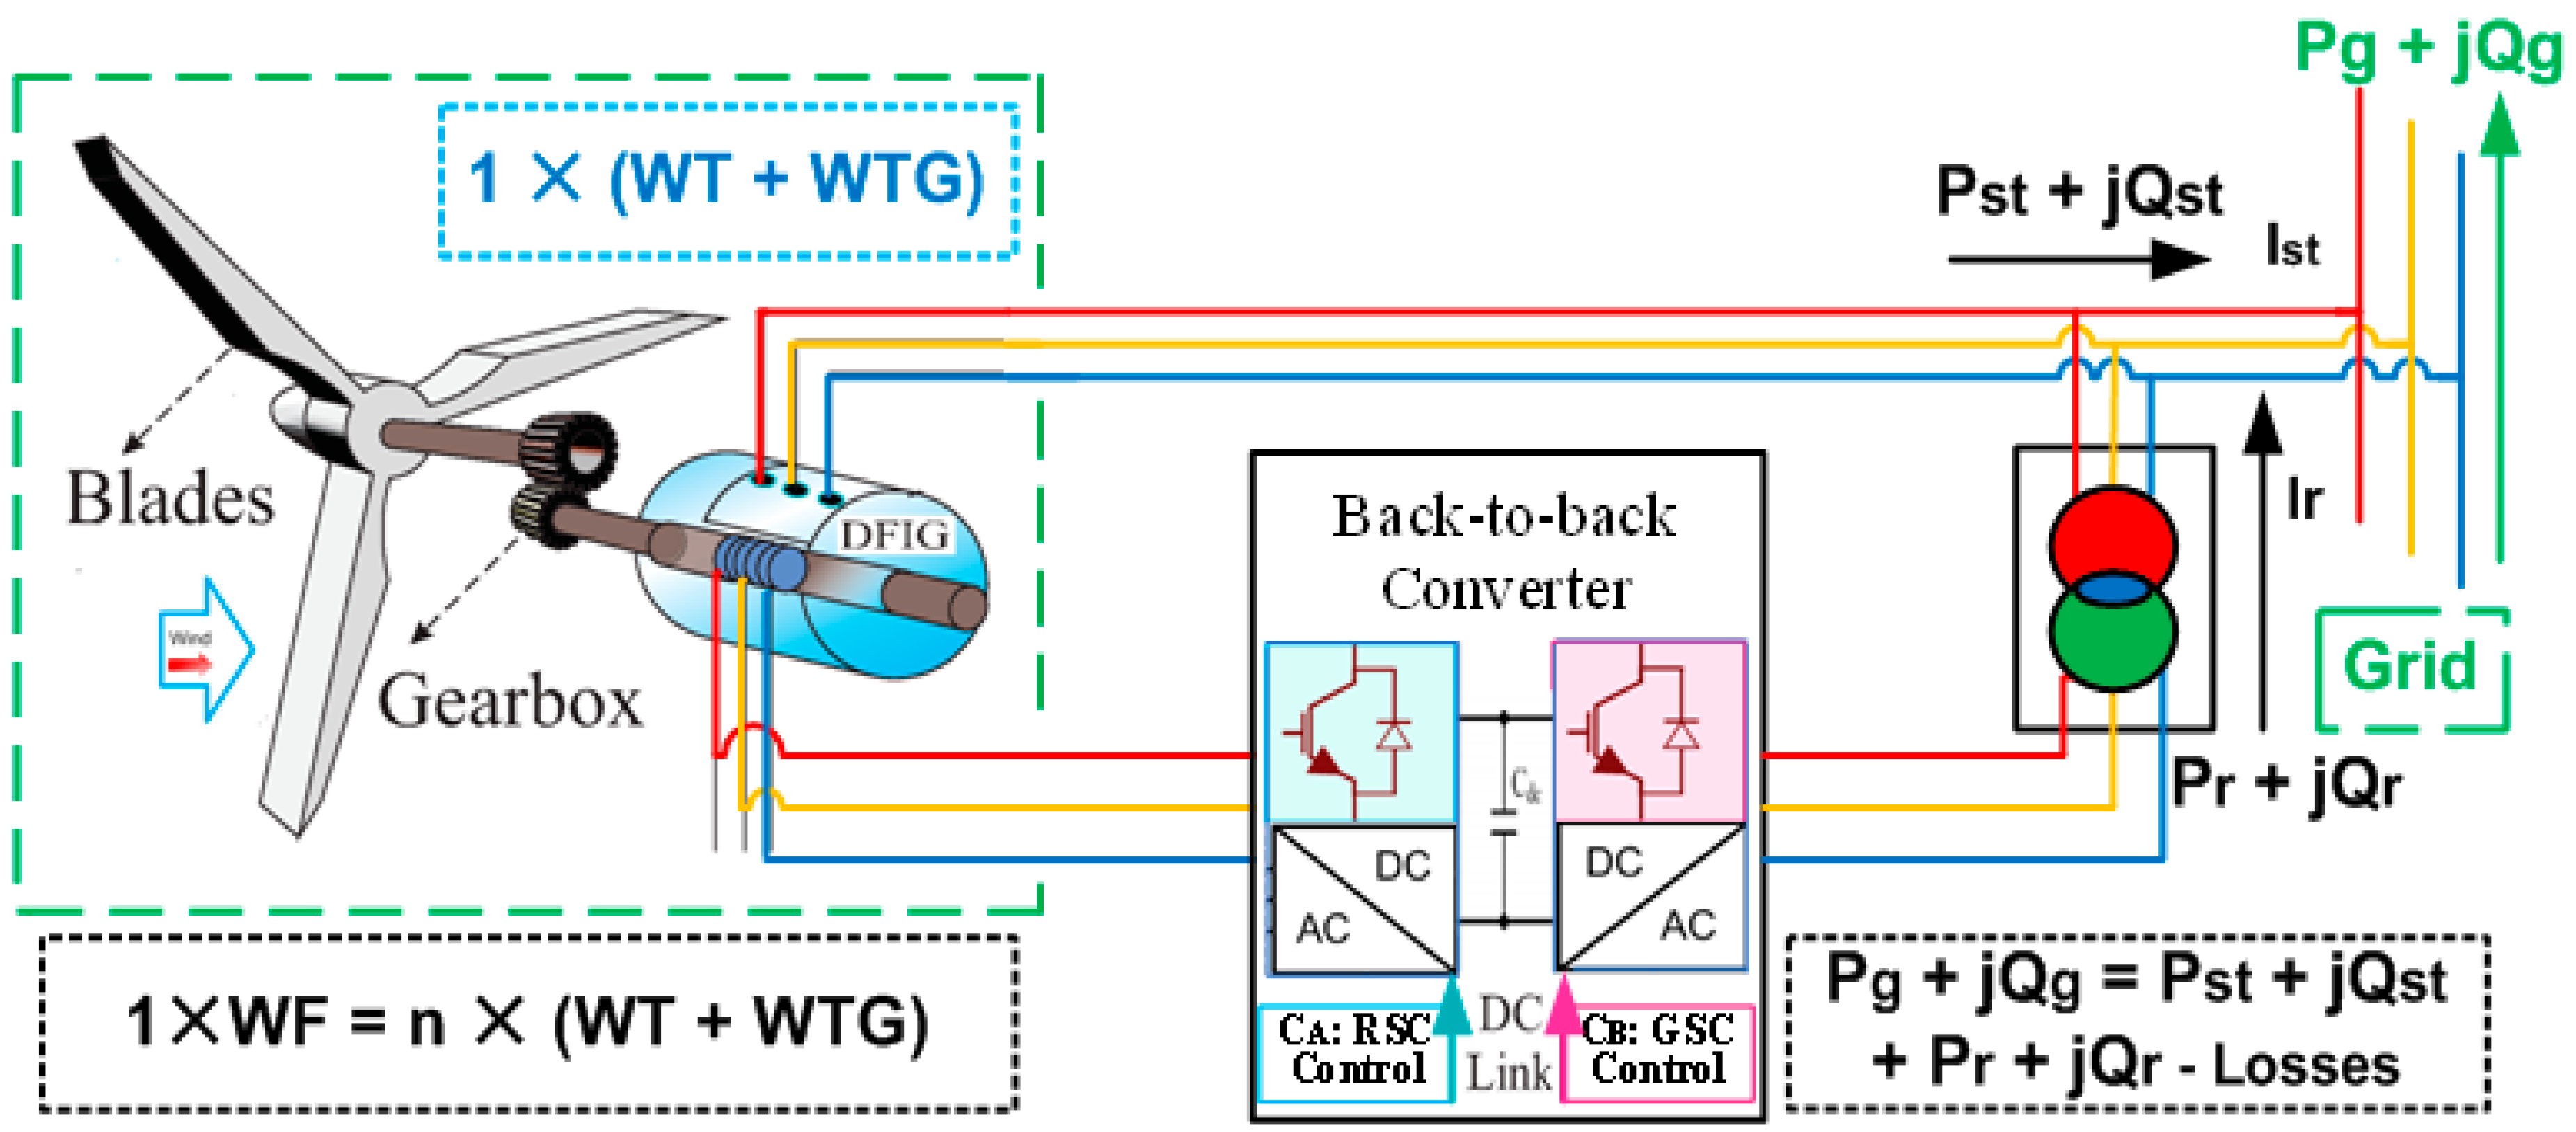
Appendix A.2. Doubly Fed Induction Generator (DFIG) in the Test Setup

The mathematical background of the doubly fed induction generator in the test setup is presented in Appendix A.2. DFIG dominates the WECS of the test setup in comparison with the fixed speed and other genres of wind turbines. DFIG is a type of asynchronous generator that has the capability of providing power to the grid from both rotor and stator. Its rotor is fed by alternating both the rotational speed of the rotor n r and frequency of the alternating current fed to the rotor f r . Therefore, it collectively decides the rotational speed of the magnetic field n φ , r passing through the stator windings, which further determines the stator frequency f s t of the induced alternating voltage across the stator windings. When the direction of n r is in the direction of   n φ , r , they are added, as shown in Equation (A1). Thus, the frequency f s t of the induced alternating voltages in the stator winding becomes:
f s t = n r × P 120 + f r
Similarly, when the direction of n r and direction of n φ , r are in opposite directions, they are subtracted as shown in Equation (A2) and f s t of the induced alternating voltages in the stator winding is:
f s t = n r × P 120 f r
In short, f s t depends upon n φ , r passing through the stator and this n φ , r depends upon n r and f r . Unlike rotor windings, the stator windings are directly connected to the grid [1]. Hence, f s t is desired to be constant, equal to f g , as shown in Equation (A3).
f s t = f g
Due to varying wind speeds, n r changes continuously. We adjust f r continuously in response to varying n r to maintain f s t as constant, equal to f g as shown in Equation (A4).
f r = f g n r × P 120
DFIG is capable to absorb and supply reactive power based on its mode of operation [2]. In a sub-synchronous mode where n r is less than synchronous speed, it absorbs reactive power from the grid. In an over-synchronous mode where, n r is greater than synchronous speed, it supplies Q to the grid. Power relationships of DFIG are of the utmost importance. Power relationships are given in [23] for the ideal case. After modification, mechanical input and electrical output power relationship considering losses are shown in Equation (A5):
P m = P s t + P r P l o s s , s t P l o s s , r
Air gap power P a g considering stator losses becomes:
P a g = P s t 3 I s t 2 R s t
Slip power P s l i p considering rotor losses becomes:
P s l i p = P r 3 I r 2 R r
Slip Power P s l i p   and air gap power P a g   can be related as:
P s l i p = s P a g
We can express mechanical power P m in terms of slip power P s l i p and air gap power P a g :
P m = P a g + P s l i p
From Equations (A8) and (A9), we have:
P m = ( 1 s ) P a g
Eventually, the total power delivered to the grid becomes:
P g = P s t + P r P l o s s , s t P l o s s , r

Appendix A.3. Control Mechanism of Doubly Fed Induction Generator (DFIG)

The control mechanism of the doubly fed induction generation is shown in Figure A1 in the section of Appendix A.3. As shown in Equation A8, the converter capacity of DFIG is found by a controllable range of slip (“s”) subjected to mechanical constraints. The converters themselves have a pivotal role in controlling DFIG-based WT, as shown in Figure A1. The rotor side converter (RSC) employs the control strategy to realize speed/torque control, PF, and/or voltage control. The grid side converter (GSC) offers a way for rotor power to external grid at unity power factor along with DC-link voltage support and Q in-feed. Direct (d) and quadrature (q) axis frame of reference represents DFI, and the system frequency is 50 Hz. The current-mode control strategy is employed in simulations, the d-axis component from rotor current controls terminal voltage, and the q-axis component controls DFIG’s torque and P.
Figure A1. DFIG-based WT configuration in LSWF.
Energies 13 05513 g0a1

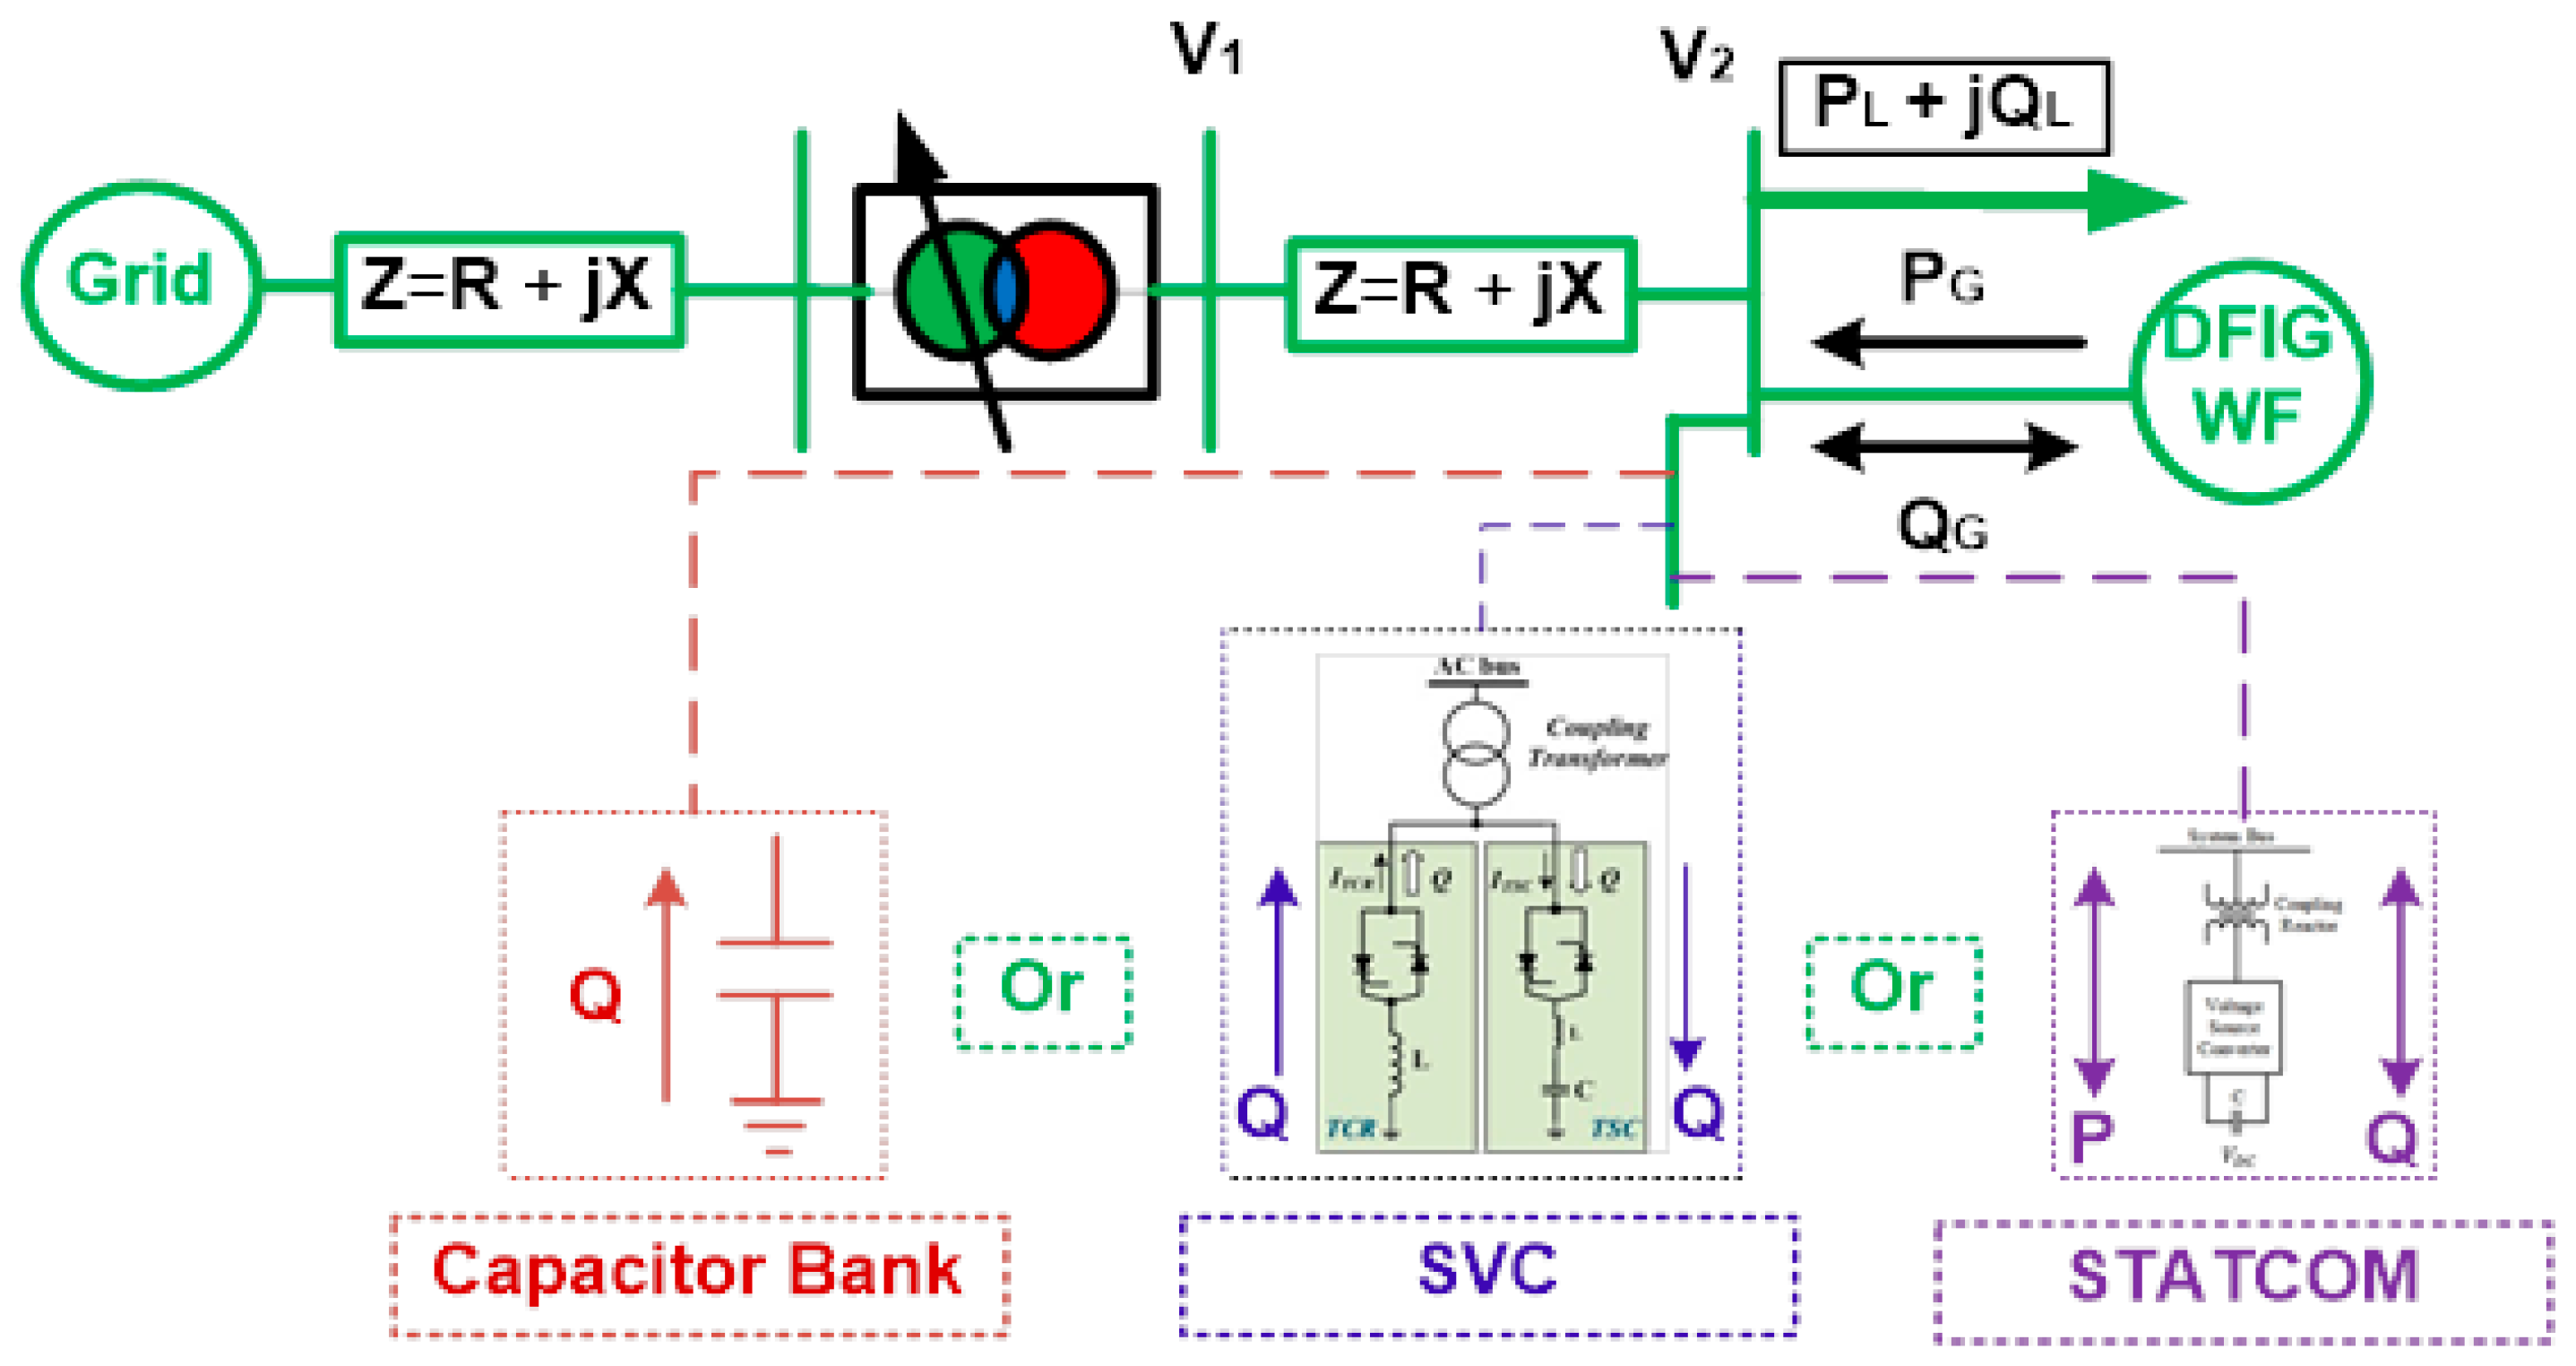
Appendix B. Reactive Power (Q/VAR) Compensation Devices and Respective Connections in Grid

Appendix B.1. Capacitor Banks

Capacitor banks are widely used for Q compensation due to the lower cost of operation. It improves the PF, which results in better voltage regulation. The connection/schematic diagram of the capacitor bank is shown in Figure A2. Switched capacitor banks are employed mostly in shunt at PCC of renewable energy generations for enhanced Q support. However, they produce strong switching transients, high-frequency harmonics, and may cause resonance issues. In addition, they do not provide a good dynamic response as its supplied Q is proportional to the square of voltage. Consequently, for system voltage is lower than the rated voltage and results in less Q than desired. Conversely, they can cause overvoltage condition if system voltage is above the nominal level.
Figure A2. Schematic/connection diagram of capacitor bank, SVC, and STATCOM in test system.
Energies 13 05513 g0a2

Appendix B.2. Static Var Compensator (SVC)

SVC is a FACTS device used for Q management of wind farms, as shown in Figure A2. It provides better dynamic response to voltage variations, yielding better voltage regulation, and enhanced system stability, as it provides fast-acting reactive power. SVC mainly consists of thyristor-controlled reactor (TCR), thyristor switched capacitor (TSC), and a harmonic filter, as shown in Figure A2. Hence, it operates in both capacitive and inductive regions. When the power system operates at leading PF, it will use the reactor to absorb Vars and a lower system’s voltage. Conversely, for lagging PF, it employs the capacitor and provides Vars to raise the voltage. However, SVC does not have the desired damping mechanism for transients damping.

Appendix B.3. Static Synchronous Compensator (STATCOM)

STATCOM is a notable FACTS device and is comprised of a coupling reactor, voltage source converter (VSC), and DC capacitor, as shown in Figure A2. It improves PF and voltage regulation at PCC, i.e., it enhances power transmitting capability and system stability. It can supply and absorb reactive power as per the system’s requirements by operating in capacitive and inductive modes, respectively. If the power system has a capacitive load and operates at leading PF, then it will play an inductive role by absorbing Vars. Conversely, if the power system operates at poor lagging PF, then it will play a capacitive role by supplying Vars to the power system to stabilize voltage by fulfilling Q requirements. STATCOM is used with a harmonic filter to attain enhanced PQ. It restores PCC voltage by giving fast dynamic response to voltage variations and improves the transient stability of the power system.

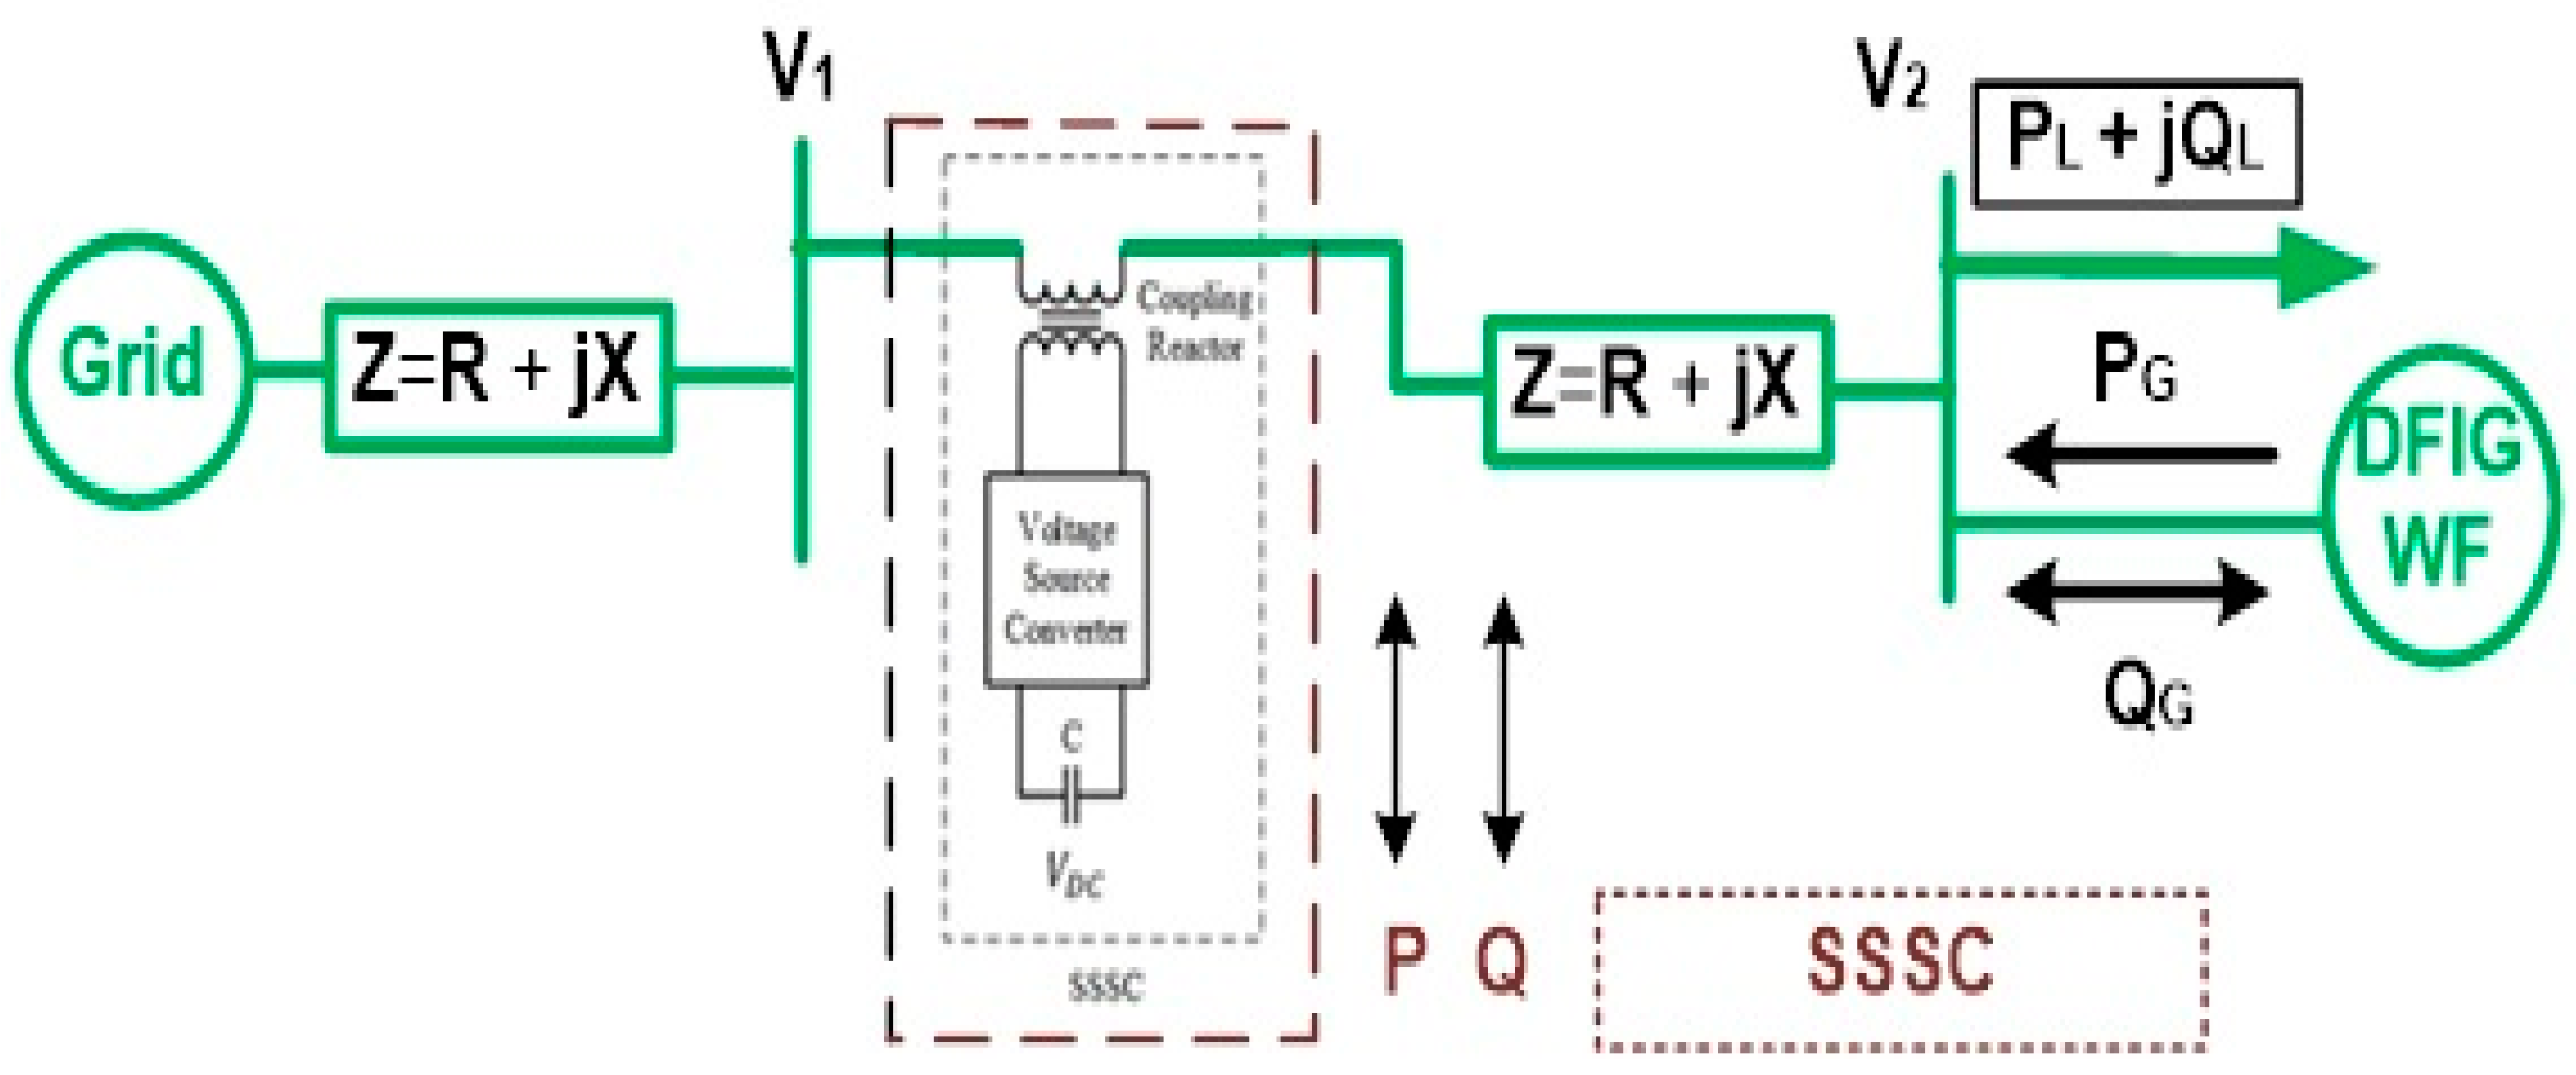
Appendix B.4. Static Synchronous Series Compensator (SSSC)

The connection/schematic diagram of SSSC is shown in Figure A3. SSSC is comprised of a coupling transformer, VSC, and a DC capacitor. SSSC is the same as STATCOM in structure, except SSSC is a series compensation device and acts as a series reactor and series capacitor. However, it has the capability to inject voltage independent of the line current [6]. By modifying the X/R ratio of the network, it reduces the reactive and resistive voltage drops. It injects the voltage and regulates the voltage through fast control at PCC. By decreasing effective reactance, SSSC enhances the power transfer capability of the power system. It is capable of exchanging both P and Q within the network and enables the improvement of voltage regulation and provides FRT via voltage injection.
Figure A3. Schematic/connection diagram of SSSC in test system.
Energies 13 05513 g0a3

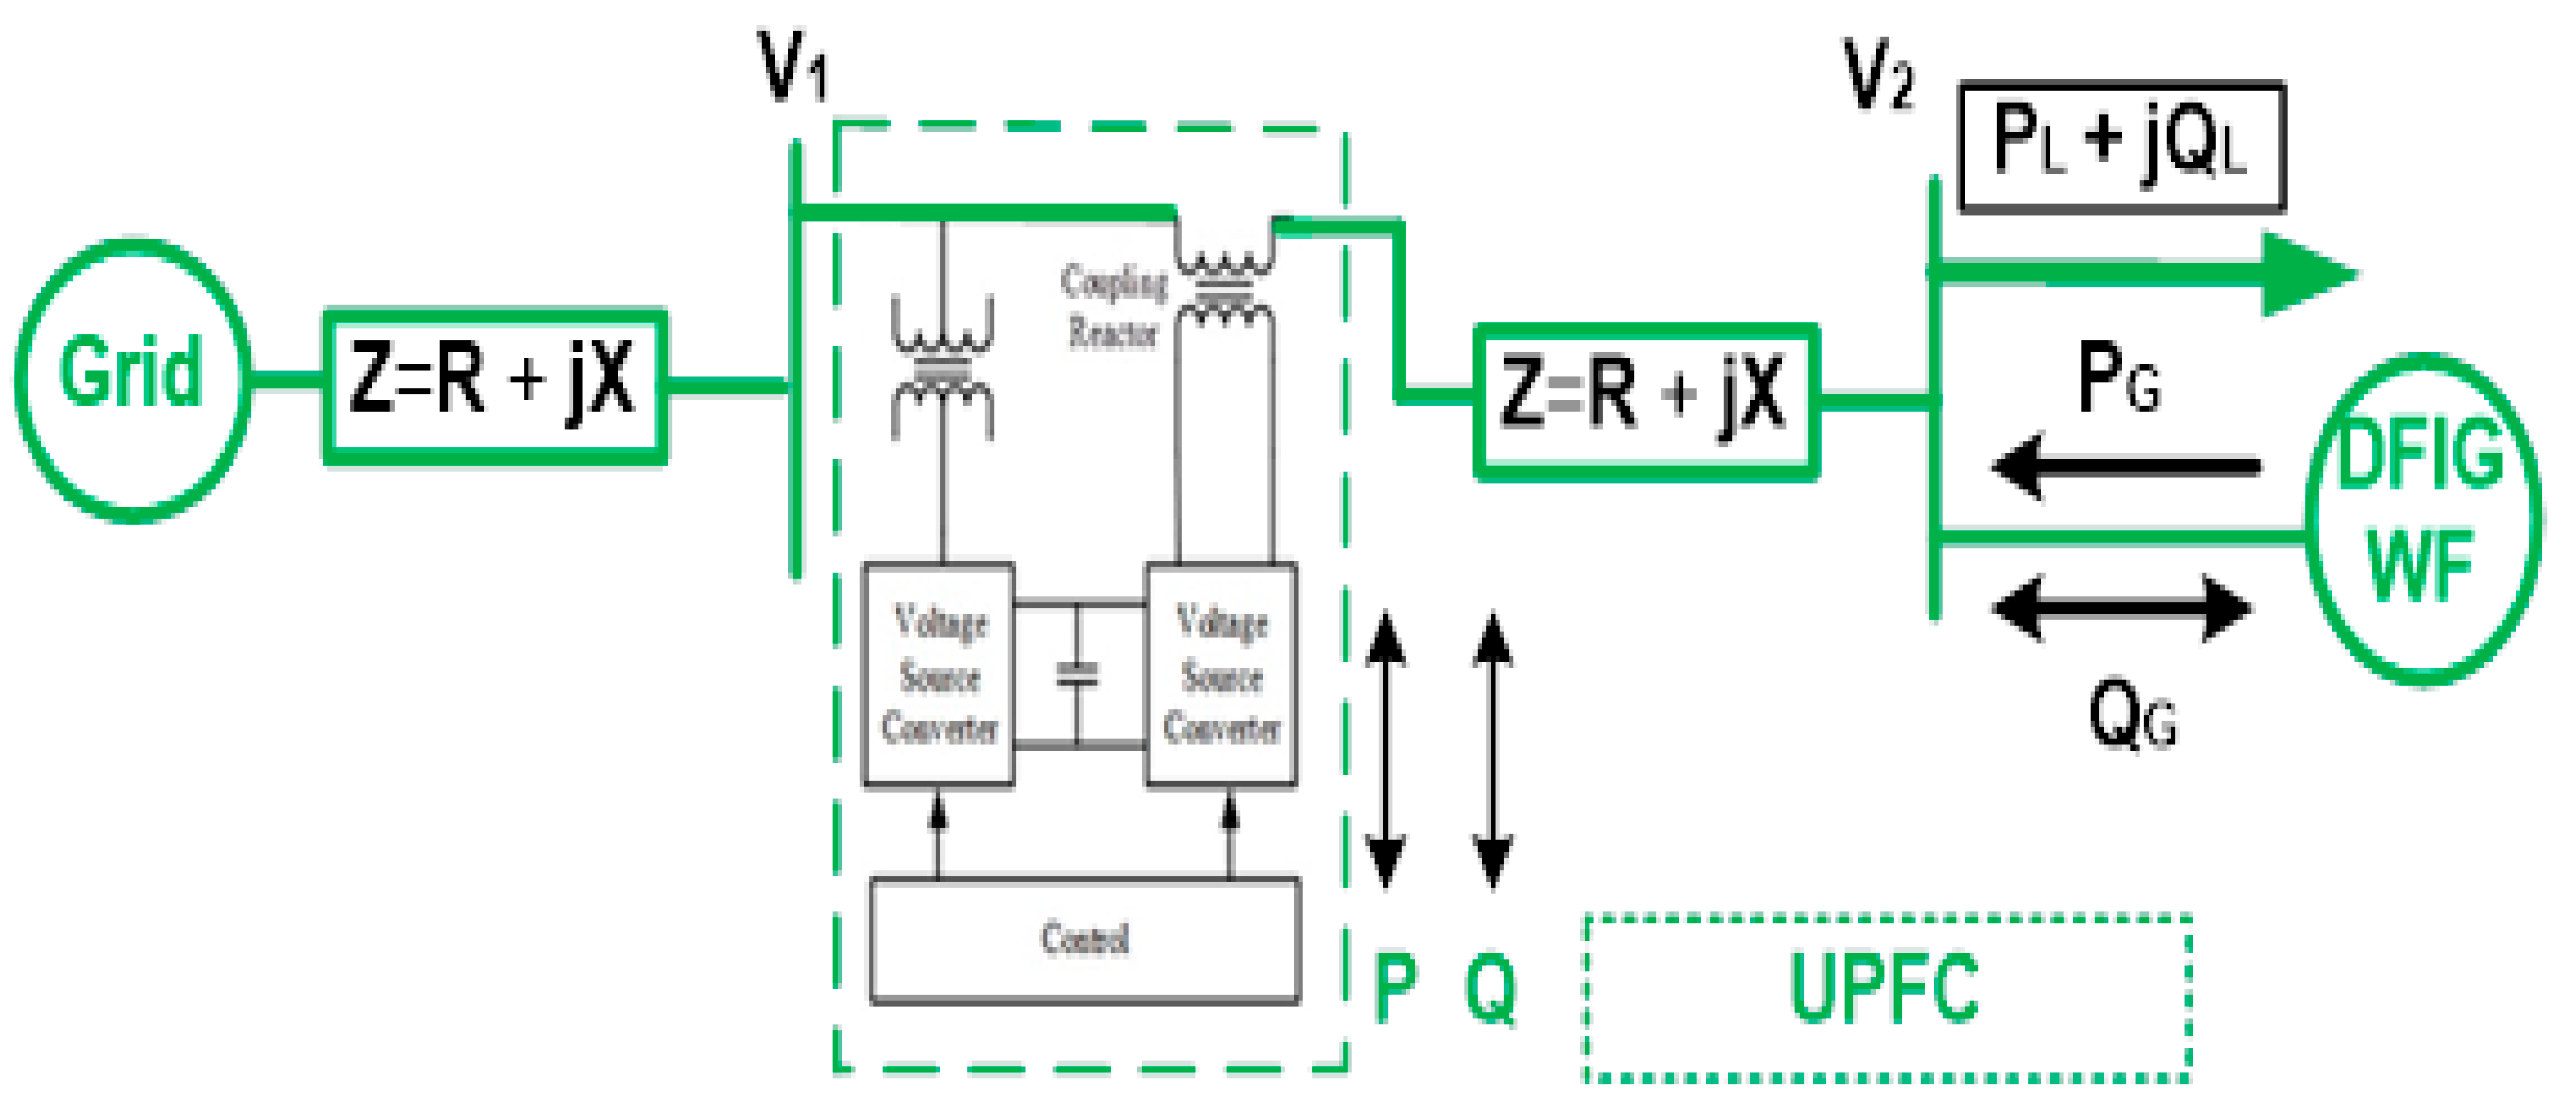
Appendix B.5. Unified Power Flow Controller (UPFC)

The UPFC is a FACTS device used to control and manage power flows in a power system using power electronics. The connection/schematic of UPFC is shown in Figure A4 and controls both P and Q flows [7]. UPFC is a hybrid device comprised of shunt and series controllers coupled through a common DC bus. The STATCOM is used as a shunt controller maintaining PCC voltage by controlling reactive power. SSSC is used as a series controller for regulating active power flows. Series compensation modifies the impedance of transmission whereas shunt compensation alters the voltage levels. Hence, this combinational feature makes UPFC better than both controllers used separately.
Figure A4. Schematic/connection diagram of UPFC in test system.
Energies 13 05513 g0a4

References

  1. Pathak, A.K.; Sharma, M.P.; Bundele, M. A critical review of voltage and reactive power management of wind farms. Renew. Sustain. Energy Rev. 2015, 51, 460–471. [Google Scholar] [CrossRef]
  2. Rona, B.; Güler, Ö. Power system integration of wind farms and analysis of grid code requirements. Renew. Sustain. Energy Rev. 2015, 49, 100–107. [Google Scholar] [CrossRef]
  3. Rahimi, E.; Rabiee, A.; Aghaei, J.; Muttaqi, K.M.; Esmaeel Nezhad, A. On the management of wind power intermittency. Renew. Sustain. Energy Rev. 2013, 28, 643–653. [Google Scholar] [CrossRef] [Green Version]
  4. Gupta, N. A review on the inclusion of wind generation in power system studies. Renew. Sustain. Energy Rev. 2016, 59, 530–543. [Google Scholar] [CrossRef]
  5. Murthy, K.S.R.; Rahi, O.P. A comprehensive review of wind resource assessment. Renew. Sustain. Energy Rev. 2017, 72, 1320–1342. [Google Scholar] [CrossRef]
  6. Mahela, O.P.; Shaik, A.G. Comprehensive overview of grid interfaced wind energy generation systems. Renew. Sustain. Energy Rev. 2016, 57, 260–281. [Google Scholar] [CrossRef]
  7. Huang, Y.W.; Kittner, N.; Kammen, D.M. ASEAN grid flexibility: Preparedness for grid integration of renewable energy. Energy Policy 2019, 128, 711–726. [Google Scholar] [CrossRef]
  8. Karbouj, H.; Rather, Z.H. Voltage Control Ancillary Service From Wind Power Plant. IEEE Trans. Sustain. Energy 2019, 10, 759–767. [Google Scholar] [CrossRef]
  9. Che, Y.; Peng, X.; Delle Monache, L.; Kawaguchi, T.; Xiao, F. A wind power forecasting system based on the weather research and forecasting model and Kalman filtering over a wind-farm in Japan. J. Renew. Sustain. Energy 2016, 8, 1. [Google Scholar] [CrossRef]
  10. Howland, M.F.; Lele, S.K.; Dabiri, J.O. Wind farm power optimization through wake steering. Proc. Natl. Acad. Sci. USA 2019, 116, 14495–14500. [Google Scholar] [CrossRef] [Green Version]
  11. González-Longatt, F.; Wall, P.P.; Terzija, V. Wake effect in wind farm performance: Steady-state and dynamic behavior. Renew. Energy 2012, 39, 329–338. [Google Scholar] [CrossRef]
  12. Lundquist, J.K.; DuVivier, K.K.; Kaffine, D.; Tomaszewski, J.M. Costs and consequences of wind turbine wake effects arising from uncoordinated wind energy development. Nat. Energy 2019, 4, 26–34. [Google Scholar] [CrossRef]
  13. Ayodele, T.R.; Ogunjuyigbe, A.S.O. Mitigation of wind power intermittency: Storage technology approach. Renew. Sustain. Energy Rev. 2015, 44, 447–456. [Google Scholar] [CrossRef]
  14. Luh, P.B.; Yu, Y.; Zhang, B.; Litvinov, E.; Zheng, T.; Zhao, F.; Zhao, J.; Wang, C. Grid integration of intermittent wind generation A Markovian approach. IEEE Trans. Smart Grid. 2014, 5, 732–741. [Google Scholar] [CrossRef]
  15. Ouyang, J.; Li, M.; Zhang, Z.; Tang, T. Multi-timescale active and reactive power-coordinated control of large-scale wind integrated power system for severe wind speed fluctuation. IEEE Access 2019, 7, 51201–51210. [Google Scholar] [CrossRef]
  16. Ren, G.; Liu, J.; Wan, J.; Guo, Y.; Yu, D. Overview of wind power intermittency: Impacts, measurements, and mitigation solutions. Appl. Energy 2017, 204, 47–65. [Google Scholar] [CrossRef]
  17. Ameur, A.; Berrada, A.; Loudiyi, K.; Aggour, M. Analysis of renewable energy integration into the transmission network. Electr. J. 2019, 32, 106676. [Google Scholar] [CrossRef]
  18. Sexauer, J.M.; Mohagheghi, S. Reactive compensation techniques to improve the ride-through capability of wind turbine during disturbance. IEEE Trans. Power Deliv. 2013, 28, 1652–1662. [Google Scholar] [CrossRef]
  19. Djamel, L.; Zohra, M.; Selwa, F. Influence of the wind farm integration on load flow and voltage in electrical power system. Int. J. Hydrog. Energy 2016, 41, 12603–12617. [Google Scholar]
  20. Kraiczy, M.; Wang, H.; Schmidt, S.; Wirtz, F.; Braun, M. Reactive power management at the transmission–distribution interface with the support of distributed generators—A grid planning approach. IET Gener. Transm. Distrib. 2018, 12, 5949–5955. [Google Scholar] [CrossRef]
  21. Vittal, E.; O’Malley, M.; Keane, A. A steady-state voltage stability analysis of power systems with high penetrations of wind. IEEE Trans. Power Syst. 2010, 25, 433–442. [Google Scholar] [CrossRef]
  22. Blaabjerg, F.; Ma, K. Wind Energy Systems, reviews application of power electronics in wind energy systems. IEEE Power Energy Soc. 2017, 105, 2116–2131. [Google Scholar]
  23. Saqib, M.A.; Saleem, A.Z. Power-quality issues and the need for reactive-power compensation in the grid integration of wind power. Renew. Sustain. Energy Rev. 2015, 43, 51–64. [Google Scholar] [CrossRef]
  24. Sinsel, S.R.; Riemke, R.L.; Hoffmann, V.H. Challenges and solution technologies for the integration of variable renewable energy sources—A review. Renew. Energy 2020, 145, 2271–2285. [Google Scholar] [CrossRef]
  25. Abulanwar, S.; Hu, W.; Chen, Z.; Iov, F. Adaptive voltage control strategy for variable-speed wind turbine connected to a weak network. IET Renew. Power Gener. 2016, 10, 238–249. [Google Scholar] [CrossRef]
  26. Prasai, A.; Sastry, J.; Divan, D.M. Dynamic capacitor (D-CAP): An integrated approach to reactive and harmonic compensation. IEEE Trans. Ind. Appl. 2010, 46, 2518–2525. [Google Scholar] [CrossRef]
  27. Ouyang, J.; Tang, T.; Yao, J.; Li, M. Active Voltage Control for DFIG-based Wind Farm Integrated Power System by Coordinating Active and Reactive Powers under Wind Speed Variations. IEEE Trans. Energy Convers. 2019, 34, 1504–1511. [Google Scholar] [CrossRef]
  28. She, X.; Huang, A.Q.; Wang, F.; Burgos, R. Wind energy system with integrated functions of active power transfer, reactive power compensation, and voltage conversion. IEEE Trans. Ind. Electron. 2013, 60, 4512–4524. [Google Scholar] [CrossRef]
  29. Chen, B.; Fei, W.; Tian, C.; Yuan, J. Research on an Improved Hybrid Unified Power Flow Controller. IEEE Trans. Ind. Appl. 2018, 54, 5649–5660. [Google Scholar] [CrossRef]
  30. Fawzi, A.; Jowder, L. Influence of mode of operation of the SSSC on the small disturbance and transient stability of a radial power system. IEEE Trans. Power Syst. 2005, 20, 2. [Google Scholar]
  31. Wang, X.; Wang, H.; Yang, J.; Xu, Z.; Sun, W.; Wu, C.; Li, C. Application of 500 kV UPFC in Suzhou southern power grid. J. Eng. 2019, 2019, 2580–2584. [Google Scholar] [CrossRef]
  32. Mahfouz, M.M.A.; El-Sayed, M.A.H. Static synchronous compensator sizing for enhancement of fault ride-through capability and voltage stabilisation of fixed speed wind farms. IET Renew. Power Gener. 2014, 8, 1–9. [Google Scholar] [CrossRef]
  33. Chompoo-Inwai, C.; Yingvivatanapong, C.; Methaprayoon, K.; Lee, W.J. System Impact Study for the Interconnection of Wind Generation and Utility System. IEEE Trans. Ind. Appl. 2005, 41, 1484. [Google Scholar] [CrossRef]
  34. National Electric Power Regulatory Authority (NEPRA) State of Industry Report 2019. Available online: https://www.nepra.org.pk/publications/State%20of%20Industry%20Reports/State%20of%20Industry%20Report%202019.pdf (accessed on 20 July 2020).
  35. Haseeb, A.; Asim, R.M.; Javed, A.; Calhoun, R. Partial Repowering Analysis of a Wind Farm by Turbine Hub Height Variation to Mitigate Neighboring Wind Farm Wake Interference using Mesoscale Simulations. Appl. Energy 2020, 268, 1–23. [Google Scholar]
Figure 1. MATLAB/SIMULINK base case test system with three integrated wind farms.
Energies 13 05513 g001
Figure 2. Equivalent of an LSWF-based model with grid integration issues.
Energies 13 05513 g002
Figure 3. Flow chart of the proposed methodology.
Energies 13 05513 g003
Figure 4. Case-1, Scenario 1 (1a–1b): (a) Voltage (V) at PCC; (b) frequency (F) at PCC; (c) PF at PCC; (d) impedance (Z) vs. F; (e) voltage harmonics; (f) current harmonics; (g) P-trend; and (h) Q-trend.
Energies 13 05513 g004aEnergies 13 05513 g004b
Figure 5. Case-1, Scenario 2: (a) Voltage (V) at PCC; (b) frequency (F) at PCC; (c) PF at PCC; (d) impedance (Z) vs. F; (e) P-trend; and (f) Q-trend.
Energies 13 05513 g005
Figure 6. Case-1, Scenario 3: (a) Voltage (V) at PCC; (b) frequency (F) at PCC; (c) PF at PCC; (d) impedance (Z) vs. F; (e) P-trend; and (f) Q-trend.
Energies 13 05513 g006
Figure 7. Case-1, Scenario 4: (a) Voltage (V) at PCC; (b) frequency (F) at PCC; (c) PF at PCC; (d) Impedance (Z) vs. F; (e) P-trend; and (f) Q-trend.
Energies 13 05513 g007
Figure 8. Case-1, Scenario 5: (a) Voltage (V) at PCC; (b) frequency (F) at PCC; (c) PF at PCC; (d) Impedance (Z) vs. F; (e) P-trend; and (f) Q-trend.
Energies 13 05513 g008
Figure 9. Case-2, Scenario 6: (a) Voltage (V) at PCC; (b) frequency (F) at PCC; (c) PF at PCC; (d) impedance (Z) vs. F; (e) P-trend; and (f) Q-trend.
Energies 13 05513 g009
Figure 10. Case-2, Scenario 7: (a) Voltage (V) at PCC; (b) frequency (F) at PCC; (c) PF at PCC; (d) impedance (Z) vs. F; (e) P-trend; and (f) Q-trend.
Energies 13 05513 g010
Figure 11. Case-2, Scenario 8: (a) Voltage (V) at PCC; (b) frequency (F) at PCC; (c) PF at PCC; (d) impedance (Z) vs. F; (e) P-trend; and (f) Q-trend.
Energies 13 05513 g011
Figure 12. Case-2, Scenario 9: (a) Voltage (V) at PCC; (b) Frequency (F) at PCC; (c) PF at PCC; (d) Impedance (Z) vs. F; (e) P-trend; (f) Q-trend.
Energies 13 05513 g012
Figure 13. Case-2, Scenario 10: (a) Voltage (V) at PCC; (b) frequency (F) at PCC; (c) PF at PCC; (d) impedance (Z) vs. F; (e) P-trend; and (f) Q-trend.
Energies 13 05513 g013
Figure 14. Special case P profiles: (a) P in Ideal case; (b) P with capacitor bank; (c) P with SVC; (d) P with STATCOM; (e) P with SSSC; and (f) P with UPFC.
Energies 13 05513 g014
Figure 15. Special case Q profiles: (a) Q in Ideal case; (b) Q with capacitor bank; (c) Q with SVC; (d) Q with STATCOM; € Q with SSSC; and (f) Q with UPFC.
Energies 13 05513 g015
Table 1. Technical specifications of the test system under study (consisting of three WFs) [34].
Technical Data/LSWFs (WPP)FFCEL (Test Case)ZE (Upstream)TGF (Upstream)
Operational DateMay 2013July 2013November 2014
Model of wind turbinesNordex-S77Vestas and Vensys-62Goldwind GW771500
Capacity of wind turbine (MW)1.5Vestas = 1.8; Vensys-62 = 1.21.5
Total number of wind turbines3328 × Vestas; 5 × Vesys-6233
Capacity of wind farm (MW)49.556.449.5
Type of generatorDFIGDFIGDFIG
Generator’s output voltage (V)660660660
Conductor (as collector cable)CairoCairoCairo
SpacingAsymmetricalAsymmetricalAsymmetrical
Inter-Farm Least Distance (m)-~800~1400
Table 2. The national electric power regulatory authority’s (NEPRA) grid codes (of Pakistan).
ParametersGrid Codes
HarmonicsIEC 61400-21 requires specifications of voltage and current harmonics up to 50 times the fundamental power frequency. The total harmonic distortion (THD) from these harmonics at the PCC should not exceed 5%.
VoltageThe wind farm should be able to deliver available power while maintaining the voltage at PCC within limits of ±5% of nominal voltage.
FrequencyThe wind farm should be capable to operate continuously between the permissible system frequency range of 49.5–50.5 Hz.
ResonanceNo resonance at odd harmonics as it proves devastating for the power system.
Power FactorThe wind farm should manage, at the point of interconnection, the reactive-power control to maintain the PF within the specified range of 0.95 lagging to 0.95 leading over the full range of plant operation.
Table 3. Comparison of various scenarios.
Scenario. #:V
(PU)
Transient F
(Hz)
Impedance
(Ohms)
PFP(MW)
Deficit
Q(MVAR) Deficit
1Ideal-10.970449.36–50.8924.960.95910.65+0.174
6Capacitor Bank1.02849.55–50.4126.530.99910.18−0.52
7SVC1.02849.75–50.2424.760.99910.70−0.56
8STATCOM1.00649.76–50.2624.760.96210.51−1.06
9SSSC1.00449.67–50.7520.830.96011.12−3.40
10UPFC1.00249.88–50.1720.830.96210.15−0.53
Table 4. Comparison of proposed work with reported works.
ParametersVoltage Harmonics (%)Current Harmonics (%)Voltage (pu)Frequency (Hz)Harmonic ResonancePower FactorP without Wake(MW)P with Wake (MW)Q without Wake (MVar)Q with Wake (MVar)
[23] 1 × Plant0.702.35--Exists-----
[P] 1 × Plant0.362.070.96650Exists0.9948.337.62.572.75
[P] 3 × Plant1.083.320.97050Exists0.961511437.056.87
Table 5. Special case validation.
Scenario. #:P(MW) without WakeP(MW) with Wake at Hub Height = 100 mP(MW)
Deficit at Hub Height = 100 m
Q(MVar)
Deficit at Hub Height = 100 m
1Ideal48.2842.705.58+0.044
6Capacitor Bank48.2542.665.59−0.25
7SVC48.2542.725.53−0.25
8STATCOM48.3042.775.53−0.53
9SSSC44.0442.341.70−2.34
10UPFC48.3042.785.52−0.23
Publisher’s Note: MDPI stays neutral with regard to jurisdictional claims in published maps and institutional affiliations.

