Article

Sustainable E-Bike Charging Station That Enables AC, DC and Wireless Charging from Solar Energy †

Department of Electrical Sustainable Energy, Delft University of Technology, 2628 CD Delft, The Netherlands
*
Authors to whom correspondence should be addressed.
This paper is an extended version of our paper published in 2018 in the European Conference on Power Electronics and Applications (EPE-ECCE Europe), Riga, Latvia, 20 September 2018.
Energies 2020, 13(14), 3549; https://doi.org/10.3390/en13143549
Submission received: 24 May 2020 / Revised: 29 June 2020 / Accepted: 4 July 2020 / Published: 10 July 2020
(This article belongs to the Special Issue PV Charging and Storage for Electric Vehicles)

Abstract

:
If electric vehicles have to be truly sustainable, it is essential to charge them from sustainable sources of electricity, such as solar or wind energy. In this paper, the design of solar powered e-bike charging station that provides AC, DC and wireless charging of e-bikes is investigated. The charging station has integrated battery storage that enables for both grid-connected and off-grid operation. The DC charging uses the DC power from the photovoltaic panels directly for charging the e-bike battery without the use of an AC charging adapter. For the wireless charging, the e-bike can be charged through inductive power transfer via the bike kickstand (receiver) and a specially designed tile (transmitter) at the charging station, which provides maximum convenience to the user.

1. Introduction

Electric vehicles (EVs) have several advantages over conventional fossil fuel-powered vehicles such as zero tailpipe emissions, higher tank-to-wheel efficiency, low noise, and full torque at zero speed. With the increased use of electric vehicles in the form of e-bikes, electric cars, and electric buses, there is increased emphasis to make sure that the electricity used to charge the EVs are sustainable as well [1,2]. As shown in Figure 1, the average emission from electricity production for various European countries shows a wide variation of 13–819 g of CO2 equivalent per kWh based on the electricity generation mix in 2016 [3]. The European Union wide average is 296 g/kWh, which is primarily driven by the 43% share of fossil fuels in the gross electricity generation. Assuming a modest energy efficiency of an electric car to be 5 km/kWh, the CO2 emission of 13–819 g/kWh translates to a 2.6–163 g/km. Therefore, to make EVs truly sustainable, it is essential to charge EVs from sustainable sources of electricity, such as wind and solar energy [4,5,6,7].
Using solar energy for charging EVs is attractive due to the possibility of distributed photovoltaic (PV) generation in locations close to where EVs are parked. Specifically, charging electric vehicles from PV panels at workplaces has significant potential for the future due to several reasons.
  • There is excellent synergy between the hours of sunshine and the working hours at workplaces.
  • The solar panels can be installed on the large roof area of office buildings, factories, or parking lot. This potential is largely untapped today.
  • Reduced peak power and energy demand on the grid as the EV charging power is locally produced from PV [6].
  • Reduced cost of EV charging due to lower levelized cost of solar energy when compared to grid electricity tariffs [8,9].
  • The EV can be used as an energy storage buffer for PV, and this could be very useful when PV feed-in tariffs are gradually reduced in the future [9,10].
Concurrently, the disadvantage of charging EVs at the workplace using solar energy is the low solar generation in winter months. Secondly, there is a lack of charging demand on the weekends for workplaces that have a weekday working week.

1.1. Electric Bikes and Electric Scooters

Electric bikes and electric scooters provide a convenient means of intra-city commute with a multitude of benefits such as door-to-door connectivity, low (indirect) emissions, reduced traffic, and parking congestion and a fraction of the energy usage of an electric car [11]. In 2016, around 30% of the 928,000 bikes sold in the Netherlands were e-bikes [12]. An e-bike can travel up to 25 km/h using a motor of up to 250 W (up to 1000 W for high-speed e-bikes) and uses a 12 V–48 V battery with an energy capacity of 0.2–1 kWh. Electric mopeds (including speed pedelec), on the other hand, can go up to 45 km/h using a motor of 1–4 kW and typically uses a 48 V battery of 1–5 kWh. Furthermore, e-bikes have an extremely low energy consumption in the range of 5–15 Wh/km depending on the drivetrain efficiency, riding behaviour, tire characteristics, and the combined weight of the bike and rider. This is much lower than the 150–200 Wh/km energy consumption of an electric car.
By providing a charging facility at the workplaces and powering it with solar energy, e-bikes can be made into a fully sustainable means of daily commute [13,14]. The focus of this paper is on the development of a charging station to sustainably charge e-bikes at the workplace using solar energy. The charge station is shown in Figure 2 and provides three modes of charging: AC, DC, and wireless charging, respectively.

1.2. State-of-the-Art

The most common design for a solar e-bike charging station is to use the AC low voltage grid for power exchange between the PV and the EV. A solar inverter with maximum power point tracking (MPPT) feeds the solar power to the AC grid [15,16,17,18,19]. A standard e-bike AC power adapter is then used for e-bike charging. Even though there have been recent studies to simplify the complexity of the e-bike power adapter [20,21], the disadvantage of such designs is due to the unnecessary power conversion from DC to AC and back, even though both the solar panels and e-bike battery operate on DC [18,22,23]. DC charging the e-bikes directly from the PV would reduce the power conversion stages, and it would not require the cyclists to bring the power adapter but only requires a DC cable. However, e-bike DC charging is still manufacturer-specific, and, therefore, no standard exists except for the consensus on typical battery voltage levels of 24 V, 36 V, and 48 V. The challenge is primarily due to lack of standard connectors and communication protocols for charging control and safety that exist between the power adapter and the bike battery, which varies across manufacturers.
The next step for a more user-friendly and safer experience in e-bike charging would be the transition from plug-in charging methods to wireless charging. This solution was already proposed in Reference [24], where a 100 W e-bike wireless charger has been demonstrated to have an efficiency above 90%. A considerable number of e-bike wireless charging systems use flat-air coils to realize the power transfer [24,25,26,27,28] because they are lightweight. However, air coils might produce a magnetic field higher than the safety limit for the general public in their proximity [29]. Other solutions use a ferromagnetic core to improve the coupling between the coils [30,31,32,33,34], but, at the same time, they introduce extra elements on the e-bike, which do not have any other purposes. In Reference [35], a review of solar-powered wireless charging systems for light electric vehicles is presented and shows 400 W–5 kW designs operating at a resonant frequency in the range of 8.7–100 kHz with a 2.8–20 cm air gap and an efficiency in the range of 75–95%.
Lastly, two key features that distinguish the charging station are the physical design of the structure and the use of energy storage. The usual method to install solar panels is to place them on the parking lot or the rooftop or façade of buildings, while the less common technique is to use a dedicated solar park-port [15,16,17,36]. The critical design tradeoffs are the cabling losses, construction/installation costs, accessibility, and need for large electrical cabinets to store the electronics. This becomes even more relevant for charging stations with battery storage due to their large size and weight. Most of the existing e-bike charging stations lack an integrated battery storage. This prevents the station from being used in an off-grid mode, especially on days where the solar insolation is very low during the year [18].

1.3. Contributions

This paper presents the development of a novel e-bike charging station that provides sustainable direct DC charging from solar photovoltaic energy, as shown in Figure 2. Using Reference [14] as a starting point, this paper provides the detailed design of the subcomponents of the charging station. The contributions are the following.
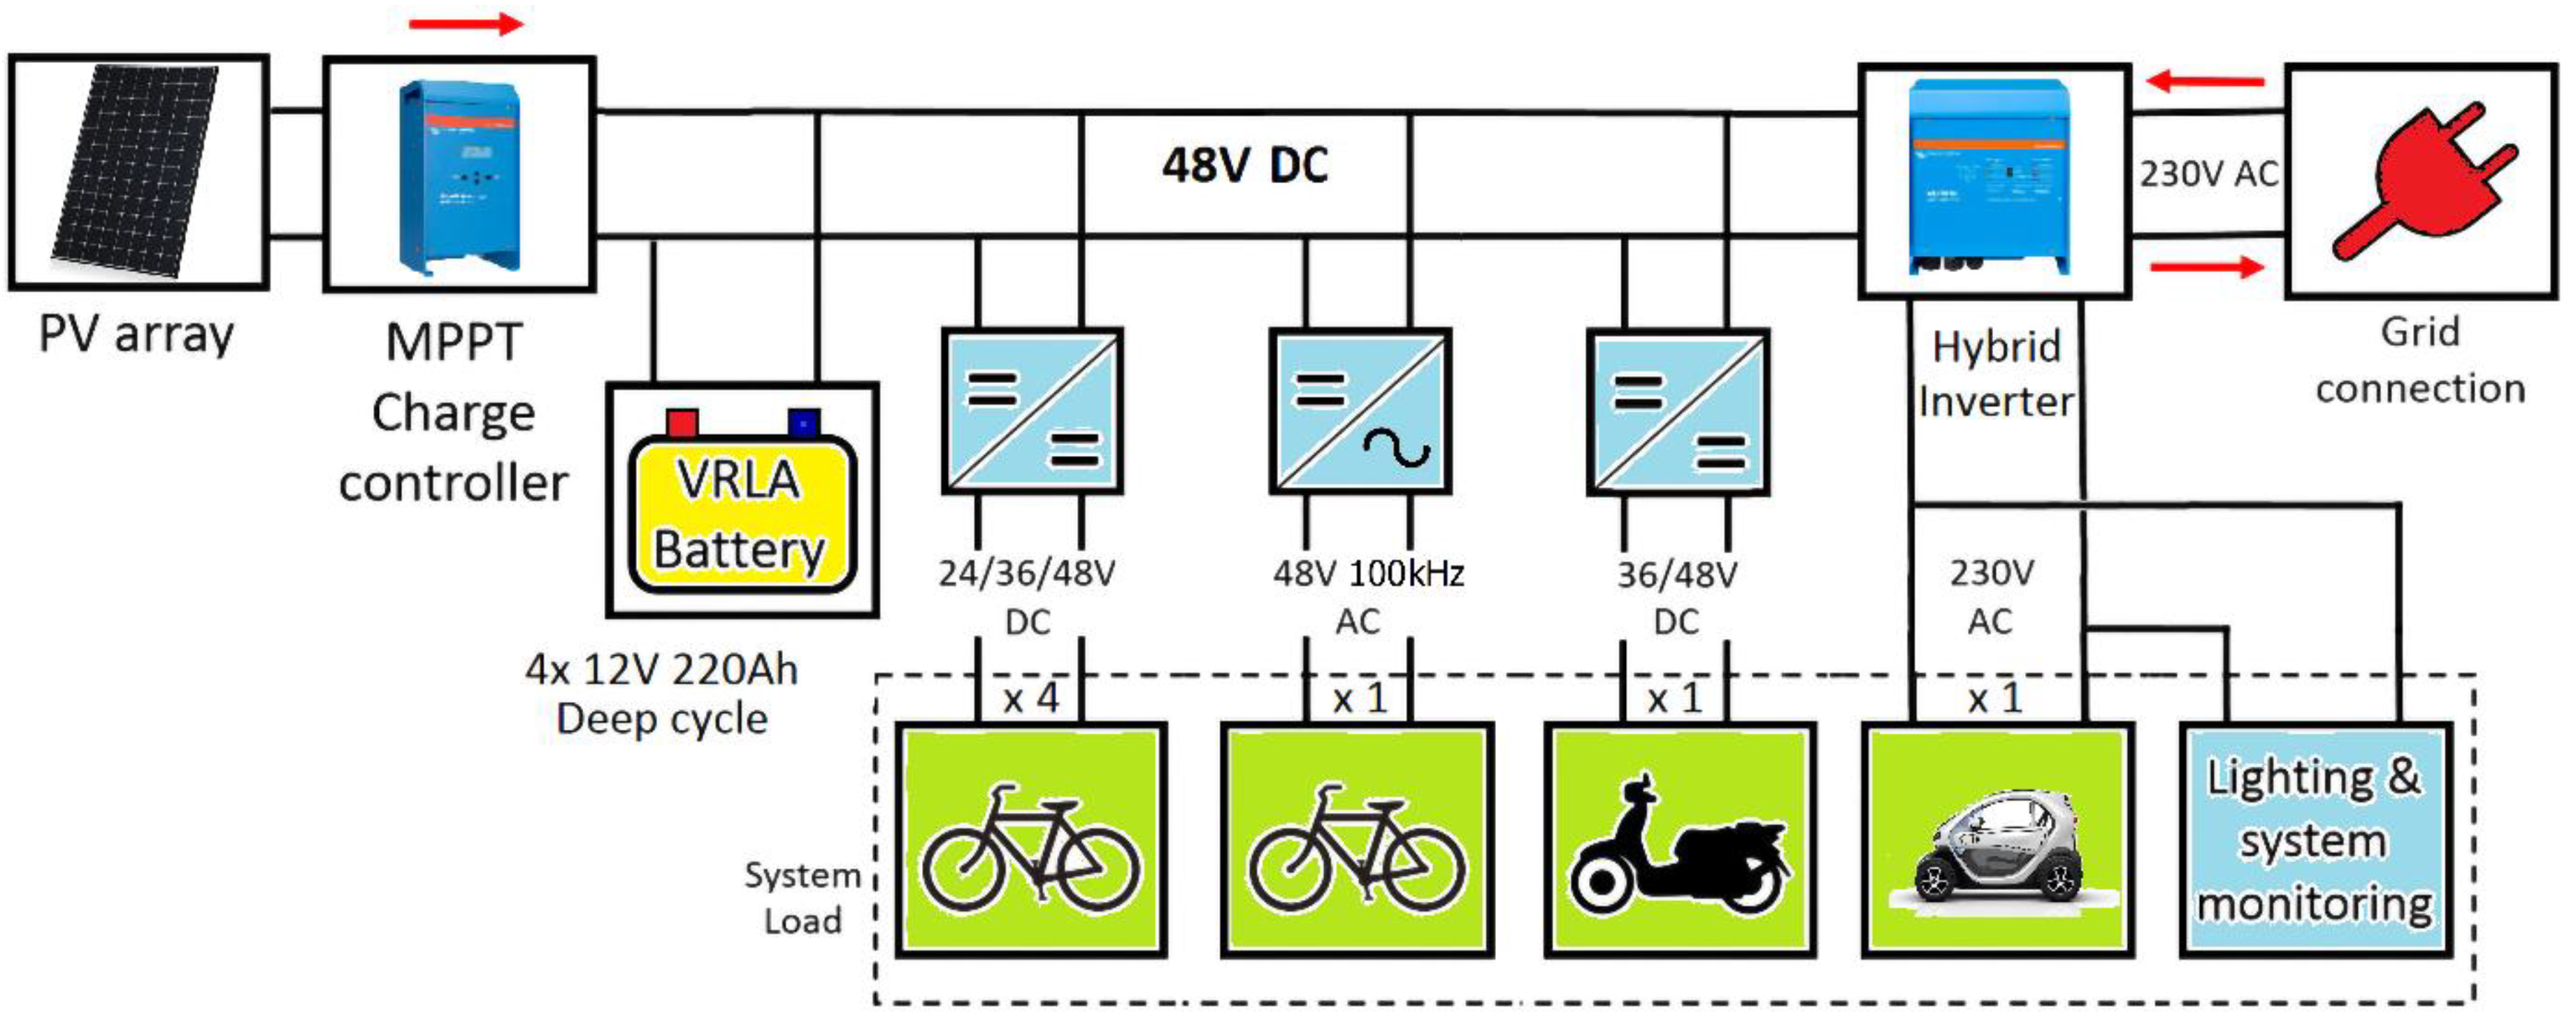
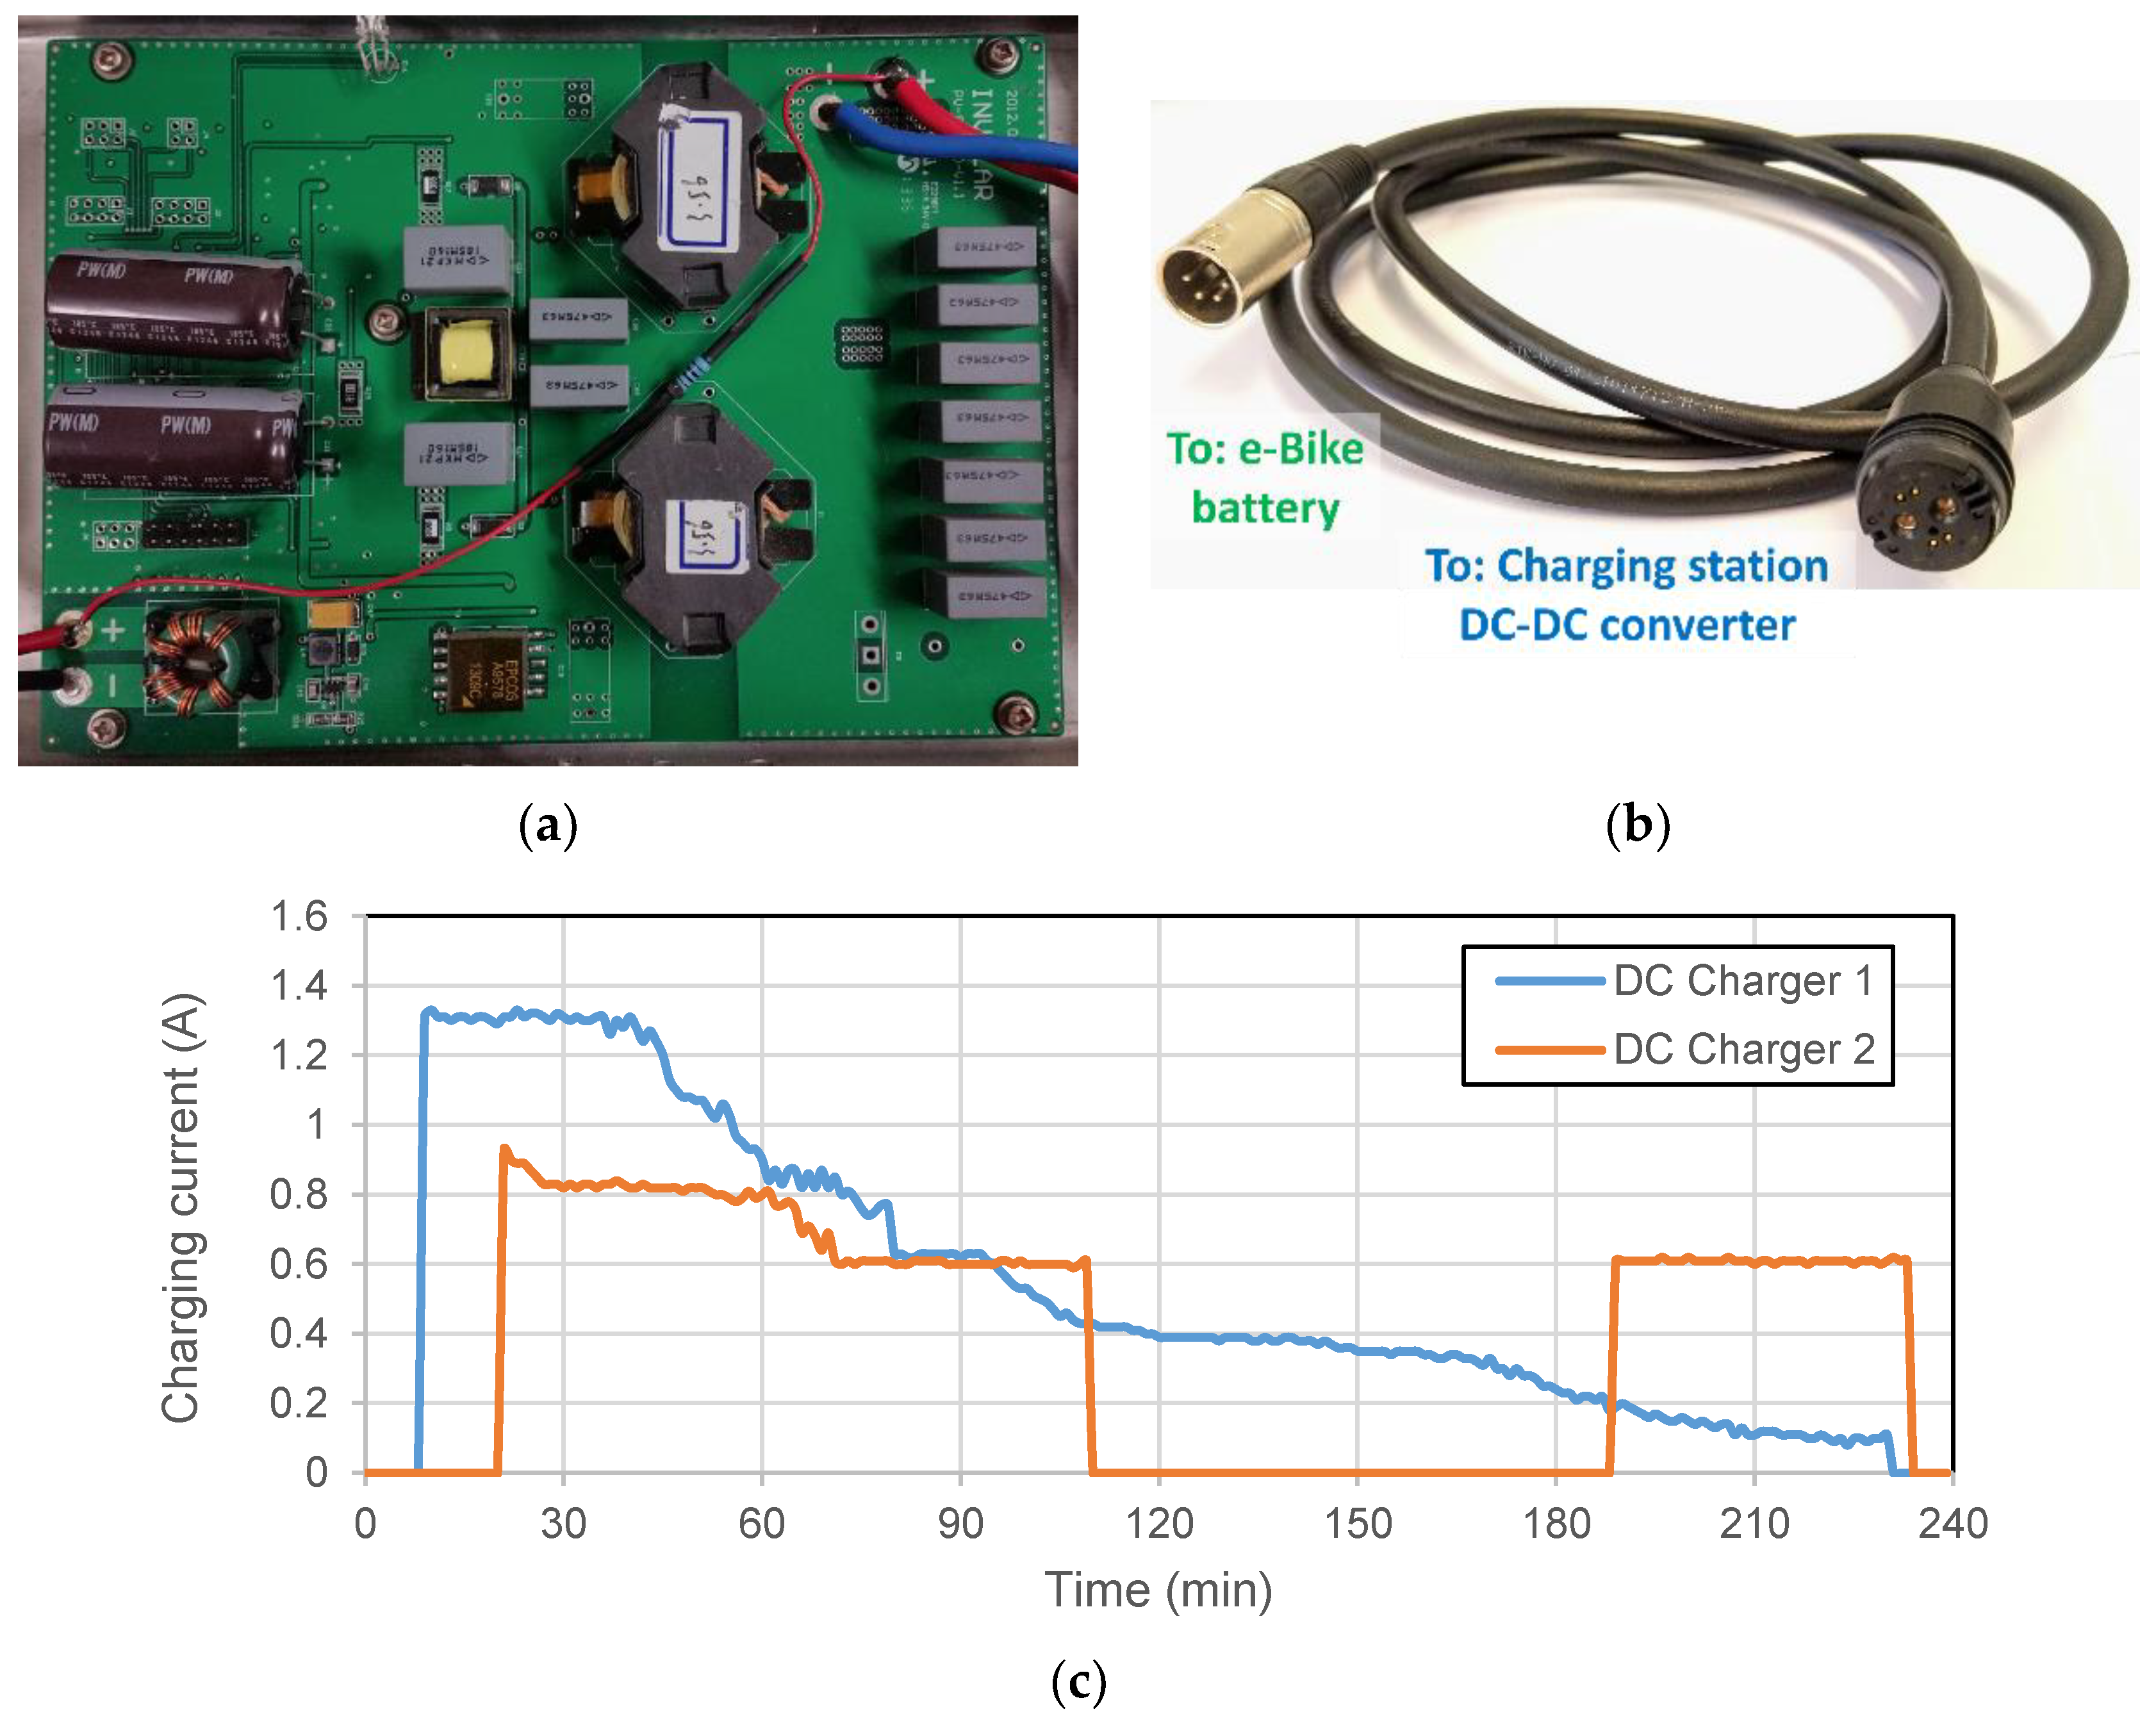
  • The station offers three methods for charging the e-bikes, namely AC charging, wireless charging, and direct DC charging. The DC charging is implemented in such a way that users no longer need a power adapter and only a DC cable for charging.
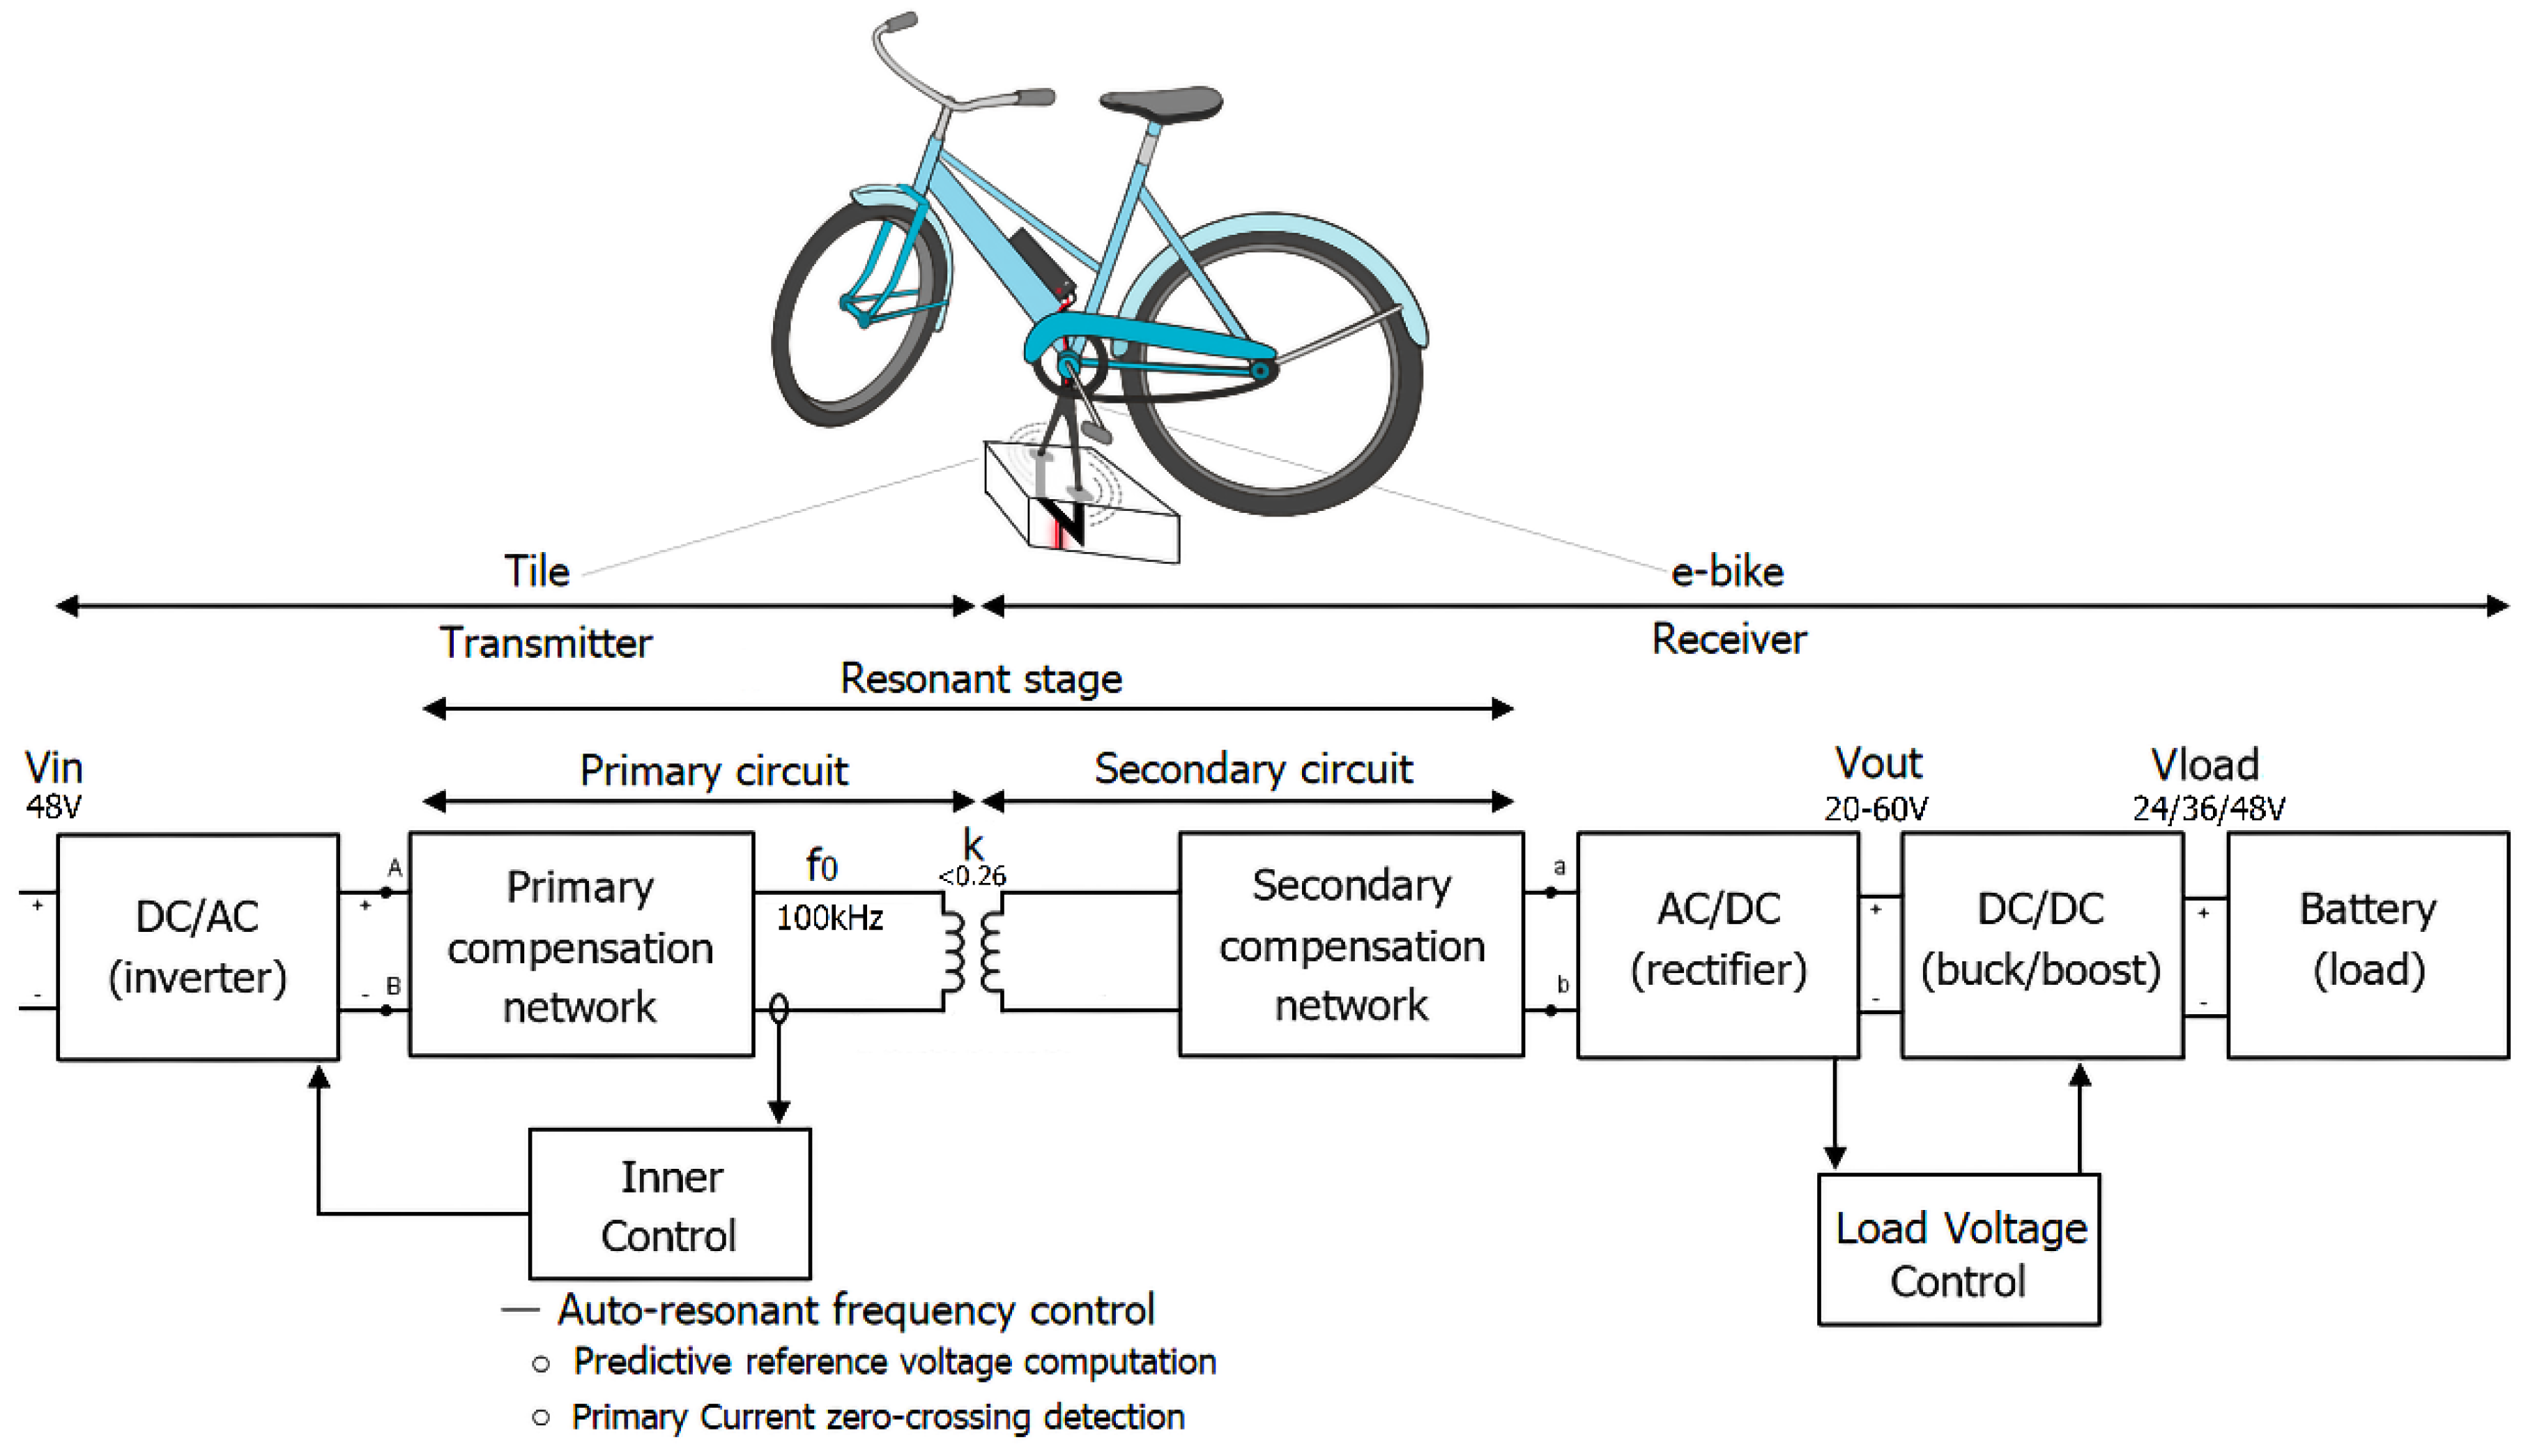
  • Wireless charging of e-bikes is possible via inductive coils made of ferromagnetic material with the transmitter coil located under the floor tile of the station, and the receiver coil is integrated into the bike kickstand. In this way, the kickstand of the bike is used for both parking, wireless charging, and communication. A novel auto-resonant frequency control is developed for misalignment tolerance of wireless charging.
  • The charging station has a bidirectional hybrid inverter and an integrated storage on a DC nano-grid, which facilitates both grid-connected and off-grid operation [37].
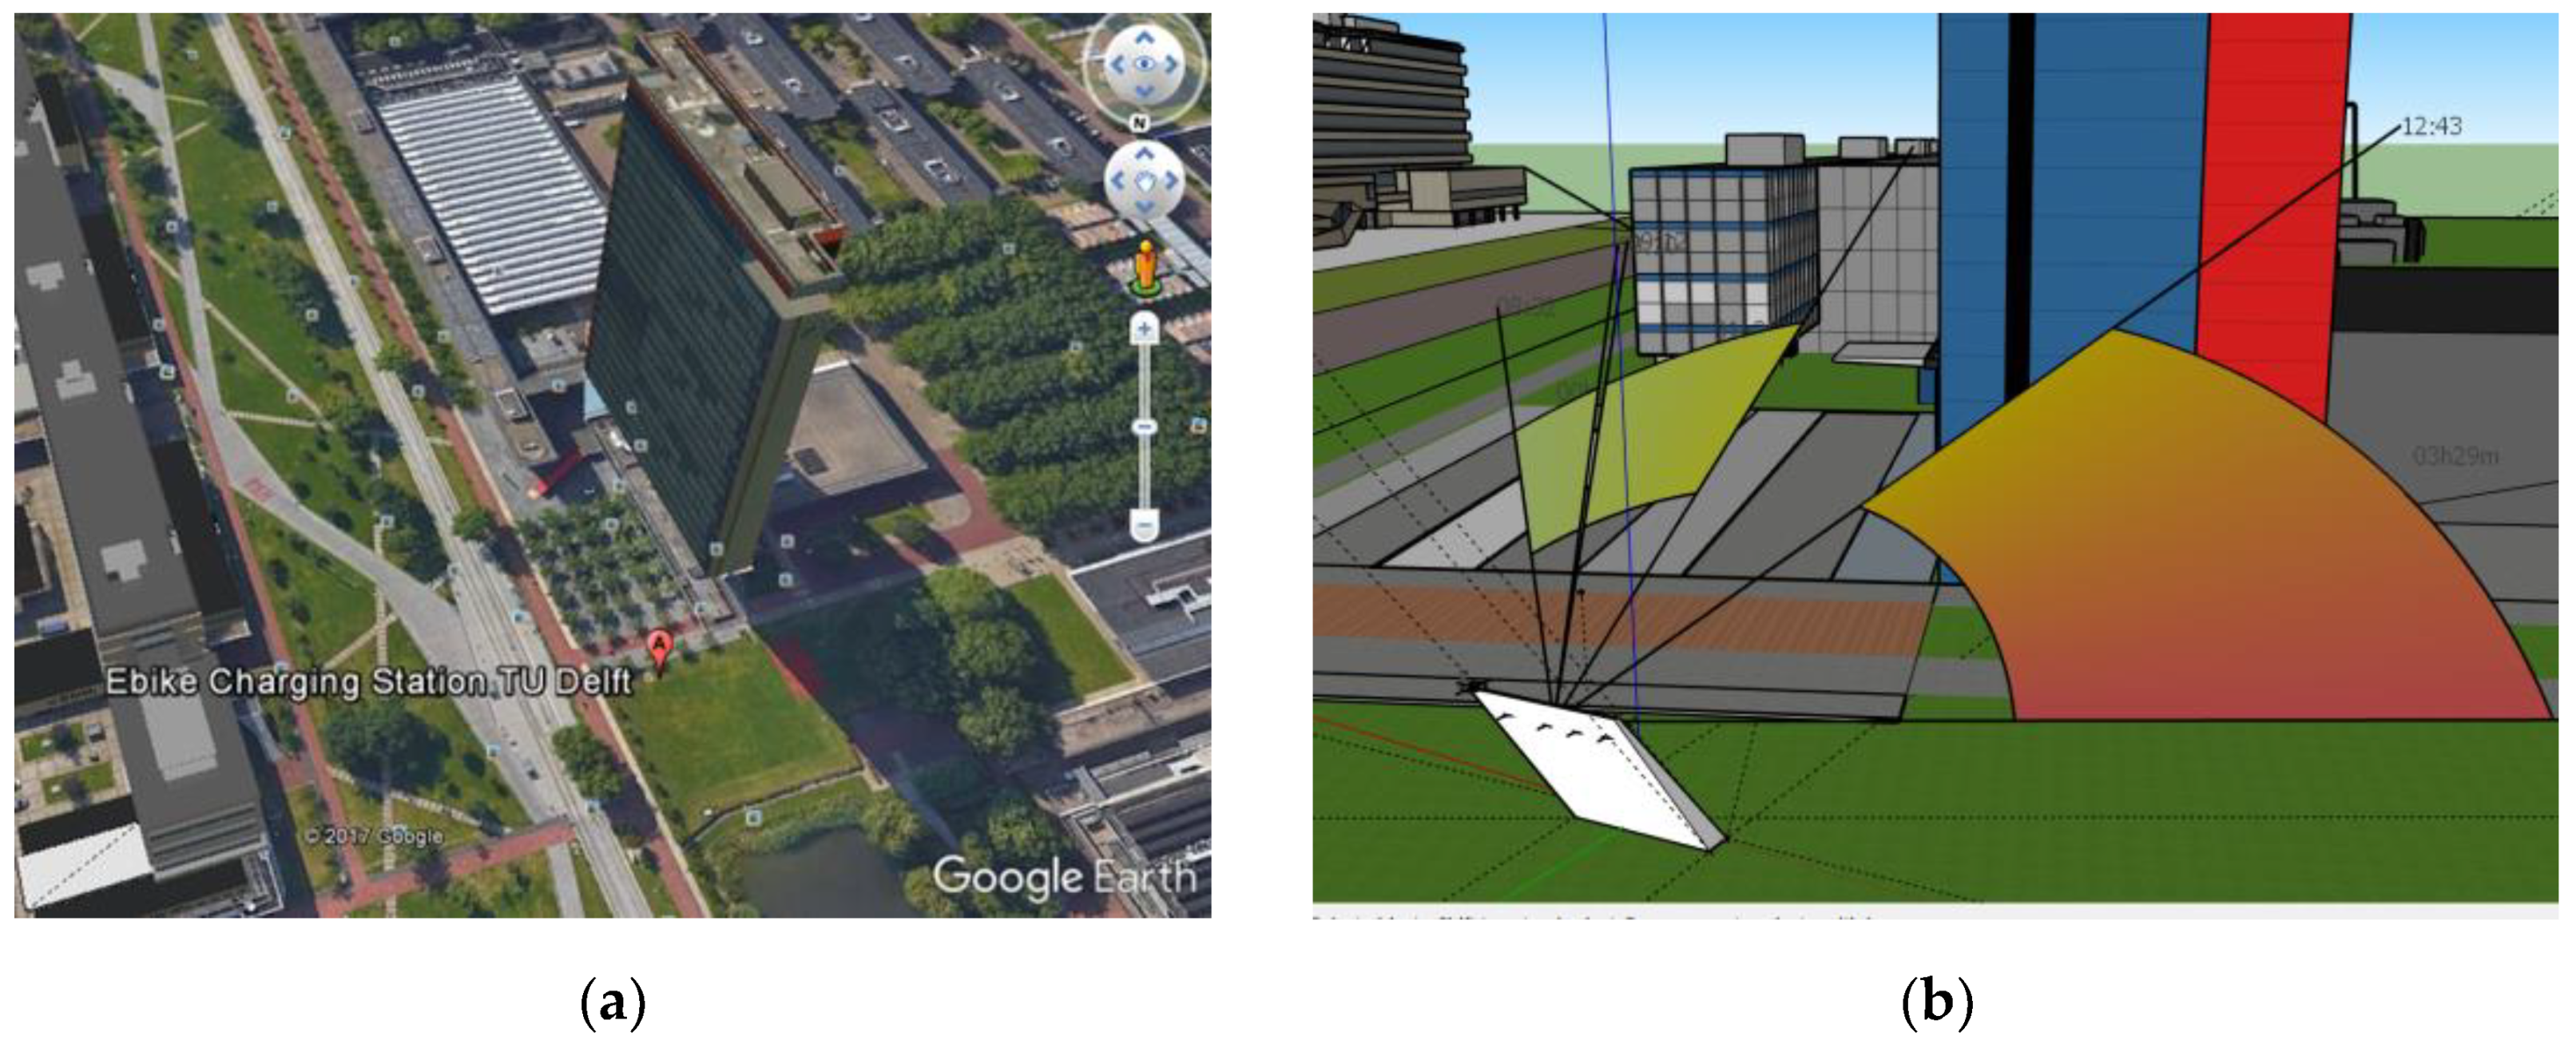
  • 3D modelling via Sketchup is used for PV shading analysis of the built environment, which provides much higher accuracy of yield estimation than the methods used in Reference [14].
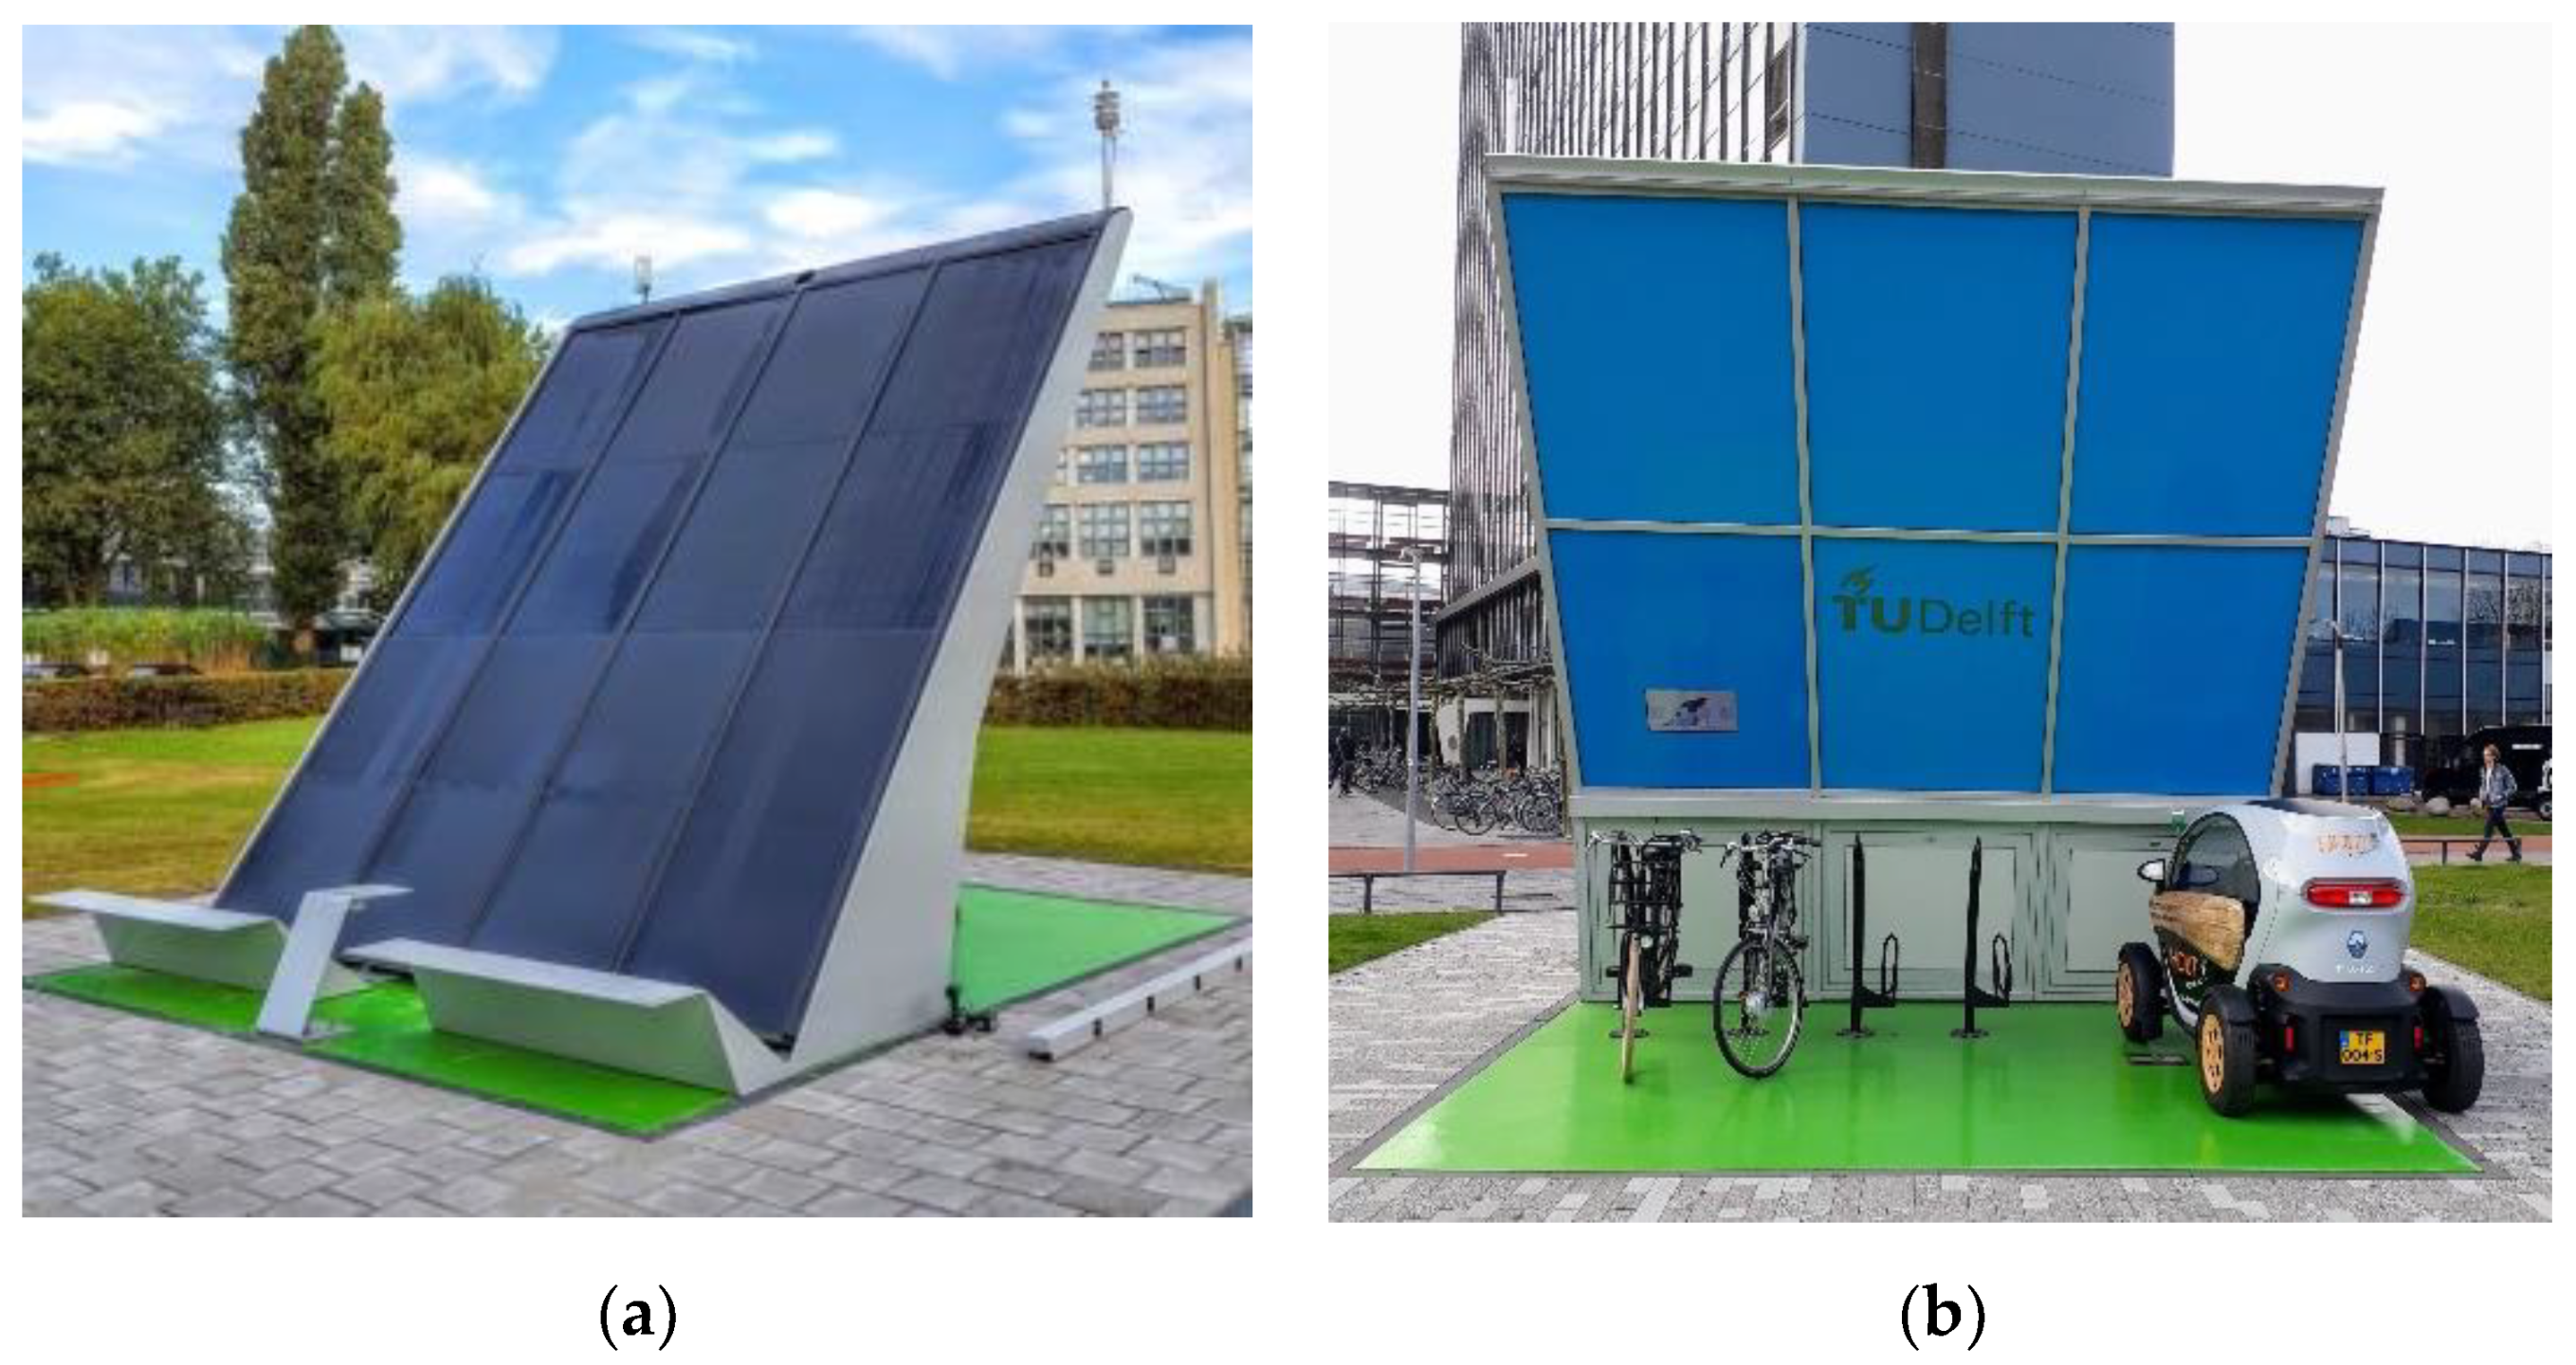
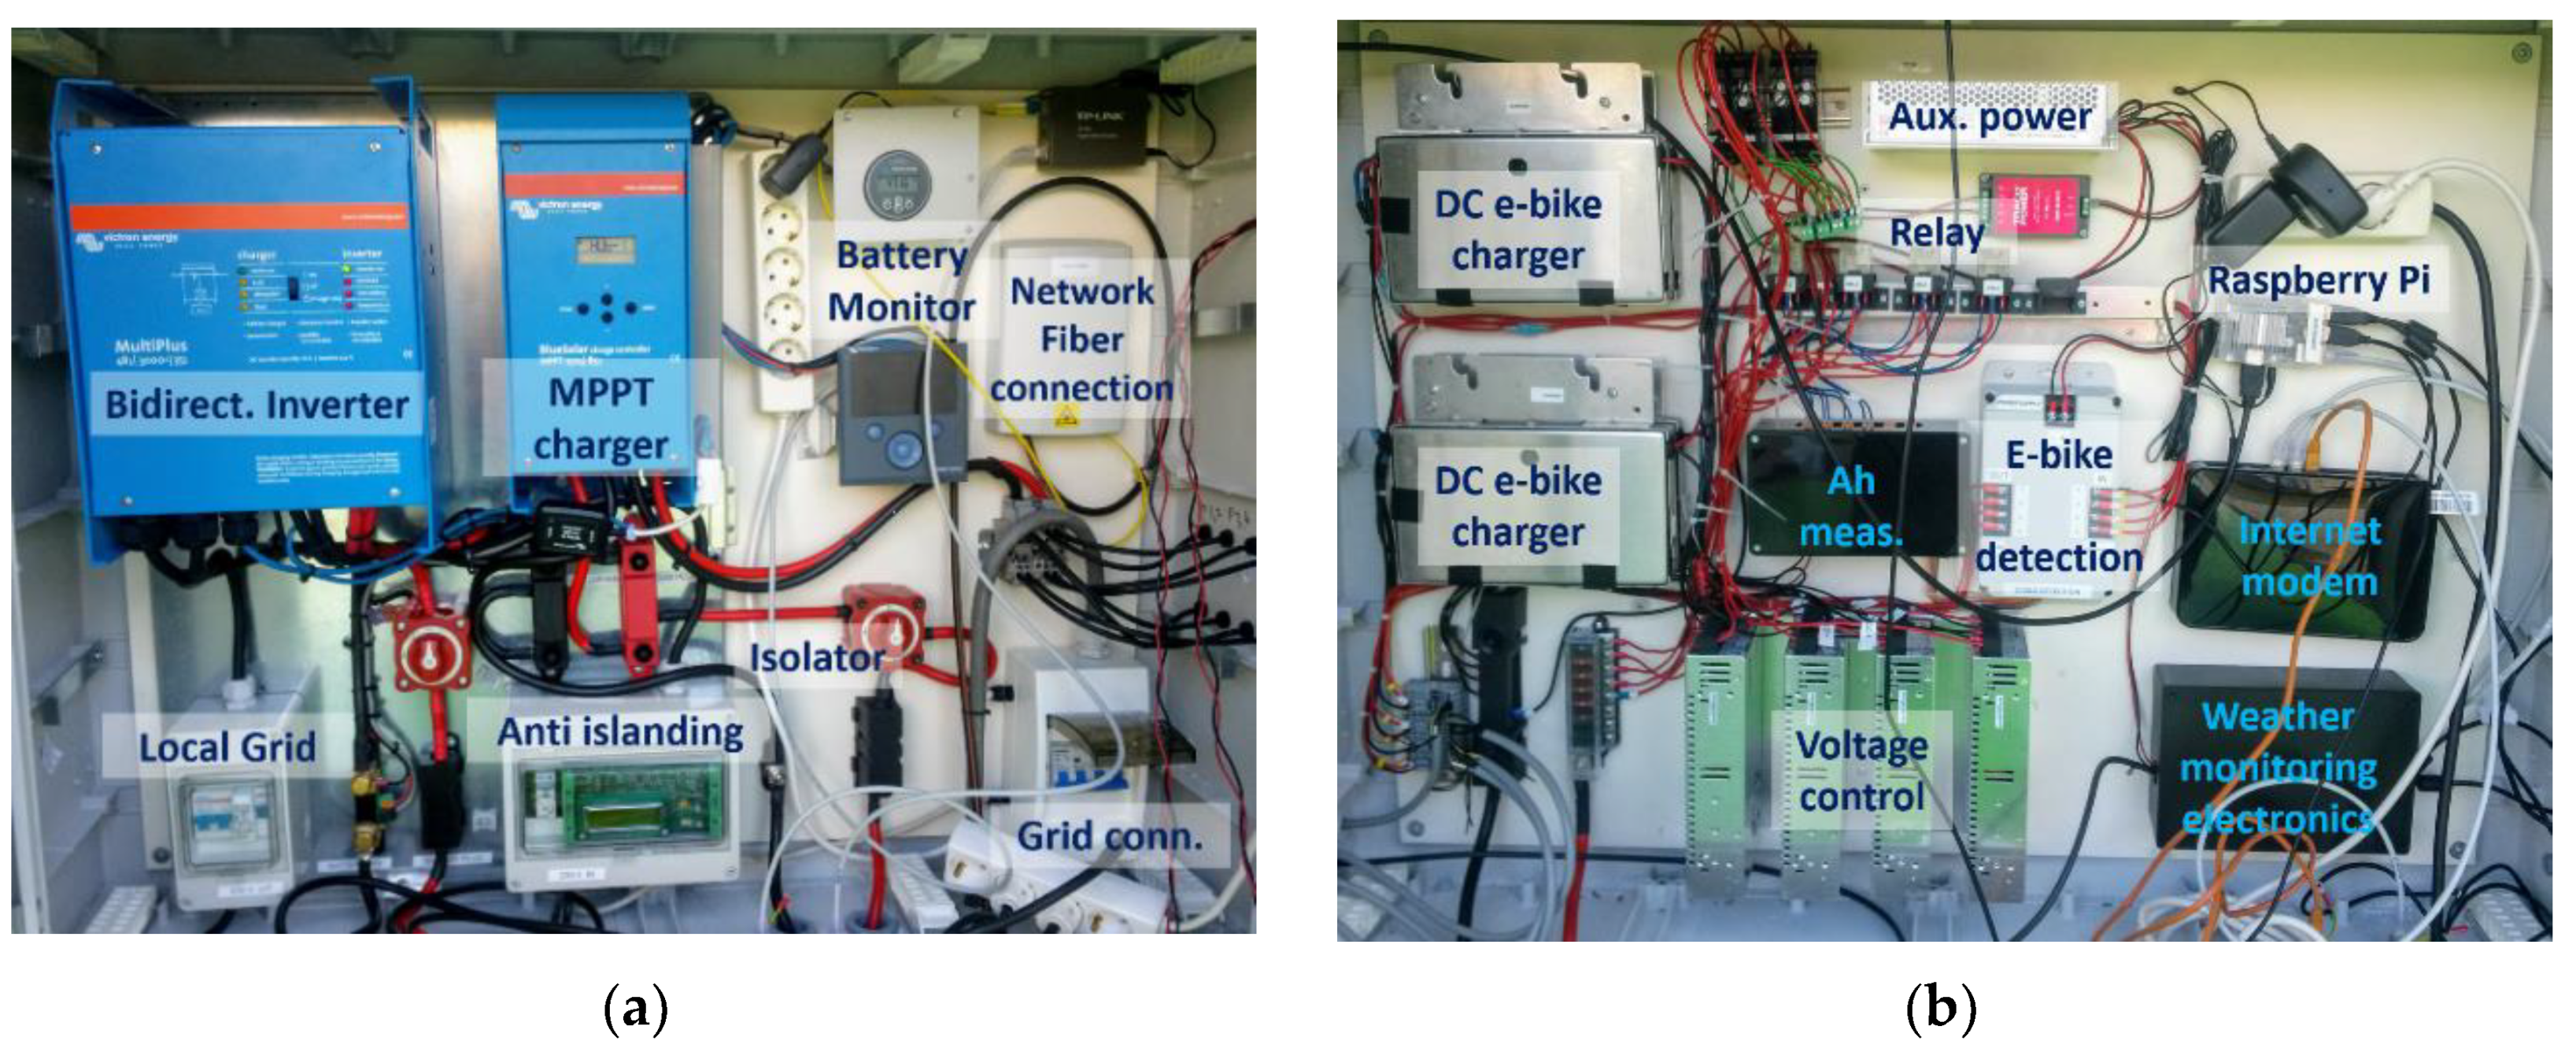
  • The physical structure of the charging station and the electrical design are cohesively integrated, which results in an environmentally-integrated PV system (EIPV), which is ergonomic, modular, safe, and designed for outdoor weather conditions. The EIPV provides 3-m3 internal cabinet space for all electronics, which removes the need for additional cabinets and, hence, increases the overall aesthetics.

1.4. Structure of the Paper

In Section 2, the system design of the e-bike charging station together with the characteristics of the charging demand and battery storage is explained. Section 3 investigates the PV system design and modelling to determine the energy yield, shading conditions, and optimal orientation of the PV system. Section 4, Section 5 and Section 6 explain the AC, DC, and wireless charging system of the e-bike, including simulations and building of the experimental prototype. Section 7 presents the development of the charging station, experimental measurements of yield, and power management strategies.

2. Solar E-Bike Charging Station

2.1. System Design

The electrical schematic and the specifications of the key components of the e-bike charging station are shown in Figure 3 and Table 1, respectively. The core of the system is a 48 V DC nano-grid, which supports the power exchange between all the components. The PV generation consists of eight modules arranged in four parallel strings. A Victron BlueSolar 150/85 maximum power point tracking (MPPT) converter is used to process power from the PV panels to charge the 48 V battery bank [38]. Isolated DC-DC converters and a high-frequency DC/AC inverter are connected to the 48 V DC nano-grid for DC and wireless charging of e-bikes, respectively.
The connection between the DC nano-grid and the 50 Hz AC grid is realized by a Victron Multiplus 48/3000 hybrid bidirectional inverter [38], which is equipped with two AC outputs. One output is connected to the single-phase AC grid. The second output powers both the e-bike AC charger and the lighting and system monitoring unit, such that the e-bike charging station supports the off-grid operation. Lastly, a Lufft WS503-UMB weather station measures the incoming solar radiation, ambient temperature, and local wind speed for monitoring and research purposes [39]. The system control and monitoring are done using a central Raspberry Pi controller, and a website provides users with feedback and data for scientific research (http://solarpoweredbikes.tudelft.nl).
The power balance equation of the system is:
P P V + P g r i d = P b a t t + P l o a d + P l o s s
where P P V is the PV power, P g r i d is the power drawn from the grid, P b a t t is the charging power of the battery, P l o a d is the power consumption of the station including that of the e-bikes and the baseload, and P l o s s is the total energy conversion losses.

2.2. Charging Demand

The PV system and storage of the charging station is sized to charge up to five e-bikes and a single e-scooter per day throughout the year, even under low winter insolation. Table 2 shows the specifications of the e-bike, e-scooter, and small car considered for the system sizing [40]. Each e-bike and e-scooter battery has a capacity of 396 Wh and 1920 Wh, respectively. A total of five such e-bikes and one e-scooter, assuming that they arrive with fully drained batteries (the worst case), would translate to a load of 3900 Wh. A baseload of 90 W is consumed by the display, controller, lights, and the weather station, which translates to 2160 Wh. If the charging demand and baseload are combined, the net demand is approximately 6.06 kWh per day. This is the same as the load of one Renault Twizy small electric car. If the charging demand is >6 kWh due to a higher number of e-bikes, then they can be charged by using PV power if the daily PV yield is >6 kWh or using the AC grid power via the DC/AC inverter up to 3 kW*24 h = 72 kWh per day.
Three types of e-bike charging methods are developed for the charging station: AC, DC, and wireless charging. The benefit of the AC charging is that it can be universally used for charging all e-bikes, e-scooters, and light EVs by using a charging adapter. On the other hand, for safety reasons, the DC charging is limited to 100 W but has the benefit that the users can simply use a DC cable between the station and the e-bike battery for charging. This DC charging negates the need for an AC power adapter and, hence, provides convenience to the user while plugging in and preventing any possible theft of the adapter. In the case of the wireless charging, the motive is to do away with the user’s need for cables altogether, which, therefore, increases the user convenience further [29,30].

2.3. Local Storage

The battery plays a crucial role in providing the off-grid capability to the charging station. The station has four lead-acid gel batteries of 220 Ah capacity each. The batteries are series-connected to 48 V and provide a usable capacity of 9.5 kWh, when operated at a maximum depth of discharge of 90%. With ~6 kWh demand per day, it can provide close to 1.5 days of autonomy to the system. Lead-acid gel batteries were preferred due to two reasons. First, they have a much longer lifetime than standard lead-acid batteries, and second, the cost is much lower when compared to lithium-ion batteries.
The preferred charging mode is to charge the batteries directly from the solar panels on DC. In the case of insufficient solar generation, the battery can be charged (and also discharged) from the AC grid using the DC-AC grid inverter. This bidirectional option can be useful for different grid support services such as peak shaving, reactive power compensation, energy arbitrage, or emergency backup power.

3. PV System Design

The 2.6 kW PV system is the primary source of power for the e-bike charging station. The PV generation potential is estimated based on solar insolation, wind speed, ambient temperature, panel orientation, and shading due to the surrounding terrain. The meteorological data Cabauw Experimental Site for Atmospheric Research (CESAR) database is used for the PV system modelling, which has a resolution of 1 min [41].

3.1. PV System Modelling

Using the CESAR data, the incident solar irradiance and the cell temperature of the PV panel are estimated for different azimuth and orientation using Equations (2)–(6) [42,43,44,45,46,47].
G d i r ( β , A m ) = G D N I   c o s ( θ i )
G d i f f ( β ) = G D H I   ( 1 + c o s β ) / 2
G g n d = G G H I   ρ ( 1 µ s v f )
G = G d i r ( β , A m ) + G d i f f ( β ) + G a l b
T c e l l = Φ G + h c T a m b + h r , s k y T s k y + h r , g r T g r h c + h r , s k y + h r , g r
where G d i r , G d i f f , and G g n d are the direct, diffused, and ground irradiance incident on the module with a tilt β and azimuth A m , G D N I ,   G D N I and G G H I are the direct normal, diffuse horizontal, and global horizontal irradiance, θ i is the angle of incidence of the direct irradiance beam on the panel, Φ = 0.727 is the absorptivity, ρ = 0.2 is the albedo (measured using albedometer), µ s v f is the sky view factor, h c , is the coefficient for convective heat transfer h r , s k y , h r , g r are the coefficient for radiative heat transfer to the sky, and to the ground, respectively, and T a m b , T s k y , T g r ,   and   T c e l l are the ambient, sky, ground, and PV cell temperature, respectively. In this case, the heat transfer coefficients are estimated using an iterative procedure, where T s k y = 0.0522   T a m b 2 / 3 . Lastly, the output power of the PV modules P P V can be calculated.
P P V = P S T C ( G G S T C ) { 1 γ ( T c e l l 25 ) }
where P S T C = 327 W is the module power at Standard Test Conditions (STC), G S T C = 800 W/m2 is the irradiance under STC, η = 20.3% is the efficiency of the modules, and γ = −0.3%/°C is the module temperature coefficient for the Sunpower X20-327-BLK modules.

3.2. PV System Orientation

Based on the meteorological data of 2013, the yield of the PV system is estimated for different fixed orientations. For the whole year, considering a fixed orientation, a tilt of 28° and azimuth facing south was found to result in maximum annual yield [6]. Figure 4 shows the average daily yield of the south-facing PV system for each month, considering various fixed tilt angles between 0° and 90°. It can be clearly seen how the tilt angle has a major influence on the monthly yield, especially in the summer months.
Figure 4 also shows the average daily yield if a two-axis tracking system is used. First, it can be seen that the tracking system has a much higher yield as it tracks both the azimuth and tilt when various tilt angles are considered in which the azimuth is fixed. Second, it can be seen that the increase in yield due to tracking is very small for the winter months as most of the irradiance is diffused irradiance. Due to the higher cost of the tracker and the need for a fixed structure for the bike shelter, tracking systems were not further considered in this study.

3.3. Optimal PV System Design

In order to get the maximum annual yield, the PV system could have been oriented at a tilt of 28° and azimuth facing south. However, the motivation is to ensure that there is sufficient generation in December, which has the lowest solar irradiation in the year. For December, the optimal tilt for maximum monthly yield was 65°. This is shown in monthly yield estimation for December in Figure 5a for different PV orientations.
On the other hand, when the tilt is increased from 28° to 65°, the annual yield is dramatically reduced by up to 20%. Hence, a tradeoff was made to set the tilt angle at 51°, which results in <5% reduction in annual yield compared to 28° and 1% reduction in December yield compared to 65°.

3.4. Shading Analysis

Since the e-bike station is installed at the ground level, shading from nearby buildings (especially the tall electrical faculty building) has a significant impact on the PV system output, as shown in Figure 6a. To account for the shading due to the adjacent buildings, their 3D models were made using Sketchup. Figure 6b shows the shading caused by the tall Electrical Faculty building in front of the bike station in the afternoon. The plug-in LSS-Chronolux 3D is then used to estimate the sky view factor µ s v f = 0.61 and the per minute shading factor S s h as well as the corresponding direct irradiance including the shading, G d i r ( β , A m ) s h :
G d i r ( β , A m ) s h = S s h G d i r ( β , A m )

3.5. PV System Yield

Using the 2013 CESAR data and the shading analysis, the PV yield of the system is estimated. The corresponding annual energy yield is 2012 kWh/year, which provides an average daily yield of 5.51 kWh/day, as shown in Figure 5b. Based on the charging demand (Section 2.2), the PV system is sized to a rated power of 2.61 kWp. This means that >90% of the total load demand can be supplied by the PV system on average. At the same time, we have to keep in mind that there is about six times the difference in energy yield between the winter and summer months, as shown in Figure 5b. This results in the load being met on about 180–200 days of the years. That is why a grid connection is required to provide the energy demand in winter, as seen in Equation (1). While the battery cannot provide seasonal storage, it can facilitate off-grid operation and help manage the diurnal solar insolation variation.
The highly efficient Sunpower X20-327-BLK modules with a relatively high cost per watt peak are chosen since this reduces the total area occupied by the PV system. The tradeoff is that, in return, the lower area significantly reduces the quantity of steel required for the station structure, which has a relatively higher cost for both material and labour.

4. AC E-Bike Charging

The e-bike charging station provides a single 230 V 50 Hz schuko wall socket for AC charging of e-bikes through the use of a charging adapter. The benefit of the AC charging is that it can be universally used for all light EVs providing up to 16 A charging current, which corresponds to a power of 3.7 kW. This is more than sufficient to charge a small electric car like the Twizy as shown in Figure 2b, which requires a charging current of 10 A. By using the hybrid grid inverter, the AC charging is possible in both grid-connected and an off-grid mode.

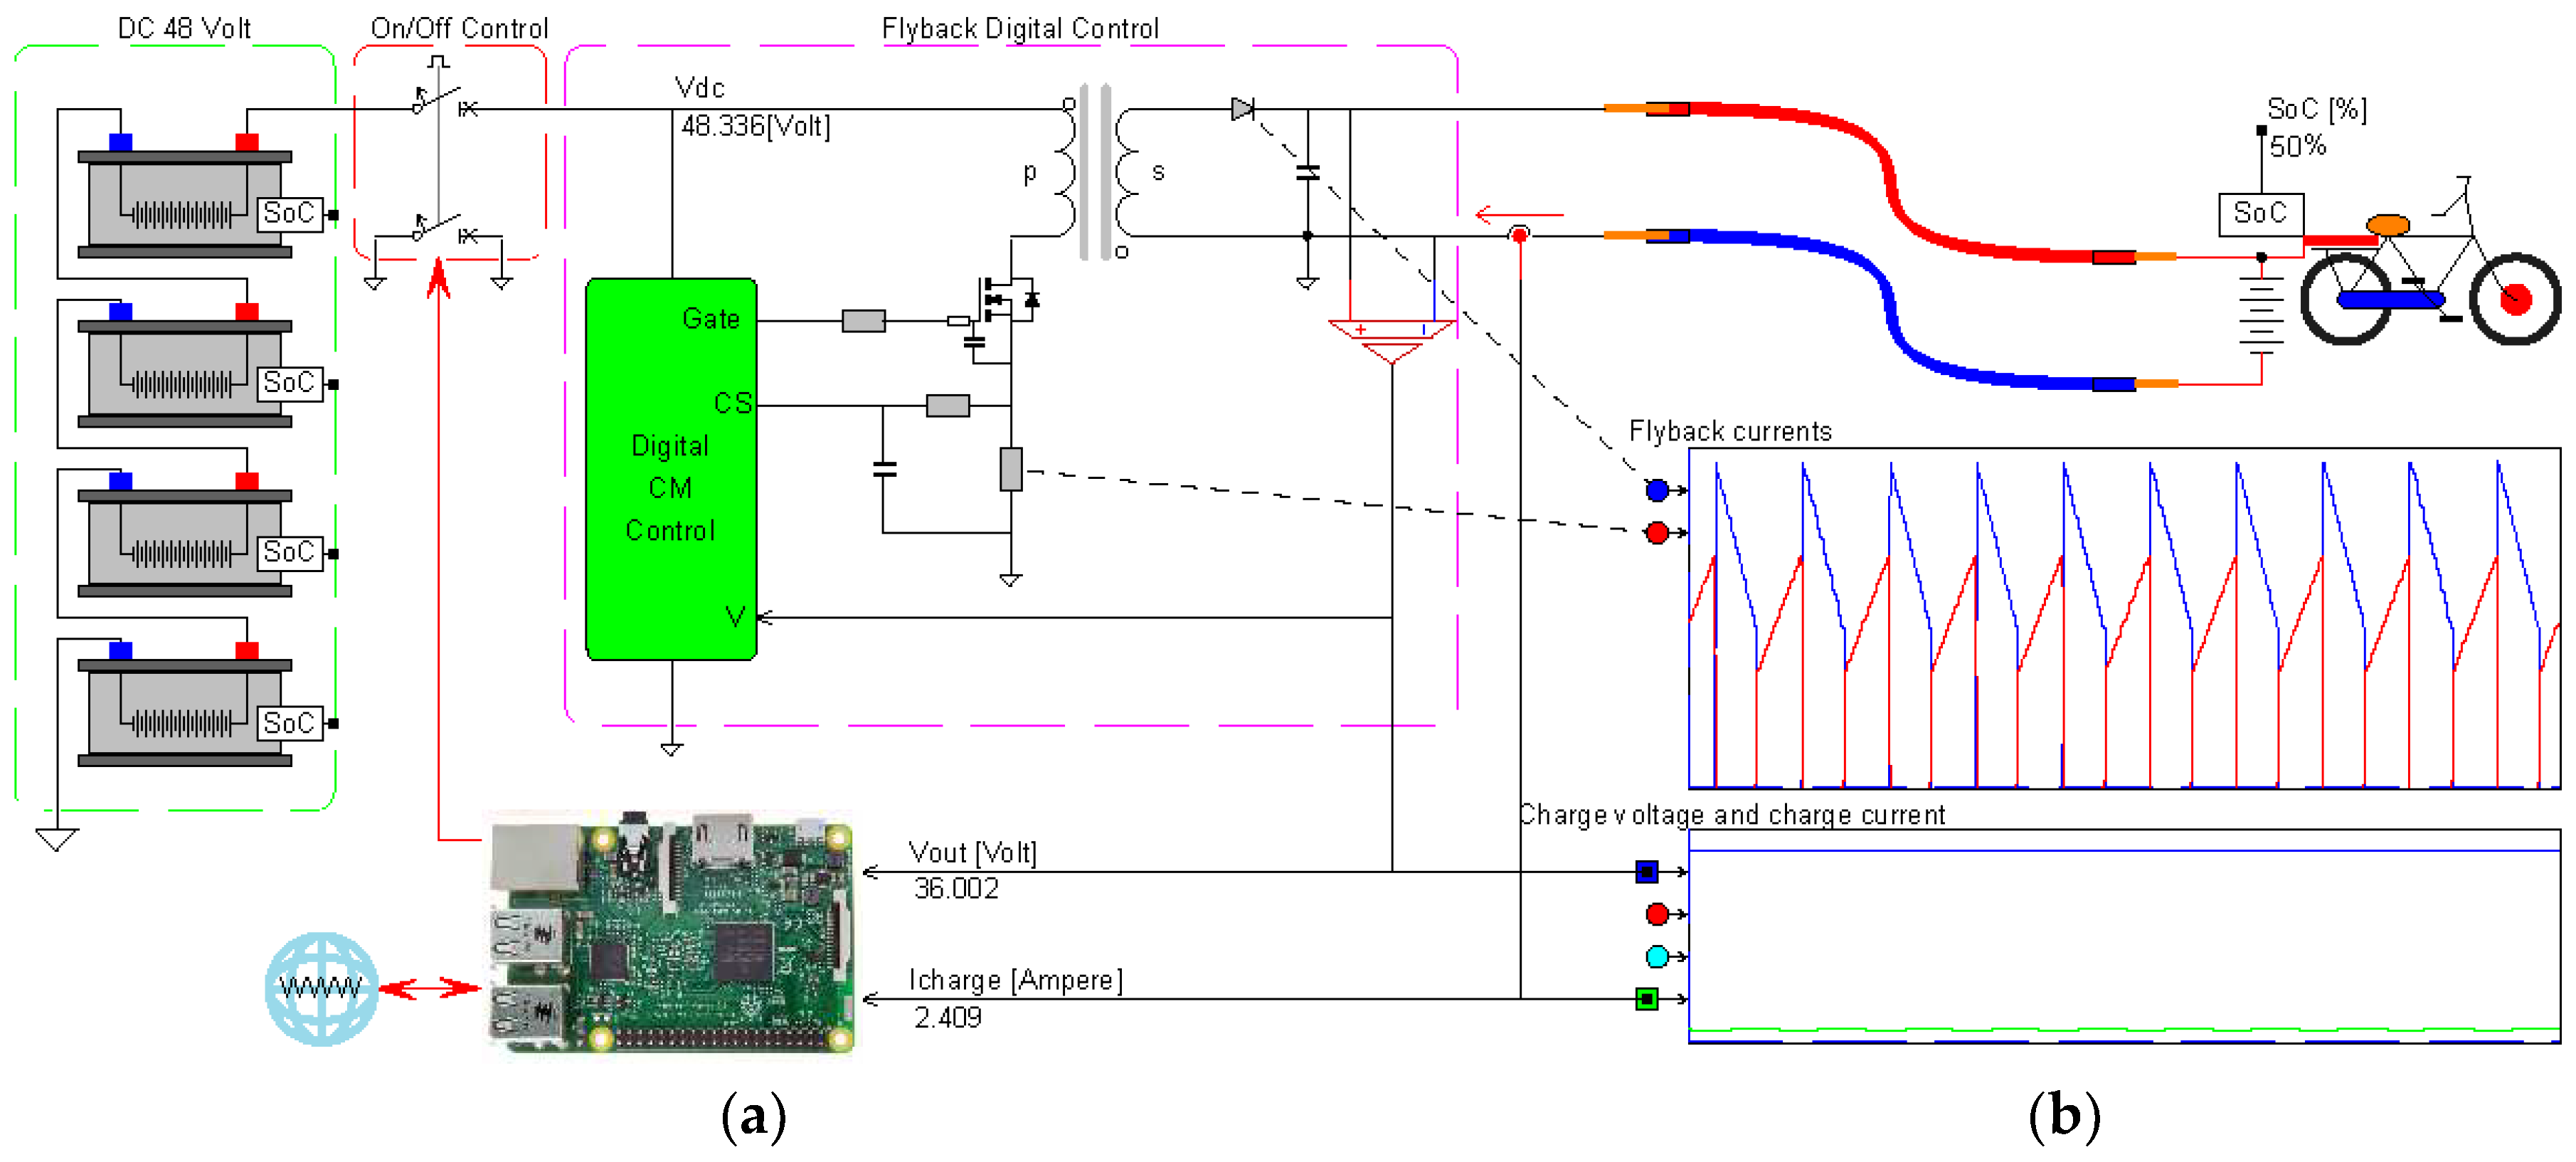
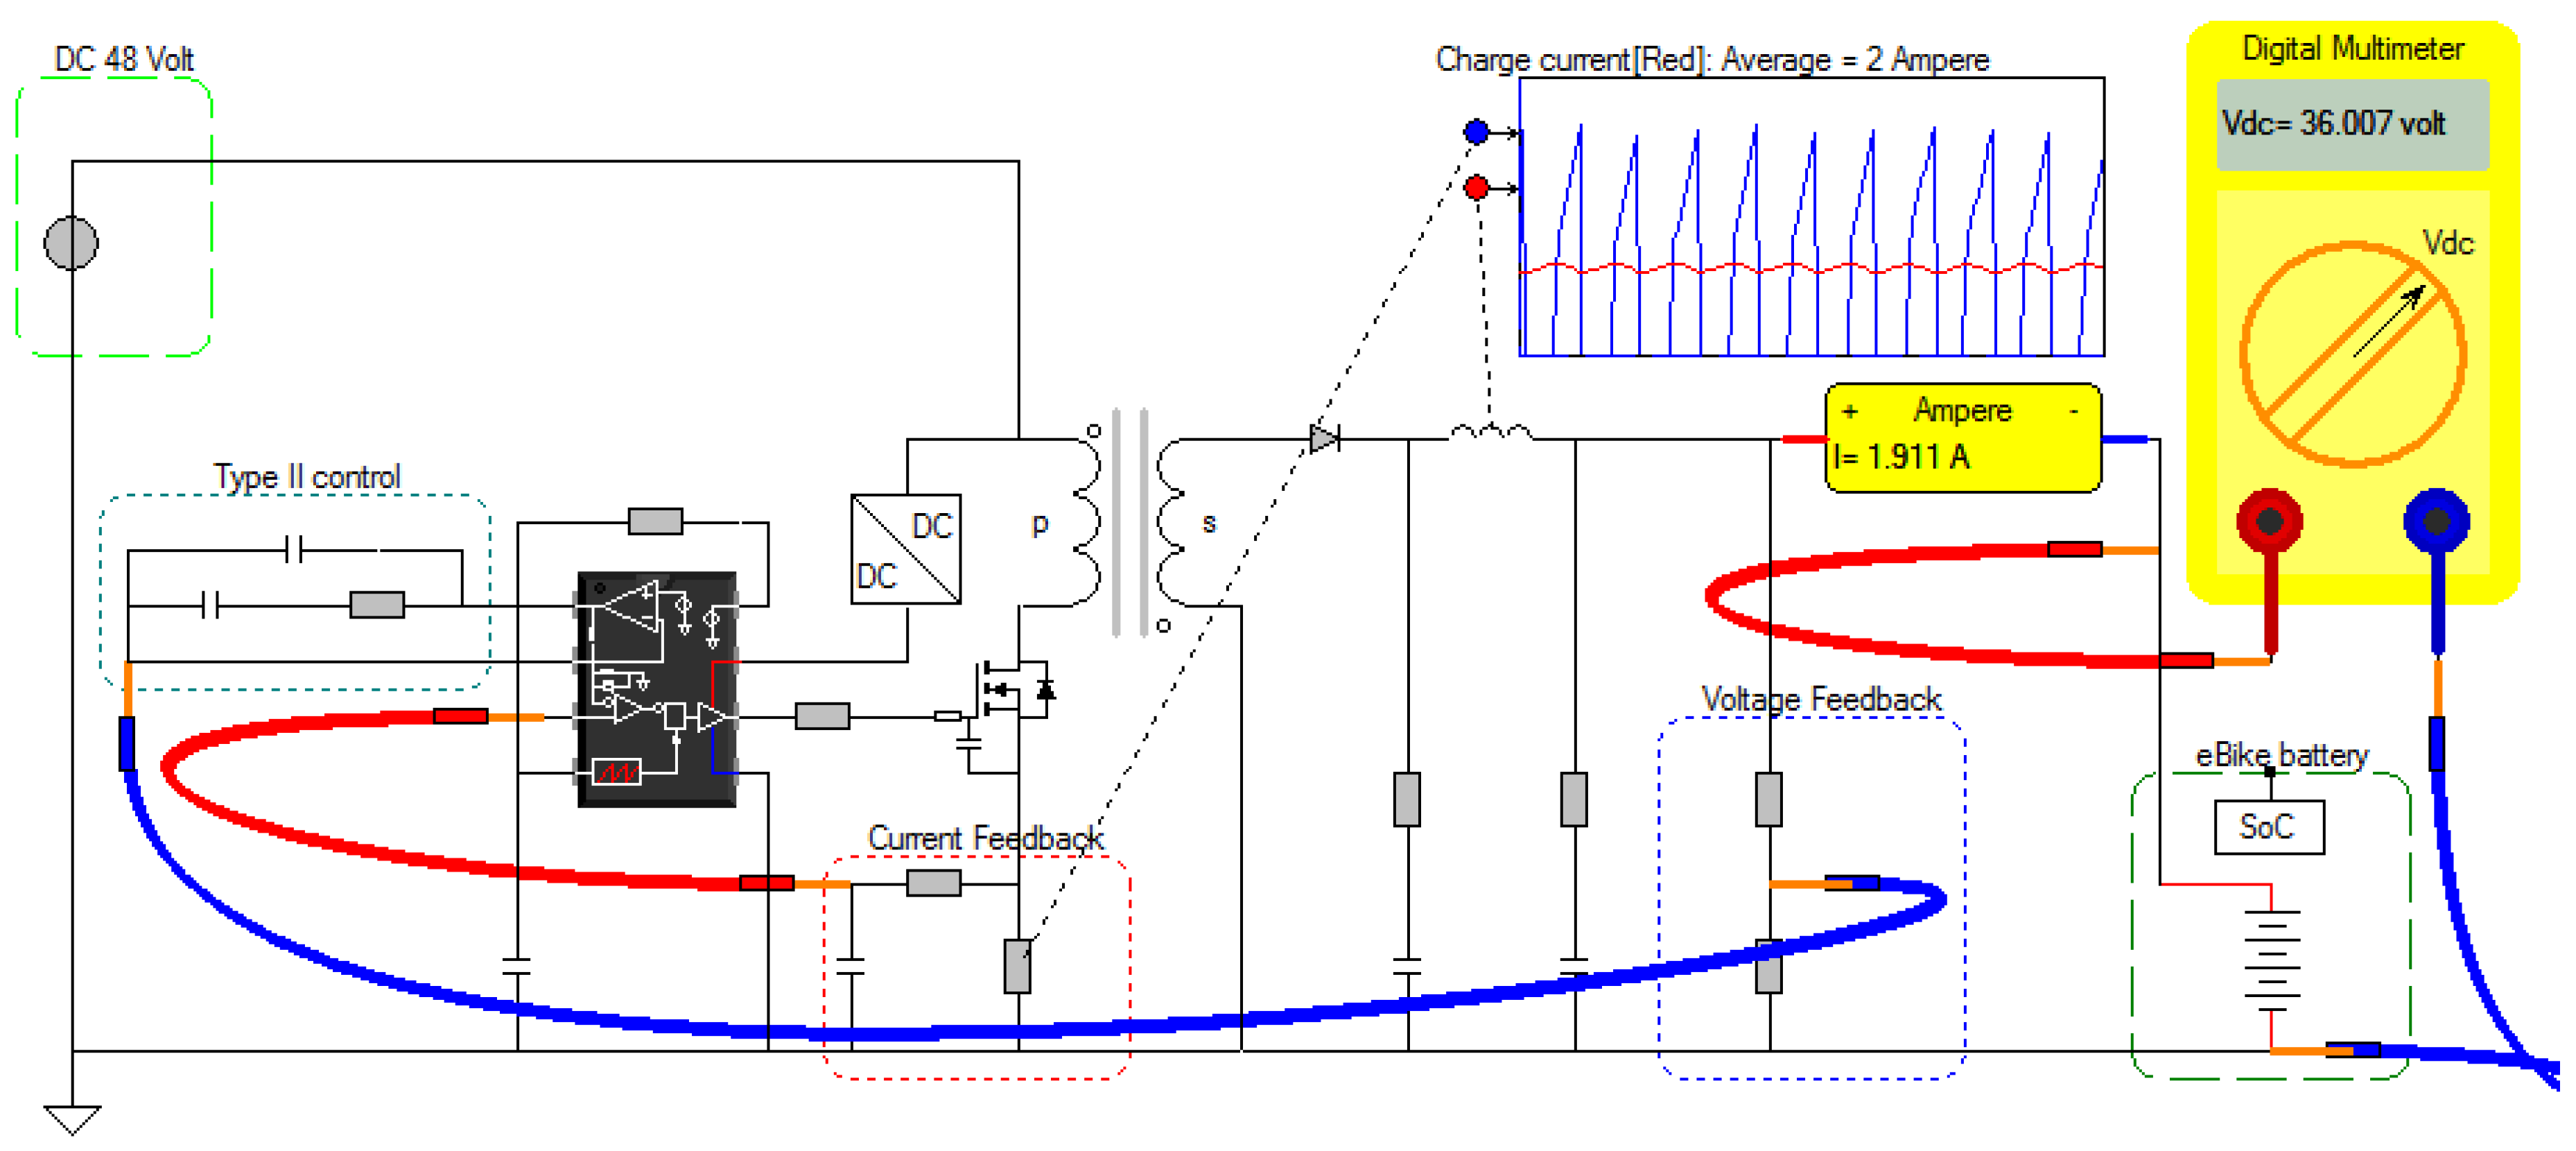
5. DC E-Bike Charging

The DC chargers for the e-bikes should provide galvanically-isolated DC power that is controllable in both output voltage level and maximum charging current, based on the e-bike battery. A dual interleaved quasi-resonant flyback converter with digital current-mode control from Involar is chosen for this task [14,48]. As shown in Figure 7a, the primary side of the flyback is operated directly from the 48 V DC nano-grid. The secondary side of the flyback is connected to the DC cable that the user has to plug into the charging inlet of the e-bike battery. The input current ripple is reduced by half due to the interleaving. The magnetically coupled inductors are wound to have minimum parasitic leakage inductance to reduce the Electromagnetic interference (EMI) and the voltage stress on the MOSFET.

5.1. Current Mode Control

Depending on the required output power to charge the e-bike battery, the current level in the primary circuit of each flyback is regulated using the current mode control. Each flyback employs two control loops that control the gate of the MOSFET, represented in Figure 7a by the green block, and shown in detail in Figure 8. The inner control is a digitally implemented current mode controller implementing quasi-resonant switching. In this case, the internal current control (curved red line) regulates the amount of energy that is allowed to flow out of the charger and, in that way, sets a limit on the maximum continuous output current, typically 1 A or 2 A. The outer voltage feedback (curved blue line) controls the maximum output voltage of the charger and, accordingly, turns the charger on/off. The maximum output voltage is limited to the nominal voltage expected by e-bike’s battery management system, which is typically 24, 36, and 48 volts. A Type-2 control is implemented and is shown on the left side of the control IC in Figure 8, including the current mode controller and gate driver [49].

5.2. Design and Simulation of the Flyback DC Charger

The flyback converter is designed based on the design procedure for a quasi-resonant operation [10]. Figure 7b shows the simulation of the e-bike charger in Caspoc, where only a single leg flyback is shown for simplicity [50,51]. The multi-level modelling method is employed, which allows the modelling of both the power electronics circuit and the hybrid control consisting of the inner current and outer voltage control loop [52]. The simulation takes into account the delays of the digital feedback compensation as well as the delays caused by switching of the MOSFET. Voltage overshoot caused by the non-coupled parasitic winding inductance is taken into account in the simulation, but not shown here in Figure 7b for clarity.
Figure 7b shows the primary and secondary currents for a duty cycle of 50% in a continuous conduction mode for a switching frequency fs = 100 kHz and turns the ratio of Np:Ns = 48:36. The scope clearly shows the difference in the voltage level on the primary side of 48 V, and secondary side of 36 V, and the charging current of 2.4 A, which is measured on the second scope.

5.3. Safety and Monitoring

As long as no e-bike is connected, the mechanical on/off switch on the flyback’s primary side (Figure 6a) is in the off position. As soon as an e-bike battery is connected to the flyback’s secondary side, the voltage is monitored, and the switch is set to the ‘on’ position. This subsequently powers the flyback converter and its internal control. If either the connection with the e-bike’s battery is removed or the charging current drops below the minimum charging current threshold, the outer control turns off the flyback converter by setting the On/Off control to its off position.

5.4. Hardware Realization and Losses

Figure 9a shows the hardware of the flyback DC charger [48]. On the primary side, IRFS4321PBF MOSFETs with low on-state resistance Rds(on) = 15 mΩ and, on the secondary side, MBR10150 schottky diodes with negligible reverse recovery losses are used. The primary current is sensed using a low ohmic sense resistor placed between the MOSFET source and ground, which is filtered using a low pass first-order filter. In this way, the maximum power is limited by the maximum primary current. The output voltage is measured and, after filtering, sampling is input to the current mode controller. The feedback amplifier with a Type-2 compensation network is replaced by its digital equivalent 2-Pole, 2-Zero compensator [2p2z].
For the converter losses, the worst-case operating point is at the lowest output voltage of 24 V and maximum power of 100 W, which corresponds to a current of 4.2 A. For the dual interleaved flyback converter, each converter delivers 50 W and 2.1 A current. The MPR10150 diode has a maximum forward voltage Vf = 0.6V at 2.1A, conducts only 50% of the time, and, therefore, has Pd = 50% (2.1A)(0.6V) = 0.62 W losses. The average input current for each converter and an input voltage of 48V is roughly Iin = 1A. Considering a nominal 50% duty cycle, this will give a peak input current Ipk = 4 A and an RMS value of Iin(rms) = 1.7 A. This results in a maximum conduction loss of (Iin(rms))2 Rds(on) = 44 mW. As a rule of thumb, the switching losses are of the same magnitude of maximum and twice the conduction losses, which gives a total of conduction and switching losses of Psw = 3(44 mW) = 132 mW. Cooling via the PCB is, hence, sufficient in this case.
Figure 9b shows the custom-designed cable that is used to connect the e-bike to the output of the flyback converter in the charging station. The right-side plug is magnetic and, hence, easily attaches to the station, while the left side plug attaches to the e-bike battery. If required, a custom-designed adapter is made for the e-bike side plug based on the manufacturer-specific connector on the user’s e-bike. This points to the need for standardization in DC e-bike charging and plugs similar to what was achieved with CCS and CHAdeMO in electric car charging [53].
Figure 9c shows the charging current of two e-bikes in which each was charged using the flyback based DC e-bike charger. For charger 1, the battery gets charged according to the Constant Current, Constant Voltage (CC-CV) principle beginning at a current of 1.3 A, and then slowly reducing to zero. For charger 2, the battery charging begins in the CV region due to the relatively high state of charge (SOC) of the e-bike battery. It can be observed how the e-bike is disconnected at 120 min and then connected again after about an hour.

5.5. Battery Connection Communication

The internal digital control employs an automated voltage level detection to allow the direct connection to either a 24 V, 36 V, or 48 V battery. An automated output voltage level detection of the battery voltage is achieved through the outer control loop that compares the output voltage to the reference value. The outer control loop subsequently regulates the amplitude of the primary current pulse through the inner loop. The Raspberry Pi is used to control the flyback operation and to monitor the output voltage and charging current. Connected to the Internet, it exchanges and logs information with a server operating in the cloud.

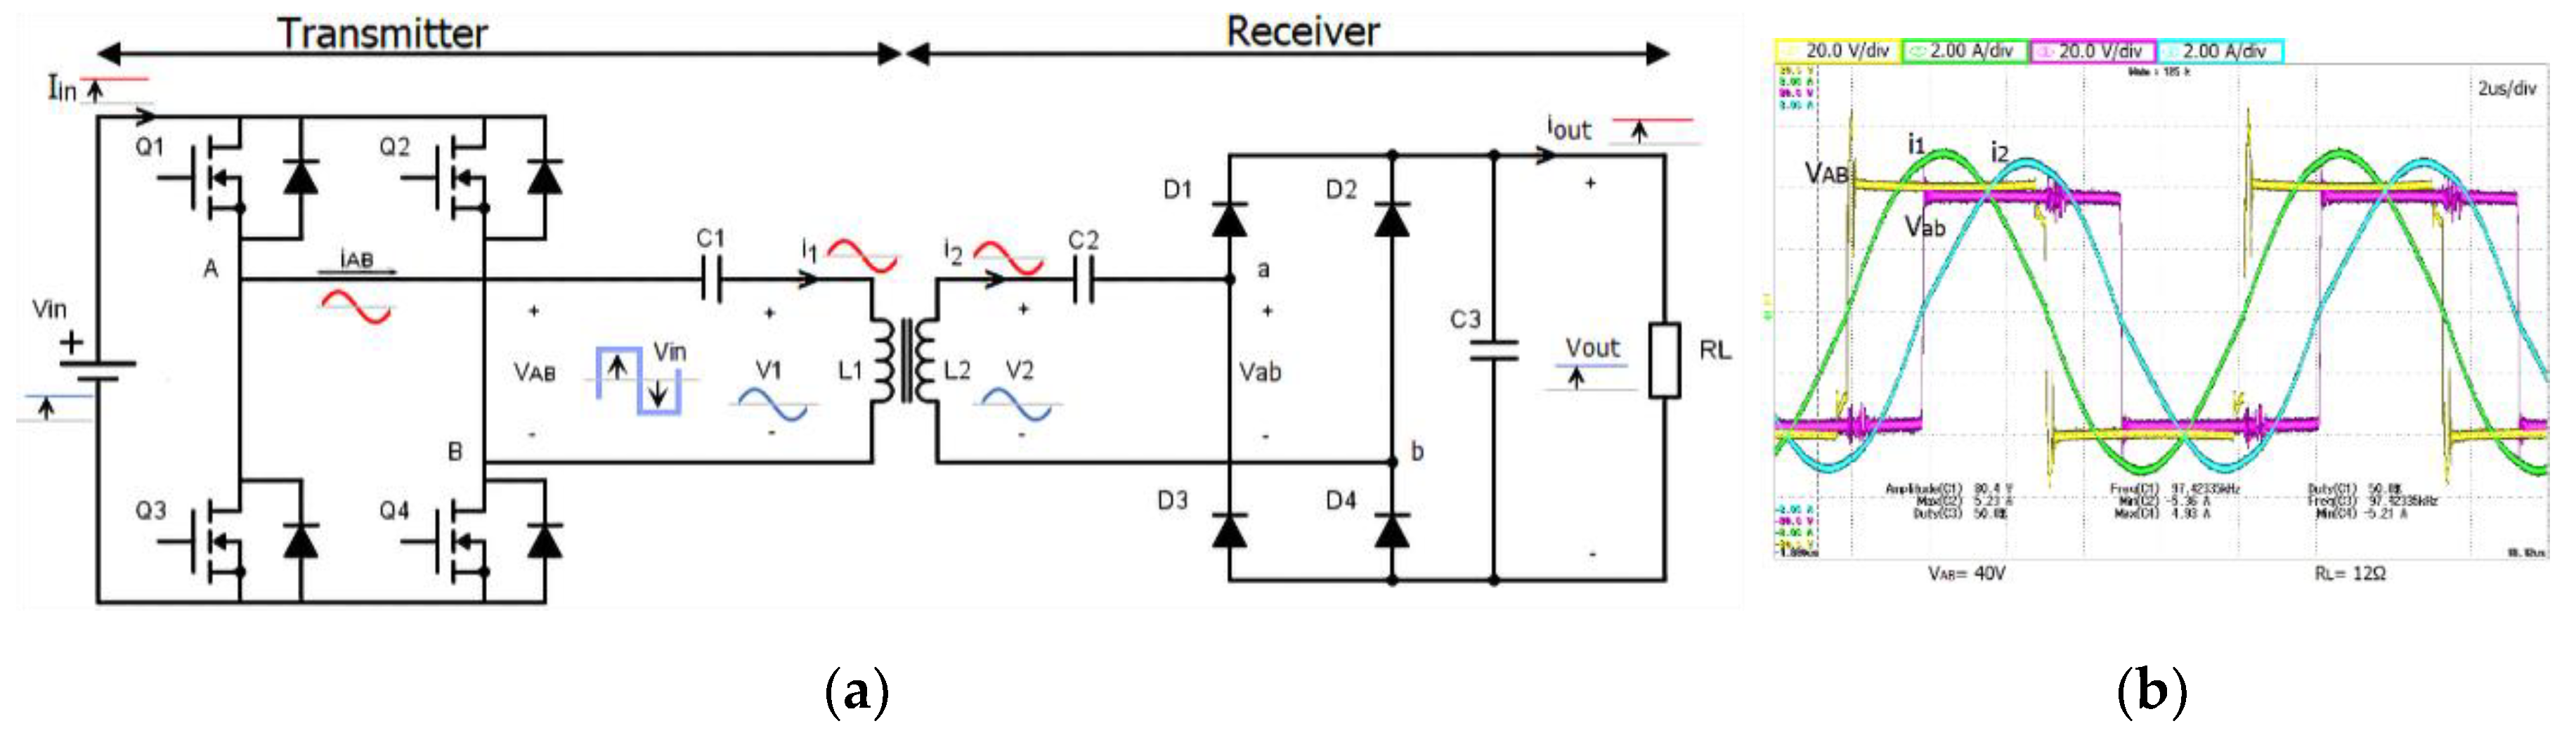
6. Wireless E-Bike Charging

Wireless charging provides the most convenient and safe experience for the e-bike user. The cyclists do not need to bring along cables and power adapter because the charging process is facilitated through the bike kickstand, as shown in Figure 10. The developed charging system is started once the bike is parked on the appointed parking spot, which is a 30 × 30 cm tile underneath the solar charging station. On the tile, the users have the possibility to park their bike in any position, which makes the wireless charging convenient. On top of that, the wireless charging has intrinsic galvanic insolation, which does not require the users to touch any conductive parts such as cables and connectors that might become dangerous, especially in wet weather conditions.

6.1. Wireless Power Transfer via Resonant Circuit

Figure 10, Figure 11a and Table 3 shows the schematic, circuit diagram, and specifications of the wireless power transfer system for the e-bike that works based on inductive power transfer through magnetic resonance. In the developed system, the transmitter coil is located under the charging tile, and it is formed by a U-shaped ferromagnetic core with a winding located at the center. On the other hand, the receiver coil consists of the double kickstand of the e-bike. This coil has a similar magnetic circuit as the transmitter coil but, in this case, the ferromagnetic core is closer to a V-shape to resemble the structure of commercial double kickstands.
Once the bike is parked over the tile, the two coils become coupled, which is equivalent to saying that the magnetic circuit becomes closed, and the charging process is ready to start. In a traditional transformer, the coils are strongly coupled because they are wounded around the same ferromagnetic core, and the airgap’s order of magnitude is not comparable to the core’s dimensions. On the other hand, when the two coils become coupled, the proposed magnetic circuit has two airgaps of about 5 mm, which are less than one order of magnitude smaller than the cross-sectional area of the core. Therefore, in this case, the equivalent transformer has a high leakage inductance and, consequently, is loosely coupled.
The capacitors C1 and C2 compensate the coils’ reactive power and form a resonant circuit together with the inductor coils L1 and L2, which is tuned to the resonant frequency f 0 . The estimation of C1 and C2 and the Kirchhoff voltage law equations of the circuit schematic can be found in Equations (9) and (10).
ω 0 = 2 π f 0 C 1 = 1 ω 0 2 L 1   C 2 = 1 ω 0 2 L 2
4 π V i n = ( j ω L 1 + 1 j ω C 1 ) I 1 + j ω M I 2 0 = ( 8 π 2 R L + j ω L 2 + 1 j ω C 2 ) I 2 + j ω M I 1
As shown in Figure 10, the wireless charging system draws power directly from the 48 V DC nano-grid. The DC input voltage is then inverted such that a high-frequency voltage supplies the transmitter resonant circuit, which is also called the primary circuit, and the current produces a magnetic field that links to the secondary coil. The high-frequency voltage induced in the secondary circuit is then rectified, and its value is regulated via a DC/DC converter to be supplied correctly to the battery.

6.2. Variable Frequency for Misalignment Tolerance

Since the cyclist has flexibility in parking the bike, the coupling between the two coils can vary. Moreover, depending on the state of charge of the battery, the loading condition also changes during the charging process. On top of that, the value of the circuit components can change because of an increase in temperature or degradation with time. All these factors make the resonant frequency of the system vary from the designed value. To overcome this problem, the inverter’s operating frequency is set by the inner control loop that tracks the natural resonant frequency of the system. For this reason, it is called auto-resonant frequency control. It sets the soft switching of the inverter by predicting the primary current zero-crossing depending on the current slope. This control circuit is simple, analog, fast, and it automatically adapts the operating frequency to the optimum value in a few periods.

6.3. Communication with the Bike and Foreign Object Identification

The communication between the e-bike and the charging station allows the start-up, shut-down, and foreign object detection. It is realized through backscatter modulation in the power line through amplitude shift keying (ASK) modulation. In this way, the information can be reflected by one side to the other by modulating the voltage of the resonant circuit between a low and high value with a frequency lower than the operating one (about 1 kHz). To send information via ASK from the e-bike to the station, a resistor in series with a switch connected across the output DC voltage is used. When the switch is in an open or close position, ASK assumes a high or low value (due to a voltage drop across the resistor), respectively. These binary values can be organized in sets of bits that form the messages of the communication system. Once a message is received, it is demodulated and interpreted for execution.
The wireless charging system has to be able to detect and stop the charging process if a foreign object is placed on the surface of the transmitter coil. This is because the magnetic field can potentially heat the object through eddy currents, and could lead to fire or injury. This is because either the charging process is not started or the ongoing charging process is stopped if a foreign object is detected. The first scenario is avoided because the charging begins only if proper communication messages are sent by the e-bike. On the other hand, efficiency measurements of the power transfer can indicate if a foreign object is receiving part of the transferred power, which results in a lower efficiency level than expected.

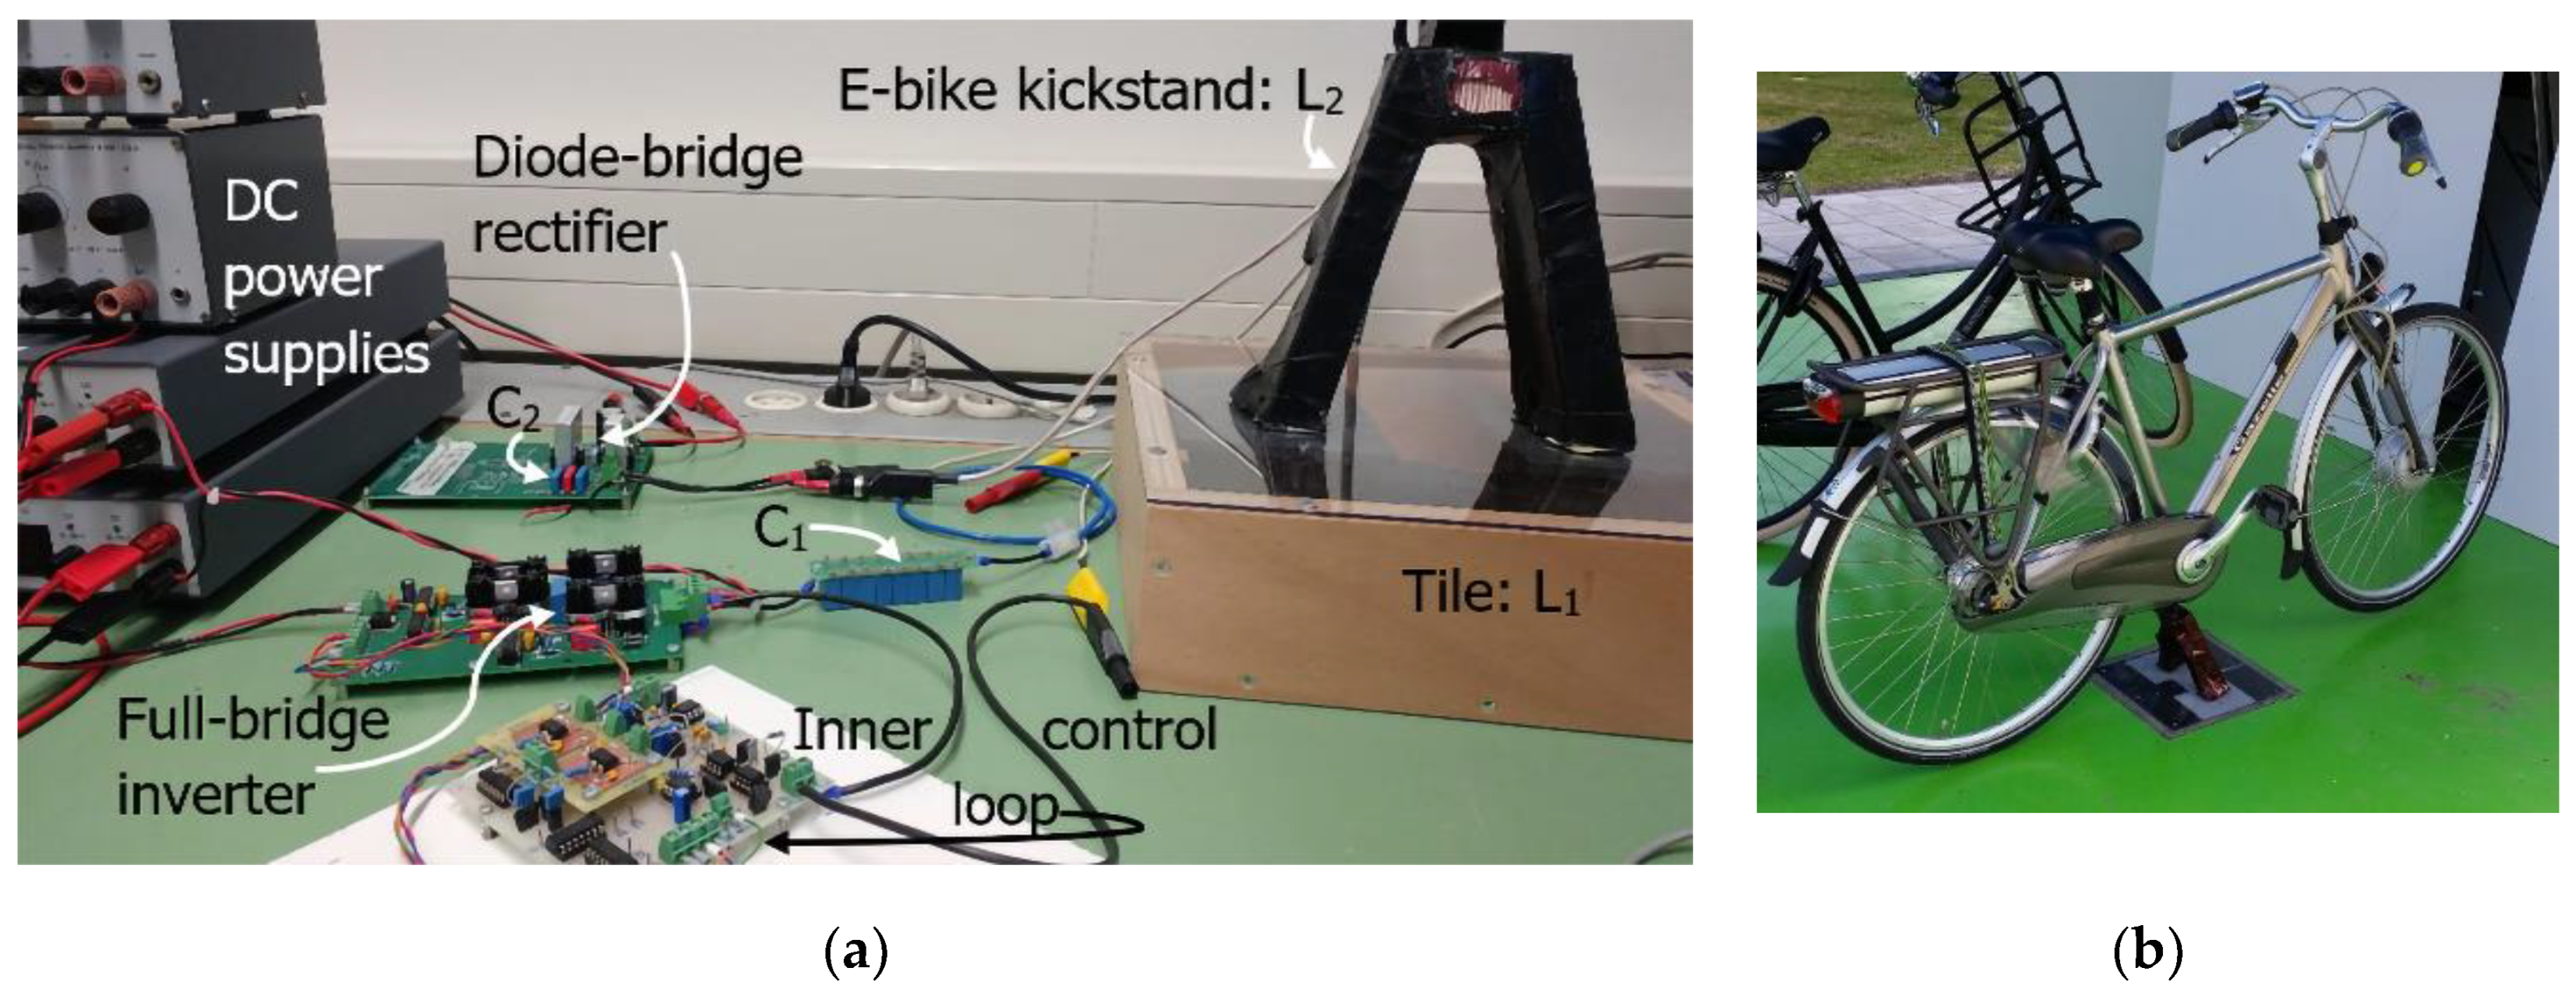
6.4. Experimental Realization

Figure 12a shows the picture of the wireless e-bike charger and the laboratory setup used as proof-of-concept to test its operation. The realization of the wireless charging for the e-bike at the solar station is shown in Figure 12b. Table 3 shows the parameter values of the various circuit components of the resonant circuit shown in Figure 11a. For the inverter, the 100V IPP030N10N5 MOSFETs switches are used, and, for the rectifier, 200V BYW29-200 diodes are used.
Figure 11b shows the voltage and current waveforms of the primary and secondary circuits. In this case, the zero-current switching (ZCS) of unity power factor is achieved because the voltage and current VAB and I1 are in phase. Therefore, the power transfer is maximized, and the ZCS of the inverter is achieved. The auto-resonant frequency control can also achieve zero-voltage switching (ZVS) depending on the gain given to the predictive zero-crossing current detection. With ZVS, the power factor is slightly less than the unity because the current I1 is lagging the voltage VAB. In Reference [54], the advantages of ZCS and ZVS are analyzed in detail by considering this e-bike charging system. The measured efficiency from the 48 V DC nano-grid to the EV bike batteries is 89.2% at the maximum coupling condition and with an output power of 230 W.

6.5. Ongoing Development

Currently, the functionality of the e-bike wireless charger has been proved in the laboratory. After this, measurements of the electromagnetic field radiated by the charger are going to be performed to verify the compliance to the International Commission on Non-Ionizing Radiation Protection (ICNIPR) that ensures safety to human beings [55]. The radiated magnetic field of the charger is expected to be within the limits for general public (27 µT) since the coils are placed on top of each other, and there is no gap in the free air. This is unlike in electric cars, where the coils have a flat arrangement with a larger gap [56]. Moreover, the rated power of this charger is considerably lower than the 3.3 kW minimum for electric cars as per SAE J2954 [57]. Hence, a lower radiated magnetic flux can be expected. Second, a kickstand with structurally integrated magnetics is being developed, which is sturdier for a longer lifetime.

7. Environment Integrated PV System

The solar panels, battery storage, and the AC, DC, and wireless charging are combined together to form an Environment Integrated PV system (EIPV) built on the university campus, as shown in Figure 2. Three cabinets of 1.39 m by 0.72 m are located inside the EIPV, which are used for storing the battery and the associated electronics for the inverter and MPPT converter and the DC e-bike charger and control circuitry, respectively. Integrating all the electronics and batteries inside the EIPV saves approximately 3 m3 space that would have otherwise be required for external cabinets to house all the electronics and batteries. The key advantage of the EIPV is, therefore, the mechanical and electrical integration of all components resulting in a single structure that combines aesthetics, modularity, safety, functionality, ergonomics, and usability.
Figure 13a shows the solar MPPT converter, bidirectional inverter, grid islanding device, control, and protection circuity for both devices. Figure 13b shows the DC-DC converters for the e-bike DC charging, charging measurement circuit, and the Raspberry Pi central controller responsible for communicating with all the devices. The Raspberry Pi also reads data from all devices like the VICTRON system, DC chargers, and weather station and logs them centrally into an Internet server [58]. The charging current and voltage are displayed on the monitor inside the e-bike station for user convenience.

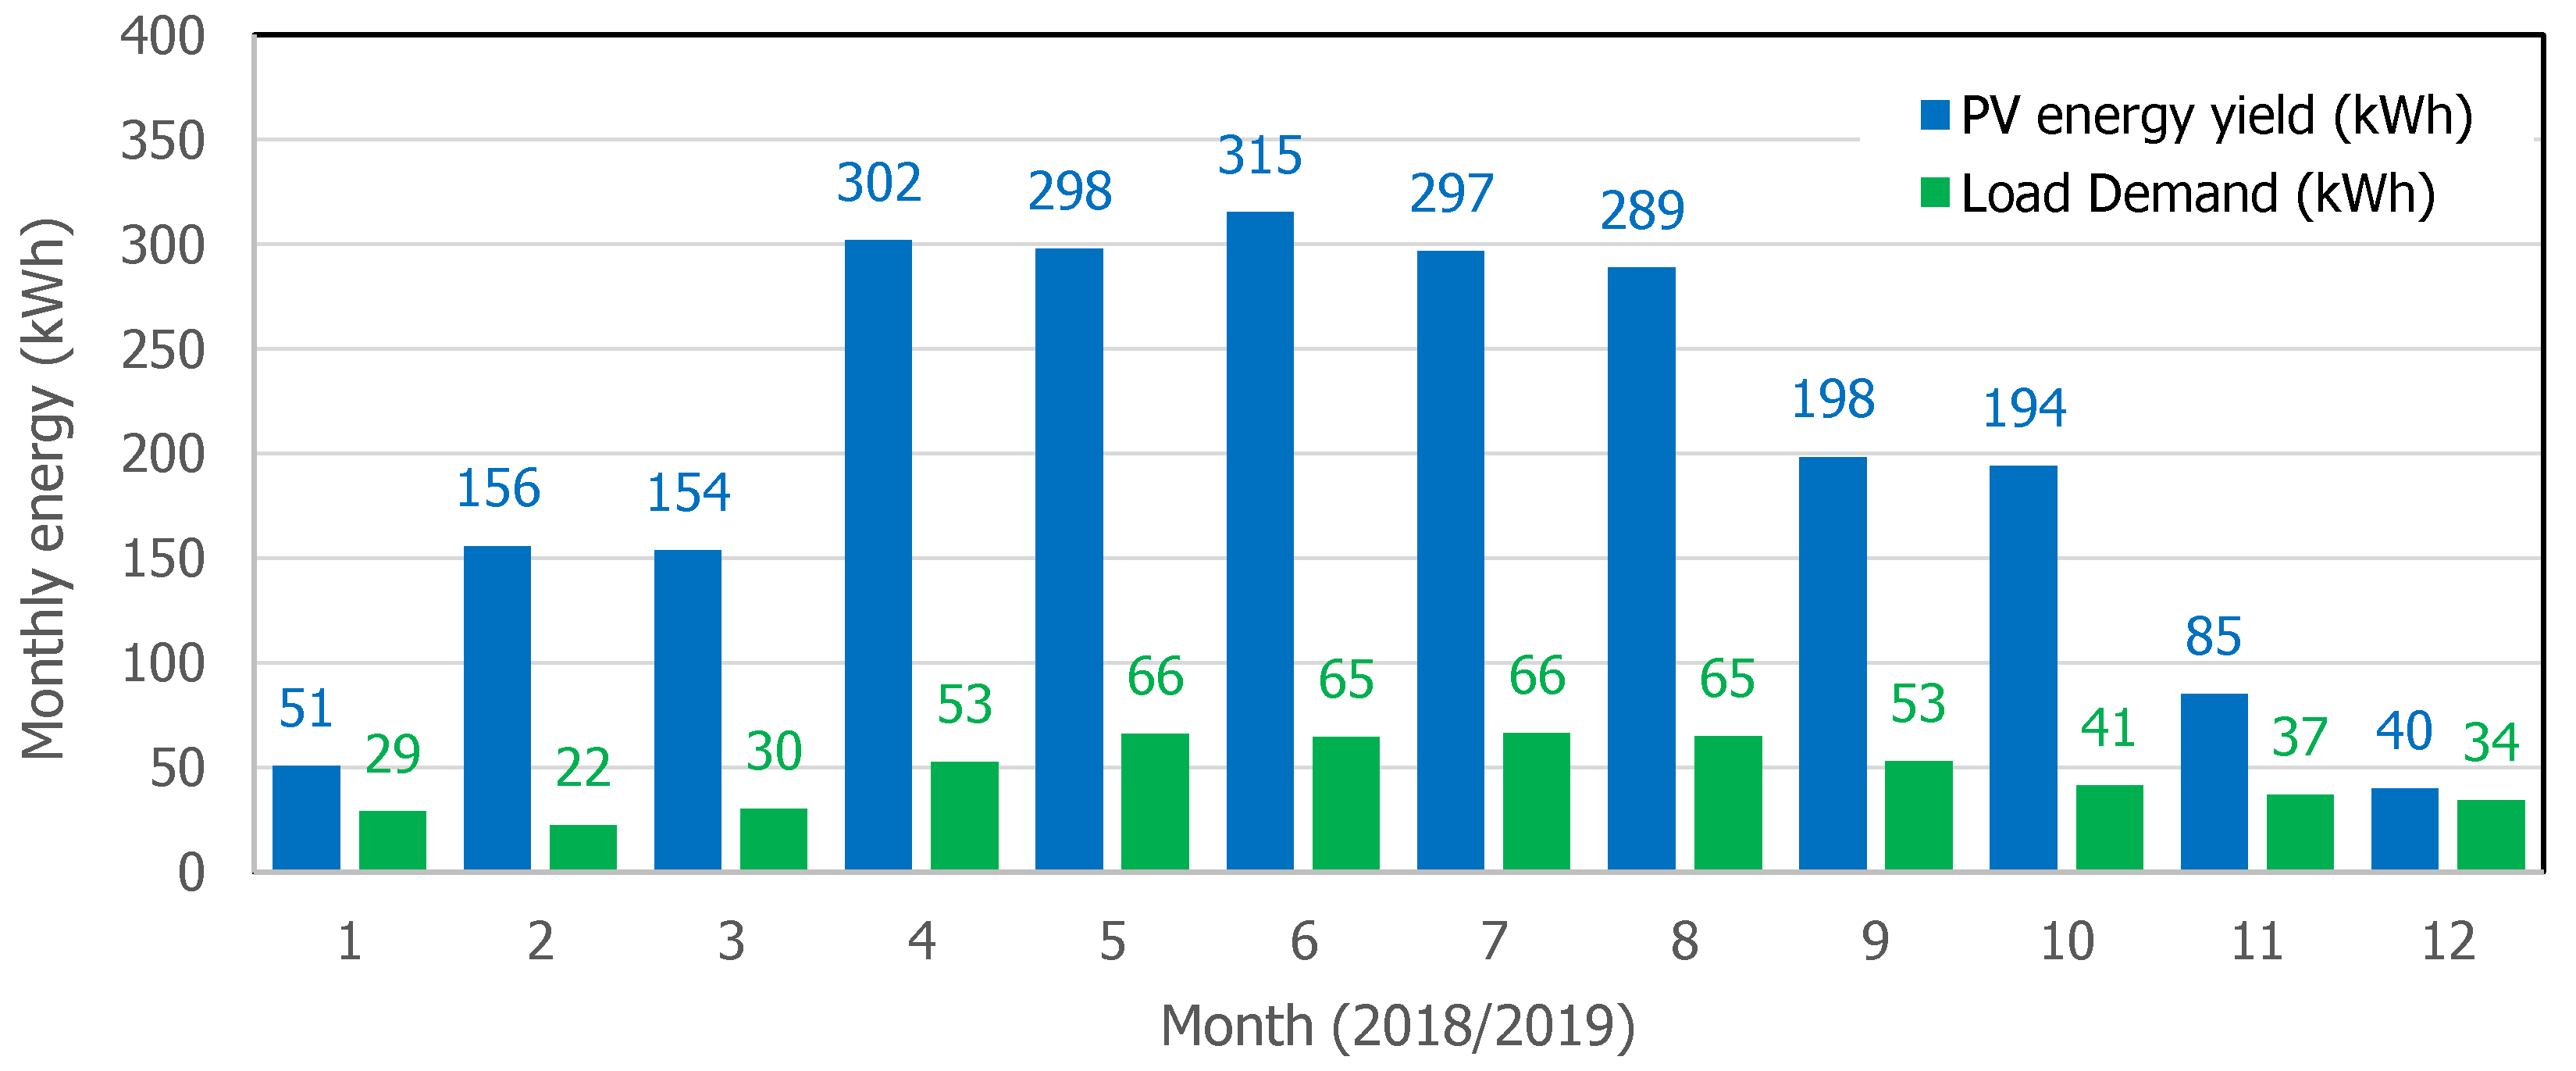
7.1. Energy Yield of the PV System and Load

Figure 14 shows the measured monthly energy yield of a 2.6 kW PV system for one year over the period of October 2018 to September 2019. A total of 2378 kWh of PV energy is produced in this period, corresponding to a daily average of 6.5 kWh/day. The extreme differences in the PV generation between the seasons can be seen with 40 kWh generation in December compared to 315 kWh in June, up to an eight times difference. In terms of daily energy yield, there is as much as a 25 times difference, varying from 0.64 kWh/day to 15.4 kWh/day. It is also important to note the difference in yield between Figure 14, and Figure 5b due primarily to the difference in the meteorological conditions of 2013 and 2018/2019.
In terms of load demand, two e-bikes from the electrical engineering faculty are regularly charged at the location with occasional demand from other e-bikes, e-scooters, and the Twizy. The annual demand of the station was much lower than the theoretical analysis and was found to be 561 kWh/year or 1.5 kWh/day on average. The lower demand was due to a much lower baseload (limited use of light, converters going into sleep mode) and a lesser number of e-bikes than anticipated. The load also exhibited a seasonal variation primarily due to variation in usage of e-bikes with higher e-bike usage and charging in the summer.
From an economic perspective, an annual yield of 2378 kWh of PV energy results in a revenue of ~595€/year, assuming a net-metered feed-in tariff of 0.25 €/kWh. Charging a 500-Wh e-bike battery costs about 0.125 €/charge. Due to the custom design of the station, the net cost of all the electronics, including the PV, battery, and chargers was approximately 15,000 €, which resulted in a payback period of ~25 years. It must be noted that this does not include civil material costs of constructing the station and the cost of hours for research and development, which are significant [9]. To reduce the costs, the options can be to provide only AC charging, not including a battery, installing the PV on the rooftop, and using a single converter for both MPPT and grid feeding.

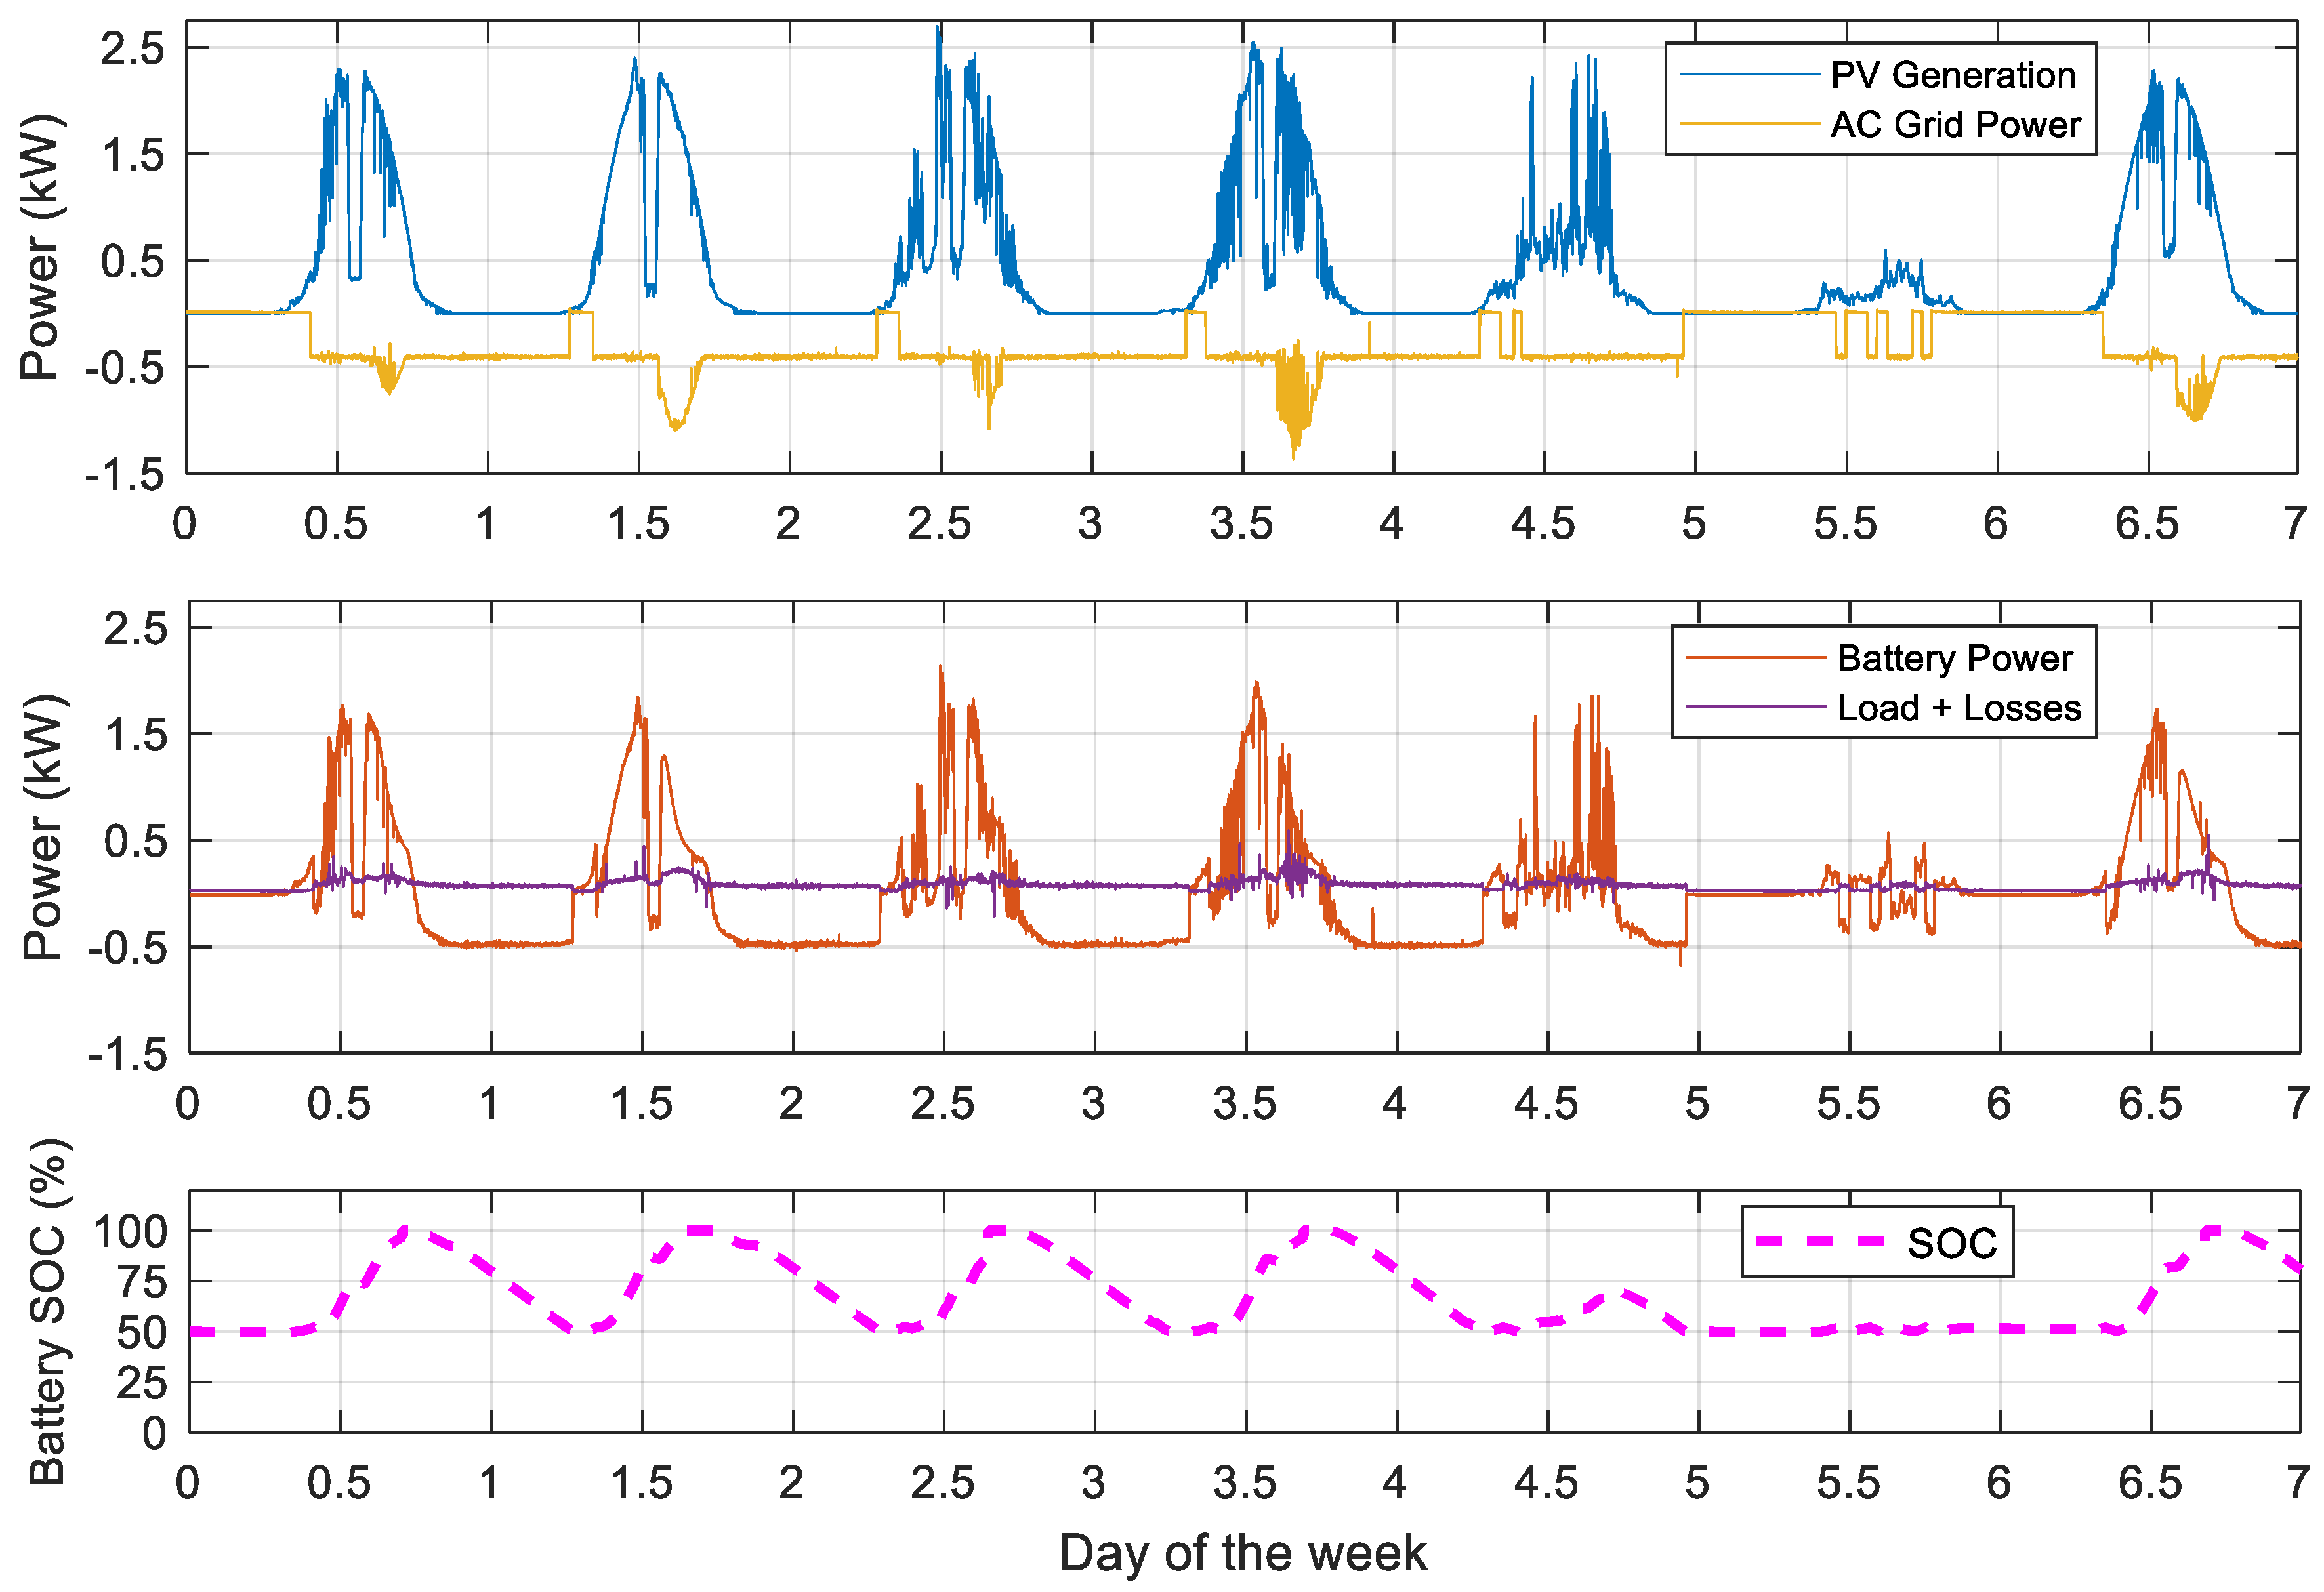
7.2. Power Management of the Battery

The integrated battery storage can be controlled with numerous power management strategies based on the PV generation and grid conditions. One such strategy that has been implemented currently is shown below.
  • The PV power is primarily used to provide the e-bike charging load and the baseload
  • If the available PV power is less than the load demand, then the demand is first supplied by the battery. If the battery becomes empty, then the load is supplied by the grid.
  • If the available PV power is more than the demand, then the excess PV power is first used to charge the battery. If the battery is nearly full, then the PV power is fed to the AC grid.
  • When the battery SOC > 50%, the battery and PV power together feed at least 400 W to the AC grid in order to utilize the battery in order to store the solar power the next day.
Based on this power management, Figure 15 shows the measured power profiles of the PV, battery, grid, and the battery SOC over one week in May with a few cloudy days. First, it can be observed that the solar power is used to supply the load on sunny days, feed at least 400 W to the AC grid, and to charge the battery from 50% to 100% SOC. Second, there is a dip in the PV generation in the afternoon due to shading from the nearby faculty building, as seen in Figure 5. Third, when the solar production is low/zero (especially in the evening and night), the battery discharges and feeds power to the AC grid. Lastly, when there is not enough solar production and if the battery SOC ≤ 50%, no power is supplied to the AC grid.

8. Conclusions

A 2.6 kWp solar powered charging station for e-bikes and e-scooters has been designed and installed that offers AC, DC, and wireless charging. It has an integrated storage with a usable capacity of 9.5 kWh that can provide both grid-connected and off-grid operation using a hybrid bidirectional inverter. The station has a 48 V DC nano-grid that is used for power exchange between the PV, EV, battery, and the AC grid. The 100 W DC charging and 200 W wireless charging systems are unique in that the user can charge the e-bike without requiring an AC charging adapter. The AC charging system provides up to 3.7 kW charging power, which is sufficient for a small electric car like the Renault Twizy.
The PV orientation was optimized to a tilt angle at 51° and facing south to increase PV yield in the winter month of December while not compromising on the annual yield significantly (<5%). 3D modelling using Sketchup is used to determine the shading due to nearby buildings to make an accurate estimation of the yield. In the observed period of 2018/2019, 2378 kWh of PV energy is produced, which corresponded to a daily average of 6.5 kWh/day. At the same time, the seasonal variation in irradiance caused up to 25 times variation in daily yield from 0.64 kWh/day to 15.4 kWh/day.
The DC charging system uses current-mode controlled flyback converters to charge 24–48 V e-bike batteries from the 48 V DC nano-grid. A custom-designed DC cable can be used to connect the e-bike batteries of different manufacturers to the station. On the other hand, the wireless charging system uses two windings on a U-shaped and V-shaped ferromagnetic core, with one placed under the tile of the charging station and the other integrated into the bike kickstand, respectively. A unique auto-resonant frequency control and amplitude shift keying modulation are implemented for misalignment tolerance and foreign object detection, which are crucial for practical usage.
The environmentally-integrated PV system cohesively integrates the mechanical, structural, and electrical components in a single unit, which saves space and provides aesthetics, modularity, safety, ergonomics, and convenience. The charging station, including its weather station, can be remotely controlled and monitored using a Raspberry Pi.

Author Contributions

Conceptualization, G.R.C.M., P.V.D., P.B., and O.I. Methodology, validation, formal analysis & investigation, G.R.C.M., P.V.D., F.G., and A.J. Writing—original draft preparation, G.R.C.M. Writing—review and editing, G.R.C.M., P.V.D., and F.G. Visualization, G.R.C.M., P.V.D., and F.G. Supervision, G.R.C.M., P.V.D., P.B., and O.I. Project administration, P.V.D. Funding acquisition, P.V.D., P.B., and O.I. All authors have read and agreed to the published version of the manuscript.

Funding

The Delft Infrastructure & Mobility Initiative, 3E fonds, Climate-KIC funded this research. The authors thank them for their financial support.

Acknowledgments

The authors would like to acknowledge (in alphabetical order) Bart Roodenburg, Gireesh Nair, Harrie Olsthoorn, Joris Koeners, Miro Zeman, Sacha Silvester, Tim Velzeboer, and Yunpeng Zhao of the Delft University of Technology, the Netherlands for their technical guidance and support, and Junyin Gu from Involar for the in-kind support of hardware components.

Conflicts of Interest

The authors declare no conflict of interest.

References

  1. Messagie, M.; Boureima, F.-S.S.; Coosemans, T.; Macharis, C.; Mierlo, J. Van A range-based vehicle life cycle assessment incorporating variability in the environmental assessment of different vehicle technologies and fuels. Energies 2014, 7, 1467–1482. [Google Scholar] [CrossRef]
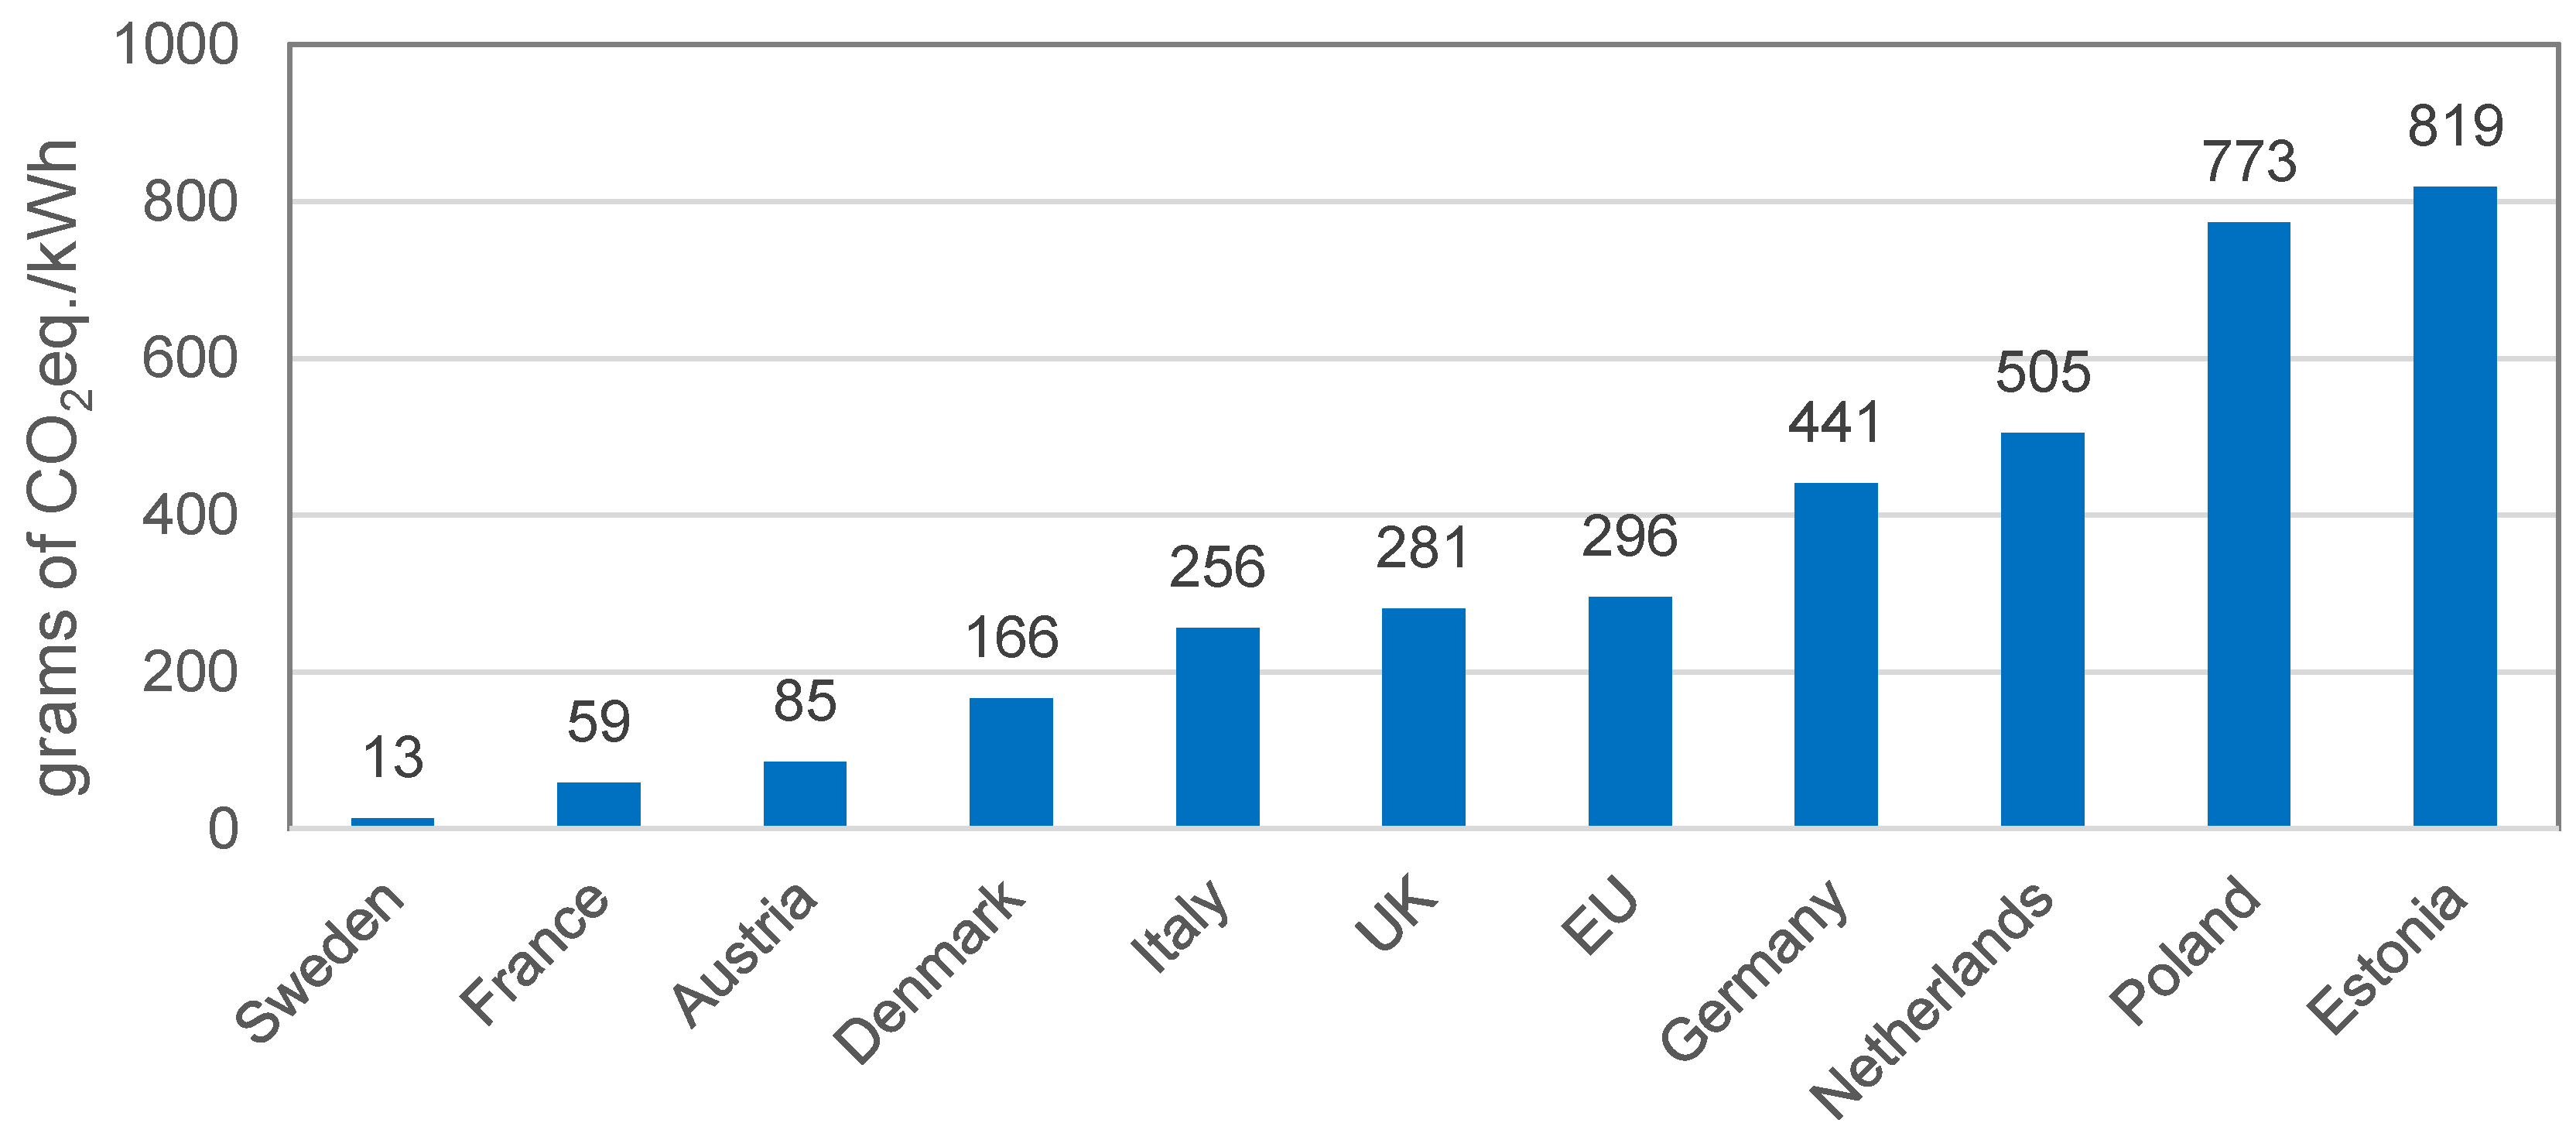
  2. Moro, A.; Lonza, L. Electricity carbon intensity in European Member States: Impacts on GHG emissions of electric vehicles. Transp. Res. Part D Transp. Environ. 2018. [Google Scholar] [CrossRef] [PubMed]
  3. Dataset nrg_105a: Supply, Transformation and Consumption of Electricity—Annual Data, Statistical Office of the European Union (EUROSTAT); Eurostat: Luxembourg, 2016.
  4. Hamilton, C.; Gamboa, G.; Elmes, J.; Kerley, R.; Arias, A.; Pepper, M.; Shen, J.; Batarseh, I. System architecture of a modular direct-DC PV charging station for plug-in electric vehicles. In Proceedings of the Annual Conference on IEEE Industrial Electronics Society, Glendale, AZ, USA, 7–10 November 2010; pp. 2516–2520. [Google Scholar]
  5. Carli, G.; Williamson, S.S. Technical Considerations on Power Conversion for Electric and Plug-in Hybrid Electric Vehicle Battery Charging in Photovoltaic Installations. IEEE Trans. Power Electron. 2013, 28, 5784–5792. [Google Scholar] [CrossRef]
  6. Chandra Mouli, G.R.; Bauer, P.; Zeman, M. System design for a solar powered electric vehicle charging station for workplaces. Appl. Energy 2016, 168, 434–443. [Google Scholar] [CrossRef] [Green Version]
  7. Birnie, D.P. Solar-to-vehicle (S2V) systems for powering commuters of the future. J. Power Sour. 2009, 186, 539–542. [Google Scholar] [CrossRef]
  8. Lai, C.S.; McCulloch, M.D. Levelized cost of electricity for solar photovoltaic and electrical energy storage. Appl. Energy 2017. [Google Scholar] [CrossRef]
  9. Chandra Mouli, G.R.; Leendertse, M.; Prasanth, V.; Bauer, P.; Silvester, S.; van de Geer, S.; Zeman, M. Economic and CO2 Emission Benefits of a Solar Powered Electric Vehicle Charging Station for Workplaces in the Netherlands. In Proceedings of the IEEE Transportation Electrification Conference and Expo (ITEC), Dearborn, MI, USA, 27–29 June 2016; pp. 1–7. [Google Scholar]
  10. Chandra Mouli, G.R.; Schijffelen, J.; Van Den Heuvel, M.; Kardolus, M.; Bauer, P. A 10 kW Solar-Powered Bidirectional EV Charger Compatible with Chademo and COMBO. IEEE Trans. Power Electron. 2019, 34, 1082–1098. [Google Scholar] [CrossRef] [Green Version]
  11. Fairley, P. China’s cyclists take charge: Electric bicycles are selling by the millions despite efforts to ban them. IEEE Spectr. 2005, 42, 54–59. [Google Scholar] [CrossRef]
  12. Mobiliteit in Cijfers Tweewielers 2017–2018, Stichting BOVAG-RAI Mobiliteit, Amsterdam; Amsterdam Foundation: Amsterdam, The Netherlands, 2017.
  13. Apostolou, G.; Reinders, A.; Geurs, K. An Overview of Existing Experiences with Solar-Powered e-Bikes. Energies 2018, 11, 2129. [Google Scholar] [CrossRef] [Green Version]
  14. Chandra Mouli, G.R.; van Duijsen, P.; Velzeboer, T.; Nair, G.; Zhao, Y.; Jamodkar, A.; Isabella, O.; Silvester, S.; Bauer, P.; Zeman, M. Solar Powered E-Bike Charging Station with AC, DC and Contactless Charging. In Proceedings of the European Conference on Power Electronics and Applications (EPE’18 ECCE Europe), Riga, Latvia, 17–21 September 2018. [Google Scholar]
  15. Mesentean, S.; Feucht, W.; Mittnacht, A.; Frank, H. Scheduling Methods for Smart Charging of Electric Bikes from a Grid-Connected Photovoltaic-System. In Proceedings of the 2011 UKSim 5th European Symposium on Computer Modeling and Simulation, Madrid, Spain, 16–18 November 2011; pp. 299–304. [Google Scholar]
  16. Fuentes, M.; Fraile-Ardanuy, J.; Risco-Martín, J.L.; Moya, J.M. Feasibility Study of a Building-Integrated PV Manager to Power a Last-Mile Electric Vehicle Sharing System. Int. J. Photoenergy 2017. [Google Scholar] [CrossRef] [Green Version]
  17. Zhang, Z.; Gercek, C.; Renner, H.; Reinders, A.; Fickert, L. Resonance instability of photovoltaic E-bike charging stations: Control parameters analysis, modeling and experiment. Appl. Sci. 2019, 9, 252. [Google Scholar] [CrossRef] [Green Version]
  18. Thomas, D.; Klonari, V.; Vallee, F.; Ioakimidis, C.S. Implementation of an e-bike sharing system: The effect on low voltage network using pv and smart charging stations. In Proceedings of the 2015 International Conference on Renewable Energy Research and Applications, ICRERA 2015, Palermo, Italy, 22–25 November 2015; pp. 572–577. [Google Scholar]
  19. Kulshrestha, P.; Wang, L.; Chow, M.Y.M.-Y.; Lukic, S. Intelligent energy management system simulator for PHEVs at municipal parking deck in a smart grid environment. In Proceedings of the 2009 IEEE Power and Energy Society General Meeting, PES ’09, Calgary, AB, Canada, 26–30 July 2009; pp. 1–6. [Google Scholar]
  20. Zhou, W.; Wattenberg, M.U.S. Design Considerations of a Single Stage LLC Battery Charger. In Proceedings of the PCIM Europe; International Exhibition and Conference for Power Electronics, Intelligent Motion, Renewable Energy and Energy Management, Nuremberg, Germany, 7–9 May 2019. [Google Scholar]
  21. Nguyen, C.-L.; Primiani, P.; Viglione, L.; Woodward, L. A Low-Cost Battery Charger Usable with Sinusoidal Ripple-Current and Pulse Charging Algorithms for E-Bike Applications. In Proceedings of the 2019 IEEE 28th International Symposium on Industrial Electronics (ISIE), Vancouver, BC, Canada, 12–14 June 2019; pp. 2085–2090. [Google Scholar]
  22. Chandra Mouli, G.R.; Bauer, P.; Zeman, M. Comparison of system architecture and converter topology for a solar powered electric vehicle charging station. In Proceedings of the International Conference on Power Electronics and ECCE Asia (ICPE-ECCE Asia), Seoul, Korea, 1–5 June 2015; pp. 1908–1915. [Google Scholar]
  23. Vega-Garita, V.; Ramirez-Elizondo, L.; Chandra Mouli, G.R.; Bauer, P. Review of residential PV-storage architectures. In Proceedings of the 2016 IEEE International Energy Conference (ENERGYCON), Leuven, Belgium, 4–8 April 2016; pp. 1–6. [Google Scholar] [CrossRef] [Green Version]
  24. Pellitteri, F.; Boscaino, V.; Di Tommaso, A.O.; Genduso, F.; Miceli, R. E-bike battery charging: Methods and circuits. In Proceedings of the 2013 International Conference on Clean Electrical Power (ICCEP), Alghero, Italy, 11–13 June 2013; pp. 107–114. [Google Scholar]
  25. Pellitteri, F.; Di Tommaso, A.O.; Miceli, R. Investigation of inductive coupling solutions for E-bike wireless charging. In Proceedings of the Universities Power Engineering Conference, Computer Society, Stoke on Trent, UK, 1–4 September 2015. [Google Scholar]
  26. Genco, F.; Longo, M.; Patrizia Livrieri, A.T. Wireless Power Transfer System Stability Analysis for E-bikes Application. In Proceedings of the AEIT International Conference of Electrical and Electronic Technologies for Automotive (AEIT AUTOMOTIVE), Torino, Italy, 2–4 July 2019. [Google Scholar]
  27. Joseph, P.K.; Elangovan, D.; Arunkumar, G. Linear control of wireless charging for electric bicycles. Appl. Energy 2019, 255, 113898. [Google Scholar] [CrossRef]
  28. Livreri, P.; Di Dio, V.; Miceli, R.; Pellitteri, F.; Galluzzo, G.R.; Viola, F. Wireless battery charging for electric bicycles. In Proceedings of the 2017 6th International Conference on Clean Electrical Power (ICCEP), Santa Margherita Ligure, Italy, 27–29 June 2017; pp. 602–607. [Google Scholar]
  29. Pellitteri, F.; Ala, G.; Caruso, M.; Ganci, S.; Miceli, R. Physiological compatibility of wireless chargers for electric bicycles. In Proceedings of the 2015 International Conference on Renewable Energy Research and Applications, ICRERA 2015, Palermo, Italy, 22–25 November 2015; pp. 1354–1359. [Google Scholar]
  30. Iannuzzi, D.; Rubino, L.; Di Noia, L.P.; Rubino, G.; Marino, P. Resonant inductive power transfer for an E-bike charging station. Electr. Power Syst. Res. 2016. [Google Scholar] [CrossRef]
  31. Chen, Y.; Kou, Z.; Zhang, Y.; He, Z.; Mai, R.; Cao, G. Hybrid Topology With Configurable Charge Current and Charge Voltage Output-Based WPT Charger for Massive Electric Bicycles. IEEE J. Emerg. Sel. Top. Power Electron. 2018, 6, 1581–1594. [Google Scholar] [CrossRef]
  32. Kindl, V.; Pechanek, R.; Zavrel, M.; Kavalir, T. Inductive coupling system for E-bike wireless charging. In Proceedings of the 12th International Conference ELEKTRO 2018, Mikulov, Czech Republic, 21–23 May 2018; pp. 1–4. [Google Scholar]
  33. Coppola, M.; Cennamo, P.; Dannier, A.; Iannuzzi, D.; Meo, S. Wireless Power Transfer circuit for e-bike battery charging system. In Proceedings of the 2018 IEEE International Conference on Electrical Systems for Aircraft, Railway, Ship Propulsion and Road Vehicles and International Transportation Electrification Conference, ESARS-ITEC, Nottingham, UK, 7–9 November 2018. [Google Scholar]
  34. Lee, J.; Lee, S.; Kwak, M.; Yeom, G. Seung-Hwan Lee Development of a Wireless Power Supply System for an E-Bike. In Proceedings of the 10th International Conference on Power Electronics and ECCE Asia (ICPE 2019—ECCE Asia), Busan, Korea, 27–30 May 2019. [Google Scholar]
  35. Joseph, P.K.; Elangovan, D. A review on renewable energy powered wireless power transmission techniques for light electric vehicle charging applications. J. Energy Storage 2018, 16, 145–155. [Google Scholar] [CrossRef]
  36. Nunes, P.; Figueiredo, R.; Brito, M.C. The use of parking lots to solar-charge electric vehicles. Renew. Sustain. Energy Rev. 2016, 66, 679–693. [Google Scholar] [CrossRef]
  37. Mackay, L.; Hailu, T.G.; Chandra Mouli, G.R.; Ramirez-Elizondo, L.; Ferreira, J.A.; Bauer, P. From DC Nano- and Microgrids Towards the Universal DC Distribution System—A Plea to Think Further Into the Future. In Proceedings of the 2015 IEEE Power & Energy Society General Meeting, Denver, CO, USA, 26–30 July 2015; pp. 1–5. [Google Scholar]
  38. Victron Energy. Datasheet—MultiPlus 48/3000/35-16; BlueSolar Charger MPPT 150/85; Victron Energy: Almere, The Netherlands, 2019. [Google Scholar]
  39. Lufft. Datsheet. WS503-UMB Smart Weather Sensor. Available online: https://www.lufft.com/products/compact-weather-sensors-293/ws503-umb-smart-weather-sensor-1837/productAction/outputAsPdf/ (accessed on 1 July 2020).
  40. Chao, D.C.-H.; van Duijsen, P.J.; Hwang, J.J.; Liao, C.-W. Modeling of a Taiwan fuel cell powered scooter. In Proceedings of the 2009 International Conference on Power Electronics and Drive Systems (PEDS), Taipei, Taiwan, 2–5 November 2009; pp. 913–919. [Google Scholar]
  41. CESAR Database, Koninklijk Nederlands Meteorologisch Instituut (KNMI). Available online: http://www.knmi.nl (accessed on 1 July 2020).
  42. Paulescu, M.; Paulescu, E.; Gravila, P.; Badescu, V. Weather Modeling and Forecasting of PV Systems Operation. Green Energy Technol. 2013, 103. [Google Scholar] [CrossRef]
  43. Braun, J.E.; Mitchell, J.C. Solar geometry for fixed and tracking surfaces. Sol. Energy 1983, 31, 439–444. [Google Scholar] [CrossRef]
  44. Reda, I.; Andreas, A. Solar position algorithm for solar radiation applications. Sol. Energy 2004, 76, 577–589. [Google Scholar] [CrossRef]
  45. Jakhrani, A.Q.; Othman, A.K.; Rigitand, A.R.H.; Samo, S.R. Comparison of solar photovoltaic module temperature models. World Appl. Sci. J. 2011, 14, 1–8. [Google Scholar]
  46. Isabella, O.; Nair, G.G.; Tozzi, A.; Castro Barreto, J.H.; Chandra Mouli, G.R.; Lantsheer, F.; van Berkel, S.; Zeman, M. Comprehensive modelling and sizing of PV systems from location to load. MRS Proc. 2015, 1771, 1–7. [Google Scholar] [CrossRef] [Green Version]
  47. Smets, A.; Jäger, K.; Isabella, O.; van Swaaij, R.; Zeman, M. Solar Energy: The Physics and Engineering of Photovoltaic Conversion, Technologies and Systems; UIT: Cambridge, UK, 2016; ISBN 9780203841464. [Google Scholar]
  48. Involar Micro-Inverters; Involar Corporation Ltd.: Pudong District, Shanghai, China.
  49. Ridley, R.B. Power Supply Design, Volume 1: Control; Ridley Designs: Camarillo, CA, USA, 2012; ISBN 9780983318002. [Google Scholar]
  50. Caspoc; Simulation Research: Alphen aan den Rijn, The Netherlands, 2019; Available online: www.caspoc.com (accessed on 1 July 2020).
  51. Bauer, P.; Van Duijsen, P.J. Challenges and Advances in Simulation. In Proceedings of the IEEE 36th Conference on Power Electronics Specialists, Recife, Brazil, 12–16 June 2005; pp. 1030–1036. [Google Scholar]
  52. Van Duijsen, P.; Woudstra, J.; Van Willigenburg, P. Educational setup for Power Electronics and IoT. In Proceedings of the 2018 19th International Conference on Research and Education in Mechatronics, REM 2018, Delft, The Netherlands, 7–8 June 2018. [Google Scholar]
  53. Chandra Mouli, G.R.; Kaptein, J.; Bauer, P.; Zeman, M. Implementation of dynamic charging and V2G using Chademo and CCS/Combo DC charging standard. In Proceedings of the IEEE Transportation Electrification Conference and Expo (ITEC), Dearborn, MI, USA, 27–29 June 2016; pp. 1–6. [Google Scholar]
  54. Grazian, F.; Duijsen, P.; Thiago, B.; Soeiro, P.B. Advantages and Tuning of Zero Voltage Switching in a Wireless Power Transfer System. In Proceedings of the IEEE PELS Workshop on Emerging Technologies: Wireless Power (WoW), London, UK, 17–23 June 2019. [Google Scholar]
  55. Xu, H.; Wang, C.; Xia, D.; Liu, Y. Design of Magnetic Coupler for Wireless Power Transfer. Energies 2019, 12, 3000. [Google Scholar] [CrossRef] [Green Version]
  56. Zeng, H.; Liu, Z.; Hou, Y.; Hei, T.; Zhou, B. Optimization of Magnetic Core Structure for Wireless Charging Coupler. IEEE Trans. Magn. 2017. [Google Scholar] [CrossRef]
  57. Society of Automotive Engineers (SAE). J2954—Wireless Power Transfer for LightDuty Plug-In/ Electric Vehicles and Alignment Methodology. SAE Int. 2019. Available online: https://www.sae.org/standards/content/j2954_201605/ (accessed on 1 July 2020).
  58. TU Delft Solar e-Bike Charging Station. Available online: http://solarpoweredbikes.tudelft.nl (accessed on 1 July 2020).
Figure 1. CO2 emission from electricity production for selected European countries for 2016, in g CO2 equivalent/kWh.
Energies 13 03549 g001
Figure 2. (a) Front view of solar e-bike charging station showing solar panels. (b) Back view showing the charging status display screen, the e-bikes, and Twizy EV charging.
Energies 13 03549 g002
Figure 3. Schematic of the solar e-bike station with 48 V DC interconnection that facilities power exchange between the solar panels, e-bike chargers, and the AC grid.
Energies 13 03549 g003
Figure 4. Average daily yield of the south facing 2.6 kW PV system for each month considering various fixed tilt angles compared to the use of a 2-axis tracker.
Energies 13 03549 g004
Figure 5. (a) PV system yield (% of maximum) for different orientations considering December month. (b) The estimated monthly energy yield of 2.6 kW PV system tilted at 51° and facing south.
Energies 13 03549 g005
Figure 6. (a) Google Earth image showing the station location and nearby building. (b) Calculation of the shading factor due to nearby buildings using Sketchup.
Energies 13 03549 g006
Figure 7. (a) Flyback converter for e-bike battery charging with a digital current mode control and charging current monitoring and logging. (b) Simulation results show the primary (red) and secondary (blue) current as well as the charge voltage (Vout = 36 Volt) and charge current (Ich = 2.4 Ampere) for the 48-volt DC grid, and operating in a continuous conduction mode.
Energies 13 03549 g007
Figure 8. Current mode control of the flyback converter using an outer voltage loop and an inner current loop.
Energies 13 03549 g008
Figure 9. (a) Interleaved flyback converter for DC e-bike charging. (b) The cable used for DC charging. (c) Measured charging current of two e-bikes in which each is charged using the flyback based DC e-bike charger.
Energies 13 03549 g009
Figure 10. Block diagram of the wireless power transfer system for the e-bike.
Energies 13 03549 g010
Figure 11. (a) Simplified circuit of the e-bike wireless charging system. (b) Waveforms of the primary and secondary voltages and currents.
Energies 13 03549 g011
Figure 12. (a) Laboratory setup of the e-bike wireless charging system and (b) e-bike with primary coil placed below the tile in the station and secondary coil integrated into the kickstand.
Energies 13 03549 g012
Figure 13. (a) Grid Inverter, PV MPPT charger, protection, and monitoring circuit. (b) DC-DC converter, control, and protection for DC charging of e-bike.
Energies 13 03549 g013
Figure 14. Monthly energy yield (in kWh) of the 2.6 kW PV system for the period of October 2018 to September 2019 and the corresponding load demand including losses (in kWh).
Energies 13 03549 g014
Figure 15. Measurement over one week in May: (Top) the generated PV power and power fed to the grid. (Middle) battery charging power (positive), discharging power (negative), the load, and power losses. (Bottom) SOC of battery.
Energies 13 03549 g015
Table 1. Specifications of the solar e-bike charging station.
Solar panels8× Sunpower X20-327-BLK, 327 W
Battery4× Victron Lead Acid Batteries, 220 Ah, 12 V
MPPT converterVictron BlueSolar 150/85
Grid InverterVictron Multiplus 48/3000 Bidirectional
Weather stationLufft WS503-UMB
ControllerRaspberry Pi
e-bike Charging1× AC, 4× DC (10–50 V), 1× Wireless
DC charging100 W, 24–48 V, with isolation
Wireless charging200 W, 24–48 V, via kickstand
Table 2. Specifications of the E-bike and E-scooter.
ModelE-BikeE-ScooterSmall Car
Batavus
Trento E-go
Novox C-50Renault
Twizy
Battery typeLithium-ionLithium-ionLithium-ion
Capacity (Wh)39619206100
Voltage (V)364858
Motor power (W)250350013,000
Driving range (km)<12050–110100 (ECE-15)
Normal charging time (h)3.553.5
Energy consumption (Wh/km)3.317.5–38.461
Table 3. Values of the components of the e-bike wireless charging system.
Vin (V)Vout (V)Vload (V)Pout (W)f0 (kHz)ηmax (%)MOSFETs & Diodes
4820–6024/36/4820090–11089.2IPP030N10N5
BYW29-200
kL1 (μH)L2 (μH)C1 (nF)C1 (nF)R1 (Ω)R1 (Ω)
0.2867.746.335.952.30.110.16

