Review

Energy Efficiency Evaluation Based on Data Envelopment Analysis: A Literature Review

School of Economics and Management, Tongji University, Shanghai 200092, China
*
Author to whom correspondence should be addressed.
Energies 2020, 13(14), 3548; https://doi.org/10.3390/en13143548
Submission received: 7 June 2020 / Revised: 6 July 2020 / Accepted: 7 July 2020 / Published: 10 July 2020
(This article belongs to the Special Issue Energy Efficiency and Indoor Environment Quality)

Abstract

:
The importance and urgency of energy efficiency in sustainable development are increasing. Accurate assessment of energy efficiency is of considerable significance and necessity. The data envelopment analysis (DEA) method has been widely used to study energy efficiency as a total factor efficiency assessment method. In order to summarize the latest research on DEA in the field of energy efficiency, this article first analyzes the overall situation of related literature published in 2011–2019. Subsequently, the definition, measurement and evaluation variables of energy efficiency are introduced. After that, this article reviews the current DEA model and its extension models and applications based on different scenarios. Finally, considering the shortcomings of the existing DEA model, possible future research topics are proposed.

1. Introduction

Energy efficiency is a major global issue that plays an essential role in achieving sustainable development. Although the use of clean energy is gradually increasing, about 80% of global energy consumption is still fossil fuels, such as oil and natural gas, and about 50% of power generation depends on coal resources [1]. As a result, the public, researchers and governments are paying more attention to this issue. It is of considerable significance to evaluate the energy efficiency of different regions and sectors, not only can help identify differences in energy efficiency, but also to provide a quantitative basis for improving efficiency [2]. Patterson [3] first proposed the concept of energy efficiency, considering that it means using fewer resources at the same output, and gave four indicators of energy efficiency measurement. According to this definition, the indicators that measure energy efficiency can be divided into economic energy efficiency and physical energy efficiency.
To the best of our knowledge, the energy efficiency measured by different definitions and indicators varies widely. In order to measure energy efficiency more accurately, many scholars have studied the measurement of energy efficiency. Among them, Hu and Wang [4] proposed the concept of total factor energy efficiency (TFEE), which was widely recognized. TFEE believes that a single energy input cannot produce any output, which means that energy must be combined with other factors (such as labor and capital) to produce output. Based on the TFEE framework, energy efficiency is defined as the ratio of the target energy input to the actual input required at a particular output level. The proposal of TFEE effectively makes up for the shortcomings of traditional single-factor energy efficiency evaluation and has significant enlightening effects on subsequent research.
Early TFEE assessment methods consider that the input of production factors such as labor, capital, and energy will ultimately yield a single output, which is generally expressed as the gross domestic product (GDP). As fossil fuels dominate the world’s energy consumption structure, environmental pollution is becoming increasingly severe. Therefore, a large number of studies have gradually incorporated ecological issues into energy efficiency evaluation [5]. It also means that energy efficiency is a significant issue related to the coordinated development of economy, energy and the environment.
With regard to energy efficiency measurement methods, there are parametric and non-parametric methods. Parametric Stochastic Frontier Analysis (SFA) requires the assumption of production function [6], which may have a multicollinearity problem [7]. The Non-parametric DEA method can better deal with the efficiency evaluation of decision-making units under the complicated situation of multiple inputs–outputs and has been widely used to evaluate the TFEE. DEA was first proposed in 1978 as a mathematical programming method for determining the relative effectiveness of homogeneous decision-making units (DMUs) [8]. Zhu, et al. [9] pointed out that DEA is a data-oriented method for evaluating the efficiency of a set of homogeneous DMUs. Compared with previous efficiency evaluation methods, DEA does not need to build a production function, which means that it can better deal with the efficiency of DMUs.
In the existing research, a large number of studies are conducted from the perspective of theory and application based on the data of countries, regions, industries and enterprises. In order to sort out the latest research results of DEA in the field of energy efficiency, this article reviews different DEA models used in energy efficiency evaluation, including basic DEA models and their extensions in different scenarios. Future research directions of DEA-based energy efficiency evaluation methods have also been proposed.
In the rest of this article, the basics of the literature published by DEA Energy Efficiency are presented in Section 2. Section 3 introduces the definition of energy efficiency and input and output variables. Section 4 and Section 5 review the DEA-based energy efficiency assessment models and applications, respectively. Conclusions and future research discussions are illustrated in Section 6.
To produce clear descriptions, all the acronyms mentioned in this paper are listed in the nomenclatures.

2. DEA-Based Energy Efficiency Publications

This section first analyzes the publication years, journals and authors. Subsequently, through a visual analysis of the keywords and their evolutionary context, the basic situation of research in the field of energy efficiency evaluation based on DEA can be discovered.

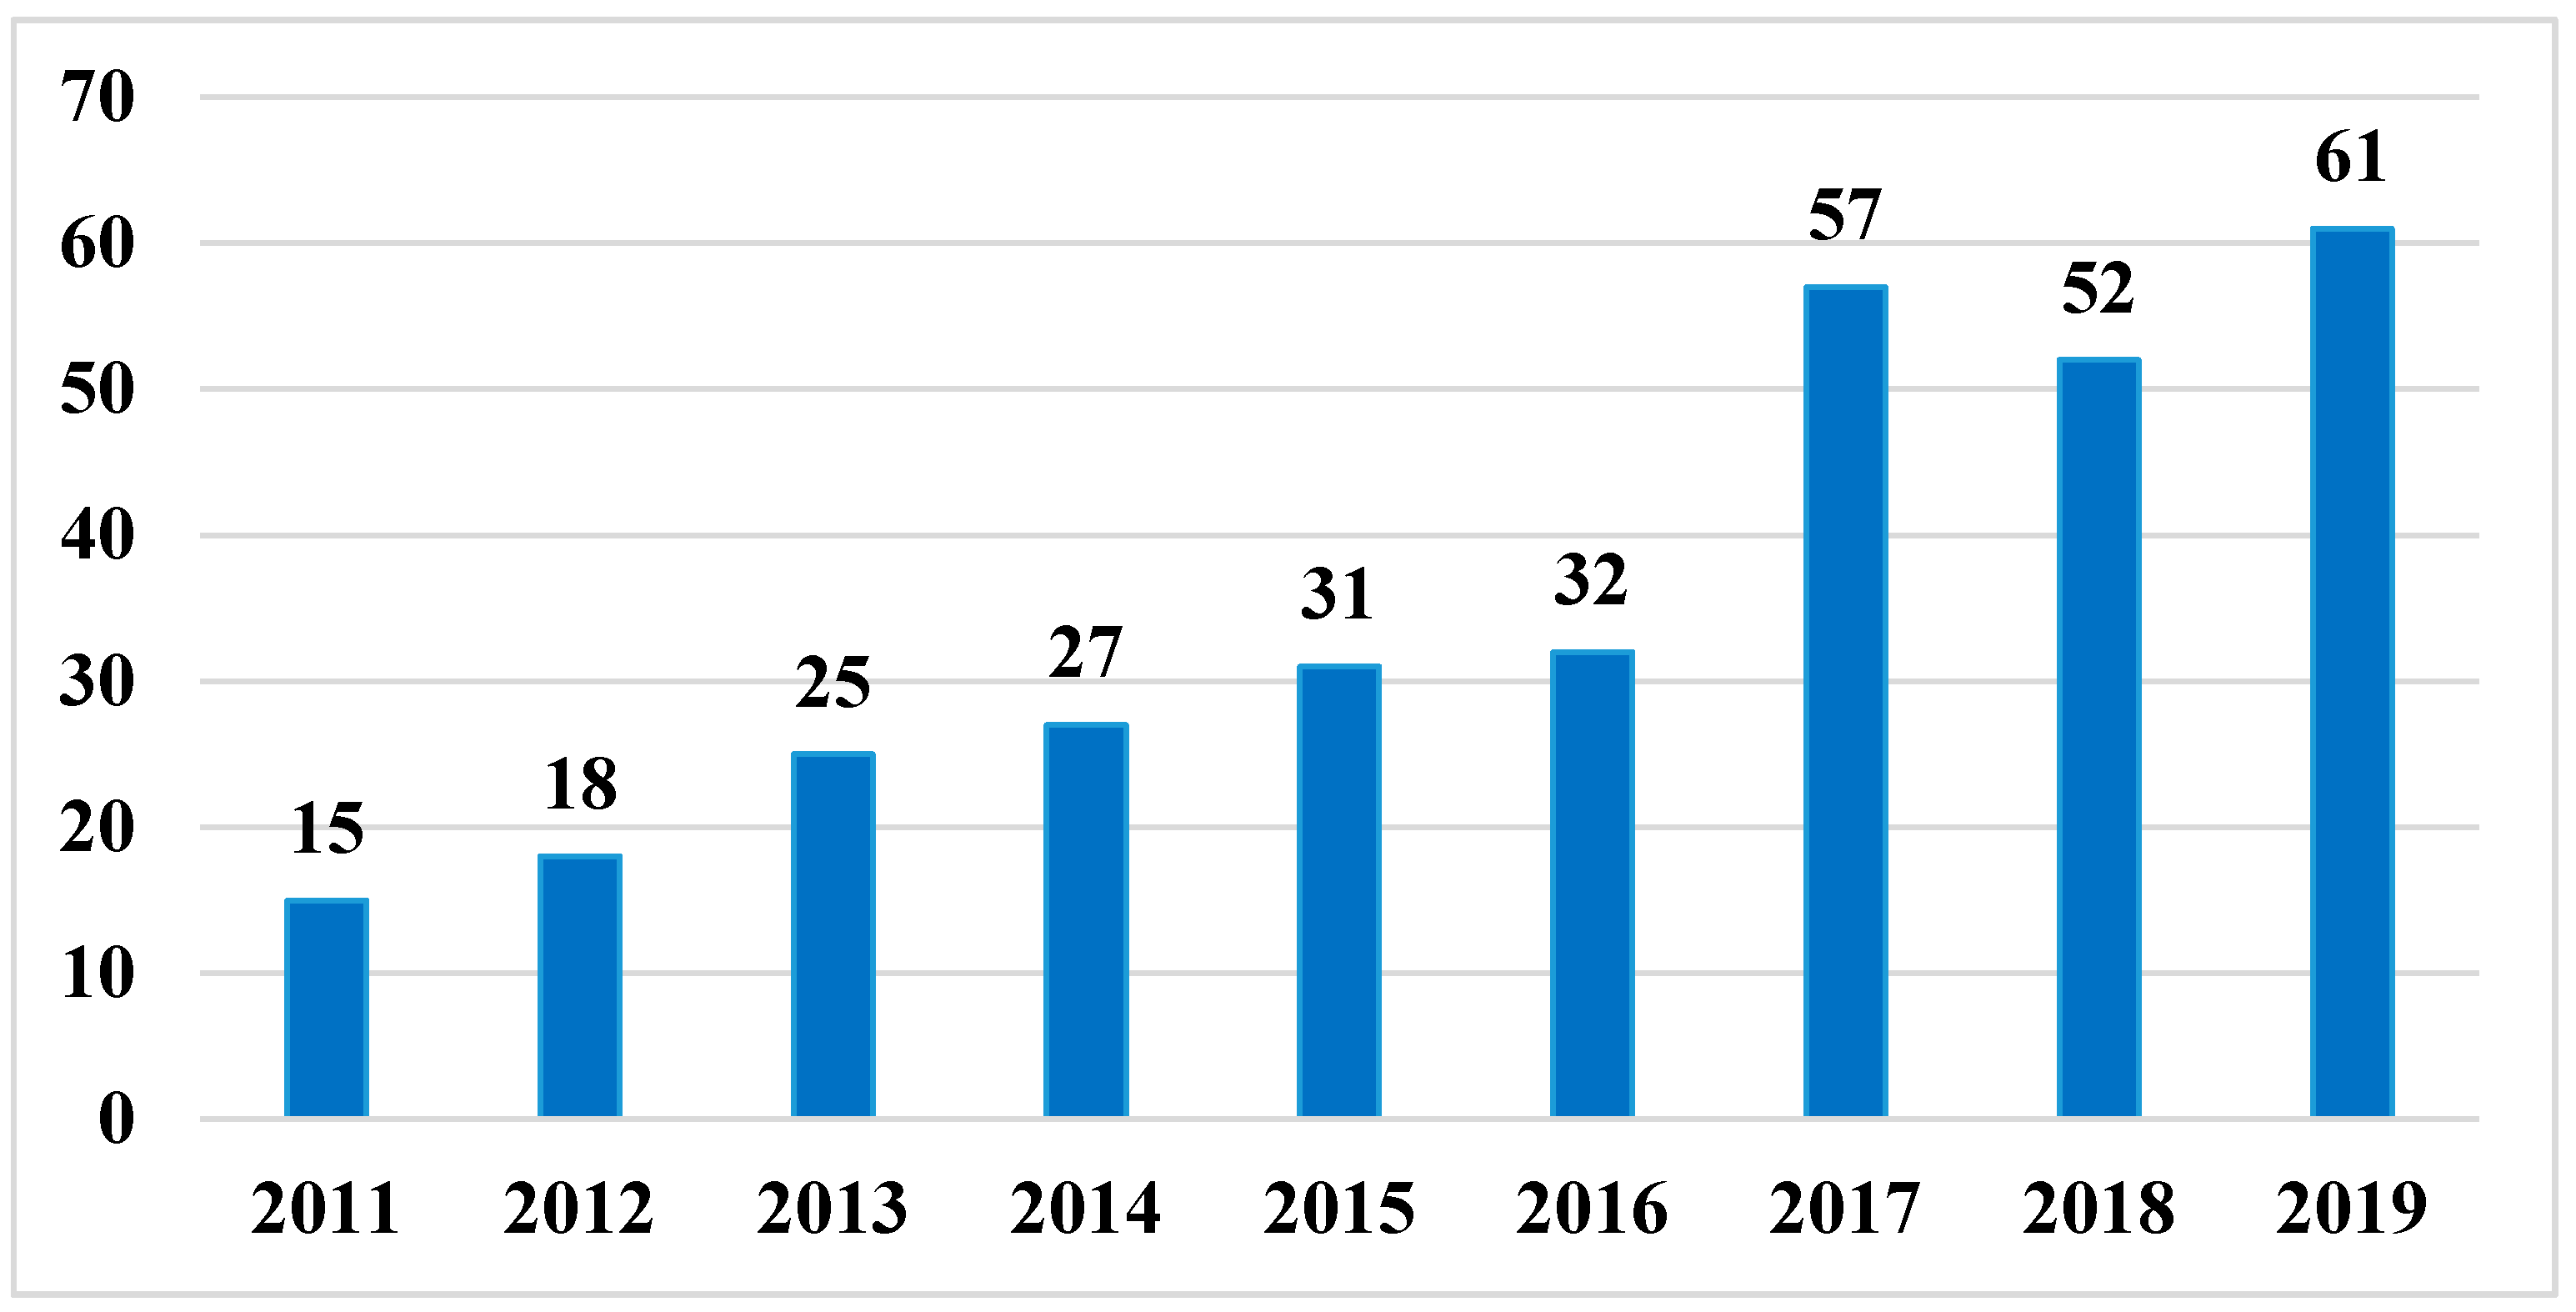
2.1. Number of Publications, Journal Distribution and Authors

In order to analyze the latest research in the field of DEA energy efficiency evaluation, this article searches the relevant articles in the core database of the web of science. The search method used in this article is for the literature with the subject “energy efficiency” and the titles containing “DEA”, as well as a publication period of 2011–2019. In the search results, the “article” type was selected, and 281 articles were selected in the end.
Based on the published papers retrieved, this article first analyzes the journal distribution of the literature. Journals with more than six published articles are shown in Figure 1. Among them, the journal with the most published articles is Energy Economics, with 26 published articles. Besides, the number of journals published in Sustainability and Energy exceeded 20. Energies and Journal of Cleaner Production have also published more than 15 articles.
Figure 2 shows the number of papers published in the field of DEA energy efficiency from 2011 to 2019. As can be seen from Figure 2, the number of papers published since 2011 has shown a clear upward trend. The quantity reached 61 articles in 2019. This also indicates that the issue of energy efficiency is getting more and more attention from researchers.

2.2. Keyword Evolution Analysis

In order to further analyze the research progress of DEA in the field of energy efficiency, this article uses Citespace to visualize the keywords and their research evolutionary context between 2010 and 2019. The context of keyword evolution is shown in Figure 3.
It can be found from Figure 3 that related research is mainly carried out from theory and applications. Theoretical analysis is primarily based on the DEA method to improve the evaluation model to evaluate the energy efficiency better.
Combined with the development and evolution of the DEA model, with the deepening of the research, the construction of the DEA-based energy efficiency evaluation model is more in line with the actual situation. These models have changed from traditional radial models (CCR, BCC) to radial SBM models, from a single output to considering undesirable output, and from simple static structures to dynamic models of complex network structures. Besides, it can be seen in Figure 3 that the primary research objects of the existing literature are regional energy efficiency (country, province, and city), industrial energy efficiency (manufacturing and agriculture), and company energy efficiency (power plant). The detailed theory and application of DEA in energy efficiency will be further discussed in the following article.

3. Energy Efficiency Definition and Input–Output Variables

3.1. Energy Efficiency Definition

As traditional energy efficiency measurement methods ignore other inputs, the concept of TFEE proposed by Hu and Wang [4] has been widely accepted. In the TFEE framework, it is believed that energy itself cannot produce any output and must be put together with other factors to produce output. The TFEE index incorporates energy, labor, and capital into the input system to generate economic output. Energy efficiency is defined as the ratio of target energy input to actual energy input, as shown below.
0 T a r g e t   E n e r g y   I n p u t A c t u a l   E n e r g y   I n p u t 1

3.2. Input–Output Variables

Selecting the appropriate input and output variables is an important step in the evaluation of TFEE using the DEA model. Although there have been many studies on energy efficiency analysis, there is still no unique standard for selecting input and output variables. In conventional energy efficiency measures, energy is used as a single input to generate GDP [3]; Hu and Wang [4] introduced labor and capital as input into the energy efficiency evaluation system for the first time, to evaluate the energy efficiency of 29 provinces and cities in China. By adopting the same variables, Honma and Hu [10] calculated the energy efficiency of a Japanese region from 1993 to 2003. Zhang, et al. [11] evaluated the energy efficiency of 27 developing countries.
In production activities, as the energy consumption structure is still dominated by fossil energy, a large number of carbon emissions, wastewater, and waste gas generated by the input of traditional energy have a serious impact on the environment. In this context, carbon emissions, waste gas, etc., are included as undesirable outputs when evaluating energy efficiency [12]. For example, Zhang, Sun and Huang [5] used carbon emissions as undesirable output and GDP as a desirable output when evaluating the energy efficiency of CDM member states. Li and Lin [13], Zhang and Choi [14], and Wang, et al. [15] also used GDP and carbon emissions as output variables when evaluating energy efficiency in 30 provinces and cities in China. Makridou, et al. [16] and Feng and Wang [17] also use the above variables to evaluate the efficiency of high energy consuming industries in EU countries and Chinese provincial-level industrial sectors.
Through the above analysis, it can be seen that there is a common system when using DEA for TFEE evaluation. Without loss of generality, energy, capital and labor are used as inputs. The main reason for introducing labor and capital is that energy itself cannot produce any output, and it must be put together with other factors to produce the output [4]. Regarding output variables, GDP is generally used as the expected output. Considering the impact of energy consumption on the environment, carbon emissions are typically used as undesirable output.
The variables will also vary depending on the different subjects. For example, when evaluating the energy efficiency of industries or enterprises, the input–output variables should be consistent with their actual production processes. Wu, et al. [18] selected passenger seats, transportation energy consumption, fixed assets, and transportation mileage as inputs. Passenger turnover and carbon emissions are selected as outputs to evaluate the energy efficiency of China’s transportation sector. Zhang and Choi [14] used the amount of power generation as the expected output when assessing the energy efficiency of 252 power plants in China.

4. Construction of DEA-Based Models in Energy Efficiency Evaluation

Since DEA was proposed in 1978, it has been widely used in the efficiency evaluation of multiple input–output problems. Since then, there has been continuous research to expand the DEA model based on different theoretical and realistic backgrounds. Many models have also been proposed, including radial and non-radial, static and dynamic, single structure and network structure models, etc. [19]. In the field of energy efficiency assessment, due to the existence of undesirable carbon emissions, modeling of energy efficiency, including undesirable outputs, has also attracted the attention of researchers. This section reviews the energy efficiency methods from the perspective of basic and extended DEA methods.

4.1. The Theoretical Basis of DEA

Data Envelopment Analysis (DEA) is a data-oriented method for estimating the full factor efficiency of homogeneous decision units (DMUs) [19]. DEA can obtain the weight of a set of optimal input and output variables through optimization methods based on objective data of the evaluation object, and determine the efficiency level of DMU in the form of input and output ratio [8]. The basic logic of the DEA method is to construct a set of homogeneous DMU convex combinations based on input–output data to obtain an efficient production frontier. By comparing the actual input–output data of the DMU with the projection data of the frontier, the DMU is evaluated by relative efficiency [20,21]. Since the DEA method was proposed, it has been widely used in different fields [9,19]. As to the DEA method, many scholars have also proposed new concepts and models, such as the cross-efficiency model, the super-efficiency model, SBM model, network structure model, etc. [22,23,24].
Charnes, Cooper and Rhodes [8] first proposed the DEA theory method. In the later DEA literature, the first DEA model they created, namely the CCR model, was named after the first letters of the three surnames of Charnes, Cooper and Rhodes. The CCR model assumes constant returns to scale (CRS). In the DEA method, the evaluated objects are represented by DMUs. Each DMU produces R outputs by inputting M production factors. In model (1),   x m o , y r o represents the m-th input and r-th output of the DMU, respectively, and u m , v r are the weights of the corresponding output and input variables. The input–output efficiency of the o-th DMU can be obtained from model (1). According to the weights of input and output variables, the CCR model can be understood as turning the multi-input–output problems into a virtual single input–output one. For a specific DMU, this single efficiency is measured by the ratio of virtual output to input. The linear programming of the CCR model can be expressed as maximizing the efficiency of a specific DMU with the condition that the efficiency of all DMUs does not exceed 1.
max m = 1 M u m y m o r = 1 R v r x r o s . t . m = 1 M u m y m n r = 1 R v r x r n 1 ; u 0 ; v 0 ;   m = 1 , 2 , , M ; r = 1 , 2 , , R ;   n = 1 , 2 , , N
Since model (1) is a nonlinear programming one, let t = 1 r = 1 R v r x r o , μ = t u , ν = t v , model (1) can be transformed into an equivalent linear programming model, as shown in model (2). Model (2) is called the DEA multiplier form, and its dual model can be represented by model (3), known as the envelope form. The CCR model assumes that the returns to scale are unchanged, and the technical efficiency obtained includes the scale efficiency component, so it is called comprehensive technical efficiency [8]. According to the way efficiency is measured, DEA models can also be divided into input-oriented, output-oriented, and non-oriented.
max m = 1 M μ m y m o s . t . m = 1 M μ m y m n r = 1 R ν m x m n 1       m = 1 , 2 , , M r = 1 R ν m x m o = 1       r = 1 , 2 , , R ν 0 ; μ 0 ; n = 1 , 2 , N
min θ s . t . n = 1 N λ n x m n θ x m o   m = 1 , 2 , , M n = 1 N λ n y r n y r o       r = 1 , 2 , , R λ n 0 , n = 1 , 2 , , N j = 1 , 2 , N
As mentioned above, many scholars have also proposed various new concepts and models in the field of the DEA method, and many of those novel methods are utilized to evaluate energy efficiency. In this paper, some basic or extended DEA models for assessing the efficiency of energy performance will be summarized. To better understand these models more visually and clearly, the main features of these models as well as their application scenario are presented in Table 1.

4.2. Energy Efficiency Evaluation Model Based on Basic DEA

4.2.1. CCR-Based Evaluation Model

Based on the input-oriented CCR model, Hu and Wang [4] proposed a TFEE evaluation model, as shown in model (4). It is also assumed that there are N DMUs, and the production process of each DMU is the input of energy and other M production factors, resulting in R outputs. The energy input of the o-th DMU is denoted by e o . x m o , y r o represents the non-energy input and expected output of the DMU respectively.
min θ s . t . n = 1 N λ n e n θ e o n = 1 N λ n x m n θ * x m o   m = 1 , 2 , , M n = 1 N λ n y r n y r o       r = 1 , 2 , , R λ n 0 , n = 1 , 2 , , N
The optimal solution can be obtained by solving model (4), which represents the efficiency of the o-th DMU. However, the above model cannot directly obtain the target energy input. Thus, Ali and Seiford [25] proposed a two-stage method so that the slack variables of input and output can be obtained. The slack variable of energy input can be expressed by s e . The TFEE based on the CCR model can be calculated by formula (5).
C C R b a s e d       T F E E = θ × e o s e e o = 1 ( 1 θ ) × e o + s e e o

4.2.2. BCC-Based Evaluation Model

The CCR model assumes that the scale effect of production technology is maintained, but in fact, not all DMUs are in the optimal production scale state. Therefore, the efficiency calculated by the CCR model includes scale efficiency. Subsequently, Banker, Charnes and Cooper [21] proposed a DEA model that considers returns to scale, known as the BCC model. The BCC model is based on variable returns to scale, and the technical efficiency derived excludes the effects of returns on the scale, so it is called pure technical efficiency. The BCC model adds a constraint n = 1 N λ n = 1 to the CCR model; λ is the linear combination coefficient of input–output variables. The BCC-based energy efficiency evaluation model is shown in model (6), and the meaning of the variables in model (6) is consistent with their counterparts in model (4).
min θ s . t . n = 1 N λ n e n θ e o   n = 1 N λ n x m n θ x m o   m = 1 , 2 , , M   n = 1 N λ n y r n y r o       r = 1 , 2 , , R   n = 1 N λ n = 1   λ n 0 , n = 1 , 2 , , N B C C b a s e d       T F E E = θ × e o s e e o = 1 ( 1 θ ) × e o + s e e o

4.2.3. SBM-Based Evaluation Model

The CCR and BCC models improve the inefficient DMU by reducing (increasing) all inputs (or outputs) proportionally, which are called radial models. In fact, for the inefficient DMU, the gap between the current state and the effective target value also includes part of the slack improvement. Therefore, Tone [26] proposed the Slack-Based Model (SBM), a non-oriented efficiency evaluation model, which is used to deal with the slack improvement of the input and output. The SBM has a higher discriminating ability than the CCR and BCC model. The energy efficiency evaluation model based on the non-oriented SBM is shown in model (7).
In model (7), the optimal value of the objective function is the efficiency value of the unoriented SBM. s e represents the slack variable of the energy input, S m and S m + represent the slack variable of the m-th input and r-th output. The remaining variables are consistent with those in the model (6). According to the Charnes–Cooper transformation, the abovementioned nonlinear SBM can be transformed into a linear model for solving.
min 1 1 M + 1 ( m = 1 M s m x m o + s e e o ) 1 1 R r = 1 R s r + y r o s . t . n = 1 N λ n e n = e o s e   n = 1 N λ n x m n = x m o s m ,       m = 1 , 2 , , M   n = 1 N λ n y r n = y r o + s r + ,       r = 1 , 2 , , R   λ n 0 , s e 0 , s m 0 , s r + 0 , n = 1 , 2 , , N

4.3. Energy Efficiency Evaluation Model Based on Extended DEA

4.3.1. Evaluation Model Considering the Impact of Carbon Emissions

In recent years, the use of clean energy has gradually increased, but the energy consumption structure has not changed in the short term, with fossil energy as the mainstay. A large number of carbon emissions, wastewater and gas caused by the use of traditional energy sources have a serious impact on the environment. Therefore, it is necessary to consider the impact of carbon emissions and wastewater emissions when evaluating energy efficiency [12]. For example, He, et al. [27] found that undesirable output has a great impact on energy efficiency when studying the energy efficiency of OECD countries. Disregarding undesirable output often leads to an overestimation of energy efficiency.
Regarding the setting of the undesirable output in the DEA method, it can be divided into strong disposability and weak disposability [28]. The first is strong disposability, which can reduce undesirable output without reducing expected output [29]. In the case of strong disposability assumptions, the undesirable output can be treated as input [30,31] or transform the data of the undesirable output, including linear transformation, inverse transformation and exponential transformation [32,33,34]. The second is the assumption of weak disposability of undesirable output, that is, to reduce undesirable output requires additional input or reduce expected output [35,36]. It implies that the reduction in undesirable output comes at the cost of expected output. There is also a null joint hypothesis for undesirable output, which indicates that as long as there is expected output in production activities, it must accompany undesirable output. The only solution to avoid undesirable output is to stop production.
In the existing literature, the assumption of weak disposability is widely adopted. As the setting of null-jointness is more in line with reality, that is to say, the input of energy, labor and capital will produce greenhouse gas emissions while generating economic benefits. According to Apergis, et al. [37], in the SBM-DEA model considering undesirable output, it is assumed that there are N DMUs, and the production process of each DMU is through the input of energy and other M production factors. This results in R expected outputs and K undesirable outputs. u q o represents the q-th undesirable output of the o-th DMU, and the remaining variables are consistent with model (7). The SBM-DEA model based on weak disposability is shown in model (8). The constraint of model (8) on the undesirable output, ( 1 + 1 R r = 1 R s r + y r o ) indicates that the expected output and the undesirable output have the same proportion of change.
min 1 1 M + 1 ( m = 1 M s m x m o + s e e o ) 1 + 1 R + Q ( r = 1 R s r + y r o + q = 1 Q s q u q o ) s . t . n = 1 N λ n e n = e o s e   n = 1 N λ n x m n = x m o s m ,       m = 1 , 2 , , M   n = 1 N λ n y r n = y r o + s r + ,       r = 1 , 2 , , R   n = 1 N λ n u q n = ( 1 + 1 R r = 1 R s r + y r o ) u q o s q ,       q = 1 , 2 , , Q   λ n 0 , s e 0 , s m 0 , s r + 0 , s q 0 , n = 1 , 2 , , N

4.3.2. Evaluation Model Considering the Network Structure

The basic DEA method regards the production system as a “black box”, which means that only the initial input and final output of the system are considered to evaluate the efficiency of the decision unit [22]. However, the energy system is regarded as a complex process, in other words, the “black box” assumption ignores the process of energy conversion or transmission. For example, the conversion process of primary energy (such as coal, oil, and natural gas) to secondary energy (such as coke, liquefied petroleum gas, and thermal power) in industrial systems, as well as the process of power generation, power distribution transmission, and end-user energy consumption by power generation companies. The energy efficiency obtained under the “black box” assumption cannot provide specific process guidance in the energy production sector and the energy utilization sector to improve energy efficiency separately [38].
In order to open the “black box” to evaluate the process efficiency of DMUs, Färe and Grosskopf [22] first proposed a network DEA model considering intermediate output. Since Seiford and Zhu [39] first applied two-stage DEA to US commercial banks, network DEA has been widely used for efficiency in various industrial and commercial sectors. Since then, Tone and Tsutsui [40] proposed the SBM-Network DEA model, and Fukuyama and Weber [41] extended the SBM network DEA model to evaluate the efficiency of systems with undesirable outputs.
In the two-stage DEA structure, the DMU is divided into two sub-DMUs, where each sub-DMU consumes input to generate output, where the input of the second stage is the output of the first stage. When evaluating energy efficiency, Liu and Wang [38] divided the energy efficiency of the industrial sector into two phases of energy production and energy consumption and used a two-stage network DEA to evaluate energy efficiency, as shown in model (9).
In the network structure of model (9), the first stage is the energy production sector, where the input is primary energy and the output is secondary energy. The second stage is the energy consumption sector, whose input is the output produced in the first stage. λ 1 and λ 2 represent the linear combination coefficients of the input and output in the first and second phases, respectively; e o is the primary energy input in the first phase; x m o is the m-th input index of the o-th DMU in the first phase; z t o is the t-th secondary energy of the o-th DMU generated in the first stage, and it is also the input index of the second stage; y r o is the r-th output index of the o-th DMU in the second stage.
max 1 2 1 M + 1 ( m = 1 M s m x m o + s e e o ) + 1 2 1 R r = 1 R s r + y r o s . t . n = 1 N λ n 1 e n = e o s e n = 1 N λ n 1 x m n = x m o s m , m = 1 , 2 , , M n = 1 N λ n 1 z t n = z t o + s t 1 + , t = 1 , 2 , , K } s t a g e 1 n = 1 N λ n 2 z t n = z t o s t 2 , t = 1 , 2 , , K n = 1 N λ n 2 y r n y r o + s r + , r = 1 , 2 , , R } s t a g e 2 λ n 1 0 , λ n 2 0 , s e 0 , s m 0 , s t 1 + 0 , s t 2 0 , s r + 0 , n = 1 , 2 , , N N e t w o r k D E A b a s e d       T F E E = 1 s e e o

4.3.3. Evaluation Model Considering the Dynamic Process

When the data of the evaluated DMU are panel data of multiple periods, the assumption that the production technology of the basic DEA method is the same all the time does not meet the actual situation. Therefore, Charnes and Cooper [42] introduced DEA window analysis as an extension of the traditional DEA method. DEA window analysis can analyze section data and panel data to analyze the dynamic efficiency of the evaluated object. As a commonly used dynamic efficiency analysis method, window DEA analysis is based on the moving average principle. It treats each DMU in different periods as a separate unit for efficiency measurement. When evaluating energy efficiency under the window analysis framework, the energy efficiency of a region in one period can be compared with the efficiency of other regions and its efficiency in other periods [43]. In addition, window analysis can also explore the energy efficiency of different regions in different years through a series of overlapping windows [44].
Besides, the non-parametric Malmquist productivity index (MPI), as a time series analysis technique, has also been extended to DEA models to characterize dynamic changes in efficiency. Färe, et al. [45] introduced the Malmquist index into the DEA model to evaluate the efficiency changes of different DMUs and the dynamic changes of production technology in two periods. In the field of energy efficiency evaluation, the Malmquist model is also widely used [17,46].

4.3.4. Evaluation Model Considering Game Relations

The basic DEA method maximizes the efficiency of the evaluation object by selecting a set of optimal weights, which usually leads to an overestimation of the evaluation object’s efficiency value [47]. Therefore, Sexton, et al. [48] proposed cross-efficiency DEA, in which the mutual evaluation weights were added between DMUs to improve objectivity. In reality, there is often a direct or indirect competitive relationship between different DMUs. Especially in the evaluation of energy efficiency, competition may be more intense due to the scarcity of energy. Considering that when there is a competitive relationship, the cross-efficiency DEA evaluation method will not be able to evaluate the efficiency value of the DMU correctly. To this end, Liang, et al. [49] consider the game relationship between different DMUs and extend the DEA cross-efficiency to the DEA game cross-efficiency, by maximizing the cross-efficiency of each DMU without reducing the efficiency of other DMUs.
In the field of energy efficiency evaluation, DEA efficiency is widely used in game cross-efficiency. Chen, et al. [50] introduced the game cross-efficiency DEA for the first time to measure the energy efficiency of the power industry in China’s provincial regions under environmental constraints. Studies have shown that the energy efficiency of eastern China is much higher than that of central and western China. Xie, et al. [51] evaluated the environmental efficiency of China’s power generation industry through the game cross-efficiency DEA, and the results showed that there was a significant efficiency gap between regions. Yang and Wei [52] also used this method to analyze the energy efficiency of 26 prefecture-level cities in China. Considering that the cross-game DEA model requires multiple steps, this article does not describe the model in detail here. The detailed model can be understood by reading the relevant literature mentioned in this section.

4.3.5. Evaluation Model Considering Technical Heterogeneity

Based on a unified reference technology assumption, the basic DEA method assumes that all DMUs participate in the evaluation with the same technical benchmark. It means that the heterogeneity of different evaluation objects is ignored in the efficiency evaluation. In fact, there are huge differences in natural resources, economic foundations, urbanization levels, and industrial structures in various regions of China. For example, some provinces are dominated by agriculture and services, while others are dominated by manufacturing. In this case, each region of China may have its own characteristics of typical energy use, and the energy structure and technological level among the provinces are quite different [53,54].
In order to solve the problem of bias in efficiency evaluation results due to heterogeneity between DMUs, Battese, et al. [55] introduced a meta-frontier model for different groups with different technologies. It can calculate comparable technical efficiency for DMUs under different technologies. Since then, DEA and meta-frontier models have been widely used in energy efficiency evaluation. Yu, et al. [56] combined the meta-frontier method with super-SBM to study the energy efficiency of various regions in China during 2006–2016. Yu, You, Zhang and Ma [55] analyze the energy efficiency of 277 cities in China from 2007 to 2014, taking into account the effects of technological heterogeneity. Wang, et al. [57] classified Guangdong enterprises based on geographic boundaries and industry classification systems and used group frontier and meta-frontier direction distance functions to analyze their energy efficiency. The technical explanation and detailed settings of the meta-frontier model can be obtained in the related literature mentioned in this section.

5. Application of DEA Model in Energy Efficiency Evaluation

As DEA has become an important and commonly used analysis tool and method in the field of energy efficiency assessment, a large amount of the literature evaluates energy efficiency based on data from countries, regions, industries and companies. This section will introduce the application of DEA in energy efficiency evaluation.

5.1. Energy Efficiency Evaluation of Regions

After Hu and Wang [4] first proposed the total factor energy efficiency framework and evaluated the energy efficiency of various regions in China, the DEA method was widely used in national and regional energy efficiency evaluation. This section reviews the studies that have evaluated energy efficiency in different regions using DEA from 2015 to 2019 and the results are shown in Table 2.
Jebali, et al. [58] analyzed the energy efficiency and influencing factors of Mediterranean countries during 2009–2012. The results of the study indicate that the energy efficiency levels in Mediterranean countries are high and decline over time. Gross national income per capita, population density and the use of renewable energy can affect energy efficiency. Zhao, et al. [59] measured the energy efficiency of 35 Belt and Road countries in 2015 based on a three-stage DEA model. The results show that South Korea, Singapore, Israel, and Turkey have a TFEE of 1. Uzbekistan, Ukraine, South Africa and Bulgaria are less efficient. He, Sun, Shen, Jian and Yu [27] established an DEA-based energy efficiency evaluation model for measuring the energy efficiency of 32 OECD countries from 1995 to 2016. Additionally, the effects of environmental factors on energy efficiency assessment were compared through efficiency analysis and predicted value analysis. Wang, et al. [60] use the DEA-Malmquist method to measure the energy efficiency of 25 countries; the results of this study show that by using the same inputs as developing countries, the developed countries’ balance between GDP growth and carbon dioxide emissions is more balanced. In addition, India and China increased their energy intensity during 2010–2017.
In addition to evaluating a country’s energy efficiency, the energy efficiency of provinces and cities has also attracted the attention of many researchers, especially in China’s provinces and cities. Wang, Yu and Zhang [43], Li and Lin [13], and Wu, Zhu, Yin and Song [63] adopt the DEA method to evaluate the energy efficiency of 30 provinces in China, and research shows that most provinces are less energy efficient. Eastern China has the highest energy efficiency, while western China has the worst energy efficiency. Efficiency has improved in most regions during 2006–2010. Yu, You, Zhang and Ma [56] proposed an energy efficiency evaluation model that takes into account regional technological heterogeneity and carbon emissions. By evaluating the energy efficiency of 277 cities in China between 2007 and 2014, the study found that there are large differences in the energy efficiency of Chinese cities. Sun, Wang and Li [66] considered the heterogeneity and technology gap of energy management in different regions and measured the energy efficiency of 211 cities in the country. The results show that the overall efficiency of Chinese cities is low, while that of central China is the lowest, and there is a huge technological gap between regions. Yang and Wei [52] used the game cross-efficiency DEA method to analyze the urban total factor energy efficiency of 26 prefecture-level cities in China from 2005 to 2015. The results show that the energy efficiency of cities considering competition is lower than traditionally calculated energy efficiency. During the study period, the study concluded that urban energy efficiency did not improve. There are also studies evaluating regional energy efficiency in other countries. For example, Honma and Hu [10] used the DEA method to analyze total factor energy efficiency based on data from 47 cities and counties in Japan.

5.2. Energy Efficiency Evaluation of Industries and Companies

DEA is also widely used in assessing industry energy efficiency. Through a search of the related literature, it can be found that research on industry energy efficiency is mainly concentrated in high energy consuming industries such as electricity, construction, and transportation. Table 3 shows the energy efficiency evaluation of industries.
Makridou, Andriosopoulos, Doumpos and Zopounidis [16] used the DEA method to assess the energy efficiency of five energy-intensive industries (building, power, manufacturing, mining, and transportation sectors) in 23 EU countries between 2000 and 2009. The study found that overall efficiency has improved across all sectors during this period. Lee and Choi [67] evaluated the energy and environmental efficiency of seven manufacturing sectors in South Korea from 2011 to 2017, and the results showed that energy efficiency improved by an average of 0.3% during the study period. Zhou, Xu, Wang and Wu [34] conducted an empirical study on the energy efficiency of China’s industrial sector from 2010 to 2014, and the results showed that most sectors of Chinese industry performed poorly, especially those related to energy extraction. Lei, et al. [68] evaluated the energy efficiency of 30 provincial transport departments in China. The results show that the energy efficiency of the provincial transport departments in China varies widely; efficiency is better than in the midwest of China. Djordjevic and Krmac [69] uses a non-radial DEA to evaluate the energy efficiency of the transportation industry (road, railway and aviation sectors) in Europe. Studies indicate that the energy efficiency of the road sector is improving, while the energy efficiency of the railway transport sector in many assessed countries is low.
Compared to the regional and industry levels, energy efficiency at the enterprise level is relatively low. In the existing research, Cui and Li [73] used DEA to analyze the energy efficiency of 11 airlines from 2008 to 2012. The results show that capital efficiency is an important factor to promote energy efficiency. The US financial crisis had a significant impact on energy efficiency. Zhang and Choi [14] carried out an empirical analysis of the energy efficiency of fossil fuel power generation in Korea by using the DEA method. The results show that coal-fired power plants have higher total energy efficiency than oil-fired power plants, and the technology gap of coal-fired power plants is smaller than that of oil-fired power plants. Studies show that the Korean government should promote technological innovation to reduce the technology gap in coal-fired power plants. Bi, et al. [74] analyzed the energy efficiency of Chinese fossil fuel power generation enterprises. They pointed out that the energy and environmental efficiency of the enterprises are low, and there are large differences between provinces. In addition to power generation companies, Zhang, et al. [75] also analyzed the energy efficiency of 62 power generation equipment.

6. Findings and Future Research Discussions

6.1. Main Findings

By analyzing the literature on energy efficiency evaluation using the DEA method, it can be found that a large number of studies are conducted from the perspective of theory and application based on the data of countries, regions, industries and enterprises. The research has attracted more researchers’ attention and the number of publications has gradually increased since 2011. From a methodological perspective, the DEA-based energy efficiency evaluation models are more consistent with the actual situation, such as extending from a single output model to an evaluation model that considers pollution emissions. The analysis of the research stage also ranges from a single stage to a multi-stage energy conversion issue. In addition, a dynamic analysis of multi-year efficiency is also the focus of one study. In other words, the construction of the energy efficiency evaluation model based on DEA has evolved from a static structure of a simple structure to a dynamic model of a complex network structure, and the accuracy of the efficiency evaluation has also been continuously improved.
Based on the above analysis of the related research on energy efficiency using DEA, this article discusses the overall situation of existing research and existing research deficiencies as follows:
(1) From the perspective of research objects, a large number of documents use data from countries, regions, industries and companies. Many research results have been obtained. Especially as China is a large country of energy consumption and carbon emissions, a large number of studies have been conducted on energy efficiency in China. Aiming at the technical heterogeneity of energy efficiency and competitive cooperation between different research objects, existing research proposes corresponding expansion models for different scenarios to improve the accuracy of efficiency assessment. It is not difficult to find that most of the existing energy efficiency is analyzed at the regional level. Although the energy efficiency at the company level has also attracted the attention of many scholars, compared with the regional and industry sectors, the energy efficiency analysis for enterprises is relatively small.
(2) From a method point of view, a large number of scholars have improved the model from different perspectives, and the accuracy of energy efficiency assessment has also continuously improved. With the expansion of research, the level of agreement between the construction of the DEA-based energy efficiency evaluation model and the actual situation continues to increase. However, as a data-oriented efficiency assessment method, DEA is mainly based on analysis with structured and clear data. Model studies that can deal with energy efficiency issues in complex data environments such as heterogeneity, uncertainty, or big data are still lacking. As the complexity of products and services continues to increase, the depth of energy efficiency assessment objects, especially at the microdata level, such as enterprise-level data and production line data, is often unstructured, and different data structures affect DEA. The accuracy of the assessment will also have an impact, resulting in increased errors in the efficiency assessment. Therefore, with the increasing complexity of the energy system, building a DEA model in a complex data environment will enable a more effective evaluation of energy efficiency.

6.2. Future Research Discussions

In order to inspire subsequent research on energy efficiency assessment using DEA, this paper proposes possible future studies from the perspective of application areas and models.

6.2.1. Further Research on Energy Efficiency Issues in Enterprises

This paper believes that research on the energy efficiency of enterprises will help to further improve energy efficiency if data are available. Specifically, the analysis of corporate data helps reveal the state of corporate energy-saving technologies. Besides, with the continuous improvement of carbon trading markets and policies, analyzing the energy efficiency level of enterprises will help companies to manage carbon emission quotas and improve their competitiveness.

6.2.2. Further Research on Energy Efficiency Based on Complex Data Environment

For energy efficiency assessment models based on complex data environment, as the complexity of energy systems continues to increase, it is particularly important to build evaluation models that can analyze complex data. In this article, complex data may include inaccurate or ambiguous observations of input and output data, large datasets for analysis, and heterogeneous data due to differences in input or output structure.
(1) The DEA energy efficiency evaluation model in the heterogeneous data environment.
Despite the continuous development of current information technology and the continuous improvement of data retrieval and analysis capabilities, there will still be data heterogeneity in the evaluation. Unlike the problem of data loss caused by data retrieval and data storage, the data heterogeneity discussed here is due to differences in the input or output variables caused by the complexity of the production system. For instance, Cook, et al. [76] pointed out that steel plants will produce different types of steel even if they invest the same resource structure. When the traditional DEA method is used for evaluation, the efficiency will be biased. In fact, researchers have begun to consider the heterogeneity of output indicators. Wu, et al. [77] have started to discuss the use of improved DEA analysis to evaluate the efficiency of DMUs with different input and output indicators. It is not difficult to find that under different energy consumption scenarios, especially at the microdata level, it is particularly important to expand the efficiency assessment method in the case of heterogeneous input–output variables.
(2) The DEA energy efficiency evaluation model in the uncertain data environment.
In the reality of energy efficiency assessments, the observations of input and output data may be inaccurate or ambiguous [78]. The efficiency evaluation in the uncertain environment has attracted the attention of many researchers. Among them, the fuzzy set theory proposed by Zadeh, et al. [79] and others has been widely adopted. Based on fuzzy theory, some researchers have suggested the Fuzzy DEA model [80,81]. In the field of energy efficiency assessment, the expansion and application of the Fuzzy DEA model will help to improve the accuracy of energy efficiency assessment.
(3) The DEA energy efficiency evaluation model in the big data environment.
In the big data environment, the dataset used for analysis is usually very large, which causes the traditional DEA calculation process to take a long time. Therefore, analyzing big data makes researchers face many difficulties [82]. Recently, scholars have begun to evaluate energy efficiency based on a large number of data environments. For example, Zhu, et al. [83] proposed a DEA-based method for the allocation and utilization of natural resources in China, using big data technology to characterize the production technology in each region. Li, et al. [84] uses big data theory to analyze and evaluate the efficiency of China’s forest resources, taking into account many evaluation indicators and large amounts of data in the big data environment. With the continuous improvement of information and information technology and data retrieval capabilities in the future, how to make full use of the big data environment in the energy field and expand DEA models and algorithms will help further enhance the application space of DEA.

Author Contributions

Conceptualization, T.X. and J.Y.; data curation, L.S.; funding acquisition, J.Y.; methodology, T.X.; resources, H.L.; visualization, L.S.; writing—original draft, T.X.; writing—review and editing, L.S. All authors have read and agreed to the published version of the manuscript.

Funding

This research was funded by the National Natural Science Foundation of China grant number 71671125.

Conflicts of Interest

The authors declare no conflict of interest.

Nomenclatures

DEAData Envelopment Analysis
DMUDecision-Making Unit
CRSConstant Returns to Scale
TFEETotal Factor Energy Efficiency
GDPGross Domestic Product
CCRAuthors’ initials (Charnes, Cooper and Rhodes)
BCCAuthors’ initials (Banker, Charnes and Cooper)
CDMClean Development Mechanism
SBMSlack-based Model
OECDOrganization for Economic Co-operation and Development
MPIMalmquist productivity index
EUEuropean Union
SFAStochastic Frontier Analysis

References

  1. Li, M.J.; He, Y.L.; Tao, W.Q. Modeling a hybrid methodology for evaluating and forecasting regional energy efficiency in China. Appl. Energy 2017, 185, 1769–1777. [Google Scholar] [CrossRef]
  2. Song, M.L.; Zhang, J.; Wang, S.H. Review of the network environmental efficiencies of listed petroleum enterprises in China. Renew. Sustain. Energy Rev. 2015, 43, 65–71. [Google Scholar] [CrossRef]
  3. Patterson, M.G. What is energy efficiency? Concepts, indicators and methodological issues. Energy Policy 1996, 24, 377–390. [Google Scholar] [CrossRef]
  4. Hu, J.-L.; Wang, S.-C. Total-factor energy efficiency of regions in China. Energy Policy 2006, 34, 3206–3217. [Google Scholar] [CrossRef]
  5. Zhang, Y.J.; Sun, Y.F.; Huang, J. Energy efficiency, carbon emission performance, and technology gaps: Evidence from CDM project investment. Energy Policy 2018, 115, 119–130. [Google Scholar] [CrossRef]
  6. Pulina, M.; Detotto, C.; Paba, A. An investigation into the relationship between size and efficiency of the Italian hospitality sector: A window DEA approach. Eur. J. Oper. Res. 2010, 204, 613–620. [Google Scholar] [CrossRef]
  7. Vishwakarma, A.; Kulshrestha, M.; Kulshreshtha, M. Efficiency evaluation of municipal solid waste management utilities in the urban cities of the state of Madhya Pradesh, India, using stochastic frontier analysis. Benchmarking 2012, 19, 340–357. [Google Scholar] [CrossRef]
  8. Charnes, A.; Cooper, W.W.; Rhodes, E. Measuring the efficiency of decision making units. Eur. J. Oper. Res. 1978, 2, 429–444. [Google Scholar] [CrossRef]
  9. Zhu, J. Data Envelopment Analysis: A Handbook of Models and Methods; Springer: Boston, MA, USA, 2015; Volume 221. [Google Scholar]
  10. Honma, S.; Hu, J.L. Total-factor energy efficiency of regions in Japan. Energy Policy 2008, 36, 821–833. [Google Scholar] [CrossRef]
  11. Zhang, X.P.; Cheng, X.M.; Yuan, J.H.; Gao, X.J. Total-factor energy efficiency in developing countries. Energy Policy 2011, 39, 644–650. [Google Scholar] [CrossRef]
  12. Wu, J.; Yin, P.Z.; Sun, J.S.; Chu, J.F.; Liang, L. Evaluating the environmental efficiency of a two-stage system with undesired outputs by a DEA approach: An interest preference perspective. Eur. J. Oper. Res. 2016, 254, 1047–1062. [Google Scholar] [CrossRef]
  13. Li, K.; Lin, B.Q. Metafroniter energy efficiency with CO2 emissions and its convergence analysis for China. Energy Econ. 2015, 48, 230–241. [Google Scholar] [CrossRef]
  14. Zhang, N.; Choi, Y. Environmental energy efficiency of China’s regional economies: A non-oriented slacks-based measure analysis. Soc. Sci. J. 2013, 50, 225–234. [Google Scholar] [CrossRef]
  15. Wang, Z.H.; Zeng, H.L.; Wei, Y.M.; Zhang, Y.X. Regional total factor energy efficiency: An empirical analysis of industrial sector in China. Appl. Energy 2012, 97, 115–123. [Google Scholar] [CrossRef]
  16. Makridou, G.; Andriosopoulos, K.; Doumpos, M.; Zopounidis, C. Measuring the efficiency of energy-intensive industries across European countries. Energy Policy 2016, 88, 573–583. [Google Scholar] [CrossRef]
  17. Feng, C.; Wang, M. Analysis of energy efficiency and energy savings potential in China’s provincial industrial sectors. J. Clean. Prod. 2017, 164, 1531–1541. [Google Scholar] [CrossRef]
  18. Wu, J.; Zhu, Q.Y.; Chu, J.F.; Liu, H.W.; Liang, L. Measuring energy and environmental efficiency of transportation systems in China based on a parallel DEA approach. Transp. Res. Part D 2016, 48, 460–472. [Google Scholar] [CrossRef]
  19. Cooper, W.W.; Seiford, L.M.; Zhu, J. Handbook on Data Envelopment Analysis; Springer Science & Business Media: Berlin, Germany, 2011; Volume 164. [Google Scholar]
  20. Li, F.; Emrouznejad, A.; Yang, G.L.; Li, Y.J. Carbon emission abatement quota allocation in Chinese manufacturing industries: An integrated cooperative game data envelopment analysis approach. J. Oper. Res. Soc. 2019. [Google Scholar] [CrossRef]
  21. Banker, R.D.; Charnes, A.; Cooper, W.W. Some Models for Estimating Technical and Scale Inefficiencies in Data Envelopment Analysis. Manag. Sci. 1984, 30, 1078–1092. [Google Scholar] [CrossRef] [Green Version]
  22. Färe, R.; Grosskopf, S. Productivity and intermediate products: A frontier approach. Econ. Lett. 1996, 50, 65–70. [Google Scholar] [CrossRef]
  23. Chung, Y.H.; Färe, R.; Grosskopf, S. Productivity and Undesirable Outputs: A Directional Distance Function Approach. J. Environ. Manag. 1997, 51, 229–240. [Google Scholar] [CrossRef] [Green Version]
  24. Tone, K. A slacks-based measure of efficiency in data envelopment analysis. Eur. J. Oper. Res. 2001, 130, 498–509. [Google Scholar] [CrossRef] [Green Version]
  25. Ali, A.I.; Seiford, L.M. Computational Accuracy and Infinitesimals In Data Envelopment Analysis. Inf. Syst. Oper. Res. 1993, 31, 290–297. [Google Scholar] [CrossRef]
  26. Tone, K. A slacks-based measure of super-efficiency in data envelopment analysis. Eur. J. Oper. Res. 2002, 143, 32–41. [Google Scholar] [CrossRef] [Green Version]
  27. He, P.; Sun, Y.; Shen, H.; Jian, J.; Yu, Z. Does Environmental Tax Affect Energy Efficiency? An Empirical Study of Energy Efficiency in OECD Countries Based on DEA and Logit Model. Sustainability 2019, 11, 3792. [Google Scholar] [CrossRef] [Green Version]
  28. Halkos, G.; Petrou, K.N. Treating undesirable outputs in DEA: A critical review. Econ. Anal. Policy 2019, 62, 97–104. [Google Scholar] [CrossRef]
  29. Fare, R.; Grosskopf, S.; Pasurka, C. Effects on Relative Efficiency in Electric-Power Generation Due to Environmental Controls. Resour. Energy 1986, 8, 167–184. [Google Scholar] [CrossRef]
  30. Tyteca, D. Linear programming models for the measurement of environmental performance of firms—Concepts and empirical results. J. Prod. Anal. 1997, 8, 183–197. [Google Scholar] [CrossRef]
  31. Macpherson, A.J.; Principe, P.P.; Shao, Y. Controlling for exogenous environmental variables when using data envelopment analysis for regional environmental assessments. J. Environ. Manag. 2013, 119, 220–229. [Google Scholar] [CrossRef]
  32. Scheel, H. Undesirable outputs in efficiency valuations. Eur. J. Oper. Res. 2001, 132, 400–410. [Google Scholar] [CrossRef]
  33. Seiford, L.M.; Zhu, J. Modeling undesirable factors in efficiency evaluation. Eur. J. Oper. Res. 2002, 142, 16–20. [Google Scholar] [CrossRef]
  34. Zhou, Z.X.; Xu, G.C.; Wang, C.; Wu, J. Modeling undesirable output with a DEA approach based on an exponential transformation: An application to measure the energy efficiency of Chinese industry. J. Clean. Prod. 2019, 236, 11. [Google Scholar] [CrossRef]
  35. Fare, R.; Grosskopf, S.; Hernandez-Sancho, F. Environmental performance: An index number approach. Resour. Energy Econ. 2004, 26, 343–352. [Google Scholar] [CrossRef]
  36. Yang, H.L.; Pollitt, M. The necessity of distinguishing weak and strong disposability among undesirable outputs in DEA: Environmental performance of Chinese coal-fired power plants. Energy Policy 2010, 38, 4440–4444. [Google Scholar] [CrossRef]
  37. Apergis, N.; Aye, G.C.; Barros, C.P.; Gupta, R.; Wanke, P. Energy efficiency of selected OECD countries: A slacks based model with undesirable outputs. Energy Econ. 2015, 51, 45–53. [Google Scholar] [CrossRef] [Green Version]
  38. Liu, Y.N.; Wang, K. Energy efficiency of China’s industry sector: An adjusted network DEA (data envelopment analysis)-based decomposition analysis. Energy 2015, 93, 1328–1337. [Google Scholar] [CrossRef]
  39. Seiford, L.M.; Zhu, J. Profitability and marketability of the top 55 US commercial banks. Manag. Sci. 1999, 45, 1270–1288. [Google Scholar] [CrossRef] [Green Version]
  40. Tone, K.; Tsutsui, M. Network DEA: A slacks-based measure approach. Eur. J. Oper. Res. 2009, 197, 243–252. [Google Scholar] [CrossRef] [Green Version]
  41. Fukuyama, H.; Weber, W.L. A directional slacks-based measure of technical inefficiency. Socio-Econ. Plan. Sci. 2009, 43, 274–287. [Google Scholar] [CrossRef]
  42. Charnes, A.; Cooper, W.W. Preface to topics in data envelopment analysis. Ann. Oper. Res. 1984, 2, 59–94. [Google Scholar] [CrossRef]
  43. Wang, K.; Yu, S.W.; Zhang, W. China’s regional energy and environmental efficiency: A DEA window analysis based dynamic evaluation. Math. Comput. Model. 2013, 58, 1117–1127. [Google Scholar] [CrossRef]
  44. Meng, F.Y.; Zhou, P.; Zhou, D.Q.; Bai, Y. Inefficiency and Congestion Assessment of Mix Energy Consumption in 16 APEC Countries by using DEA Window Analysis. Enrgy Procedia 2014, 61, 2518–2523. [Google Scholar] [CrossRef] [Green Version]
  45. Färe, R.; Grosskopf, S.; Lindgren, B.; Roos, P. Productivity developments in Swedish hospitals: A Malmquist output index approach. In Data Envelopment Analysis: Theory, Methodology, and Applications; Springer: Berlin, Germany, 1994. [Google Scholar]
  46. Perez, K.; Gonzalez-Araya, M.C.; Iriarte, A. Energy and GHG emission efficiency in the Chilean manufacturing industry: Sectoral and regional analysis by DEA and Malmquist indexes. Energy Econ. 2017, 66, 290–302. [Google Scholar] [CrossRef]
  47. Wu, J.; Liang, L. A multiple criteria ranking method based on game cross-evaluation approach. Ann. Oper. Res. 2012, 197, 191–200. [Google Scholar] [CrossRef]
  48. Sexton, T.R.; Silkman, R.H.; Hogan, A.J. Data envelopment analysis: Critique and extensions. New Dir. Program Eval. 1986, 1986, 73–105. [Google Scholar] [CrossRef]
  49. Liang, L.; Wu, J.; Cook, W.D.; Zhu, J. The DEA Game Cross-Efficiency Model and Its Nash Equilibrium. Oper. Res. 2008, 56, 1278–1288. [Google Scholar] [CrossRef] [Green Version]
  50. Chen, W.; Zhou, K.L.; Yang, S.L. Evaluation of China’s electric energy efficiency under environmental constraints: A DEA cross efficiency model based on game relationship. J. Clean. Prod. 2017, 164, 38–44. [Google Scholar] [CrossRef]
  51. Xie, B.C.; Gao, J.; Zhang, S.; Pang, R.Z.; Zhang, Z.X. The environmental efficiency analysis of China’s power generation sector based on game cross-efficiency approach. Struct. Chang. Econ. Dyn. 2018, 46, 126–135. [Google Scholar] [CrossRef]
  52. Yang, Z.S.; Wei, X.X. The measurement and influences of China’s urban total factor energy efficiency under environmental pollution: Based on the game cross-efficiency DEA. J. Clean. Prod. 2019, 209, 439–450. [Google Scholar] [CrossRef]
  53. Yu, J.; Zhou, K.; Yang, S. Regional heterogeneity of China’s energy efficiency in “new normal”: A meta-frontier Super-SBM analysis. Energy Policy 2019, 134, 110941. [Google Scholar] [CrossRef]
  54. Broadstock, D.C.; Li, J.; Zhang, D. Efficiency snakes and energy ladders: A (meta-)frontier demand analysis of electricity consumption efficiency in Chinese households. Energy Policy 2016, 91, 383–396. [Google Scholar] [CrossRef] [Green Version]
  55. Battese, G.E.; Prasada Rao, D.S.; O’Donnell, C.J. A metafrontier production function for estimation of technical efficiencies and technology gaps for firms operating under different technologies. J. Prod. Anal. 2004, 21, 91–103. [Google Scholar] [CrossRef]
  56. Yu, A.Y.; You, J.X.; Zhang, H.; Ma, J.J. Estimation of industrial energy efficiency and corresponding spatial clustering in urban China by a meta-frontier model. Sustain. Cities Soc. 2018, 43, 290–304. [Google Scholar] [CrossRef]
  57. Wang, P.; Deng, X.; Zhang, N.; Zhang, X. Energy efficiency and technology gap of enterprises in Guangdong province: A meta-frontier directional distance function analysis. J. Clean. Prod. 2019, 212, 1446–1453. [Google Scholar] [CrossRef]
  58. Jebali, E.; Essid, H.; Khraief, N. The analysis of energy efficiency of the Mediterranean countries: A two-stage double bootstrap DEA approach. Energy 2017, 134, 991–1000. [Google Scholar] [CrossRef]
  59. Zhao, C.H.; Zhang, H.N.; Zeng, Y.R.; Li, F.Y.; Liu, Y.X.; Qin, C.J.; Yuan, J.H. Total-Factor Energy Efficiency in BRI Countries: An Estimation Based on Three-Stage DEA Model. Sustainability 2018, 10, 278. [Google Scholar] [CrossRef] [Green Version]
  60. Wang, L.W.; Le, K.D.; Nguyen, T.D. Assessment of the Energy Efficiency Improvement of Twenty-Five Countries: A DEA Approach. Energies 2019, 12, 1535. [Google Scholar] [CrossRef] [Green Version]
  61. Bampatsou, C.; Papadopoulos, S.; Zervas, E. Technical efficiency of economic systems of EU-15 countries based on energy consumption. Energy Policy 2013, 55, 426–434. [Google Scholar] [CrossRef]
  62. Guo, S.D.; Li, H.; Zhao, R.; Zhou, X. Industrial environmental efficiency assessment for China’s western regions by using a SBM-based DEA. Environ. Sci. Pollut. Res. 2019, 26, 27542–27550. [Google Scholar] [CrossRef]
  63. Wu, J.; Zhu, Q.Y.; Yin, P.Z.; Song, M.L. Measuring energy and environmental performance for regions in China by using DEA-based Malmquist indices. Oper. Res. 2017, 17, 715–735. [Google Scholar] [CrossRef]
  64. Guo, X.; Lu, C.-C.; Lee, J.-H.; Chiu, Y.-H. Applying the dynamic DEA model to evaluate the energy efficiency of OECD countries and China. Energy 2017, 134, 392–399. [Google Scholar] [CrossRef]
  65. Amowine, N.; Ma, Z.Q.; Li, M.X.; Zhou, Z.X.; Asunka, B.A.; Amowine, J. Energy Efficiency Improvement Assessment in Africa: An Integrated Dynamic DEA Approach. Energies 2019, 12, 17. [Google Scholar] [CrossRef] [Green Version]
  66. Sun, J.S.; Wang, Z.H.; Li, G. Measuring emission-reduction and energy-conservation efficiency of Chinese cities considering management and technology heterogeneity. J. Clean. Prod. 2018, 175, 561–571. [Google Scholar] [CrossRef]
  67. Lee, H.S.; Choi, Y. Environmental Performance Evaluation of the Korean Manufacturing Industry Based on Sequential DEA. Sustainability 2019, 11, 14. [Google Scholar] [CrossRef] [Green Version]
  68. Lei, X.Y.; Li, L.; Zhang, X.F.; Dai, Q.Z.; Fu, Y.L. A Novel Ratio-Based Parallel DEA Approach for Evaluating the Energy and Environmental Performance of Chinese Transportation Sectors. J. Syst. Sci. Syst. Eng. 2019, 28, 621–635. [Google Scholar] [CrossRef]
  69. Djordjevic, B.; Krmac, E. Evaluation of Energy-Environment Efficiency of European Transport Sectors: Non-Radial DEA and TOPSIS Approach. Energies 2019, 12, 27. [Google Scholar] [CrossRef] [Green Version]
  70. Wu, J.; Xiong, B.B.; An, Q.X.; Sun, J.S.; Wu, H.Q. Total-factor energy efficiency evaluation of Chinese industry by using two-stage DEA model with shared inputs. Ann. Oper. Res. 2017, 255, 257–276. [Google Scholar] [CrossRef]
  71. Fei, R.; Lin, B. Energy efficiency and production technology heterogeneity in China’s agricultural sector: A meta-frontier approach. Technol. Forecast. Soc. Chang. 2016, 109, 25–34. [Google Scholar] [CrossRef]
  72. Han, Y.M.; Long, C.; Geng, Z.Q.; Zhang, K.Y. Carbon emission analysis and evaluation of industrial departments in China: An improved environmental DEA cross model based on information entropy. J. Environ. Manag. 2018, 205, 298–307. [Google Scholar] [CrossRef]
  73. Cui, Q.; Li, Y. Evaluating energy efficiency for airlines: An application of VFB-DEA. J. Air Transp. Manag. 2015, 44, 34–41. [Google Scholar] [CrossRef]
  74. Bi, G.-B.; Song, W.; Zhou, P.; Liang, L. Does environmental regulation affect energy efficiency in China’s thermal power generation? Empirical evidence from a slacks-based DEA model. Energy Policy 2014, 66, 537–546. [Google Scholar] [CrossRef]
  75. Zhang, N.; Kong, F.B.; Choi, Y.; Zhou, P. The effect of size-control policy on unified energy and carbon efficiency for Chinese fossil fuel power plants. Energy Policy 2014, 70, 193–200. [Google Scholar] [CrossRef]
  76. Cook, W.D.; Harrison, J.; Imanirad, R.; Rouse, P.; Zhu, J. Data Envelopment Analysis with Nonhomogeneous DMUs. Oper. Res. 2013, 61, 666–676. [Google Scholar] [CrossRef]
  77. Wu, J.; Li, M.J.; Zhu, Q.Y.; Zhou, Z.X.; Liang, L. Energy and environmental efficiency measurement of China’s industrial sectors: A DEA model with non-homogeneous inputs and outputs. Energy Econ. 2019, 78, 468–480. [Google Scholar] [CrossRef]
  78. Han, Y.M.; Geng, Z.Q.; Zhu, Q.X.; Qu, Y.X. Energy efficiency analysis method based on fuzzy DEA cross-model for ethylene production systems in chemical industry. Energy 2015, 83, 685–695. [Google Scholar] [CrossRef]
  79. Zadeh, L.A.; Fu, K.-S.; Tanaka, K. Fuzzy sets and their applications to cognitive and decision processes. In Proceedings of the US–Japan Seminar on Fuzzy Sets and Their Applications, Berkeley, CA, USA, 1–4 July 1974; Academic press, 2014. [Google Scholar]
  80. Lertworasirikul, S.; Fang, S.-C.; Joines, J.A.; Nuttle, H.L. Fuzzy data envelopment analysis (DEA): A possibility approach. Fuzzy Sets Syst. 2003, 139, 379–394. [Google Scholar] [CrossRef]
  81. Wen, M.L.; Li, H.S. Fuzzy data envelopment analysis (DEA): Model and ranking method. J. Comput. Appl. Math. 2009, 223, 872–878. [Google Scholar] [CrossRef] [Green Version]
  82. Chu, J.F.; Wu, J.; Song, M.L. An SBM-DEA model with parallel computing design for environmental efficiency evaluation in the big data context: A transportation system application. Ann. Oper. Res. 2018, 270, 105–124. [Google Scholar] [CrossRef]
  83. Zhu, Q.Y.; Wu, J.; Li, X.C.; Xiong, B.B. China’s regional natural resource allocation and utilization: A DEA-based approach in a big data environment. J. Clean. Prod. 2017, 142, 809–818. [Google Scholar] [CrossRef]
  84. Li, L.; Hao, T.T.; Chi, T. Evaluation on China’s forestry resources efficiency based on big data. J. Clean. Prod. 2017, 142, 513–523. [Google Scholar] [CrossRef]
Figure 1. Journal distribution and number of publications.
Energies 13 03548 g001
Figure 2. Number of publications from 2011 to 2019.
Energies 13 03548 g002
Figure 3. The context of keyword evolution.
Energies 13 03548 g003
Table 1. The main features and application scenario of DEA.
TypeModelMain Features and Application Scenario
Basic DEACCR DEACCR model assumes constant returns to scale, so that the results of the model include scale efficiencies
BCC DEAThe BCC model assumes variable returns to scale, and the results obtained are referred to as pure technical efficiency
SBM DEAAs a non-oriented efficiency evaluation model, SBM can be better used to deal with the slack improvement of the input and output variables
Extended DEAUndesirable DEAA good solution which can solve the problem of bad output in the production process
Network DEABy constructing a DEA model with intermediate output, the network DEA can open the black box to show more detailed efficiency in the production process
Dynamic DEADynamic DEA can effectively analyze the efficiency of different stages and the changes in efficiency, which can be achieved through the window DEA method or the Malmquist index
Game Cross-Efficiency DEAGame Cross-Efficiency DEA can analyze the situation of competition between DMUs, which is helpful to improve the accuracy of efficiency assessment
Meta-Frontier DEAMeta-Frontier DEA can solve the difference between different decision-making units due to technical or resource problems, and improve the accuracy of evaluation
Table 2. Energy efficiency evaluation of regions.
AuthorSubject of EvaluationModel
He, Sun, Shen, Jian and Yu [27]32 OECD countriesCCR DEA
Bampatsou, et al. [61]15 EU countriesCCR-DEA
Zhang, Cheng, Yuan and Gao [11]23 developing countriesBCC DEA
Zhang and Choi [14]30 provinces in ChinaSBM DEA
Guo, et al. [62]Western of ChinaSBM DEA
Apergis, Aye, Barros, Gupta and Wanke [37]20 OECD countriesSBM-Undesirable DEA
Zhao, Zhang, Zeng, Li, Liu, Qin and Yuan [59]35 Belt and Road countriesNetwork DEA
Jebali, Essid and Khraief [58]24 Mediterranean countriesNetwork DEA
Wu, Yin, Sun, Chu and Liang [12]30 provinces in ChinaNetwork DEA
Wu, et al. [63]30 provinces in ChinaDynamic DEA
Wang, Yu and Zhang [43]29 provinces in ChinaDynamic DEA
Guo, et al. [64]27 countriesDynamic DEA
Wang, Le and Nguyen [60]25 countriesDynamic DEA
Amowine, et al. [65]25 African countriesDynamic DEA
Wang, Deng, Zhang and Zhang [57]Guangdong provinceMeta-Frontier DEA
Zhang, Sun and Huang [5]16 CDM countriesMeta-Frontier DEA
Li and Lin [13]30 provinces in ChinaMeta-Frontier DEA
Yu, Zhou and Yang [53]30 provinces in ChinaMeta-Frontier DEA
Sun, et al. [66]211 cities in ChinaMeta-Frontier DEA
Yu, You, Zhang and Ma [56]277 cities in ChinaMeta-Frontier SBM
Yang and Wei [52]26 cities in ChinaGame Cross-Efficiency DEA
Table 3. Energy efficiency evaluation of industries.
Author & YearSubject of EvaluationModel
Zhou, Xu, Wang and Wu [34]38 Chinese industrial sectorsBCC DEA
Wang, Zeng, Wei and Zhang [15]30 Chinese provincial industrial sectorsBCC DEA
Lei, Li, Zhang, Dai and Fu [68]30 Chinese interprovincial transport sectorsSBM-DEA
Liu and Wang [38]30 Chinese provincial industrial sectorsNetwork DEA
Wu, et al. [70]30 Chinese provincial industrial sectorsNetwork DEA
Makridou, Andriosopoulos, Doumpos and Zopounidis [16]23 Energy-intensive industries in EU countriesDynamic DEA
Lee and Choi [67]7 Korean manufacturing sectorsDynamic DEA
Perez, Gonzalez-Araya and Iriarte [46]20 Chilean manufacturing industryDynamic DEA
Fei and Lin [71]30 Chinese provincial agricultural sectorsMeta-Frontier Malmquist DEA
Feng and Wang [17]30 Chinese provincial industrial sectorsMeta-Frontier Malmquist DEA
Han, et al. [72]42 Chinese industrial sectorsGame Cross-Efficiency DEA
Xie, Gao, Zhang, Pang and Zhang [51]30 Chinese provincial generation sectorsGame Cross-Efficiency DEA

