Article

Absorption of Cu(II) and Zn(II) from Aqueous Solutions onto Biochars Derived from Apple Tree Branches

1
Inner Mongolia Key Laboratory of Soil Quality and Nutrient Resource, College of Grassland, Resources and Environment, Inner Mongolia Agricultural University, Huhhot 010018, China
2
College of Natural Resources & Environment, Northwest A&F University, Yangling 712100, China
3
Laboratory of Grassland Resources, Ministry of Education, Hohhot 010018, China
*
Author to whom correspondence should be addressed.
Energies 2020, 13(13), 3498; https://doi.org/10.3390/en13133498
Submission received: 26 April 2020 / Revised: 26 June 2020 / Accepted: 28 June 2020 / Published: 7 July 2020
(This article belongs to the Special Issue Wastewater Treatment and Resource Recovery)

Abstract

:
The aim of this study was to investigate the adsorption of Cu(II) and Zn(II) onto apple tree branches biochar (BC) produced at 300, 400, 500 and 600 °C (BC300, BC400, BC500, and BC600), respectively. The effect of adsorbent dosage, pH value, contact time, initial concentration of Cu(II) or Zn(II), and temperature on the adsorption process were investigated. The result showed that 5 g BC·L−1 was the optimal dosage to remove Cu(II) and Zn(II) from wastewater and the maximum adsorption efficiency was achieved at a pH of 5.0 for all the BCs when the initial concentration of Cu(II) and Zn(II) were 64 and 65 mg L−1, respectively. Adsorption kinetics and isotherm experiments showed that the pseudo-second order equation and the Langmuir isotherm could best describe the adsorption process, indicating that the adsorption of Cu(II) and Zn(II) onto BCs were monolayer processes and chemisorption was the rate limiting step. The values of ΔG0 for the absorption of Cu(II) and Zn(II) on all BCs were negative, while the values of ΔH0 were positive, suggesting that the absorption was a spontaneous endothermic process. The mechanisms of BC adsorption of metal ions adsorption include surface precipitation, ion exchange, and minor contribution by cation-π interaction. BC500 had highest Cu(II) and Zn(II) adsorption capacity under various conditions (except at pH 2.0). The maximum adsorption capacities of Cu(II) and Zn(II) on BC500 were 11.41 and 10.22 mg·g−1, respectively. Therefore, BC derived from apple tree branches produced at 500 °C can be used as an adsorbent to remove Cu(II) and Zn(II) from wastewater.

1. Introduction

Heavy metal contamination has become a particularly serious environmental issue in recent years [1]. Due to their toxic and non-biodegradable property, heavy metals may cause environmental problems that threaten human health [2,3], such as “itai–itai disease” and “minamata disease” [4]. Copper (Cu) and Zinc (Zn) are the most widespread heavy metals contaminants in the environment because of their wide application in industry [5]. Although low level Cu and Zn are essential micro-nutrients for all known living lifeforms, they are toxic beyond certain limits and can bring about serious environmental and human health problems [6]. Therefore, Cu(II) and Zn(II) must be removed from wastewaters before being discharged into water or used for irrigation [7].
Biochar (BC) is a carbonaceous material produced in an oxygen-free environment [8]. Due to its specific structure and physicochemical properties [9,10,11,12], BC can be used as an effective adsorbent material to adsorb heavy metals from aqueous solutions [13,14]. Much work has been done on the adsorption of Cu(II) and Zn(II) onto BCs derived from plant-residue or agricultural waste such as sesame straw [15], pine sawdust [16], pine and jarrah [17], hickory wood [18], pistachio shells [19], and so on. Meanwhile, the adsorption of Cu(II) and Zn(II) by BCs produced at different pyrolysis conditions were also investigated in recent years [20,21]. Some previous studies showed that the high efficiency sorption of BC for Cu (II) and Zn(II) most likely depended on surface functional groups [7]. However, surface precipitation between CO32− or PO43− originating from BCs with Cu(II) and Zn(II) were also observed by other researchers [22]. The adsorption capacities and mechanisms of BC for Cu(II) and Zn(II) are controlled by its characteristics [23], which are influenced by the type of raw materials and pyrolysis conditions [24,25]. That is to say, the effectiveness of BC in retaining Cu(II) and Zn(II) varied with different BCs.
Due to its unique features of topography and climate, Weibei upland of the Loess Plateau has been recognized as one of the best apple production bases in the world [26]. In recent years, apple tree branches and cutoffs (ATB) have become the main agricultural residues in this region due to the increase in area planted. In order to reduce the occurrence of plant diseases and insect pests, ATB might be burned by the fruit grower in the fall of the year, which may cause a series of environmental problems. Thus, conversion of ATB into BC as a sorbent is of advantage to both resource management and environmental protection [23]. However, to our knowledge, few data are available for the adsorption of Cu(II) and Zn(II) onto ATB BCs produced at different temperatures. Such studies will certainly contribute to the sustainable development of the apple industry.
Therefore, in this study, BCs with ATBs as the feedstock were produced at 300, 400, 500, and 600 °C, respectively. A series of batch adsorption studies were carried out to examine the adsorption behavior of Cu(II) and Zn(II) onto BCs. The aim of this study was to (1) investigate the adsorption capacity of BCs produced at different temperatures; (2) examine the effects of BC dosage, pH value, contact time, initial metal concentration, and temperature on the adsorption process; and (3) evaluate the possible mechanisms responsible for the adsorption.

2. Materials and Methods

2.1. Biochar Preparation

ATBs were collected from apple orchards located on Weibei upland of the Loess Plateau, Northwest China (34°53′N, 108°52′E). BCs were produced in a muffle furnace (Yamato FO410C, Japan) at 300, 400, 500, and 600 °C and the obtained BCs were named as BC300, BC400, BC500, and BC600, respectively. Details related to BC preparation can be found in our previous studies and the main characteristics of BCs are listed in Table 1 [27].

2.2. Batch Adsorption Experiments

2.2.1. Chemical Reagents

The chemical reagents used in this study were of analytical grade (Sinopreagents Co., LTD.), and the solution and reagents were prepared with distilled water. Stock solutions of Cu(II) (3200 mg L−1) and Zn(II) (3250 mg L−1) were prepared by dissolving Cu(NO3)2·3H2O and Zn(NO3)2·6H2O in deionized water, respectively. The stock solutions were further diluted to the required initial concentration. The initial solution pH was also adjusted to the desired value with 0.1 mol L−1 NaOH or HNO3 solution.

2.2.2. Adsorption Experiments

Five separate experiments were conducted to investigate the effect of BC dosage, pH value, contact time, initial metal concentration, and temperature on the adsorption of Cu(II) and Zn(II). The operating conditions of the experiments are listed in Table 2.
Experiment 1: 0.02, 0.6, 0.1, 0.2, and 0.4 g BCs were added to 20 mL 0.01 mol L−1 NaNO3 containing either 64 mg L−1 Cu(II) or 65 mg L−1 Zn(II) (initial solution pH 5.0; contact time 1440 min; reaction temperature 25 °C), respectively.
Experiment 2: The influence of pH on the metal adsorption was investigated by adding 0.1 g of each BC to 20 mL 0.01 mol L−1 NaNO3 containing either 64 mg L−1 Cu(II) or 65 mg L−1 Zn(II). The initial solution pH ranged from 2.0 to 6.0 (contact time 1440 min; reaction temperature 25 °C). Meanwhile, the finial pH values were also measured at the end of the adsorption using a pH meter (PHS-3C). The zeta potentials of BCs at different pH values were also recorded in this study. Briefly, 0.1 g of each BC was added to 20 mL 0.01 mol L−1 NaNO3 solution. The solution pH was adjusted within the range of 2–6 using 0.1 mol L−1 NaOH or HNO3 solution. The suspensions were shaken at 25 °C for 24 h, and then the electrophoresis mobility was measured using Zetasizer Nano ZS90 (UK) [28].
Experiment 3: The kinetic experiments were carried out in 50 mL polyethylene centrifuge tube by adding 0.1 g of each BC to 20 mL 0.01 mol L−1 NaNO3 containing either 64 mg L−1 Cu(II) or 65 mg L−1 Zn(II). The suspensions were shaken at 180 rpm. At regular time intervals (10, 20, and 40 min, 1, 1.5, 2, 3, 4, 6, 8, 10, 12, 16, 20, 24, 28, 32, 40, and 48 h), the samples were analyzed for the adsorption capacity (initial solution pH 5.0; reaction temperature 25 °C).
Experiment 4: A total of 0.1 g of each BC was added to 20 mL 0.01 mol L−1 NaNO3 containing either 6.4, 12.8, 38.4, 64, 128, 256m and 384 mg L−1 Cu(II) or 6.5, 13, 39, 65, 130, 260, and 390 mg L−1 Zn(II) for adsorption isotherm test (initial solution pH 5.0; contact time 1440 min; reaction temperature 25 °C). Meanwhile, the cation (Ca2+ and Mg2+) and anion (CO32− and PO43−) concentrations were also analyzed using the atomic absorption spectrometry method (AAS) (AA-6300C, SHIMADZU, Japan) and ion chromatography (Nexera UHPLC LC-30A, SHIMADZU, Japan) [29], respectively.
Experiment 5: The temperature effect was established by adding 0.1 g of each BC with 20 mL 0.01 mol L−1 NaNO3 containing either 64 mg L−1 Cu(II) or 65 mg L−1 Zn(II) in a temperature-controlled shaker at 25, 30, 35, and 40 °C at 180 rpm for 24 h (initial solution pH 5.0).
Once the adsorption experiments completed, the suspension was centrifuged at 4000 rpm for 5 min and filtered by a 0.22 µm membrane. Controls of Cu(II) and Zn(II) solutions without BCs and controls of Cu(II) and Zn(II) free solutions with BCs were also included. Initial and final concentrations of Cu(II) and Zn(II) were analyzed by AAS. All experiments were conducted in triplicate. The adsorption amount (qt) and the removal efficiency (R%) of Cu(II) or Zn(II) were calculated according to the following equations:
q t = ( C 0 C t ) V m
R % = C 0 C t C 0 × 100 %
where qt (mg·g−1) is the adsorption capacity of Cu(II) or Zn(II) at time t, R% is the removal efficiency represented as percent, m (g) is the weight of BC, V (mL) is the volume of solution, and c0 and ct (mg·L−1) are concentrations of Cu(II) or Zn(II) in solution at initial and time t, respectively. When t is equal to the equilibrium contact time, ct = ce, qt = qe.

2.3. Mathematical Models

2.3.1. Kinetics Test

The kinetics data were analyzed using three models: the pseudo-first order model (PF order), the pseudo-second order model (PS order), and the intraparticle diffusion model (IPD).
The PF order model is described as [30,31]:
q t = q e ( 1 e k 1 t )
where k1 (L·min−1) is the rate constant, qt and qe (mg·g−1) are the amount of Cu(II) or Zn(II) adsorbed at time t and at equilibrium, respectively. The parameters can be obtained by using the nonlinear curve fit method based on Origin software.
The PS order equation is expressed as [32,33]:
q t = k 2 q e 2 t 1 + k 2 q e 2 t
where k2 (g·mg−1·min−1) is the rate constant, qt and qe (mg·g−1) are the amount of Cu(II) or Zn(II) adsorbed at time t and at equilibrium, respectively. The parameters can be obtained by using the nonlinear curve fit method based on Origin software.
Moreover, the initial sorption rate, h (mg·g−1·min−1) can be calculated according to Equation (5) [16].
h = k 2 q e 2
The IPD model can verify whether the transport of ions from the solution to BCs pore is a rate controlling step. The model is expressed as [21]:
q t = k i t 1 / 2 + C
where ki (mg·g−1·min−0.5) is the rate constant, qt (mg·g−1) is the amount of Cu(II) or Zn(II) adsorbed at time t, C is the intercept.

2.3.2. Adsorption Isotherm

Freundlich and Langmuir models were used to fit the sorption isotherms.
The Langmuir isotherm model assumes that the adsorption process is monolayer. The adsorbate particles are adsorbed onto a limited number of adsorption sites. The Langmuir model is expressed as [34,35]:
q e = Q m a x b c e 1 + b c e
where Qmax (mg·g−1) is the maximum adsorption capacity, qe (mg·g−1) is the amount of Cu(II) or Zn(II) adsorbed at equilibrium, b (L·g−1) is the constant associated with the affinity, ce (mg·L−1) is the equilibrium Cu(II) or Zn(II) concentration in solution. The parameters can be obtained by using non-linear curve fit method based on Origin software.
The dimensionless separation parameter RL can be calculated according to Equation (8) [36,37], which can be used to determine the favorability of heavy metal ion sorption onto BCs.
R L = 1 1 + b c 0
where c0 (mg·L−1) is concentration of Cu(II) or Zn(II) in solution at initial time.
The Freundlich isotherm model assumes that the adsorption process is multilayer; there is no limit to the amount of adsorbate that can be adsorbed [38]. The Freundlich isotherm model is given by:
q e = k f c e 1 / n
where kf (mg·g−1) is the adsorption capacity, n is the Freundlich constant associated with the surface heterogeneity, qe (mg·g−1) is the amount of Cu(II) or Zn(II) adsorbed at equilibrium, ce (mg·L−1) is the equilibrium Cu(II) or Zn(II) concentration in solution. The parameters can be obtained by using the nonlinear curve fit method based on Origin software.

2.3.3. Thermodynamics Study

The thermodynamics of the adsorption processes can be expressed in the following equations:
K e = q e c e
K e = exp ( Δ S 0 R Δ H 0 R T )
Δ G 0 = Δ H 0 T Δ S 0
where qe (mg·g−1) is the amount of Cu(II) or Zn(II) adsorbed at equilibrium, ce (mg·L−1) is the equilibrium Cu(II) or Zn(II) concentration in solution, Ke (L·g−1) is the adsorption equilibrium constant, T (K) is the absolute temperature, and R (J·mol−1·K−1) is the gas constant (8.314). The values of Δ H 0 (KJ·mol−1) and Δ S 0 (J·mol−1·K−1) can be calculated using the nonlinear curve fit method based on Origin software. The values of Δ G 0 (KJ·mol−1) can be obtained from the corresponding values of Δ H 0 and Δ S 0 [39].

2.4. Statistical Analysis

The data were tested by analysis of variance (ANOVA) using SAS (version 8.0). The least significant difference test was applied to assess the differences among the means at the 5% level.

3. Results and Discussion

3.1. Influence of BC Dosage

The amount of BC directly affects the removal efficiency of Cu(II) and Zn(II), since it determines the capacity of BC at a given initial concentration [28]. The results of the experiments with varying BCs dose are presented in Figure 1. The Cu(II) and Zn(II) adsorption efficiency of BCs decreased sharply with increasing the dose of BCs. For Cu(II), the adsorption efficiency of BC300, BC400, BC500, and BC600 sharply decreased from 10.13, 17.75, 27.20, and 23.35 mg·g−1 at 1 g BC·L−1 to 2.90, 2.97, 3.14, and 3.08 mg·g−1 at 20 g BC·L−1, respectively (Figure 1a). For Zn(II), the adsorption efficiency of BC300, BC400, BC500, and BC600 significantly decreased from 7.10, 13.20, 23.84, and 20.90 mg·g−1 at 1 g BC·L−1 to 2.80, 2.84, 3.01, and 2.98 mg·g−1 at 20 g BC·L−1, respectively (Figure 1b). These results were in agreement with previous similar studies on Cu(II) and Zn(II) adsorption [3,4]. This may be due to the unsaturated adsorption sites caused by the high adsorbent concentrations during the adsorption reaction [4]. However, with increasing BC dose, the Cu(II) and Zn(II) removal efficiency (%) improved significantly. For example, at 1 g BC·L−1, the removal of Cu(II) and Zn(II) were 15.82% and 10.93%, 27.74% and 20.30%, 42.49% and 36.67%, 36.49% and 32.16% for BC300, BC400, BC500, and BC600, respectively, while at 20 g BC·L−1 they were 90.66% and 86.00%, 92.74% and 87.49%, 98.03% and 92.73%, 96.30% and 91.74%. In general, a larger dosage can provide more adsorption sites, thereby resulting in a higher removal percentage of heavy metal [3]. Thus, the increase in the metal removal may be due to the increase of total adsorption sites with increasing adsorbent concentration. It was also observed that BC500 had the highest Cu(II) and Zn(II) adsorption efficiency and removal efficiency (%) under the same dose of BC. Moreover, the higher adsorption efficiency and removal efficiency (%) for Cu(II) than for Zn(II) were observed at the same time.
In this study, when the BC concentration was 5 g BC·L−1, both the adsorption efficiency and the percent removal of Cu(II) and Zn(II) in the presence of NaNO3 reached relatively high values. Chen et al. [4] also suggested that a multi-stage adsorption process could occur during the adsorption process at this dosage. Therefore, the following experiments were conducted at the dosage of 5 g·L−1.

3.2. Influence of Solution pH

The pH value of solution is a critical parameter influencing heavy metals adsorption [21]. This study was carried out at a pH range 2–6, since Cu(II) and Zn(II) hydroxides start to precipitate at a higher pH [3]. The resulting data showed that the adsorption of Cu(II) and Zn(II) by all the BCs significantly increased with increasing pH until they plateaued at pH 5.0 and decrease in adsorption capacities was observed when the pH was increased further to 6.0 (Figure 2). This was in agreement with the results in previous studies [17,39]. For the BCs obtained at four different temperatures, the adsorption capacities of Cu(II) and Zn(II) followed the order: BC500 > BC600 > BC400 > BC300 when the initial solution had pH values in the range 3.0–6.0. While, at the initial pH of 2.0, BC600 had the highest adsorption capacities of Cu(II) and Zn(II). Interestingly, the adsorption of Cu(II) onto BCs were higher than Zn(II) under various pH conditions.
In general, the pH value of the solution not only affects the surface properties of the adsorbent, but also the ionization degree and morphology of the metal ions in the solution [21]. The high concentration of H+ ions compete with the metal ions for the adsorption positions on the BCs at a lower pH [3]. As the solution pH increased, the competitive effect of H+ ions would decrease, and more Cu(II) and Zn(II) could react with BCs. BCs also could adsorb Cu(II) and Zn(II) through electrostatic attraction due to the negative charge on the surface [11]. Our result indicated that the zeta potentials of BCs were negative, and they became more negative with increasing the pH of solution (Figure 3), indicating that the BCs possessed variable negative charge on their surface. This may be one of the reasons for the increase of Cu(II) and Zn(II) adsorption with increasing solution pH. In addition, the deprotonation reaction of the functional groups present on the BCs surface becomes vigorous at higher solution pH [11]. Thus, the protons in these functional groups exchange with Cu(II) and Zn(II) in the solution [7], which was consistent with the changes of solution pH data (ΔpH = Cu(II) and Zn(II) free solutions pH—the final solution pH) (Figure 4). It was found that the changes of pH data (ΔpH) followed the order: BC300 > BC400 > BC500 > BC600, which was consistent with their surface functional groups (Table 1). While, at higher pH value (pH = 6), decreases in adsorption capacities were observed for all BCs. This phenomenon might be due to the formation of soluble hydroxyl complexes in the solution [3,40]. Therefore, the adsorption efficiency for Cu(II) and Zn(II) were highest when the pH value was 5.0 and the other adsorption experiments were performed at this pH value.

3.3. Influence of Contact Time and Adsorption Kinetics

As seen earlier, Cu(II) and Zn(II) adsorption occurred rapidly within the first 6 h, when about 24.94–73.56% of Cu(II) and 20.49–59.57% of Zn(II) were removed, respectively (Figure 5). However, the subsequent adsorption was relatively slow. Saturation of adsorption was reached at 1440 min. The two-phase adsorption is a common phenomenon during the adsorption process, which can be explained as a large number of adsorption sites exist on the surface of BC and the adsorption sites become gradually saturated over time [16].
Pseudo-first-order (PF order) and pseudo-second-order (PS order) models were used to explain the results of the adsorption experiment (Table 3). The results indicated that the adsorption kinetics of Cu(II) and Zn(II) onto BCs were best described by PS order model (Table 3). This can be explained by the correlation coefficient values, which ranged from 0.99 to 1.00. In addition, this is also confirmed by the fact that the values of qe and the experimental values of qe,exp were very close. This result suggested that chemisorption was the rate-limiting mechanism for the adsorption of Cu(II) and Zn(II) onto BCs. This was in agreement with previous studies [23,41]. It was also found that the k2 values in the PS order model increased with an increase in pyrolysis temperature for both the adsorption process of Cu(II) and Zn(II). This was probably due to the higher surface area of BC produced at higher temperatures, which could facilitate faster mass transfer of Cu(II) and Zn(II) onto the surface of BC and provide more opportunities for metal-adsorption site [42] (Table 1). This result was well supported by the increasing initial adsorption rate (h) of Cu(II) and Zn(II) with the pyrolysis temperature. The adsorption process was also different for Cu(II) and Zn(II). In this study, higher k2 values as well as the initial adsorption rate (h) for Cu(II) than for Zn(II) were observed. The differences between Cu(II) and Zn(II) may be explained by differences in their chemical characteristics.
However, we found highest Cu(II) and Zn(II) adsorption by BC500 (9.86 and 9.54 mg·g−1) in spite of relatively lower surface area in comparison to BC600. This indicated that other mechanisms might play important roles in the specific adsorption capacity of Cu(II) and Zn(II) onto BC. The IPD process was also evaluated in this study to determine whether the transport of Cu(II) or Zn(II) ions from the solution into the BCs pores was the rate controlling step [21]. The results indicated that the straight lines did not pass through the origin. Thus, the IPD process was not the rate limiting step. However, it should be noted that the highest intercept (C) values were observed in the Cu(II) and Zn(II) adsorption by BC500. Kołodyńska et al. [21] suggested that the intercept (C) value gives the concept of boundary layer thickness, namely, the larger C value resulting in a greater boundary layer effect. Therefore, the highest Cu(II) and Zn(II) adsorption by BC500 might have contributed to the most evident boundary layer effect.

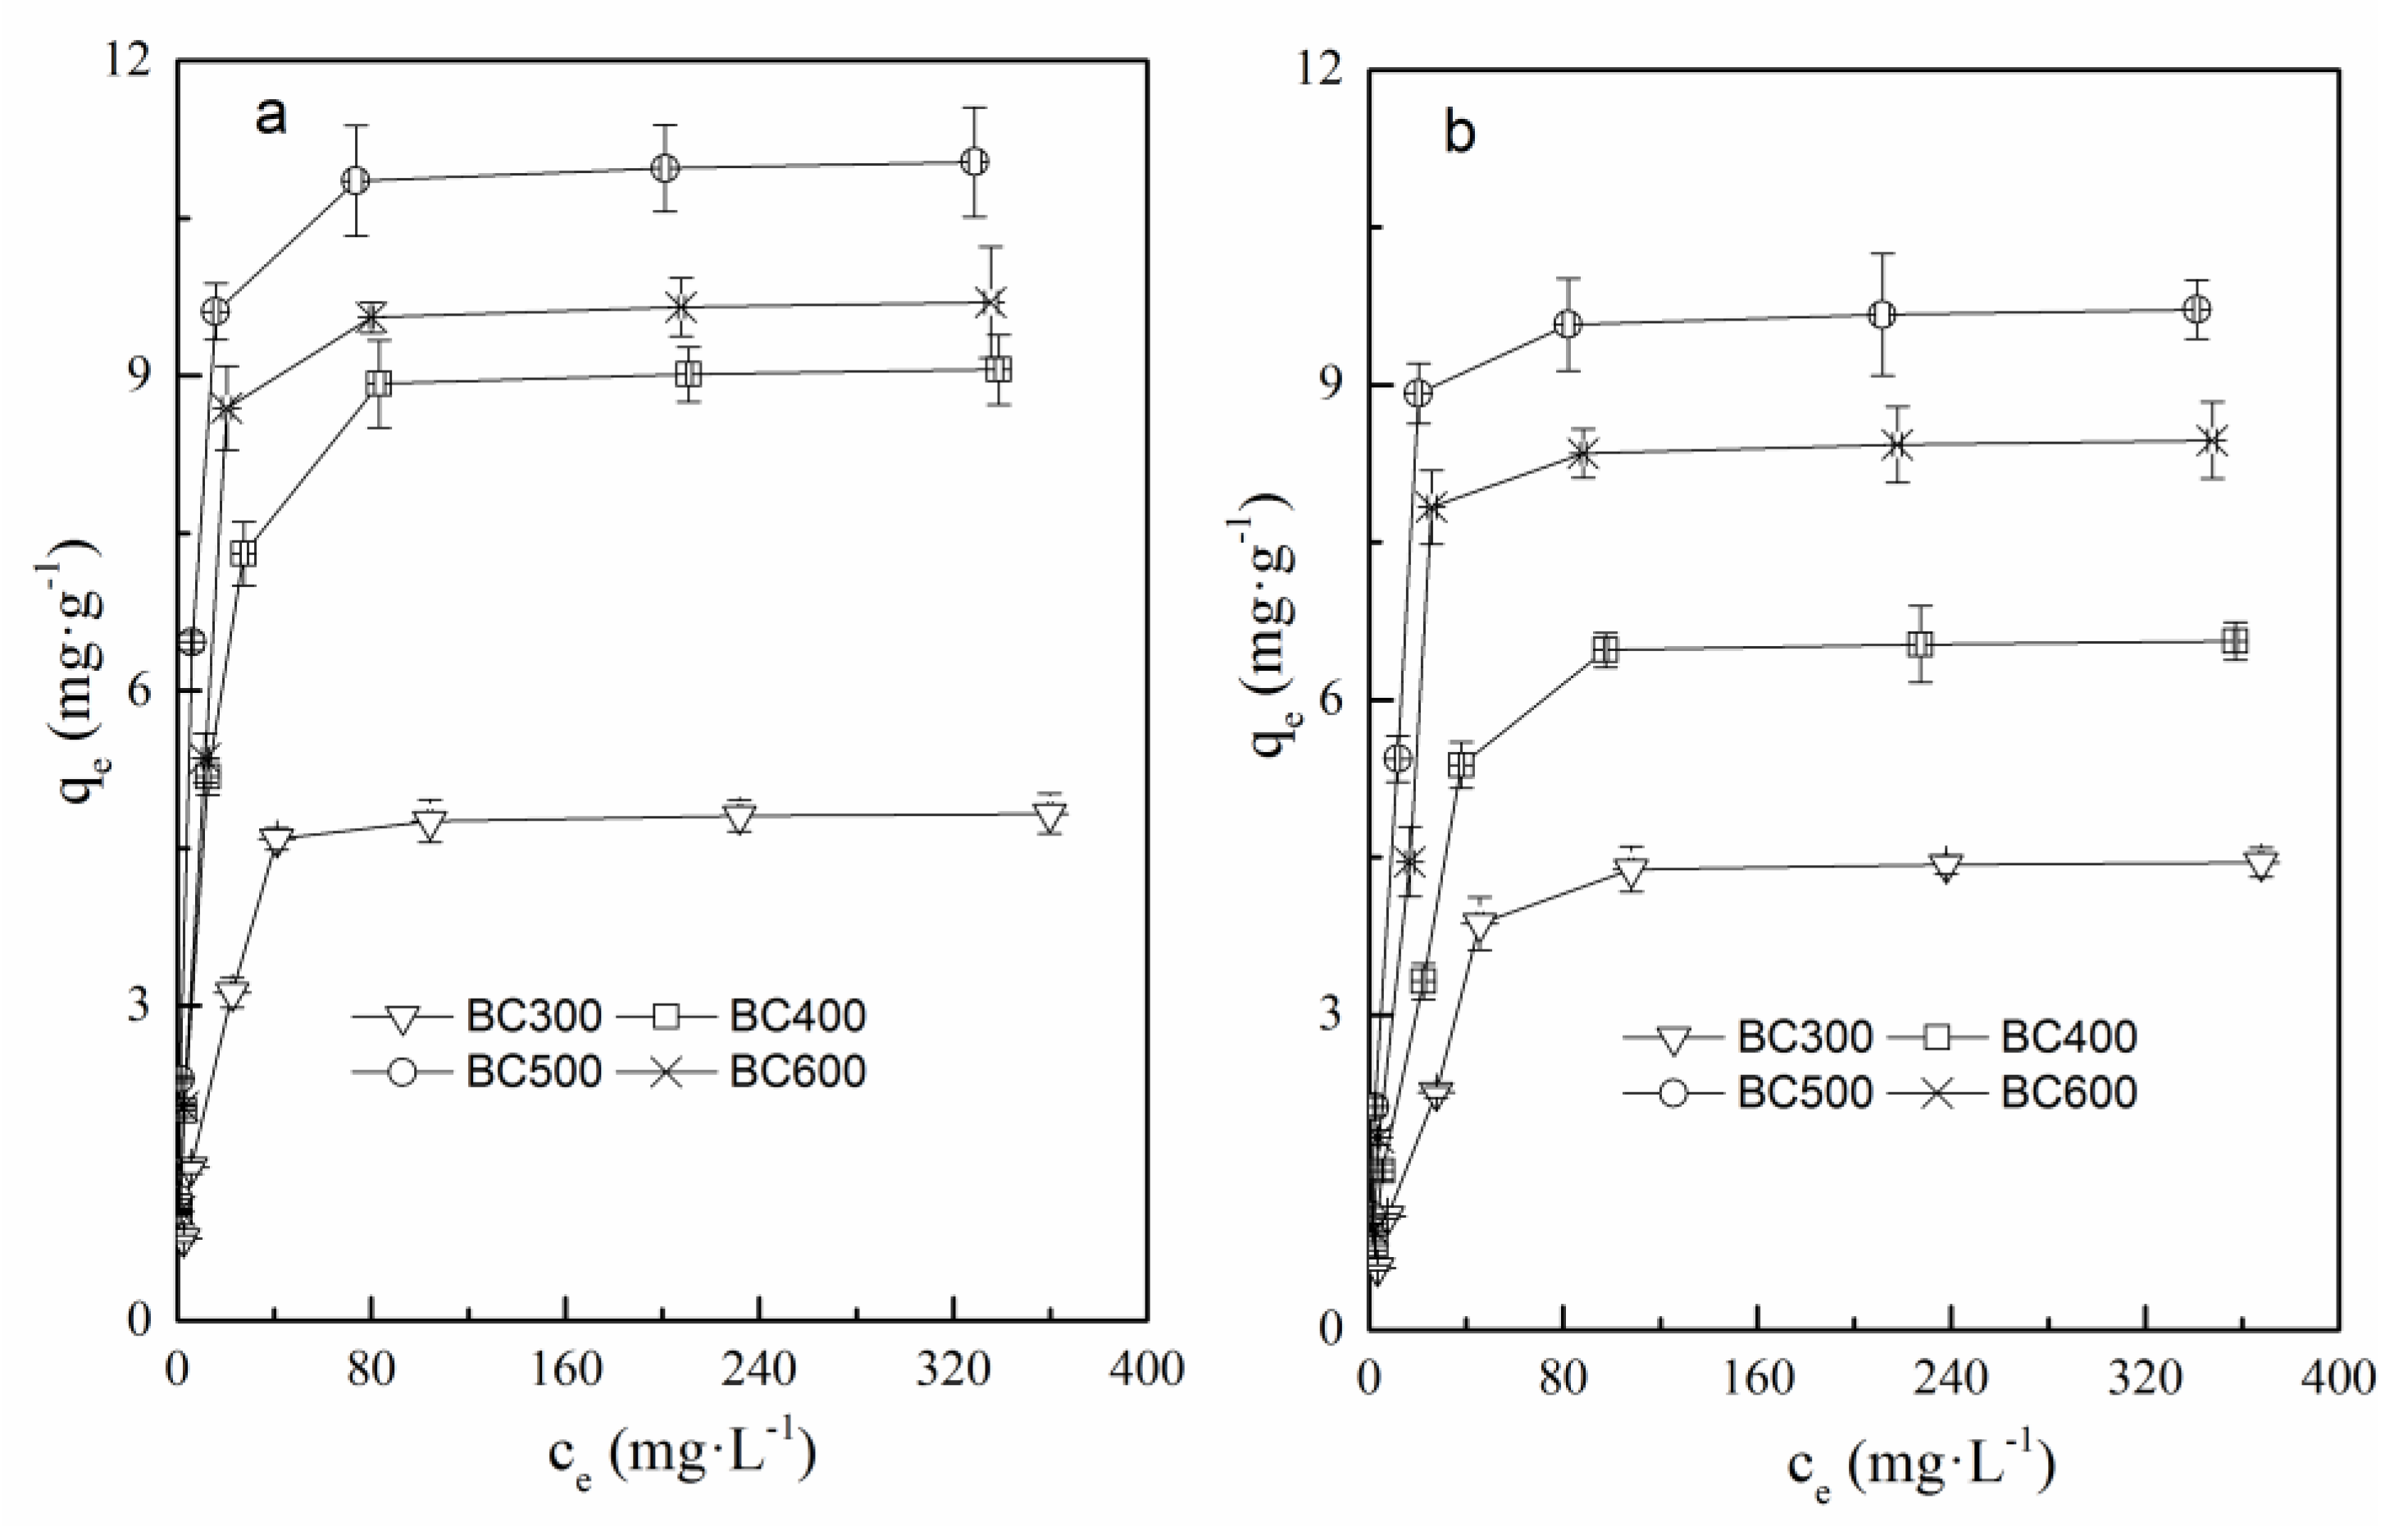
3.4. Adsorption Isotherm Studies

The results of adsorption isotherms of Cu(II) and Zn(II) on BCs are presented in Figure 6. The increasing initial Cu(II) and Zn(II) concentrations increased the adsorption capacities of Cu(II) and Zn(II) onto BCs. This was due to an increase in the mass transfer driving force, which is the concentration gradient [3]. For the BCs obtained at four different temperatures, the adsorption capacities of Cu(II) and Zn(II) followed the order: BC500 > BC600 > BC400 > BC300 under the same heavy metal concentration. In addition, decreases in the Cu(II) and Zn(II) removal (%) were observed as the initial Cu(II) and Zn(II) in the solution increased (Figure 7). Similar results were also observed by other researchers [43,44]. This was probably due to the saturation of the adsorption sites in the solution. Moreover, the results also showed that anion (CO32− and PO43−) and cation (Ca2+ and Mg2+) concentrations were functions of initial concentrations of Cu(II) or Zn(II). The increasing initial concentrations of Cu(II) and Zn(II) decreased the concentrations of anion (CO32− and PO43−) (Figure 8), while increasing the cation (Ca2+ and Mg2+) concentrations (Figure 9), especially when the initial concentrations of Cu(II) and Zn(II) increased from 6.4 to 64 mg L−1 and 6.5 to 65 mg L−1, respectively. This observation indicated that surface precipitation and ion exchange were involved in the sorption of Cu(II) and Zn(II) by BCs.
The adsorption constants and correlation coefficients for Cu(II) and Zn(II) onto BCs are listed in Table 4, which were obtained from Langmuir and Freundlich isotherms models. The experimental data were well described by the Langmuir model with R2 values ranging from 0.96 to 0.99 and 0.95 to 0.97 for Cu(II) and Zn(II), respectively. The result indicated that the adsorption of Cu(II) and Zn(II) onto BCs were monolayer processes with limited identical sites, which was in agreement with previous studies [21]. The maximum absorption capacities (qm) of Cu(II) and Zn(II) on BCs ranged from 5.20 to 11.41 mg·g−1 and 4.98 to 10.22 mg·g−1, respectively, which were similar to BCs derived from hardwood [5]. It was interesting that BC500 showed the highest qm of Cu(II) and Zn(II) (11.41 and 10.22 mg g−1, respectively). The reason might be contributed to the highest affinity of BC500 with the highest parameter b (0.23 and 0.13 L·mg−1, respectively). Chen et al. [39] also suggested that the higher the parameter b was, the higher the qm. Moreover, on the basis of qm and parameter b values, the BCs showed higher sorption capacity for Cu(II) than for Zn(II). In addition, BC500 showed the lowest RL values for both metals, and the RL values of Cu(II) being lower than Zn(II) for all BCs might also explain the observed differences. In general, RL was used to determine the favorability of heavy metal ion sorption onto BCs [36]. The RL values ranged from 0.01 to 0.66 and 0.02 to 0.79 for Cu(II) and Zn(II), respectively (Table 4), indicating that the sorption of Cu(II) and Zn(II) onto BCs was a favorable process.

3.5. Influence of Temperature and Thermodynamics Study

The absorption of Cu(II) and Zn(II) on BCs were also investigated as a function of temperature. The Cu(II) and Zn(II) absorption capacities of the four BCs increased with increasing reaction temperature (Figure 10), indicating that absorption was an endothermic process. Similar results were also observed by other researchers [45]. This might be due to sufficient energy provided by the increased temperature, which allowed overcoming the diffuse double layer [46].
To understand the mechanism involved the absorption process, thermodynamic parameters were calculated and provided in Table 5. In this study, the values of ΔG0 for the absorption of Cu(II) and Zn(II) on all BCs were negative, indicating that absorption might occur spontaneously [21]. This was in agreement with previous research [47]. In addition, the decrease in ΔG0 with solution temperature suggested more efficient absorption at higher solution temperatures. In contrast, the values of ΔH0 were positive, suggesting that it is an endothermic reaction. Banerjee et al. suggested that the endothermic reaction might be contributing to the formation of chemical bonds between adsorbate and adsorbent [48]. Thus, it could be stated that chemisorption was the dominant mechanism in the absorption process. Furthermore, the positive ΔS0 values indicated the increased randomness at the adsorbent–solution interface during the fixation of Cu(II) and Zn(II) on the absorption sites. This was also observed by Meng et al. [28].
It should be noted that BC500 had the lowest values of ΔG0 for both the metals at all temperatures. This indicated that BC500 had the most efficient absorption among the four BCs, which was reflected by the highest values of ΔH0 and ΔS0. Additionally, the values of ΔG0 for Cu(II) were lower than for Zn(II). Thus, higher absorption capacities of Cu(II) onto the four BCs as well as the higher values of ΔH0 and ΔS0 for Cu(II) were observed.

3.6. Mechanism of Absorption

The mechanism of metal ions sorption by the BCs is complex. The possible absorption mechanisms usually include electrostatic attraction, ion exchange, complexation, surface precipitation, and so on [16,23]. In this study, negative relationships were observed between surface function groups and Cu(II) and Zn(II) absorption capacities (Table 1), indicating that absorption through complexation with surface functional groups contribute not too much for the sorption of Cu(II) and Zn(II) by BCs derived from apple tree branches.
Previous studies have demonstrated that surface precipitation between CO32− or PO43− originating from BCs with heavy metals played important roles in the absorption capacity of BCs [49,50]. Thus, in order to evaluate the contribution of surface precipitation formed near the BCs surface, the amounts of soluble CO32− and PO43− were monitored during the absorption process (Figure 8). The changes of soluble CO32− and PO43−, regardless of the metal, followed the order: BC500 > BC600 > BC400 > BC300, which was in accordance with the absorption capacities of BCs. Hence, soluble CO32− and PO43− played important roles in the sorption of Cu(II) and Zn(II) by BCs. A previous study [22] also revealed that the sorption of Cu(II) and Zn(II) by dairy manure-derived BC was mainly attributed to the formation of Cu(II) and Zn(II) phosphate and carbonate precipitates near the surface of BC. It also should be noted that when the absorption efficiency became larger, the Ca2+ and Mg2+ concentrations were higher. Moreover, the amounts of Ca2+ and Mg2+ exchanged by Cu(II) or Zn(II) followed the order: BC300 > BC400 > BC500 > BC600 during the absorption process (Figure 9), which was in agreement with their cation exchange capacity (Table 1). This suggests that ion exchange between Cu(II) or Zn(II) and the cations is one of the important mechanisms for the sorption of Cu(II) and Zn(II) by BCs. In addition, the higher absorption efficiency also resulted in lower pH values after equilibrium (Figure 4), which provided more evidence that ion exchange between ionizable protons or cations at the surface involved in the sorption of Cu(II) and Zn(II) by the BCs, similar results were also observed by Jiang et al. [17].
BC carry a lot of negative charges on surface (Figure 3). Thus, the possibility of electrostatic attraction cannot be excluded during the absorption process. The zeta potential values of BCs increased with the pyrolysis temperature (Figure 3), indicating that BCs produced at lower temperature had more negative charges on their surface compared with those produced at higher temperatures. However, in this study, BC600 had the highest absorption capacities of Cu(II) and Zn(II) at the initial pH of 2.0. This was mainly attributable to higher pyrolysis temperatures increasing the aromaticity along with more delocalized π electrons, which could induce more Cu(II) and Zn(II) sorbed to the surface of BC [16]. This result was well supported by the lower H/C and O/C ratios of BC produced at a higher pyrolysis temperature (Table 1). In addition, the cation–π interaction may also explain the fact that k2 values as well as initial absorption rate (h) increased with increasing pyrolysis temperatures regardless of the metals.
Based on the results of this study, the mechanism of sorption of Cu(II) and Zn(II) by BCs derived from apple tree branches can be described by the following equations:
(1) Surface Precipitation
3M2+ + 2PO43−→M3(PO4)2
M2+ + CO32−→MCO3↓ + H2O
(2) Ion Exchange
M2+ + BCm-Ca→BCm-M + Ca2+
M2+ + BCm-Mg→BCm-M + Mg2+
M2+ + BCm-H+H2O→BCm-M+ + H3O+
(3) Cation–π Interaction
M2+ + BCm: →BCm:M2+
where M represents Cu and Zn, BCm represents the BC matrix.
It was interesting that higher Cu(II) absorption capacity was observed under all of the different systems. Similar results were also observed by other researchers [15,51]. This is mainly due to the differences in chemical properties of the two metals, which mainly affect the affinity of metals for sorption sites [15]. A possible explanation for this result is that the electronegativity constant is higher for Cu(II) (1.90) than Zn(II) (1.65), which is responsible for electrostatic attraction [51]. However, in this study, chemisorption on the surface of BCs was the dominant mechanism. Thus, the higher absorption capacity of Cu(II) by BCs is mainly affected by other factors, such as first hydrolysis constant and radius of the ion [15]. Cu(II) has a lower pKH (8.0) (negative log of hydrolysis constant) than that of Zn(II) (9.0). In addition, the radius of Cu(II) (0.72 Å) is lower than Zn(II) (0.74 Å) [37]. These factors ensure that Cu(II) is more easily adsorbed through sorption reactions than Zn(II) [51]. This trend was confirmed by the results of the higher parameter b of Cu(II) than Zn(II) (Table 4)

4. Conclusions

The ability of BCs produced at four different temperatures to adsorb Cu(II) and Zn(II) from aqueous solution were studied. With increasing BC dose, the Cu(II) and Zn(II) absorption efficiency of BCs decreased sharply, while the Cu(II) and Zn(II) removal efficiency (%) improved significantly. BC500 had the highest absorption efficiency and removal efficiency for all the metals. The highest absorption efficiency was achieved at a pH of 5.0 for all the BCs. Meanwhile, for the tested BCs, the absorption capacities of Cu(II) and Zn(II) followed the order: BC500 > BC600 > BC400 > BC300 under same pH conditions (except at a pH of 2.0). The kinetic experiments indicated that the sorption of Cu(II) and Zn(II) occurred rapidly within the first 6 h, and the required time to reach equilibrium was about 1440 min. Moreover, the absorption rate increased with increasing pyrolysis temperature for both the absorption process of Cu(II) and Zn(II), which was well supported by the parameter k2 and initial absorption rate (h). The adsorption kinetics of Cu(II) and Zn(II) onto BCs were best described by PS order model, indicating that chemisorption was the rate-limiting mechanism for the adsorption of Cu(II) and Zn(II) onto BCs. The absorption capacities of Cu(II) and Zn(II) onto BCs were also increased with the increase of the initial metal concentrations. BC500 had the highest absorption capacities of Cu(II) and Zn(II) under various initial metal concentrations. The experimental data were well fitted by the Langmuir isotherm model. This result suggested that the absorption of Cu(II) and Zn(II) onto BCs were monolayer processes. The Cu(II) and Zn(II) absorption capacities of the all BCs clearly increased with temperature. BC500 had the highest absorption capacities regardless of the metals. The values of ΔG0 for the absorption of Cu(II) and Zn(II) on all BCs were negative, while the values of ΔH0 were positive, suggesting that the absorption was a spontaneous endothermic process. It was interesting that the absorption capacity for Cu(II) onto all the BCs were higher than for Zn(II) under all of the tested systems, which could be explained by the differences in chemical properties of the two metals.
Therefore, the mechanism of Cu(II) and Zn(II) sorption by the BC samples include surface precipitation, ion exchange, and minor contribution by cation–π interaction. This could explain the fact that BC500 had highest Cu(II) and Zn(II) absorption capacity under various conditions (except at pH 2.0). Thus, BC derived from apple tree branches at 500 °C is an optimum adsorbent for the removal of Cu(II) and Zn(II) from wastewater. However, BC derived from ATB is poor in absorption capacity. Recently, in order to improve the absorption performance of heavy metals onto BC, oxidation, chemical graft, as well as acid or alkali modification have been used to modify BC. The activated BCs show much greater ability to remove heavy metal from aqueous solution than the pristine BCs. Therefore, more research is needed on the modification of BC derived from ATB when the BC products are used in full scale systems.

Author Contributions

Conceptualization, S.Z. and X.W.; methodology, S.Z. and N.T.; validation, S.Z.; N.T. and X.W.; investigation, S.Z. and N.T.; data curation, N.T.; writing—original draft preparation, S.Z. and N.T.; writing—review and editing, X.W.; funding acquisition, X.W. All authors have read and agreed to the published version of the manuscript.

Funding

This research was funded by the Scientific Research Foundation for Talented Scholars, Inner Mongolia Agricultural University, China (NDYB2017−2), the National Natural Science Foundation of China (41907082) and the Special Fund for Agro-scientific Research in the Public Interest of the Ministry of Agriculture, China (201503116).

Conflicts of Interest

The authors declare no conflict of interest.

References

  1. Li, M.; Liu, Q.; Guo, L.; Zhang, Y.; Lou, Z.; Wang, Y.; Qian, G. Cu(II) removal from aqueous solution by Spartina alterniflora derived biochar. Bioresour. Technol. 2013, 141, 83–88. [Google Scholar] [CrossRef] [PubMed]
  2. Hadjittofi, L.; Prodromou, M.; Pashalidis, I. Activated biochar derived from cactus fibres--preparation, characterization and application on Cu(II) removal from aqueous solutions. Bioresour. Technol. 2014, 159, 460–464. [Google Scholar] [CrossRef] [PubMed]
  3. Pellera, F.M.; Giannis, A.; Kalderis, D.; Anastasiadou, K.; Stegmann, R.; Wang, J.Y.; Gidarakos, E. Absorption of Cu(II) ions from aqueous solutions on biochars prepared from agricultural by-products. J. Environ. Manag. 2012, 96, 35–42. [Google Scholar] [CrossRef]
  4. Chen, T.; Zhou, Z.; Han, R.; Meng, R.; Wang, H.; Lu, W. Adsorption of cadmium by biochar derived from municipal sewage sludge: Impact factors and adsorption mechanism. Chemosphere 2015, 134, 286–293. [Google Scholar] [CrossRef]
  5. Han, Y.; Boateng, A.A.; Qi, P.X.; Lima, I.M.; Chang, J. Heavy metal and phenol adsorptive properties of biochars from pyrolyzed switchgrass and woody biomass in correlation with surface properties. J. Environ. Manag. 2013, 118, 196–204. [Google Scholar] [CrossRef] [PubMed]
  6. Tong, X.J.; Li, J.Y.; Yuan, J.H.; Xu, R.K. Adsorption of Cu(II) by biochars generated from three crop straws. Chem. Eng. J. 2011, 172, 828–834. [Google Scholar] [CrossRef]
  7. Jin, H.; Hanif, M.U.; Capared, S.; Chang, Z.; Huang, H.; Ai, Y. Copper(II) removal potential from aqueous solution by pyrolysis biochar derived from anaerobically digested algae-dairy-manure and effect of KOH activation. J. Environ. Chem. Eng. 2016, 4, 365–372. [Google Scholar] [CrossRef]
  8. Zhao, R.; Coles, N.; Wu, J. Carbon mineralization following additions of fresh and aged biochar to an infertile soil. Catena 2015, 125, 183–189. [Google Scholar] [CrossRef]
  9. Suliman, W.; Harsh, J.B.; Abu-Lail, N.I.; Fortuna, A.M.; Dallmeyer, I.; Garcia-Perez, M. Influence of feedstock source and pyrolysis temperature on biochar bulk and surface properties. Biomass Bioenergy 2016, 84, 37–48. [Google Scholar] [CrossRef]
  10. Hu, Y.; Oduro, I.N.; Huang, Y.; Fang, Y. Structural characterization and pyrolysis behavior of holocellulose obtained from lignin-first biorefinery. J. Anal. Appl. Pyrolysis 2016, 120, 416–422. [Google Scholar] [CrossRef]
  11. Kim, B.S.; Lee, H.W.; Park, S.H.; Baek, K.; Jeon, J.K.; Cho, H.J.; Jung, S.C.; Kim, S.C.; Park, Y.K. Removal of Cu2+ by biochars derived from green macroalgae. Environ. Sci. Pollut. Res. 2016, 23, 985–994. [Google Scholar] [CrossRef] [PubMed]
  12. Melo, L.C.A.; Puga, A.P.; Coscione, A.R.; Beesley, L.; Abreu, C.A.; Camargo, O.A. Sorption and desorption of cadmium and zinc in two tropical soils amended with sugarcane-straw-derived biochar. J. Soils Sediments 2016, 16, 226–234. [Google Scholar] [CrossRef]
  13. Boni, M.R.; Chiavola, A.; Marzeddu, S. Application of Biochar to the Remediation of Pb-Contaminated Solutions. Sustainability 2018, 10, 4440. [Google Scholar] [CrossRef] [Green Version]
  14. Mireles, S.; Parsons, J.; Trad, T.; Cheng, C.L.; Kang, J. Lead removal from aqueous solutions using biochars derived from corn stover, orange peel, and pistachio shell. Int. J. Environ. Sci. Technol. 2019, 16, 5817–5826. [Google Scholar] [CrossRef]
  15. Park, J.H.; Ok, Y.S.; Kim, S.H.; Cho, J.S.; Heo, J.S.; Delaune, R.D.; Seo, D.C. Competitive adsorption of heavy metals onto sesame straw biochar in aqueous solutions. Chemosphere 2016, 142, 77–83. [Google Scholar] [CrossRef] [PubMed]
  16. Lou, K.Y.; Rajapaksha, A.U.; Ok, Y.S.; Chang, S.X. Sorption of copper(II) from synthetic oil sands process-affected water (OSPW) by pine sawdust biochars: Effects of pyrolysis temperature and steam activation. J. Soils Sediments 2016, 16, 2081–2089. [Google Scholar] [CrossRef]
  17. Jiang, S.; Huang, L.; Nguyen, T.A.; Ok, Y.S.; Rudolph, V.; Yang, H.; Zhang, D. Copper and zinc adsorption by softwood and hardwood biochars under elevated sulphate-induced salinity and acidic pH conditions. Chemosphere 2016, 142, 64–71. [Google Scholar] [CrossRef]
  18. Ding, Z.H.; Hu, X.; Wan, Y.S.; Wang, S.S.; Gao, B. Removal of lead, copper, cadmium, zinc, and nickel from aqueous solutions by alkali-modified biochar: Batch and column tests. J. Ind. Eng. Chem. 2016, 33, 239–245. [Google Scholar] [CrossRef] [Green Version]
  19. Komnitsas, K.; Zaharaki, D.; Pyliotis, I.; Vamvuka, D.; Bartzas, G. Assessment of Pistachio Shell Biochar Quality and Its Potential for Adsorption of Heavy Metals. Waste Biomass Valorization 2015, 6, 805–816. [Google Scholar] [CrossRef]
  20. Chen, T.; Zhang, Y.; Wang, H.; Lu, W.; Zhou, Z.; Zhang, Y.; Ren, L. Influence of pyrolysis temperature on characteristics and heavy metal adsorptive performance of biochar derived from municipal sewage sludge. Bioresour. Technol. 2014, 164, 47–54. [Google Scholar] [CrossRef]
  21. Kołodyńska, D.; Wnętrzak, R.; Leahy, J.J.; Hayes, M.H.B.; Kwapiński, W.; Hubicki, Z. Kinetic and adsorptive characterization of biochar in metal ions removal. Chem. Eng. J. 2012, 197, 295–305. [Google Scholar] [CrossRef]
  22. Xu, X.; Cao, X.; Zhao, L.; Wang, H.; Yu, H.; Gao, B. Removal of Cu, Zn, and Cd from aqueous solutions by the dairy manure-derived biochar. Environ. Sci. Pollut. Res. Int. 2013, 20, 358–368. [Google Scholar] [CrossRef]
  23. Tan, X.; Liu, Y.; Zeng, G.; Wang, X.; Hu, X.; Gu, Y.; Yang, Z. Application of biochar for the removal of pollutants from aqueous solutions. Chemosphere 2015, 125, 70–85. [Google Scholar] [CrossRef] [PubMed]
  24. Zhang, J.; Liu, J.; Liu, R. Effects of pyrolysis temperature and heating time on biochar obtained from the pyrolysis of straw and lignosulfonate. Bioresour. Technol. 2015, 176, 288–291. [Google Scholar] [CrossRef] [PubMed]
  25. Claoston, N.; Samsuri, A.W.; Ahmad Husni, M.H.; Mohd Amran, M.S. Effects of pyrolysis temperature on the physicochemical properties of empty fruit bunch and rice husk biochars. Waste management & research: The journal of the International Solid Wastes and Public Cleansing Association. ISWA 2014, 32, 331–339. [Google Scholar] [CrossRef]
  26. Fang, K.; Li, H.; Wang, Z.; Du, Y.; Wang, J. Comparative analysis on spatial variability of soil moisture under different land use types in orchard. Sci. Hortic. 2016, 207, 65–72. [Google Scholar] [CrossRef]
  27. Zhao, S.X.; Ta, N.; Wang, X.D. Effect of Temperature on the Structural and Physicochemical Properties of Biochar with Apple Tree Branches as Feedstock Material. Energies 2017, 10, 1293. [Google Scholar] [CrossRef] [Green Version]
  28. Meng, J.; Feng, X.; Dai, Z.; Liu, X.; Wu, J.; Xu, J. Adsorption characteristics of Cu(II) from aqueous solution onto biochar derived from swine manure. Environ. Sci. Pollut. Res. Int. 2014, 21, 7035–7046. [Google Scholar] [CrossRef]
  29. Cao, X.; Harris, W. Properties of dairy-manure-derived biochar pertinent to its potential use in remediation. Bioresour. Technol. 2010, 101, 5222–5228. [Google Scholar] [CrossRef]
  30. Kołodyńska, D.; Krukowska, J.; Thomas, P. Comparison of Sorption and Desorption Studies of Heavy Metal Ions from Biochar and Commercial Active Carbon. Chem. Eng. J. 2016, 307, 353–363. [Google Scholar] [CrossRef]
  31. Ho, Y.S.; Mckay, G. Sorption of Dye from Aqueous Solution by Peat. Chem. Eng. J. 1998, 70, 115–124. [Google Scholar] [CrossRef]
  32. Cui, X.; Fang, S.; Yao, Y.; Li, T.; Ni, Q.; Yang, X.; He, Z. Potential mechanisms of cadmium removal from aqueous solution by Canna indica derived biochar. Sci. Total Environ. 2016, 562, 517–525. [Google Scholar] [CrossRef] [PubMed]
  33. Weber, W.J.; Morris, J.C. Kinetics of Adsorption on Carbon from Solution. J. Sanit. Eng. Div. 1963, 89, 31–60. [Google Scholar]
  34. Langmuir, I. The constitution and fundamental properties of solids and liquids. J. Am. Chem. Soc. 1917, 38, 102–105. [Google Scholar] [CrossRef]
  35. Fan, S.; Tang, J.; Wang, Y.; Li, H.; Zhang, H.; Tang, J.; Wang, Z.; Li, X. Biochar prepared from co-pyrolysis of municipal sewage sludge and tea waste for the adsorption of methylene blue from aqueous solutions: Kinetics, isotherm, thermodynamic and mechanism. J. Mol. Liq. 2016, 220, 432–441. [Google Scholar] [CrossRef]
  36. Wang, L.; Xu, Y.M.; Liang, X.F.; Sun, Y.B.; Lin, D.S.; Dong, R.Y. Effects of biochar and chicken manure on cadmium uptake in pakchoi cultivars with low cadmium accumulation. Zhongguo Huanjing Kexue/China Environ. Sci. 2014, 34, 2851–2858. [Google Scholar]
  37. Bogusz, A.; Oleszczuk, P.; Dobrowolski, R. Application of laboratory prepared and commercially available biochars to adsorption of cadmium, copper and zinc ions from water. Bioresour. Technol. 2015, 196, 540–549. [Google Scholar] [CrossRef]
  38. Freundlich, H. Über die Adsorption in Lösungen, Zeitschrift für physikalische Chemie. J. Am. Chem. Soc. 1906, 62, 121–125. [Google Scholar]
  39. Chen, X.; Chen, G.; Chen, L.; Chen, Y.; Lehmann, J.; McBride, M.B.; Hay, A.G. Adsorption of copper and zinc by biochars produced from pyrolysis of hardwood and corn straw in aqueous solution. Bioresour. Technol. 2011, 102, 8877–8884. [Google Scholar] [CrossRef]
  40. Tong, X.; Xu, R. Removal of Cu(II) from acidic electroplating effluent by biochars generated from crop straws. J. Environ. Sci. 2013, 25, 652–658. [Google Scholar] [CrossRef]
  41. Ahmad, M.; Rajapaksha, A.U.; Lim, J.E.; Zhang, M.; Bolan, N.; Mohan, D.; Vithanage, M.; Lee, S.S.; Ok, Y.S. Biochar as a sorbent for contaminant management in soil and water: A review. Chemosphere 2014, 99, 19–33. [Google Scholar] [CrossRef]
  42. Trakal, L.; Šigut, R.; Šillerová, H.; Faturíková, D.; Komárek, M. Copper removal from aqueous solution using biochar: Effect of chemical activation. Arab. J. Chem. 2014, 7, 43–52. [Google Scholar] [CrossRef] [Green Version]
  43. Zheng, W.; Li, X.M.; Wang, F.; Yang, Q.; Deng, P.; Zeng, G.M. Adsorption removal of cadmium and copper from aqueous solution by areca—A food waste. J. Hazard. Mater. 2008, 157, 490–495. [Google Scholar] [CrossRef] [PubMed]
  44. El-Ashtoukhy, E.S.Z.; Amin, N.K.; Abdelwahab, O. Removal of lead (II) and copper (II) from aqueous solution using pomegranate peel as a new adsorbent. Desalination 2008, 223, 162–173. [Google Scholar] [CrossRef]
  45. Zhang, J.; Fu, H.; Lv, X.; Tang, J.; Xu, X. Removal of Cu(II) from aqueous solution using the rice husk carbons prepared by the physical activation process. Biomass Bioenergy 2011, 35, 464–472. [Google Scholar] [CrossRef]
  46. Liu, Z.G.; Zhang, F.S. Removal of lead from water using biochars prepared from hydrothermal liquefaction of biomass. J. Hazard. Mater. 2009, 167, 933–939. [Google Scholar] [CrossRef] [PubMed]
  47. Parshetti, G.K.; Chowdhury, S.; Balasubramanian, R. Hydrothermal conversion of urban food waste to chars for removal of textile dyes from contaminated waters. Bioresour. Technol. 2014, 161, 310–319. [Google Scholar] [CrossRef]
  48. Banerjee, S.; Mukherjee, S.; LaminKa-ot, A.; Joshi, S.R.; Mandal, T.; Halder, G. Biosorptive uptake of Fe2+, Cu2+ and As5+ by activated biochar derived from Colocasia esculenta: Isotherm, kinetics, thermodynamics, and cost estimation. J. Adv. Res. 2016, 7, 597–610. [Google Scholar] [CrossRef] [Green Version]
  49. Cao, X.D.; Ma, L.; Gao, B.; Harris, W. Dairy-manure derived biochar effectively sorbs lead and atrazine. Environ. Sci. Technol. 2009, 43, 3285. [Google Scholar] [CrossRef]
  50. Karami, N.; Clemente, R.; Moreno-Jimnez, E.; Lepp, N.W.; Beesley, L. Efficiency of Green Waste Compost and Biochar Soil Amendments for Reducing Lead and Copper Mobility and Uptake to Ryegrass. J. Hazard. Mater. 2011, 191, 41–48. [Google Scholar] [CrossRef]
  51. Caporale, A.G.; Pigna, M.; Sommella, A.; Conte, P. Effect of pruning-derived biochar on heavy metals removal and water dynamics. Biol. Fertil. Soils 2014, 50, 1211–1222. [Google Scholar] [CrossRef] [Green Version]
Figure 1. Effect of biochar (BC) dosage on the adsorption capacities and the removal efficiency of the Cu(II) (a) and Zn(II) (b) (initial Cu(II) concentration 64 mg L−1, initial Zn(II) concentration 65 mg L−1; reaction temperature 25 °C; initial solution pH 5.0; contact time 1440 min). Error bars represent standard error (n = 3). LSD is the least significant difference at p < 0.05 under the same dose of BC.
Energies 13 03498 g001
Figure 2. Effect of initial solution pH on Cu(II) (a) and Zn(II) (b) adsorption by BCs produced at different temperatures (initial Cu(II) concentration 64 mg L−1, initial Zn(II) concentration 65 mg L−1; reaction temperature 25 °C; BC dosage 5 g·L−1; contact time 1440 min). Error bars represent standard error (n = 3). Different letters above bars within the same pH condition indicate significant differences among BCs (p < 0.05).
Energies 13 03498 g002
Figure 3. Zeta potentials of BC300, BC400, BC500, and BC600 at different pH values. Error bars represent standard error (n = 3). LSD is the least significant difference at p < 0.05 under the same pH.
Energies 13 03498 g003
Figure 4. Effect of initial solution pH on the final pH and ΔpH (ΔpH = Cu(II) and Zn(II) free solutions pH—the final pH) during the sorption of Cu(II) (a,c) and Zn(II) (b,d) by BCs produced at different temperatures (initial Cu(II) concentration 64 mg L−1, initial Zn(II) concentration 65 mg L−1; reaction temperature 25 °C; BC dosage 5 g L−1; contact time 1440 min). Error bars represent standard error (n = 3). Different letters above bars within the same pH condition indicate significant differences among BCs (p < 0.05).
Energies 13 03498 g004
Figure 5. Effect of contact time on Cu(II) (a) and Zn(II) (b) adsorption by BCs produced at different temperatures (initial Cu(II) concentration 64 mg L−1, initial Zn(II) concentration 65 mg L−1; reaction temperature 25 °C; BC dosage 5 g·L−1; initial solution pH 5.0). Error bars represent standard error (n = 3).
Energies 13 03498 g005
Figure 6. Adsorption isotherms of Cu(II) (a) and Zn(II) (b) by BCs (reaction temperature 25 °C; BC dosage 5 g·L−1; initial solution pH 5.0; contact time 1440 min). Error bars represent standard error (n = 3).
Energies 13 03498 g006
Figure 7. Effect of initial heavy metal concentration on the percent removal of the Cu(II) (a) and Zn(II) (b) (reaction temperature 25 °C; BC dosage 5 g·L−1; initial solution pH 5.0; contact time 1440 min). Error bars represent standard error (n = 3). LSD is the least significant difference at p < 0.05 under the same initial heavy metal concentration.
Energies 13 03498 g007
Figure 8. Variation of CO32− and PO43− during the absorption of Cu(II) (a,c) and Zn(II) (b,d) by BCs produced at different temperatures (reaction temperature 25 °C; BC dosage 5 g·L−1; initial solution pH 5.0; contact time 1440 min). Error bars represent standard error (n = 3). LSD is the least significant difference at p < 0.05 under the same initial heavy metal concentration.
Energies 13 03498 g008
Figure 9. Variation of Ca2+ and Mg2+ during the absorption of Cu(II) (a,c) and Zn(II) (b,d) by BCs produced at different temperatures (reaction temperature 25 °C; BC dosage 5 g·L−1; initial solution pH 5.0; contact time 1440 min). Error bars represent standard error (n = 3). LSD is the least significant difference at p < 0.05 under the same initial heavy metal concentration.
Energies 13 03498 g009
Figure 10. Effect of temperature on the sorption of Cu(II) (a) and Zn(II) (b) by BCs produced at different temperatures (initial Cu(II) concentration 64 mg L−1, initial Zn(II) concentration 65 mg L−1; BC dosage 5 g·L−1; initial solution pH 5.0; contact time 1440 min). Error bars represent standard error (n = 3). LSD is the least significant difference at p < 0.05 under the same reaction temperature.
Energies 13 03498 g010
Table 1. The main characteristics of biochars produced at different temperatures.
SampleBC300BC400BC500BC600
C (%)62.2071.1374.8880.01
H (%)5.184.032.882.72
N (%)1.691.941.771.28
O (%)24.2115.0510.416.59
H/C1.000.680.460.41
O/C0.290.160.110.06
Surface area (m2·g−1)2.397.0037.25108.59
Ash (%)6.727.8510.069.41
pH (5:1)7.4811.4211.6210.60
Cation exchange capacity
(cmol·g−1)
44.7264.3366.7018.53
Total acidic functional
groups (mmol·g−1)
0.540.390.300.22
Surface carboxyl groups
(mmol·g−1)
0.300.240.170.12
Surface phenol groups
(mmol·g−1)
0.120.080.070.06
Surface lactone groups
(mmol·g−1)
0.120.060.050.04
Note: The methods used for determining the physical and chemical properties of biochar have been described in detail in our previous study [27].
Table 2. The operating conditions of the experiments.
ConditionsExperiment 1Experiment 2Experiment 3Experiment 4Experiment 5
Biochar dosage (g L−1)1, 3, 5, 10, 205555
Initial solution pH52, 3, 4, 5, 6555
Contact time
(min)
1440144010, 20, 40, 60, 90, 120, 180, 240, 360,480, 600, 720, 960, 1200, 1440, 1680, 1920, 2400, 288014401440
Reaction temperature25 °C25 °C25 °C25 °C25, 30, 35, and 40 °C
Initial Cu (II) concentration
(mg L−1)
6464646.4, 12.8, 38.4, 64, 128, 256, 38464
Initial Zu (II) concentration
(mg L−1)
6565656.5, 13, 39, 65, 130, 260, 390 65
Rotation speed180180180180180
Table 3. Parameters of pseudo-first order model, pseudo-second order model, and intraparticle diffusion model for Cu(II) and Zn(II) adsorption by BCs.
MetalCuZn
BiocharBC300BC400BC500BC600BC300BC400BC500BC600
qe,exp4.96 ± 0.18d7.56 ± 0.27c9.70 ± 0.33a8.87 ± 0.42b4.30 ± 0.10d5.69 ± 0.13c9.11 ± 0.28a7.99 ± 0.22b
PF order
model
qe (mg g−1)4.63 ± 0.07d7.14 ± 0.10c9.23 ± 0.13a8.47 ± 0.12b4.05 ± 0.06c5.30 ± 0.09b8.77 ± 0.13a7.75 ± 0.11a
k1 × 10−3 (L·min−1)3.49 ± 0.20c7.77 ± 0.49b13.5 ± 0.94a14.36 ± 1.06a2.91 ± 0.16c5.26 ± 0.37b9.14 ± 0.61a10.33 ± 0.69a
R20.930.910.900.890.930.930.920.91
PS order
model
qe (mg g−1)5.33 ± 0.04d7.80 ± 0.02c9.86 ± 0.08a9.02 ± 0.02b4.74 ± 0.03d5.93 ± 0.03c9.54 ± 0.06a8.34 ± 0.04b
k2 × 10−3(g·mg−1·min−1)0.79 ± 0.15c1.35 ± 0.14b1.99 ± 0.24a2.37 ± 0.28a0.72 ± 0.06c1.14 ± 0.15b1.31 ± 0.37ab1.79 ± 0.0.34a
h (mg·g−1·min−1)0.02 ± 0.00c0.08 ± 0.01b0.19 ± 0.03a0.19 ± 0.05a0.02 ± 0.00c0.04 ± 0.00b0.12 ± 0.01a0.12 ± 0.02a
R21.001.000.991.001.001.001.000.99
IPD
model
ki (mg·g−1·min−0.5)0.10 ± 0.01a0.12 ± 0.01a0.13 ± 0.02a0.11 ± 0.02a0.10 ± 0.20ab0.10 ± 0.01b0.14 ± 0.02a0.12 ± 0.02ab
C0.72 ± 0.25c2.56 ± 0.48b4.59 ± 0.64a4.41 ± 0.58a0.46 ± 0.02c1.35 ± 0.33b3.50 ± 0.61a3.42 ± 0.55a
R20.870.730.640.650.900.810.710.67
Note: data are presented as mean ± standard deviation; values in a row within the same heavy metal group followed by the same letter are not significantly different at p < 0.05 according to LSD test.
Table 4. Langmuir and Freundlich isotherm parameters and correlation coefficients for Cu(II) and Zn(II) absorption by BCs.
MetalBiocharLangmuir Isotherm ModelFreundlich Isotherm Model
Qmax (mg·g−1)b (L·g−1)R2RL, maxRL, minnKf (mg·g−1)R2
CuBC3005.20 ± 0.23d0.08 ± 0.02b0.970.66 ± 0.06a0.03 ± 0.01a4.35 ± 0.07b1.41 ± 0.47b0.74
BC4009.58 ± 0.18c0.10 ± 0.01b0.990.60 ± 0.02a0.03 ± 0.01a4.17 ± 0.06b2.58 ± 0.76ab0.80
BC50011.41 ± 0.23a0.23 ± 0.02a0.990.41 ± 0.11b0.01 ± 0.01a5.00 ± 0.06a3.94 ± 1.08a0.76
BC60010.31 ± 0.50b0.12 ± 0.03b0.960.57 ± 0.04a0.02 ± 0.01a4.55 ± 0.07b2.99 ± 0.99a0.73
ZnBC3004.98 ± 0.32c0.04 ± 0.01c0.950.79 ± 0.03a0.06 ± 0.01a3.45 ± 0.08d0.93 ± 0.37c0.74
BC4007.22 ± 0.36b0.05 ± 0.01bc0.970.75 ± 0.02a0.05 ± 0.01a3.70 ± 0.07c1.48 ± 0.52bc0.80
BC50010.22 ± 0.52a0.13 ± 0.03a0.960.54 ± 0.07c0.02 ± 0.00c4.55 ± 0.07a3.10 ± 1.00a0.76
BC6009.15 ± 0.63a0.09 ± 0.03ab0.950.63 ± 0.01b0.03 ± 0.00b4.17 ± 0.08b2.35 ± 0.88ab0.73
Note: data are presented as mean ± standard deviation; values in a column within the same heavy metal group followed by the same letter are not significantly different at p < 0.05 according to LSD test.
Table 5. Thermodynamic parameters of Cu and Zn(II) absorption onto BCs produced at different temperatures.
Heavy MetalBiocharΔG (KJ·mol−1)ΔH
(KJ·mol−1)
ΔS
(J·mol−1·K−1)
Temperature (°C)
25303540
CuBC300−0.48 ± 0.06a−0.60 ± 0.01a−0.72 ± 0.05a−0.83 ± 0.05a6.45 ± 0.43d23.28 ± 1.92d
BC400−1.05 ± 0.05b−1.23 ± 0.09b−1.41 ± 0.01b−1.60 ± 0.04b9.72 ± 0.86c36.16 ± 0.59c
BC500−1.27 ± 0.04c−1.54 ± 0.08d−1.81 ± 0.09c−2.08 ± 0.06d14.78 ± 1.12a53.87 ± 2.72a
BC600−1.13 ± 0.02c−1.35 ± 0.04c−1.57 ± 0.05c−1.79 ± 0.02c11.91 ± 0.91b43.77 ± 1.21b
ZnBC300−0.30 ± 0.06a−0.40 ± 0.02a−0.51 ± 0.07a−0.62 ± 0.03a5.93 ± 0.02b20.95 ± 0.28c
BC400−0.50 ± 0.07b−0.66 ± 0.09b−0.83 ± 0.01b−0.99 ± 0.03b9.28 ± 0.81a32.82 ± 0.67b
BC500−1.14 ± 0.08d−1.32 ± 0.05d−1.51 ± 0.02d−1.70 ± 0.08d9.91 ± 0.82a37.11 ± 1.37a
BC600−0.92 ± 0.06c−1.09 ± 0.06c−1.26 ± 0.04c−1.43 ± 0.05c9.42 ± 0.76a34.72 ± 2.06ab
Note: data are presented as mean ± standard deviation; values in a column within the same heavy metal group followed by different letters are significantly different at p < 0.05 according to LSD test.

