Case Report

Advanced Wastewater Treatment to Eliminate Organic Micropollutants in Wastewater Treatment Plants in Combination with Energy-Efficient Electrolysis at WWTP Mainz

1
Institute Water Infrastructure Resources, University of Kaiserslautern, Paul-Ehrlich-Straße 14, D-67663 Kaiserslautern, Germany
2
Greenpeace Energy eG, Hongkongstraße 10, D-20457 Hamburg, Germany
3
Hydro-Ingenieure Energie & Wasser GmbH, Richard-Wagner-Straße 45, D-67655 Kaiserslautern, Germany
*
Author to whom correspondence should be addressed.
Energies 2020, 13(14), 3599; https://doi.org/10.3390/en13143599
Submission received: 27 May 2020 / Revised: 29 June 2020 / Accepted: 6 July 2020 / Published: 13 July 2020
(This article belongs to the Special Issue Wastewater Treatment and Resource Recovery)

Abstract

:
To achieve the Paris climate protection goals there is an urgent need for action in the energy sector. Innovative concepts in the fields of short-term flexibility, long-term energy storage and energy conversion are required to defossilize all sectors by 2040. Water management is already involved in this field with biogas production and power generation and partly with using flexibility options. However, further steps are possible. Additionally, from a water management perspective, the elimination of organic micropollutants (OMP) is increasingly important. In this feasibility study a concept is presented, reacting to energy surplus and deficits from the energy grid and thus providing the needed long-term storage in combination with the elimination of OMP in municipal wastewater treatment plants (WWTPs). The concept is based on the operation of an electrolyzer, driven by local power production on the plant (photovoltaic (PV), combined heat and power plant (CHP)-units) as well as renewable energy from the grid (to offer system service: automatic frequency restoration reserve (aFRR)), to produce hydrogen and oxygen. Hydrogen is fed into the local gas grid and oxygen used for micropollutant removal via upgrading it to ozone. The feasibility of such a concept was examined for the WWTP in Mainz (Germany). It has been shown that despite partially unfavorable boundary conditions concerning renewable surplus energy in the grid, implementing electrolysis operated with regenerative energy in combination with micropollutant removal using ozonation and activated carbon filter is a reasonable and sustainable option for both, the climate and water protection.

Graphical Abstract

1. Introduction and Background

To achieve the Paris climate protection goals (temperature rise < 1.5 °C [1]), there is an urgent need for action in the energy sector. To accomplish that goal a rapid expansion of renewable energy generation capacities is needed and the provision of flexibility, long-term energy storage and energy conversion to maintain stable operation of the energy grids is essential. This is mandatory to defossilize all sectors by 2040 [2,3]. Water management is already taking part here, but can take more ambitious steps. From a water management perspective, the elimination of organic micropollutants (OMP) is of increasing importance. Both aspects can be combined and solved in a holistic manner.

1.1. Organic Micropollutants (OMP) in Wastewater

The topic of OMP is one of the top priorities on the international agenda in water management for several years [4,5,6,7,8]. Wastewater treatment plants (WWTPs) are presenting one of the main pathways of OMP into the environment and surface water [9]. In Europe several countries are taking activities in treating OMP at WWTPs like Denmark, Finland, France, Sweden, Netherlands, Germany and Switzerland [10,11]. However, legal regulations are actually implemented only in Switzerland [12,13], other countries shy away from compelling measures. In Germany, handling of OMP is still very different among the federal states and but was taken up as part of the national federal stakeholder process. The results of the process were summarized in a report in March 2019 [14] and give for the first time a framework for advanced wastewater treatment at the federal level. Up to now, in some federal states a large number of WWTPs of different sizes have already been equipped with an advanced treatment step for the removal of OMP. In Europe, the most commonly used process technologies to remove OMP are ozonation or active carbon (AC) technologies [11,15].

1.2. Sector Coupling and Energy Transition

The ongoing worldwide energy transition from fossil to renewable energy production is shown by the global increasing capacity of renewables [16] with a yearly growth rate of 7.4% and a total power generation capacity of 2537 GW at the end of 2019. The global share of renewable capacity is highest in Asia (44%) and Europe (23%) followed by North America (15%) and South America (9%) [17]. With an increasing share of renewables, sector coupling will become a central element of this transition process. It is defined as the integration of energy systems from different sectors, which are usually managed and optimized independently of one another via specific energy storage options. Relevant sectors are electricity, gas, heating, transport and the production of basic chemical materials [18]. Based on the electricity sector driven by renewables, power-to-x technologies can supply the required transformation of energy to the other sectors to substitute fossil-based resources and lead to more stability of the system.
A large review of the possible role of WWTPs by means of sector coupling is given in [19]. Practical implementations and their impacts on the processes are depicted, discussed and evaluated. The results show significant synergies, e.g., using electrical energy surplus from the power grid (secondary control reserve, to offer system service: automatic frequency restoration reserve (aFRR)) to produce hydrogen and oxygen with an electrolyzer. Hydrogen can be used for long-term storage and oxygen for enhancing purification processes on the WWTP. Furthermore, storable methane gas can be produced at WWTPs, which can contribute to an implementation of local heating networks. As explained in detail in [19], an interconnection in many fields of different research sectors is given and it is shown that it is possible and reasonable for WWTPs to contribute with sustainable energy concepts to defossilization. Thus it can be assumed that many WWTPswill be able to support the energy transition with its gas potentials and flexibility options if suitable management concepts are applied (cf. [20,21]).

2. WWTP Mainz

2.1. Description of the Plant

The WWTP Mainz (Germany) is a mechanical–biological treatment plant for enhanced nitrogen and phosphorus removal with separate anaerobic sludge digestion. It treats the wastewater of approximately 225,000 inhabitants plus wastewater from industry, summing up to 375,000 PE120 in 2017. The wastewater inflow amounts up to 55,000 m3 per day (average value) with peaks of 6300 m3 per hour.
A simplified flow chart is given in Figure 1. The rain overflow basin is placed upstream of the inlet with a total volume of 18,700 m3 feeding the first treatment stage consisting of a four-lane screen, four aerated grit chambers and a primary sedimentation tank (3700 m3). The second stage consists of six activated sludge tanks (4 × 5200 m3 + 2 × 2600 m3), each with five cascades, equipped with aeration panels and mixing devices. Nitrification and denitrification take place intermittently and alternately. Phosphate is chemically precipitated by two-point simultaneous precipitation (in the return sludge and the effluent of the activated sludge tanks). From the effluent of the activated sludge tanks the wastewater is pumped to twelve secondary clarifiers with an overall volume of 30,120 m3. Afterwards, the cleaned wastewater is discharged to the Rhine River.
Sewage sludge is anaerobically stabilized in two digesters with a total volume of 14,000 m3. The digested sludge is dewatered by centrifuges before incineration onsite (start of operations in second half of the year of 2020). Nearly 8900 Nm3/d raw biogas corresponding to 23.7 L/(PE∙d) are produced in the digesters and can be temporarily stored in two parallel operated low-pressure gas storage tanks with a volume of 6700 m3 [22]. The biogas is used in four combined heat and power plant (CHP) units with around 1.4 MWel. Furthermore, the thermal energy of the cooling water from the CHPs is used via a heat exchanger to heat the digestion tanks and the operation buildings of the WWTP.

2.2. Organic Micropollutants

In order to get a rough insight into the micropollutant situation at the WWTP Mainz as a base for the planning process, one influent sample and five effluent samples (all as 24-h composite samples) were taken during dry weather flow and analyzed for approximately 120 micropollutants. The results of the analysis of these samples are available in Supplementary Materials Data S1. An extract of the results for 12 drugs and five X-ray contrast agents is shown in Figure 2. For a better evaluation and ranking, the inflow concentrations are compared with concentration values of 40 other municipal WWTP based on [23]. The effluent values are compared to concentrations measured on five municipal WWTP based on [24].
The inflow concentrations in Figure 2a show that the concentrations from five substances are close to the mean values reported in [23], the others are at least within the range between the minimum and maximum values of [23]. This demonstrates that the concentrations for OMP in the influent of the WWTP Mainz are within a typical range of other municipal WWTPs. Nevertheless some substances like the common widely used analgetic diclofenac (DCF; influent concentration of 6.3 µg/L) occur in the upper concentration range, whereas the pain reliever ibuprofen can be found in a lower concentration range (4 µg/L) compared to the literature data from [23]. The X-ray contrast medium iomeprol has a concentration twice as high as the mean value of the measurements published in [23]. However, the other contrast media examined are in the lower part of the measuring range (e.g., amidotrizoic acid, iohexol and iopromid) or close to the determination limit (iopamidol).
Most substances measured in the effluent of the WWTP Mainz are within a typical range found on other WWTPs [24] (see Figure 2b). However, some substances show a different pattern. DCF reaches with an average concentration of 2.2 µg/L higher concentrations than the mean effluents concentrations described in [24]. An international review of DCF in municipal WWTPs [25] also confirms that DCF inflow concentration as well as effluent concentrations in Mainz are rather high, but are even found in higher concentrations on few WWTPs in Germany and worldwide [26].
Nevertheless, these results have to be regarded conditionally because
  • the limited sampling only shows a snapshot and is not statistically assured;
  • deviation between the concentrations found in Mainz and on other WWTPs might depend on regional differences in the application and prescription of substances.
The comparison of influent and effluent concentrations in Mainz shows the medium removal of DCF in the conventional wastewater treatment. This is in accordance with the removal rates quantified as “mainly in the scope of 21–40%” in [27].
Figure 2b shows additionally the chronic quality standard (CQS) values in order to assess the ecotoxicological relevance of a substance. CQS is described as follows in [8]: “Chronic quality standards are recommended for water quality monitoring. They can be used for assessing pollution over an extended time period. For the continuous input of micropollutants from treated effluents, the chronic quality standard is particularly relevant and helps to protect the organisms against the consequences of long-term pollution”. The value of the proposed CQS for DCF in Germany and Switzerland is 0.05 µg/L [8,28]. In the Rhine River, one of the large rivers in Europe, the DCF concentration is already in the area of the CQS and exceeds the CQS seasonally and clearly at different measuring stations [29]. The specific situation at the measuring point Mainz is shown in Figure 3. The mean value of the measuring period 2010–2017 amounts to 0.047 µg/L [30] and is thus only marginally lower than the proposed CQS. Therefore, a real need for OMP removal is pointed out.

2.3. Energetic Situation and Upcoming Changes

The WWTP Mainz has actually a total power consumption of 8200 MWhel/a, corresponding to a specific power consumption of 21.9 kWhel/(PE∙a). This is far below the median value of 35 kWhel/(PE∙a) of other comparable WWTPs in Germany [31] and characterizes the energetic efficiency of this WWTP. The electrical self-sufficiency rate averages actually around 78%, which is realized by 227 MWhel/a produced by onsite photovoltaic (PV) power and 6173 MWhel/a generated by onsite CHPs using biogas produced in the two digesters (see Figure 1). In the current situation only 81% of the total yearly biogas amount of 3,250,000 m3/a with an energy content of 19,825 MWhCH4/a (heating value: 6.1 kWh/m3) can be used to produce electricity via CHPs (ηel = 38.5%) onsite. Due to a dynamic energy demand of the WWTP and limited storage capacity for the biogas, ca. 19% (621,475 m3/a · 6.1 kWh / m 3 3791 MWhCH4/a · 0.385 1460 MWhel/a) of the biogas, respectively, its energy content is not used onsite and needs to be flared because a conversion into electricity via CHP and feeding into the public power network is uneconomic due to low feed in compensations. As a consequence, 1800 MWhel/a have to be purchased from the regional power utility to ensure the continuous power supply of the plant. The here mentioned energetic indicators are summarized in Table 1.
In the second half of the year 2020 a new sewage sludge incineration plant (TVM—Thermische Verwertung Mainz, Mainz, Germany) will start operation at the site of the WWTP Mainz, processing sewage sludges from several WWTPs in the surroundings corresponding to a total capacity of nearly 2,400,000 PE120. This will affect the energy balance and consumption for the operation of the WWTP Mainz: the processes of sludge dewatering and drying will then be integrated in the TVM system reducing the power consumption of the WWTP by the amount of 328 MWhel/a. The sludge drying will be realized by the waste heat of the turbine of TVM, which will provide an electrical surplus power of up to 500 kWel, producing 4000 MWhel/a, used for the wastewater treatment. This will significantly change the current situation of external electricity procurement and the use of biogas for self-sufficiency purposes: a purchase of external power is no longer necessary. Launching the TVM, the theoretical power (energy) surplus onsite will increase to 3988 MWhel/a (corresponding to 10,357 MWhCH4/a biogas). The summarized energy balance is illustrated in Table 1.
This expected amount of surplus biogas (Table 1) of 10,357 MWhCH4/a generated onsite should be used under a holistic point of view and thus under aspects of energy storage and energy efficiency. Flaring of biogas as well as the conversion into electricity due to a full (local) gas storage has to be avoided because this will lose the flexibility and therefore energy-efficient properties of the renewable biogas. This is why a forward-looking energy-concept was in demand.

3. Practical Implementation: The “Arrived” Project

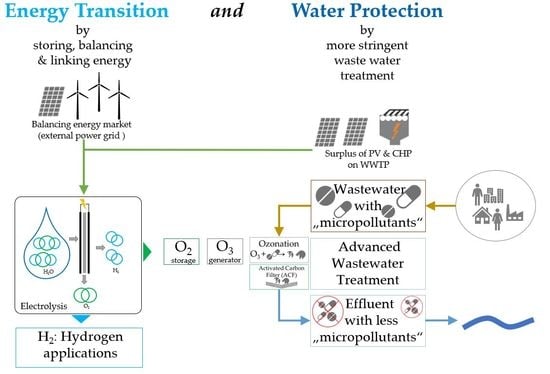
3.1. Integrated Concept

The aim of the project was to equip a municipal WWTP with an electrolysis and an advanced treatment step for the removal of OMP and to operate for the first time both process stages together, just using renewable energy sources.
On the one hand, electrolysis provides oxygen as the starting product for ozone generation, needed for ozone treatment of the wastewater to remove OMP. The ozonated wastewater is then led to a biologically activated and granulated active carbon filter (GACF) to reduce possible transformation products (Figure 4). This combination of OMP elimination processes has already been successfully demonstrated in several research projects [32,33,34] and has been investigated since 2017 in the frame of two pilot projects at the Paderborn WWTP (30,000 PE120) [15] and the Weißenburg WWTP (35,000 PE120) [35]. This technology is also operated at WWTP Altenrhein (120,000 PE120) since 2019 [15] and proposed as combined treatment technology for the removal of OMP in Sweden [36]. However, up to now this combination is not implemented on a WWTP with a capacity of 375,000 PE120 and connected to the energy market as it is planned for WWTP Mainz.
On the other hand, hydrogen generated by electrolysis can be used in different ways and is usually the much more valuable product. The natural gas infrastructure (NGI) acts as a long-term storage. Thus, particularly the direct feed into the natural gas grid of the local gas grid operator (Mainzer Stadtwerke, Mainz, Germany) may be considered due to a favorable location to the NGI. One focus of its use is the marketing of hydrogen (produced by the power-to-gas (PtG) technology) to the heating sector to replace natural gas in the public gas grid as an important contribution and component for the energy transition.
In addition to the feed-in into the natural gas grid the planned project also considers the use of H2 in the mobility sector and the public transport system of the city of Mainz (hydrogen buses).
At a later point, methanation with the CO2 from the flue gas of TVM or the 35% constituent of CO2 in the biogas could be a further option in the future.
The process chain of the above-described concept is shown in Figure 4. Before implementation two feasibility studies were conducted determining the planning constraints for the construction of such a system and demonstrating the feasibility for Mainz [22,37]. Both studies combine the investigations into the two innovative processes of micropollutant elimination and integration of a WWTP into the energy grid and their combination. Concerning WWTPs, especially for the last-mentioned area of electrolysis, there is only little experience when using surplus power and grid system services. In comparison to other initiatives, the challenge lies in coupling a sustainable energy concept with the removal of OMP. Experiences made in the single sectors were transferred and adapted to the specific local conditions of the WWTP Mainz. The result shows that the overall concept is sustainable, innovative and energy-efficient.
In the outcome of the studies, implementing an advanced treatment step for the removal of OMP for 89% of the wastewater stream (see Section 4.2.1), combined with an electrolyzer with an electrical capacity of 1.25 MW [22] (see Section 4.3) was proposed. This capacity enables a sufficient production of oxygen for ozonation and also the sustainable use of the energy surplus onsite (see Section 2.3).
The set-up of the new concept leads to a complex energetic situation with different given or fluctuating power generators and sources of renewable energy (a new photovoltaic (PV) will be installed, the TVM delivers surplus energy (see Table 1), temporarily available energy from the power grid to offer system service) and consumers (several devices on the WWTP, a new electrolyzer). No additional conventional electricity should be required for the cleaning process and an energy-efficient and sustainable generation of oxygen should take place. This will enable the self-generated electricity to be used locally and, in an energy-efficient manner under the very complex energetic conditions of a WWTP of such a size.
This requires a precise control of the flexible power generators (CHP), which cannot be ensured manually, but with the support of innovative software concepts and technology. Therefore, the establishment of storage and CHP management is planned to ensure the most regenerative and sustainable supply of the overall concept. The software aims to optimize the use of the biogas in the CHP and the gas storages for oxygen and hydrogen.

3.2. Objectives and Environmental Impact

The project pursues several objectives on two levels causing different positive environmental effects.
Level 1: contribution to the energy transition (thus, positive effects on climate protection):
  • Expansion of renewable energies on site through extension of the PV plant.
  • Provision of short-term flexibility: integration of fluctuating renewable energy, and supply of system services in the form of aFRR (secondary control reserve).
  • Sector coupling: integration of the WWTP in the energy market (hydrogen feed-in into the gas grid, hydrogen for public transport, gas storage and CHP management).
  • Substitution of fossil fuels in different areas (gas and heat market, public transport and on-site of the WWTP).
  • Coupling the regenerative energy generation on site with the advanced wastewater treatment to be implemented for the removal of OMP.
  • Increasing resource efficiency by the use of the oxygen generated during electrolysis as the starting product for ozone production.
Level 2: improving water quality:
  • Further reduction of OMP in the effluent of the WWTP by the innovative coupling of ozonation and GACF in combination (see Section 4.2) with resource-efficient operation of this process stage (see above) beyond the state of the art.
  • Further reduction of phosphate and solid substances emissions into the Rhine River (see Section 5.1).

4. Planning Principles, Boundary Conditions and Results of the Feasibility Studies

4.1. Energetic Environment

In an ideal case, electrolyzers are operated with green volatile surplus energy. Both products should be used afterwards, hydrogen for energy purposes and, in the described case, sufficient oxygen should be available for the ozonation (see Section 4.3.3). To evaluate the energetic situation, a detailed analysis of the regional energetic environment of the WWTP as the location for the electrolyzer was carried out examining different hydrogen distribution paths, with a focus on feeding hydrogen into the natural gas grid. Additionally, the availability of renewable surplus energy, e.g., from wind or solar power plants was investigated.
Due to current German technical regulation, the maximum proportion of hydrogen in the natural gas grid is 10 vol.-% under favorable conditions [38]. Depending on technical restrictions local authorities can require lower proportions. In the case of Mainz the gas grid operator and Mainz municipal utility company determined that it is feasible to feed-in part of the produced hydrogen, but only up to 2 vol.-% of the gas flux in the grid. A higher amount is actually not possible, because of industrial and chemical processes nearby, which are using natural gas from the grid and would have problems with high amounts of hydrogen.
Regarding the availability of the temporarily renewable surplus energy of wind and PV power, the situation in Mainz is rather unfavorable. Due to the electricity demand in the Mainz region, no regional renewable energy surplus situations are to be expected in the near future.
Therefore, a location-specific electricity supply with renewable energy for the electrolyzer had to be ensured integrating fluctuating PV electricity (onsite) and a more flexible power supply by the CHP. Furthermore, the electrolyzer at WWTP can offer system services in the form of aFRR (secondary control reserve). An important aspect of the energy transition is the supply of system services based on renewable energy. Until now, conventional power plants mainly offer system services like frequency stabilization and load management. In a renewable future, this must be provided also by renewable energies and its flex options. Due to the feed-in capacity into the gas grid in Mainz, only discontinuous system services in the form of aFRR (secondary control reserve) are possible to be offered.
The emerging procedural changes at WWTP (commissioning of the TVM, relocation of sludge dewatering and drying) and the associated effects on the energy balance (see Section 4.5) need to be considered in the concept development as well. Furthermore, possibilities to increase the local renewable power generation by expansion of the PV capacity on the WWTP site were analyzed.

4.2. Organic Micropollutant Elimination

The reduction of OMP can be realized by different technologies: Oxidative technologies such as ozonation and advanced oxidation processes, adsorptive technologies like powdered activated carbon and granulated activated carbon (GAC) or physical technologies like nanofiltration and reverse osmosis [11,36]. Among these, ozonation and adsorptive technologies are most common. Physical technologies and advanced oxidation processes are the most cost intensive [39] and less proven at the technical scale and were therefore not considered in this project. Ozonation was compulsive in order to use the oxygen produced during electrolysis.
For the WWTP Mainz the micropollutant removal unit is designed as a two-step treatment with an ozone stage and a granulated active carbon filter (GACF) stage in series, treating the effluent of the secondary clarification. The advantage of combining both processes are as follows [36,40]:
  • Increasing cleaning performance compared to one-step processes: in comparison to a pure ozone or GACF plant, both elimination mechanisms, oxidative degradation and GAC adsorption with their respective strengths are used for the removal of OMP. This effectively eliminates a wider range of micropollutants.
  • Cleaning performance concerning micropollutant removal: depending on the desired elimination of various key substances, the ozone dosing in combination with the bed volume of the GAC can be adjusted.
  • Reduction of the resource consumption for both stages and possibly the operating costs: Compared to single-stage ozonation or GAC processes, significantly lower ozone dosing and higher GAC bed volumes can be achieved. This reduces the resource consumption for each level.

4.2.1. Treated Amount of Wastewater

The treated amount of wastewater is a central design parameter for the advanced treatment step on the one hand influencing significantly the total elimination of OMP, on the other hand having a high impact on the investment costs. Therefore, a compromise between both aspects has to be found.
For the WWTP Mainz a maximum flow of 800 L/s was scheduled for the final expansion. This exceeds the maximum dry weather inflow Qd,h,max of 760 L/s and ensures that the complete dry weather and large parts of the rainwater inflow will be captured and treated. With the maximum flow of 800 L/s around 17.8 million m3/a can be treated, corresponding to 89% of the annual wastewater volume.

4.2.2. Plant Design

The ozone reactor is designed for a retention time of 20 minutes, for the maximum flow of 800 L/s, resulting in a 960 m3 volume. The reactor consists of three lines each having a dimension of L × W × D = 13.5 m × 4.0 m × 6.0 m (arrangement see Figure 5).
The ozone requirement depends on the treated flow and on the composition of the wastewater, where mainly the nitrite concentration of the feed flow is important. Actually the effluent of the WWTP Mainz comprises of partially increased nitrite concentrations attributed to high ammonium loads in the process water. In order to disburden the biological treatment step and thus reduce the effluent nitrite concentrations, a deammonification step for process water treatment was planned to be set up. For both scenarios (actual nitrite concentration and nearly no nitrite in the effluent) the ozone requirement was calculated and averages between 86.2 (status quo) and 53.1 kgO3/h (no nitrite in the feed flow; further information see Appendix A). The produced gas from the ozone generator usually containing an ozone mass fraction of 10%, thus 1 kg of O3 will be produced from 10 kg of O2. The average oxygen requirement will be therefore in the range between 2068 (status quo) and 1275 kgO2/d (no nitrite in the feed flow).
The GACF cells were designed for a contact time of 20 min and a filter speed of 6 m/h, based on the maximum flow of 800 L/s. This resulted in a number of 10 filter cells with a dimension of L × W = 9.6 × 5.0 m. The filter bed height is 2 m. The total filter area was thus designed with 480 m² (arrangement see Figure 5).

4.3. Electrolysis

4.3.1. Sustainable Operation Options

The electrolyzer should provide the oxygen required for ozonation and produce hydrogen for feed-in into the natural gas grid and for use in public transport. Whether an electrolysis operation is energy-efficient depends primarily on the mode of operation and the power supply. Continuous operation under a full load, which does not consider the current power grid situation or the fluctuating feed-in of renewable energies, does not support the energy transition due to its rigid additional load. In contrast, such a mode of operation rather damages the energy transition and causes more emissions of CO2. If the hydrogen would be produced with the conventional electricity mix, the greenhouse gas emissions would currently be about three times higher than the emissions from steam reforming [42]. Greenhouse gas emissions can only be reduced by supplying the electrolyzer with green electricity in combination with a flexible operating mode. The following modes of operation can be considered an energy transition supporting electrolysis operation:
  • The use of renewable surplus energy in the power grid/reaction to the curtailment of renewable energy systems,
  • The use of a negative residual load caused by fluctuating renewable power,
  • The structuring of fluctuating renewable energies for integration in renewable energy portfolios or for sales to consumers,
  • Participation in the balancing power market/system services using renewable energy (in combination with points 1., 2. and 3.).
In a 100% renewable electricity system and alone in the context of point 1. to 3. it is assumed that an electrolyzer will have approximately 2500 full load hours [43].

4.3.2. Operating Concept

The analysis of the energetic environment (see Section 4.1) has shown that bottlenecks in the distribution grid or surplus energy from the curtailment of renewable energy plants are not to be expected in the region around WWTP Mainz in the near future. Furthermore, the analysis points out, that both, the structuring of fluctuating renewable energies and the reduction of forecast deviation of fluctuating renewable energies onsite, can be carried out more efficiently for the existing CHP units than the electrolyzer. Since offering a primary energy control reserve alone is not seen as a sustainable operation mode (see above) and due to the limited feed-in capacity into the gas grid, this system service for the power grid is not possible. Therefore, the only operation modes within the framework are expansion and integration of a new PV plant combined with the secondary control reserve aFRR.
To calculate the power consumption through aFRR, the provided system services of the years 2017 and 2018 were analyzed. The analysis shows that about 40–50% of the time aFRR is called. Today, the negative secondary control power is advertised daily in 4 h blocks, whereby the bid must be divided into performance and work price. To achieve high full load hours for the electrolyzer in order to reduce the specific fixed cost per kWh of hydrogen generated, a successful offer strategy for the working price must be developed. If the offer strategy places the electrolyzer in the lowest one to five percent of the merit order in each tender, around 3500 full load hours (40% of 8760 h a year) of the electrolyzer can be reached. It must be considered that the actual calls by aFRR depend on the offer strategy and can therefore deviate from the quantities assumed here.
In order to react to the secondary control signal as quick as possible a permanent minimum load of approximately 20% of its capacity, the minimal load of the electrolyzer, is needed.
This base load of the electrolyzer has to be covered with the local power production of fluctuating PV, the additionally installed PV plant onsite and the CHP units, which will supply the rest of the power needed. This is possible, as soon as the TVM is put into operation and therefore less biogas is needed to provide the electricity demand of the WWTP. The favorable maximum production of the PV plant matches the base load of the electrolyzer (20% of the capacity). Altogether, the power supply of the electrolyzer will not reduce the renewable energies (RE) in the power grid. The addition of PV onsite provides renewable electricity for the electrolyzer and therefore reduces the need for electricity from the grid.
Figure 6 shows an example of electricity consumption for the electrolyzer for a week in summer, in which the locally generated PV electricity at the WWTP Mainz would be included.
Simulation results of the energy consumption of the electrolyzer at WWTP showed that about 15% of the energy consumption could be covered by the already existing and newly planned PV plants on site and 34% from CHP electricity. Approximately 50% of the electrolyzer’s power calls were made up of system services, the energy requirement of which, due to the short-term nature, mostly comes from the supply of green electricity from the grid. Since PV plants are already installed on the appropriate roof areas at the buildings of WWTP Mainz, the additional PV will be installed via an innovative construction above the secondary clarifiers, resulting in a double use of a portion of the WWTPs area (waste water treatment and power generation).

4.3.3. Hydrogen and Oxygen Production

A 1.25 MW electrolyzer provided the sustainable production of hydrogen (H2) and the production of oxygen (O2; cf. Table 2). The efficiency of converting electricity to hydrogen was assumed as 68% based on manufacturer specifications and [44].
The maximum oxygen requirement for the advanced treatment step is around 150 kgO2/h and on average around 53 kgO2/h or 465,206 kgO2/a (see Section 4.2.2) after reducing the nitrite concentration in the effluent of the WWTP (cf. Table 3, additional and more detailed information see Appendix A). With the operating concept presented above, the base load of 20% of the electrolyzer’s capacity (see Table 2) covers approximately 60% of the average oxygen demand for ozonation. The residual required oxygen has to be generated via discontinuous calls of control reserve (aFRR) and is temporarily stored in an oxygen storage tank (possibly supplemented by a backup liquid oxygen tank).

4.4. Interface O2 Storage

The central coupling element between the two usually separately operated technologies for OMP removal on the one hand and electrolysis on the other hand is oxygen storage with upstream O2 treatment.
The necessary inlet pressure for O2 at the ozone generator is at least 6 bar. Depending on the manufacturer, the pressure of the oxygen generated by PEM electrolysis varies from unpressurized to 10 bar (for electrolyzers with an electrical power greater than 500 kW) and up to 30 bar (for electrolyzers with an electrical power less than 500 kW) [45,46]. An O2 outlet pressure of 10 bars was assumed for the electrolysis provided at the Mainz WWTP. 10 bars were chosen because this pressure is easier to handle for manufacturers and more economical prices compared to higher pressures are expected.
The co-product oxygen of the electrolysis will be saturated with water and must be dried before storage. This can be realized with the same technology applied for the drying of hydrogen described in [47]: drying is realized in two steps. A gas-cooling-drying separates a high quantity of water via condensation followed by a temperature change adsorption.
If oxygen is considered to be an ideal gas in the relevant pressure range, the storage volume for the average daily requirement of O2 (basing on 1275 kg/d) will be provided in the form of a storage tank with a volume of 100 m3

4.5. Energetic Situation after Implementation of the Concept

The energetic situation after implementation of the concept and operation of the incineration plant will be influenced by the power consumption of the advanced wastewater treatment step (−1240 MWh/a) as well of the operation of electrolysis (−2146 MWh/a for base load operation powered from onsite PV and CHP; −2229 MWh/a for aFRR operation powered from the grid), and the generation of additional renewable PV power (500 kWp; +500 MWh/a), see Table 4.
The power consumption of only the ozonation step was calculated with 830 MWh/a covering pumping energy, cooling, ozone generation, ozone dosing and residual ozone destruction. Considering the annual wastewater feed flow of this step (17,975,520 m3/a) a specific consumption of 0.046 kWh/m3 is expected. This value is expected fort the future operation-mode, corresponding to the lower ranges of values on energy demand technologies for OMP reduction (0.03–0.2 kWh/m3, depending on the specific conditions) on WWTP presented in [48]. The GACF process for the WWTP Mainz was calculated with 410 MWh/a or 0.023 kWh/m3. In the literature energy consumption for a single operated GACF process is specified to be 0.04 kWh/m3 [48]. Thus, the total energy consumption of 1240 MWhel/a of the combined advanced treatment remains within the scope of the energy demand for single operated ozonation.
The power consumption of electrolysis for the base load operation, fed with surplus CHP power generated from surplus biogas, was calculated with 2146 MWhel/a and for aFRR services with 2229 MWh/a. Thus, electrolysis produced 2975 MWhH2/a of renewable and storable hydrogen each year, whereby one part will be fed into the natural gas grid and another part will be used for mobility purposes (filling station and public transport). The energy consumption for aFRR services was not considered in the balance in Table 4, because the use of energy from the grid was obligatory and could not be replaced by power generated onsite.
This shows that a large part of expected energy surplus in 2020 could be used for two sustainable processes: green hydrogen and oxygen production as well as OMP removal. Both processes will be coupled and operated for the first time together at one location. If the theoretical remaining surplus of 2861 MWhel/a (see Table 4) will be confirmed after implementation of the process, an even more sustainable utilization pathway will be implemented (e.g., additional use in the electrolyzer).

5. Environmental Effects

The implementation of the proposed project will lead to significant environmental improvements:
  • Reduction of OMP discharges,
  • Reduction of standard parameters discharges (total phosphorus (Ptot), total suspended solids (TSS) and chemical oxygen demand (COD)),
  • Supporting the energy transition and,
  • Multilevel reduction of CO2 emissions.

5.1. Environmental Improvements through Improved Water Protection

One central environmental improvement will be the reduction of emissions of OMP. Table 5 presents an estimation of the expected reduction of emissions from substances included in the following substance groups and fields of application:
  • Drugs,
  • X-ray contrast agent,
  • Household chemicals,
  • Personal care and,
  • Others.
Comprehensive experiences from full scale plants for OMP elimination with a combined ozone and GAC process do not exist yet. Thus, the elimination percentages listed in Table 5 are expected to be the minimum eliminations, derived from experiences with one-step OMP treatment plants. It is assumed that these values should normally be exceeded in the context of large-scale implementation in Mainz, especially due to the combination of ozonation with additional GACF. Other studies are proving theses expected eliminations [5,49,50]. Although the values in Table 5 are calculated at the safe side, they show a significant reduction in emissions for a large number of substances, especially for substances occurring in critical concentrations in the Rhine River, such as DCF.
Considering these key substances, a significant reduction of the effluent load can be expected. Table 5 points out, too, that the elimination varies strongly between 10 and 90%, depending on the substance. For some substances CQS are available. For most of those a significant reduction can be achieved, e.g., for the drug substances carbamazepine, diclofenac and ibuprofen. For further OMP, e.g., the origin of household and personal care products, relevant reductions are expected to be between 50 and 80%. Although the complexing agent EDTA was only reduced in the order of 10%, its concentration was far below the proposed CQS value of 2200 µg/L [8].
A downstream installed filter (GACF) step will have positive aspects on the elimination of conventional wastewater constituents, too. The efficient reduction of Ptot and TSS of municipal wastewater effluent by GACF could be shown in [51] with a reduction of up to 85% for Ptot and 75% for TSS. Additionally, COD concentrations can be reduced significantly by a filtration step [52]. Therefore, due to the combined implementation of ozonation and GACF a reduction of the parameters COD, Ptot and TSS is also expected.

5.2. Environmental Improvements through Contributions to the Energy Transition

The implementation of the proposed concept will demonstrate that the transition of the energy system is possible and sector coupling as well as hydrogen play a decisive role. Currently some major problems regarding the energy sector are still unsolved:
  • How can renewable power be stored at a large scale?
  • How do we manage a heat supply system based on renewable energies?
  • How can we realize a proper defossilization in the transport and industry sectors?
  • How can we offer system services for the power grid based on RE?
Electrolysis provides a key answer to these questions. On the one hand, electrolysis enables (green) electricity to be converted into renewable gas and stored in the gas grid over a longer period. The hydrogen can be used in a natural gas–wind gas mixture for cooking and heating. Converted to methane [53], it could even completely replace fossil natural gas. On the other hand, there are diverse applications for hydrogen in the transport and industry sector.
In addition to the innovative provision of oxygen for ozonation, the operation of the electrolyzer enhances the energy transition and reduces the environmental pollution in Mainz:
  • With the amount of hydrogen fed into the NGI at the WWTP, 250 apartments (each 50 m2 living space) could be supplied with renewable heat. In this case, the use of green hydrogen reduces greenhouse gas emissions by 83% compared to the use of fossil natural gas. Furthermore, hydrogen enables long-term storage of electricity.
  • Supplementary to the feed into the NGI, the hydrogen produced at the WWTP can supply four fuel cell buses, saving around 190,000 L of diesel per year. By using green hydrogen in fuel cell buses, greenhouse gas emissions are reduced by 89% compared to a diesel bus.
  • By offering secondary control reserve (aFRR), the electrolyzer contributes to the stability of the local power grid. Thus, conventional and CO2 producing power generation plants are replaced from the national balancing market.
  • By expanding the PV capacity on the WWTP site, less biogas is required in the CHP unit and is saved for other situations. Thereby the overall greenhouse gas balance of the WWTP is improving.

5.3. Environmental Relief through CO2 Reductions

With an assumed feed-in limit for hydrogen of 2 vol.-% of the gas flux, 1240 MWh of hydrogen could be fed into the NGI annually, displacing natural gas and thus avoiding around 200 tCO2e/a (natural gas from steam reforming causes around 202 gCO2e/kWh [54]. The greenhouse gas emissions of the produced hydrogen at the WWTP amount to around 34 gCO2e/kWh H2, considering the electricity supply (renewable electricity, CHP unit based on local biogas and local PV plants), the production of the electrolyzer, the compression of hydrogen and an efficiency of the electrolyzer of 68%). By using the remaining 1735 MWh of hydrogen in fuel cell buses in public transport, another approximately 500 tCO2e/a (calculated greenhouse gas emission for the diesel bus: 166 kgCO2e/100 km and for the fuel cell bus: 17 kgCO2e/100 km. With a consumption of 13 kgH2/100 km [55], four fuel cell buses driving 220 km daily can be used) could be saved in comparison to diesel buses. Additionally, greenhouse gas emissions are avoided through the replacement of conventional power plants for providing control reserve by the electrolyzer. The avoided greenhouse gas emissions through an alternative oxygen supply via air separation should be considered, too. In order to generate one kilogram of oxygen via air separation, approximately 0.3 kWh of electricity is needed [56]. Assuming a supply of grey electricity, the conventional oxygen production would cause approximately 70 tCO2e/a (the amount of oxygen produced: 600 t/a; 400 gCO2e/kWh grey electricity (data set: EL-KW-Park-DE-2020) [57]) [22,37]. Beyond that, by using the local biogas from the WWTP in the CHP unit to provide electricity for the advanced treatment step, a further 500 tCO2e/a (electricity consumption 4th cleaning stage: 1.250 MWh/a and greenhouse gas emissions: 400 gCO2e/kWh grey electricity (data set: EL-KW-Park-DE-2020) [57] 2,3 gCO2e/kWh for electricity from sewer gas (data set: Klärgas-BHKW-GM 200-OxKat-2020/en [57]) can be reduced in comparison to the use of grey electricity from the grid.
Overall, as shown in Figure 7, this results in savings of 1279 tCO2e/a. This corresponds to the annual CO2 storage capacity of around 128 ha of forest (1 ha of forest binds around 10 t CO2 yearly [58]).

6. Techno-Economical Aspects

As shown in Section 2.3 the launch of TVM will change the energy situation at the WWTP Mainz fundamentally: the plant will have a significant amount of surplus of energy. The common renewable power feed of CHP electricity into the public grid is uneconomical for the operator. It would be a losing deal and at the same time it would not be sustainable, due to the loss of flexibility characters of the biogas. These were central aspects for the operator to look for alternative options and a new and more holistic business case.
For the economic evaluation the operation of the electrolyzer and the oxygen storage unit as the central coupling element are considered. The advanced treatment step for OMP removal is neglected, because it is part of the wastewater treatment and will be financed by charges.
If hydrogen is fed directly into the gas grid, hydrogen equates with biogas. For biogas, a market with a higher willingness to pay already exists in Germany. The price for 1 kWh of biogas is actually around €0.06 and varies depending on the quality of the biogas. Depending on the full load hours, the production costs for hydrogen are about 0.15 €/kWh, with an EEG surcharge and network charges up to 0.38 €/kWh [59]. Main driver for the economy of PtG-projects are the operating costs, among them the electricity costs are dominating. Due to the expansion and integration of the local renewable electricity generation in the energy concept of the electrolyzer on the WWTP, the economic advantages of self-supply (mainly reduction of the EEG surcharge) are helping to improve the economic situation. Nonetheless, due to the high hydrogen production costs, the electrolyzer can only be operated economically if the consumer is willing to pay more than the above mentioned 0.06 €/kWh or if appropriate subsidies are given. The energy supplier Greenpeace Energy involved in the project at WWTP Mainz offers a special gas tariff to encourage innovative and energy-transition-supporting concepts with power-to-gas technologies. This tariff includes a premium for each kilowatt-hour of consumed gas. Through this support, the supplier is able to build its own power-to-gas plants and to buy green hydrogen from plants operated by third parties in an energy transition supporting manner [60]. The higher willingness to pay enables the economical operation of these power-to-gas plants and helps to foster the technology.
To avoid blow off situations of parts of the O2 production due to the flexible operation (in the frame of aFRR calls) of the electrolyzer on the one hand and to provide ozonation as high as possible with O2 as the co-product from the electrolyzer, on the other hand, an O2-storage will be installed (see Section 4.4). This will reduce the additional liquid oxygen demand significantly. To guarantee the permanent supply with O2 of the ozone generator a liquid oxygen tank will still be available. By using an oxygen storage tank, the use of external liquid oxygen can be minimized, thus reducing costs in this field. Table 6 shows that by using O2 with an origin from control energy calls (aFRR), the coverage gap can be closed and 17,320 €/a for liquid oxygen can be avoided, when assuming costs for liquid O2 of 0.10 €/kg.
In total 47,000 €/a of costs for liquid oxygen can be saved by utilizing the co-product of electrolysis. These yearly savings can be used to calculate the amortization of the oxygen storage including the pre-treatment. The range of costs for the O2 treatment and storage is indicated for each relevant component in Table 7 based on [37]. In the best case the components amortize in 10.5 years, in the worst case in 14.3 years. This shows the medium-term economic feasibility of this central coupling component of both processes of the presented concept.

7. Discussion and Outlook

Hydrogen and thus electrolysis are a relevant part of a successful progressing energy transition as shown in different studies [3,18,61,62,63]. In early 2019, 95 projects with electrolysis and methanation technologies were active worldwide, most projects were located in Germany, Denmark, the United States and Canada [64]. Actually, the framework conditions, respectively, the regulations in Europe, are not perfectly suited to PtG and are still not promoting a faster rollout. Today most hydrogen projects are pilot projects with lifetimes up to 3 years, depending on funding to cover operating costs or on additional willingness-to-pay of consumers [64]. To improve economic efficiency, it would be beneficial to use all products of the plant: hydrogen or methane, heat and oxygen, but only few projects worldwide address this topic [64]. In the long term, an exponential global increase of PtG projects is expected, which will lead to an enormous reduction of the investment costs from today’s 1.300 €/kW to about 500 €/kW [59,64]. However, in respect to the regulation in Europe, the main driver for the economy of PtG projects is the operating costs, among them particularly the electricity costs. In Germany mainly regulation about the electricity taxes and levies are hindering the economy of an electrolyzer project. According to the EEG 2017, every natural and legal person who consumes electricity is a final consumer. Since an electrolyzer fulfills the criteria for electricity storage or the energy converter, it is considered as a final consumer and is therefore obliged to pay all electricity levies and taxes [65]. Reductions and exemptions only arise in very few cases. Today these costs for state taxes and levies can amount to up to 160 €/MWhel [66]. Solely out of the EEG tax results an amount of 103.94 €/MWhH2 (67.56 €/MWh divided by the efficiency of the electrolyzer of 65%) [67]. Furthermore, there is no European regulation for the certification of hydrogen and for the feed into the European gas grid as well as the cross-border trade of hydrogen.
As described in Section 4 the mode of operation and the power supply mainly influence whether an electrolysis operation is energy-efficient and/or supports the energy transition. This should be considered when designing further funding programs and new regulations for the electrolyzer.
The implementation of an advanced treatment step for the reduction of OMP at WWTP is already regulated in Switzerland and is discussed in many other countries to improve the surface water quality. This additional treatment step will lead to increasing energy consumption (e.g., operation of the new process, oxygen production and AC production/regeneration) onsite or offsite. Plant operators have to decide about the sustainability of this new step.
The combination of both processes offers the opportunity to use synergy effects:
  • Increasing the efficiency of the electrolyzer by using the co-products O2 (for ozonation) and heat (e.g., in the digester of WWTP);
  • Economizing the purchase of liquid O2;
  • Enhancing the energy transition by the expansion and integration of the local renewable energy generation in the energy system of the power-to-gas plants and by optimizing the overall energy management at the WWTP site.
In particular with a view to the mandatory progress made in the energy transition (in the electricity, heating and mobility sectors) in combination with possible nationwide obligations on WWTP to specifically eliminate OMP, the proposed process combination has a model character and might be transferable to numerous other WWTP locations. The economic conditions are likely to improve significantly in the near future, but will not be available at the current time. Therefore, funds are required for an economical operation.
Electrolysis technology is the key technology to defossilize the energy and material cycles and is therefore imperative to achieve the climate protection goals [3]. This also significantly increases the possibility of transferring the concept to other WWTPs.
The energetic environment and boundary conditions are an important aspect of each electrolyzer project. The Mainz site showed rather unfavorable boundary conditions due to the local grid situation. However, despite (currently) missing surplus energy situations, an ecological and energy-transition-supporting operating concept could be developed. Due to the feasibility at such an unfavorable location, transferability is ultimately possible to many other locations. In Germany, this affects 100 large WWTPs with anaerobic sludge stabilization, without an advanced treatment step for the reduction of OMP, and they are still emitting considerable loads of OMP into waters.
The combination of power-to-gas technology and advanced wastewater treatment and the selected process combination for the OMP treatment in this size will be implemented for the first time in full scale on a municipal WWTP and underlines the innovative character of the entire project. With possible stricter requirements for wastewater treatment in the future and an advancing energy transition worldwide, the transferability of this combination of processes has great potential for WWTP in and out of Germany. Therefore, further investigations are needed to develop additional business cases as well as to assess a transferability of the present study results.

Supplementary Materials

The following are available online at https://www.mdpi.com/1996-1073/13/14/3599/s1, Supplementary Materials Data S1: Results of Analysis of Effluent and Influent Samples.

Author Contributions

Conceptualization, O.G., M.S.; methodology, O.G., M.S.; formal analysis, M.S. and O.G.; investigation, M.S., O.G., S.K., K.K., E.P.; data curation, O.G., M.S., S.K., K.K., E.P.; writing—original draft preparation, O.G., M.S., K.K., E.P.; writing—review and editing, M.S., O.G., H.S., K.K., E.P.; visualization, O.G., K.K.; supervision, H.S.; All authors have read and agreed to the published version of the manuscript.

Funding

This research was funded by Wirtschaftsbetrieb Mainz AöR (WBM) of the city of Mainz, Germany.

Acknowledgments

Special thanks to Herbert Hochgürtel (WBM) and his team for helpful suggestions and discussions during the implementation of the feasibility studies as well to the Mainzer Stadtwerke for their support concerning questions around the local power and gas grid. Further, the authors would like to thank the German Federal Ministry for the Environment, Nature Conservation, Building and Nuclear Safety for funding the upcoming realization and the further research on this project, as part of the Environmental Innovation Program, as well as to the Ministry of the Environment, Energy, Food and Forests of the German regional state of Rhineland-Palatinate for its support.

Conflicts of Interest

The authors declare no conflict of interest.

Abbreviations

AA-QSannual average-quality standard AA-QS, chronical quality standard
ACactive carbon
aFRRautomatic frequency restoration reserve—automatic activated reserve as system services for the power grid (secondary control)
Background: the German transmission system operators (TSOs) have to maintain the balance between electricity generation and consumption within the control areas at all times. Therefore, the TSOs need different types of control reserve, which can be divided into three groups:
-
Frequency containment reserve (FCR, also called the primary control reserve):
Automatic and complete activation of the primary control reserve within 30 seconds
-
Frequency restoration reserve with automatic activation (aFRR, also called the secondary control reserve)
complete activation within five minutes (at most)
-
Frequency restoration reserve with manual activation (mFRR):
Complete activation within fifteen minutes
[68]
CO2eEquivalent carbon dioxide
CODchemical oxygen demand
CQSchronical quality standard or annual average-quality standard (AA-QS): “Chronic quality standards are recommended for water quality monitoring. They can be used for assessing pollution over an extended time period. For the continuous input of micropollutants from treated effluents, the chronic quality standard is particularly relevant and helps to protect the organisms against the consequences of long-term pollution.” [8]
DOCdissolved organic carbon
ηelelectrical efficiency
GACgranulated active carbon
GACFgranulated active carbon filter
OMPorganic micropollutant
MWelMegawatt electrical power
NGInatural gas infrastructure
PEpopulation equivalent
PE120PE120 is population equivalent, assuming 120 g of chemical oxygen demand (COD) per PE and per day
Ptottotal phosphorus
PtGPower to Gas
PVphotovoltaic energy generation
Qd,h,maxMaximum hourly wastewater flow during dry weather
RErenewable energies
TOCtotal organic carbon
TSStotal suspended solids
TVMThermische Verwertung Mainz—sludge incineration plant
WWTPwastewater treatment plant

Appendix A. Oxygen and Ozone—Effects of different NO2-N concentrations

The oxygen demand for ozonation depends on different parameters of the treated water. For the determination of the oxygen demand for the planned ozonation at the WWTP Mainz the potential influent of the planned ozonation step (which is the actual effluent of the WTP) was analyzed concerning the following relevant parameters with average concentrations of:
  • DOC = 12.9 mg/L;
  • Nitrite-Nitrogen (NO2-N) = 0.47 mg/L (25% percentile = 0.10 mg/L; 85% percentile = 1.00 mg/L).
Especially elevated nitrite-nitrogen (NO2-N) concentrations can cause an additional demand for ozone. The oxidation of 1 g NO2-N consumes 3.43 g of ozone. The operator and authors expect that the nitrite concentration will be reduced with the operation of a deammonification step in 2020. To show the sensitivity of this parameter, two further NO2-N concentrations were used to quantify the influence on ozone demand.
  • Reduction of NO2-N concentration in the feed by 50% to 0.235 mg/L;
  • Reduction of NO2-N concentration in the feed by 100% to 0.0 mg/L.
If ozonation is operated without a subsequent GACF, usually ozone concentrations are applied in the range of 0.6–0.9 gO3/gDOC [69]. Based on the own experiences of the working group of this study with combined ozone–GACF technology at the experimental scale [70] the following ozone doses were chosen:
  • Maximum concentration: 0.4 gO3/gDOC;
  • Average concentration: 0.2 gO3/gDOC.
The ozone demand resulting from maximum and average flows combined with two different dosing rates and the effect of changing the nitrite concentration is illustrated in the Table A1. The produced gas from the ozone generator contains a mass fraction of 10% ozone (out of 10 kgO2, 1 kgO3 can be generated).
Table A1. Impact of the reduced nitrite-concentration on oxygen and ozone demand in the advanced treatment step for OMP reduction.
Status-Quo−50%
NO2-N
−100%
NO2-N
Unit
necessary ozone dose
feed to advanced treatmentmaximum800.0800.0800.0L/s
average570.0570.0570.0L/s
specific ozone dose with regard to DOCmaximum0.40.40.4g O3/g DOC
average0.20.20.2g O3/g DOC
average feed concentration of DOC12.9412.9412.94mg DOC/L
specific ozone dose with regard to nitrite-nitrogen3.433.433.43g O3/g N
average feed concentration of nitrite0.470.240.00mg NO2-N/L
necessary ozone dosemaximum6.795.985.18mg O3/L
average4.203.392.59mg O3/L
Oxygen demand
spec. oxygen demand for ozone production10.010.010.0mgO2/mgO3
necessary oxygenmaximum195.5172.3149.1kg O2/h
469241353578kg O2/d
average86.269.753.1kg O2/h
2068.51671.51274.5kg O2/d
754,989610,098465,206kg O2/a
Ozone demand
Ozone demandmaximum19.5517.2314.91kg O3/h
average8.626.965.31kg O3/h
Table A2 illustrates the range of a reduction of the oxygen demand due to a reduction of the nitrite concentration in the feed up to 38% compared to the status quo. Compared to the status quo the oxygen demand would be decreased by 290,000 kg/a. The coverage of oxygen demand by the electrolyzer is illustrated for the different nitrite-scenarios in the following table. Considering a complete nitrite reduction, the 1.25 MW electrolyzer would be able to cover approximately 63% of the yearly oxygen demand by its base load power of 20%. For the design of O2 storage (Section 4.4) a zero-nitrite concentration was assumed, which has to be specified in the implementation planning.
Table A2. Oxygen demand and coverage gaps depending on the nitrite concentration in the feed of the ozonation step.
Change in Nitrite-Nitrogen Concentration
Status-Quo−50% NO2-N−100% NO2-NPos
Oxygen demand(kg/a)754,990610,098465,206P1
Oxygen reduction compared to status-quo(kg/a)0144,892289,783P2
Use of oxygen from 20% base-loadOxygen from electrolysis (20% base load)(kg/a)292,000292,000292,000P3
Oxygen coverage gap(kg/a)462,990318,098173,206P4=P1 − P3
Use of total oxygen (including aFRR-calls of the electrolyzerOxygen from electrolysis (from aFRR)(kg/a)307,569307,569307,569P5
thereof need in ozonation(kg/a)307,569307,569173,206P6=P5 (if P5 < P4)
=P4 (if P5 > P4)
remaining oxygen coverage gap(kg/a)155,42110,5290P7=P4 − P6
thereof remaining oxygen surplus(kg/a)00134,363P8=P5 − P6

References

  1. United Nations. The Paris Agreement. Available online: https://unfccc.int/process-and-meetings/the-paris-agreement/the-paris-agreement (accessed on 22 April 2020).
  2. Quaschning, V. Klimaschutz oder Deichbau? Warum wir nicht erst 2038 aus der Kohleverstromung Aussteigen Können. Vortrag beim Energietag Rheinland-Pfalz 2019; Energietag Rheinland-Pfalz. TSB Transferstelle Bingen: Bingen, Germany, 2019. [Google Scholar]
  3. Sterner, M. Power-to-X and Sector Coupling: Setting the Right Legislative Framework for 230 Technology Pathways to Meet the Paris Climate Goals in Germany; IRES International Renewable Energy Storage: Düsseldorf, Germany, 2019. [Google Scholar]
  4. Jose, J.; Sandra Pinto, J.; Kotian, B.; Mathew Thomas, A.; Narayana Charyulu, R. Comparison of the regulatory outline of ecopharmacovigilance of pharmaceuticals in Europe, USA, Japan and Australia. Sci. Total Environ. 2020, 709, 134815. [Google Scholar] [CrossRef] [PubMed]
  5. Penru, Y.; Guillon, A.; Esperanza, M.; Martin, S.; Baig, S.; Miege, C.; Daval, A.; Cretollier, C.; Masson, M.; Coquery, M.; et al. Ozonation: Elimination des Micropolluants / Elimination von Mikroverunreinigungen durch Ozonung. Aqua Gas 2017, 97, 42–49. [Google Scholar]
  6. Peake, B.M.; Braund, R.; Tong, A.Y.C.; Tremblay, L.A. Regulatory Practices to Control the Discharge of Pharmaceuticals into the Environment. The Life-Cycle of Pharmaceuticals in the Environment; Elsevier: Amsterdam, The Netherlands, 2016; pp. 203–228. ISBN 9781907568251. [Google Scholar]
  7. Miarov, O.; Tal, A.; Avisar, D. A critical evaluation of comparative regulatory strategies for monitoring pharmaceuticals in recycled wastewater. J. Environ. Manag. 2020, 254, 109794. [Google Scholar] [CrossRef]
  8. oekotoxzentrum. Proposals for Acute and Chronic Quality Standards. Available online: https://www.ecotoxcentre.ch/expert-service/quality-standards/proposals-for-acute-and-chronic-quality-standards/?_ga=2.53865448.1586158361.1587446765-2105293851.1585640125 (accessed on 21 April 2020).
  9. Gerbersdorf, S.U.; Cimatoribus, C.; Class, H.; Engesser, K.-H.; Helbich, S.; Hollert, H.; Lange, C.; Kranert, M.; Metzger, J.; Nowak, W.; et al. Anthropogenic Trace Compounds (ATCs) in aquatic habitats—Research needs on sources, fate, detection and toxicity to ensure timely elimination strategies and risk management. Environ. Int. 2015, 79, 85–105. [Google Scholar] [CrossRef] [PubMed] [Green Version]
  10. EurEau. Treating Micropollutants at Waste Water Treatment Plants: Experiences and Developments from European Countries. Available online: http://www.eureau.org/resources/briefing-notes/3826-briefing-note-on-treating-micropollutants-at-the-wwtp/file (accessed on 13 May 2020).
  11. Antakyali, D.; Morgenschweis, K.; de Kort, T.; Herbst, H. Micropollutants in the Aquatic Environment and Their Removal in Wastewater Treatment Works: 9th European Waste Water Management Conference & Exhibition 12–13 October, Manchester Town Hall. Available online: https://www.researchgate.net/publication/312879251_MICROPOLLUTANTS_IN_THE_AQUATIC_ENVIRONMENT_AND_THEIR_REMOVAL_IN_WASTEWATER_TREATMENT_WORKS (accessed on 17 May 2020).
  12. Metz, F. (Ed.) From Network Structure to Policy Design in Water Protection. A Comparative Perspective on Micropollutants in the Rhine River Riparian Countries; Springer International Publishing: Cham, Switzerland, 2017; ISBN 978-3-319-55693-2. [Google Scholar]
  13. Siegrist, H.; Joss, A.; Boehler, M.; McArdell, C.S.; Ternes, T. Organic micropollutant control. In Advances in Wastewater Treatment; Mannina, G., Ekama, G., Ødegaard, H., Olsson, G., Eds.; IWA Publishing: London, UK, 2019. [Google Scholar]
  14. BMU/UBA. Ergebnispapier—Ergebnisse der Phase 2 des Stakeholder-Dialogs »Spurenstoffstrategie des Bundes« zur Umsetzung von Maßnahmen für die Reduktion von Spurenstoffeinträgen in die Gewässer. 2019. Available online: https://www.bmu.de/download/ergebnisse-der-phase-2-des-stakeholder-dialogs-spurenstoffstrategie-des-bundes/ (accessed on 9 July 2020).
  15. VSA. Projekte mit Ozon. VSA-Plattform “Verfahrenstechnik Mikroverunreinigungen”. 2019. Available online: https://www.micropoll.ch/anlagen-projekte/ozon/ (accessed on 28 February 2019).
  16. IRENA. Renewable Capacity Statistics 2020. Available online: https://www.irena.org/publications/2020/Mar/Renewable-Capacity-Statistics-2020 (accessed on 6 April 2020).
  17. IRENA. Renewable Capacity Highlights. Available online: https://www.irena.org/-/media/Files/IRENA/Agency/Publication/2020/Mar/IRENA_RE_Capacity_Highlights_2020.pdf?la=en&hash=B6BDF8C3306D271327729B9F9C9AF5F1274FE30B (accessed on 31 March 2020).
  18. Sterner, M.; Stadler, I. Handbook of Energy Storage. Demand, Technologies, Integration; Springer Berlin: Berlin, Germany, 2018; ISBN 978-3-662-55504-0. [Google Scholar]
  19. Schäfer, M.; Gretzschel, O.; Steinmetz, H. The Possible Roles of Wastewater Treatment Plants in Sector Coupling. Energies 2020, 13, 2088. [Google Scholar] [CrossRef] [Green Version]
  20. Schäfer, M. Short-term flexibility for energy grids provided by wastewater treatment plants with anaerobic sludge digestion. Water Sci. Technol. 2019. [Google Scholar] [CrossRef] [PubMed]
  21. Schmitt, T.G.; Gretzschel, O.; Schäfer, M.; Hüesker, F.; Salomon, D.; Bidlingmaier, A.; Zdrallek, M.; Kornrumpf, T.; Simon, R.; Hanke, B.; et al. Abwasserreinigungsanlagen als Regelbaustein in intelligenten Verteilnetzen mit Erneuerbarer Energieerzeugung—Arrivee. Schlussbericht Arrivee. 2017. Available online: http://edok01.tib.uni-hannover.de/edoks/e01fb17/899010695.pdf (accessed on 13 December 2017).
  22. Steinmetz, H.; Schmitt, T.G.; Schäfer, M.; Gretzschel, O.; Krieger, S.; Alt, K.; Zydorczyk, S.; Bender, V.; Pick, E. Konzeptstudie—Klimafreundliche und ressourceneffiziente Anwendung der Wasserelektrolyse zur Erzeugung von regenerativen Speichergasen kombiniert mit einer weitergehenden Abwasserbehandlung zur Mikroschadstoffelimination auf Kläranlagen—Arrived. Studie im Auftrag der Wirtschaftsbetriebe Mainz (Unpublished); Final Report; Tectraa an der TU Kaiserslautern: Kaiserslautern, Germany, 2018. [Google Scholar]
  23. Rößler, A.; Rau, W.; Metzger, S. Vorkommen von Spurenstoffen in Kläranlagenzuläufen in Baden-Württemberg. Wasser und Abfall 2018, 40–49. Available online: https://koms-bw.de/cms/content/media/Vorkommen%20von%20Spurenstoffen%20in%20Klaeranlagenzulaeufen%20in%20BW.pdf (accessed on 9 July 2020).
  24. Schmitt, T.G.; Knerr, H.; Gretzschel, O.; Kolisch, G.; Taudien, Y. Relevanz, Möglichkeiten und Kosten einer Elimination von Mikroschadstoffen auf kommunalen Kläranlagen in Rheinland-Pfalz, aufgezeigt am Beispiel der Nahe— Mikro_N. Studie im Auftrag des Ministeriums für Umwelt, Landwirtschaft, Ernährung, Weinbau und Forsten (MULEWF) des Landes Rhein-land-Pfalz, Deutschland. 2016. Available online: https://wasser.rlp-umwelt.de/servlet/is/1130/ (accessed on 21 August 2018).
  25. Vieno, N.; Sillanpää, M. Fate of diclofenac in municipal wastewater treatment plant—A review. Environ. Int. 2014, 69, 28–39. [Google Scholar] [CrossRef]
  26. Sathishkumar, P.; Meena, R.A.A.; Palanisami, T.; Ashokkumar, V.; Palvannan, T.; Gu, F.L. Occurrence, interactive effects and ecological risk of diclofenac in environmental compartments and biota—A review. Sci. Total Environ. 2020, 698, 134057. [Google Scholar] [CrossRef]
  27. Zhang, Y.; Geissen, S.-U.; Gal, C. Carbamazepine and diclofenac: Removal in wastewater treatment plants and occurrence in water bodies. Chemosphere 2008, 73, 1151–1161. [Google Scholar] [CrossRef]
  28. Umweltbundesamt. ETOX: Informationssystem Ökotoxikologie und Umweltqualitätsziele. Available online: https://webetox.uba.de/webETOX/public/search/ziel/open.do (accessed on 11 September 2018).
  29. ICSR/IKSR. Micropollutants in the Rhine Catchment Area/Mikroverunreinigungen im Rheineinzugsgebiet Bilanz 2017: Bericht Nr. International Commission for the Protection of the Rhine (ICPR). Available online: https://www.iksr.org/en/public-relations/documents/archive/technical-reports/reports-and-brochures-individual-presentation?tx_news_pi1%5Baction%5D=detail&tx_news_pi1%5Bcontroller%5D=News&tx_news_pi1%5Bnews%5D=527&cHash=7ec1cb6e82a0271e9bf7caa6b7dab3f8 (accessed on 10 April 2018).
  30. Angerbauer, F. Spurenstoffmessung im Rhein an der Messstelle Mainz—Ergebnisse 2010. Personal communication via E-Mail, 2019. [Google Scholar]
  31. DWA (Ed.) Energiecheck und Energieanalyse. Instrumente zur Energieoptimierung von Abwasseranlagen; DWA: Hennef, Germany, 2015; ISBN 978-3-88721-276-6. [Google Scholar]
  32. DWA. Anthropogene Spurenstoffe, Krankheitserreger und Antibiotikaresistenzen im Wasserkreislauf. 2017. Available online: https://de.dwa.de/files/_media/content/01_DIE%20DWA/Forschung%20und%20Innovation/Anthropogene_Spurenstoffe_Krankheitserreger_TransRisk_Druckfassung_komprimiert-20170130.pdf (accessed on 21 February 2019).
  33. Böhler, M.; Blunschi, M.; Czekalski, N.; Fleiner, J.; Kienle, C.; Langer, M.; McArdell, C.S.; Teichler, R.; Siegrist, H. Biologische Nachbehandlung von kommunalem Abwasser nach Ozonung—ReTREAT. Abschlussbericht für das Bundesamt für Umwelt (Bafu) im Rahmen eines Projektes der Technologieförderung. 2017. Available online: http://www.oekotoxzentrum.ch/media/182953/2017_boehler_retreat_schlussbericht.pdf (accessed on 9 July 2020).
  34. Östman, M.; Björlenius, B.; Fick, J.; Tysklind, M. Effect of full-scale ozonation and pilot-scale granular activated carbon on the removal of biocides, antimycotics and antibiotics in a sewage treatment plant. Sci. Total Environ. 2019, 649, 1117–1123. [Google Scholar] [CrossRef]
  35. Rödel, S.; Günthert, W.; Christ, O.; Miller, E.; Schatz, R.; Zech, T.; Bleisteiner, S.; Eßlinger, M.; Sengl, M.; Rehbein, V.; et al. Erfahrungen und Ergebnisse aus dem Betrieb der vierten Reinigungsstufe in Weißenburg: Teil 1: Untersuchungsprogramm und Ergebnisse. KA Korrespondenz Abwasser Abfall 2019, 66, 200–209. [Google Scholar]
  36. Baresel, C.; Ek, M.; Ejhed, H.; Allard, A.-S.; Magnér, J.; Dahlgren, L.; Westling, K.; Wahlberg, C.; Fortkamp, U.; Söhr, S.; et al. Sustainable treatment systems for removal of pharmaceutical residues and other priority persistent substances. Water Sci. Technol. 2019, 79, 537–543. [Google Scholar] [CrossRef] [PubMed]
  37. Steinmetz, H.; Schmitt, T.G.; Schäfer, M.; Gretzschel, O.; Krieger, S.; Alt, K.; Zydorczyk, S.; Bender, V.; Pick, E. Ergänzende Betrachtungen zur Konzeptstudie „arrived“ Vorzugsvariante-. Studie im Auftrag der Wirtschaftsbetriebe Mainz (Unpublished); Final Report; Tectraa an der TU Kaiserslautern: Kaiserslautern, Germany, 2019. [Google Scholar]
  38. Müller-Syring, G.; Henel, M.; Köppel, W.; Sterner, M.; Höcher, T. Entwicklung von modularen Konzepten zur Erzeugung, Speicherung und Einspeisung von Wasserstoff und Methan ins Erdgasnetz. Abschlussbericht—DVGW-Förderzeichen G 1-07-10; DVGW Forschung: 2013. Available online: https://www.dvgw.de/medien/dvgw/forschung/berichte/g1_07_10.pdf (accessed on 9 July 2020).
  39. Ateş, A. Cost of Reducing Micropollutant Load from Urban Wastewater Treatment Plants in Turkey. 2019. Available online: http://etd.lib.metu.edu.tr/upload/12625042/index.pdf (accessed on 17 May 2020).
  40. Austermann-Haun, U.; Meier, J.F.; Nahrstedt, A.; Sikorski, D.; Kuhlmann, S.; Alt, K. Spurenstoffelimination auf der Kläranlage Detmold mittels der Kombination von Ozon mit nachgeschalteter Aktivkohlefiltration. Abschlussbericht, gerichtet an das Ministerium für Klimaschutz, Umwelt, Landwirtschaft, Natur- und Verbraucherschutz des Landes Nordrhein-Westfalen. 2017. Available online: https://www.lanuv.nrw.de/fileadmin/forschung/170815_Pilotvorhaben%20Detmold/O-01-12-DT-Spurenstoffelimination-KA-DT_Abschlussbericht.pdf (accessed on 12 October 2018).
  41. Gretzschel, O.; Schäfer, M.; Steinmetz, H.; Schmitt, T.G. Combined Implementation of Power-to-Gas and Elimination of Micropollutants—A Feasibility Study for WWTP Mainz. In Proceedings of the 13th International Renewable Energy Storage Conference (IRES 2019), Düsseldorf, Germany, 12–14 March 2019. [Google Scholar]
  42. Bhandari, R.; Trudewind, C.A.; Zapp, P. Life cycle assessment of hydrogen production via electrolysis—A review. J. Clean. Prod. 2014, 85, 151–163. [Google Scholar] [CrossRef]
  43. Huneke, F.; Linkenheil, C.P.; Niggemeier, M.-L. Kalte Dunkelflaute: Robustheit des Stromsystems bei Extremwetter. Available online: https://www.energybrainpool.com/fileadmin/download/Studien/Studie_2017-06-26_GPE_Studie_Kalte-Dunkelflaute_Energy-Brainpool.pdf (accessed on 4 May 2020).
  44. Sterner, M.; Stadler, I. Energiespeicher-Bedarf, Technologien, Integration, Auflage; Springer: Berlin/Heidelberg, Germany, 2017. [Google Scholar]
  45. h2agentur. Wasserstoff zur Speicherung Erneuerbarer Energie: PEM-Elektrolyseure. Available online: https://h2agentur.de/elektrolyseure/ (accessed on 11 May 2020).
  46. h2agentur. Pressure of the Oxygen Generated by PEM Electrolysis, Personal Confirmation by Phone from h2agentur to Stefan Krieger Hydroingenieure, Kaiserslautern, Germany: 2019.
  47. Tjarks, G. PEM-Elektrolyse-Systeme zur Anwendung in Power-to-Gas Anlagen; Forschungszentrum Jülich GmbH, Zentralbibliothek: Jülich, Germany, 2017; ISBN 978-3-95806-217-7. [Google Scholar]
  48. Mousel, D.; Palmowski, L.; Pinnekamp, J. Energy demand for elimination of organic micropollutants in municipal wastewater treatment plants. Sci. Total Environ. 2017, 575, 1139–1149. [Google Scholar] [CrossRef]
  49. Pinnekamp, J.; Bolle, F.-W.; Palmowski, L.; Veltmann, K.; Mousel, D.; Mauer, C.; Eckers, S. Energiebedarf von Verfahren zur Elimination von organischen Spurenstoffen. Abschlussbericht zum gleichnamigen Forschungsprojekt, gefördert durch das Ministerium für Klimaschutz, Umwelt, Landwirtschaft, Natur- und Verbraucherschutz des Landes Nordrhein-Westfalen (MKULNV). 2011. Available online: http://www.lanuv.nrw.de/wasser/abwasser/forschung/pdf/Abschlussbericht_ENVELOS.pdf (accessed on 28 September 2012).
  50. Hillenbrand, T.; Tettenborn, F.; Fuchs, S.; Tochovski, S.; Metzger, S.; Tjoeng, I.; Wermter, P.; Kersting, M.; Hecht, D.; WErbeck, N.; et al. Maßnahmen zur Verminderung des Eintrages von Mikroschadstoffen in die Gewässer—Phase 2. Available online: https://www.umweltbundesamt.de/sites/default/files/medien/377/publikationen/mikroschadstoffen_in_die_gewasser-phase_2.pdf (accessed on 9 July 2020).
  51. Altmann, J.; Rehfeld, D.; Träder, K.; Sperlich, A.; Jekel, M. Combination of granular activated carbon adsorption and deep-bed filtration as a single advanced wastewater treatment step for organic micropollutant and phosphorus removal. Water Res. 2016, 92, 131–139. [Google Scholar] [CrossRef]
  52. Hamoda, M.F.; Al-Ghusain, I.; Al-Mutairi, N.Z. Sand filtration of wastewater for tertiary treatment and water reuse. Desalination 2004, 164, 203–211. [Google Scholar] [CrossRef]
  53. Lardon, L.; Thorberg, D.; Krosgaard, L. Biogas valorization and efficient energy management—Technical and economic analysis of biological methanation. POWERSTEP Deliverable D 3. In Powerstep: Your Flush, Our Energy; Kompetenzzentrum, W.B., Ed.; Kompetenzzentrum Wasser Berlin: Berlin, Germany, 2018; Available online: http://powerstep.eu/system/files/generated/files/resource/d3-2-technical-and-economic-analysis-of-biological-methanationdeliverable.pdf (accessed on 16 March 2020).
  54. Juhrich, K. CO2-Emissionsfaktoren für Fossile Brennstoffe. Available online: https://www.umweltbundesamt.de/publikationen/co2-emissionsfaktoren-fuer-fossile-brennstoffe (accessed on 14 January 2019).
  55. Koch, F. E-Busse mit Brennstoffzelle—Europäische Markteinführungsinitiative; EnergieAgentur NRW: Aachen, Germany, 2016. [Google Scholar]
  56. Eichhammer, W.; Fleiter, T.; Schlomann, B. Energieverbrauch und CO2-Emissionen industrieller Prozesstechnologien. Einsparpotenziale, Hemmnisse und Instrumente; Fraunhofer-Verl.: Stuttgart, Germany, 2013; Available online: https://www.isi.fraunhofer.de/content/dam/isi/dokumente/ccx/2013/Umweltforschungsplan_FKZ-370946130.pdf (accessed on 9 July 2020).
  57. UBA. ProBas-Prozessorientierte Basisdaten für Umweltmanagementsysteme. Available online: http://www.probas.umweltbundesamt.de/php/index.php (accessed on 17 December 2018).
  58. Schutzgemeinschaft Deutscher Wald, S.D.W. Was leistet der Wald für uns? Available online: https://www.sdw.de/waldwissen/oekosystem-wald/waldleistungen/index.html (accessed on 4 May 2020).
  59. Huneke, F. Auf dem Weg in die Wettbewerbsfähigkeit: Elektrolysegase erneuerbaren Ursprungs. 2018. Available online: https://www.energybrainpool.com/fileadmin/download/Studien/Kurzanalyse_2018-03-19_GPE_Kurzanalyse_Kostenentwicklung-von-Elektrolysegas-erneuerbaren-Ursprungs.pdf (accessed on 5 May 2020).
  60. Greenpeace Energy. Unser Windgas im Detail. Available online: https://www.greenpeace-energy.de/privatkunden/oekogas/unser-windgas-im-detail.html (accessed on 18 May 2020).
  61. Parra, D.; Zhang, X.; Bauer, C.; Patel, M.K. An integrated techno-economic and life cycle environmental assessment of power-to-gas systems. Appl. Energy 2017, 193, 440–454. [Google Scholar] [CrossRef]
  62. Blanco, H.; Faaij, A. A review at the role of storage in energy systems with a focus on Power to Gas and long-term storage. Renew. Sustain. Energy Rev. 2018, 81, 1049–1086. [Google Scholar] [CrossRef]
  63. Eveloy, V.; Gebreegziabher, T. A Review of Projected Power-to-Gas Deployment Scenarios. Energies 2018, 11, 1824. [Google Scholar] [CrossRef] [Green Version]
  64. Thema, M.; Bauer, F.; Sterner, M. Power-to-Gas: Electrolysis and methanation status review. Renew. Sustain. Energy Rev. 2019, 112, 775–787. [Google Scholar] [CrossRef]
  65. Erneuerbare-Energien-Gesetz—EEG 2017/Renewable Energy Sources Act. (EEG 2017). EEG. 2020. Available online: https://www.bmwi.de/Redaktion/DE/Downloads/E/eeg-2017-gesetz-en.pdf?__blob=publicationFile&v=8 (accessed on 19 May 2020).
  66. BDEW. BDEW-Strompreisanalyse 2020. Available online: https://www.bdew.de/energie/strom-und-gaspreisanalysen/ (accessed on 18 May 2020).
  67. 50Hertz Transmission GmbH, Amprion GmbH, TransnetBW GmbH, Tennet TSO GmbH. EEG-Umlage. Available online: https://www.netztransparenz.de/EEG/EEG-Umlagen-Uebersicht (accessed on 19 May 2020).
  68. regelleistung.net. Balancing Market in Germany. Available online: https://www.regelleistung.net/ext/static/market-information?lang=en (accessed on 29 June 2020).
  69. Bui, X.T.; Vo, T.P.T.; Ngo, H.H.; Guo, W.S.; Nguyen, T.T. Multicriteria assessment of advanced treatment technologies for micropollutants removal at large-scale applications. Sci. Total Environ. 2016, 563–564, 1050–1067. [Google Scholar] [CrossRef] [PubMed]
  70. Alt, K. Umnutzung vorhandener Flockungsfiltrationsanlagen zu Aktivkohle- und Ozonanlagen; 50 Jahre Oswald-Schulze Stiftung; Technische Innovationen in der Abwasserreinigung: Münster, Germany, 2018. [Google Scholar]
Figure 1. Simplified flow chart of the wastewater treatment plant (WWTP) Mainz.
Energies 13 03599 g001
Figure 2. Micropollutant concentrations at WWTP Mainz compared to results from other WWTP: (a) Inflow values of WWTP Mainz compared to results in [23] and (b) effluent values of WWTP Mainz compared to values in [24] complemented by chronic quality standard (CQS)-values.
Energies 13 03599 g002
Figure 3. Concentrations of the analgetic diclofenac in the Rhine River [30].
Energies 13 03599 g003
Figure 4. Process chain of the “arrived” project.
Energies 13 03599 g004
Figure 5. Aerial view of WWTP Mainz (www.geoportal.rlp.de; “Data license Germany—attribution—Version 2.0” referring to the license text available at www.govdata.de/dl-de/by-2-0; left side) and extract of a side plan with the new system components (right side) [41].
Energies 13 03599 g005
Figure 6. Example of electricity consumption for the electrolyzer in a summer week [41].
Energies 13 03599 g006
Figure 7. Annual savings in greenhouse gas emissions through the use of electrolysis after implementation of the project in comparison to conventional power use [41].
Energies 13 03599 g007
Table 1. Energetic situation based on annual average values of the WWTP Mainz before and after the start of operation of the sludge incineration plant.
Energies 13 03599 i001
1: calculated on the basis of a heating value of biogas of 6.1 kWh/m3; 2: calculated on the basis of the biogas amount and an electrical efficiency of the combined heat and power plant (CHP) unit with 38.5% and a heating value of biogas of 6.1 kWh/m3; 3: electrical surplus power of TVM after electrical supply of internal TVM processes (including dewatering of sludge). 4: calculated on the basis of an electrical efficiency of the CHP unit with 38.5%.
Table 2. Characteristics and performance data of the 1.25 MW electrolyzer.
CharacteristicsAmountUnit
Power1.25MW
Hours of operation 20% band8585h/a
Full load hours3500h/a
O2 production (20% band)292,000kg/a
O2 production (aFRR)307,569kg/a
Total O2 production599,569kg/a
H2 production2975MWh/a
Table 3. Oxygen requirement of the advanced treatment for OMP reduction.
AmountUnit
specific oxygen demand for ozone production10.0mgO2/mgO3
maximum required amount of oxygen149.1kg O2/h
average required amount of oxygen53.1kg O2/h
Table 4. Simplified energetic situation based on the annual average values of the WWTP Mainz before and after the start of the operation of the sludge incineration plant and the implementation of the innovative concept.
Energies 13 03599 i002
1 Not included in the balance, due to linkage to external energy market situation; 2 calculated on the basis of a heating value of biogas of 6,1 kWh/m3; 3 electrical surplus power of TVM after electrical supply of internal TVM-processes (including dewatering of sludge).
Table 5. Assessment of the environmental relief through implementation of the advanced treatment for OMP removal at WWTP Mainz (elimination values based on experiences from full-scale WWTPs with the single stage OMP treatment).
SubstanceSubstance Group/Field of ApplicationSpecificationElimination by Advanced Treatment [%] 1Average Effluent Concentration n = 5 [µg/L]Dry Weather Runoff 2017 [Mio m3/a]Calculated Emission Load Status Quo (kg/a)Reduction of Emission Load in (kg/a) with 4th Treatment StageCQS ([µg/L) 4
Carbamazepinedruganti-epileptic900.4515.597.046.32.00
Diclofenacanti-inflammatory902.3415.5936.4732.80.05
Ibuprofenanti-inflammatory800.2215.593.422.70.11
Metoprololbeta blockers501.7115.5926.6913.38.60
Sulfamethoxazoleantibiotics900.2915.594.464.00.60
Amidotrizoic acidX-ray contrast agentX-ray contrast agent102.7615.5943.024.3- 5
IomeprolX-ray contrast agent5075.8015.591,181.41590.7-
Perfluoroctane sulfonic acid (PFOS)household chemicalsfluorosurfactant500.046 215.590.720.70.022
Perfluorooctance acid (PFOA)fluorosurfactant500.010 215.590.140.1-
Terbutrynherbicide800.044 215.590.690.50.065
HHCBpersonal caresynthetic fragrances900.5415.598.487.6-
Triclosandisinfectant800.046 315.590.720.50.11
EDTAotherscomplexing agent1096.0015.591496.24149.62200
1 Elimination quantity is assumed to be conservative and is based on the elimination of other studies such as [5,49,50]; 2 based on 2 effluent samples; 3 based on 1 effluent sample; 4 CQS values taken from [8]; 5 no CQS value available.
Table 6. Oxygen demand and avoided costs depending on the “source” of oxygen.
OxygenUnitAvoided Costs for Liquid O2 1Unit
Oxygen demand for ozone production:465,206kgO2/a
Oxygen production by 20%-load of electrolyzer:292,000kgO2/a29,200€/a
Resulting coverage gap:173,206kgO2/a
Oxygen production by control energy calls (aFRR):307,569kgO2/a
Usable to close coverage gap:173,206kgO2/a17,320€/a
1 Costs for liquid oxygen 0.10 €/kg.
Table 7. Ranges of gross costs of the components for oxygen storage and treatment.
CostsUnit
O2 dryer180,000–264,000
Compressor80,000–131,000
O2 storage (100 m3)170,000–220,000
Pressure reduction66,000
Set gross costs(496,000)–681,000

