Characteristics of Flame Stability and Gaseous Emission of Bio-Crude Oil from Coffee Ground in a Pilot-Scale Spray Burner


Abstract
:
1. Introduction
2. Materials and Methods
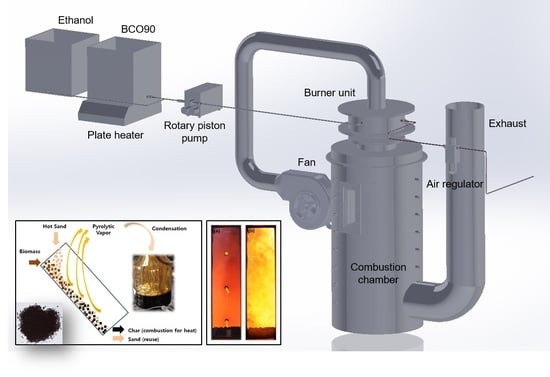
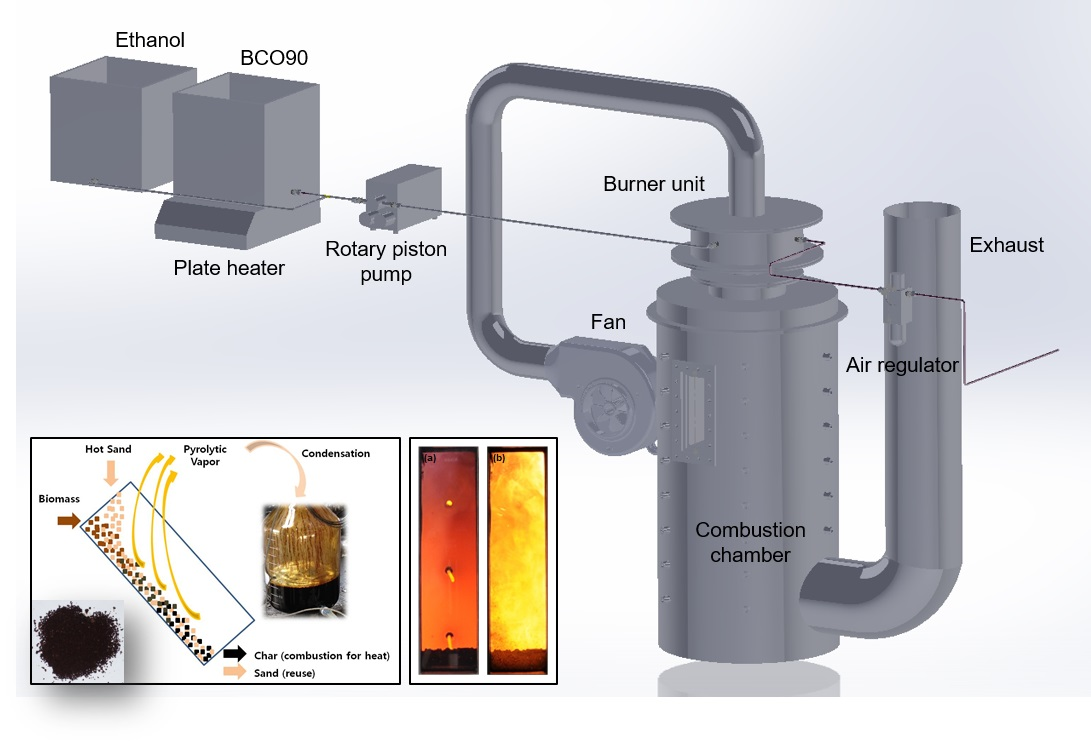
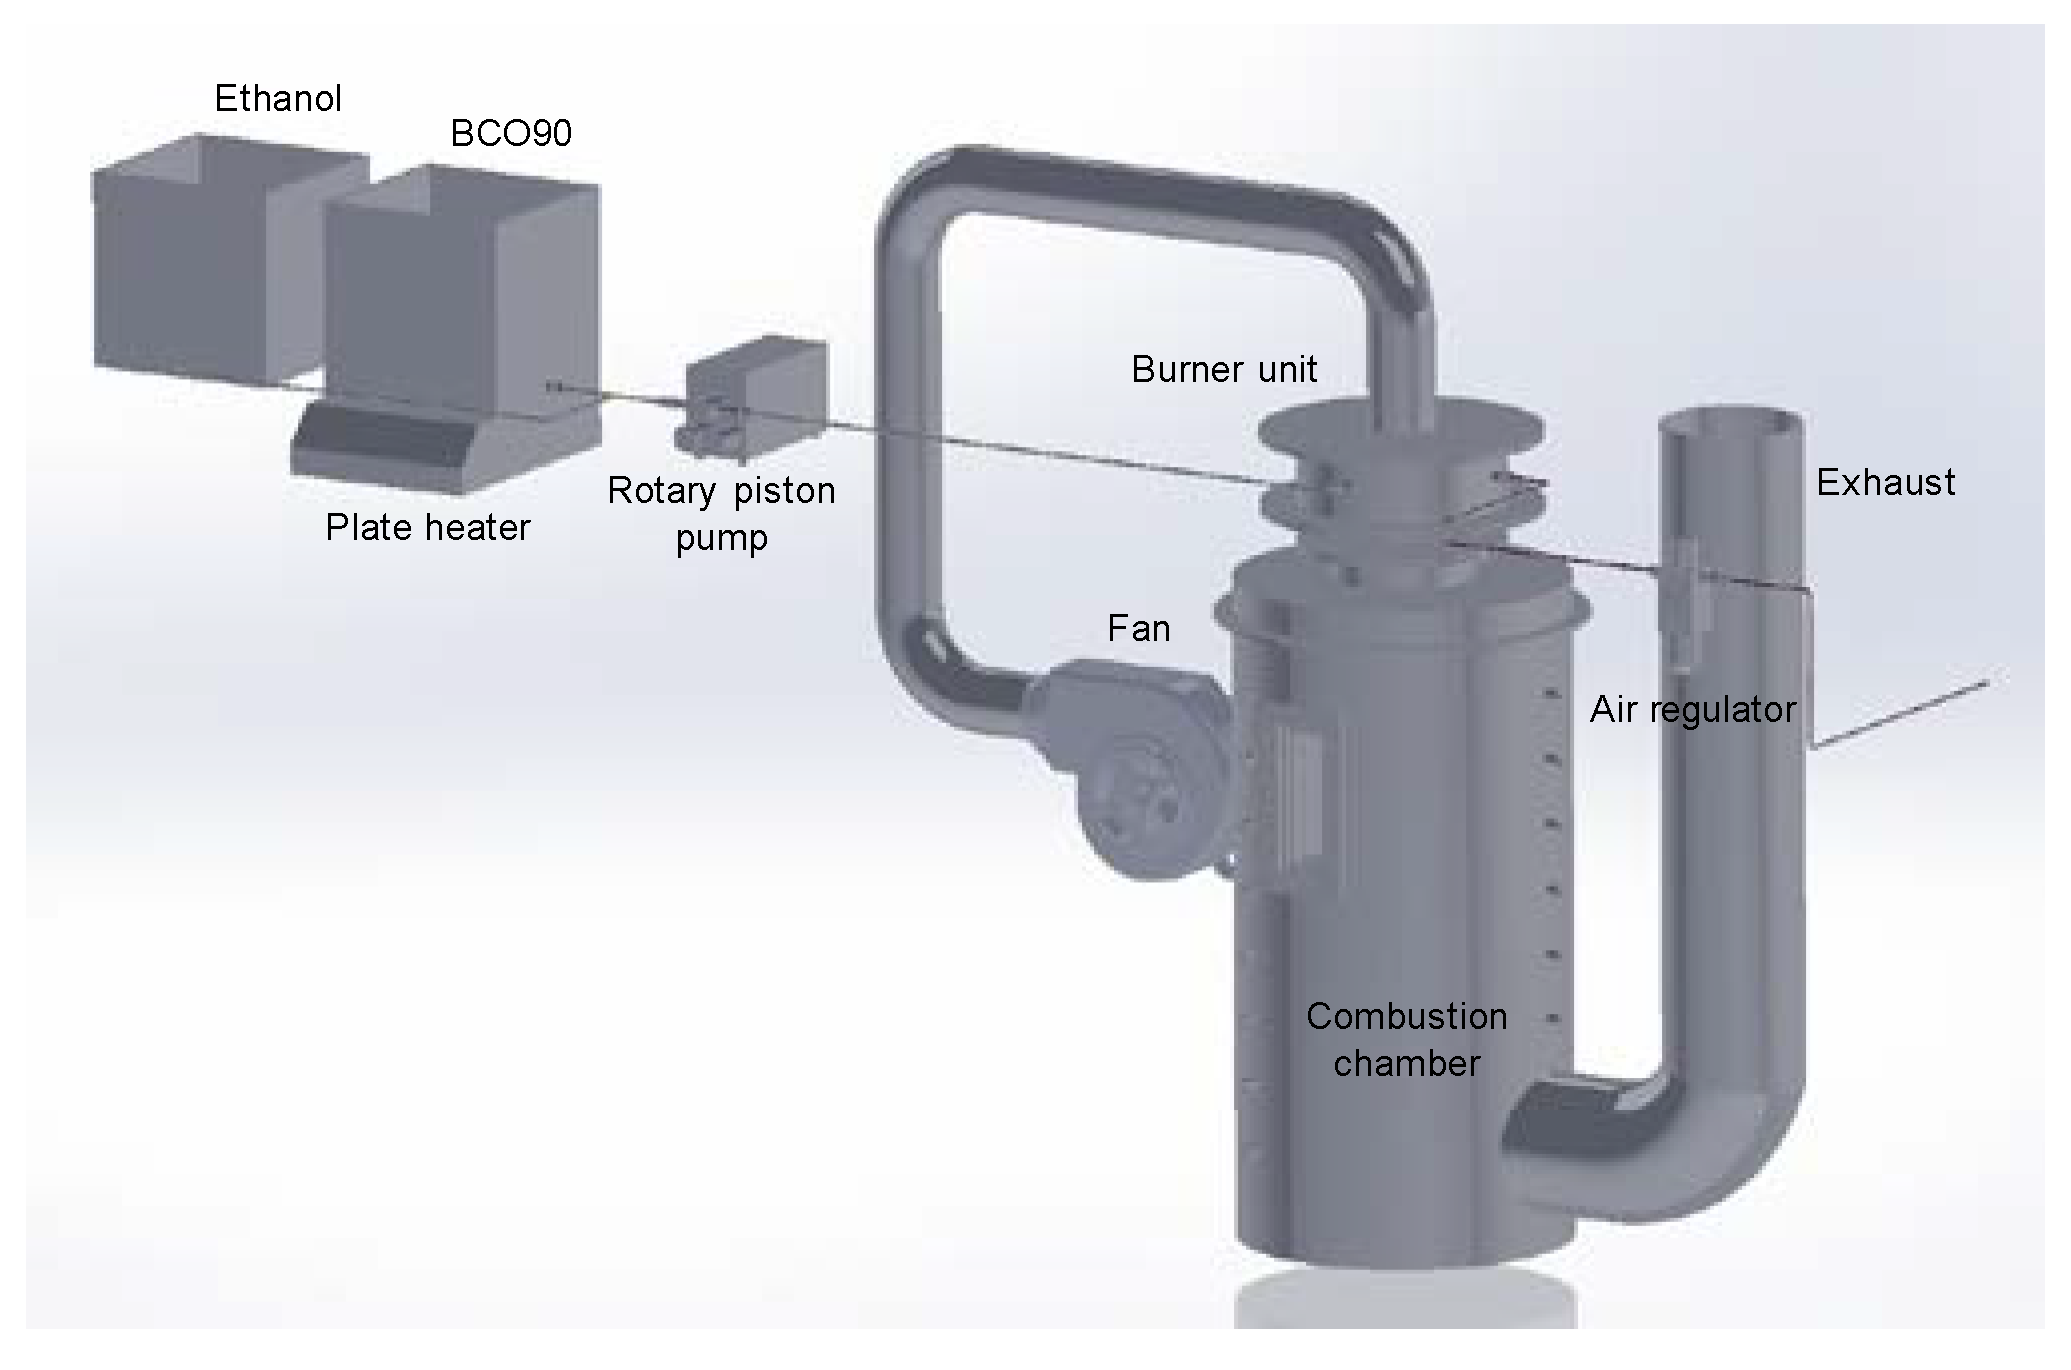
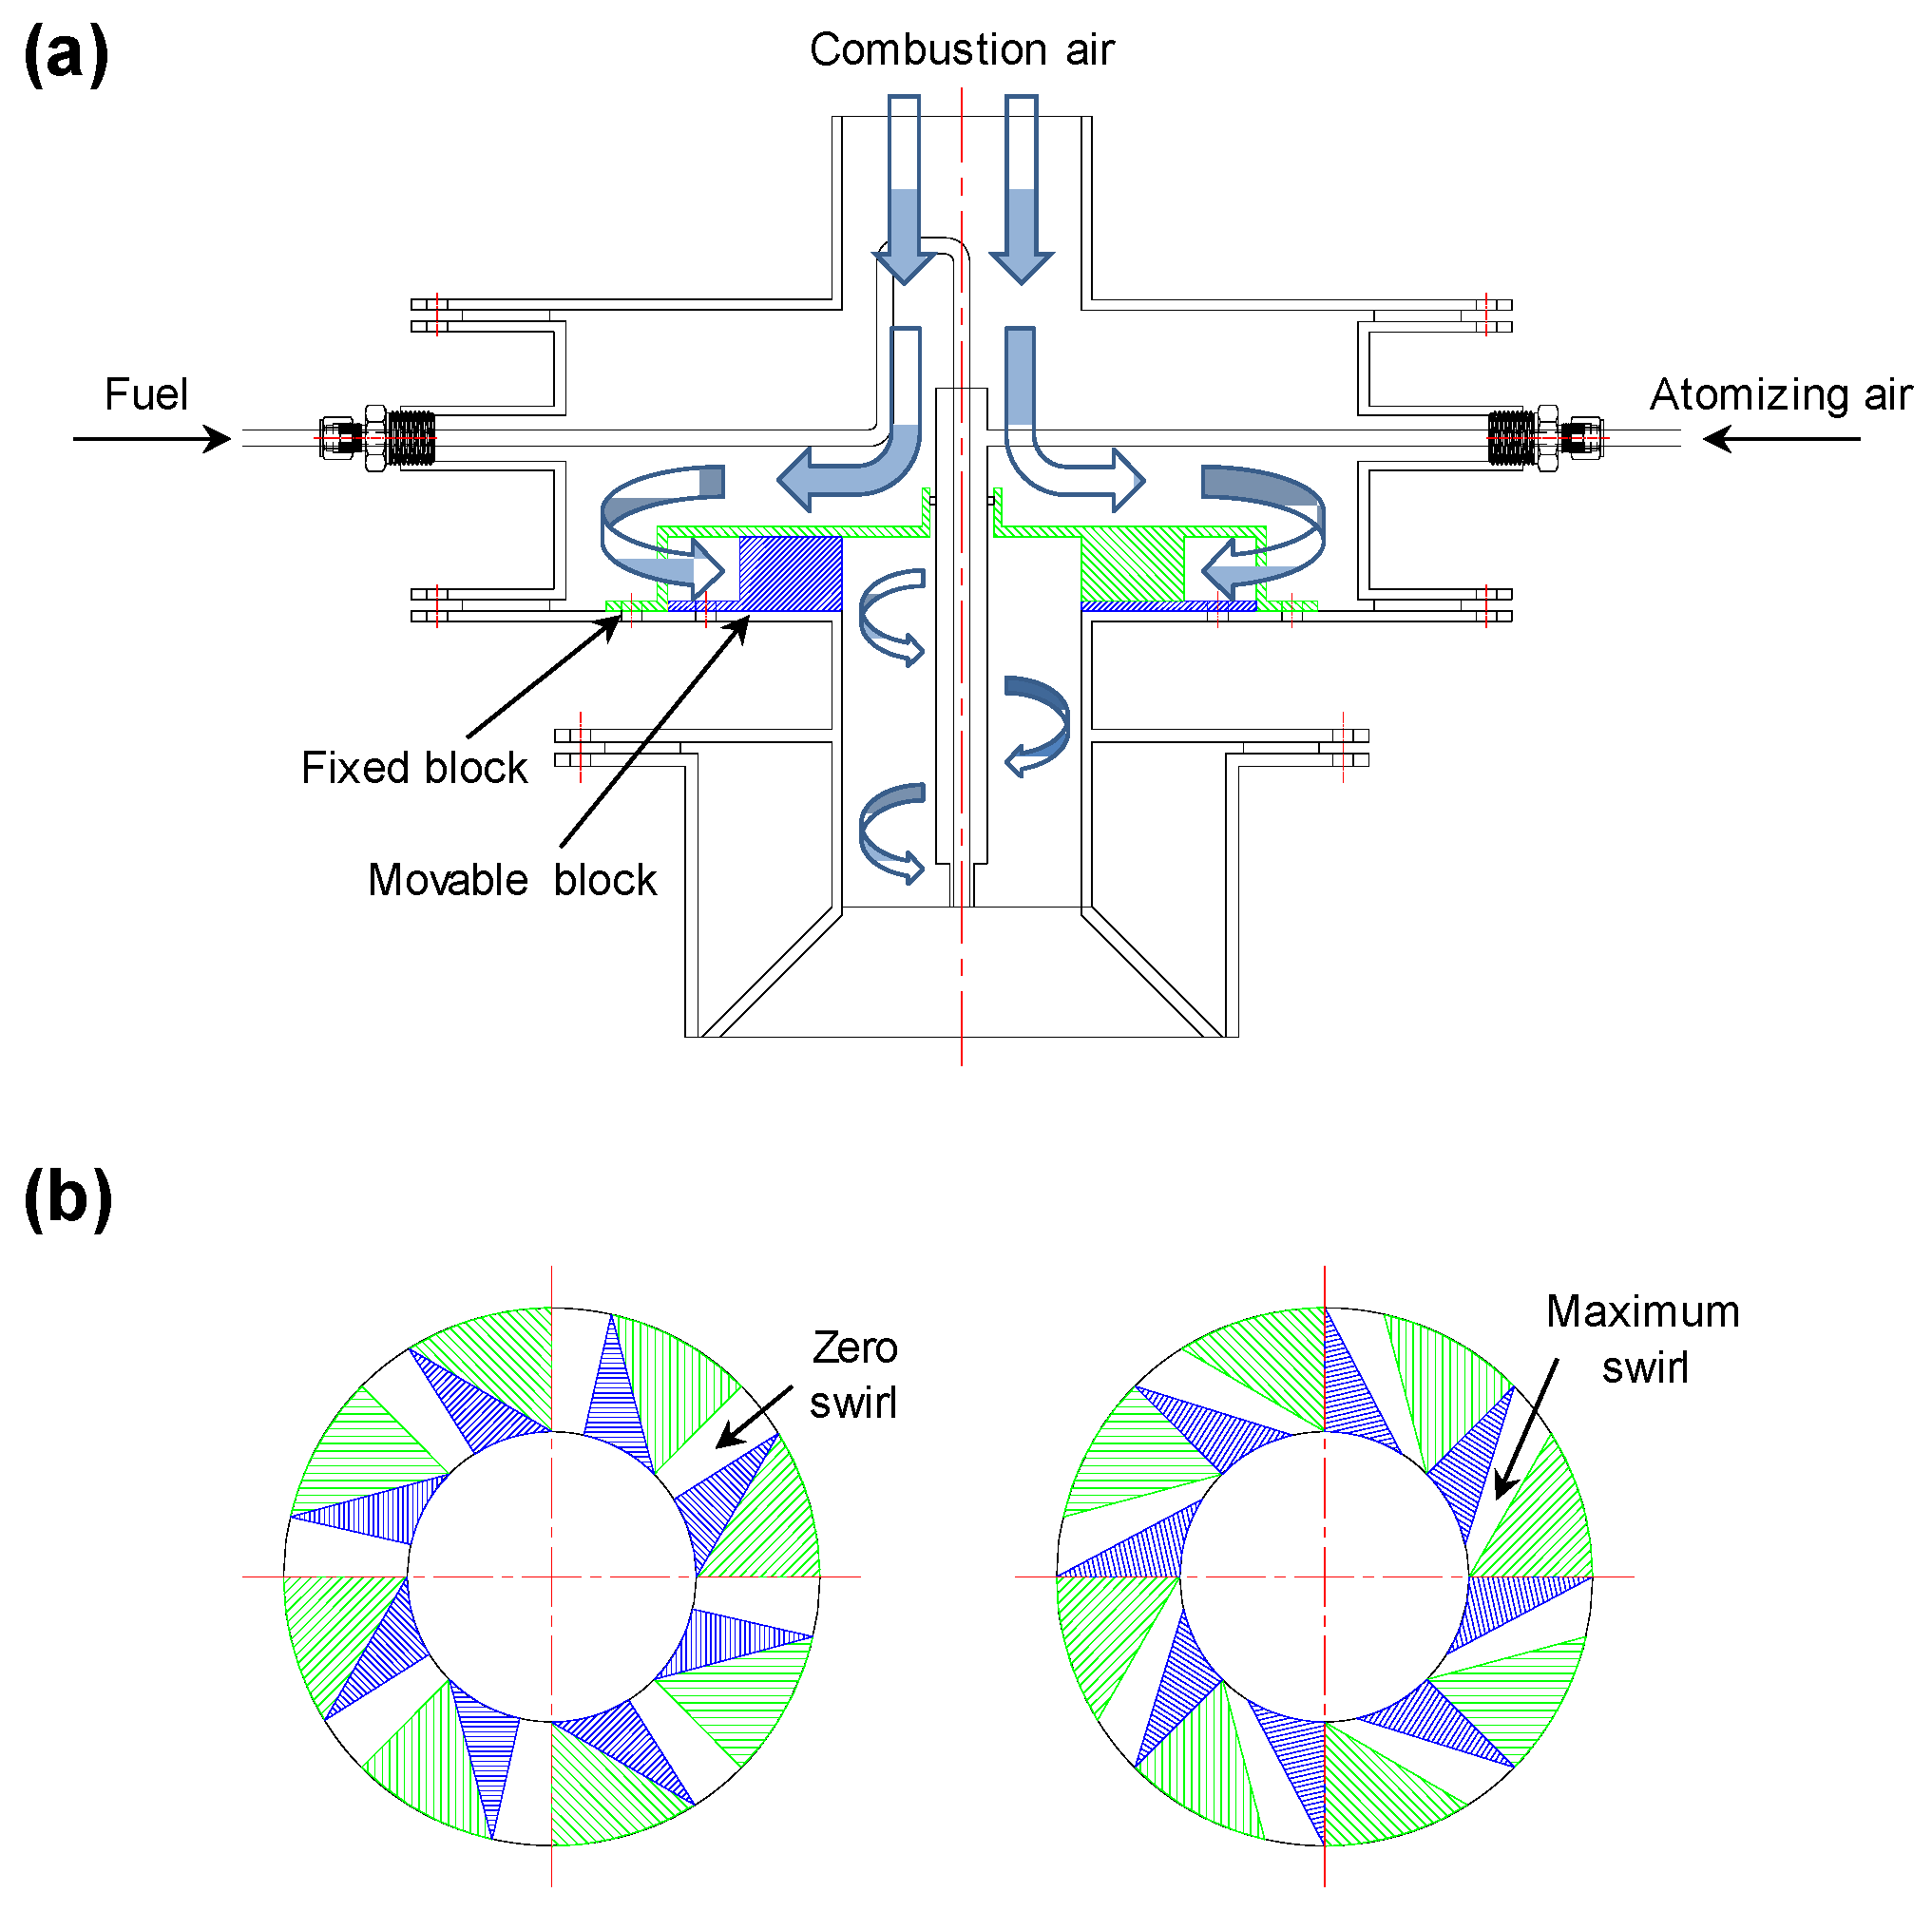
2.1. Burner System Setup
2.2. Fuel Properties
3. Results and Discussion
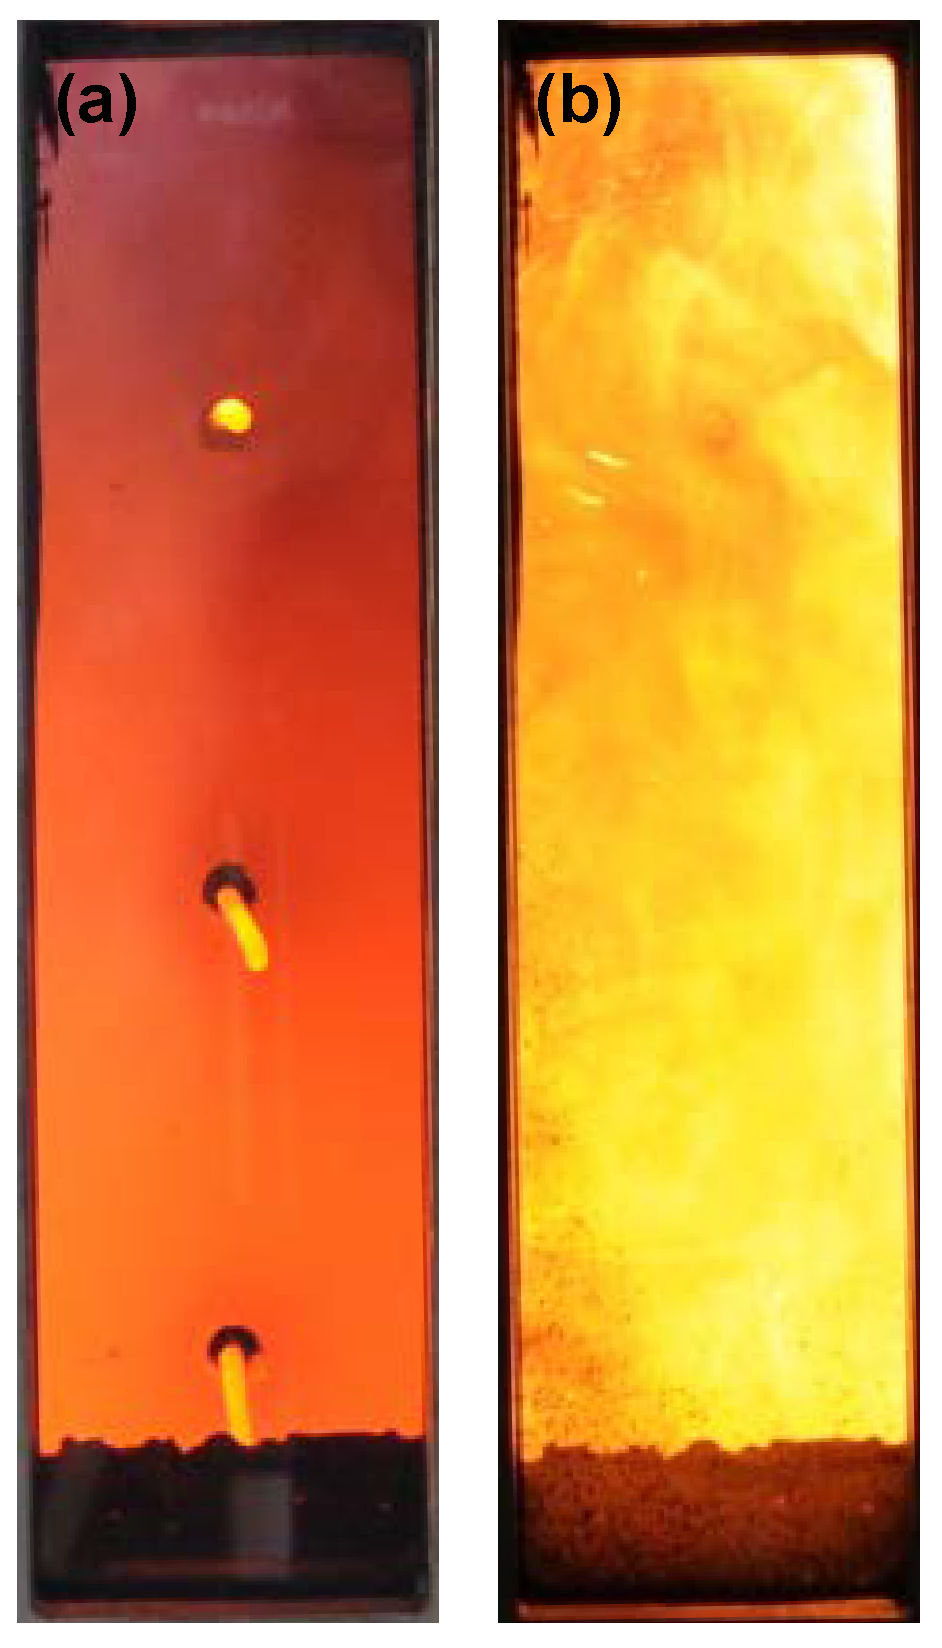
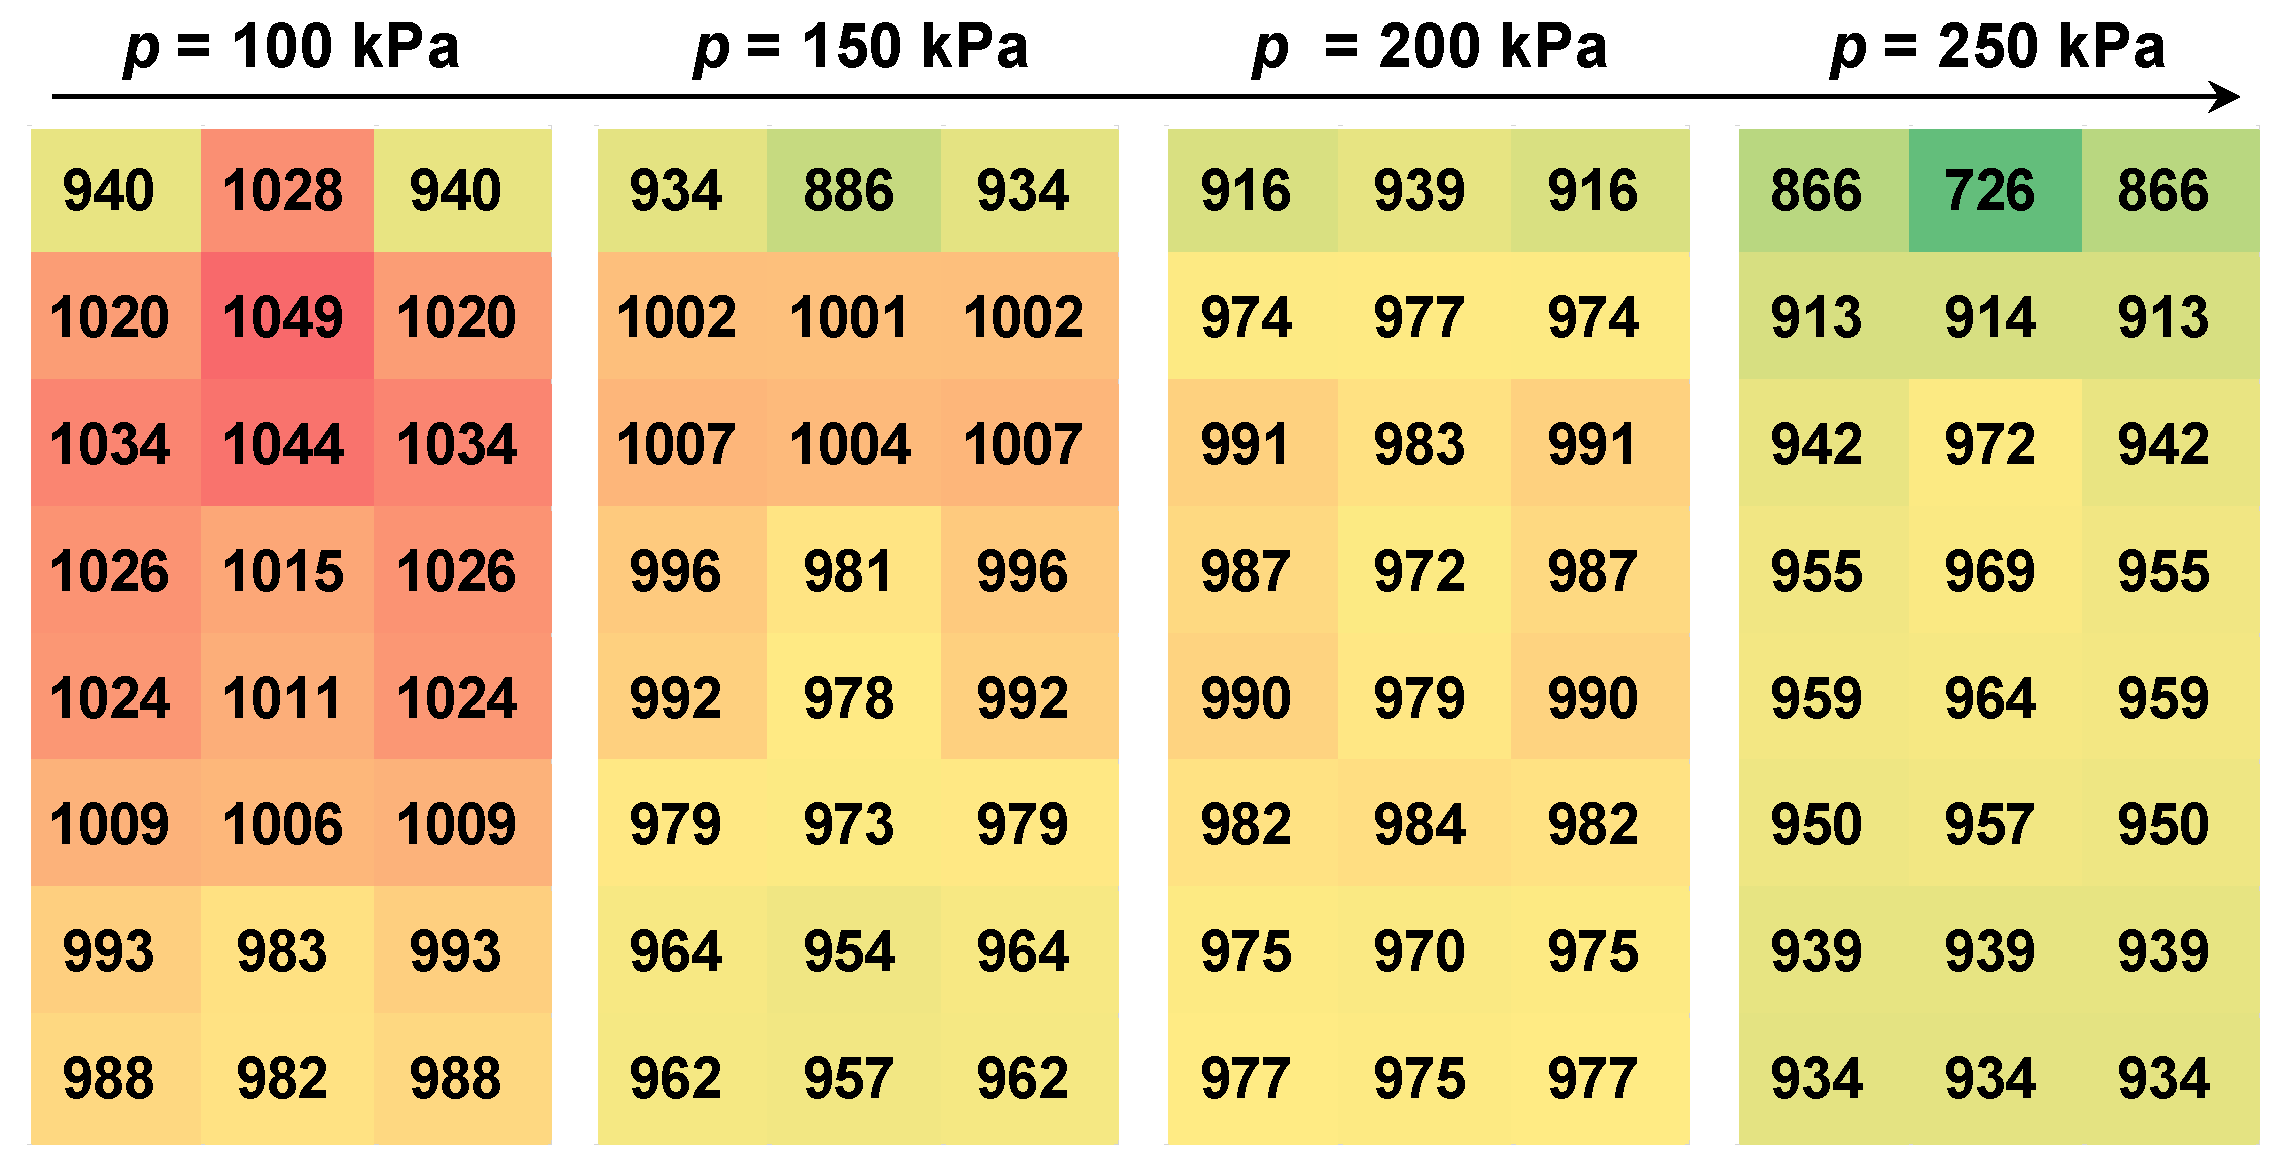
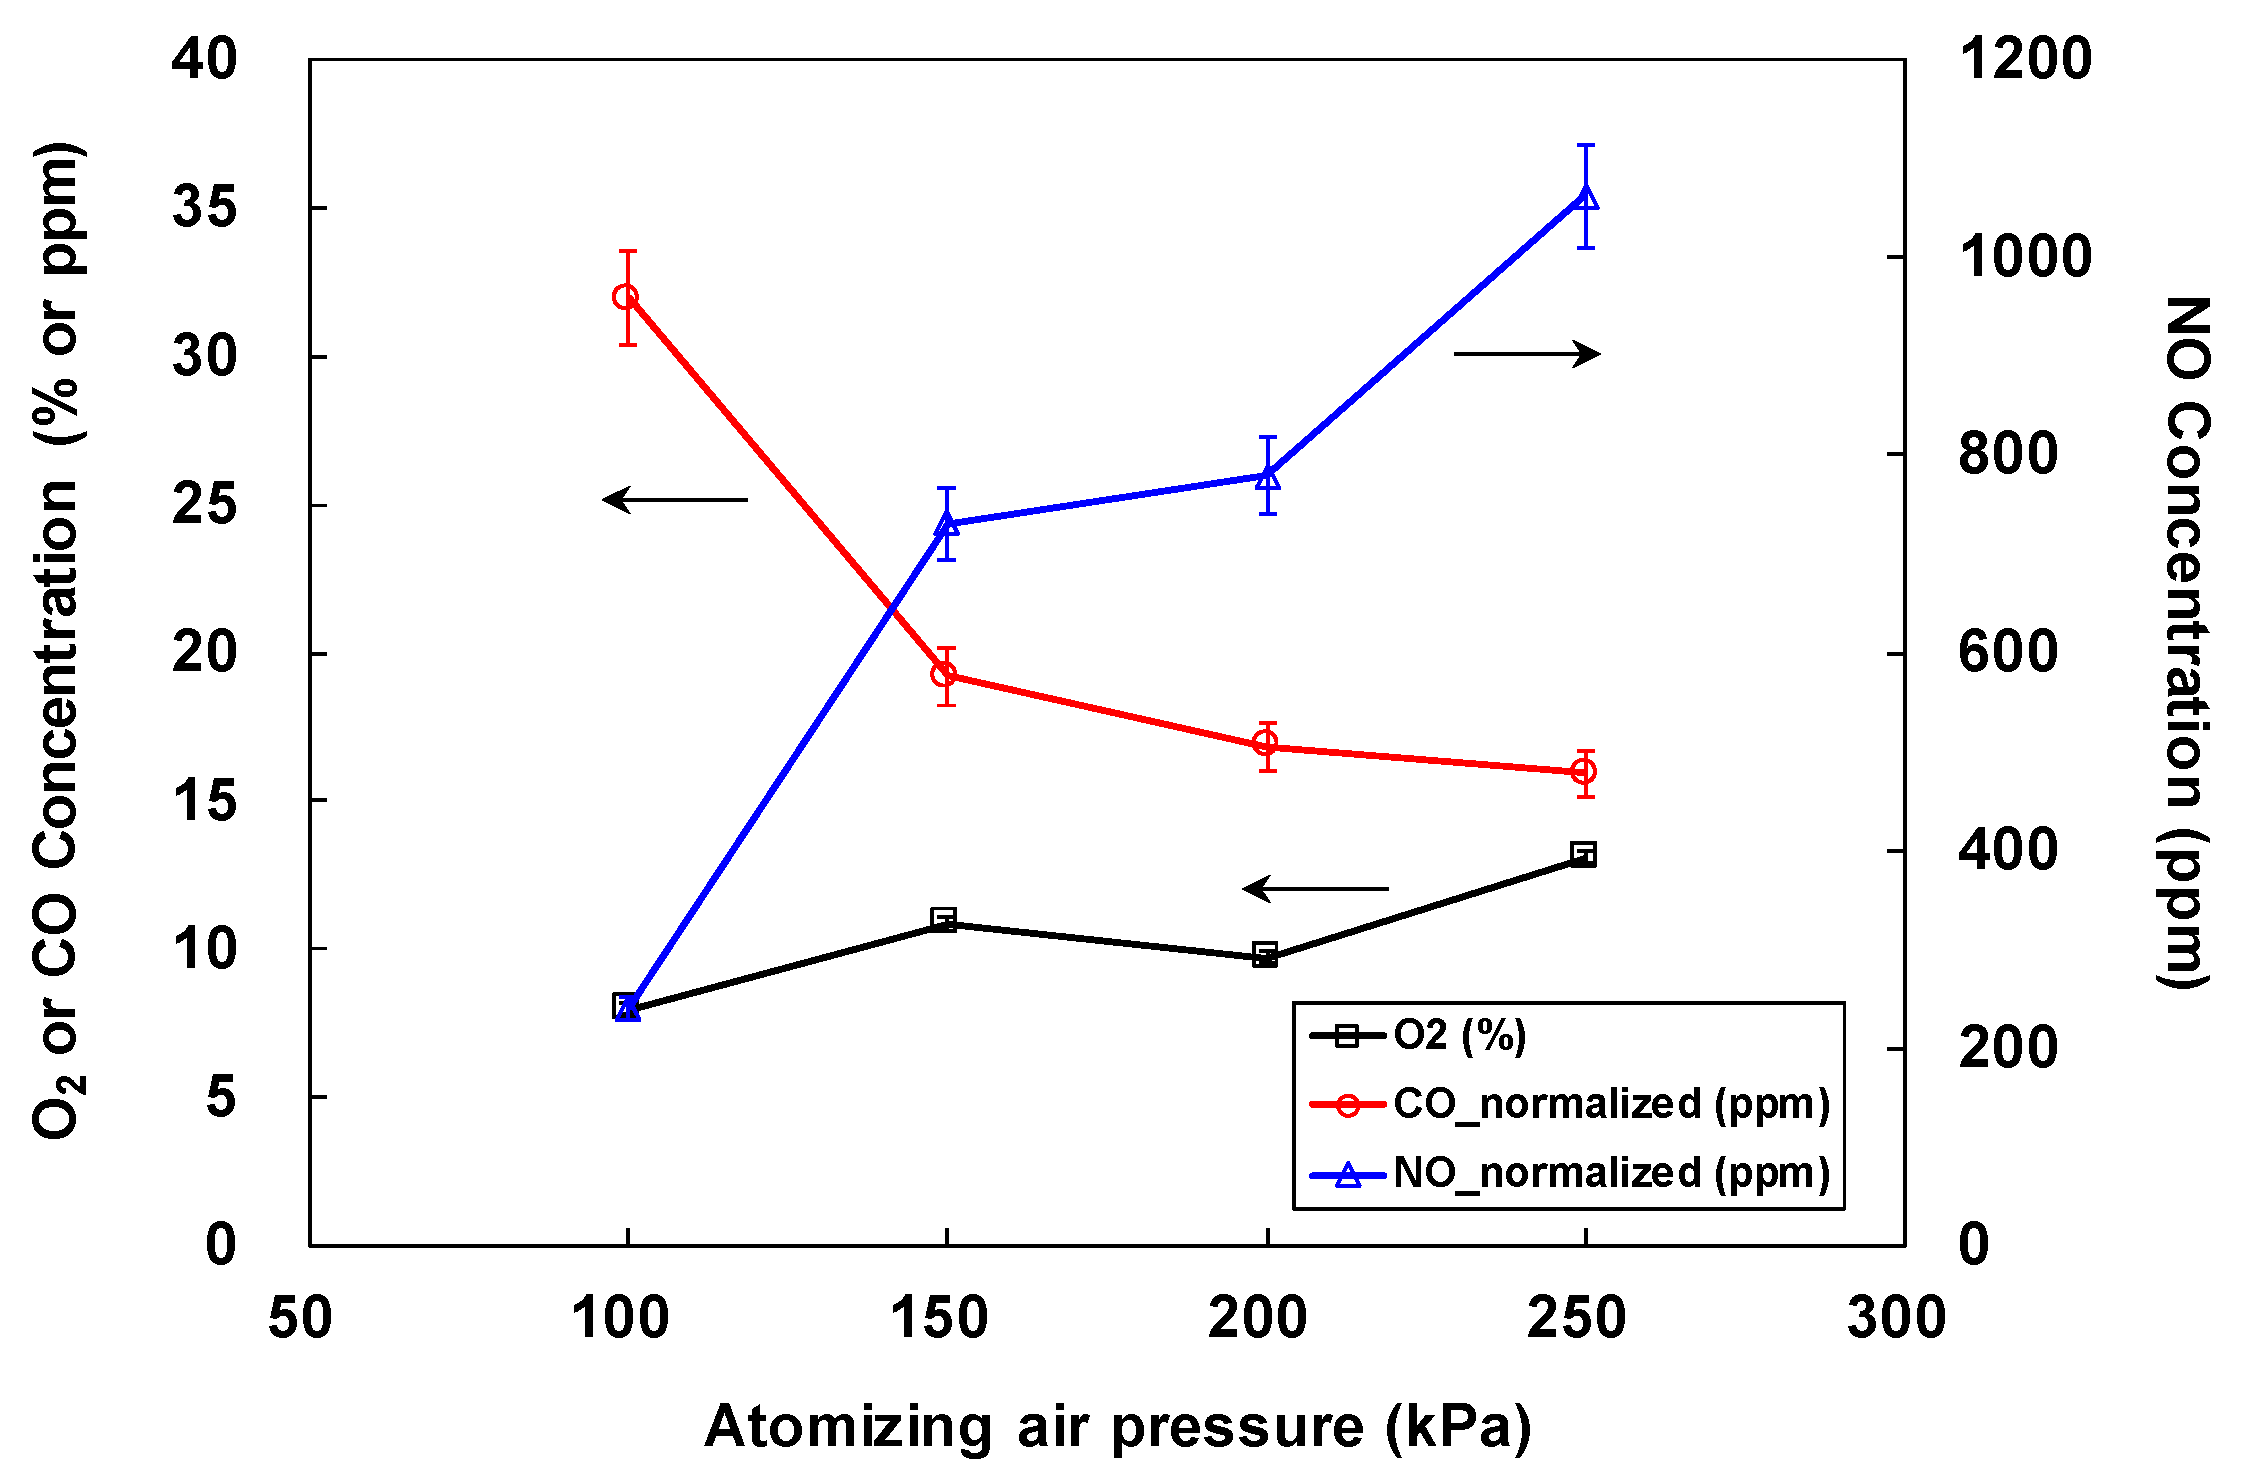
3.1. Effect of Atomizing Air Pressure
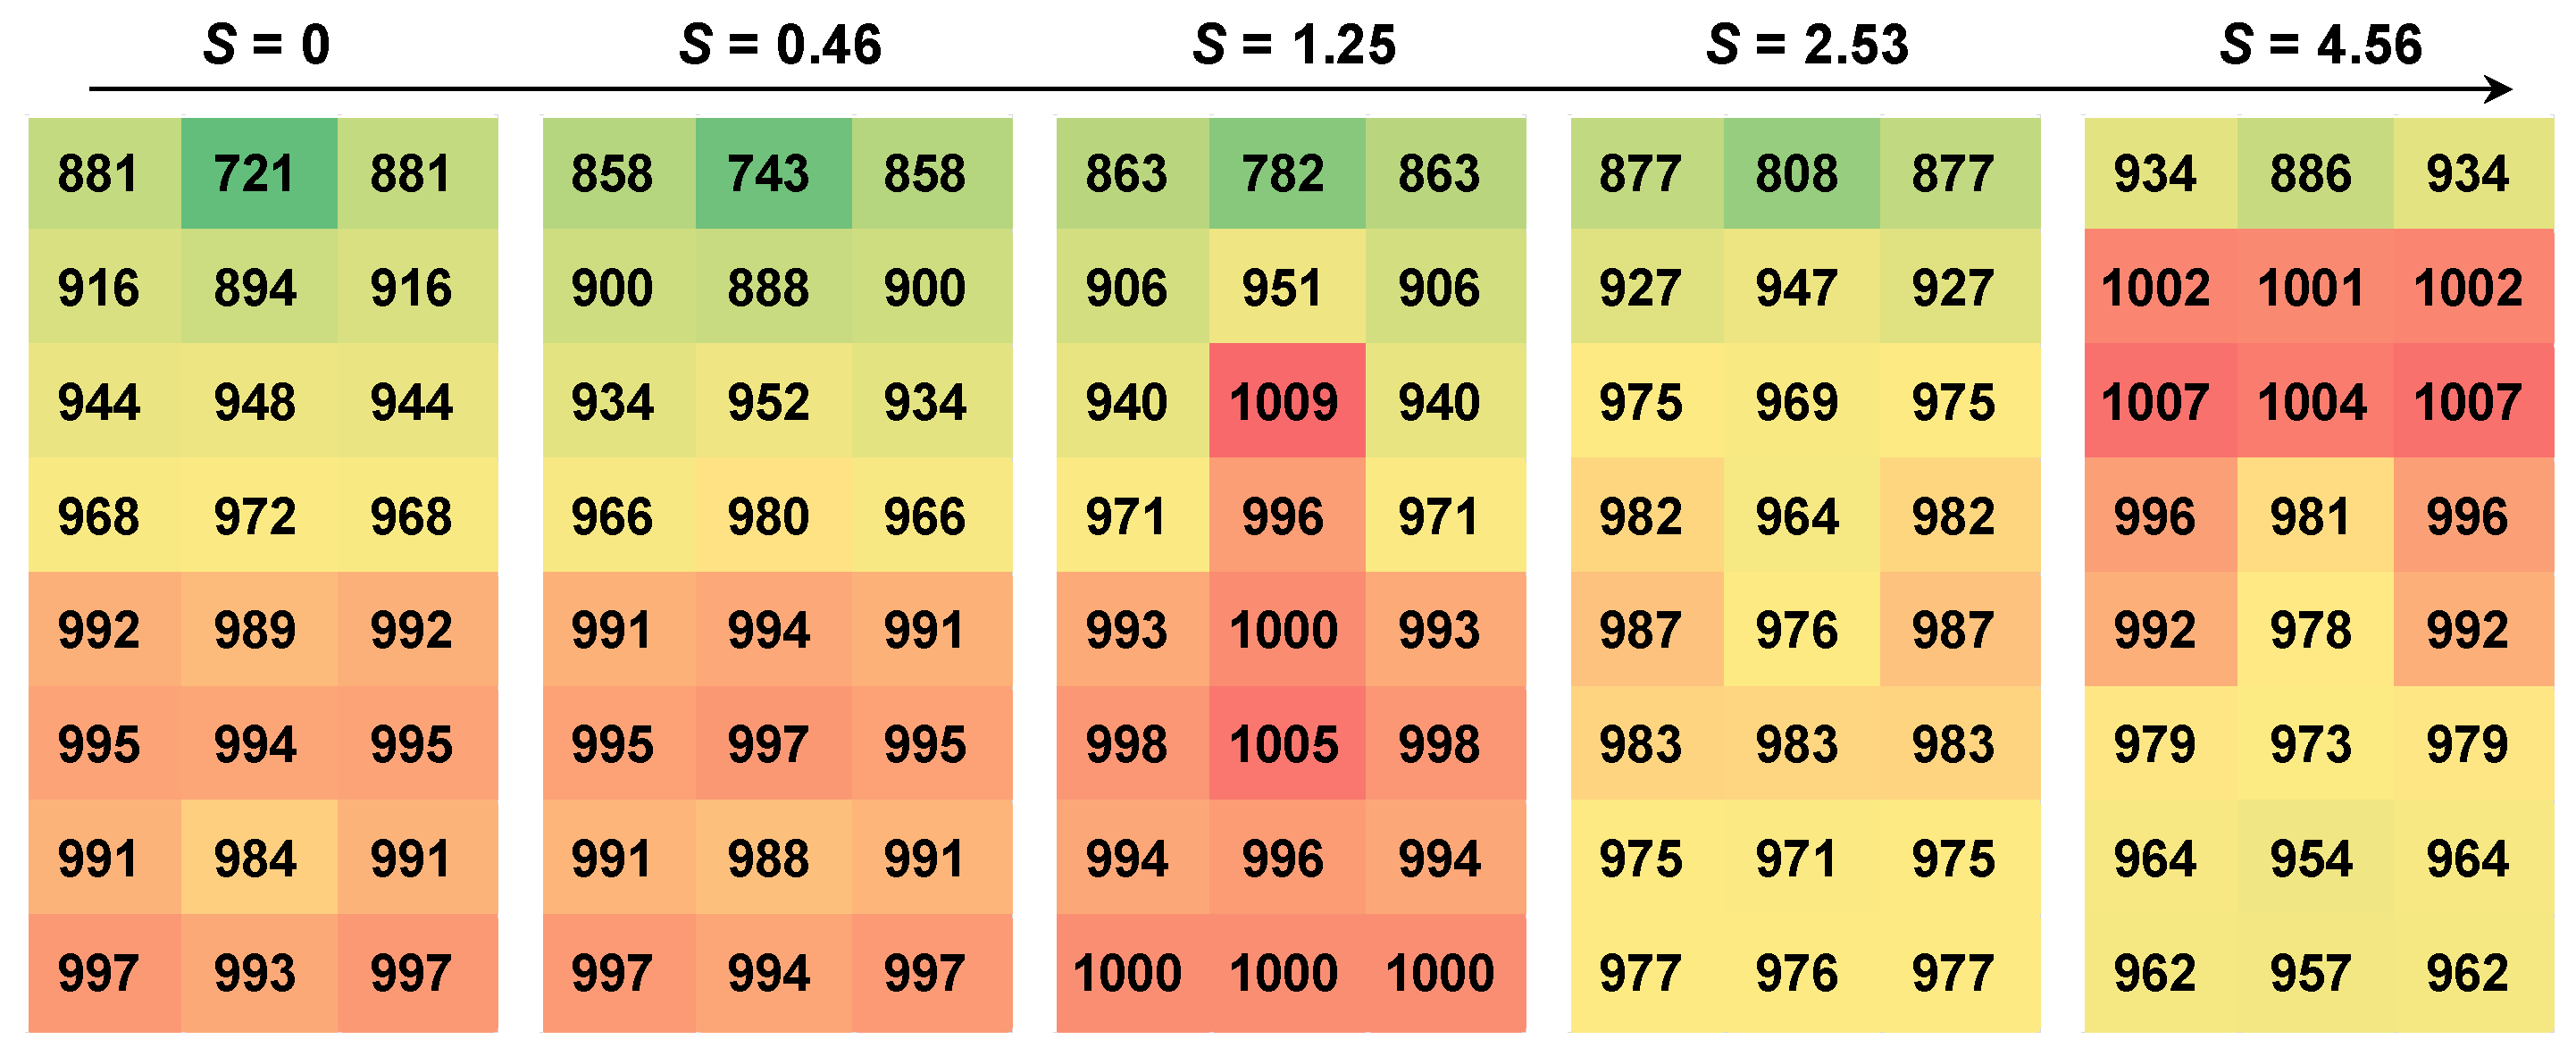
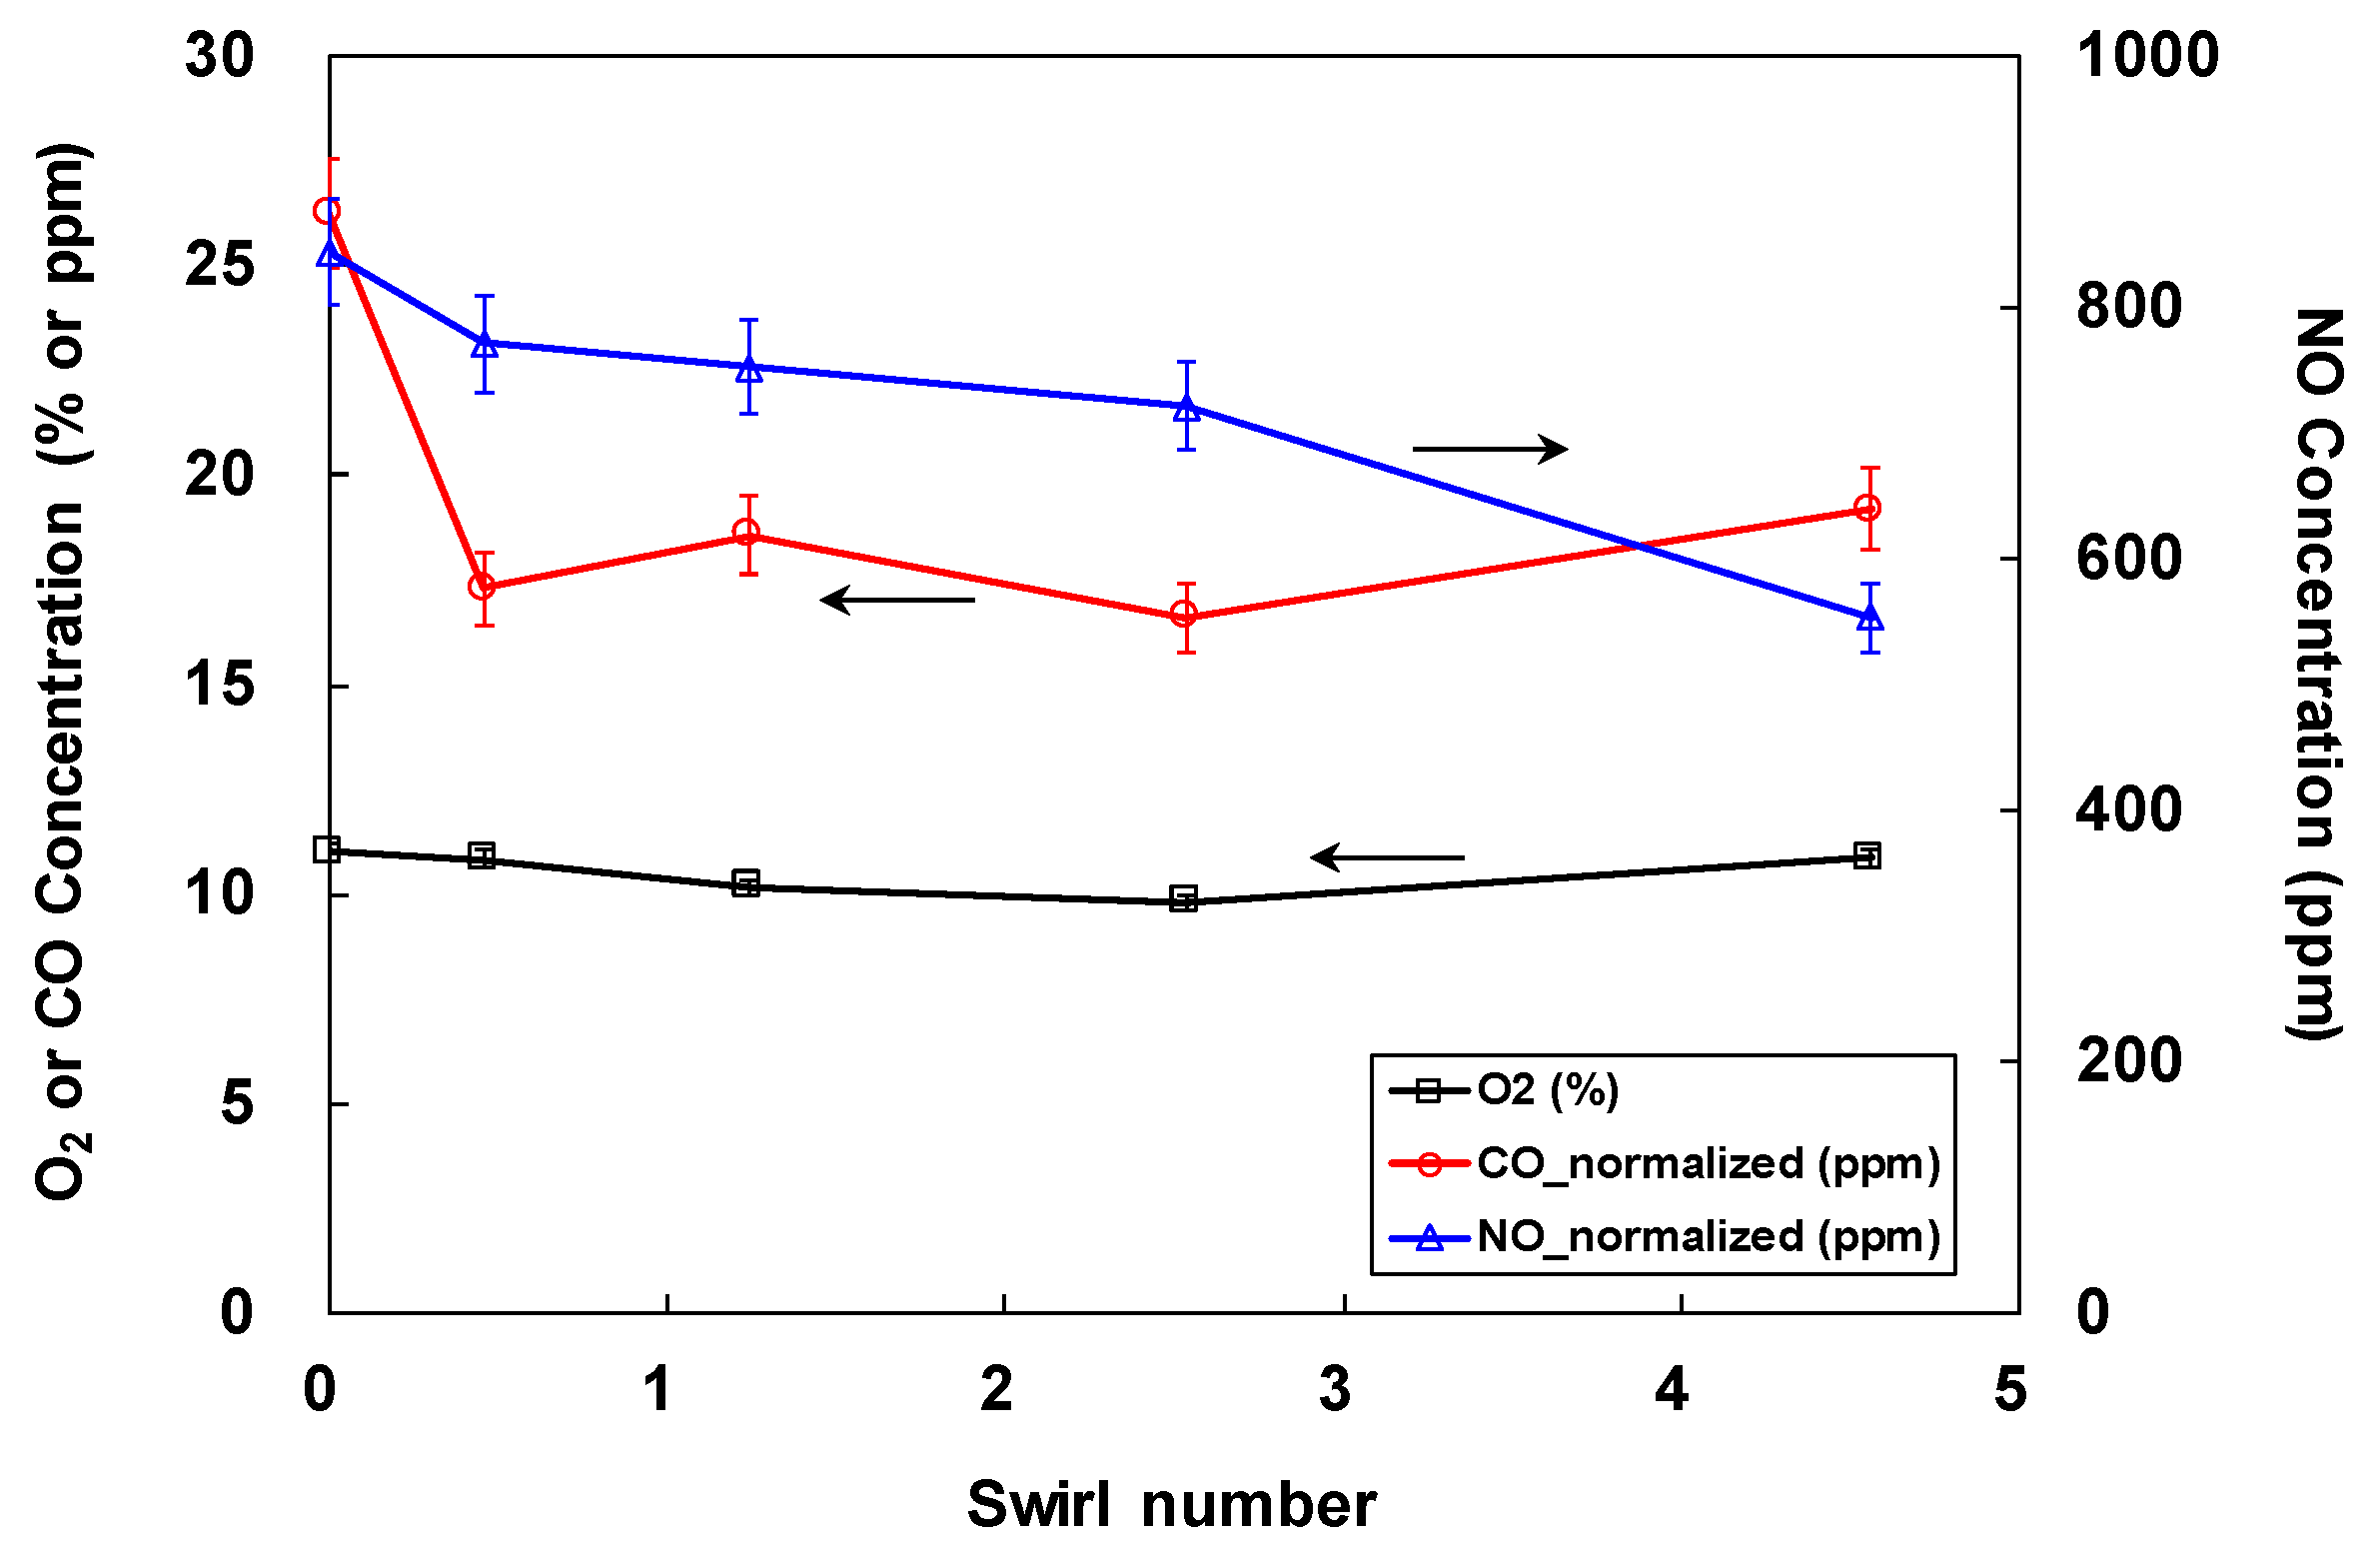
3.2. Effect of Swirl Number
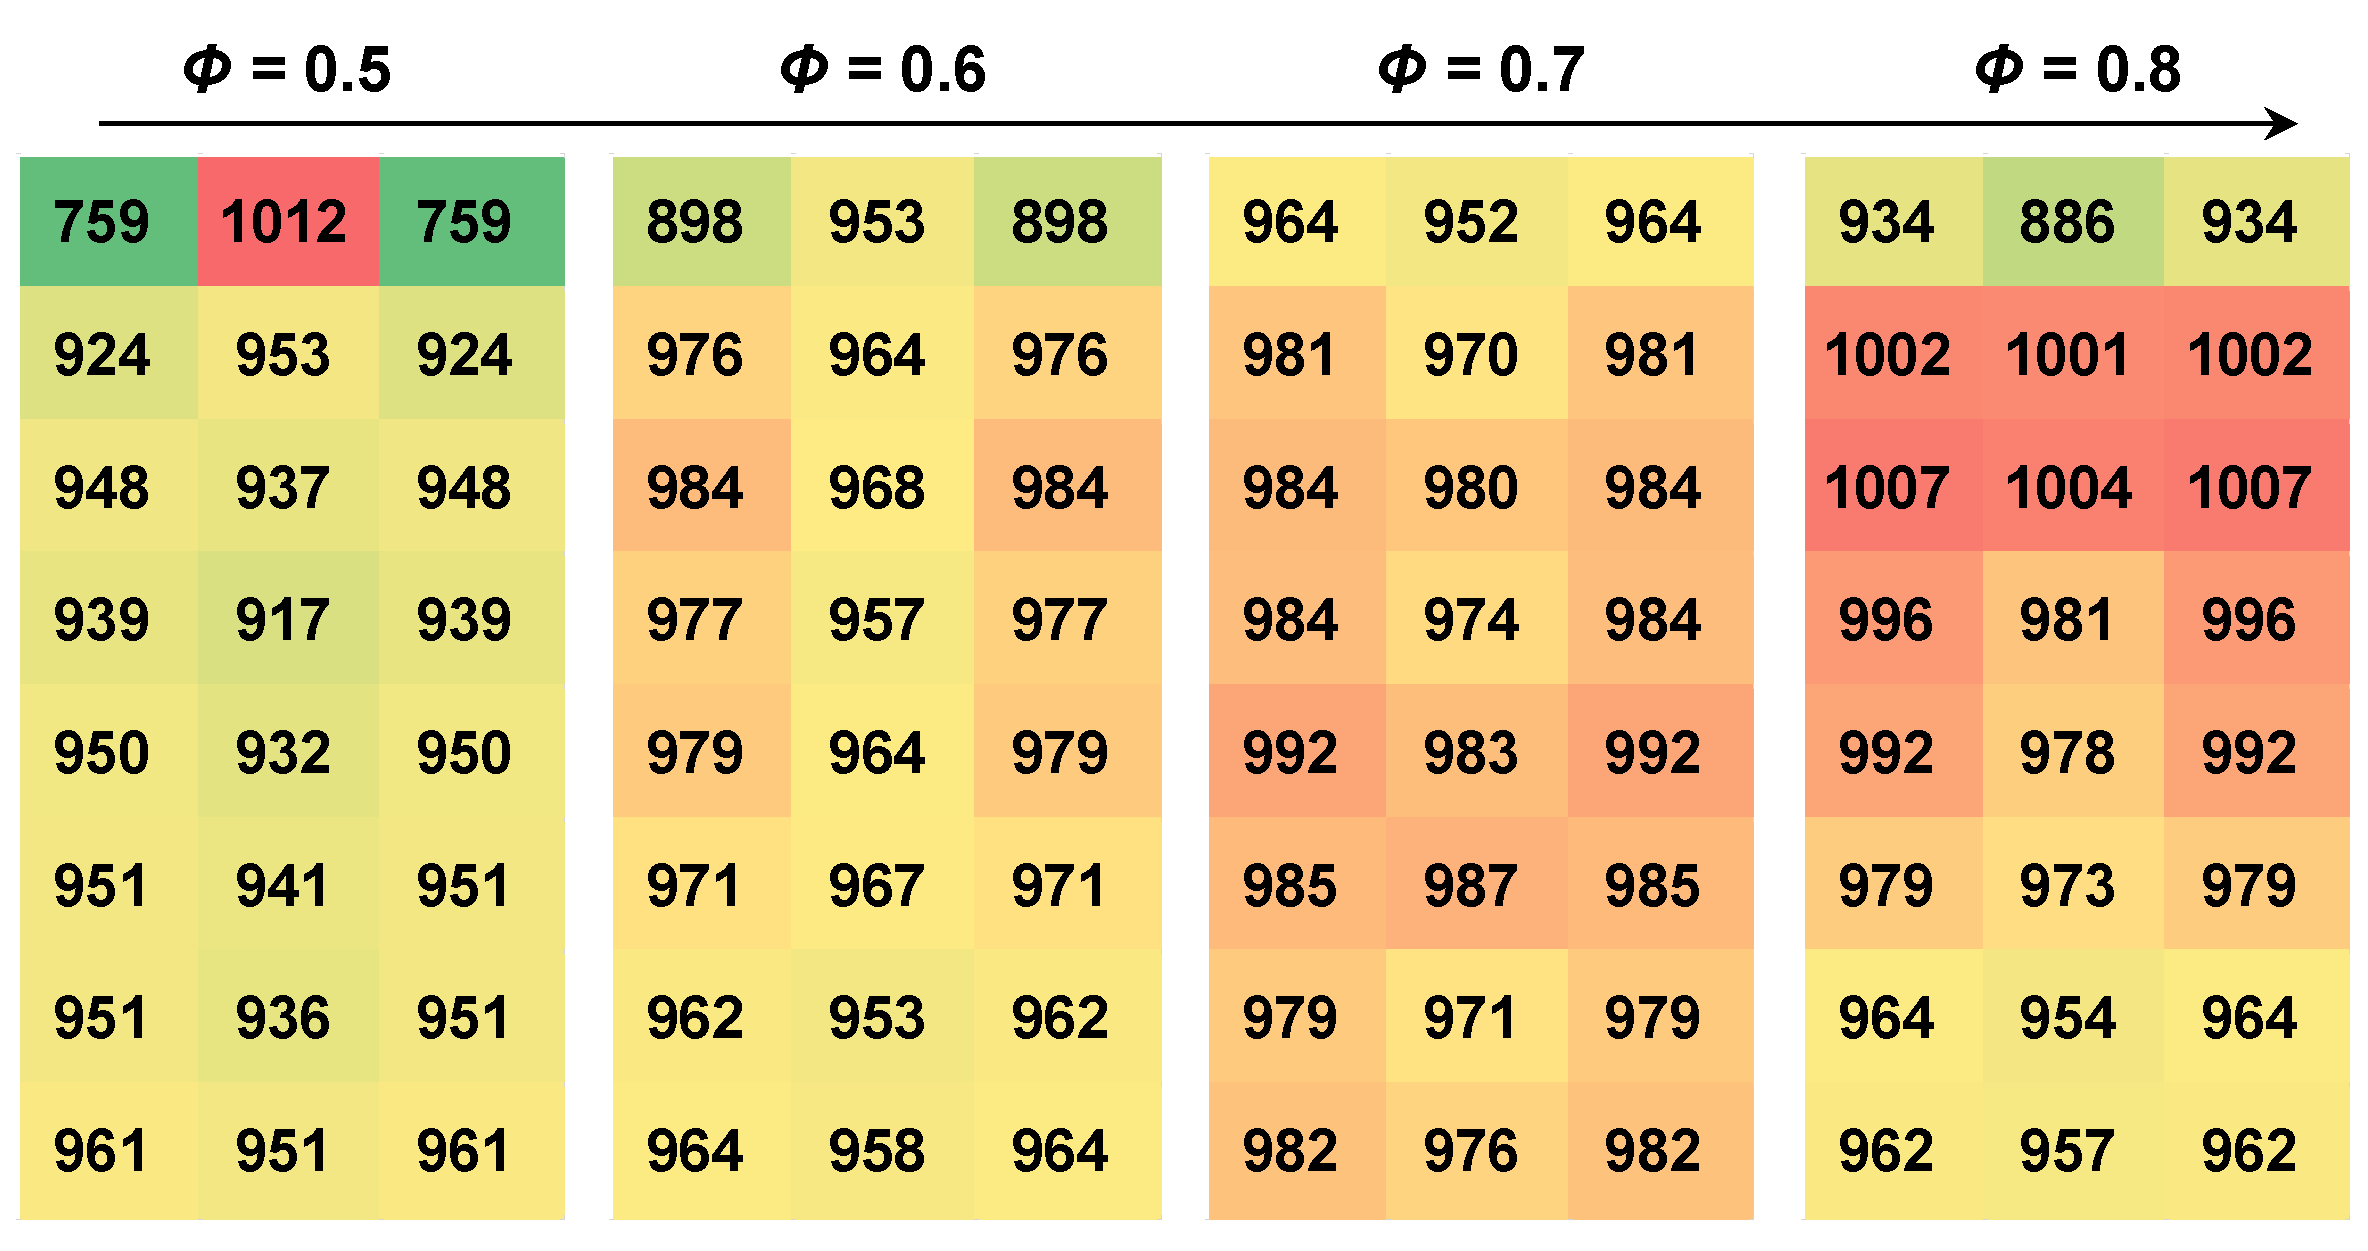
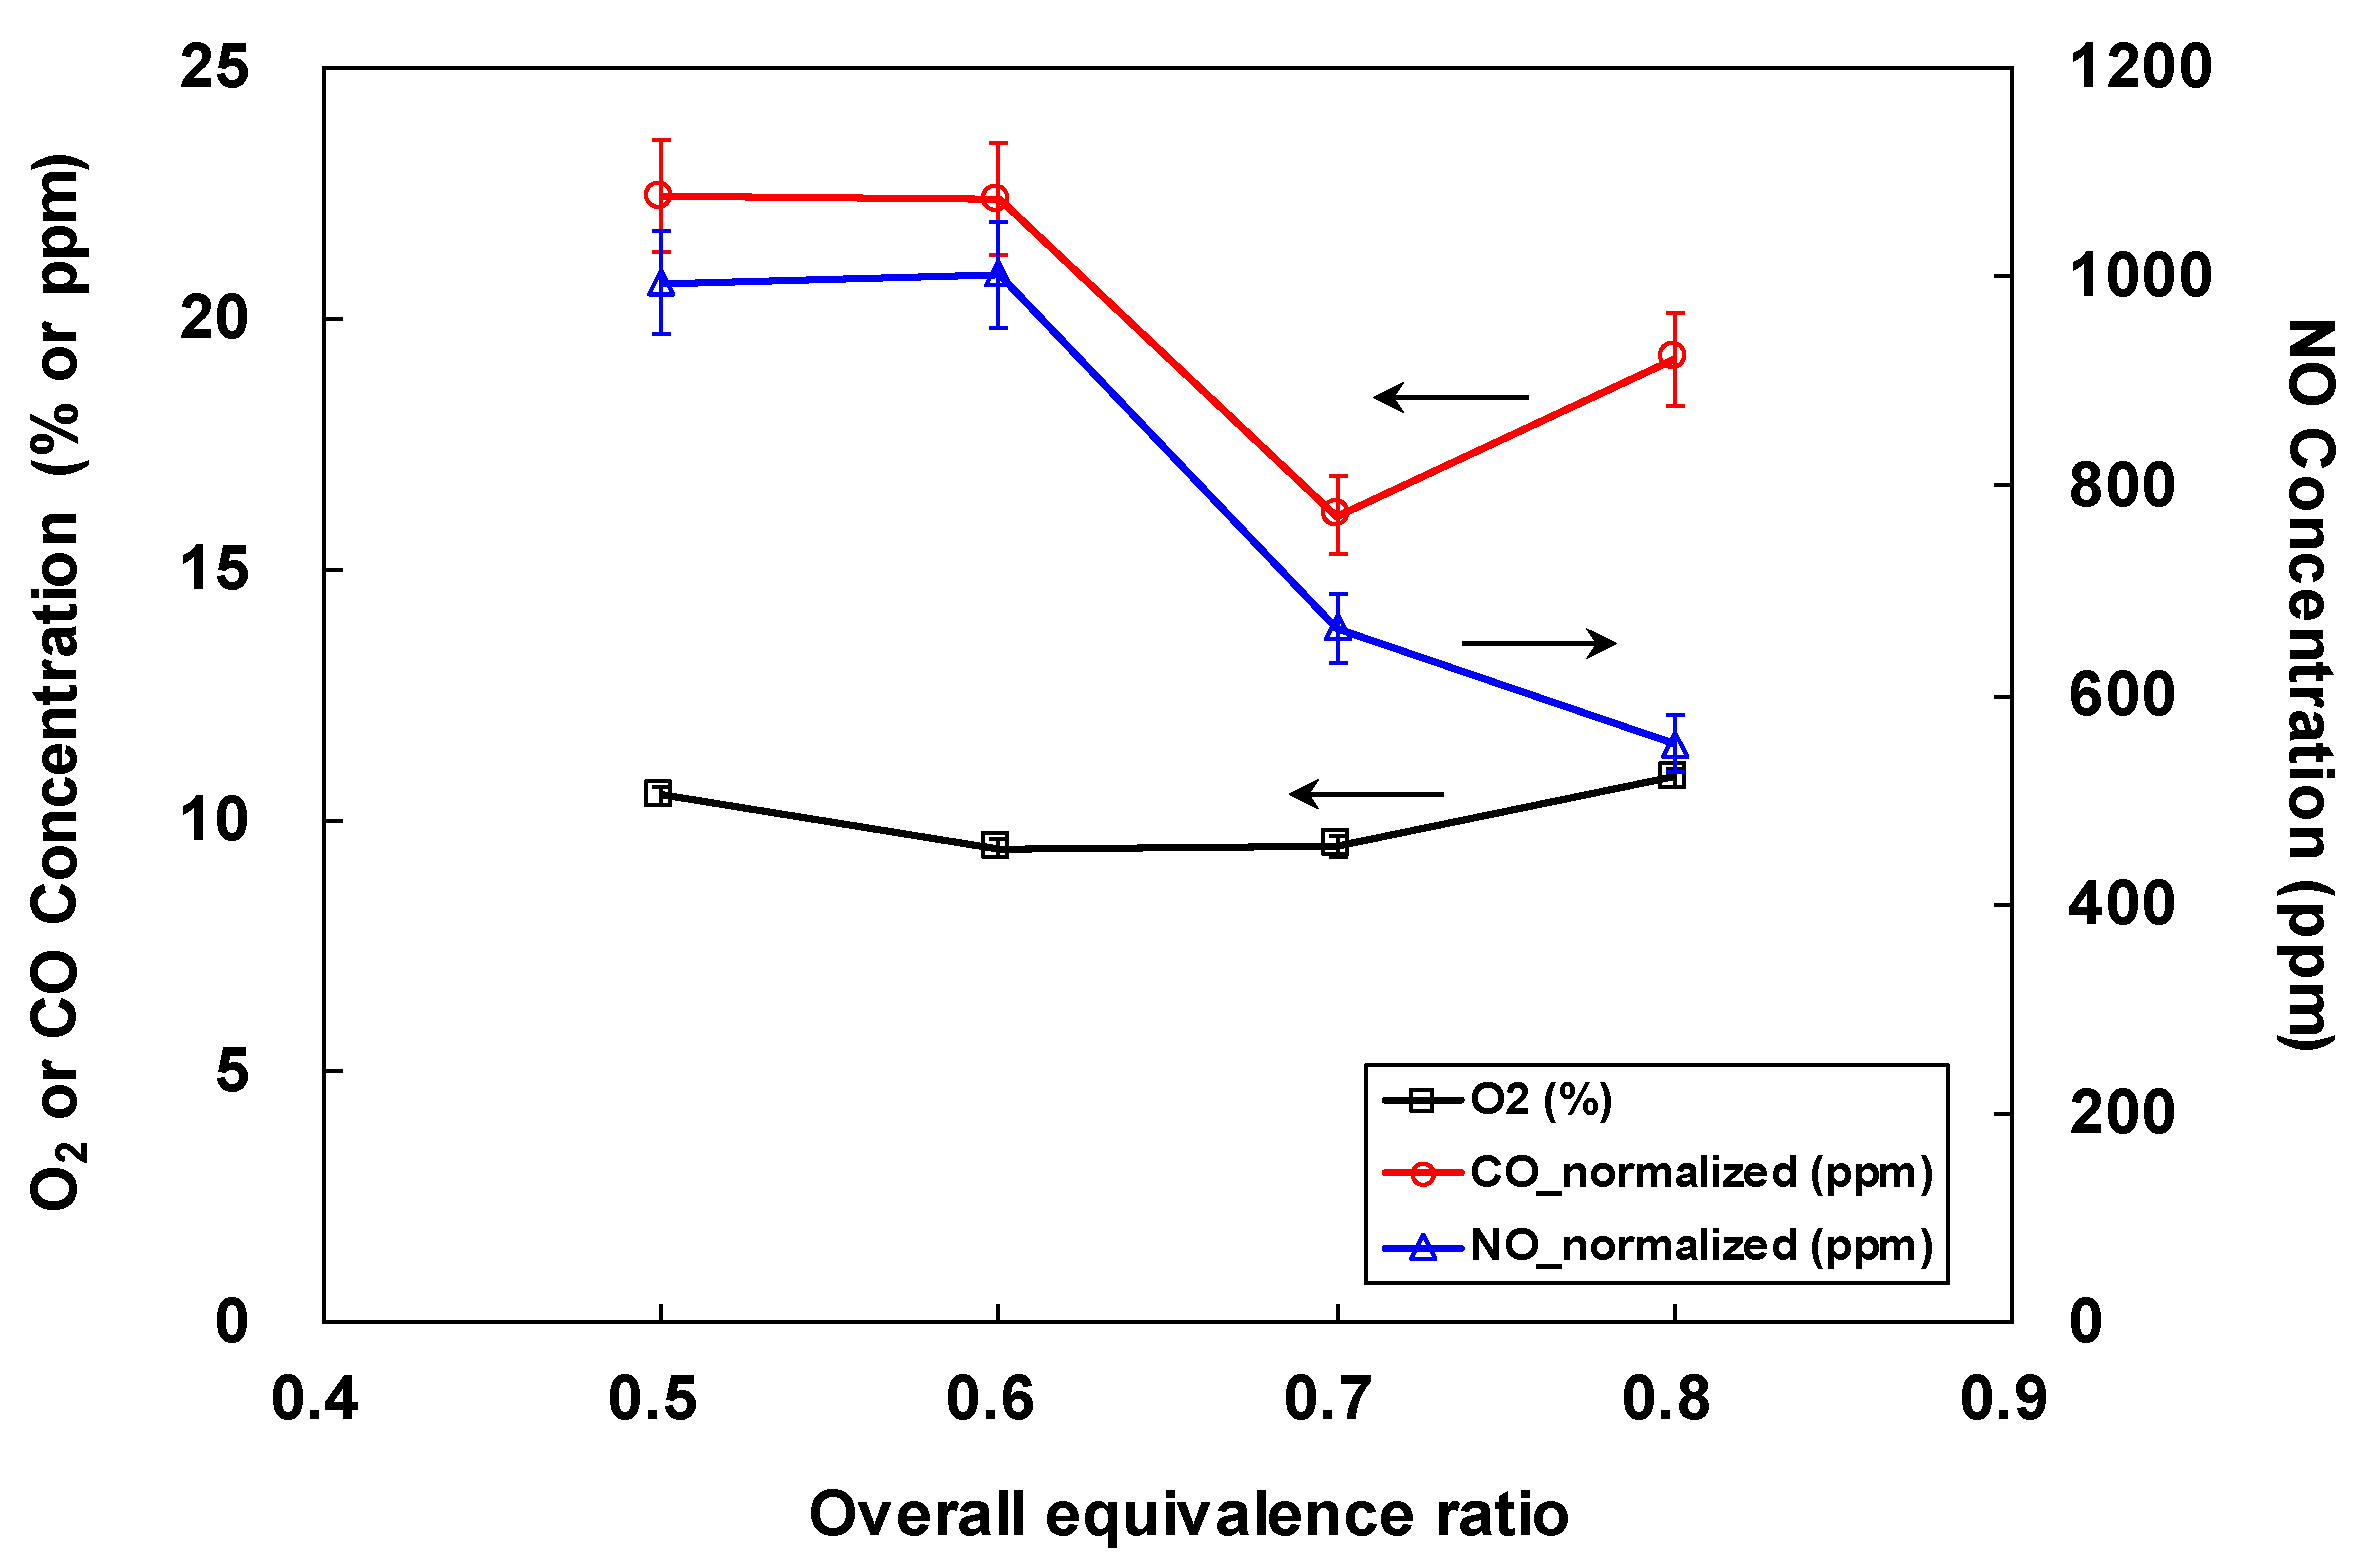
3.3. Effect of Overall Equivalence Ratio
4. Conclusions
Author Contributions
Funding
Conflicts of Interest
References
- Bridgwater, A.V. Review of fast pyrolysis of biomass and product upgrading. Biomass Bioenergy 2012, 38, 68–94. [Google Scholar] [CrossRef]
- Bridgwater, A.V.; Meier, D.; Radlein, D. An overview of fast pyrolysis of biomass. Org. Geochem. 1999, 30, 1479–1493. [Google Scholar] [CrossRef]
- Lu, Q.; Li, W.Z.; Zhu, X.F. Overview of fuel properties of biomass fast pyrolysis oils. Energy Convers. Manag. 2009, 50, 1376–1383. [Google Scholar] [CrossRef]
- Mohan, D.; Pittman, C.U.; Steele, P.H. Pyrolysis of wood/biomass for bio-oil: A critical review. Energy Fuels 2006, 20, 848–889. [Google Scholar] [CrossRef]
- USDA Foreign Agricultural Service. Coffee: World Markets and Trade; 2019; pp. 1–9. Available online: https://www.fas.usda.gov/data/coffee-world-markets-and-trade (accessed on 29 April 2020).
- Bok, J.P.; Choi, H.S.; Choi, Y.S.; Park, H.C.; Kim, S.J. Fast pyrolysis of coffee grounds: Characteristics of product yields and biocrude oil quality. Energy 2012, 47, 17–24. [Google Scholar] [CrossRef]
- Choi, Y.S.; Choi, S.K.; Kim, S.J.; Jeong, Y.W.; Soysa, R.; Rahman, T. Fast pyrolysis of coffee ground in a tilted-slide reactor and characteristics of biocrude oil. Environ. Prog. Sustain. Energy 2017, 36. [Google Scholar] [CrossRef]
- Chiaramonti, D.; Oasmaa, A.; Solantausta, Y. Power generation using fast pyrolysis liquids from biomass. Renew. Sustain. Energy Rev. 2007, 11, 1056–1086. [Google Scholar] [CrossRef]
- Lee, S.; Kim, T.; Kang, K. Performance and emission characteristics of a diesel engine operated with wood pyrolysis oil. Proc. Inst. Mech. Eng. Part D J. Automob. Eng. 2014, 228, 180–189. [Google Scholar] [CrossRef]
- López Juste, G.; Salvá Monfort, J.J. Preliminary test on combustion of wood derived fast pyrolysis oils in a gas turbine combustor. Biomass Bioenergy 2000, 19, 119–128. [Google Scholar] [CrossRef]
- Oasmaa, A.; Kyto, M.; Sipila, K. Pyrolysis oil combustion tests in an industrial boiler. In Progress in Thermochemical Biomass Conversion; Bridgwater, A.V., Ed.; Blackwell Science: Oxford, UK, 2001; pp. 1468–1481. [Google Scholar]
- Shihadeh, A.; Hochgreb, S. Diesel engine combustion of biomass pyrolysis oils. Energy Fuels 2000, 14, 260–274. [Google Scholar] [CrossRef]
- Solantausta, Y.; Nylund, N.-O.; Gust, S. Use of pyrolysis oil in a test diesel engine to study the feasibility of a diesel power plant concept. Biomass Bioenergy 1994, 7, 297–306. [Google Scholar] [CrossRef]
- Strenziok, R.; Hansen, U.; Kunstner, H. Combustion of bio-oil in a gas turbine. In Progress in Thermochemical Biomass Conversion; Bridgwater, A.V., Ed.; Blackwell Science: Oxford, UK, 2001; pp. 1452–1458. [Google Scholar]
- Choi, S.K.; Choi, Y.S.; Kim, S.J.; Jeong, Y.W. Characteristics of flame stability and gaseous emission of biocrude-oil/ethanol blends in a pilot-scale spray burner. Renew. Energy 2016, 91, 516–523. [Google Scholar] [CrossRef]
- Tzanetakis, T.; Farra, N.; Moloodi, S.; Lamont, W.; McGrath, A.; Thomson, M.J. Spray combustion characteristics and gaseous emissions of a wood derived fast pyrolysis liquid-ethanol blend in a pilot stabilized swirl burner. Energy Fuels 2010, 24, 5331–5348. [Google Scholar] [CrossRef]
- Zheng, J.L.; Kong, Y.P. Spray combustion properties of fast pyrolysis bio-oil produced from rice husk. Energy Convers. Manag. 2010, 51, 182–188. [Google Scholar] [CrossRef]
- Martin, J.A.; Boateng, A.A. Combustion performance of pyrolysis oil/ethanol blends in a residential-scale oil-fired boiler. Fuel 2014, 133, 34–44. [Google Scholar] [CrossRef]
- Nguyen, D.; Honnery, D. Combustion of bio-oil ethanol blends at elevated pressure. Fuel 2008, 87, 232–243. [Google Scholar] [CrossRef]
- Stamatov, V.; Honnery, D.; Soria, J. Combustion properties of slow pyrolysis bio-oil produced from indigenous Australian species. Renew. Energy 2006, 31, 2108–2121. [Google Scholar] [CrossRef]
- Lefebvre, A.H. Airblast atomization. Prog. Energy Combust. Sci. 1980, 6, 233–261. [Google Scholar] [CrossRef]
- Ballester, J.; Barroso, J.; Cerecedo, L.M.; Ichaso, R. Comparative study of semi-industrial-scale flames of pulverized coals and biomass. Combust. Flame 2005, 141, 204–215. [Google Scholar] [CrossRef]
- Palm, R.; Grundmann, S.; Weismüller, M.; Šarić, S.; Jakirlić, S.; Tropea, C. Experimental characterization and modelling of inflow conditions for a gas turbine swirl combustor. Int. J. Heat Fluid Flow 2006, 27, 924–936. [Google Scholar] [CrossRef]
- Ćosić, B.; Bobusch, B.C.; Moeck, J.P.; Paschereit, C.O. Open-loop control of combustion instabilities and the role of the flame response to two-frequency forcing. J. Eng. Gas Turbines Power 2012, 134, 1–8. [Google Scholar] [CrossRef]
- Jones, W.P.; Marquis, A.J.; Prasad, V.N. LES of a turbulent premixed swirl burner using the Eulerian stochastic field method. Combust. Flame 2012, 159, 3079–3095. [Google Scholar] [CrossRef]
- Gupta, A.K.; Lilley, D.G.; Syred, N. Swirl Flows; Energy and engineering science series; Abacus Press: Tunbridge Wells, Kent, UK, 1984; ISBN 9780856261756. [Google Scholar]
- Fudihara, T.J.; Goldstein, L.; Mori, M. The three-dimensional numerical aerodynamics of a movable block burner. Braz. J. Chem. Eng. 2003, 20, 391–401. [Google Scholar] [CrossRef]
- Hodgson, E.M.; Fahmi, R.; Yates, N.; Barraclough, T.; Shield, I.; Allison, G.; Bridgwater, A.V.; Donnison, I.S. Miscanthus as a feedstock for fast-pyrolysis: Does agronomic treatment affect quality? Bioresour. Technol. 2010, 101, 6185–6191. [Google Scholar] [CrossRef]


| Parameter | Description | Value |
|---|---|---|
| Number of swirl blocks | 8 | |
| Swirl generator exit radius | 46.8 mm | |
| Swirl generator inner radius | 9.5 mm | |
| Depth of swirl blocks | 25 mm | |
| Fixed swirl block angle | 60° | |
| Adjustable swirl block angle | - | |
| Maximum opening angle | 12.8° |
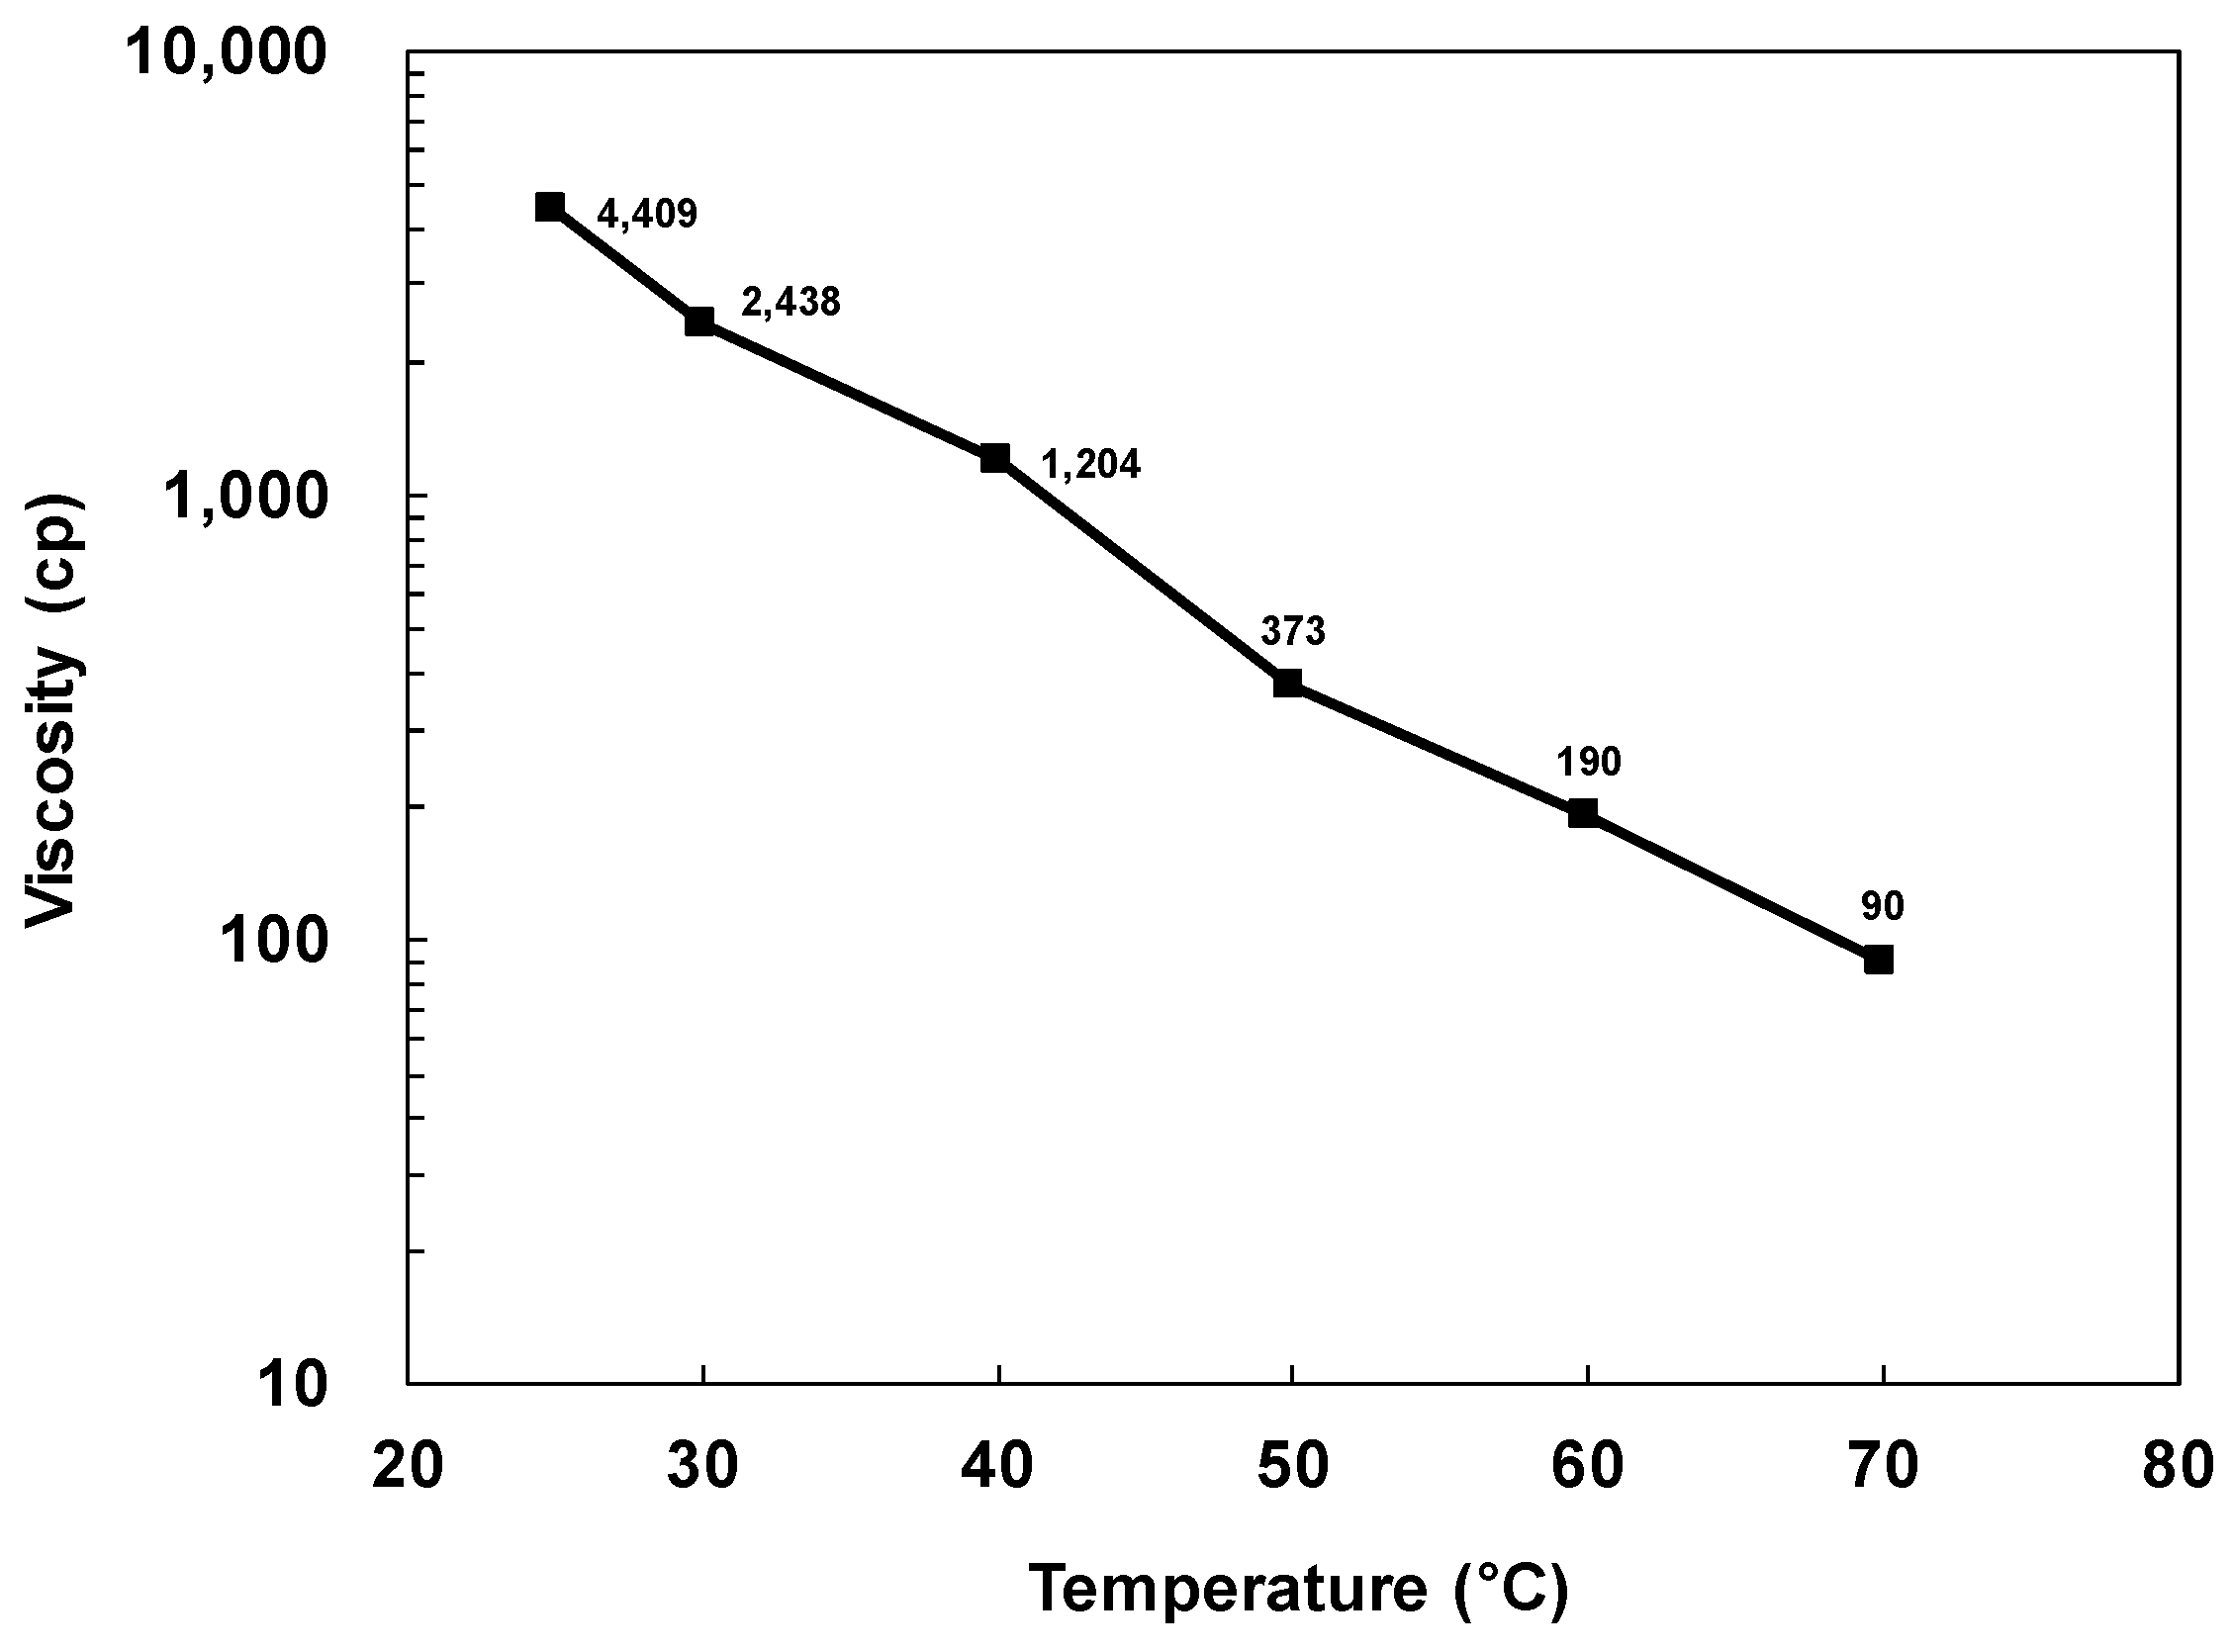
| Fuel | HHV (MJ/kg) | Viscosity (cP at 50 °C) | Density (kg/L) | Elemental Composition (wt%) | ||||
|---|---|---|---|---|---|---|---|---|
| C | H | O 1 | N | S | ||||
| Coffee BCO | 21.14 | 862.3 | 1.06 | 47.12 | 7.72 | 41.08 | 4.08 | 0 |
| Coffee BCO90 | 21.80 | 373.4 | 1.03 | 47.51 | 8.13 | 40.59 | 3.77 | 0 |
| Sawdust BCO [15] | 16.75 | 22.9 | 1.20 | 41.07 | 7.84 | 50.91 | 0.19 | 0 |
© 2020 by the authors. Licensee MDPI, Basel, Switzerland. This article is an open access article distributed under the terms and conditions of the Creative Commons Attribution (CC BY) license (http://creativecommons.org/licenses/by/4.0/).
Share and Cite
Choi, S.K.; Choi, Y.S.; Jeong, Y.W.; Han, S.Y.; Van Nguyen, Q. Characteristics of Flame Stability and Gaseous Emission of Bio-Crude Oil from Coffee Ground in a Pilot-Scale Spray Burner. Energies 2020, 13, 2882. https://doi.org/10.3390/en13112882
Choi SK, Choi YS, Jeong YW, Han SY, Van Nguyen Q. Characteristics of Flame Stability and Gaseous Emission of Bio-Crude Oil from Coffee Ground in a Pilot-Scale Spray Burner. Energies. 2020; 13(11):2882. https://doi.org/10.3390/en13112882
Chicago/Turabian StyleChoi, Sang Kyu, Yeon Seok Choi, Yeon Woo Jeong, So Young Han, and Quynh Van Nguyen. 2020. "Characteristics of Flame Stability and Gaseous Emission of Bio-Crude Oil from Coffee Ground in a Pilot-Scale Spray Burner" Energies 13, no. 11: 2882. https://doi.org/10.3390/en13112882