Article

Commercial Biogas Plants: Lessons for Ukraine

by
Valerii Havrysh
1,
Antonina Kalinichenko
2,3,
Grzegorz Mentel
4,* and
Tadeusz Olejarz
5
1
Department of Tractors and Agricultural Machines, Operating and Maintenance, Mykolayiv National Agrarian University, 54020 Mykolayiv, Ukraine
2
Institute of Environmental Engineering and Biotechnology, University of Opole, 45-040 Opole, Poland
3
Department of Information System and Technology, Poltava State Agrarian Academy, 36003 Poltava, Ukraine
4
Department of Quantitative Methods, The Faculty of Management, Rzeszow University of Technology, 35-959 Rzeszow, Poland
5
Department of Management Systems and Logistics, The Faculty of Management, Rzeszow University of Technology, 35-959 Rzeszów, Poland
*
Author to whom correspondence should be addressed.
Energies 2020, 13(10), 2668; https://doi.org/10.3390/en13102668
Submission received: 13 April 2020 / Revised: 17 May 2020 / Accepted: 21 May 2020 / Published: 25 May 2020
(This article belongs to the Special Issue Financial Development and Energy Consumption Nexus)

Abstract

:
Ukraine has enough biomass resources for biogas production. However, this energy potential is not used sufficiently. This research is aimed at examining the current experience of commercial biogas systems in the Europe Union and its adaptation for Ukraine. Special attention was paid to economic indicators, such as specific investment costs, production costs (biogas, biomethane, and electricity), and incentives. Using statistical data for the European Union and Ukraine, the biogas potential for Ukraine (based on European experience) was determined. The economic competitiveness of biogas production was evaluated compared to alternatives, such as photovoltaic, wind power, biomass, conventional fuels, and liquid biofuels. The results showed that biogas complexes have higher specific investment costs and produce more expensive electricity. It was highlighted that agricultural residues and industrial waste are sustainable feedstocks for biogas systems. A perspective biogas plant is a plant that is an integrated part of the circular bioeconomy that is based on organic residues. Biomethane production (as a substitution for vehicle fuel) combined with capture and utilization of carbon dioxide is a more profitable pathway. Awareness and perception of the importance of biogas are key factors for the development of the biogas industry. To develop an effective strategy for the biogas industry, it is necessary to create a positive image in order to raise awareness and knowledge of biogas technologies.

1. Introduction

Ukraine is striving to integrate into the European Union (EU). To do this, it must harmonize its national legislation and energy policy. The energy and climate policy of the EU has support schemes to promote the development of renewable energy resources, including biogas. Biogas is produced from organic feedstock by means of anaerobic digestion and consists of methane (55%–70%), carbon dioxide (27%–44%), hydrogen sulfide (up to 3%), and others. Its lower heating value ranges from 17 to 23 MJ/m3, which is higher than syngas.
There are vast opportunities for Ukraine to increase the use of renewable energy, following global trends. In 2017, renewable energy supplied a 10.6% share of global total final energy consumption [1]. Renewable energy includes biofuels (solid, liquid, and gaseous). Biogas is produced from different feedstock sources, including livestock manure, agrarian residues, energy crops, landfills, and municipal and industrial waste [2,3,4,5,6]. Biogas can be stored and used on demand. This is an important advantage of biogas compared to solar and wind power systems [7].
Globally, there are several types of biogas plants. In Asia, biogas plants are mainly family-sized units and generate biogas for household use [8,9,10]. The governments of China and India are striving to install larger biogas plants for power and heat generation. In European countries and the Americas, the majority of biogas plants are large-scale facilities. They provide heat and electricity to municipal or national grids, and renewable natural gas (upgraded biogas) to the natural gas grid and vehicle refueling stations [11]. Biogas upgrading to biomethane is the removal of carbon dioxide, ammonia, hydrogen sulfide, water, and other compounds in order to increase the methane.
Large-scale commercial biogas plants aim to meet internal energy needs for manufacturing companies or to make a profit by selling energy resources (electricity, heat, biomethane) and coproducts [12]. Biogas produced from agricultural residues and industrial and municipal waste does not compete with food production, unlike liquid biofuels from energy crops. Moreover, its production can improve sanitation and organic waste management.
Medium- and large-scale biogas plants are more profitable than household biogas digesters. Their biogas production costs are lower due to economies of scale and the use of advanced technologies [13]. The key benefits of biogas production and utilization are job creation and a reduction in the importation of energy resources, resulting in an improvement in energy security indicators, environmental management, and reduced risk of land degradation [14,15,16].
A number of studies point to the high potential of the biogas industry for national economies [4,5,6,7]. The use of organic waste resources as biogas feedstock may give multiple benefits. Biogas plants can improve the environmental management of solid and liquid waste from agricultural, municipal, industrial, and food processing facilities [17]. For example, untreated municipal and industrial wastewater pollutes water resources [18,19,20,21], while dumping solid waste and manure from livestock farms results in the emission of greenhouse gases (GHGs) [22].

2. Literature Review

The biogas industry and its national applications have been popular research topics for a number of countries, including:
  • Trends, subsidies, consumption, and cost evaluation in Italy [23];
  • An assessment of biogas market potential in the USA [24];
  • Prospect of biogas transportation grid in the Netherlands [25];
  • Support schemes for biogas in the European Union [26];
  • Development and perspectives of biogas in the European Union [27];
  • Biogas innovation systems in Brazil [28];
  • Lesson from Denmark, Germany, and Italy in biogas and biomethane production [29];
  • Sustainability of biogas production in Finland [30];
  • Experiences and perspectives from Denmark, China, Poland, and other countries [31,32,33].
Ukraine has great potential for biogas production from agricultural residues, energy crops, food processing by-products, and landfills. Despite this, there are few implemented projects in Ukraine. The opportunities and threats from biogas production are of great interest to researchers [34,35]. Trypolska et al. proved that the development of biogas production results in positive macroeconomic effects, including gross domestic product growth, a decrease in fossil fuel consumption (coal, natural gas, etc.), and a reduction of greenhouse emissions [36,37,38]. International experiences have also been studied [39]. Bilan, Goncharuk, Nitsenko, and other scientists studied the alternative fuels market, the theoretical aspects of vertical energy integration [40,41,42], and the specifics of biogas production in agriculture [43]. The experiences of individual digesters in India were analyzed so as to use them in Ukraine [44].
Ukraine has great untapped potential for large-scale biogas systems. The potential target users of large-scale biogas plants could be agricultural holdings, food processing facilities, and wastewater and solid waste facilities of local authorities [45]. A number of countries have used large-scale biogas facilities for many years and gained valuable experience in renewable gaseous fuel production and utilization. Therefore, Ukraine should learn and use their experience in order to benefit from the advantages of green technology [13].
The purpose of this article is to study the experience of large-scale, commercial biogas systems in order to facilitate their development and dissemination in Ukraine. All types of feedstock, energy resources (biomethane, electricity, heat, and a combination of these), coproducts, and biogas utilization pathways are considered. The results of this research may be useful in assessing the attractiveness of biogas projects for both native businesses and international investors.
This research is based on previous studies of alternative fuel markets [40], the efficiency of biogas utilization pathways [46,47,48], and agricultural feedstock availability [49,50,51].

3. Materials and Methods

Bibliographic research, necessary documents, and data were used in this study. A set of relevant criteria was used to analyze the collected information. Landfill and sewage gases were not the subject of our research. Biogas production and its utilization were examined using available statistical data International Renewable Energy Agency (IRENA), EurObserv’ER Report, German Biogas Association, International Energy Agency (IEA) Bioenergy, reports, and results of research. These data include electricity generation, heat production, and biomethane production.
In this study, the following criteria were used: inventory, economic, utilization pathway, sustainability. The inventory criteria included support programs (incentive and subsidy programs). The regulatory criteria considered national quality standards. It was necessary to identify barriers within a country. The utilization pathway criteria considered the major distribution and utilization directions. They informed which branch of the economy uses biogas and which utilization pathway is profitable. The economic criteria comprised specific investment costs, production costs, and energy costs for biogas and its derived energy resources, including biomethane, electricity, and heat. The sustainability criterion studied whether residues, waste, or by-products (agricultural and food processing) are used for biogas production. Energy crops require arable land, water, and fertilizers, meaning biogas production cannot be sustainable.
A broader review addressing achievements in the biogas industry worldwide was carried out.
In this study, the power data were presented in kW and MW. To measure the energy production, tons of oil equivalent (toe) and GWh were applied. The relationship between these energy units was as follows: 1 toe = 0.01163 GWh = 41,870 MJ.
The indexing method was used to analyze the history of renewable energy and biogas production. The energy production index is an annual indicator measuring real output in renewable industries relative to a base year. The base year was 2009 and the current index is equal to 1. To calculate the energy production index, the energy production in any given year is divided by the energy production in the base year.

4. Results

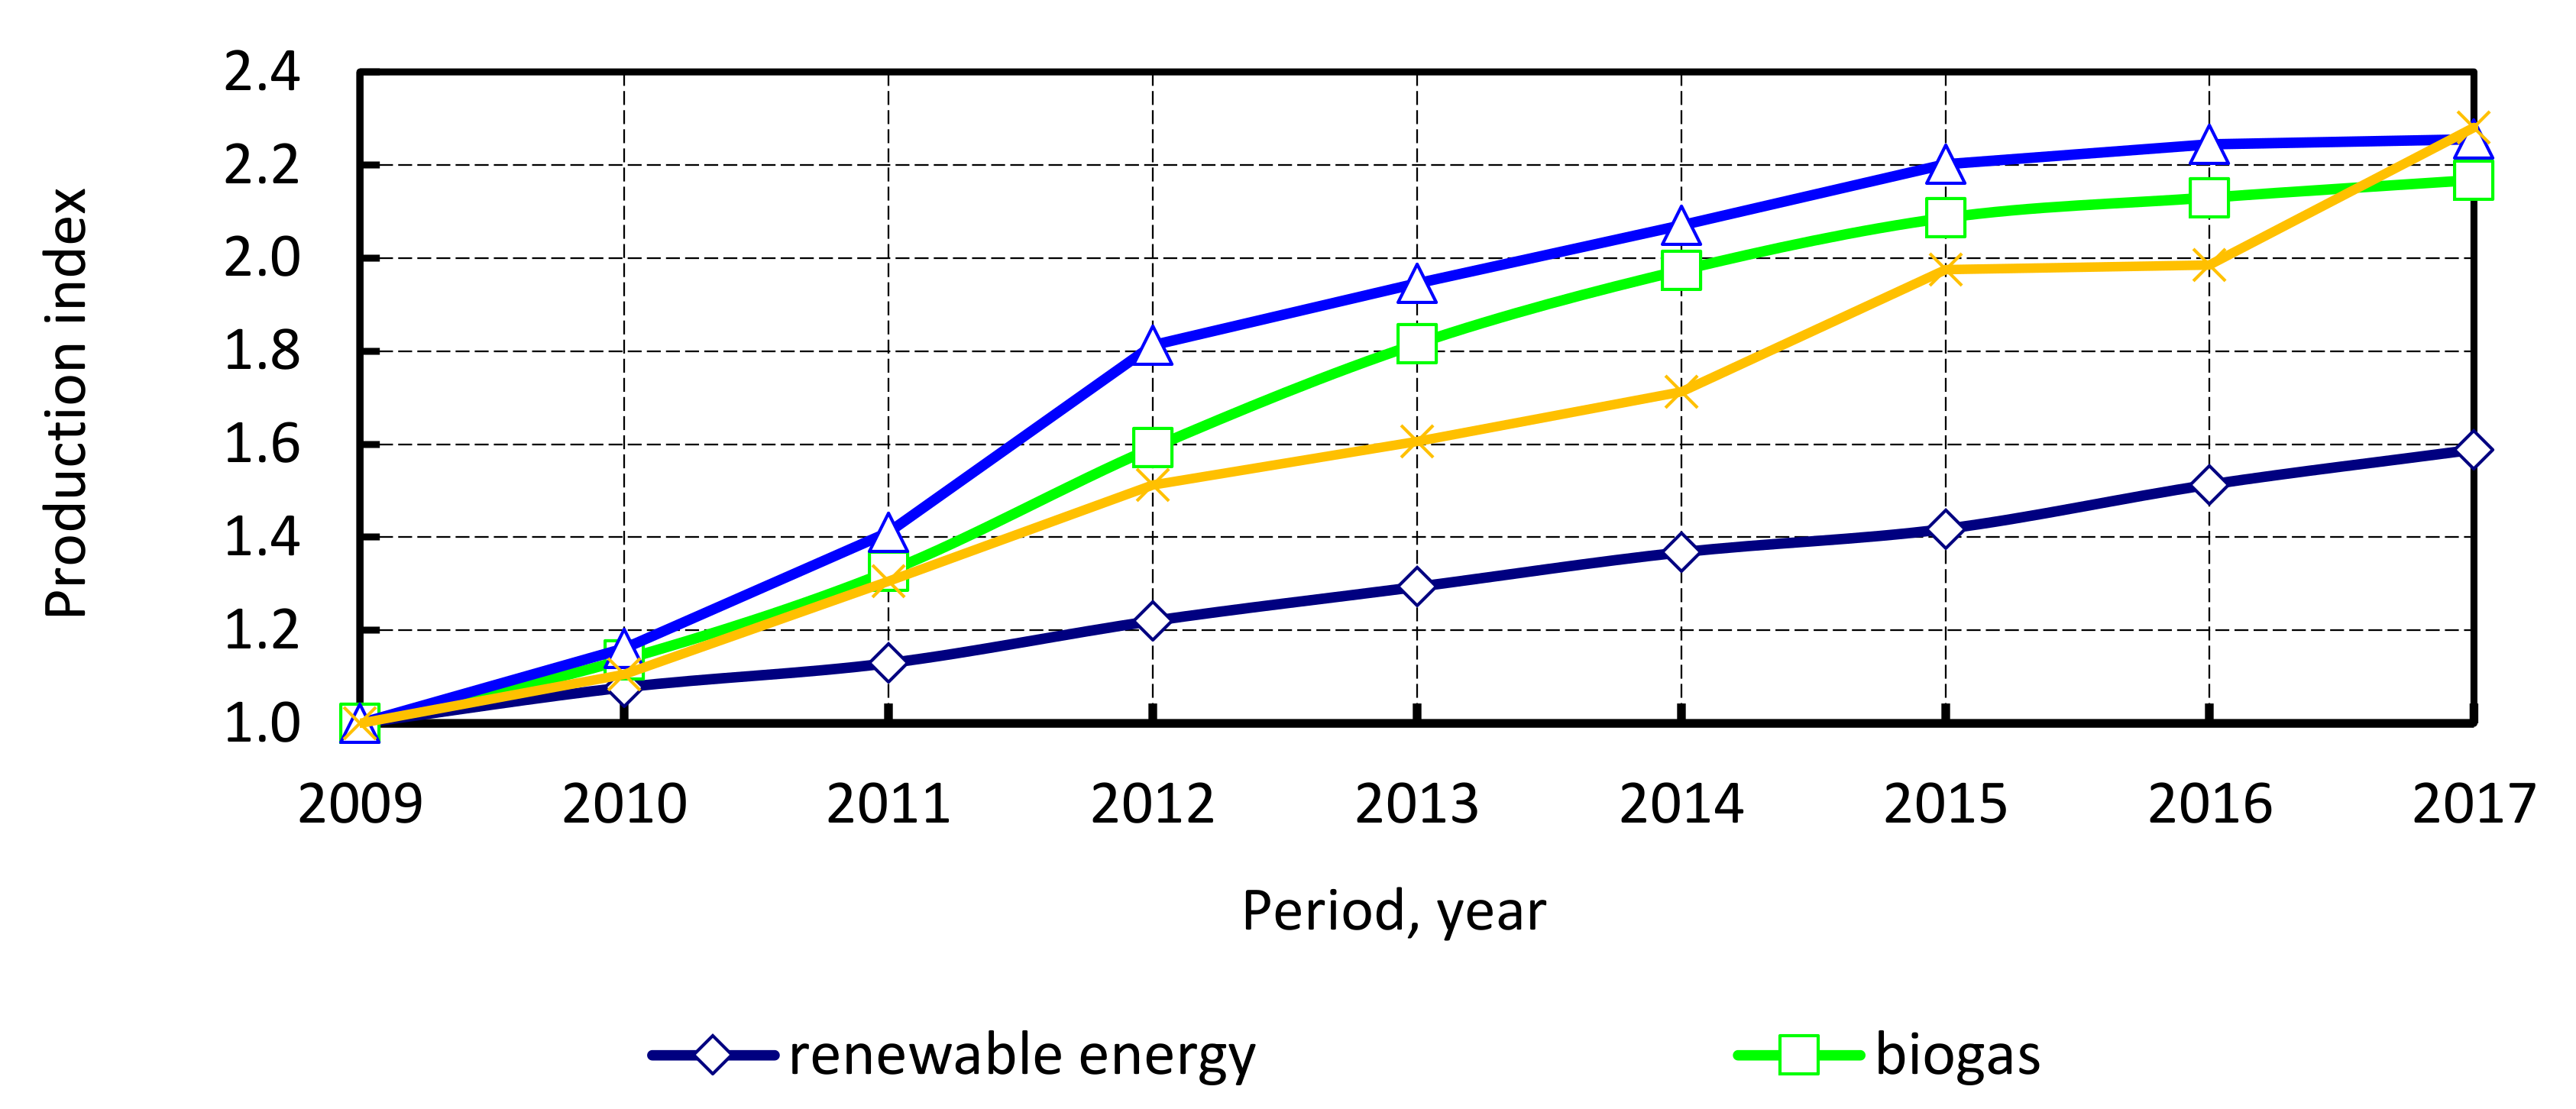
4.1. Global Renewable Energy Status

Since 2008, total renewable energy production has increased by 58% [52]. Meanwhile, global biogas production has grown by 220% (Figure 1) [52]. While the total renewable energy production has been gradually increasing, the global biogas production has almost peaked.
The current share of biogas of total energy production is 1.32%. This indicator varies widely for different countries, ranging from 0.76% for Ukraine to 15.66% for Germany.
The largest biogas producers are China, the USA, Germany, the United Kingdom, and Italy. Biogas is used for heating, electricity generation, and biomethane production. There are national features of biogas utilization. For example, in China almost 100% of biogas is used for heating. In the USA, around half of biogas is used for electricity generation (electricity only plants and cogeneration plants). In European countries, around 90% of biogas is used for electricity generation. The total share of biogas used as vehicle fuel does not exceed 1% [53].
The maximum possible capacity of any renewable power plant must be taken into account when any power supply system is developed. The above value depends on the type of renewable energy power plant (Table 1). The capacity of biogas plants is much lower compared to other types of power plants. Therefore, biogas plants can meet local energy requirements and can be an auxiliary component of an electricity supply system.

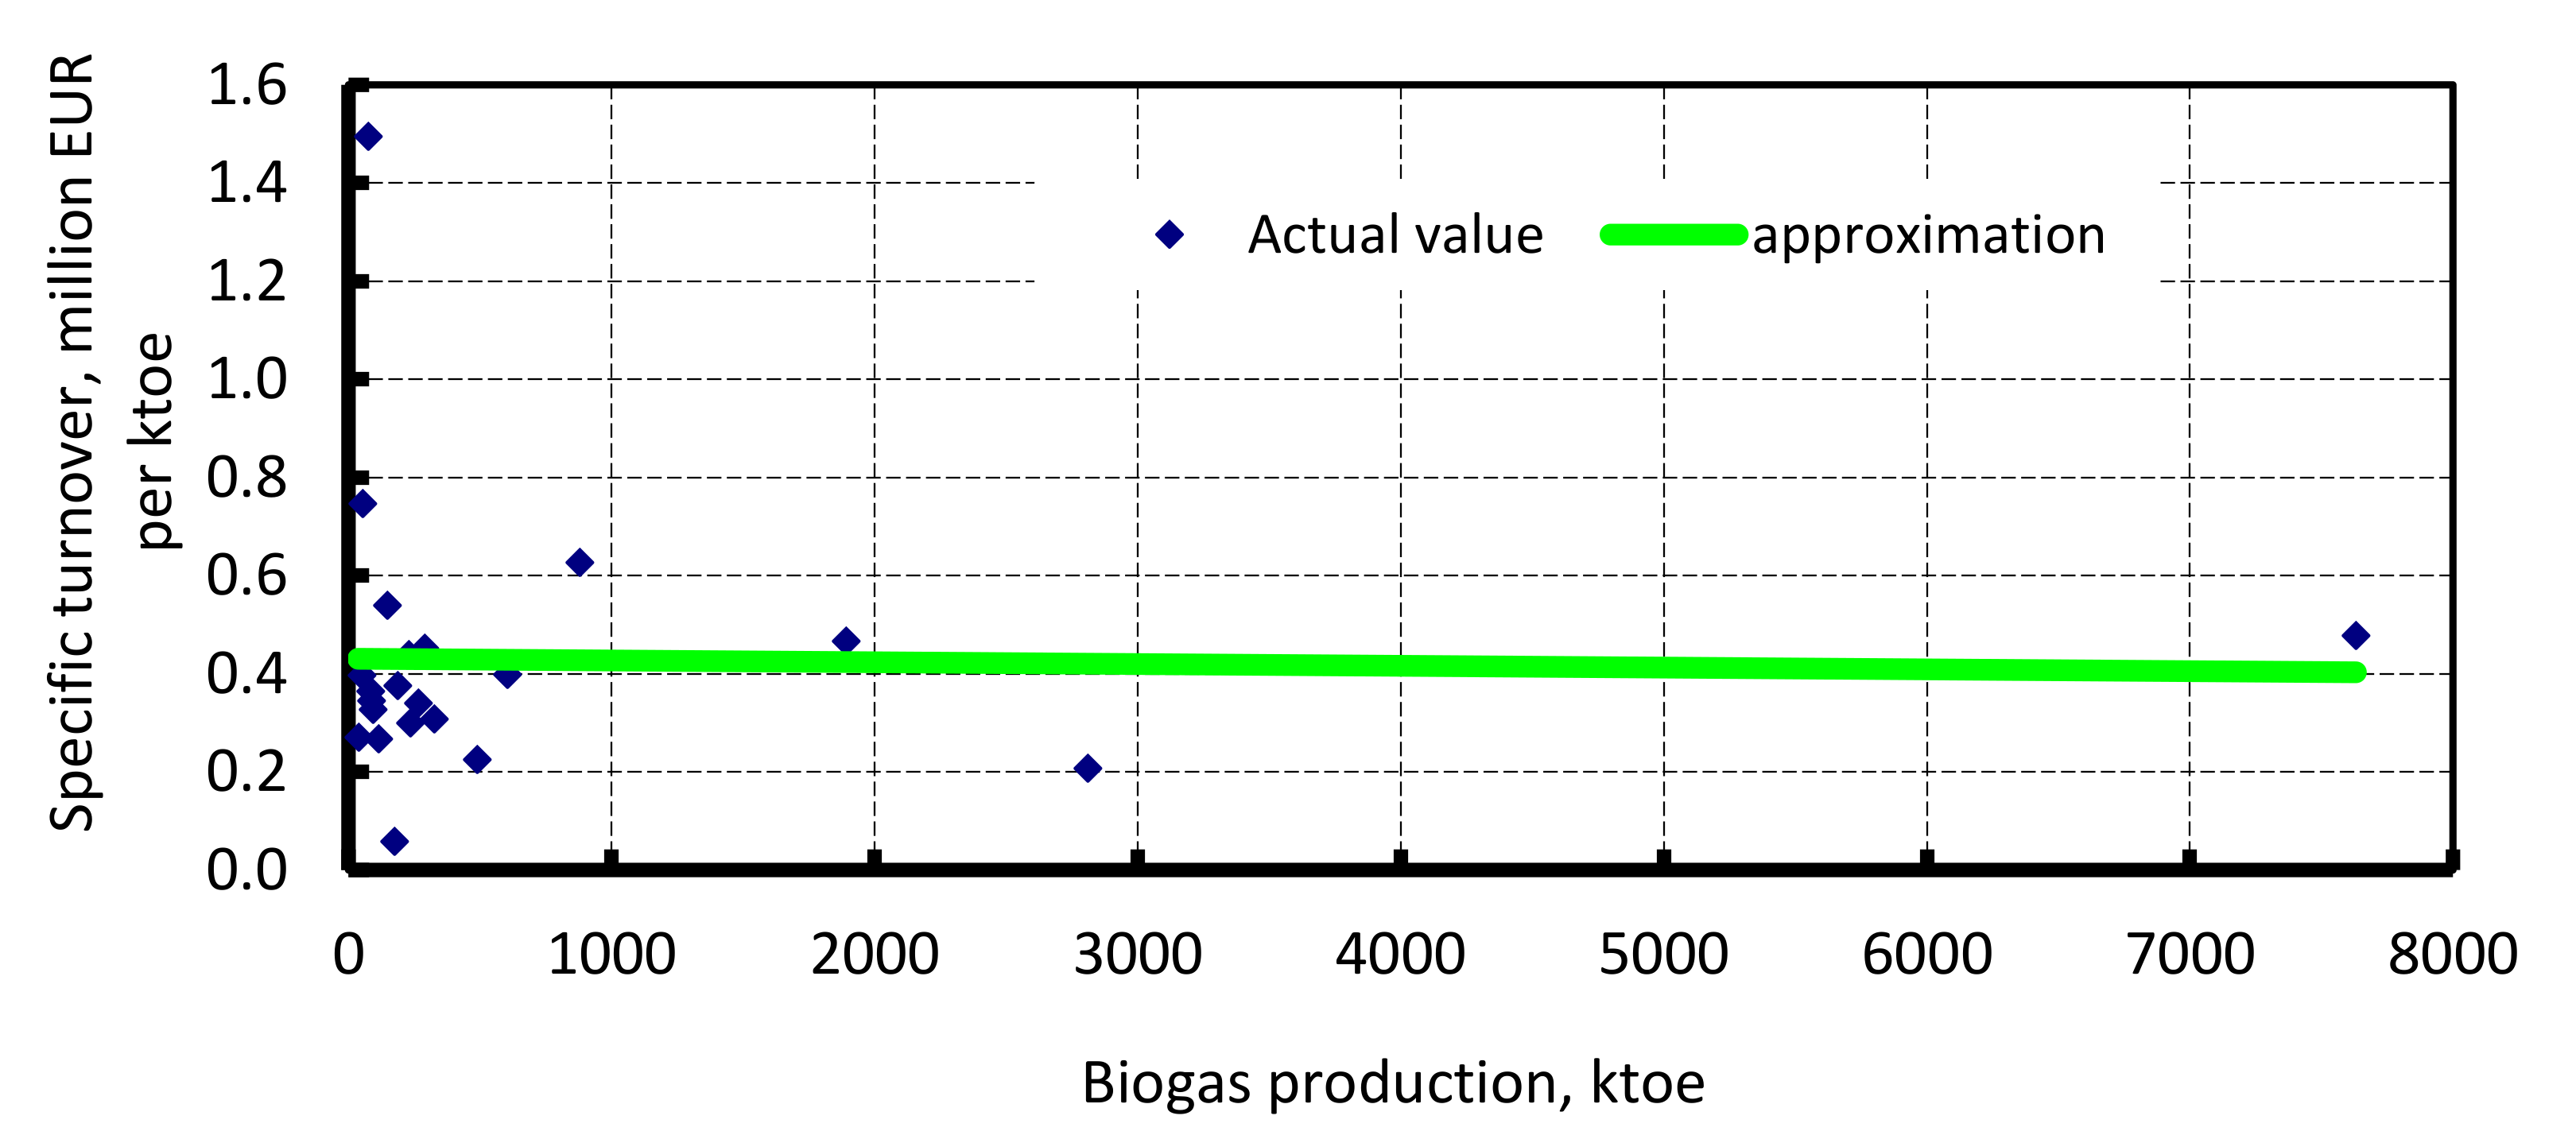
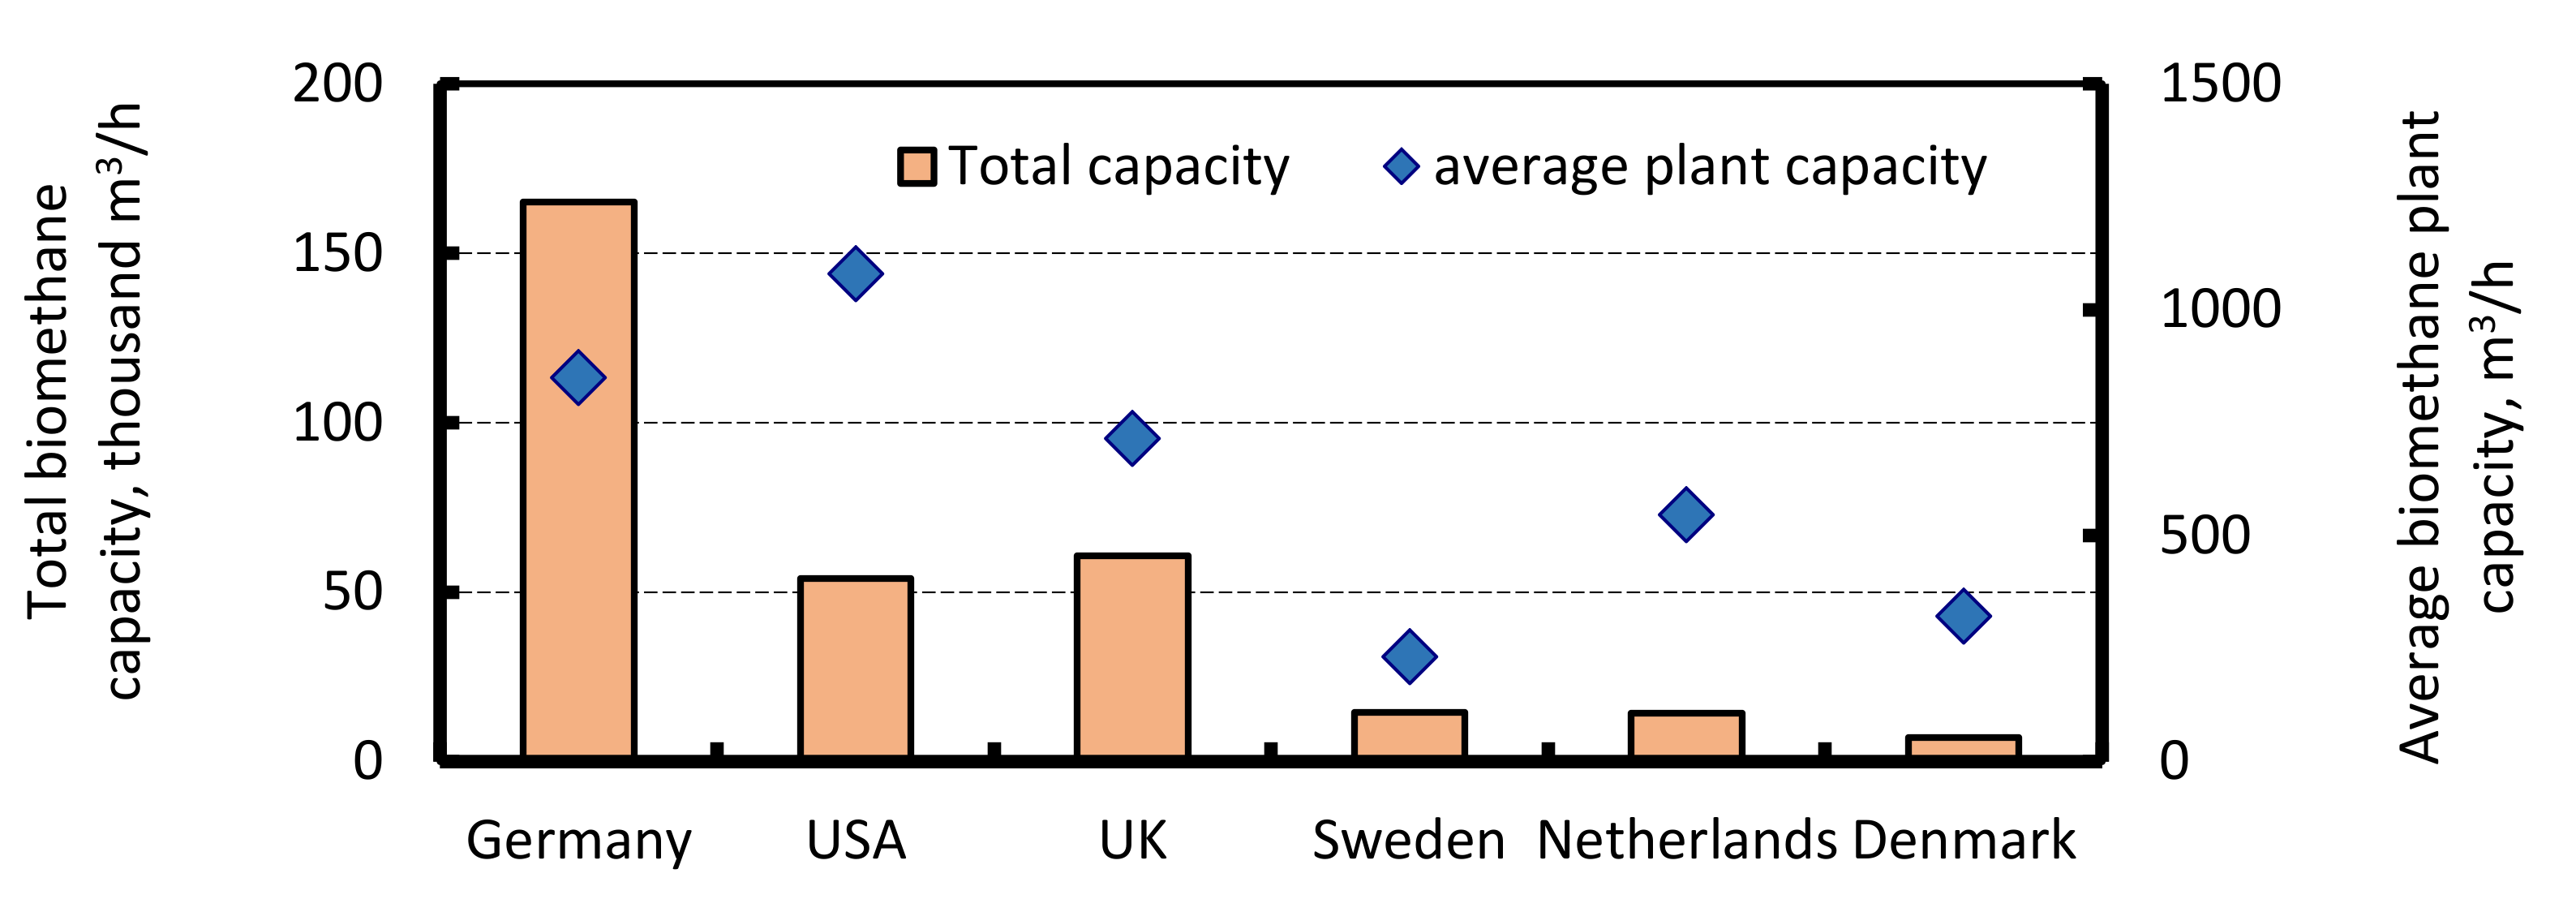
4.2. Current Biogas Production and Utilization Status in the European Union

According to Eurostat in 2018, there were 16,500 biogas plants. Biogas production for 2018 was stable, reaching 16,838.7 ktoe, or 195,834.08 GWh. The share of biogas from anaerobic digestion was 74.68%. This was slightly more than in 2017 (74.30%). The top producers were Germany (7631.1 ktoe), the United Kingdom (2809.2 ktoe), and Italy (1892.2 ktoe). Electricity production from biogas in the EU was 61,025.6 GWh. This means that around 152,564 GWh (or 13,118.14 ktoe) of biogas was used for electricity generation. The electricity was generated by both combined heat and power (CHP) plants (70.8% of the total electricity production) and electric power plants (29.2% of the total electricity production). Biogas was used to produce heat equaling 9986.6 GWh, or 35,951.76 TJ. CHP plants produced 96.1% of total heat production. In total, 187.2 ktoe of biogas, or 1.11% of total biogas production, was consumed as vehicle fuel [64,65].
If a biogas plant uses energy crops (for example maize silage) as substrates, then transport costs will influence biogas production costs. This fact limits the maximum power of a biogas plant. The biogas industry in Germany is an example [62].
The European Biomethane Observatory reports that European countries has 621 biogas upgrading plants. However, only eight countries use biomethane (upgraded biogas) for transport: Sweden (118.5 ktoe), Germany (33.4 ktoe), the United Kingdom (14.1 ktoe), the Netherlands (7.2 ktoe), Denmark (5.2 ktoe), Finland (4.7 ktoe), Estonia (3.3 ktoe), and Italy (0.4 ktoe) [65].
The biogas industry has created 688,00 jobs in the EU. In 2018, the turnover of this industry was 7.01 billion EUR, or 93.2% of the amount from 2017 [65]. The average specific turnover is around 0.4 million EUR per ktoe (Figure 2). The above value is practically constant; however, there are significant deviations if national biogas production is less than 1000 ktoe.
Feedstock (availability and cost) has a significance impact on the biogas production cost. One of the ways around this is to use residues from agro-industrial mills, for example sugar and ethanol mills. This allows stakeholders to use heat and electric energy produced from biogas to meet their own energy requirements. There are currently some projects involving the combined production (when the biogas production is integrated into a processing plant) and utilization of biogas. These projects are implemented in Lithuania, Germany, Italy, the USA, and other countries [66,67,68].
Countries have different climate conditions (soil, rainfall, temperature, etc.) and agricultural technologies resulting in biomass formation. The above points must be factored in to give an accurate comparison. Germany has higher specific biomass production due to having a considerable area producing maize silage [69]. To determine a national target, the adjusted specific biogas production has to be calculated. To estimate the biogas production potential for Ukraine, some indicators were analyzed. Biomass produced per unit of area must be taken into account:
B M S = i = 1 n A i Y i 1 + R C R i A 0 ,   t / ha ,
where Ai is the area of ith crop, ha; Yi is the yield of ith crop, t/ha; A0 is the total area of arable land, ha; and RCRi is the residue to crop ratio of ith crop.
To adjust the potential biogas production, we suggest using an adjustment factor:
A F = B M S B M S 0 ,  
where BMS0 is the specific biomass production of a base variant, t/ha.
The biogas production target for Ukraine is calculated in Table 2. Statistical data for German, the EU, and Ukrainian agriculture were used for calculations [69,70,71]. Reserves of biogas production were determined and were computed as the difference between the potential biogas production and the actual biogas production. The potential biogas production was determined by taking into account the national biomass production and maximum specific biogas production (per unit of biomass) achieved by Germany. The obtained results show that if the countries in the EU have reserves of 55.5% of current biogas production, then Ukraine uses only 0.25% its own potential output.

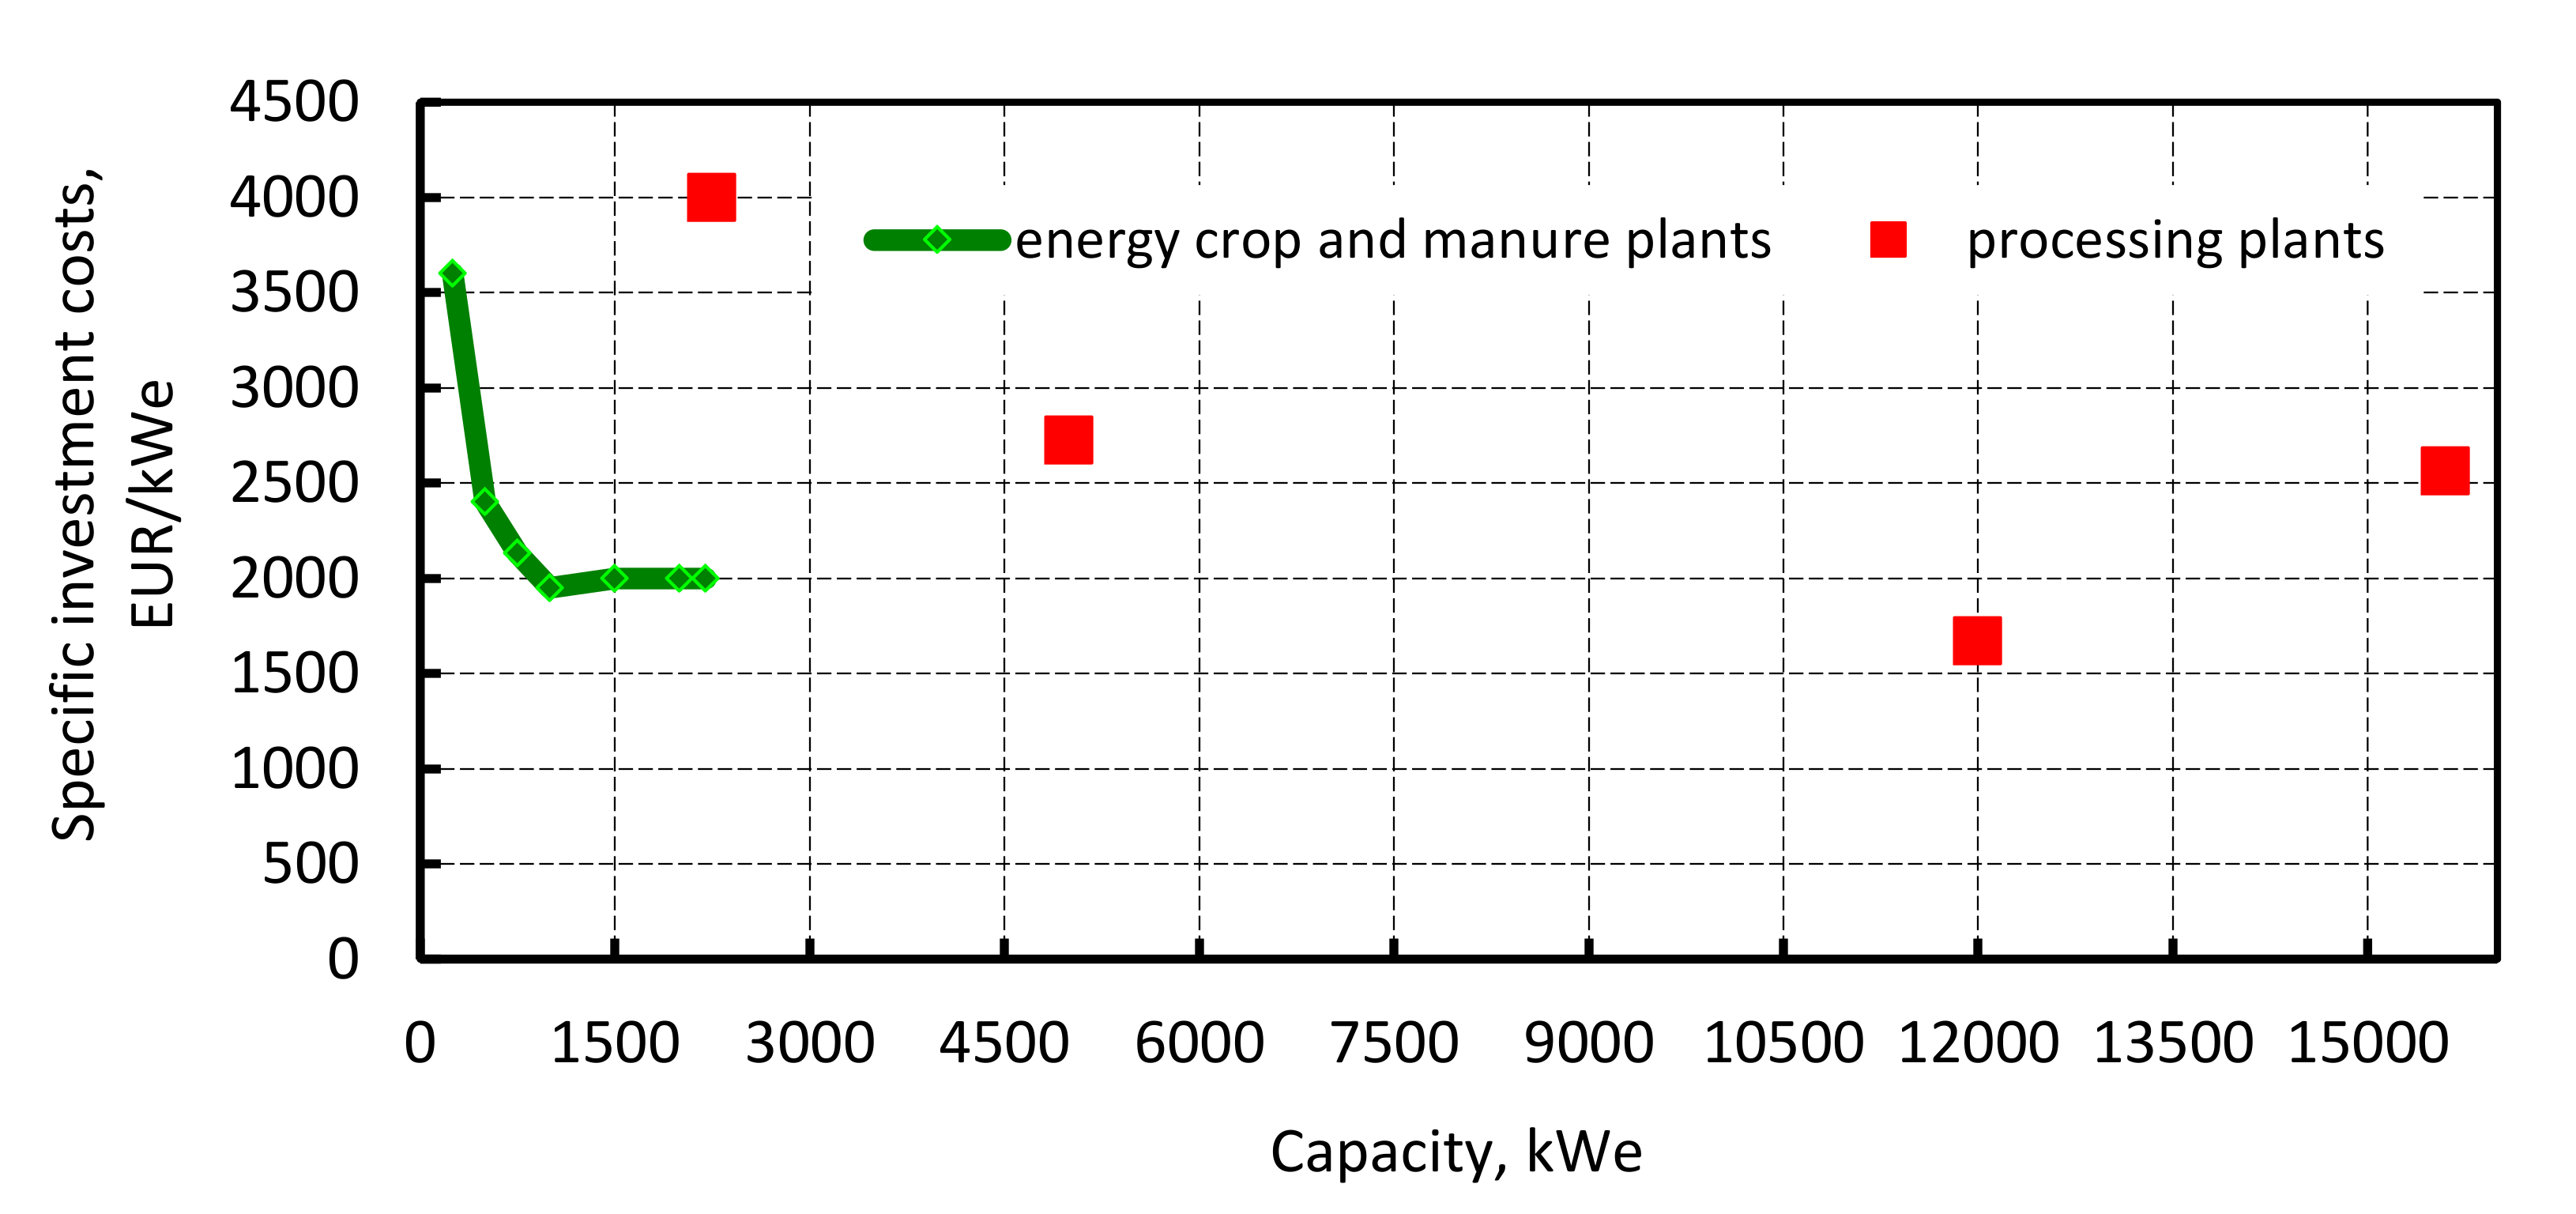
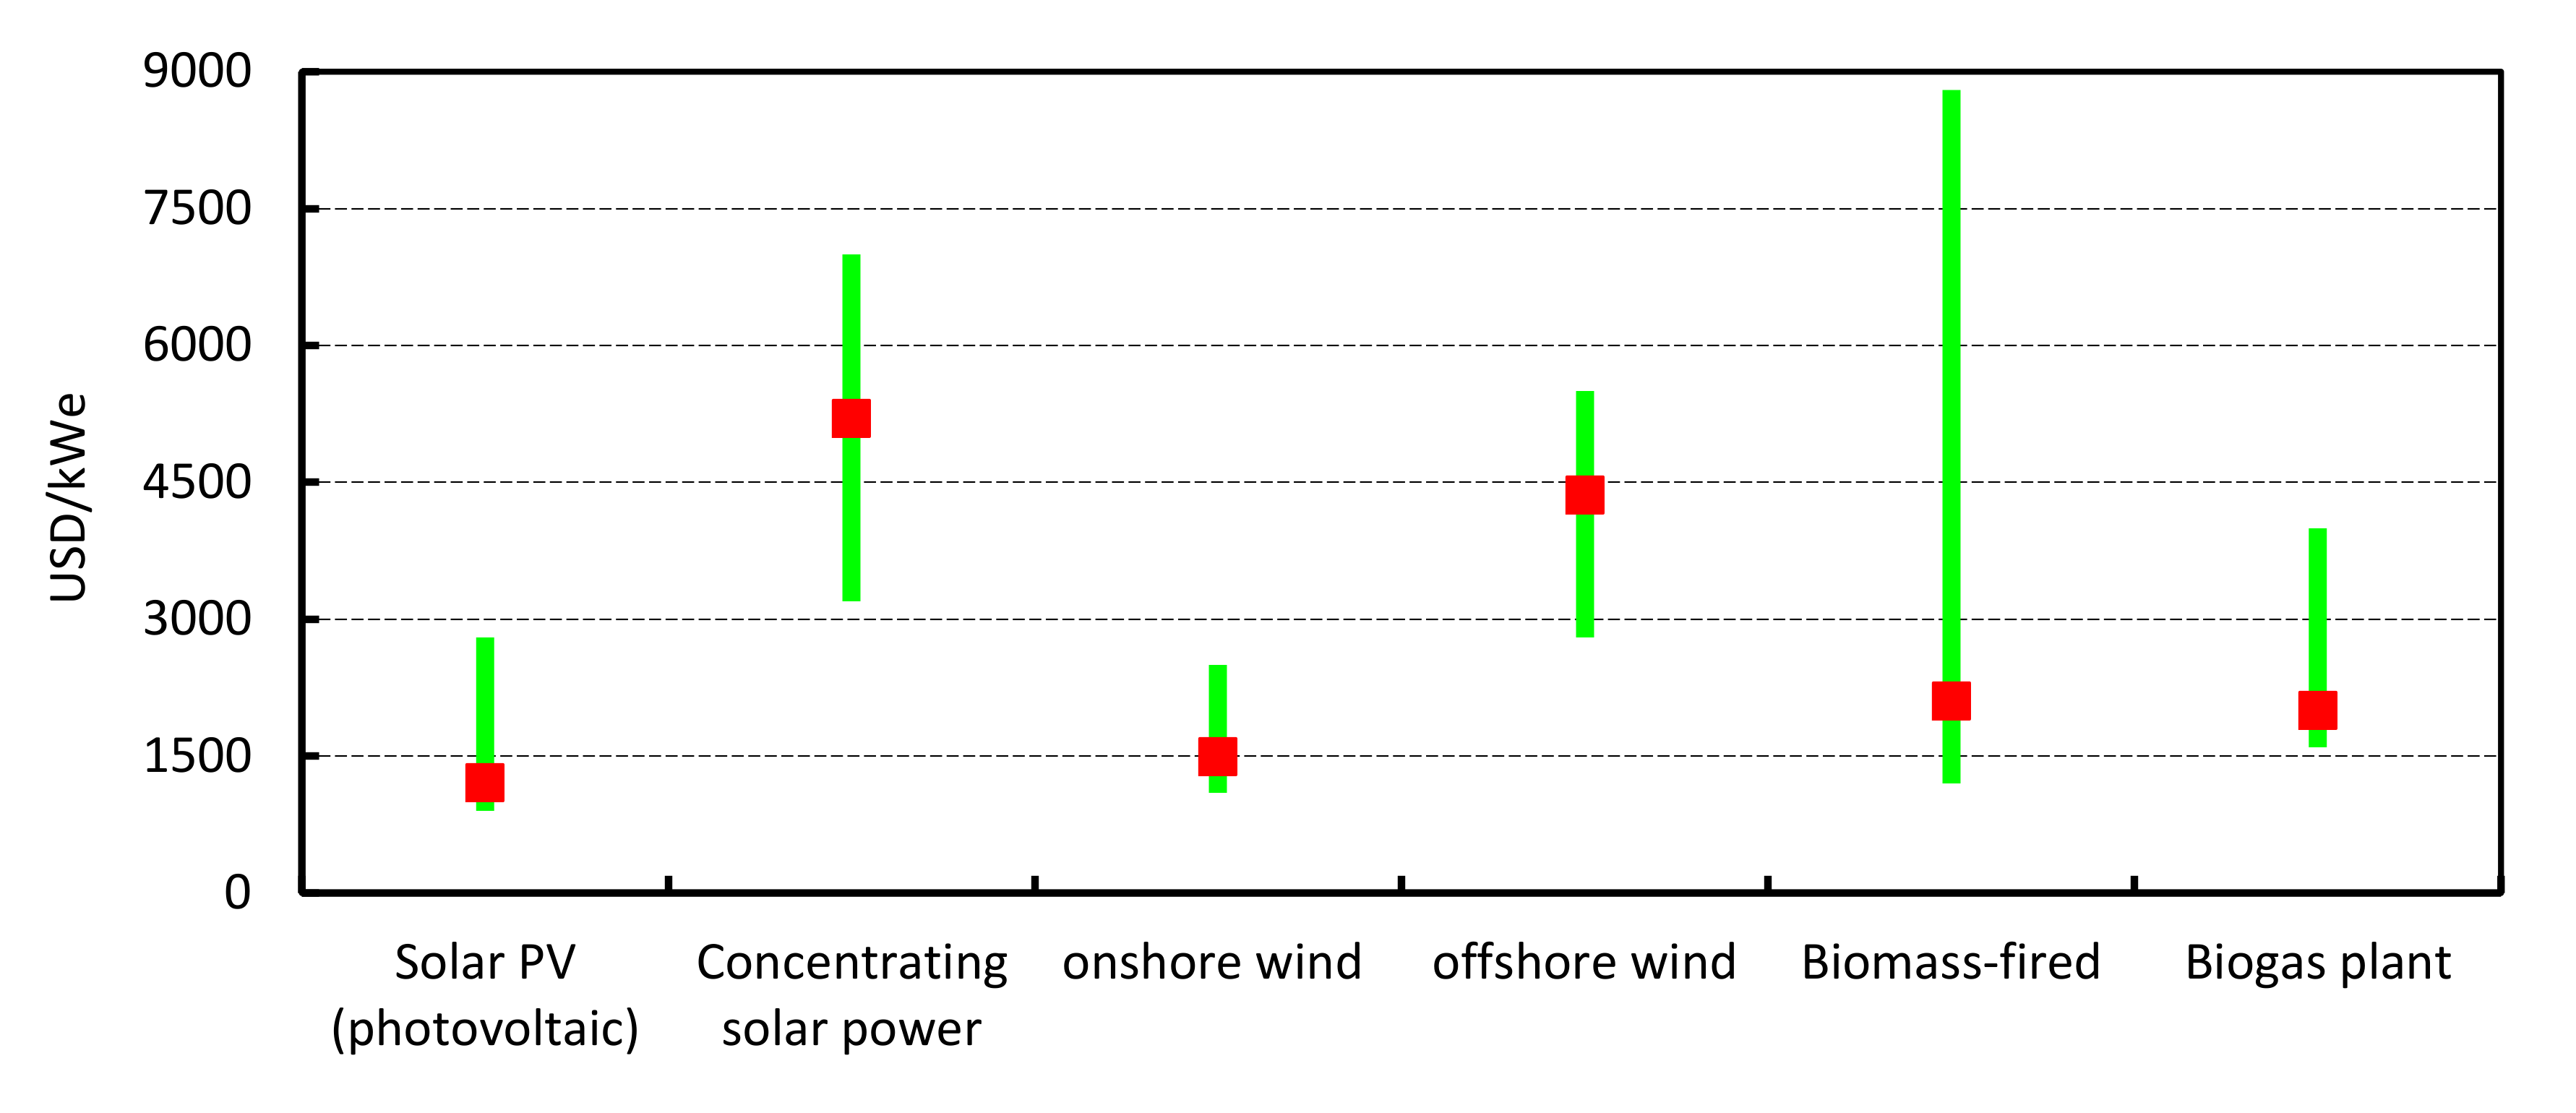
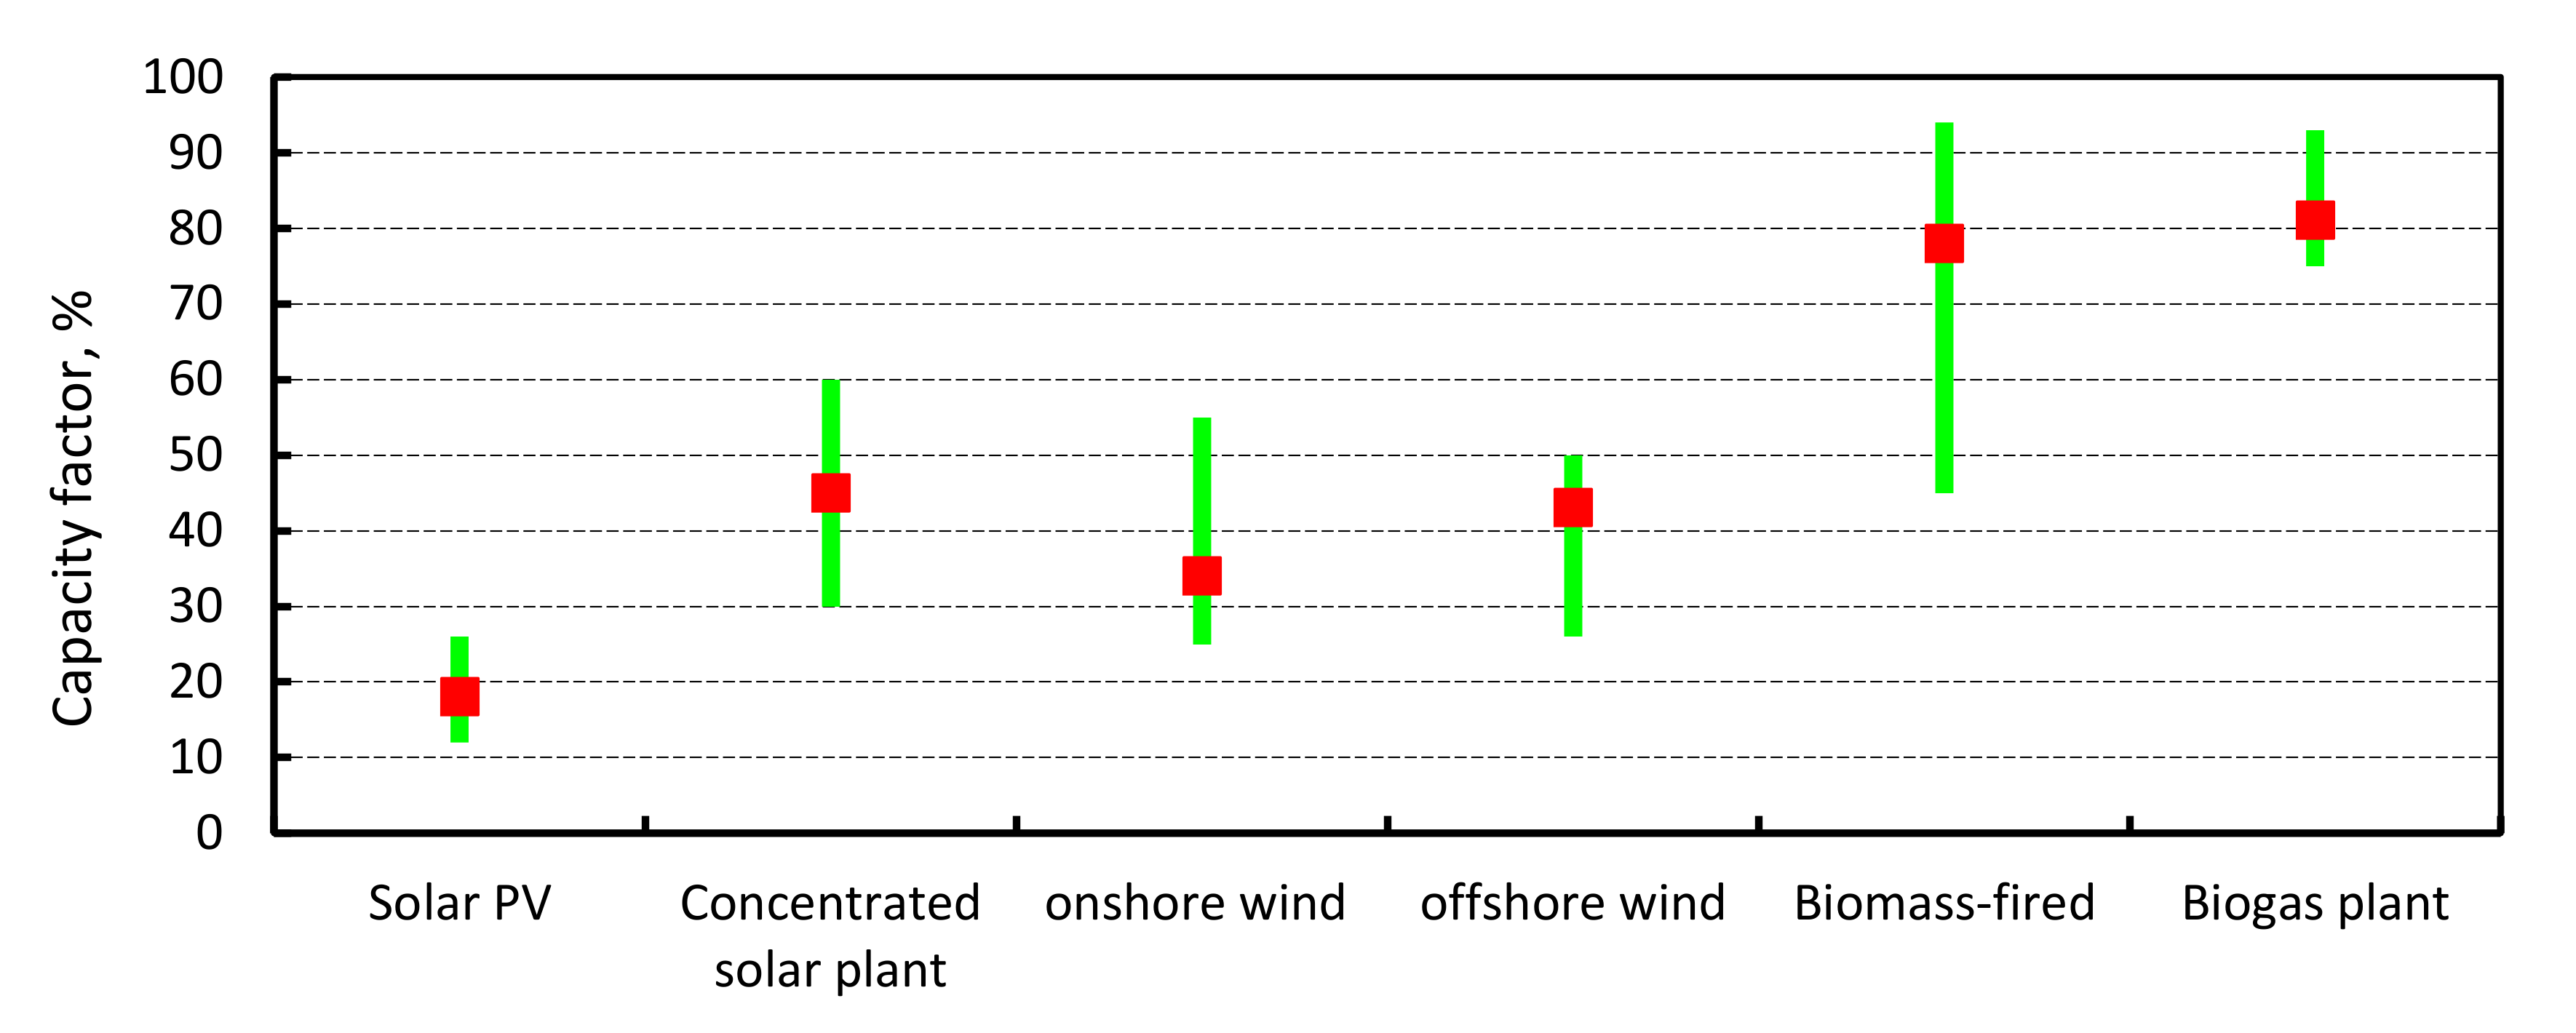
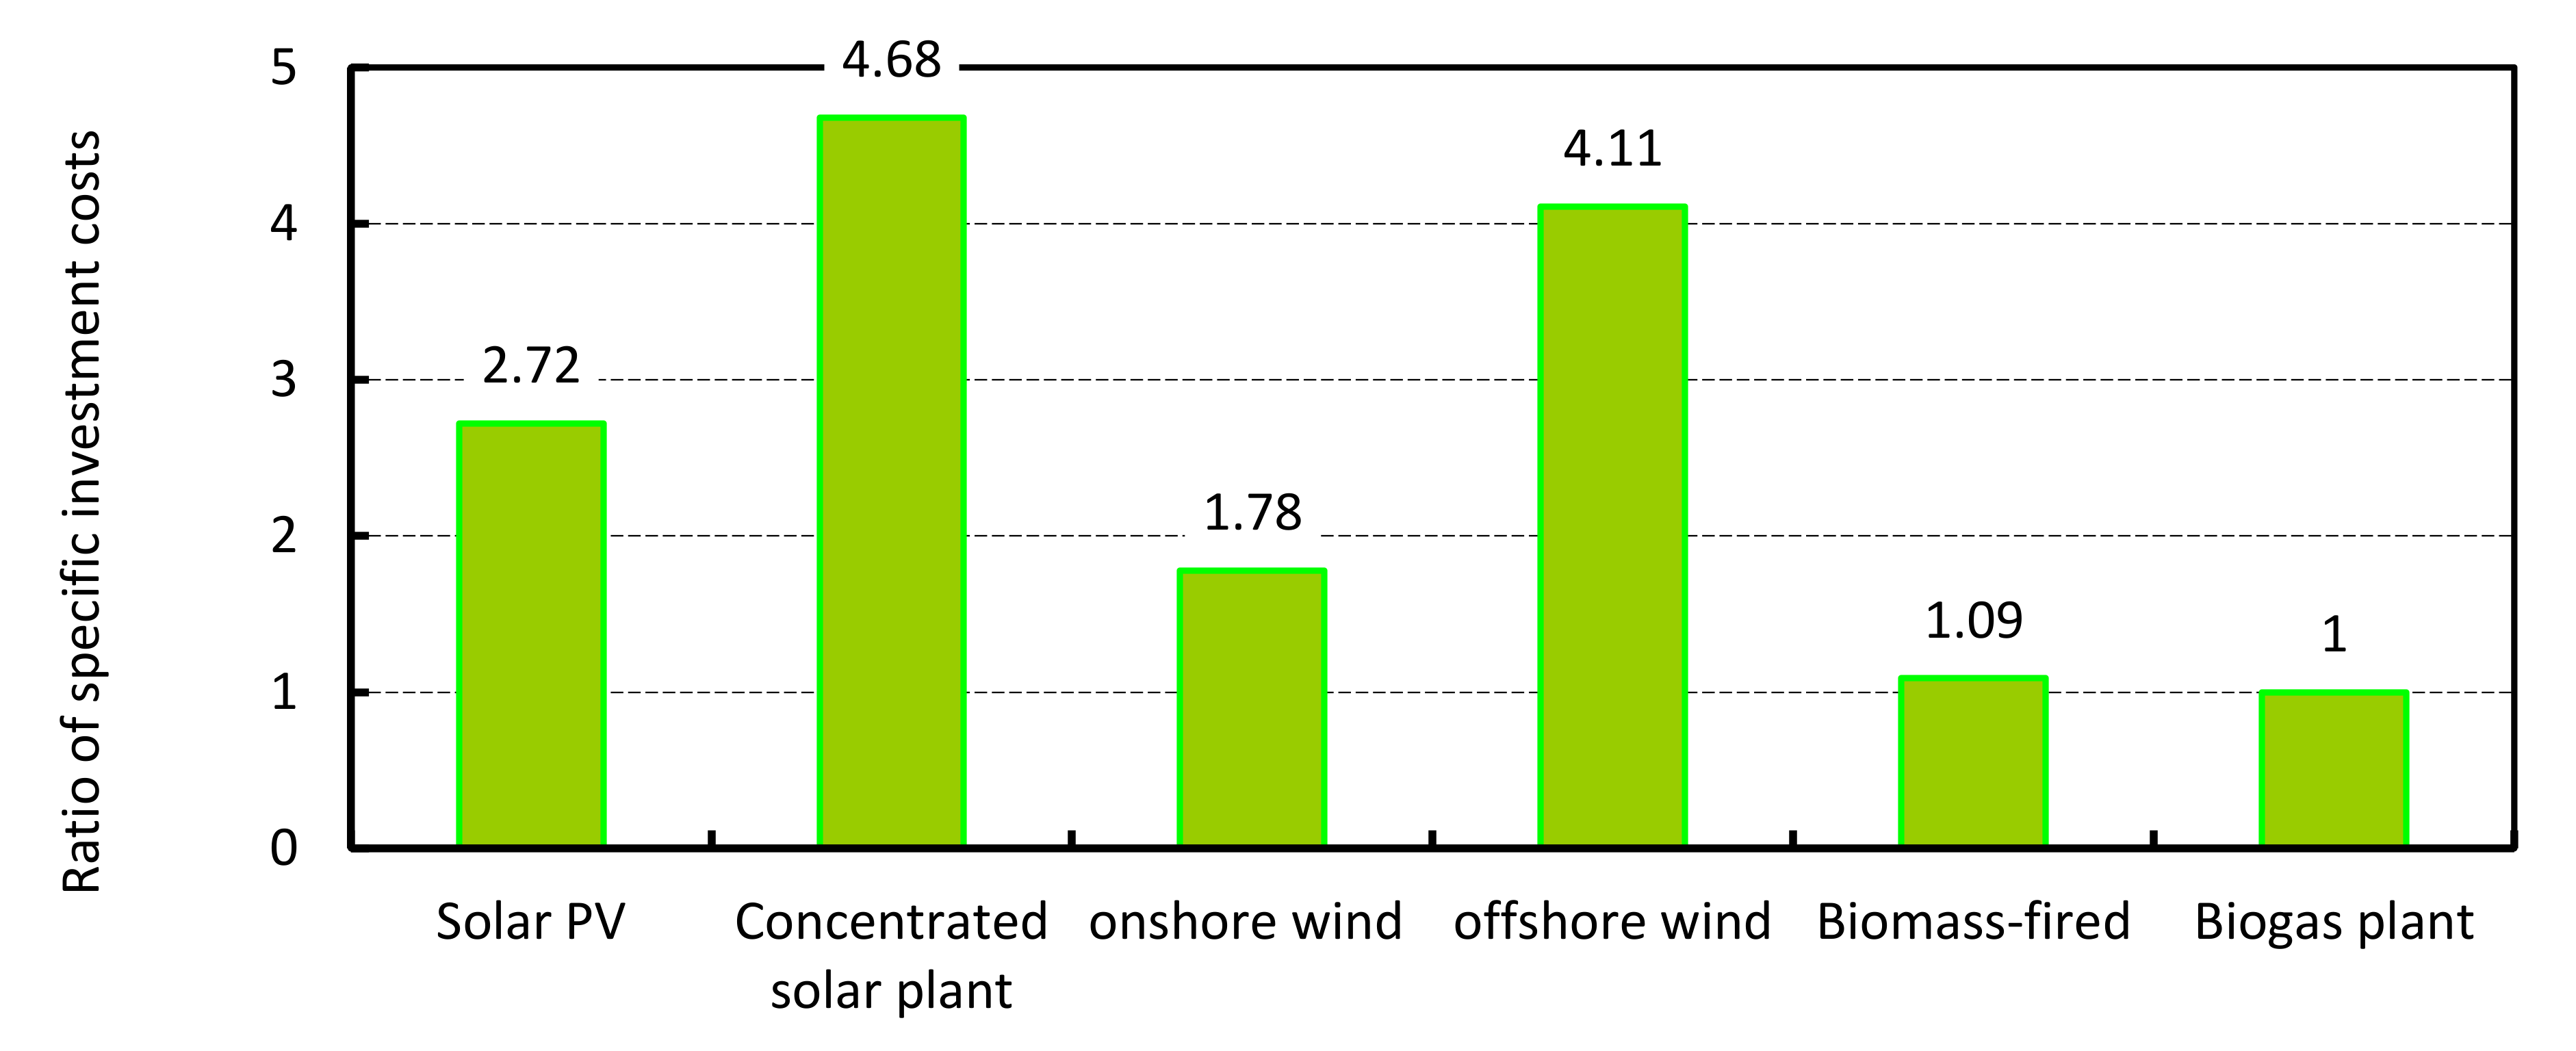
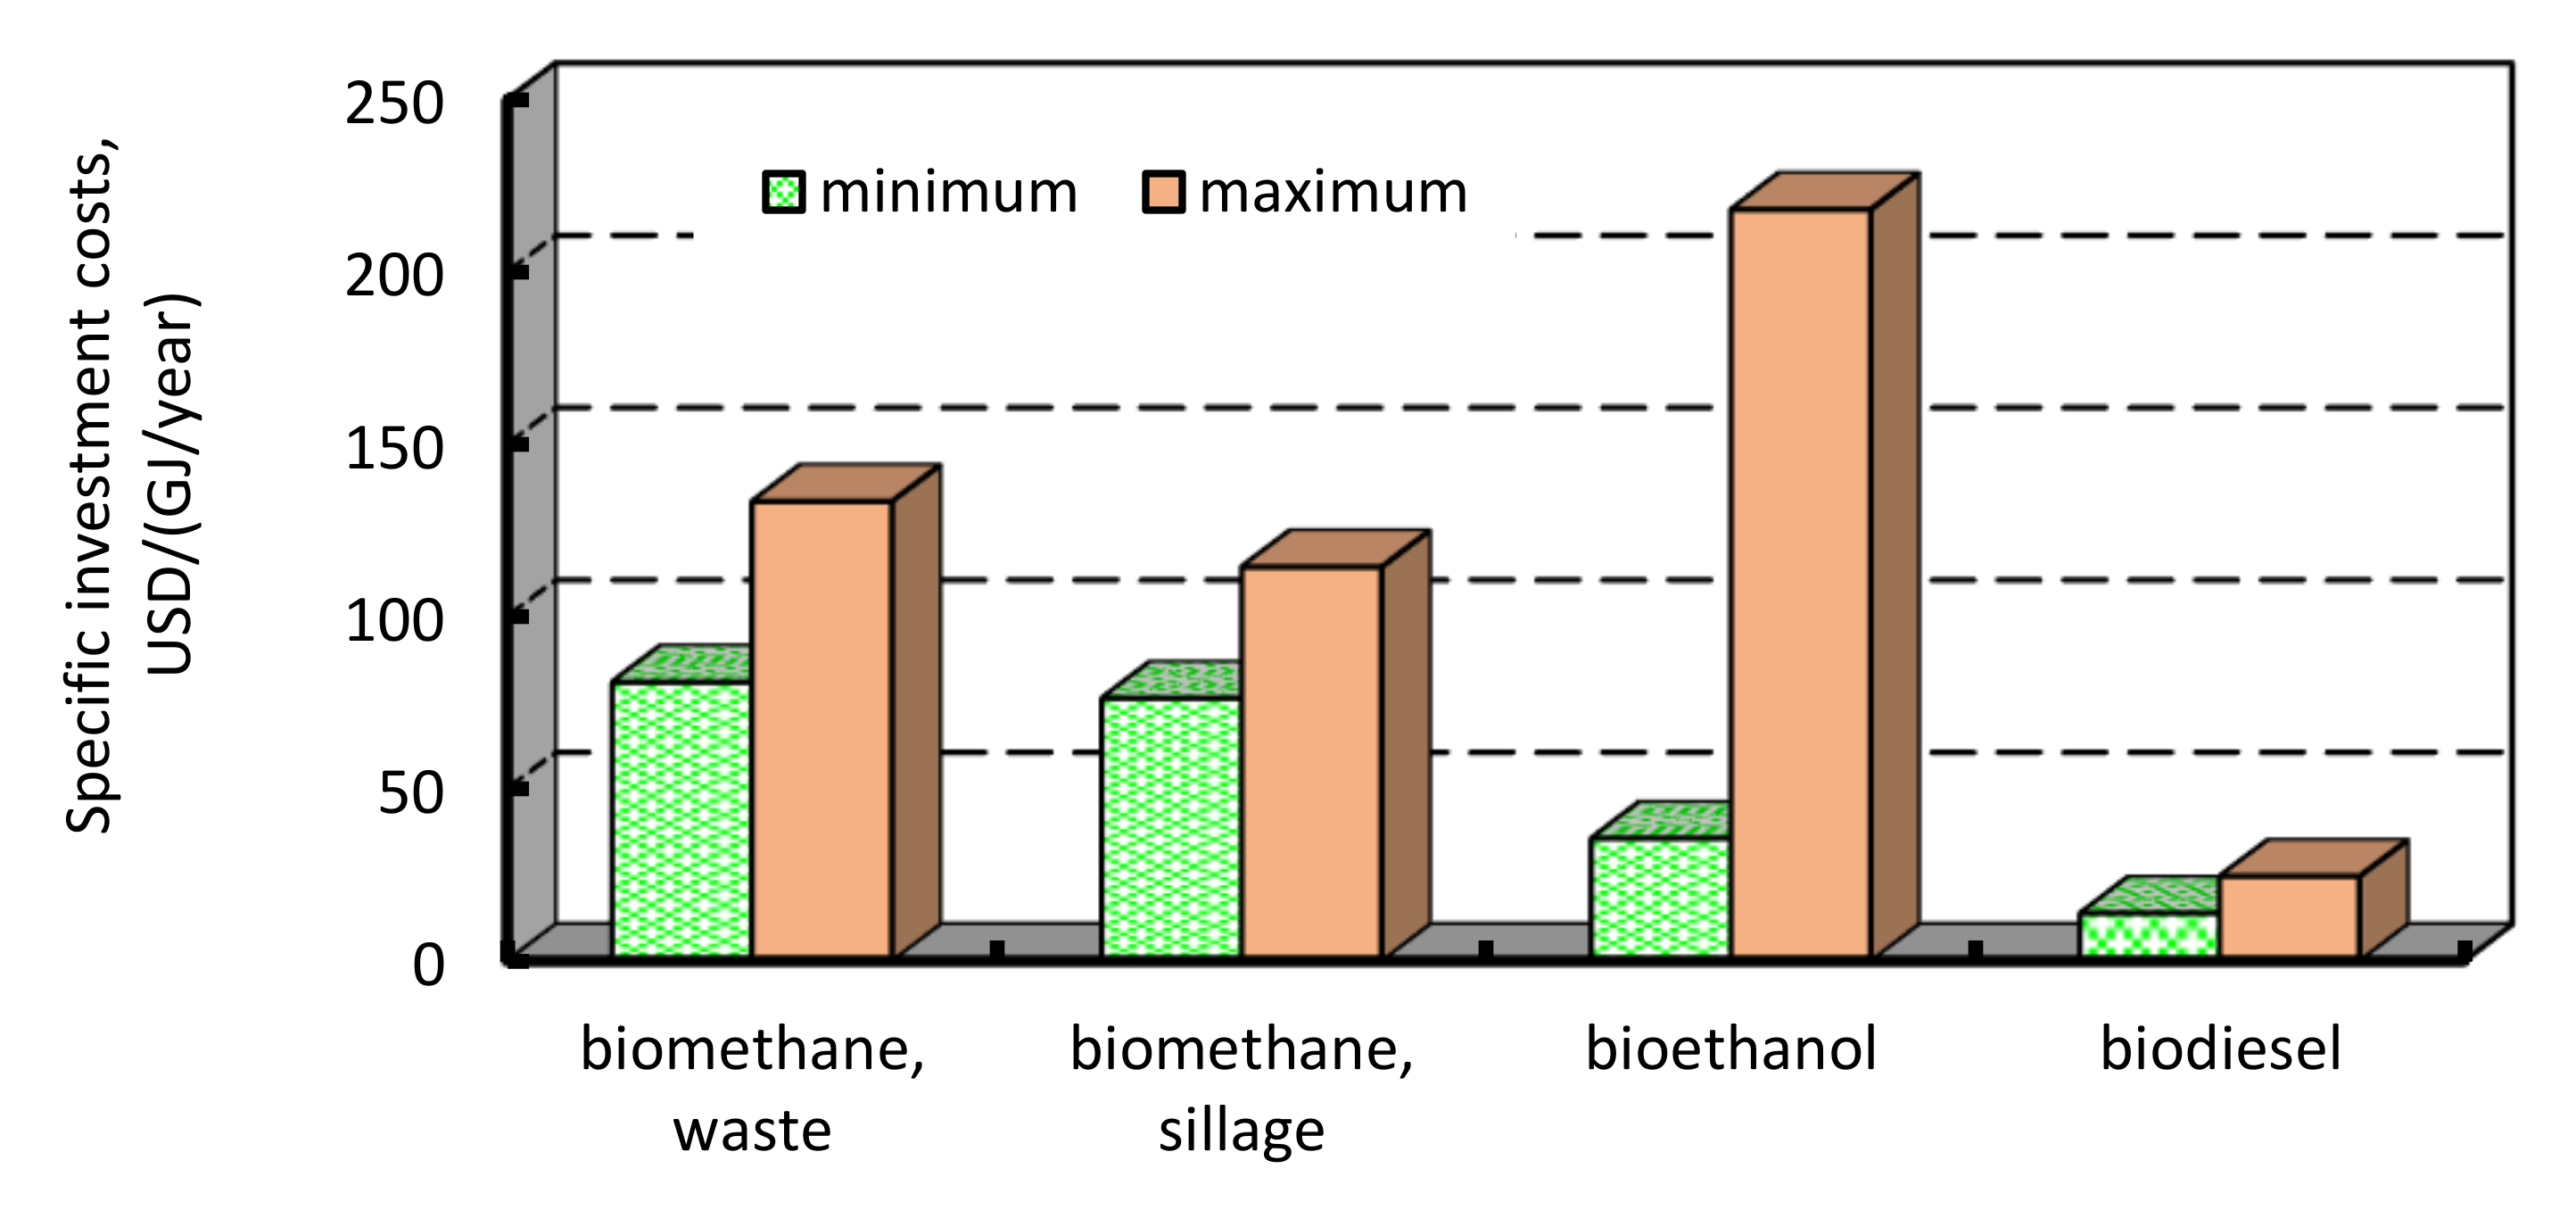
4.3. Economical Indicator: Specific Investment Costs

There are three types of biogas plants: energy crop biogas plants, combined energy crop and manure biogas plants (codigestion), and biowaste biogas plants [64]. Residues from processing plants, such as sugar and ethanol mills, can be used as feedstock for biogas production. The specific investment costs of the above biogas plants are competitive compared to manure-based biogas plants if their capacity is more than 6000–8000 kWe. The specific investment costs for agricultural manure-based biogas plants according to data biogas plants being in operation are shown on Figure 3 [72]. Ukrainian sugar plants and poultry farms build biogas plants to meet their own energy requirements. Their specific investment costs range from 1600 to 4000 EUR per kWe. Landfill power plants require lower capital costs, averaging around 1670 EUR per kWe [73].
The world average specific investment costs for renewable power plants are declining. In 2018, solar photovoltaic (PV) plants and onshore wind turbines were the cheapest options (Figure 4) [74], while biogas plants were ranked third.
The actual average annual capacity of any power plant is less than the nameplate capacity. It can be determined by the capacity factor. The capacity factor is the dimensionless ratio of the actual energy production over an operational period of time (generally per year) to the maximum possible energy production over the same period, for which values range from 0 to 1. Due to fluctuation, the capacity factor of plants is less than 1. Solar plants have a minimum capacity factor value, while biomass plants have the highest value (Figure 5) [74,75,76]. This fact should be taken into account for correction comparison of technologies.
To correctly compare different renewable power plants, we suggest adjusting their specific investment costs using the following formula:
S I C a = S I C C F ,
where SIC is the specific investment costs of any power plant in EUR/kWe and CF is the capacity factor.
If we assume that a biogas plant is a base for comparison, the specific investment costs of ith renewable power plant to specific investment costs of the biogas plant ratio will be:
S I C R i = S I C a i S I C a b = S I C i C F b S I C b C F i ,
where SICai is the specific investment costs of the ith plant in EUR/kWe, CFi is the capacity factor of the ith plant, SICab is the specific investment cost of the biogas plant in EUR/kWe, and CFb is the capacity factor of the biogas plant.
According to our calculations, biogas and biomass-fired plants have the best ratio values, while concentrated solar plants have the worst ratio values (Figure 6).

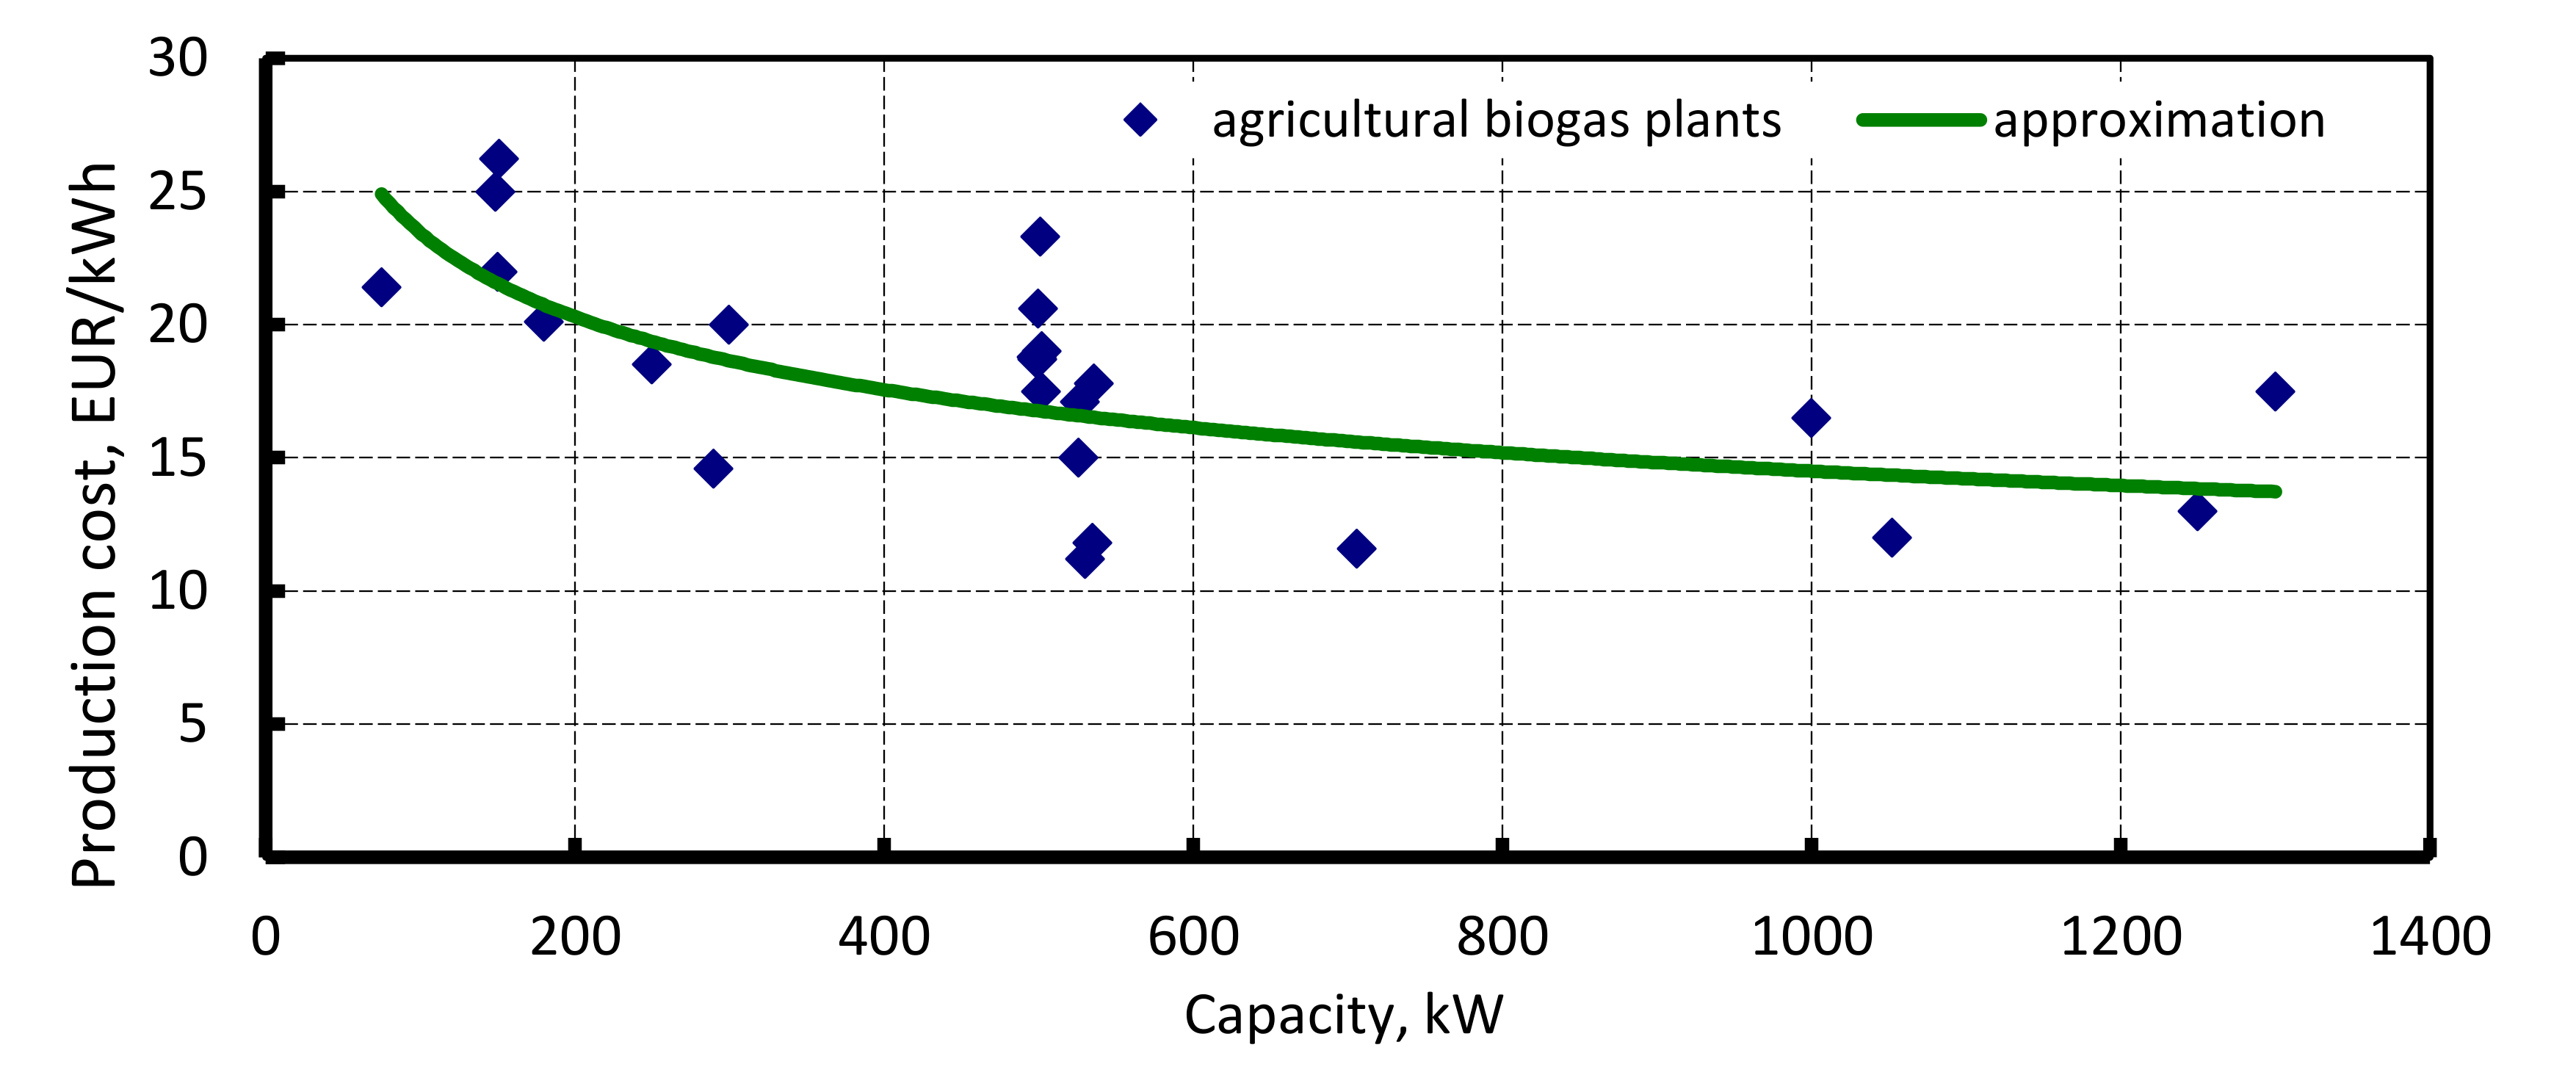
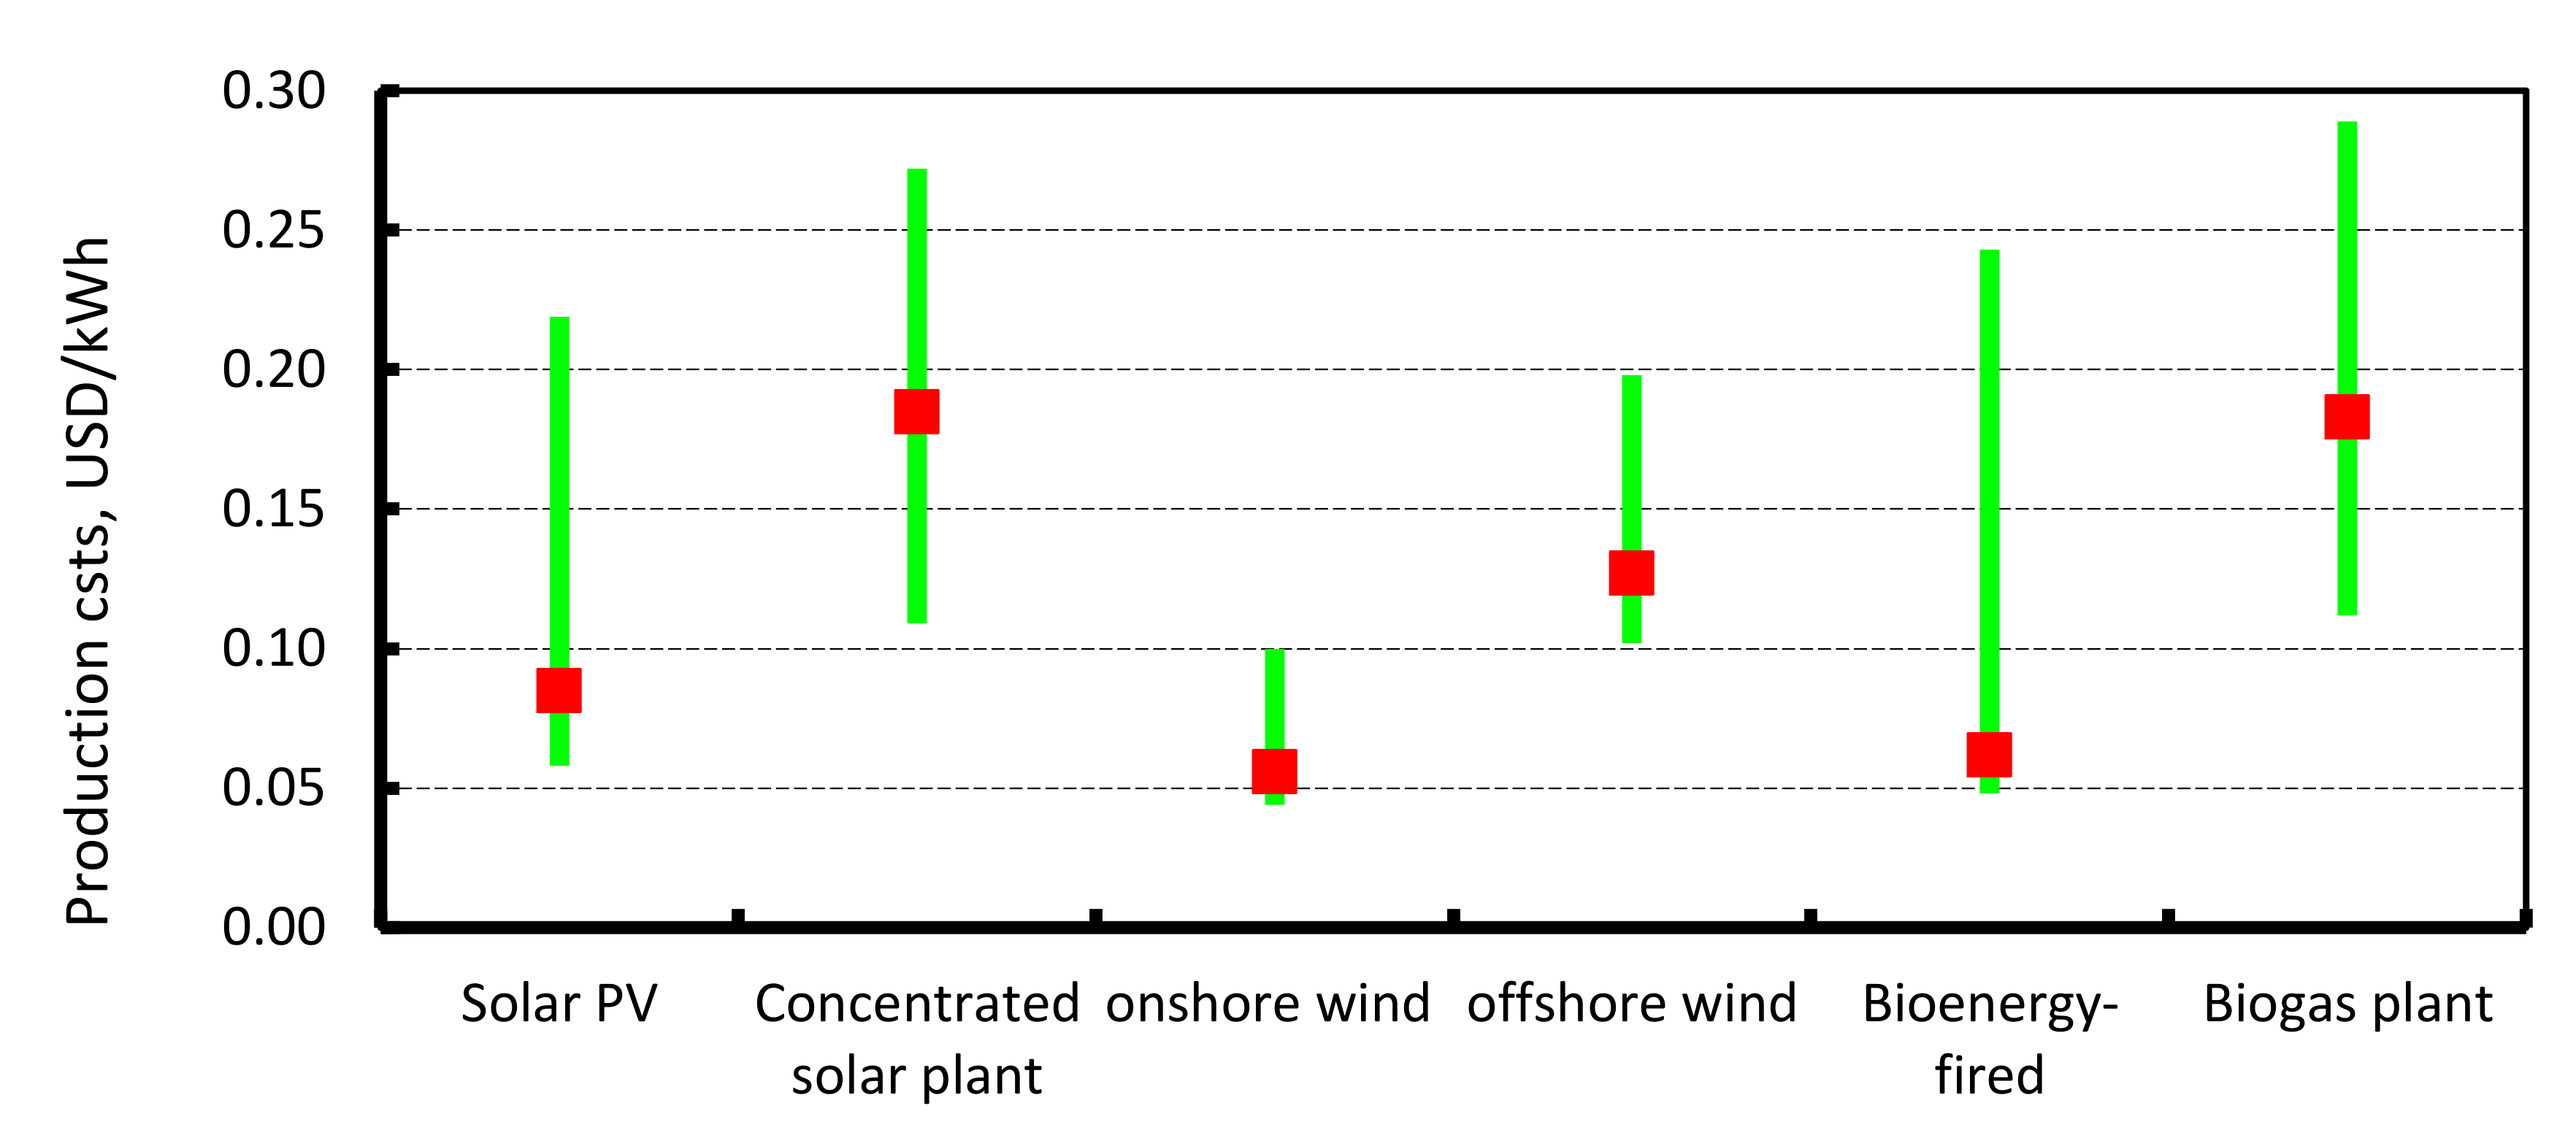
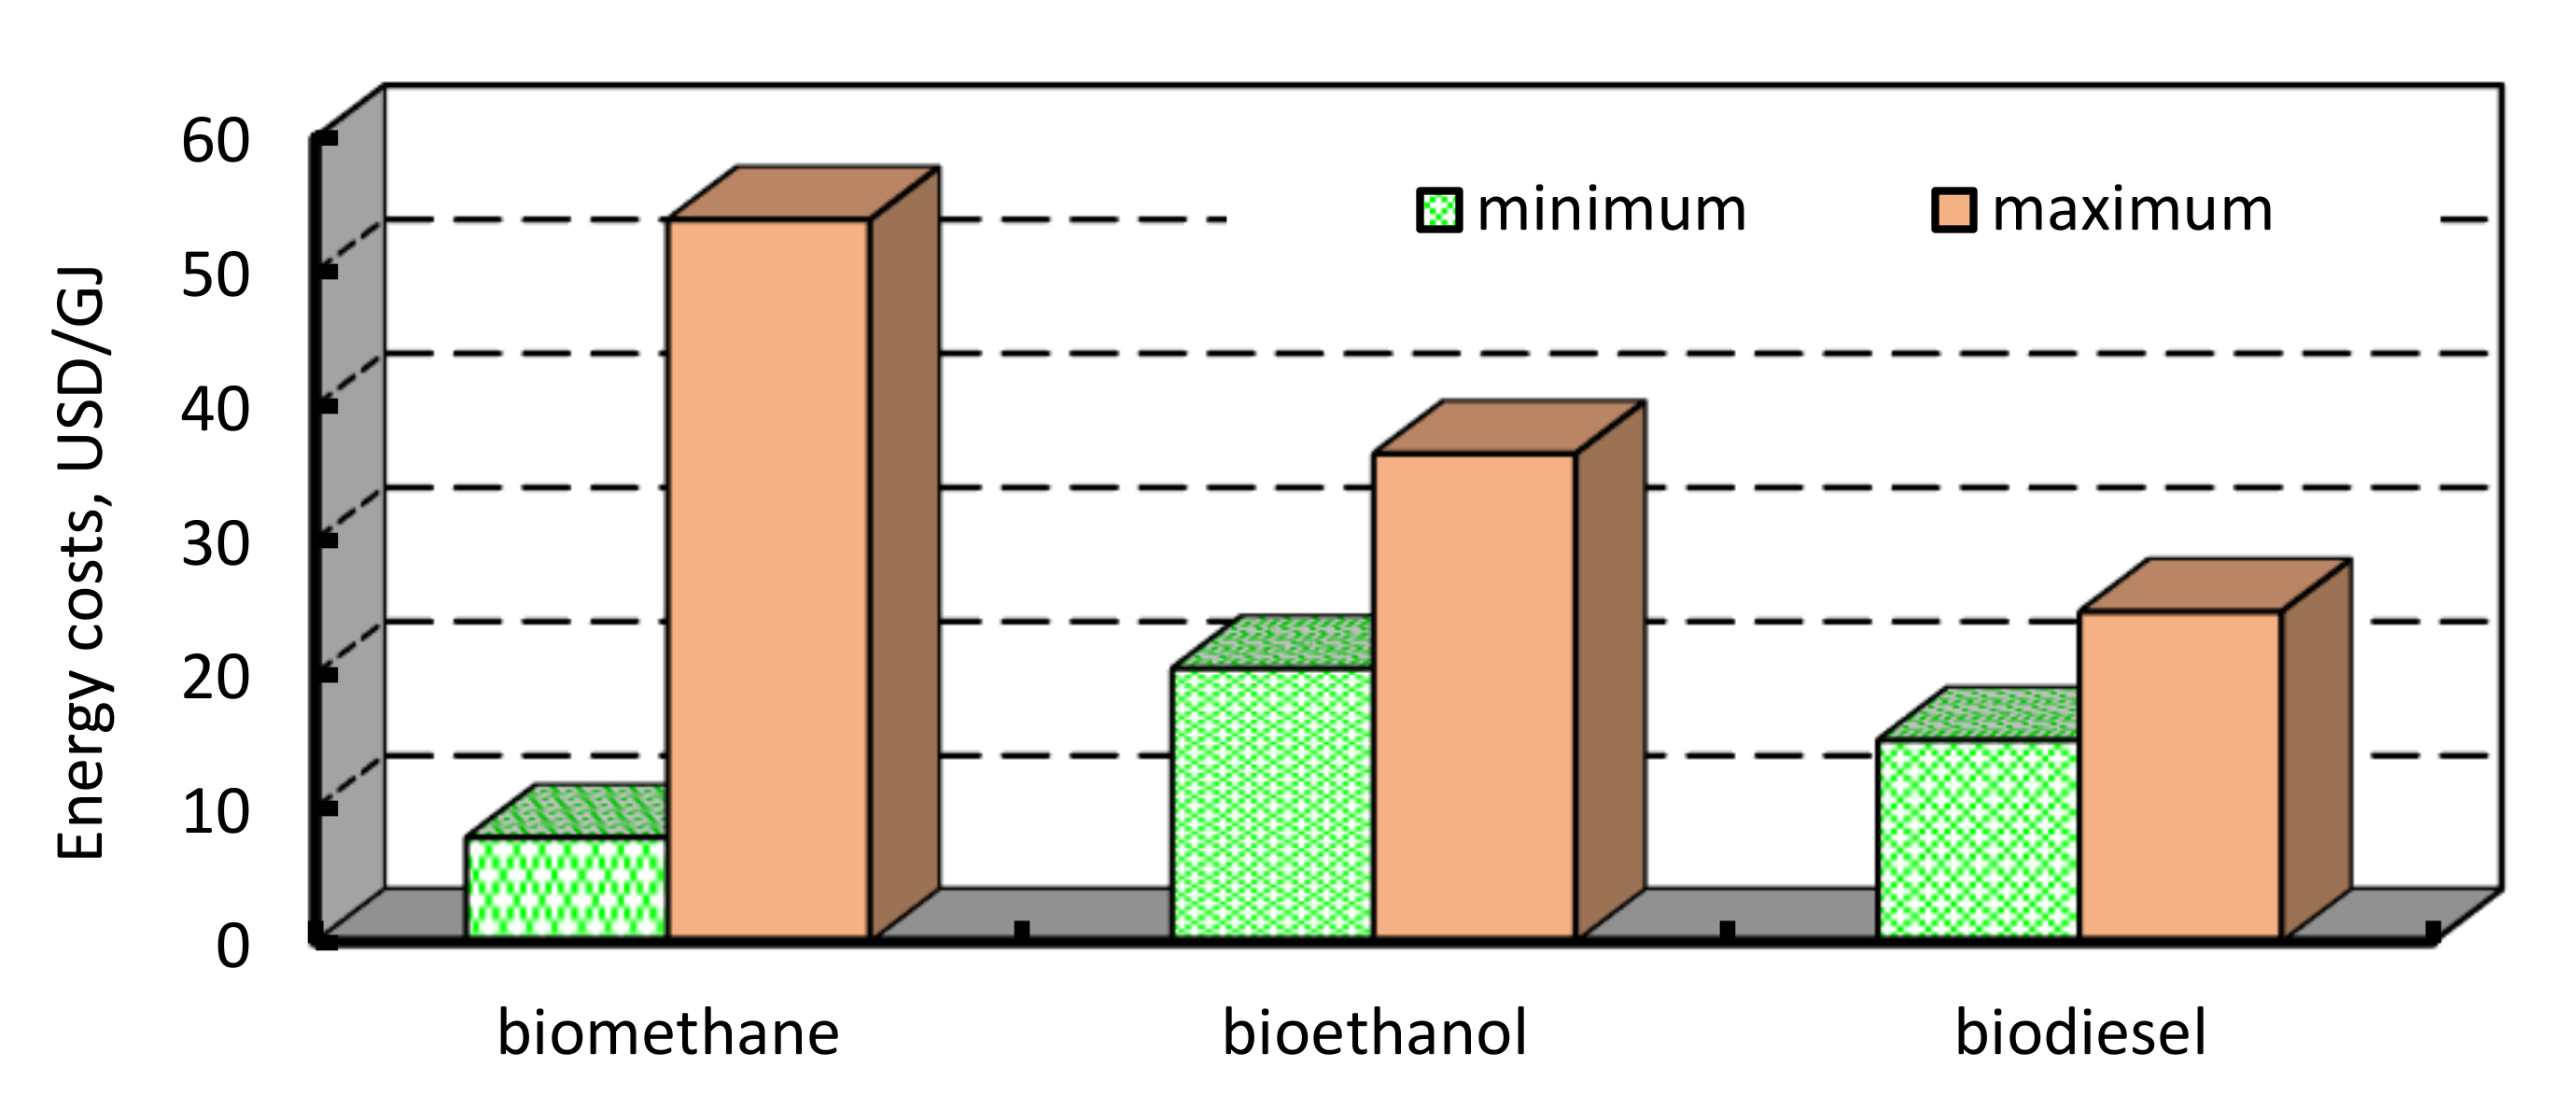
4.4. Electricity Production Costs

The electricity production cost of biogas plants depends on the installed capacity (Figure 7) [72,77,78,79,80,81]. For agricultural biogas plants, the above value varies from 0.112 to 0.2623 EUR/kWh. For energy-crop (maize silage)-based biogas plants with capacity over 500 kW, the electricity production costs are almost stable and do not depend on the size. This is the result of transport costs.
The average electricity production cost may be calculated using the following formula:
A E P C = x min x max E P C ( x ) d x x max x min
where xmax is the maximum installed capacity in the range studied in kWe, xmin is the minimum installed capacity in the range studied in kWe, and EPC(x) is the dependence of the electricity production costs on the installed capacity.
In the range of 75–1300 kW, the average electricity production cost is 0.1649 EUR/kWh. Therefore, biogas technology and concentrated solar plants are the most expensive among renewable sources (Figure 8) [74]. Global electricity production costs are decreasing. Currently, onshore wind power plants produce the cheapest electricity.
In Germany, there is a wide range of electricity prices spread between small business (around EUR 0.15/kWh) and large electricity consumers (around EUR 0.09/kWh if annual electricity consumption is more than 20 GWh) [82]. In 2019, the average electricity price for households reached EUR 0.3022/kWh [83]. Only part of biogas plants can compete with the grid to meet the requirements of small businesses. In the USA, the situation is the same [84].
Occasionally, the market electricity price may be lower than operational power costs or CHP units. In this case, some biogas plants prefer to burn their biogas in a flame and get their income from the treatment of residues [30].
The application of cogeneration results in a fall of the electricity production cost by 20%. In the USA, these dairy-based biogas plants generate competitive electricity [85].

4.5. Biomethane as Vehicle Fuel
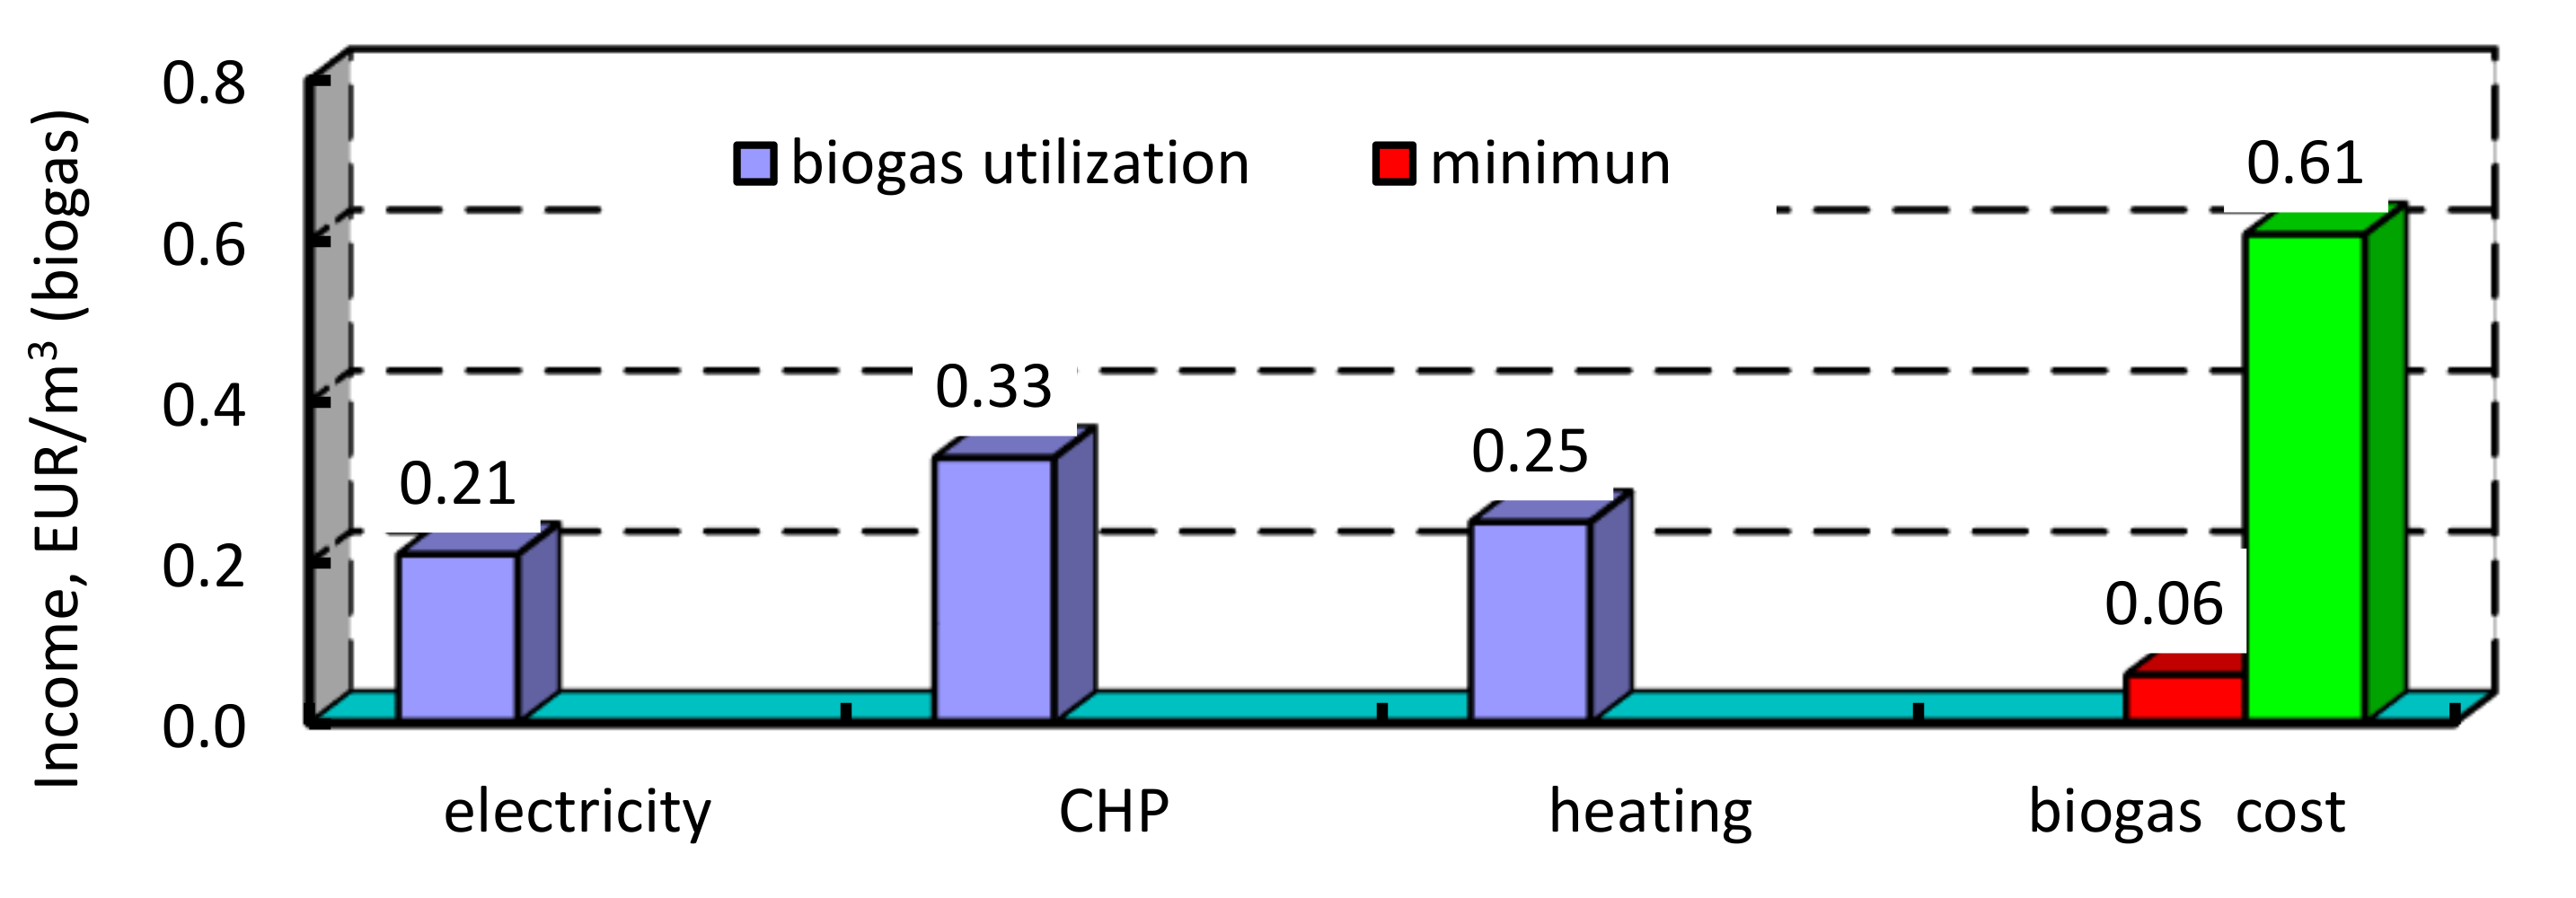
It is difficult to find which option would be more suitable without cost analysis of alternative renewable fuels available for transport. In this subsection, biomethane was examined and compared to biofuels such as bioethanol and biodiesel.
Specific investment costs of bioethanol plants range from USD 0.75/(L/year) to USD 4.6/(L/year) [76]. If units of energy are used instead of units of volume, then the specific investment costs will be between USD 35.54/(GJ/year) and USD 218.02/(GJ/year). Conventional bioethanol plants are at least twice as cheap as advanced bioethanol plants The specific investment costs for biodiesel plants are less than bioethanol plants and vary from USD 0.45/(L/year) to USD 0.8/(L/year) [86], or between USD 13.79/(GJ/year) and USD 24.51/(GJ/year). This indicator is strongly influenced by the size factor [87].
Biomethane production comprises biogas production and upgrades. Therefore, investment costs consist of two components. The specific investment costs for an anaerobic digestion (AD) biogas plant depend on its capacity and feedstock. AD systems based on energy crops are characterized by slightly higher investment costs compared to waste systems (agricultural and municipal waste, food processing, and residues). Waste-based anaerobic digesters have investment costs ranging from USD 5050/nm3 to USD 7310/nm3, whereas the investment costs for AD using silage vary from 5400/nm3 to USD 7500/nm3 [86]. To convert a unit USD/(nm3/h) into USG/(GJ/year), the following formula was used:
I C C = I C A D L H V b g A U ,   USD / ( GJ / year ) ,
where ICAD is the investment cost in USD/(nm3/h), LHVbg is the lower heating value of biogas in GJ/nm3, and AU is the annual utilization in hours.
The maximum annual utilization cannot exceed 8760 h. The German Biomass Research Center reported that the average annual utilization (operating hours) for anaerobic digesters is 7889 h [64]. Daniel-Gromke et al. found that biogas combined heat and power plants (CHP) averaged 7086 operating hours annually. The average full load operating hours for biomethane plants was 4906 h [88].
To produce biomethane, some biogas upgrading technologies are used, including amine scrubbing, pressure swing absorption, water scrubbing, membrane separation, cryogenic separation, and organic physical scrubbing [89,90]. The first three technologies are more popular. In Germany, their total share is 89% [53,86]. Investment costs for biogas upgrading systems strongly depend on size [84]. The total investment costs for biogas and biogas upgrading plants are higher than biodiesel. Advance bioethanol is an exception (Figure 9).
The following countries are the top producers of biomethane: Germany, the USA, the United Kingdom, Sweden, the Netherlands, and Denmark [90,91]. The most powerful average biogas upgrading plants are in the USA and Germany (Figure 10).
Biomethane production costs vary from USD 0.28/m3 to USD 1.94/m3. This variation depends on the feedstock, upgrading technology, and capacity (Figure 11). Despite the cost of biomethane production being higher than natural gas, it is more competitive than biofuels and conventional fuels (Figure 12). Biomethane from agricultural residues and industrial waste has the lowest production costs. For capacity exceeding 1000 m3/h, the production costs do not exceed USD 0.5/m3 or USD 13.89/GJ [86].

4.6. Heat Sale

Biogas may be used for heating and cooking. As a rule, small-scale digesters are used for these purposes. This is currently a widespread practice in China [53], but in European countries biogas is rarely used for heat supply. The main reason for this situation is economic. For example, in Germany the district heating price is around EUR 0.076/kWhth [64]. This means that the biogas cost must be less than EUR 0.05 kWh or EUR 0.291/m3 to compete against conventional fuels.
According to the reported information, in the USA the biogas production costs (anaerobic digester systems in livestock production facilities) varied from USD 2.99/GJ to USD 28.98/GJ, with an average value of USD 6.82/GJ [92]. This corresponds to biogas production costs of USD 143.33/1000 m3.
In EU countries, biogas production costs range from USD 3.06/GJ to USD 13.89/GJ (manure-based and industrial-based biogas production) [53]. Therefore, economic competition against natural gas is hardly possible.
The total biogas production costs depend mainly on the type of feedstock. The cost of feedstock, its pretreatment, and transport costs have significant influence on biogas production costs. For example, in Denmark biogas from municipal waste has the lowest production costs at EUR 10/GJ, while most expensive production costs are for catch crops (EUR 37/GJ) [31]. Cucchiella et al. estimated biogas production costs to be in the range of EUR 12.22/GJ to EUR 27.78/GJ [93].
Astarta-Kyiv LLC (Ukraine) produces biogas from beet pulp and leaves. The designed capacity of its biogas plant is 150,000 cubic meters per day. Their biogas production cost can be estimated at USD 120–180/1000 m3 [34]. This cost is competitive and the company uses biogas to meet its own energy requirements.
Therefore, only large biogas plants (with a capacity of more than 1000 m3/h) using agricultural, municipal, and industrial waste can reach a competitive price.

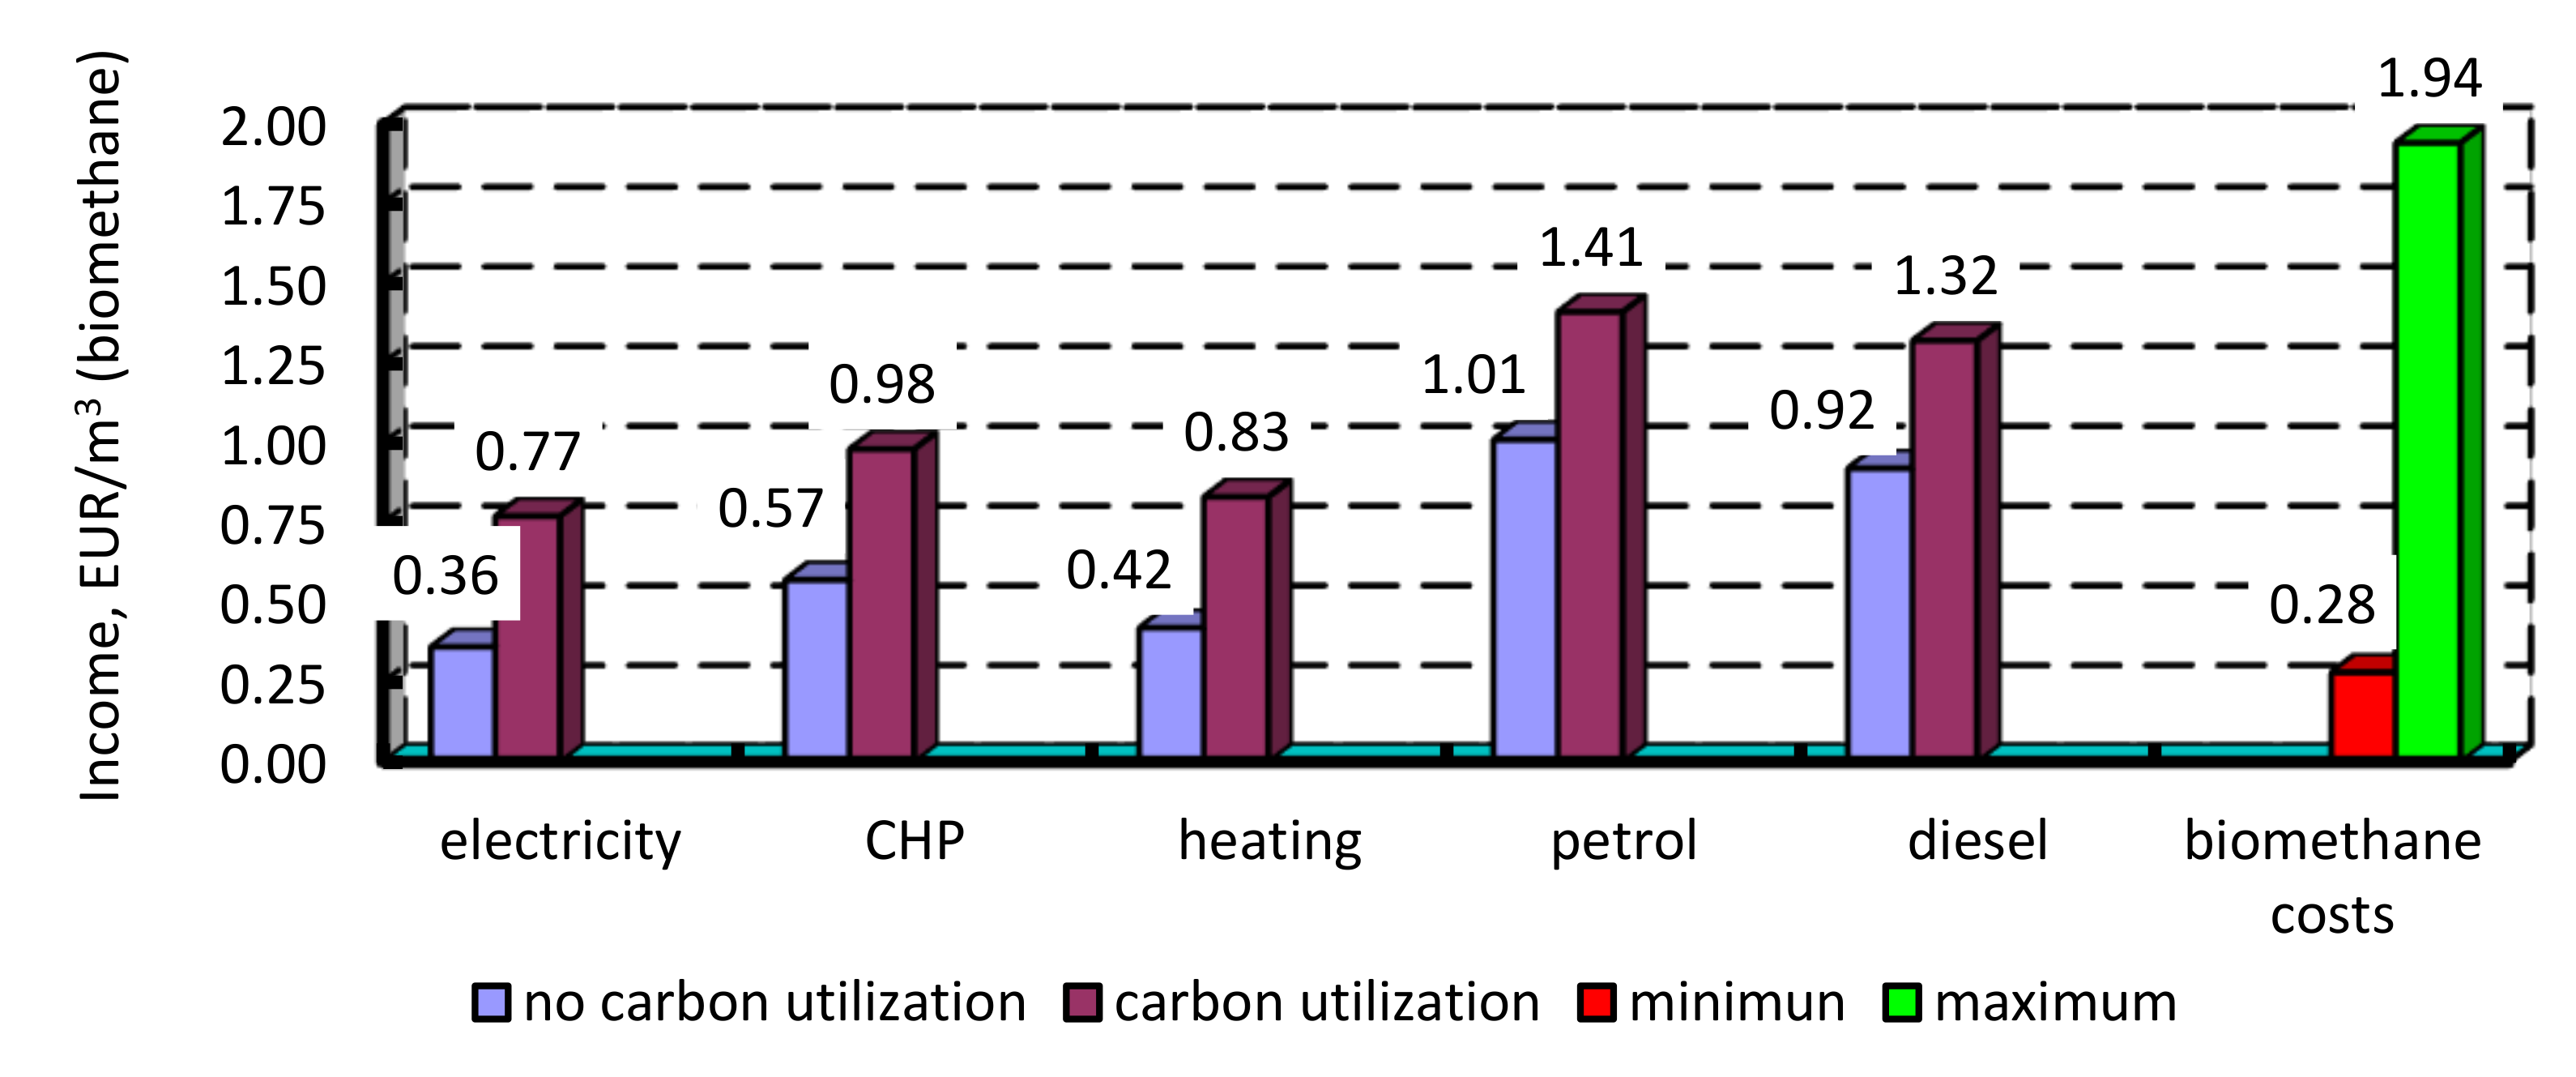
4.7. Combined Utilization of Biomethane and Carbon Dioxide

The economic attractiveness of biogas production has to be enhanced. Among recent trends are the integration of ethanol and biogas production [94], and capturing and utilizing carbon dioxide (a by-product of biogas upgrading) [95]. For example, the Magic Factory (Norway) produces biomethane, biofertilizer, and carbon dioxide. The organic feedstock for AD contains macro- (nitrogen, phosphorous, potassium, calcium, magnesium, and sulfur) and micronutrients (boron, cobalt, copper, iron, etc.), which are retained in digestate during anaerobic digestion. Therefore, the application of organic feedstock as fertilizer creates a closed-loop nutrient cycle. Carbon dioxide is used in greenhouses with fertilizer [96].
Biogas income depends on the utilization pathway [45]. We assessed the expected income for two variants: without carbon dioxide utilization and when carbon dioxide is captured and sold. Initial data for Ukraine are presented in Table 3.
The use of biogas in CHP plants has the maximum costs of conventional substituted energy (Figure 13). The maximum possible biogas cost cannot exceed these values. Biogas production costs depend on feedstock, capacity, and technology. For manure-based biogas plants, these values range from EUR 0.13/m3 to EUR 0.23/m3 [53]; for municipal and industrial waste they range from EUR 0.22/m3 to EUR 0.25/m3; and for slurry they average EUR 0.46/m3 [31]. However, the maximum biogas production costs are higher than the maximum acceptable biogas cost. This is why incentives are required to use biogas.
Biomethane may be used as a substitute for conventional vehicle fuels (petrol and diesel). The total income may be increased if the by-product of biogas upgrading (carbon dioxide) is captured and used as a commodity. Substituting vehicle fuels brings the highest income (Figure 14). For power generation, heat production, and cogeneration, the total income doubles if carbon dioxide is captured and sold. Carbon dioxide capture is currently common practice and is used by ethanol plants. If biomethane is used to substitute vehicle fuels, carbon dioxide utilization increases the total income by 40%. A biomethane plant can produce competitive, renewable, combustible gas as vehicle fuel if its capacity is more than 1000 m3/h for energy-crop-based biogas plants and 200 m3/h for waste-based plants (Figure 11). Carbon dioxide capture and utilization practices make a waste-based plant economically attractive if its capacity is more than 600 m3/h (Figure 11). A biomethane plant with a capacity of more than 1600 m3/h can ensure profitability, even without carbon dioxide utilization. Operating biogas plants in Ukrainian poultry farms and sugar mills have capacity ranging from 1000 to 6250 m3/h [99]. Therefore, they have good conditions for the profitable production and utilization of both biogas and biomethane.
As can be seen in Figure 14, there is a wide range between the maximum and minimum incomes for biomethane production. This increases the uncertainty of biomethane projects. Therefore, these projects should be thoroughly elaborated before their implementation. Special attention should be paid to feedstock, capacity factor, and sales markets for both main products (biomethane) and by-products, including carbon dioxide.

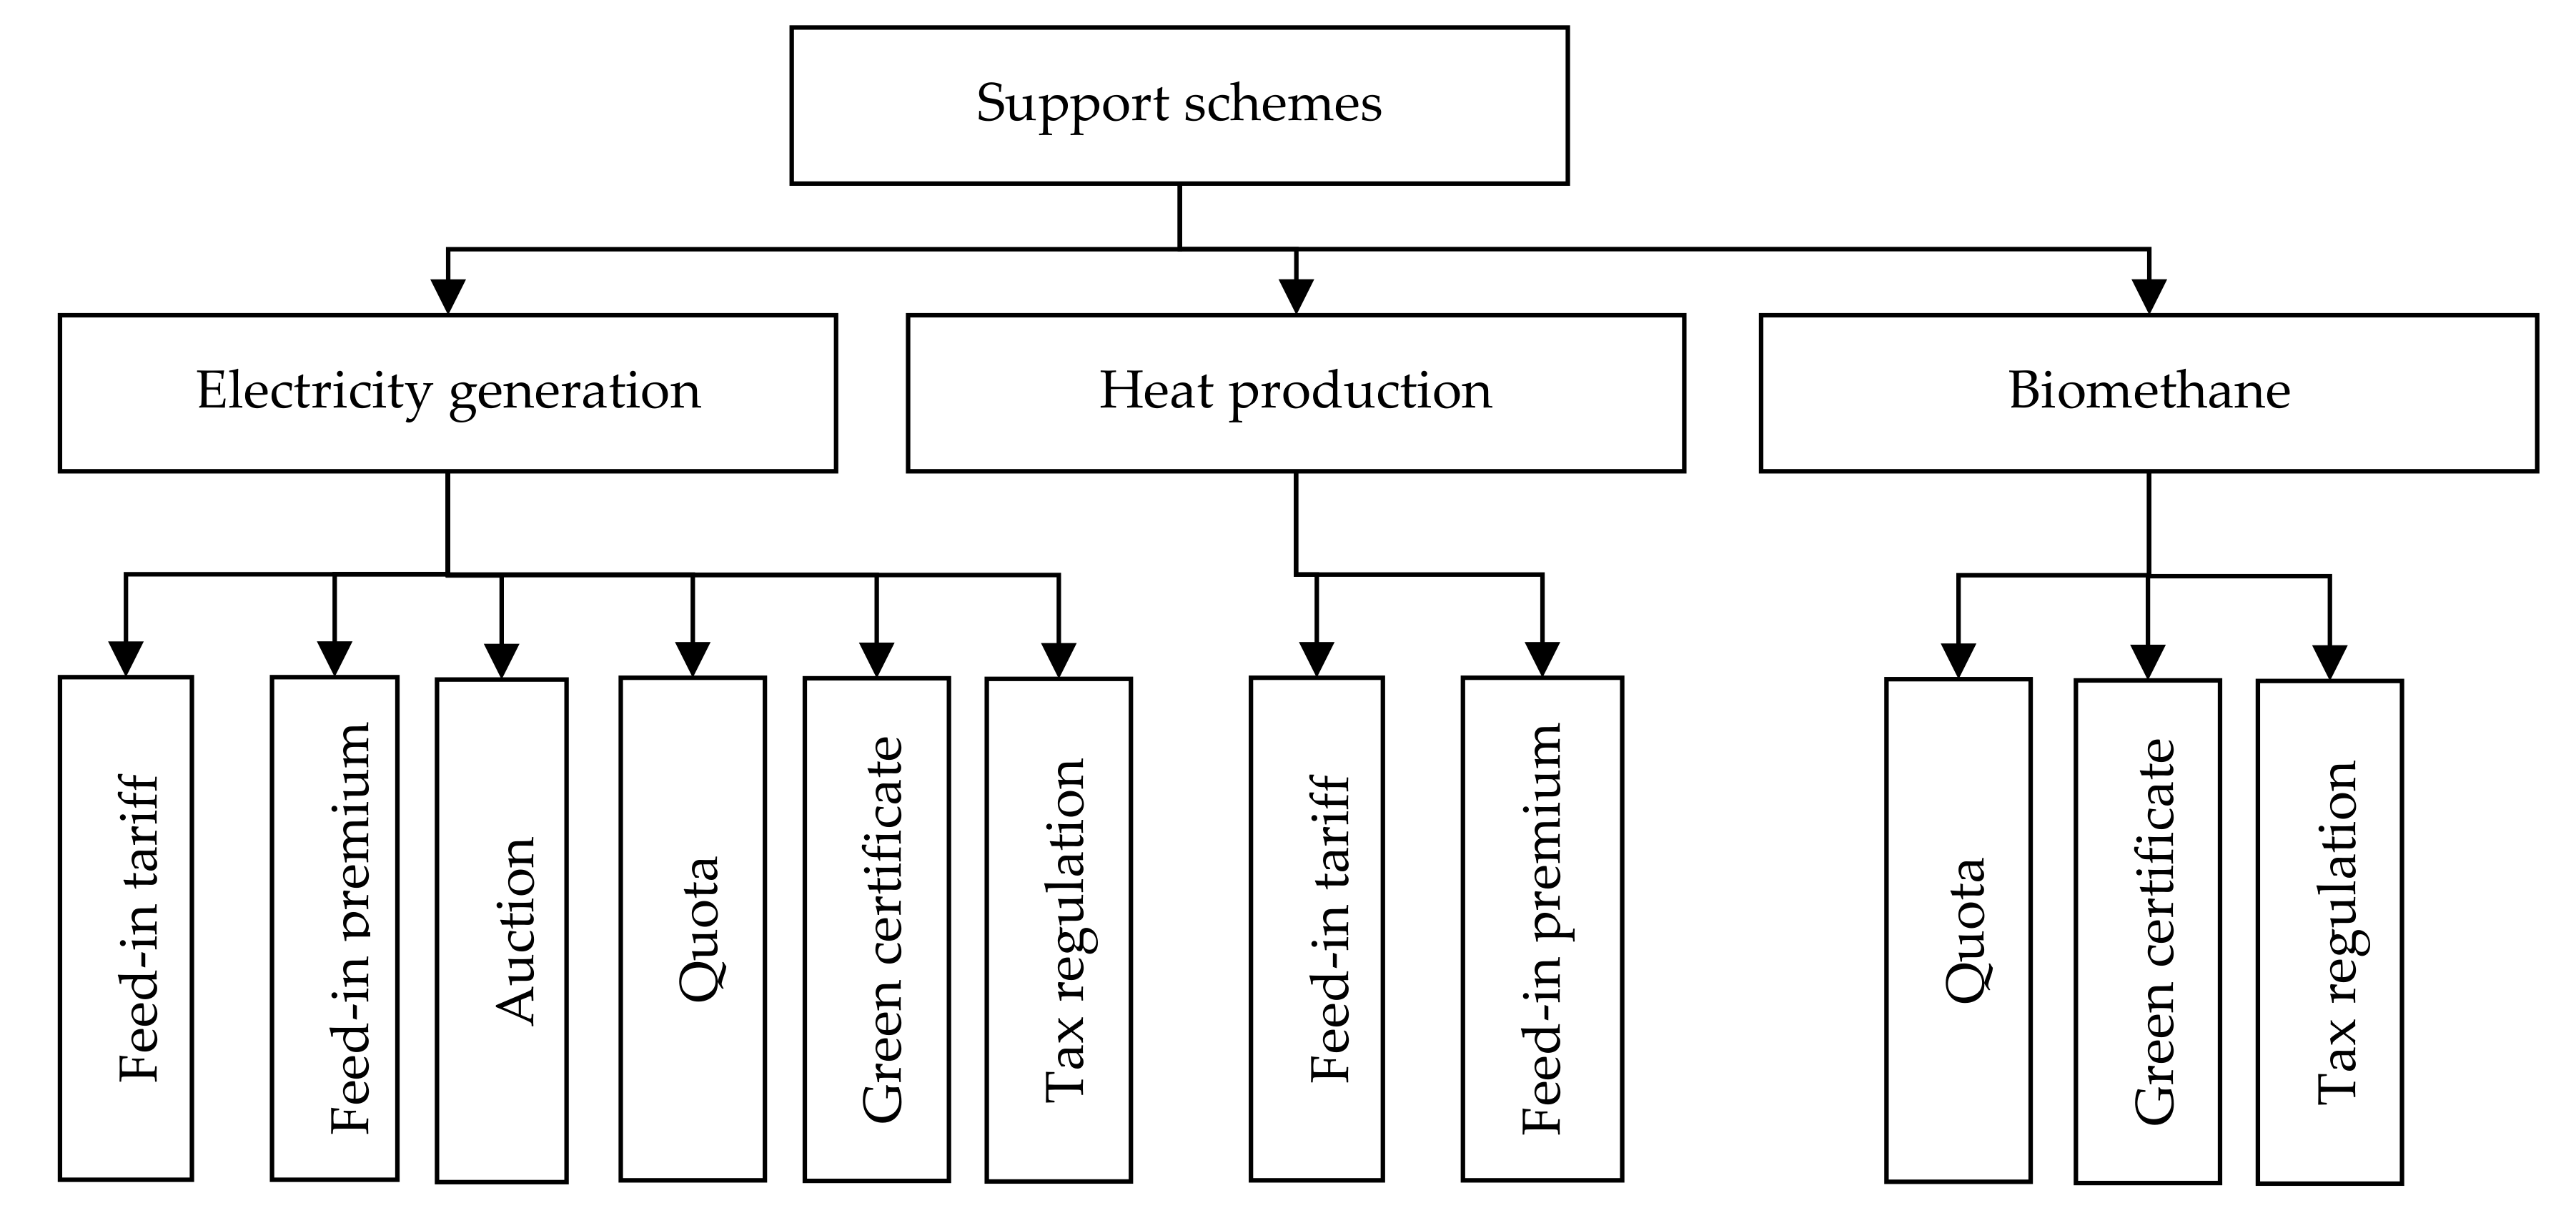
4.8. Support Schemes in European Union Countries

High investment and production costs are the key barriers to the biogas industry. Due to high production costs, sole heat production is not competitive compared to other alternatives [31]. To overcome the above, different support schemes are applied. The drivers of biogas utilization have been the transformative forces behind renewable energy systems, agricultural and agro-industry waste management, mitigation of climate changes, and job creation, as well as different support schemes.
Authorities of European countries support the biogas industry within the domains of electricity generation and heat and biomethane production, for which a number of incentives have been applied (Figure 15). For the electricity sector, feed-in tariff, feed-in premium, quota, auction, mixed measure, grant, and loan systems are used. Heat production is supported less compared to electricity generation. Only some countries (Austria, Estonia, and Finland) apply feed-in premium systems, and only one country (the United Kingdom) uses feed-in tariff systems. As a rule, biomethane as a transport fuel is supported by biofuel quotas. Countries such as Sweden, Germany, Finland, Italy, and the United Kingdom implemented tax regulation [100], while certificates are an Italian practice [93].
Before 2012, Danish legislation only supported heat and electricity production. A feed-in tariff (EUR 0.1/kWh) and a feed-in premium (EUR 0.054/kWh) were used. Moreover, this country used an indirect subsidy (no carbon dioxide tax), the value of which was around EUR 8/GJ (when biogas substitutes natural gas). Currently, the Danish government supports biogas upgrading and utilization. The subsidy scheme includes three feed-in premiums: a base subsidy for biomethane production (EUR 0.038/kWh); a temporary subsidy (EUR 0.05/kWh), which decreases annually; and a gas price adjustment subsidy. Their values are adjusted annually. From 2021, a tender-based principle will be applied for new biogas plants. The current subsidy scheme will continue to be used for existing biogas plants until 2032 [29,32].
The Italian biogas industry developed quickly towards the end of 2012 due to effective support schemes, which included feed-in tariffs (if electricity power was lower than 500 kW) and incentives (feed-in premiums). The incentives varied from EUR 0.109/kWh to EUR 0.236/kWh [23].
Since 2013, stimulation packages for upgraded biogas (biomethane) as a vehicle fuel have been used, namely the Certificates of Release for Consumption (CIC). One CIC corresponds to 10 Gcal of biofuel energy, or 0.8372 t of biomethane. The cost of one CIC ranges from EUR300 to EUR800. This incentive depends on a number of factors: the type of substrate, the type of plant (existing or new), and distribution (to the end consumer or to third parties) [93].
A mandatory quota (up to 1.85% by 2022) for biomethane as vehicle fuel has been established in Italy. It should be noted that advanced biomethane is preferable [101]. Advance biomethane is defined as a fuel that meets the requirements of Indirect Land Use Change (ILUC) Directive 2015/1513 [102].
Germany is the leader in biogas and biomethane production in the European Union and ranked second in the world. This is a result of national support measures. The majority of biogas plants have small- and medium-scale anaerobic silage maize digesters. Their average electricity capacity is around 500 kWe [86,103]. The biogas industry is regulated by the Renewable Energy Sources Act (EEG), which contains the principle support measures [103].
The favorable value of feed-in tariff resulted in biogas production increasing up to 2011. In 2017, the new support scheme based on auctions was established. The latest amendments abolished the substrate bonus for energy crops (maize silage was widely used in Germany) [29]. All biogas plants which have an installed electric capacity of more than 150 kWe have to take part in the auctions. However, biowaste-based biogas plants (of a capacity not more than 150 kWe) can use either the feed-in tariff or the auction scheme. Regarding biomethane, since 2017 the EEG has stimulated biowaste-based biomethane plants [103].
Commercial biogas complexes may be integrated into waste management systems and may be used as treatment platforms [104,105]. For example, in Germany the disposal of municipal solid waste (MSW) to landfills is banned. This results in an increase of biogas plants for MSW management [106].
It should be stressed that there is supranational EU legislation focusing on the reduction of arable land for cultivation of energy biomass [100]. Specifications for biomethane (for grid injection and automobile fuel) have been established [107,108].
Regarding Sweden, the utilization of upgraded biogas as vehicle fuel is of particular interest. This gaseous renewable fuel is used in spark ignition engines and dual-fuel diesel engines. Biomethane as a vehicle fuel must comply with Standard SS 15 54 38 [109]. To support biomethane production and utilization, the Swedish government applies various incentives, including tax exemption, zero vehicle tax, climate investment programs (grants for investment projects that reduce carbon dioxide emissions), and public procurement (may favor gaseous fuel vehicles) [110].
Swedish producers of green electricity can receive electricity certificates. This initiative improves the profitability of biogas plants. The average price of an electricity certificate varied from EUR 21.62/MWh (2003) to EUR 9.4/MWh in 2019 [111].
Research and development of new technologies plays a vital role in the biogas industry. Leaders of the European biogas market (Germany, the Netherlands, the United Kingdom, and Italy) understand this and have particular research programs [112].
More than 100 European companies are engaged in the biogas industry in areas such as research and development, manufacturing, and supply, of which Germany is ranked first (Figure 16) [113]. Among them, more than 30 companies conduct research on topics such as biochemical and microbiological aspects of anaerobic digestion, biogas upgrading technologies, value chain analysis, life cycle analysis, system integration, economic modeling, and social–economic aspects [114]. These companies (technology developers and equipment manufacturers) are responsible for the growth of the biogas industry.

4.9. Support Schemes in Ukraine

Regarding Ukraine, there are several institutions dealing with biogas technologies, such as the Bioenergy Association of Ukraine and The Gas Institute of the National Academy of Sciences of Ukraine [115], which have moderate state financial support.
In Ukraine, the state authorities support only electricity generation from biogas. Since 1998, there has been a green tariff (feed-in tariff) for green energy in Ukraine [116]. Over the last decade, this has attracted investment in Ukrainian renewable energy. In 2019, this sector produced around 3.7% of the total electricity but cost 8% of the total national electricity. Therefore, the green tariff has become a financial burden on the state budget [117,118]. To reduce it, lawmakers put forward an initiative to replace the feed-in tariff with auctions. They expect that green auctions will guarantee an economically justified price for renewable energy.
Regarding biomethane, its production and utilization is not regulated by laws.
For a clear illustration of national policy concerning biogas markets, selected countries are compared in Table 4.
The key barrier to biogas technology dissemination is low competitiveness with conventional energy resources due to high investment costs, and therefore biogas production costs. To overcome this issue, awareness and perception of the biogas industry’s importance are needed. Many existing obstacles are based on various national issues, such as local opposition in Bulgaria, unavailability of information in Czechia, public perception in Estonia, lack of public acceptance in France, lack of public support in Germany, lack of reliable information sources in Greece, lack of political support in Hungary, lack of long-term national vision of renewable energy resources in Lithuania, and lack of public support in Poland [100].

4.10. Principle Recommendations

Despite the existing support schemes and the available potential, biogas production in Ukraine is insufficiently developed. In our opinion, the fundamental reason is a lack of perception of the importance of biogas to the national economy. To solve this situation, it is necessary to enhance awareness of this industry. Moreover, the role of state authorities is to encourage universities and research institutions to intensify research in this field. The creation of links between research centers, manufacturers, and potential beneficiary industries is a task of great importance.
Accordingly, the following recommendations were formulated for the development of the biogas industry in Ukraine. It is important to develop technologies and manufacture technological equipment within the country. This will give the following positive results. Firstly, this results in the development of high technology industries. Secondly, it will be easier for society to accept financial support for the production and use of biogas, because it will be perceived as an investment in its own economy. Finally, it will accelerate the creation of competitive technologies for the biogas industry.
A number of aspects need to be considered for the sustainable production of biogas and its use in Ukraine.
  • Biogas production needs to be based on agricultural residues, animal manure, and organic waste from processing mills.
  • Transport distances for feedstock transportation should be minimized.
  • Cogeneration and subsequent use of engine waste heat are preferable to electricity generation alone. The use of heat recovery can contribute to the bioeconomy, such as from greenhouses, beer brewing, and ethanol production.
  • Digestate management is a point of great importance. Digestate needs to be used as fertilizer. Digestate can be used as fertilizer without any treatment after it is unloaded from the digester. However, if it needs to be stored or transported, processing of digestate to reduce its volume becomes relevant. This should be taken into account when a biogas plant is developed.
  • Biogas contains carbon dioxide. This gas may be used as a chemical source and as a commodity, which will improve economic indicators of biogas systems.
  • Anaerobic digesters can be integrated into processing plants, such as sugar, beer, and ethanol plants. This option may be a solution to the problem of substrate supply and the use of energy converted from biogas.
A comparison of our summarized recommendations and the current status of the biogas industry is presented in Table 5.
In Ukraine, some of the above recommendations are currently used. Examples of their applications include the utilization of processing mill residues, cogeneration, vertical energy integration, and the increased capacity of new biogas plants. Despite this, some pathways need to be developed, including mastering of biogas upgrading, carbon dioxide capture, and most importantly, research and development of relevant technologies for national conditions.

5. Conclusions

The global biogas production is increasing. Ukraine can sort out its own energy issues (especially in food industries) by harnessing renewable energy resources, including biogas.
Germany currently produces 0.651 ktoe of biogas per 1000 hectares of arable land, while for all EU countries this value is 0.239 ktoe. Ukraine produces only 0.001 ktoe. Therefore, Ukraine has a huge potential to increase biogas production.
Energy crops including corn silage are not a sustainable feedstock. Organic resources such as agricultural residues and industrial waste must be used as substrates in commercial biogas plants and should be integrated into processing mills (sugar and ethanol, etc.). The biogas industry must be part of waste management.
The actual investment costs for biogas systems are USD 1600/kWe, which is almost the same as for PV and wind power, but the adjusted investment costs are the lowest among clean energy plants.
The electricity production costs of biogas plants are more expensive than other green technologies, such as wind and biomass-fired ones, which is why substitution of petroleum vehicle fuels is the most profitable utilization of biogas. The use of amine scrubbing, pressure swing absorption, and water scrubbing technologies to upgrade biogas may be recommended because they provide the lowest production cost for biomethane. Carbon dioxide (a by-product of biogas upgrading) capture and utilization is a promising way to improve the profitability of biogas technologies.
Biogas plants with a capacity of more than 2000 m3/h are preferable due to low specific investment costs and acceptable production costs. These plants can produce competitive energy resources, such as electricity and biomethane.
Awareness and perception are the key tools for dissemination of any technology. State and local authorities should encourage research institutions to develop technologies and promote training programs.

Author Contributions

Formal analysis and methodology, V.H. and A.K. Investigation, G.M. and T.O. Writing—original draft, V.H. and A.K. Writing—review and editing, V.H. and A.K. All authors have read and agreed to the published version of the manuscript.

Funding

This research received no external funding.

Conflicts of Interest

The authors declare no conflict of interest.

References

  1. Renewable Energy Network of the 21st Century. Renewables 2019 Global Status Report. 2019. Available online: https://www.ren21.net/wp-content/uploads/2019/05/gsr_2019_full_report_en.pdf (accessed on 11 May 2020).
  2. Ahammad, S.Z.; Sreekrishnan, T.R. Biogas: An Evolutionary Perspective in the Indian Context. In Green Fuels Technology; Soccol, C.R., Brar, S.K., Faulds, C., Pereira Ramos, L., Eds.; Springer: Cham, Switzerland, 2016; pp. 431–443. ISBN 978-3-319-30203-4. [Google Scholar] [CrossRef]
  3. Ahmad Dar, R.; Ahmad Dar, E.; Kaur, A.; Gupta Phutela, U. Sweet sorghum-a promising alternative feedstock for biofuel production. Renew. Sustain. Energy Rev. 2018, 82, 4070–4090. [Google Scholar] [CrossRef]
  4. Wu, Q.; Qiang, T.C.; Zeng, G.; Zhang, H.; Huang, Y.; Wang, Y. Sustainable and renewable energy from biomass wastes in palm oil industry: A case study in Malaysia. Int. J. Hydrogen Energy 2017, 42, 23871–23877. [Google Scholar] [CrossRef] [Green Version]
  5. Li, K.; Liu, R.; Sun, C. A review of methane production from agricultural residues in China. Renew. Sustain. Energy Rev. 2016, 54, 857–865. [Google Scholar] [CrossRef]
  6. Biosantech, T.A.S.; Rutz, D.; Janssen, R.; Drosg, B. Biomass resources for biogas production. In The Biogas Handbook; Wellinger, A., Murphy, J., Baxter, D., Eds.; Woodhead Publishing: Cambridge, UK, 2013; pp. 19–51. ISBN 978-0-85709-498-8. [Google Scholar] [CrossRef]
  7. Lebuhn, M.; Munk, B.; Effenberger, M. Agricultural biogas production in Germany—From practice to microbiology basics. Energy Sustain. Soc. 2014, 4, 10. [Google Scholar] [CrossRef] [Green Version]
  8. Cheng, S.; Li, Z.; Mang, H.-P.; Huba, E.-M.; Gao, R.; Wang, X. Development and application of prefabricated biogas digesters in developing countries. Renew. Sustain. Energy Rev. 2014, 34, 387–400. [Google Scholar] [CrossRef]
  9. Roubík, H.; Mazancová, J.; Le Dinh, P.; Dinh Van, D.; Banout, J. Biogas quality across small-scale biogas plants: A case of central Vietnam. Energies 2018, 11, 1794. [Google Scholar] [CrossRef] [Green Version]
  10. Rajendran, K.; Aslanzadeh, S.; Taherzadeh, M.J. Household biogas digesters—A review. Energies 2012, 5, 2911–2942. [Google Scholar] [CrossRef]
  11. Angelidaki, I.; Treu, L.; Tsapekos, P.; Luo, G.; Campanaro, S.; Wenzel, H.; Panagiotis, K. Biogas upgrading and utilization: Current status and perspectives. Biotechnol. Adv. 2018, 36, 452–466. [Google Scholar] [CrossRef] [Green Version]
  12. Mittal, S.; Ahlgren, E.O.; Shukla, P.R. Barriers to biogas dissemination in India: A review. Energy Policy 2018, 112, 361–370. [Google Scholar] [CrossRef]
  13. Jiang, X.; Sommer, S.G.; Christensen, K.V. A review of the biogas industry in China. Energy Policy 2011, 39, 6073–6081. [Google Scholar] [CrossRef]
  14. Shindina, T.; Streimikis, J.; Sukhareva, Y.; Nawrot, Ł. Social and Economic Properties of the Energy Markets. Econom. Sociol. 2018, 11, 334–344. [Google Scholar] [CrossRef]
  15. Stavytskyy, A.; Kharlamova, G.; Giedraitis, V.; Šumskis, V. Estimating the interrelation between energy security and macroeconomic factors in European countries. J. Int. Studies 2018, 11, 217–238. [Google Scholar] [CrossRef] [PubMed]
  16. Kalinichenko, A.; Havrysh, V. Environmentally Friendly Fuel Usage: Economic Margin of Feasibility. Ecol. Chem. Eng. S 2019, 26, 241–254. [Google Scholar] [CrossRef] [Green Version]
  17. Kopishynska, O.; Utkin, Y.; Kalinichenko, A.; Jelonek, D. Efficacy of the cloud computing technology in the management of communication and business processes of the companies. Pol. J. Man. Stud. 2016, 14, 104–114. [Google Scholar] [CrossRef]
  18. Guimarães, C.; Maia, D.; Serra, E. Construction of biodigesters to optimize the production of biogas from anaerobic co-digestion of food waste and sewage. Energies 2018, 11, 870. [Google Scholar] [CrossRef] [Green Version]
  19. Mor, S.; Ravindra, K.; Dahiya, R.P.; Chandra, A. Leachate characterization and assessment of groundwater pollution near municipal solid waste landfill site. Environ. Monit. Assess. 2006, 118, 435–456. [Google Scholar] [CrossRef] [PubMed]
  20. Mantis, I.; Voutsa, D.; Samara, C. Assessment of the environmental hazard from municipal and industrial wastewater treatment sludge by employing chemical and biological methods. Ecotoxicol. Environ. Saf. 2005, 62, 397–407. [Google Scholar] [CrossRef]
  21. Tatsi, A.A.; Zouboulis, A.I. A field investigation of the quantity and quality of leachate from a municipal solid waste landfill in a Mediterranean climate (Thessaloniki, Greece). Adv. Environ. Res. 2002, 6, 207–219. [Google Scholar] [CrossRef]
  22. Mugodo, K.; Magama, P.P.; Dhavu, K. Biogas production potential from agricultural and agro-processing waste in South Africa. Waste Biomass Valoriz. 2017, 8, 2383–2392. [Google Scholar] [CrossRef]
  23. Benato, A.; Macor, A. Italian Biogas Plants: Trend, Subsidies, Cost, Biogas Composition and Engine Emissions. Energies 2019, 12, 979. [Google Scholar] [CrossRef] [Green Version]
  24. Murray, B.; Galik, C.S.; Vegh, T. Biogas in the United States: An Assessment of Market. Potential in a Carbon-Constrained Future; Report NI R 14-02; Nicholas Institute for Environmental Policy Solutions: Durham, NC, USA, February 2014; Available online: https://nicholasinstitute.duke.edu/sites/default/files/publications/ni_r_14-02_full_pdf.pdf (accessed on 29 December 2019).
  25. Hengeveld, E.J.; Bekkering, J.; van Gemert, W.J.T.; Broekhuis, A.A. Biogas infrastructures from farm to regional scale, prospects of biogas transport grids. Biomass Bioenergy 2016, 86, 43–52. [Google Scholar] [CrossRef] [Green Version]
  26. Banja, M.; Jegard, M.; Motola, V.; Sikkema, R. Support for biogas in the EU electricity sector—A comparative analysis. Biomass Bioenergy 2019, 128, 105313. [Google Scholar] [CrossRef]
  27. Scarlat, N.; Dallemand, J.-F.; Fahl, F. Biogas: developments and perspectives in Europe. Renew. Energy 2018, 129, 457–472. [Google Scholar] [CrossRef]
  28. De Oliveira, L.G.S.; Negro, S.O. Contextual structures and interaction dynamics in the Brazilian Biogas Innovation System. Renew. Sustain. Energy Rev. 2019, 107, 462–481. [Google Scholar] [CrossRef]
  29. Eyl-Mazzega, M.-A.; Mathieu, C. Biogas and Biomethane in Europe: Lessons from Denmark, Germany and Italy; Etudes de l’Ifri, Ifri: Paris, France, April 2019; Available online: https://www.ifri.org/sites/default/files/atoms/files/mathieu_eyl-mazzega_biomethane_2019.pdf (accessed on 29 December 2019).
  30. Winquist, E.; Rikkonen, P.; Pyysiäinen, J.; Varho, V. Is biogas an energy or a sustainability product?—Business opportunities in the Finnish biogas branch. J. Clean. Prod. 2019, 233, 1344–1354. [Google Scholar] [CrossRef]
  31. Bundgaard, S.S.; Kofoed-Wiuff, A.; Herrmann, I.T.; Karlsson, K.B. Experiences with Biogas in Denmark. DTU Management Engineering. 2014. Available online: https://backend.orbit.dtu.dk/ws/portalfiles/portal/97911958/Experiences_with_biogas_in_Denmark.pdf (accessed on 29 December 2019).
  32. Gu, L.; Zhang, Y.X.; Wang, J.Z.; Chen, G.; Battye, H. Where is the future of China’s biogas? Review, forecast, and policy implications. Pet. Sci. 2016, 13, 604–624. [Google Scholar] [CrossRef] [Green Version]
  33. Igliński, B.; Buczkowski, R.; Cichosz, M. Biogas production in Poland—Current state, potential and perspectives. Renew. Sustain. Energy Rev. 2015, 50, 686–695. [Google Scholar] [CrossRef]
  34. Trends and Developments in the Renewable Energy Sector in Ukraine; Saxion University of Applied Sciences: Enschede, The Netherlands, 2018; Available online: https://www.agroberichtenbuitenland.nl/binaries/agroberichtenbuitenland/documenten/publicaties/2018/09/21/trends-in-biomass/2018+trends+in+renewable+sector+eng.pdf (accessed on 11 April 2020).
  35. Atamanyuk, I.P.; Kondratenko, Y.P.; Sirenko, N.N. Forecasting Economic Indices of Agricultural Enterprises Based on Vector Polynomial Canonical Expansion of Random Sequences. In Proceedings of the 12-th International Conference ICTERI’2016, CEUR-WS, Kyiv, Ukraine, 21–24 June 2016; 1614, pp. 458–468. Available online: http://ceur-ws.org/Vol-1614/paper_91.pdf (accessed on 21 March 2020).
  36. Trypolska, H.; Diachuk, O.; Podolets, R.; Chepeliev, M. Biogas projects in Ukraine: prospects, consequences and regulatory policy. Econ. Forecast. 2018, 2, 111–134. [Google Scholar] [CrossRef]
  37. Hnatyshyn, M. Decomposition analysis of the impact of economic growth on ammonia and nitrogen oxides emissions in the European Union. J. Int. Stud. 2018, 11, 201–209. [Google Scholar] [CrossRef] [Green Version]
  38. Simionescu, M.; Bilan, Y.; Gędek, S.; Streimikiene, D. The Effects of Greenhouse Gas Emissions on Cereal Production in the European Union. Sustainability 2019, 11, 3433. [Google Scholar] [CrossRef] [Green Version]
  39. Muzychak, A.; Vlasenko, M. Prospects for Biogas—Leaders’ Experience Helps Ukraine. In Proceedings of the International Youth Science Forum “Litteris Et Artibus”, Lviv, Ukraine, 24–26 November 2016; pp. 179–180. Available online: http://ena.lp.edu.ua/bitstream/ntb/40738/1/LEA-2016-179-180.pdf (accessed on 29 December 2019).
  40. Goncharuk, A.G.; Havrysh, V.; Nitsenko, V. National features for alternative motor fuels market. Int. J. Energy Technol. Policy 2018, 14, 226–249. [Google Scholar] [CrossRef]
  41. Bilan, Y.; Nitsenko, V.; Havrysh, V. Energy aspect of vertical integration in agriculture. Rynek Energii 2017, 5, 98–110. Available online: http://rynek-energii.pl/pl/RE132 (accessed on 29 December 2019).
  42. Plotnitska, S.I.; Arutiunian, R.R.; Berezhna, Y.H.; Bogomolova, K.S. Formation and efficient development of biogas production in the agricultural sector. Financ. Credit Act Probl. Theory Pract. 2019, 1, 216–224. [Google Scholar] [CrossRef] [Green Version]
  43. Pryshliak, N. Biogas production in individual biogas digesters: Experience of India and prospects for Ukraine. Agric. Res. Econ. 2019, 5, 122–136. Available online: https://www.are-journal.com/are/article/view/226 (accessed on 29 December 2019).
  44. Parawira, W. Biogas technology in sub-Saharan Africa: Status, prospects and constraints. Rev. Environ. Sci. Biotechnol. 2009, 8, 187–200. [Google Scholar] [CrossRef]
  45. Kalinichenko, A.; Havrysh, V. Feasibility study of biogas project development: Technology maturity, feedstock, and utilization pathway. Arch. Env. Protect. 2019, 45, 68–83. [Google Scholar]
  46. Jiang, Y.; Havrysh, V.; Klymchuk, O.; Nitsenko, V.; Balezentis, T.; Streimikiene, D. Utilization of Crop Residue for Power Generation: The Case of Ukraine. Sustainability 2019, 11, 7004. [Google Scholar] [CrossRef] [Green Version]
  47. Lyeonov, S.; Pimonenko, T.; Bilan, Y.; Štreimikienė, D.; Mentel, G. Assessment of Green Investments’ Impact on Sustainable Development: Linking Gross Domestic Product Per Capita, Greenhouse Gas Emissions and Renewable Energy. Energies 2019, 12, 3891. [Google Scholar] [CrossRef] [Green Version]
  48. Tvaronavičienė, M.; Prakapienė, D.; Garškaitė-Milvydienė, K.; Prakapas, R.; Nawrot, Ł. Energy Efficiency in the Long-Run in the Selected European Countries. Econ. Sociol. 2018, 11, 245–254. [Google Scholar] [CrossRef] [Green Version]
  49. Havrysh, V.; Kalinichenko, A.; Minkova, O.; Lyashenko, S. Agricultural feedstock for solid and liquid biofuel production in Ukraine: cluster analysis. Proceedings of Environmental Science, Engineering and Management, Environmental Innovations: Advances in Engineering, Technology and Management, EIAETM, Poltava, Ukraine, 23–27 September 2019; 6, pp. 649–658. Available online: http://procedia-esem.eu/pdf/issues/2019/no4/73_Havrysh_19.pdf (accessed on 3 March 2020).
  50. Kalinichenko, A.; Havrysh, V.; Hruban, V. Heat Recovery Systems for Agricultural Vehicles: Utilization Ways and Their Efficiency. Agric. Basel 2018, 8, 199. [Google Scholar] [CrossRef]
  51. Simionescu, M.; Albu, L.L.; Raileanu Szeles, M.; Bilan, Y. The impact of biofuels utilisation in transport on the sustainable development in the European Union. Technol. Econ. Dev. Econ. 2017, 23, 667–686. [Google Scholar] [CrossRef]
  52. IRENA. Renewable Energy Statistics; International Renewable Energy Agency: Abu Dhabi, UAE, 2019; ISBN 978-92-9260-137-9. Available online: https://www.irena.org/publications/2019/Jul/Renewable-energy-statistics-2019 (accessed on 11 April 2020).
  53. IRENA. Biogas for Road Vehicles: Technology Brief; International Renewable Energy Agency: Abu Dhabi, UAE, 2018; Available online: https://www.irena.org/publications/2017/Mar/Biogas-for-road-vehicles-Technology-brief (accessed on 11 April 2020).
  54. Power from Waste—the World’s Biggest Biomass Power Plants. Power Technology. Available online: https://www.power-technology.com/features/featurepower-from-waste-the-worlds-biggest-biomass-power-plants-4205990/ (accessed on 11 April 2020).
  55. Vaskiluoto—The world’s Largest Biomass Gasifier Exceeds Expectations. Valmet. Available online: https://www.valmet.com/media/articles/all-articles/vaskiluoto---the-worlds-largest-biomass-gasifier-exceeds-expectations/ (accessed on 11 April 2020).
  56. Top 10 Biggest Wind Farms. Power Technology. Available online: https://www.power-technology.com/features/feature-biggest-wind-farms-in-the-world-texas/ (accessed on 11 April 2020).
  57. 5 Largest Solar Farms in the World. Origin. Available online: https://www.originenergy.com.au/blog/5-largest-solar-farms-in-the-world/ (accessed on 11 April 2020).
  58. Ortega, S.C. The Largest Waste Water Treatment Plant in the World. Available online: http://www.dimasagrupo.com/wp-content/uploads/2016/06/Biogas-Directory-Vol04M-Reportaje-Atotonilco.pdf (accessed on 10 May 2020).
  59. Shen, Y.; Linville, J.L.; Urgun-Demirtas, M.; Mintz, M.M.; Snyder, S.W. An overview of biogas production and utilization at full-scale wastewater treatment plants (WWTPs) in the United States: Challenges and opportunities towards energy-neutral WWTPs. Renew. Sustain. Energy Rev. 2015, 50, 346–362. [Google Scholar] [CrossRef] [Green Version]
  60. New Jenbachers Make Ottersberg Plant. Largest Biogas Complex. In Germany. Available online: https://dieselgasturbine.com/new-jenbachers-make-ottersberg-plant-largest-biogas-complex-in-germany/ (accessed on 11 April 2020).
  61. Brazil’s Sao Paulo Inaugurates 29.5-MW Biogas Plant. Available online: https://renewablesnow.com/news/brazils-sao-paulo-inaugurates-295-mw-biogas-plant-540185/ (accessed on 11 April 2020).
  62. First Phase of Ukraine’s Largest Biogas Complex Put into Operation. Available online: https://latifundist.com/en/novosti/47871-v-ukraine-zapustili-pervuyu-ochered-krupnejshego-biogazovogo-kompleksa (accessed on 11 April 2020).
  63. World’s Largest Biogas Plant Started Running at Full Capacity in Ukraine. Available online: https://latifundist.com/en/novosti/46049-v-ukraine-na-polnuyu-moshchnost-zarabotala-krupnejshaya-v-mire-biogazovaya-stantsiya (accessed on 11 April 2020).
  64. Balussou, D. An analysis of current and future electricity production from biogas in Germany. Ph.D. Thesis, Karlsruhe Institute of Technology, Karlsruhe, Germany, 2018. [Google Scholar] [CrossRef]
  65. The State of Renewable Energies in Europe. Edition 2019. 19th EurObserv’ER Report. Available online: https://www.eurobserv-er.org/ (accessed on 11 April 2020).
  66. Biogas Technologies in Lithuania. Available online: http://www.lei.lt/Opet/Renewable/biogas (accessed on 11 April 2020).
  67. New VERBIO Plant for the Production of Biomethane from 100 Percent Straw Commissioned as Scheduled. Available online: https://www.verbio.de/en/press/news/press-releases/new-verbio-plant-for-the-production-of-biomethane-from-100-percent-straw/ (accessed on 11 April 2020).
  68. BioEnergy Farm. Implementation Plan for BioEnergy Farm. IEE Contract No. IEE/09/637 S12.558213. D 4.1: Description of Best Examples. Available online: https://ec.europa.eu/energy/intelligent/projects/sites/iee-projects/files/projects/documents/bioenergy_farm_description_of_best_case_examples_en.pdf (accessed on 3 March 2020).
  69. Field Crops and Gassland. Statistisches Bundesamt. Available online: https://www.destatis.de/EN/Themes/Economic-Sectors-Enterprises/Agriculture-Forestry-Fisheries/Field-Crops-Grassland/_node.html (accessed on 5 March 2020).
  70. Short-Term Outlook for EU Agricultural Markets in 2019 and 2020. Summer 2019. Edition #24. Available online: https://ec.europa.eu/info/sites/info/files/food-farming-fisheries/farming/documents/short-term-outlook-autumn-2019_en.pdf (accessed on 5 March 2020).
  71. Crop. Production of Ukraine. Statistical Yearbook. 2018. Available online: http://www.ukrstat.gov.ua/druk/publicat/kat_u/2019/zb/04/zb_rosl_2018.pdf (accessed on 5 March 2020).
  72. Biogas-Messprogramm II, 61 Biogasanlagen im Vergleich. Available online: https://www.infothek-biomasse.ch/images/178_2009_FNR_Biogasanlagen_im_Vergleich.pdf (accessed on 3 January 2020).
  73. Savchuk, S. Ukraine: Energy Efficiency and Renewable Energy. Available online: https://saee.gov.ua/sites/default/files/documents/SAEE_Invest_potential_EE_RE_29_05_2018.pdf (accessed on 3 January 2020).
  74. IRENA (2019), Renewable Power Generation Costs in 2018, International Renewable Energy Agency, Abu Dhabi. Available online: https://www.irena.org/-/media/Files/IRENA/Agency/Publication/2019/May/IRENA_Renewable-Power-Generations-Costs-in-2018.pdf (accessed on 3 January 2020).
  75. Logan, J.; Marcy, C.; McCall, J.; Flores-Espino, F.; Bloom, A.; Aabakken, J.; Cole, W.; Jenkin, T.; Porro, G.; Liu, C. Electricity Generation Baseline Report, NREL. January 2017. Available online: https://www.nrel.gov/docs/fy17osti/67645.pdf (accessed on 3 January 2020).
  76. Chludziński, D.; Duda, M. Technological solutions applied in biogas plants—A case study. E3S Web Conf. 2018, 49, 00012. [Google Scholar] [CrossRef]
  77. Balussou, D.; Kleyböcker, A.; McKenna, R.; Möst, D.; Fichtner, W. An economic analysis of three operational co-digestion biogas plants in Germany. Waste Biomass Valoris 2011, 3, 23–41. [Google Scholar] [CrossRef] [Green Version]
  78. Koch, M. Ökologische und Ökonomische Bewertung von Co-Vergärungsanlagen und Deren Standortwahl; Universität Karlsruhe: Karlsruhe, Germany, 2009; Available online: https://publikationen.bibliothek.kit.edu/1000010806/809783 (accessed on 10 January 2020).
  79. König, A. Ganzheitliche Analyse und Bewertung konkurrierender energetischer Nut-zungspfade für Biomasse im Energiesystem Deutschland bis zum Jahr 2030. Ph.D. Thesis, Universität Stuttgart, Stuttgart, Germany, 2009. [Google Scholar] [CrossRef]
  80. Deutsches Biomasseforschungszentrum (DBFZ). Vorbereitung und Begleitung der Erstellung des Erfahrungsberichts 2014 gemäß §65 EEG, Vorhaben IIa Stromerzeugung aus Biomasse; Wissenschaftlicher Bericht: Leipzig, Germany, July 2014; p. 50. Available online: https://www.dbfz.de/fileadmin/eeg_monitoring/berichte/02_Erfahrungsbericht_Juli_2015.pdf (accessed on 3 January 2020).
  81. Zeddies, J.; Bahrs, E.; Schönleber, N.; Gamer, W.; Empl, J.-B. Optimierung der Biomas-senutzung nach Effizienz in Bereitstellung und Verwendung unter Berücksichtigung von Nachhaltigkeitszielen und Welternährungssicherung (Schlussbericht), FK 11NR039; Universität Hohenheim: Stuttgart, Germany, December 2014; p. 231. Available online: https://projekte.uni-hohenheim.de/i410b/download/publikationen/UHOH%20410B%20FNR_BMELV%20FKZ11NR039%20Optimierung%20Biomassenutzung%20final%20report.pdf (accessed on 3 January 2020).
  82. Amelang, S. Industry Power Prices in Germany: Extremely High – and Low. 4 December 2019. Available online: https://www.cleanenergywire.org/industrial-power-prices-and-energiewende (accessed on 11 January 2020).
  83. Electricity Price Statistics. Available online: https://ec.europa.eu/eurostat/statistics-explained/index.php/Electricity_price_statistics (accessed on 11 January 2020).
  84. An Analysis of Energy Production Costs from Anaerobic Digestion Systems on U.S Livestock Production Facilities; Technical Note No. 1; USDA: Washington, DC, USA, October 2007; Available online: https://directives.sc.egov.usda.gov/OpenNonWebContent.aspx?content=22533.wba (accessed on 11 January 2020).
  85. Financial Analysis of Biomethane Production. Available online: http://www.suscon.org/pdfs/cowpower/biomethaneSourcebook/Chapter_8.pdf (accessed on 17 February 2020).
  86. Road Transport: The Cost of Renewable Solutions. IRENA Report. 2013. Available online: https://www.irena.org/-/media/Files/IRENA/Costs/Renewable-Costing-Alliance/Road_Transport.pdf?la=en&hash=A0E526B4D007F3E759DDBD9A27205E409DF40CF5 (accessed on 15 January 2020).
  87. Yii-Der, Y. Economic Cost Analysis of Biodiesel Production: Case in Soybean Oil. Energy Fuels 2008, 22, 182–189. [Google Scholar] [CrossRef]
  88. Daniel-Gromke, J.; Rensberg, N.; Denysenko, V.; Stinner, W.; Schmalfuß, T.; Scheftelowitz, M.; Nelles, M.; Liebetrau, J. Current Developments in Production and Utilization of Biogas and Biomethane in Germany. Chem. Ing. Technol. 2018, 90, 17–35. [Google Scholar] [CrossRef]
  89. Havrysh, V.; Nitsenko, V.; Bilan, Y.; Streimikiene, D. Assessment of optimal location for a centralized biogas upgrading facility. Energy Environ. 2019, 30, 462–480. [Google Scholar] [CrossRef]
  90. Gas Infrastructure Europe (GIE); European Biogas Association (EBA). European Biomethane Map: Infrastructure for Biomethane Production 2018. Available online: https://www.gie.eu/download/maps/2018/GIE_BIO_2018_A0_1189x841.pdf (accessed on 28 February 2020).
  91. Schmid, C.; Horschig, T.; Pfeiffer, A.; Szarka, N.; Thrän, D. Biogas Upgrading: A Review of National Biomethane Strategies and Support Policies in Selected Countries. Energies 2019, 12, 3803. [Google Scholar] [CrossRef] [Green Version]
  92. Aui, A.; Wright, M.M. Life Cycle Cost Analysis of the Operations of Anaerobic Digesters in Iowa; Grant Number 17ARRA001; Iowa State University: Ames, IA, USA, 2018; Available online: http://iowabiogasmodel.us/Anaerobic_Digestion_LCA_Final_Report.pdf (accessed on 28 February 2020).
  93. Cucchiella, F.; D’Adamo, I.; Gastaldi, M. Profitability Analysis for Biomethane: A Strategic Role in the Italian Transport Sector. Int J. Energy Econ. Policy 2015, 5, 440–449. Available online: https://ideas.repec.org/a/eco/journ2/2015-02-07.html (accessed on 3 March 2020).
  94. Cesaro, A.; Belgiorno, V. Combined Biogas and Bioethanol Production: Opportunities and Challenges for Industrial Application. Energies 2015, 8, 8121–8144. [Google Scholar] [CrossRef]
  95. Esposito, E.; Dellamuzia, L.; Moretti, U.; Fuoco, A.; Giorno, L.; Jansen, J.C. Simultaneous production of biomethane and food grade CO2 from biogas: An industrial case study. Energy Environ. Sci. 2019, 12, 281. [Google Scholar] [CrossRef]
  96. IEA Bioenergy Task 37—Country Reports Summary 2017. Available online: https://task37.ieabioenergy.com/country-reports.html (accessed on 3 March 2020).
  97. Global Petrol Prices. Available online: https://www.globalpetrolprices.com/gasoline_prices/#hl227 (accessed on 3 March 2020).
  98. Carbon Dioxide in Ukraine. Available online: https://zakupka.com/k/tehnicheskaya-uglekislota/ (accessed on 3 March 2020).
  99. Zhuk, H. Biogas Technologies—Ukrainian Perspective. Available online: https://www.beic.nu/resources/03_Hennadiy_Zhuk.pdf (accessed on 3 March 2020).
  100. Optimal Use of Biogas from Waste Streams. An Assessment of the Potential of Biogas from Digestion in the EU beyond 2020 European Commission. Final Report. December 2016. Available online: https://ec.europa.eu/energy/sites/ener/files/documents/ce_delft_3g84_biogas_beyond_2020_final_report.pdf (accessed on 9 March 2020).
  101. Italy – 2018 Update, Bioenergy Policies and Status of Implementation. IEA Bioenergy, IEA. September 2018. Available online: https://www.ieabioenergy.com/wp-content/uploads/2018/10/CountryReport2018_Italy_final.pdf (accessed on 5 March 2020).
  102. European Parliament, Council of the European Union. Directive (EU) 2015/1513 of the European Parliament and of the Council of 9 September 2015 amending Directive 98/70/EC relating to the quality of petrol and diesel fuels and amending Directive 2009/28/EC on the promotion of the use of energy from renewable sources: ILUC 2015/1513. O. J. Eur. Union 2015, 239, 1–29. Available online: https://eur-lex.europa.eu/legal-content/EN/TXT/PDF/?uri=CELEX:32015L1513&from=EN (accessed on 5 March 2020).
  103. German Federal Ministry for Economic Affairs and Energy Renewable Energy Sources Act (EEG 2017). Available online: https://www.bmwi.de/Redaktion/EN/Downloads/renewable-energy-sources-act-2017.pdf%3F__blob%3DpublicationFile%26v%3D3 (accessed on 9 March 2020).
  104. Lönnqvist, T.; Sandberg, T.; Birbuet, J.C.; Olsson, J.; Espinosa, C.; Thorin, E.; Gronkvist, S.; Gomez, M.F. Large-scale biogas generation in Bolivia—A stepwise reconfiguration. J. Clean. Prod. 2018, 180, 494–504. [Google Scholar] [CrossRef]
  105. Meyer, A.K.P.; Ehimen, E.A.; Holm-Nielsen, J.B. Future European biogas: Animal manure, straw and grass potentials for a sustainable European biogas production. Biomass Bioenergy 2018, 111, 154–164. [Google Scholar] [CrossRef]
  106. Poeschl, M.; Ward, S.; Owende, P. Prospects for expanded utilization of biogas in Germany. Renew. Sustain. Energy Rev. 2010, 14, 1782–1797. [Google Scholar] [CrossRef]
  107. European Committee for Standardization. EN 16723-1 2016: Natural Gas and Biomethane for Use in Transport and Biomethane for Injection in the Natural Gas Network—Part 1: Specifications for Biomethane for Injection in the Natural Gas Network: Work Item Number: 00408006. 2016. Available online: https://ilnas.services-publics.lu/ecnor/downloadPreview.action?documentReference=198423 (accessed on 9 March 2020).
  108. European Committee for Standardization. EN 16723-2. 2017: Natural Gas and Biomethane for Use in Transport and Biomethane for Injection in the Natural Gas Network—Part 2: Automotive Fuels Specification: Work Item Number: 00408005. 2017. Available online: https://infostore.saiglobal.com/en-us/Standards/EN-16723-2-2017-342578_SAIG_CEN_CEN_784469/ (accessed on 9 March 2020).
  109. Technology Center Ltd. Biogas Data on Biogas. Swedish Gas. 2012. Available online: http://www.sgc.se/ckfinder/userfiles/files/BasicDataonBiogas2012.pdf (accessed on 9 March 2020).
  110. Mathiasson, A.; Swedich Gas Association. Present Status and Future Projects of Biomethane in Sweden (Scandinavia). Available online: https://docplayer.net/21322963-Present-status-and-future-projects-of-biomethane-in-sweden-scandinavia-anders-mathiasson-malmo-2016-05-12-senior-advisor-swedish-gas-association.html (accessed on 9 March 2020).
  111. The Swedish-Norwegian electricity Certificate Market. Annual Report 2018. Available online: https://energimyndigheten.a-w2m.se/FolderContents.mvc/Download?ResourceId=136635 (accessed on 9 March 2020).
  112. Sehgal, K. Current State and Future Prospects of Global Biogas Industry. In Biogas. Biofuel and Biorefinery Technologies; Springer: Cham, Switzerland, 2018; pp. 449–472. ISBN 978-3-319-77334-6. [Google Scholar] [CrossRef]
  113. Biogas Technology Suppliers Directory. 2018. Available online: https://bioenergyinternational.com/app/uploads/sites/3/2019/01/Biogas-Technology-Suppliers-Directory_103.pdf (accessed on 21 March 2020).
  114. Leading Companies in Biogas Technology. Companies Catalogue. January 2018. Available online: https://www.europeanbiogas.eu/wp-content/uploads/2019/05/Companies-Catalogue-EBA-2018.pdf (accessed on 21 March 2020).
  115. The Gas Institute of the National Academy of Sciences of Ukraine. Available online: www.gas-inst.org.ua (accessed on 21 March 2020).
  116. Law 16.10.1997 № 575/97-ВР. Available online: https://zakon.rada.gov.ua/laws/show/575/97-%D0%B2%D1%80?lang=uk (accessed on 9 March 2020).
  117. Brzozowska, A.; Bubel, D.; Kalinichenko, A.; Nekrasenko, L. Transformation of the agricultural financial system in the age of globalization. Agric. Econ. 2017, 63, 548–558. [Google Scholar] [CrossRef] [Green Version]
  118. Feliv, O. Ukraine’s Green Tariff Attracts Investors, Yet Hurts Economy. Integrites. Available online: https://www.integrites.com/publications/ukraines-green-tariff-attracts-investors-yet-hurts-economy/ (accessed on 9 March 2020).
Figure 1. Production index.
Energies 13 02668 g001
Figure 2. Specific turnover created by biogas industry.
Energies 13 02668 g002
Figure 3. Specific investment costs for agricultural biogas plants.
Energies 13 02668 g003
Figure 4. Specific investment costs for renewable plants.
Energies 13 02668 g004
Figure 5. Capacity factors.
Energies 13 02668 g005
Figure 6. Ratios of adjusted specific investment costs.
Energies 13 02668 g006
Figure 7. Electricity production costs versus installed capacity.
Energies 13 02668 g007
Figure 8. Electricity production costs from renewable energy.
Energies 13 02668 g008
Figure 9. Specific investment costs.
Energies 13 02668 g009
Figure 10. Capacity of biomethane plants.
Energies 13 02668 g010
Figure 11. Biomethane production costs.
Energies 13 02668 g011
Figure 12. Cost of biomethane production compared to alternatives.
Energies 13 02668 g012
Figure 13. Income from the use of one cubic meter of biogas.
Energies 13 02668 g013
Figure 14. Income from the use of one cubic meter of biomethane.
Energies 13 02668 g014
Figure 15. Support schemes.
Energies 13 02668 g015
Figure 16. Number of companies.
Energies 13 02668 g016
Table 1. Largest renewable energy power plants.
TypeInstalled Power Capacity, MWeFeedstockLocationReference
biomass fired740Wood pelletsSevern Gorge, UK[54]
biomass gasification140Forest residuesVaasa, Finland[55]
wind power8000 (target 20,000 by 2020) Gansu, China[56]
solar2000 Karnataka’s Tumakuru, India[57]
biogas32WastewaterAtotonilco de Tula[58]
biogas11Wastewater Oakland, USA[59]
biogas11.35dried poultry manureGermany[60]
biogas29.5Landfill gasSao Paulo, Brazil[61]
biogas12 (target 24)poultry manureLadyzhyn, Ukraine[62]
biogas15.6Sugar beet pulp, corn silageTeofipol, Ukraine[63]
Table 2. Selected biogas production indicators in Ukraine, Germany, and the EU. Note: toe, tons of oil equivalent.
ItemUnitGermanyEUUkraine
Annual biogas productionktoe7631.116,838.728.68
Arable land area1000 ha11,730.970,56727,700
Specific biomass productiont/ha19.4411.0910.61
Adjustment factor 10.5700.546
Specific biogas productionktoe/1000 ha0.6510.2390.001
Adjusted potential biogas productionktoe/1000 ha0.6510.3710.355
Reserve for specific biogas productionktoe/1000 ha 0.1320.354
Potential biogas productionktoe 26,187.4229834.555
Total reservektoe 9348.7229805.875
Table 3. Initial data. CHP, combined heat and power plants.
Parameter UnitValueReference
Electricity priceEUR/kWh0.104
Petrol priceEUR/l0.96[97]
Diesel fuel priceEUR/l0.93[97]
Heating priceEUR/kWh0.047
Carbon dioxide priceEUR/kg0.362[98]
Power generation efficiency %35
Total efficiency of CHP%80
Biogas boiler efficiency%90
Lower heating value of biogasMJ/m321
Carbon dioxide content%35
Table 4. Market comparison. CIC, Certificates of Release for Consumption.
IndicatorCountry
GermanyItalyDenmarkSwedenUkraine
Biogas production and utilization
Biogas production, ktoe7631.11892.2489.0175.828.7
Average biogas plant capacity, ktoe0.6961.1433.3960.8880.870
Electricity only: ktoe617.9249.30.0700
%8.1013.180.01400
Heat only: ktoe8.70.11.94.50
%0.110.0050.392.560
Cogeneration ktoe6931.11642.4481.852.828.7
%91.3586.8098.5330.03100
Vehicle fuel: ktoe33.40.45.2118.50
%0.440.021.0667.410
Sustainability (primary type of feedstock)
 Energy crops+
 Residues and waste ++++
Support schemes for electricity
 Feed-in tariff+ + +
 Feed-in premium
 Auction+ +
 Electricity certificates +
National quality standards (biomethane)
 Grid injection+++
 Use as vehicle fuel+ ++
Support schemes for biomethane
 Quota +
 CIC +
 Tax exemption +
Note: + = Available.
Table 5. Recommendations and current status.
MeasuresRecommendationsCurrent Status
Sustainability:
Waste (residues)+*
Energy crops-*
Research and production of technology and equipment+¤
Support schemes:
Electricity+*
Heat+¤
Biomethane+¤
Standards for biomethane+¤
Utilization pathways:
Electricity-*
Heat-*
Cogeneration+*
Biomethane as vehicle fuel+¤
Biomethane and capture of carbon dioxide+¤
Capacity:
More than 1000 m3/h+*
Note: +—recommended; −—not recommended; *—used; ¤—not used.

