1. Introduction
Sodium-nickel chloride technology was first introduced with the ZEBRA (Zero Emission Battery Research Activity) battery [
1]. It seems an appealing alternative to Lithium-Ion (Li-Ion) for energy storage, thanks to the good energy density and long lifetime [
2]. Above all, sodium–nickel chloride technology is inherently safer and less expensive than Li-Ion, because it uses molten sodium as anode and nickel chloride as cathode. These materials are very common in nature, cheap, and less prone to accidents like lithium is [
3,
4]. Conduction relies on the movement of the sodium ions through a beta-alumina ceramic container, which is conductive for the ions and insulating for the electrons [
5]. The main chemical reaction occurring in the cell is
The cathode material is added with iron (Fe) to increase the cell power response at low State of Charge (SOC). This fact reduces the cell resistance and allows the occurrence of the following additional reaction.
Some obvious drawbacks of the sodium–nickel chloride technology are that the electrolyte must get to the liquid phase and the beta-alumina resistance must be comparable with the other contributions. Thus, the cell operation is only possible at temperatures above 250 °C, at which the sodium is liquid and the beta-alumina is not damaged by the ion passage [
1]. This condition forces the battery to be equipped with a heater that increases the energy losses and makes these batteries not suited to every application. However, the above-mentioned advantages make sodium–nickel chloride very appealing as alternative to Li-Ion in several applications, such as in some automotive cases [
5,
6], as an energy storage system for renewable energy [
7,
8,
9], and as a backup energy source in telecommunication applications [
10,
11].
Unfortunately, the production process of the sodium–nickel chloride battery and the full exploitation of its capabilities present open challenges that still limit the penetration of the battery market [
12]. Many studies were presented in the last years to address the production issues [
13,
14,
15]. Instead, the literature is poor about improved and accurate battery models and battery state estimation algorithms that can contribute to the full exploitation of this technology [
16]. A large amount of experimental data is not available in the literature yet. More data would be welcome to find an accurate model of the battery behavior in every operational condition.
A commercial sodium–nickel chloride battery, the FZSonick
® 48TL200, was discharged with different constant loads and the preliminary characterization results were reported in [
17]. These tests highlighted that the battery provides the maximum energy to the load if it is discharged with a current of ~50 A. This current fully discharges the battery in about 4 h, i.e., discharge rate is C/4, where C is the nominal battery capacity. On the one hand, the energy lost in the battery heaters to maintain the minimum value of the temperature decreases at high currents. Therefore, the task of maintaining the minimum temperature level is also sustained by the heat generated in the parasitic series resistance of the battery, and the heaters may eventually be turned off. On the other hand, the heat generated in the battery series resistance is larger than that dissipated through the case at high discharge rates. The net effect is that the battery temperature increases too much and overcomes the maximum operating value, eventually causing the battery disconnection.
This work extends the experimental characterization of the 48TL200 battery reported in [
17]. The aim is to estimate the parameters and the accuracy of a state-of-the-art battery model and to contribute to the finding of more accurate battery models. These models are needed to develop advanced state estimation algorithms and improve the Battery Management Systems (BMSs) for this technology.
The sodium–nickel chloride battery model investigated in this work and the characterization process are shown in the next section. The description of the experimental set-up and tests are reported in
Section 3, and the test results and the identification of the model parameters are discussed in
Section 4. Finally, the conclusions are summarized in the last section.
2. Sodium–Nickel Chloride Battery Models
The model of a sodium–nickel chloride battery is more complex than the models applied to other kinds of batteries because there are two chemical reactions, i.e., (
1) and (
2), that can occur simultaneously. The models usually presented in the literature can be divided into three different categories: electrochemical [
18,
19], mathematical [
20,
21], and electrical models [
22,
23,
24].
The electrochemical models describe the chemical reactions to model the battery cell electrical behavior. Therefore, they require high computational power, the complete knowledge of the production process of the cells, and their exact chemical composition [
18]. Electrochemical models are used in the development phase of a new technology and to model single cells for these reasons [
19]. They are not suitable to model a complete battery and to be used in the BMS development [
25]. On the contrary, mathematical models are not directly related to the physical composition of the cell. They consider the cell like a black-box and usually require a large quantity of data to identify the model parameters [
21]. As a consequence, the parameters of the model are not related to the internal structure of the cell and the inner processes, so they are not useful for extracting other features of the battery, like information about the state of health that an advanced BMS should provide.
The electrical models use a circuit consisting of combinations of voltage sources, resistors, and capacitors to represent the cell behavior at the terminals. They are thus very suitable to model an entire battery pack, as it is done in this work. Moreover, they are useful for the development of the BMS, because they are used in co-design and simulation of the battery system and even of the whole application [
25]. The most popular electrical models are based on a Thévenin circuit that consists of two parts: The first part models the battery capacity and accounts for the SOC of the battery. Instead, the second part represents the battery terminal voltage with the sum of a voltage source controlled by the SOC and the voltage drop on a series consisting of a resistor and a variable number of
RC groups. The groups are composed of a capacitor and a resistor in parallel [
26].
Musio et al. demonstrated in [
22] that the model described above is not sufficient to represent the sodium–nickel chloride battery behavior, because it does not take into account the effect of the two reactions typical of this technology. The model was modified in [
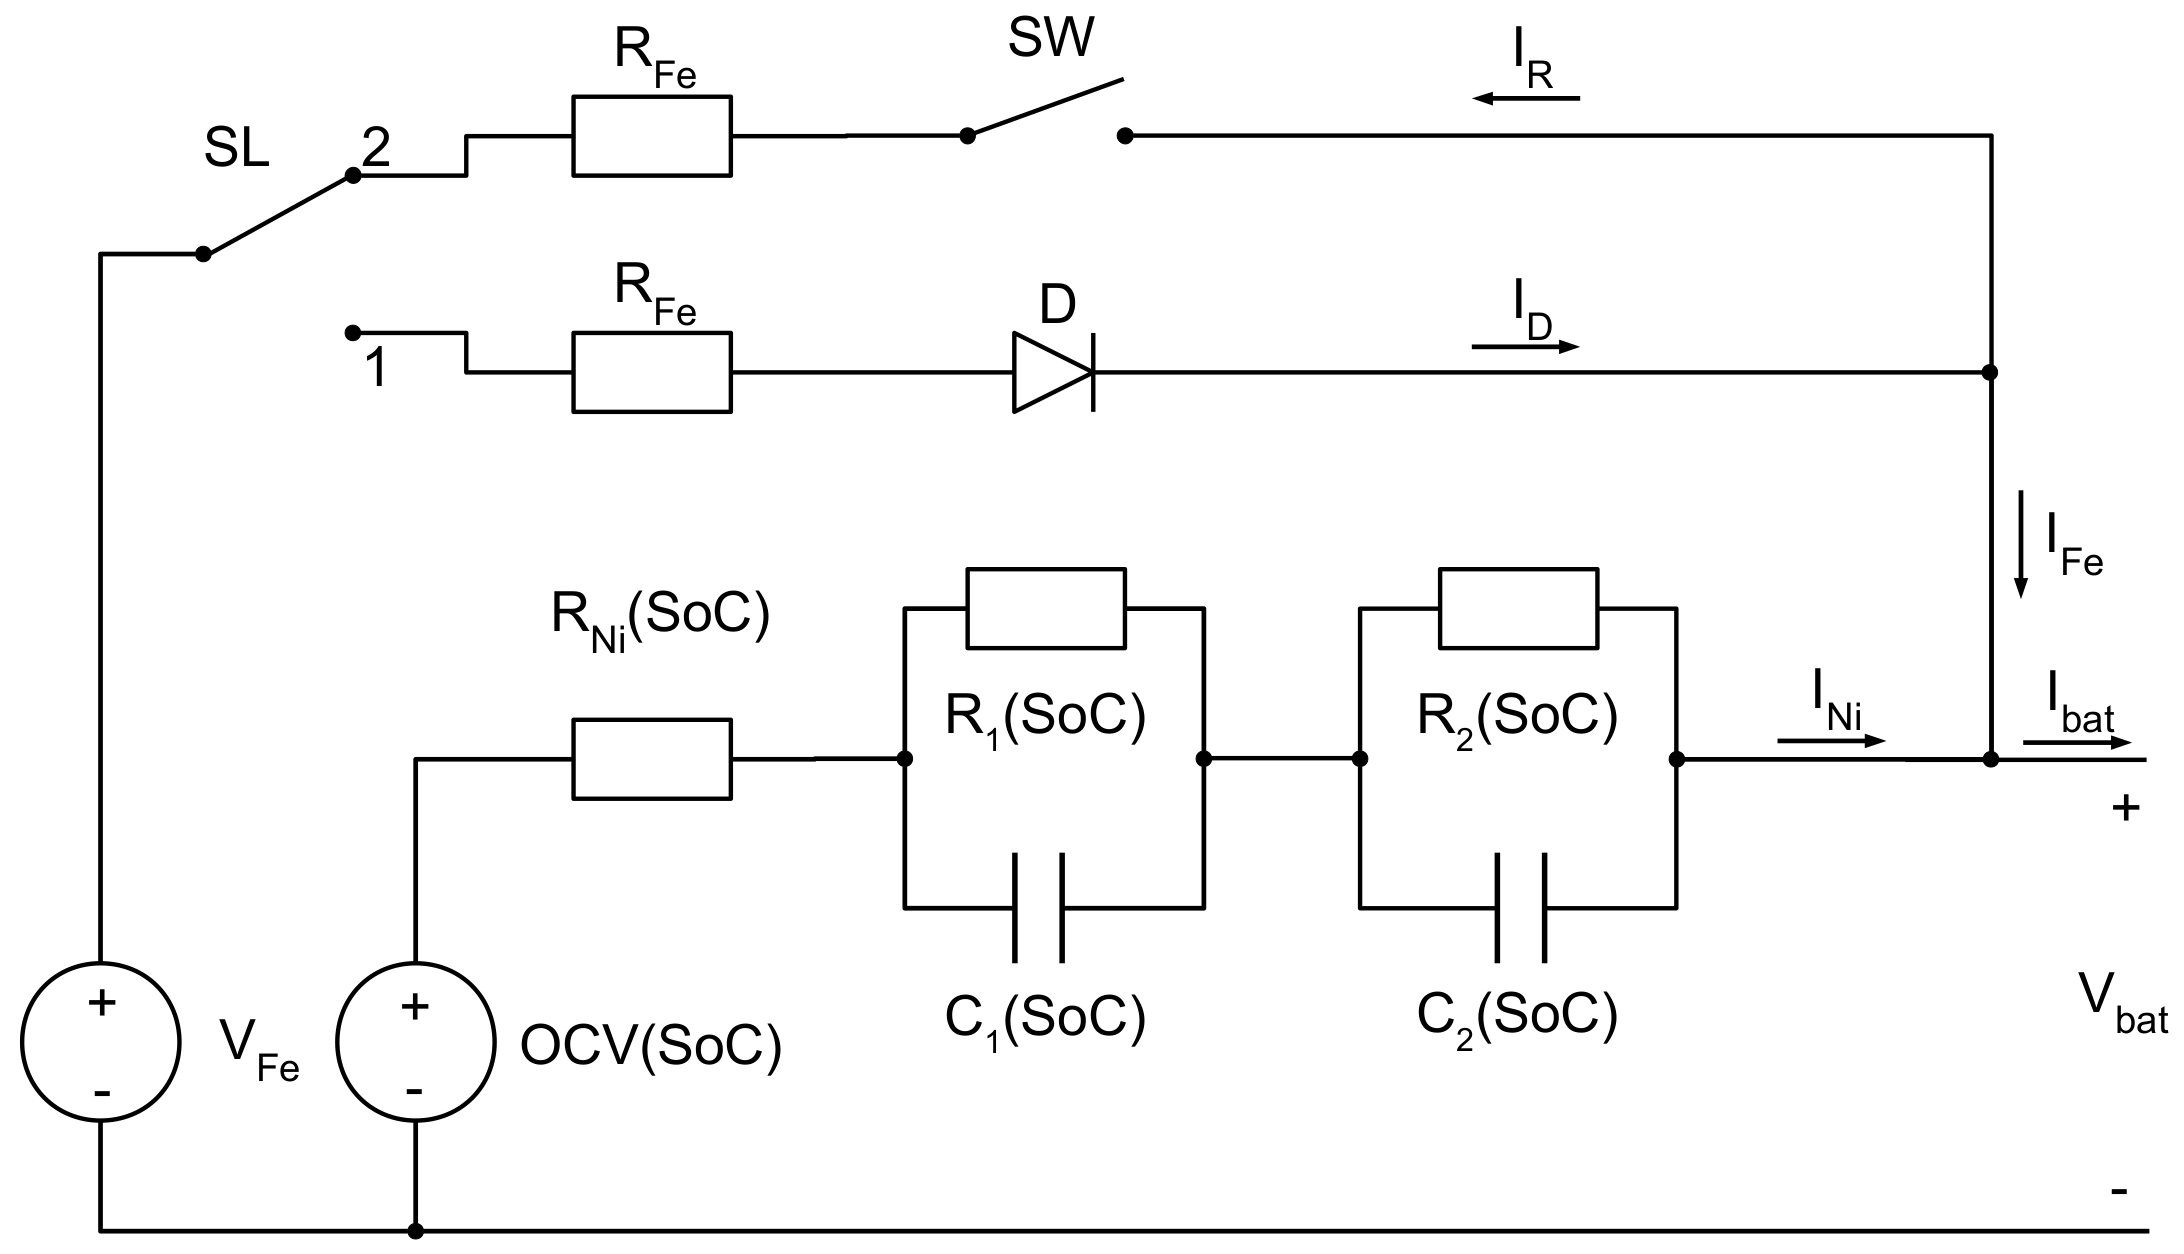
24], obtaining the solution shown in
Figure 1. In particular, a Thévenin-based model is adopted to account the effect of reaction (
1). An additional branch is added in parallel to the first one to model the effects of the reaction involving the iron material. This last branch is composed of a constant voltage source
of 2.35 V per each cell of the battery, which is series-connected to one of two possible other branches by the switch SL. When the battery voltage
is less than
, SL is in position 1 and the iron branch contributes to the discharge with the current
. The model of
Figure 1 is thus described by the following system of equations,
where
,
, and
are the voltages across the groups
−
and
−
, respectively, and the diode D is considered ideal.
SL goes in position 2 and the iron branch is charged by the current
if the switch SW is closed, when
. SW is only closed if the total charge transferred by
is larger than that transferred by
, i.e., some already transformed iron material that can be reverted back is available. This memory effect is taken into account by integrating in time the currents
and
, i.e., performing their coulomb counting, and comparing the results of the integration. The same system of equations described in Equation (
3) is also used to describe the model by posing
. We note that the iron contribution is activated when the battery voltage becomes lower than
. Therefore, the model coincides with the classical Thévenin circuit when the battery SOC is high and the load current is low,
, and the model is only described by Equation (
4).
The battery model shown in
Figure 1 contains parameters the values of which need to be identified experimentally. The most popular experiment carried out to identify the model parameters is the Pulsed Current Test (PCT) [
27]. It consists of a series of constant current pulses separated by rest times. The pulses are used to change the battery SOC and to stimulate the battery, whereas the rest times are useful to estimate the model parameters during battery relaxation. The PCT procedure can be applied in charge and discharge, because the model parameters could be different in the two conditions. The procedure used to identify the model parameters is explained in detail in the following section, in which the characterization tests are presented.
3. Experimental Set-Up and Characterization Tests
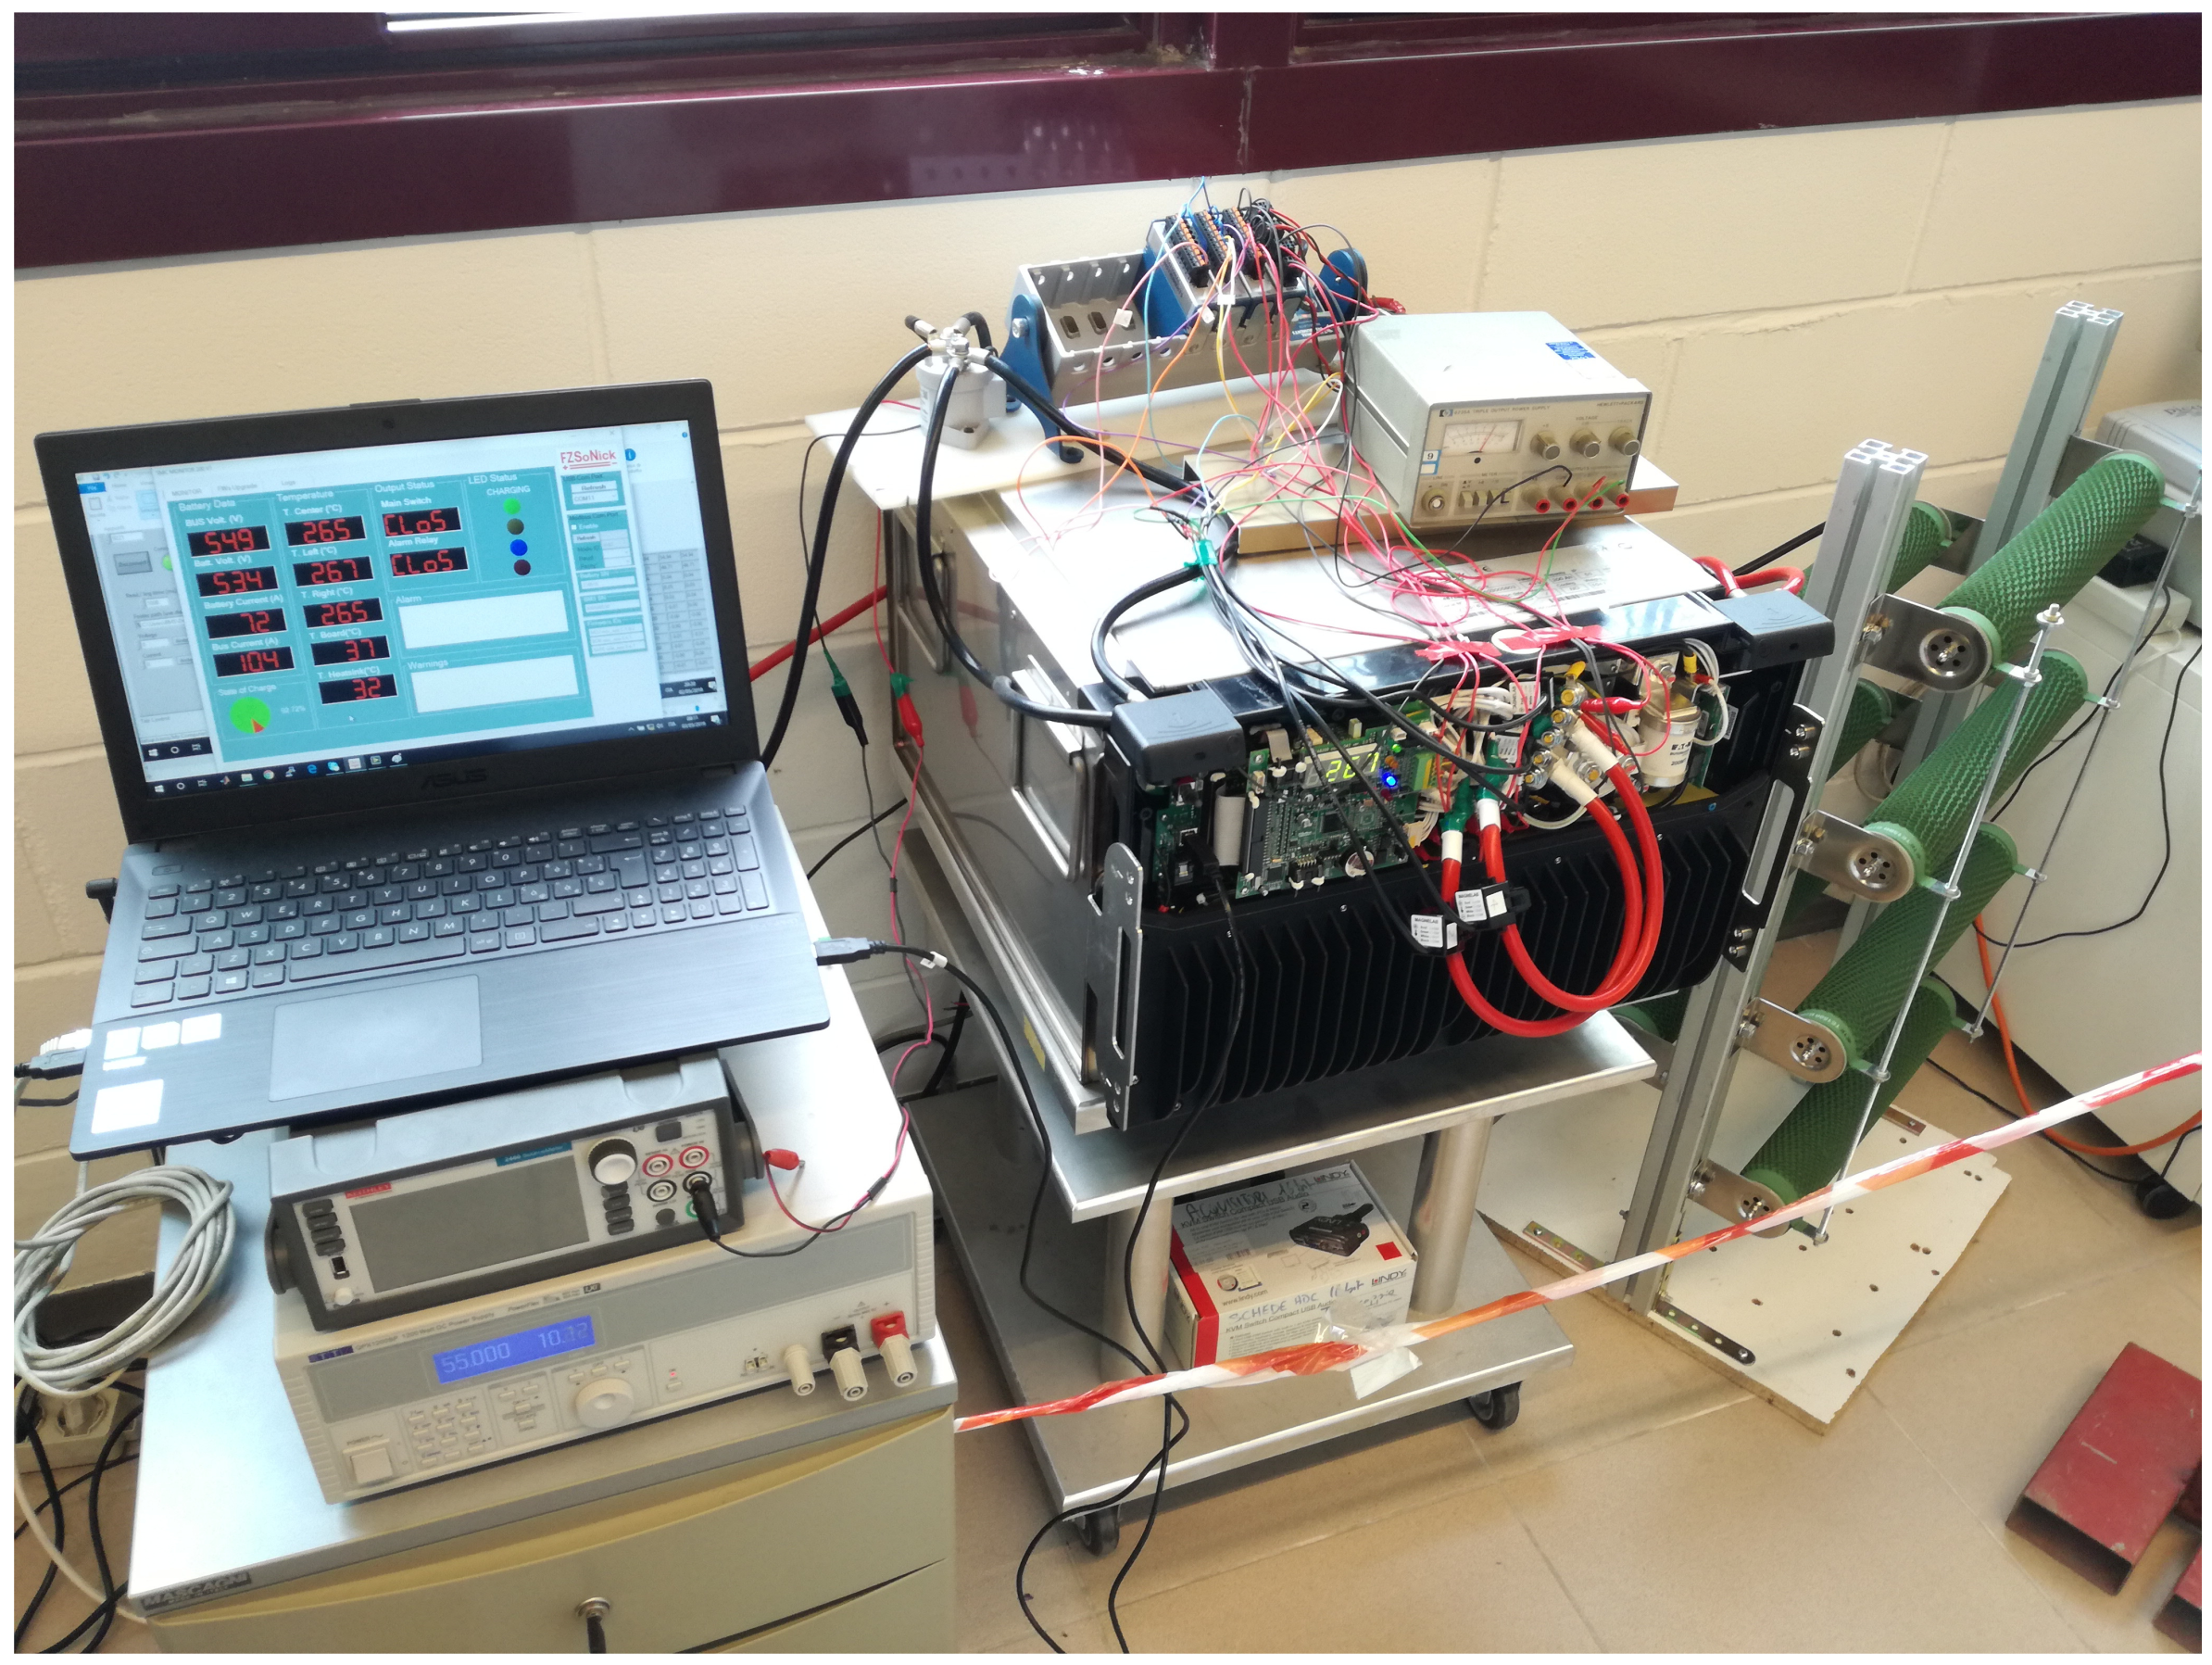
The authors of [
17] describes the details of the experimental setup used to characterize the commercial sodium–nickel chloride battery for telecommunication applications FZSonick
® 48TL200 shown in
Figure 2.
The battery nominal voltage is 48 V, the capacity is 200 Ah, and the maximum continuous discharge current is 150 A, with 200 A peak value. The battery consists of five strings of 20 series-connected cells. The strings are connected in parallel by the BMS, which is responsible for battery monitoring and for avoiding unsafe situations. In fact, it is able to manage the charge and discharge phases, to control the battery power switch, and to maintain the battery temperature inside the safe range. The battery temperature is set and controlled by the BMS. It turns on and off three heaters by means of a PWM signal with controlled duty cycle. The battery inner case is thermally insulated to reduce the energy lost to keep the minimum internal temperature required (at least 250 °C) for proper operations. The battery outer case was opened in our lab and additional sensors were introduced to acquire the individual voltage and current of each string. The internal temperature of the battery is acquired by the built-in sensors. The availability of the internal data of every string allows a deeper view of the battery and highlights the differences in the behavior of the strings when they are parallel-connected.
The characterization experiments were carried out by discharging the battery on a variable resistive load, ranging from 314 to 2200 mΩ, that is connected to the battery by means of a controlled power switch. The load consists of seven 2.2 Ω power resistors that power bars connect in any parallel combination from one to seven. Instead, the BMS internally manages the charging process of the battery by applying a classical constant-current/constant-voltage (CC-CV) charging profile on each particular string. The charging process starts when the external battery power terminals are connected to a power supply with a voltage higher than 54 V. The current value of the CC phase can be set by the user on the battery user interface.
3.1. Model Parameter Identification Procedure
PCTs were used to characterize the battery in several operating conditions and to investigate the accuracy of the state-of-the-art model described in
Section 2. First of all, the battery was fully discharged with a PCT profile consisting of 19 test points that spans the battery SOC with steps of
, starting from the fully charged condition. Three different current values were used to test the battery: 23 A, 43 A, and 80 A. These current values are obtained using 1, 2, and 4 parallel-connected load resistors, respectively.
As mentioned before, the battery is composed of five parallel-connected strings that share the same voltage but have different currents. The experiments show that the strings are similar to one another and the difference between the string currents was measured to be always below 15% of the mean value. The data of string #1 in the 43 A PCT test are used to explain the identification process of the model parameters of
Figure 1. The identified parameters of the other strings and in the other tests are shown in the next section, in which they will be discussed.
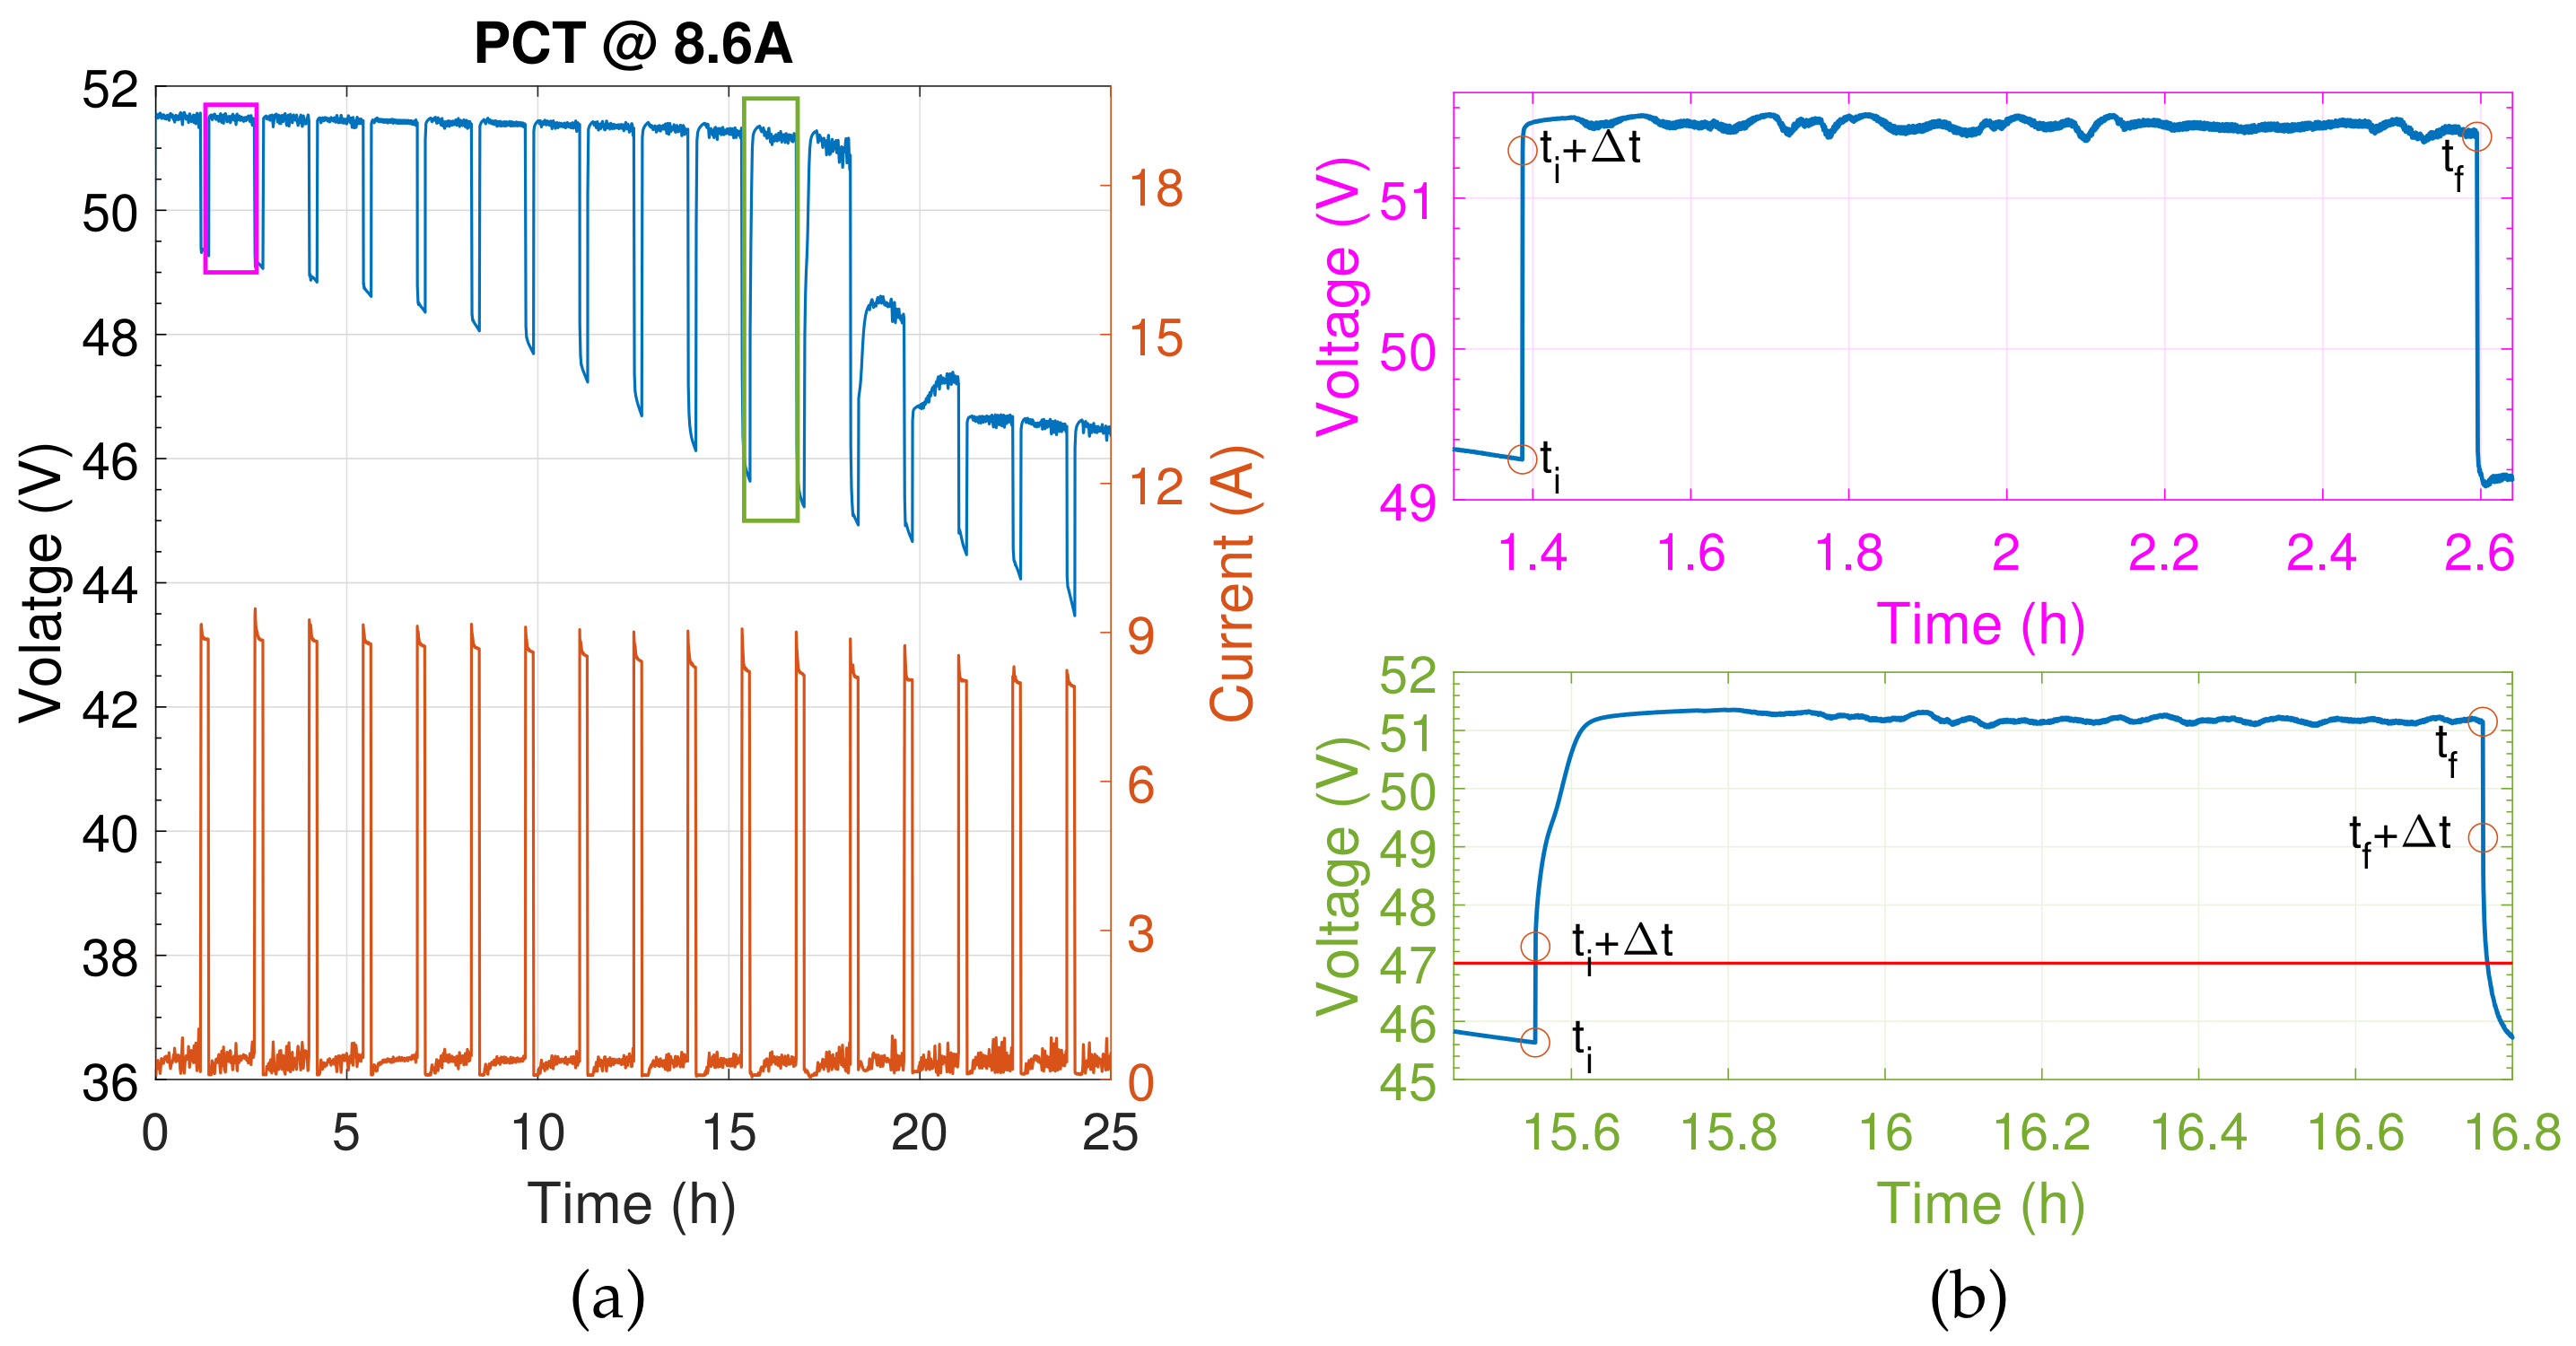
Figure 3 shows the voltage and the current of string #1 in the 43 A PCT test. The string current is one-fifth of 43 A, i.e., 8.6 A, and each pulse counts ~5% SOC. The battery behavior down to a SOC around 30% shows almost constant OCV and internal resistance gradually increasing, i.e., larger voltage drops for the same current pulse. The behavior significantly changes at low SOC. This indicates that the chemical reaction involving the iron component of the cell is taking place [
1]. The figure also shows the enlarged view of two pulses, one for each particular operating zone of the battery, which are useful to estimate the parameters of the two branches of the model pertaining to each chemical reaction. The test can be divided in two parts: the first consists of the pulses in which the battery voltage remains above
, meaning that only the nickel reaction is involved. The second part instead regards the zone in which the iron contribution becomes to show up.
Let us analyze the experiment results to extract the model parameters. The analysis of the first group of pulses involving just the nickel reaction is easier than the second one, because the iron branch of the model can be ignored. The string voltage can be obtained with reference to
Figure 1 and the top diagram of
Figure 3b using Equation (
4). The value of
is estimated using the voltage drop measured between
and
. It is reasonable to neglect the variation of OCV,
, and
in
, which is equal to 1 s. The remaining parameters are estimated from the string voltage acquired in the relaxation time from
to
, to which the
contribute is subtracted. The fitting is carried out using the fit function of Matlab and considering the time constants of the
groups lower than the observation time, i.e., the battery is fully relaxed at the end of the rest time.
The pulse shown in the bottom diagram of
Figure 3b, in which the string voltage becomes lower than
, is instead used to calculate
.
is considered constant for any operating condition of the battery as expressed in [
24] and is calculated according to the following procedure. First of all, the value of
is estimated in this pulse using the measured voltage drop from
to (
) and Equation (
4). The battery voltage is higher than
in this condition, and the selector SL is in position 2. Moreover, the string can be considered fully relaxed in
and the switch SW is open.
The voltage and current drops form
to (
) are used to estimate
. SL is now in position 1, because
, and
derives from the solution of the system of equations reported in Equation (
5) obtained from Equation (
3). Here, we consider
. We also define
and
the variations of the two components of the battery current in the time interval
.
Finally, the other model parameters are obtained after the calculation of that is considered a global constant. The same approach described above is applied to every pulse. Each pulse corresponds to a well-defined SOC value.
The optimization tool of Matlab is applied to the string current and voltage data of each pulse. The tool uses a nonlinear data fitting function that improves the identification of
,
,
, and
.
Table 1 reports the model parameters calculated for each SOC value using the data of string #1 in the 43 A PCT test, where
and
, respectively.
4. Model Validation and Discussion
The model proposed in [
24] and recalled in
Section 2 is now applied to the data of each string for all the tests carried out on the investigated battery. The model parameters are identified as described in
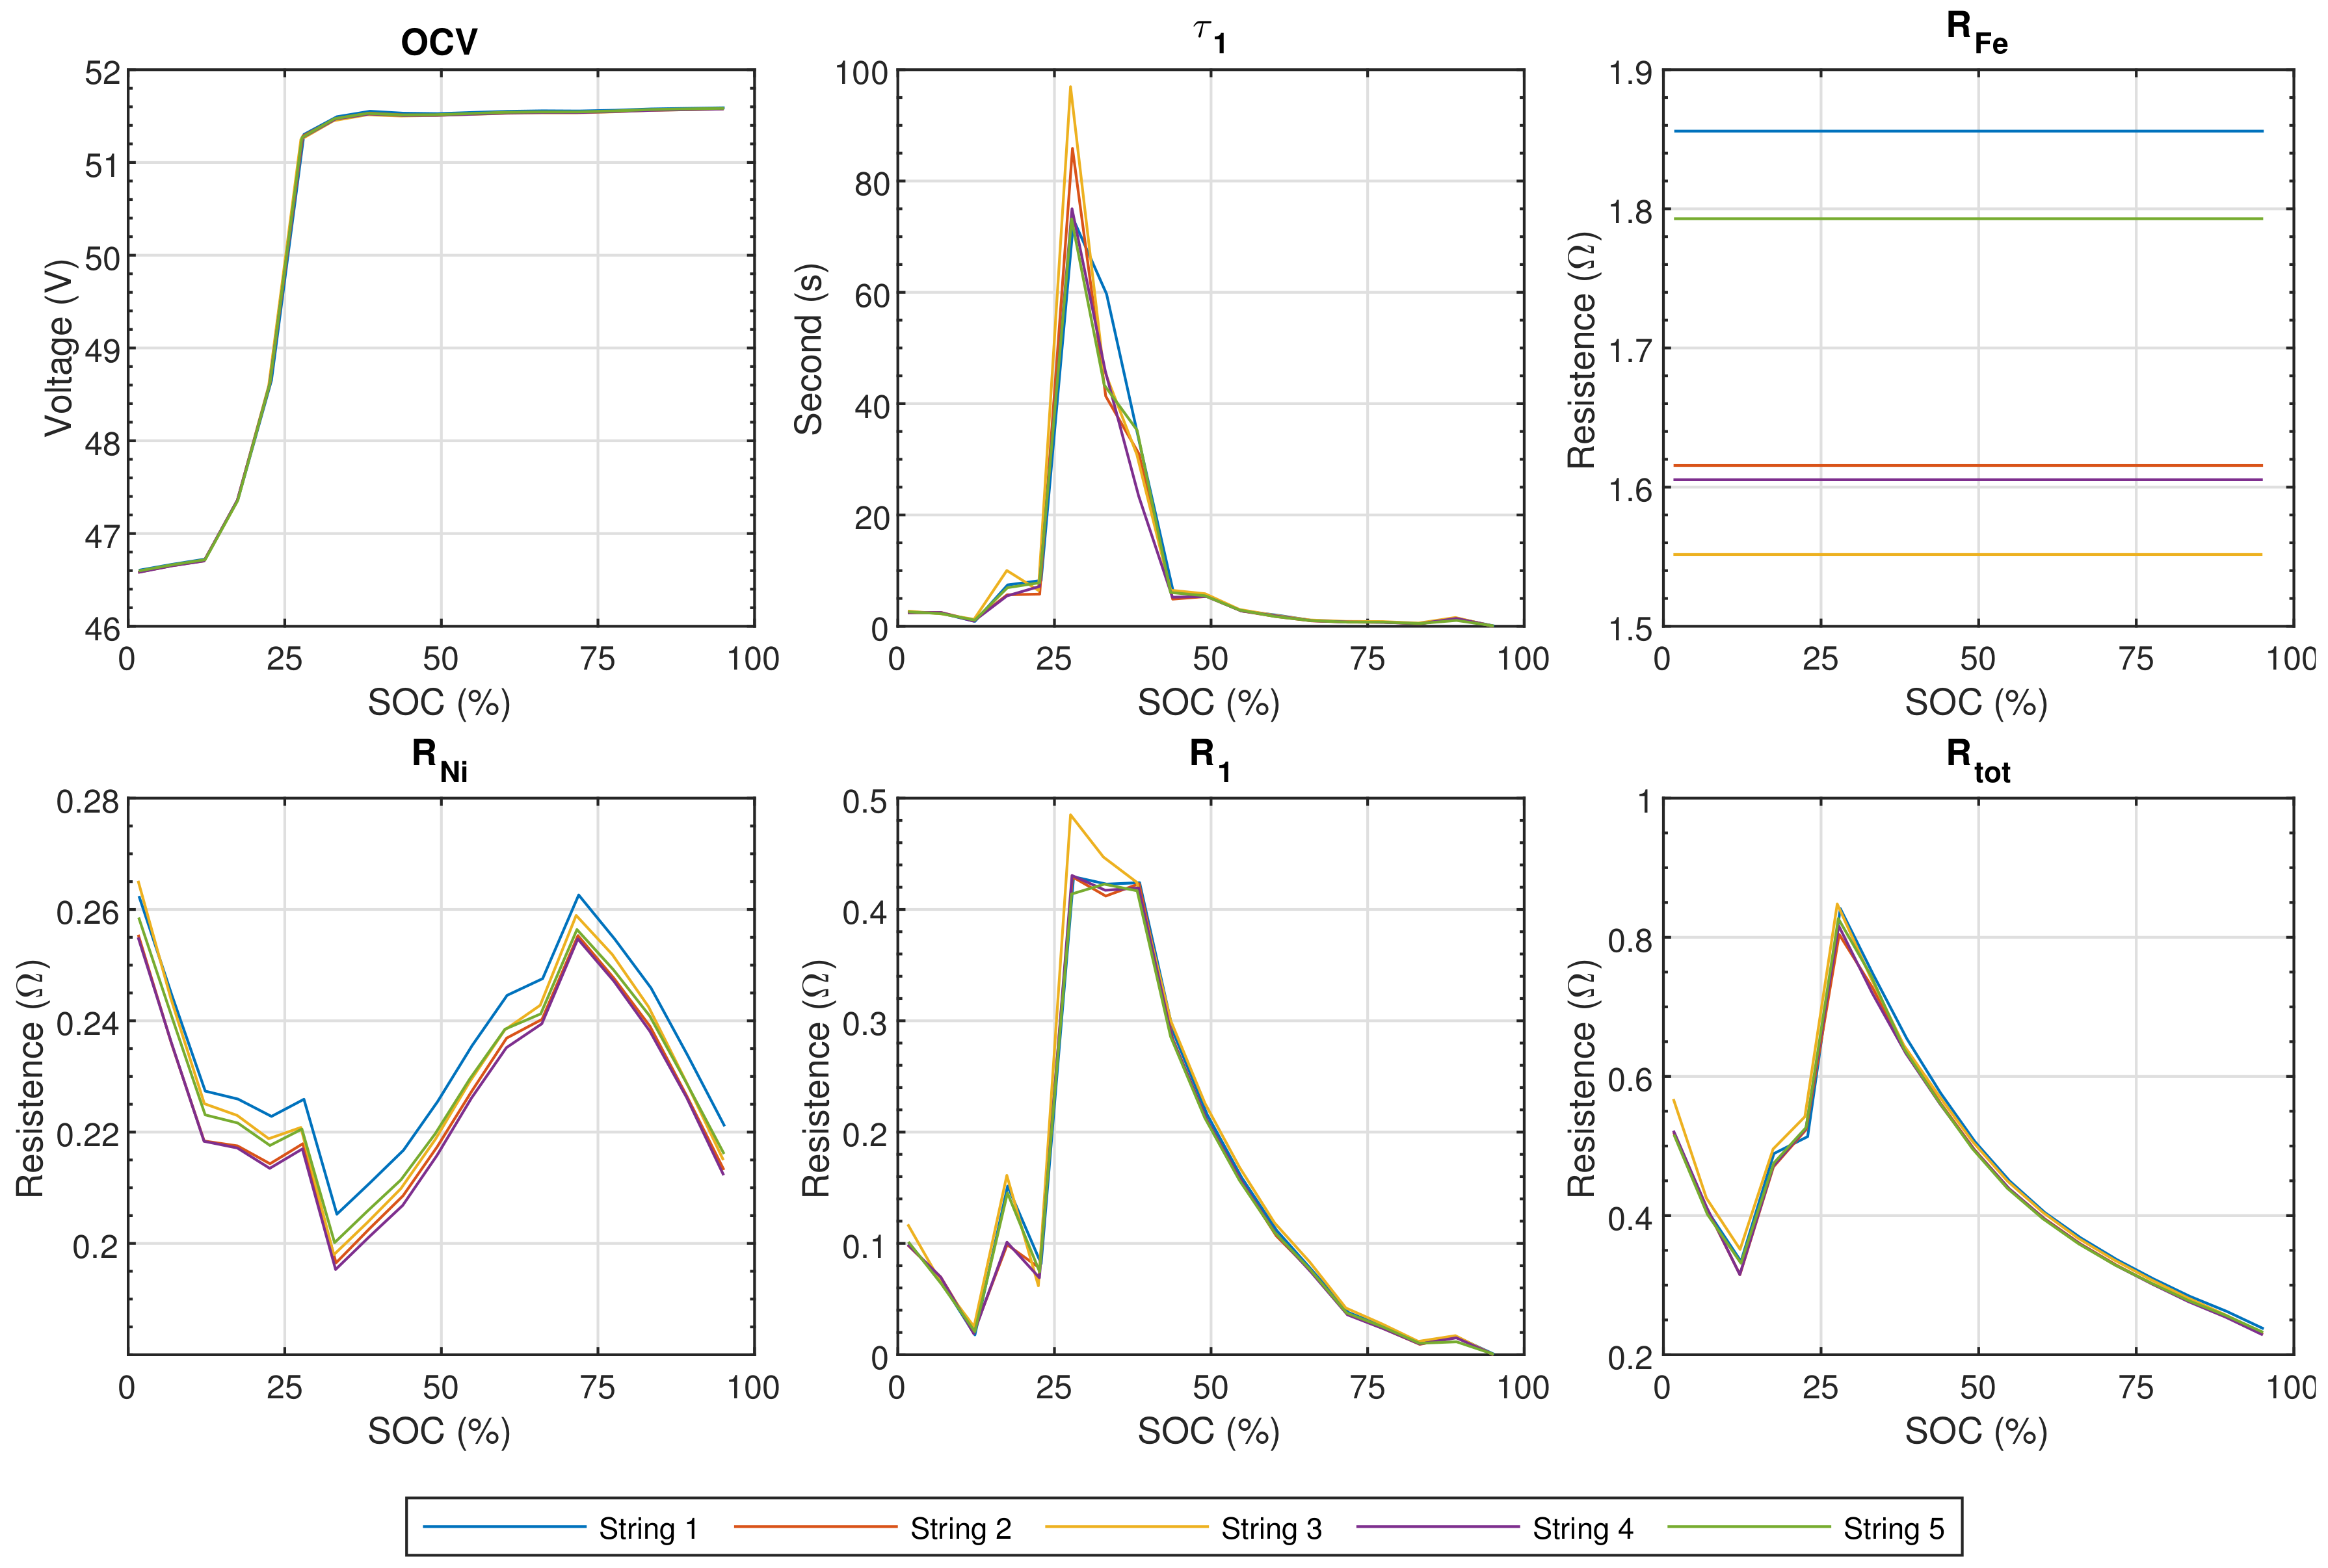
Section 3.1. The identification process is applied to the data of the five strings acquired in the 43 A PCT test. The values of OCV,
,
,
,
, and
are shown in
Figure 4. The parameters of each string are very similar to each other as expected. The strings are fairly good matched and present a maximum difference among their current values lower than 15% of the mean value when put in parallel. The same set of parameters can thus be used to model each string neglecting their small differences. The parameter set is obtained using the median value of the parameters of the five strings.
The analysis of the parameter trends shows behaviors not fully expected. For example,
should increase when the SOC decreases because it only depends on the nickel reaction. In fact, the reaction front of (
1) moves away from the beta-alumina layer. The distance traveled by the sodium ions before the reaction occurs increases and the voltage drop for the same charge flow increases as well [
5]. Surely,
increases when SOC goes from 100% to ~30% when the iron reaction is not activated yet. It instead decreases when SOC is below 30%. This phenomenon suggests a complex interaction between the nickel and iron reactions [
28]. Indeed, the interaction cannot fully be described by the two separated branches of the model.
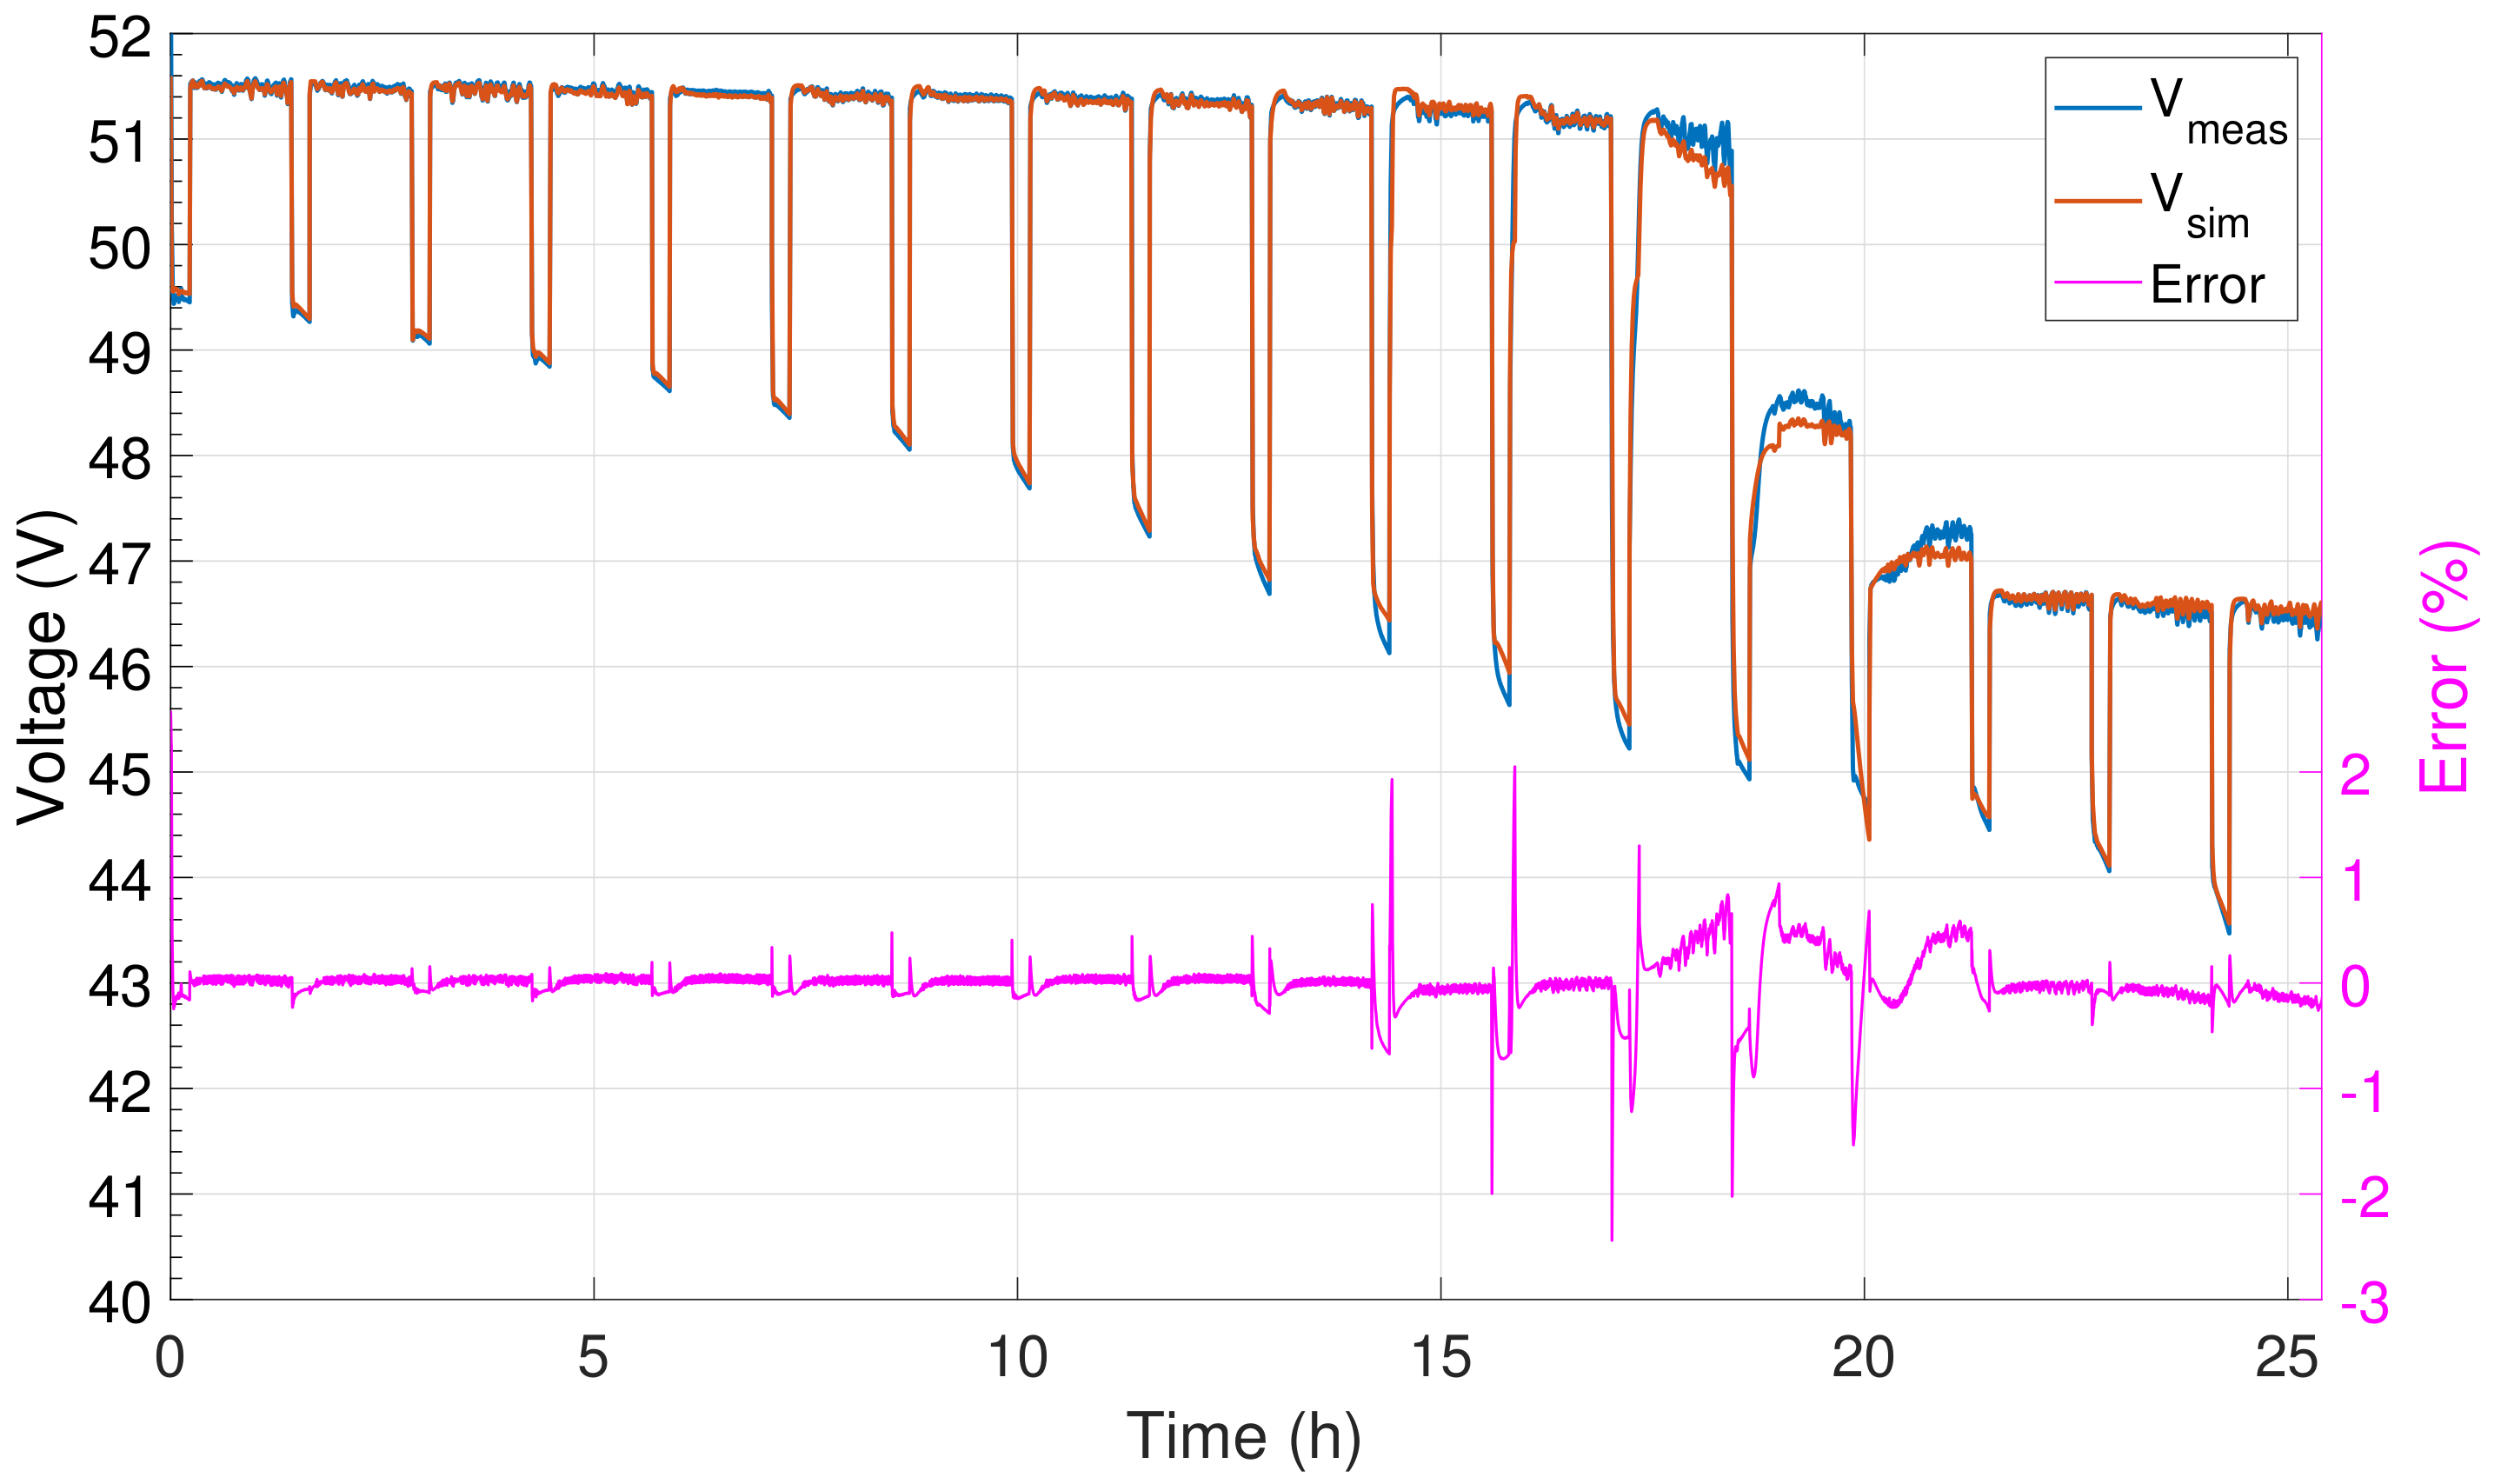
Let us now verify how much the model response fits to the measured voltage of string #1 in the PCT with a pulse current value of 43 A. The model is stimulated with the current acquired from string #1 in the same test.
The comparison between the measured and simulated string voltages is reported in
Figure 5, together with their difference that represents the error in the reconstruction of the battery behavior. The model response is rather accurate in this test, as the absolute value of the relative error remains lower than 1% for almost all the test. This error is consistent with the one obtained in [
24], where the same model is used on a high-voltage series-connected battery. Instead, it is lower than the finding of [
20], where a mathematical model is used. Moreover, it is comparable with the 4% error found with the electrochemical model presented in [
18]. However, we note that the error is rather low until the occurrence of the iron reaction, i.e., when the battery voltage is above
. This fact suggests that the model accounts very well for the nickel reaction and is less accurate when both reactions occur.
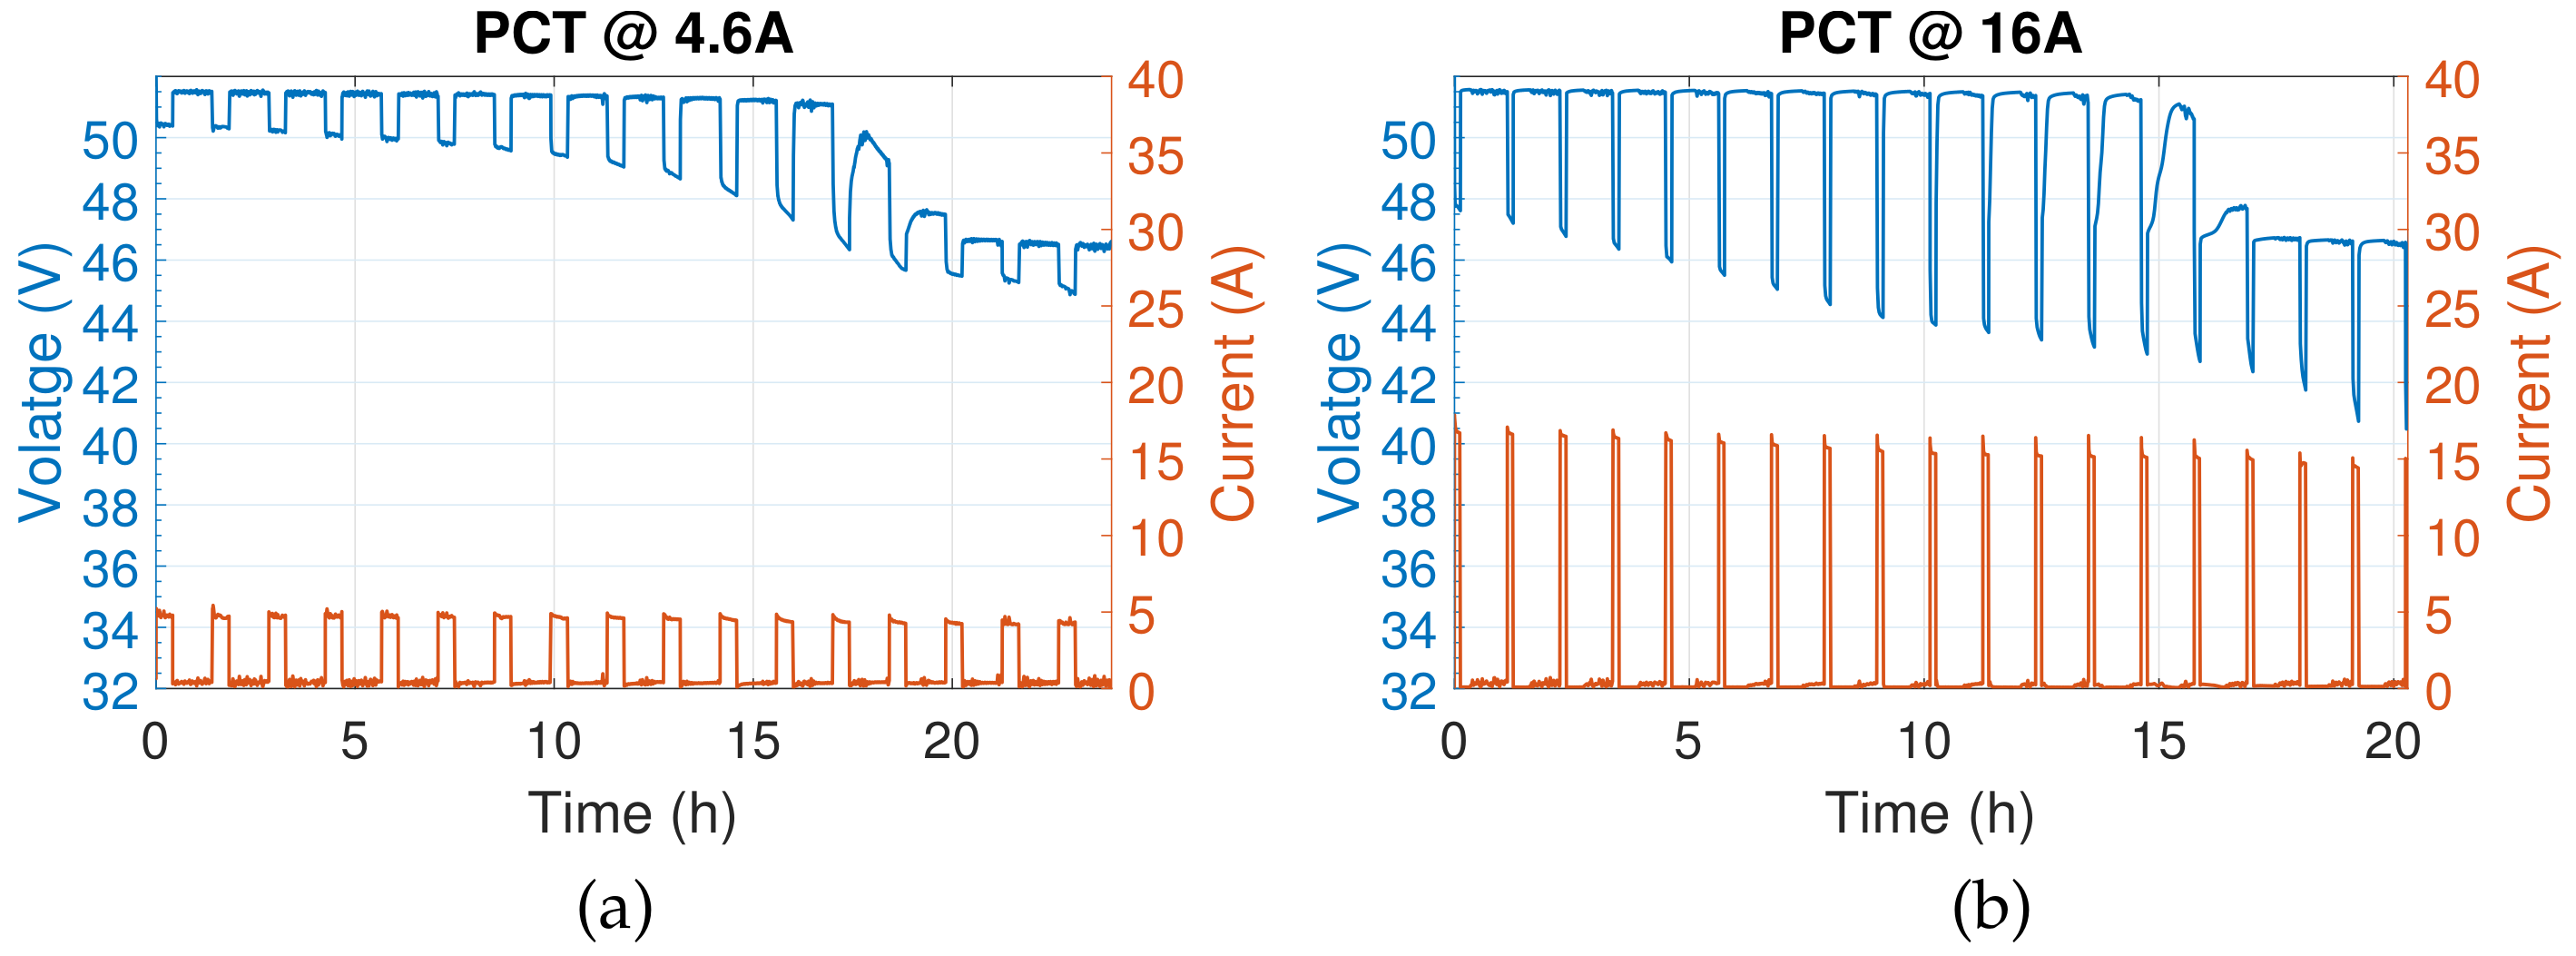
It was mentioned before that other PCTs were carried out to investigate the model response in different conditions. PCTs were performed with 23 A and 80 A as battery pulse current values, i.e., 4.6 A and 16 A as string pulse current value. The details of the experiments carried out on the battery are reported in
Table 2. The SOC steps are chosen to be ~5% in any case.
Figure 6 reports the measured current and voltage of string #1 in the PCTs with 23 A and 80 A as battery pulse current values. We note that the string voltage at the end of the rest time remains almost constant at 51.6 V and tends to remain close to
for higher SOC when the string is discharged with higher current. At the same time, the battery relaxation seems distorted by the iron reaction at earlier SOC values. The experiments thus show that the relative interaction between the two reactions depends on both the current and the SOC values. In addition, it is also important to note that the battery is always slowly discharged by the heaters that keep the temperature of the battery above 265 °C, which is controlled by the electronic system attached to the battery. The charge utilized by the heaters depends on the battery temperature at the end of each PCT pulse. The higher the pulse current value, the higher the end pulse temperature and thus the lower the charge utilized in the rest times.
The parameter identification process described in
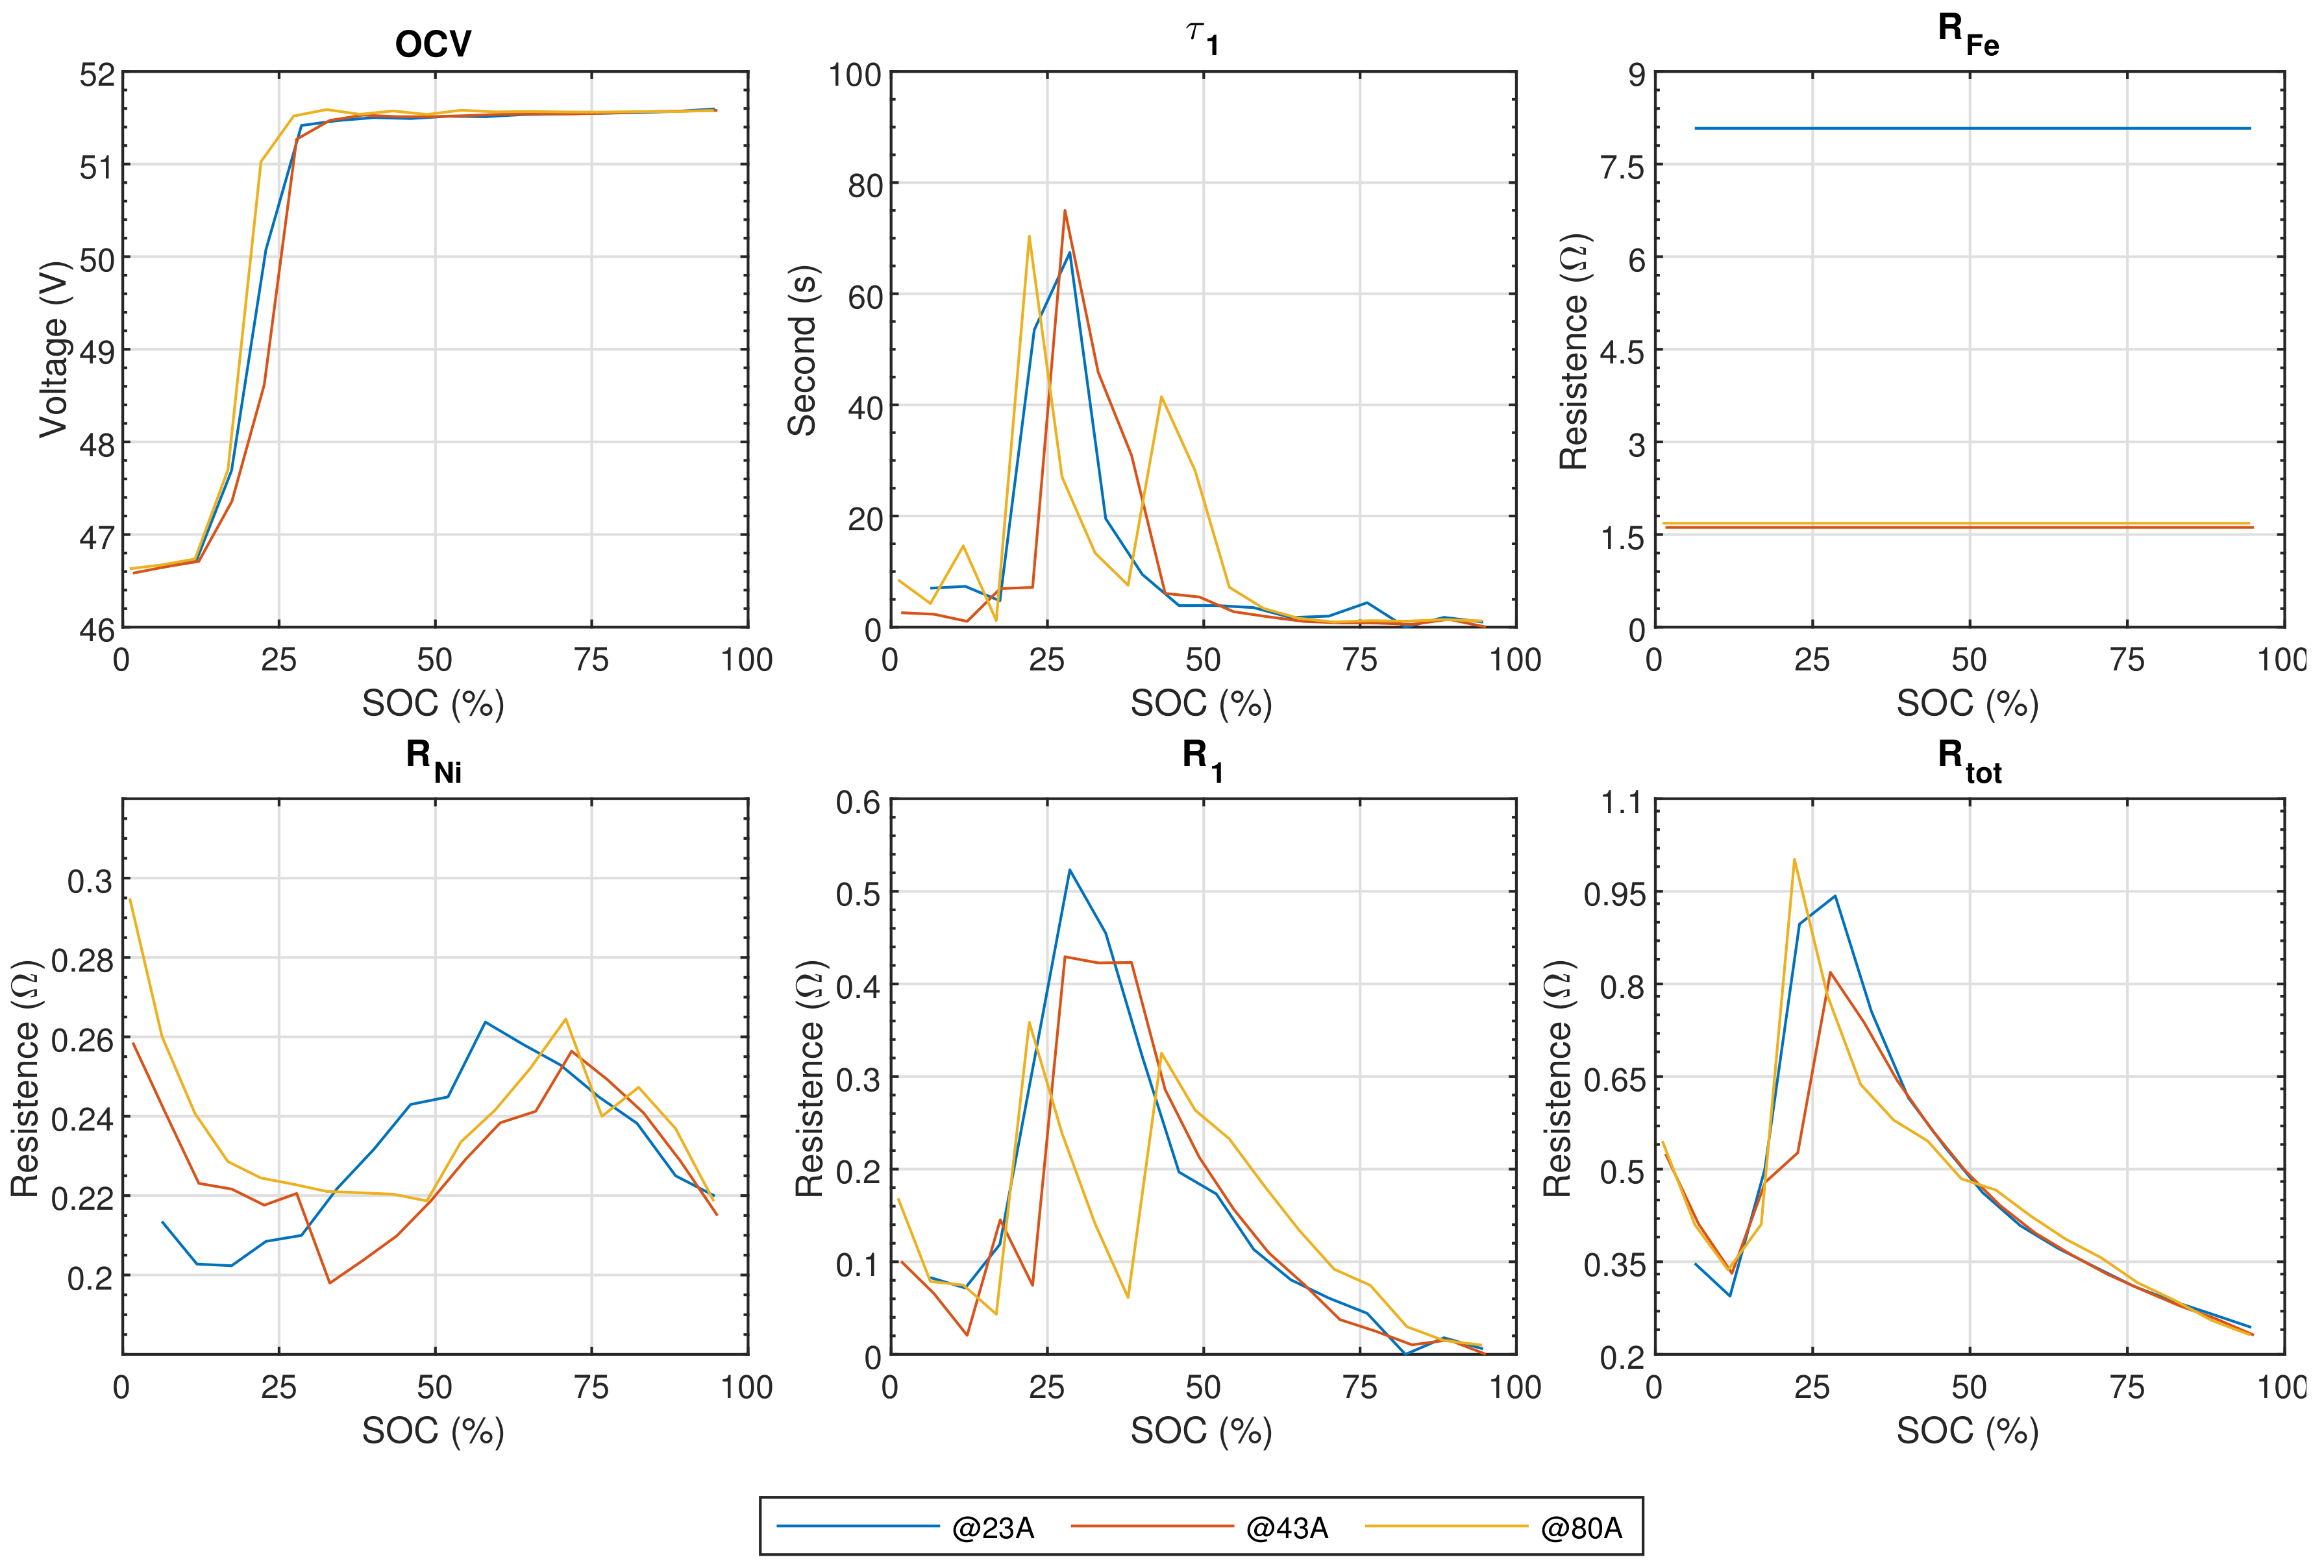
Section 3.1 was applied to the other tests to investigate the parameter robustness to the load current. The five strings do not significantly differ to one another, so the parameters are calculated using the median value of the five strings.
Figure 7 shows the values of OCV,
,
,
,
, and
identified in the three PCTs carried out at different current levels. The OCV is very similar in the three PCTs as expected, because it is independent from the discharge current value [
20]. We can note that the parameter values depend on the pulse current value, although the shapes of the curves are similar. The current value changes the way in which the iron reaction intervenes. For example,
identified with the 23 A PCT is about 4 times the value obtained with the other PCTs.
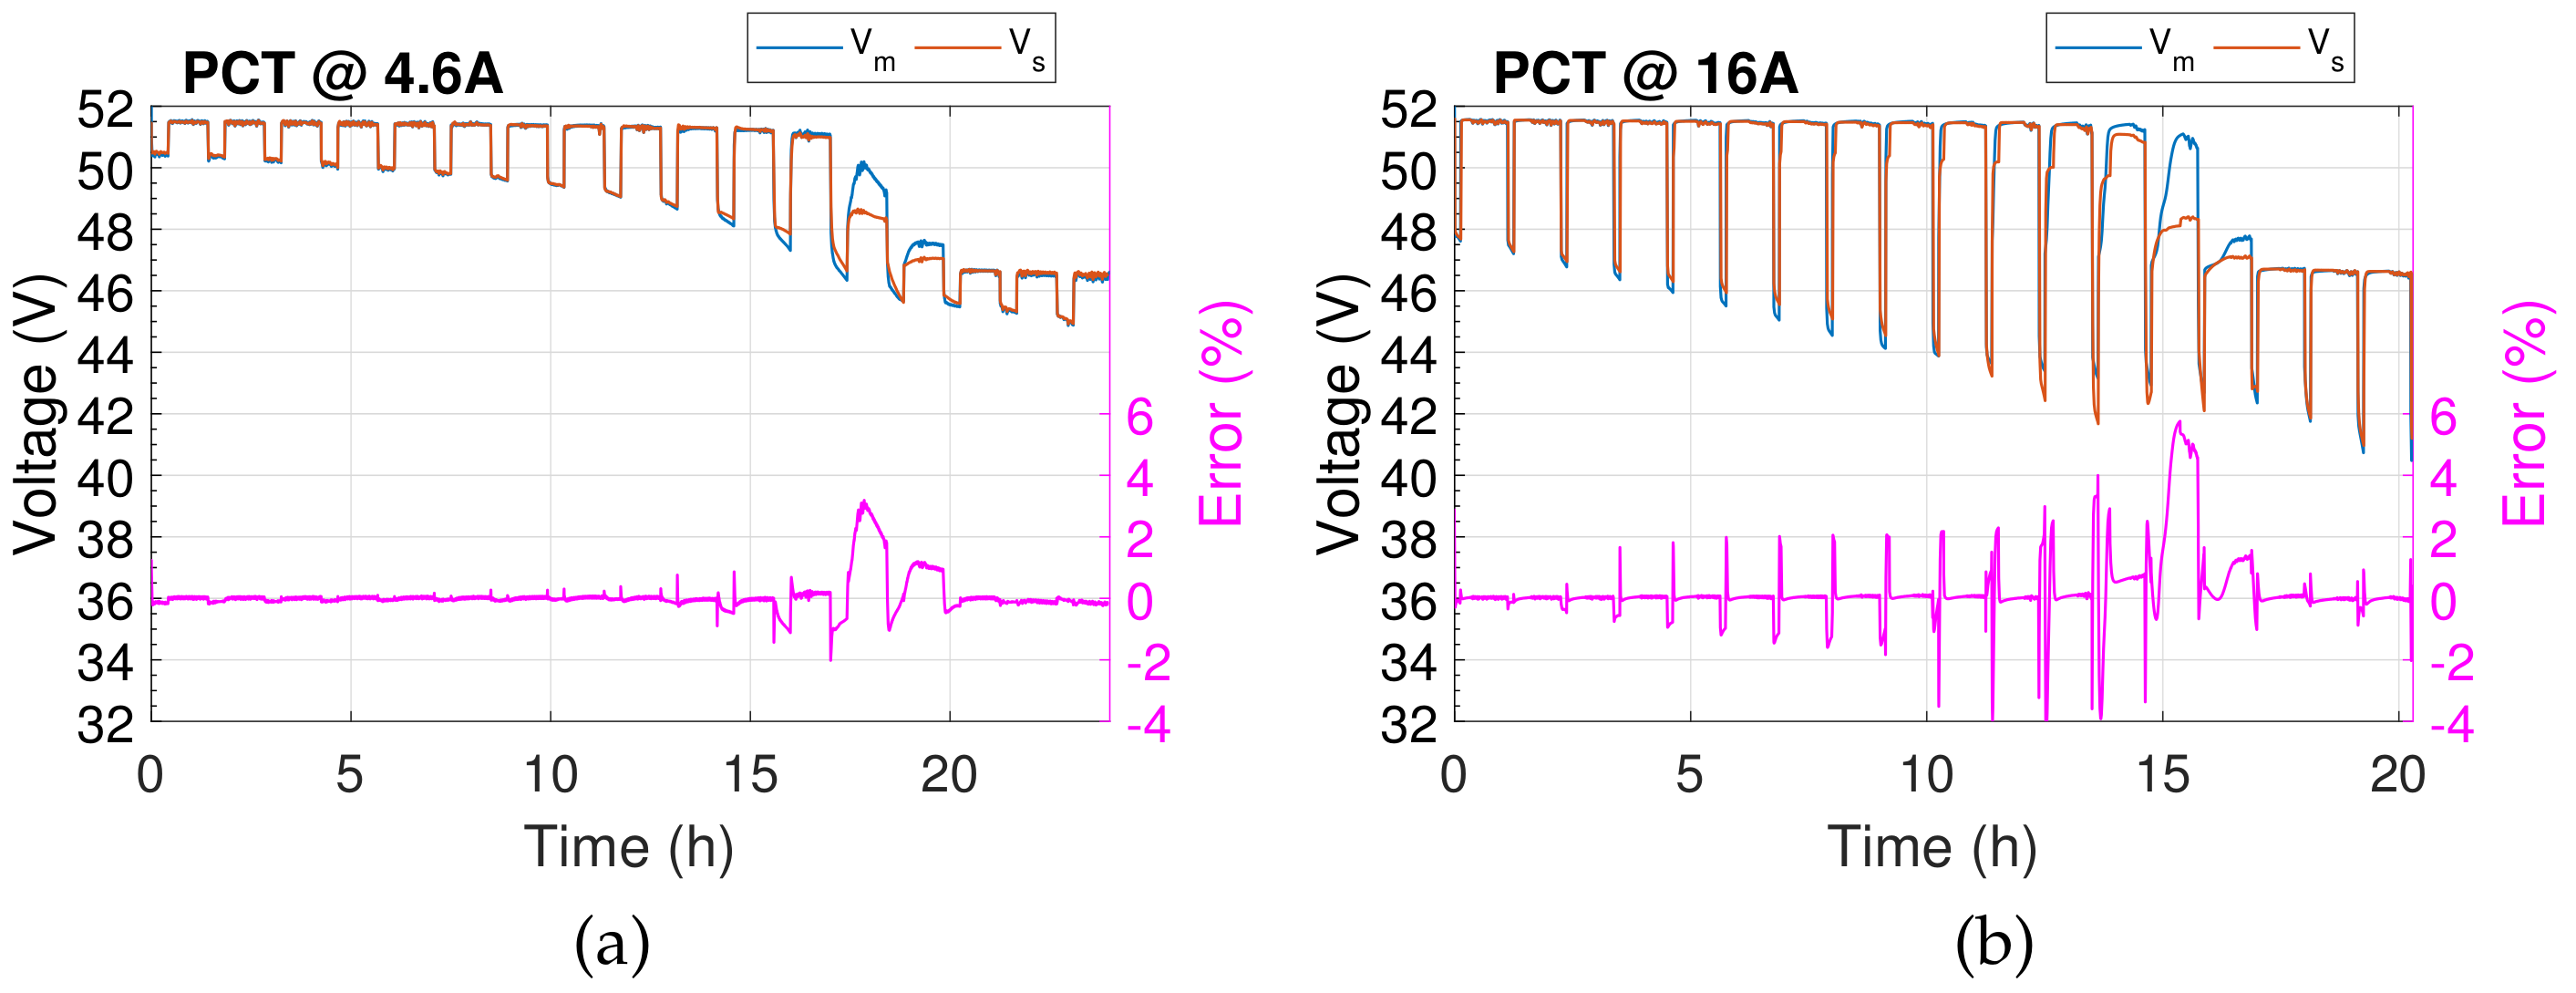
The model was applied to the data collected in the experiments with current values of 23 A and 80 A, i.e., string currents of 4.6 A and 16 A, respectively. The used set of model parameters are those identified with 43 A current that represents the “average load” condition. The comparison between the simulated and measured voltage is reported in
Figure 8. It undoubtedly shows that the model accuracy becomes worse when the discharge current values increase. Once again, it is shown that the model response to the iron component of the chemical reactions is lacking accuracy.
The model output was also compared to the measurements performed on the other strings of the battery that our experimental set-up allows us to investigate.
Table 3 reports the Root Mean Square Error (RMSE) between the measured and simulated string voltages for the five strings and the three PCT experiments. As anticipated before, the behaviors of the five strings constituting the battery are very similar to each other, and thus the difference in the RMSE values is very limited even if the same set of parameters is used for all the strings.
It can again be noted that the RMSE significantly increases for the PCTs carried out at both 23 A and 80 A current values. This fact is due to the dependence of the parameters on the current shown in
Figure 7. The parameters identified in the 43 A test lead to a loss of accuracy when the battery operates with different discharge rates.
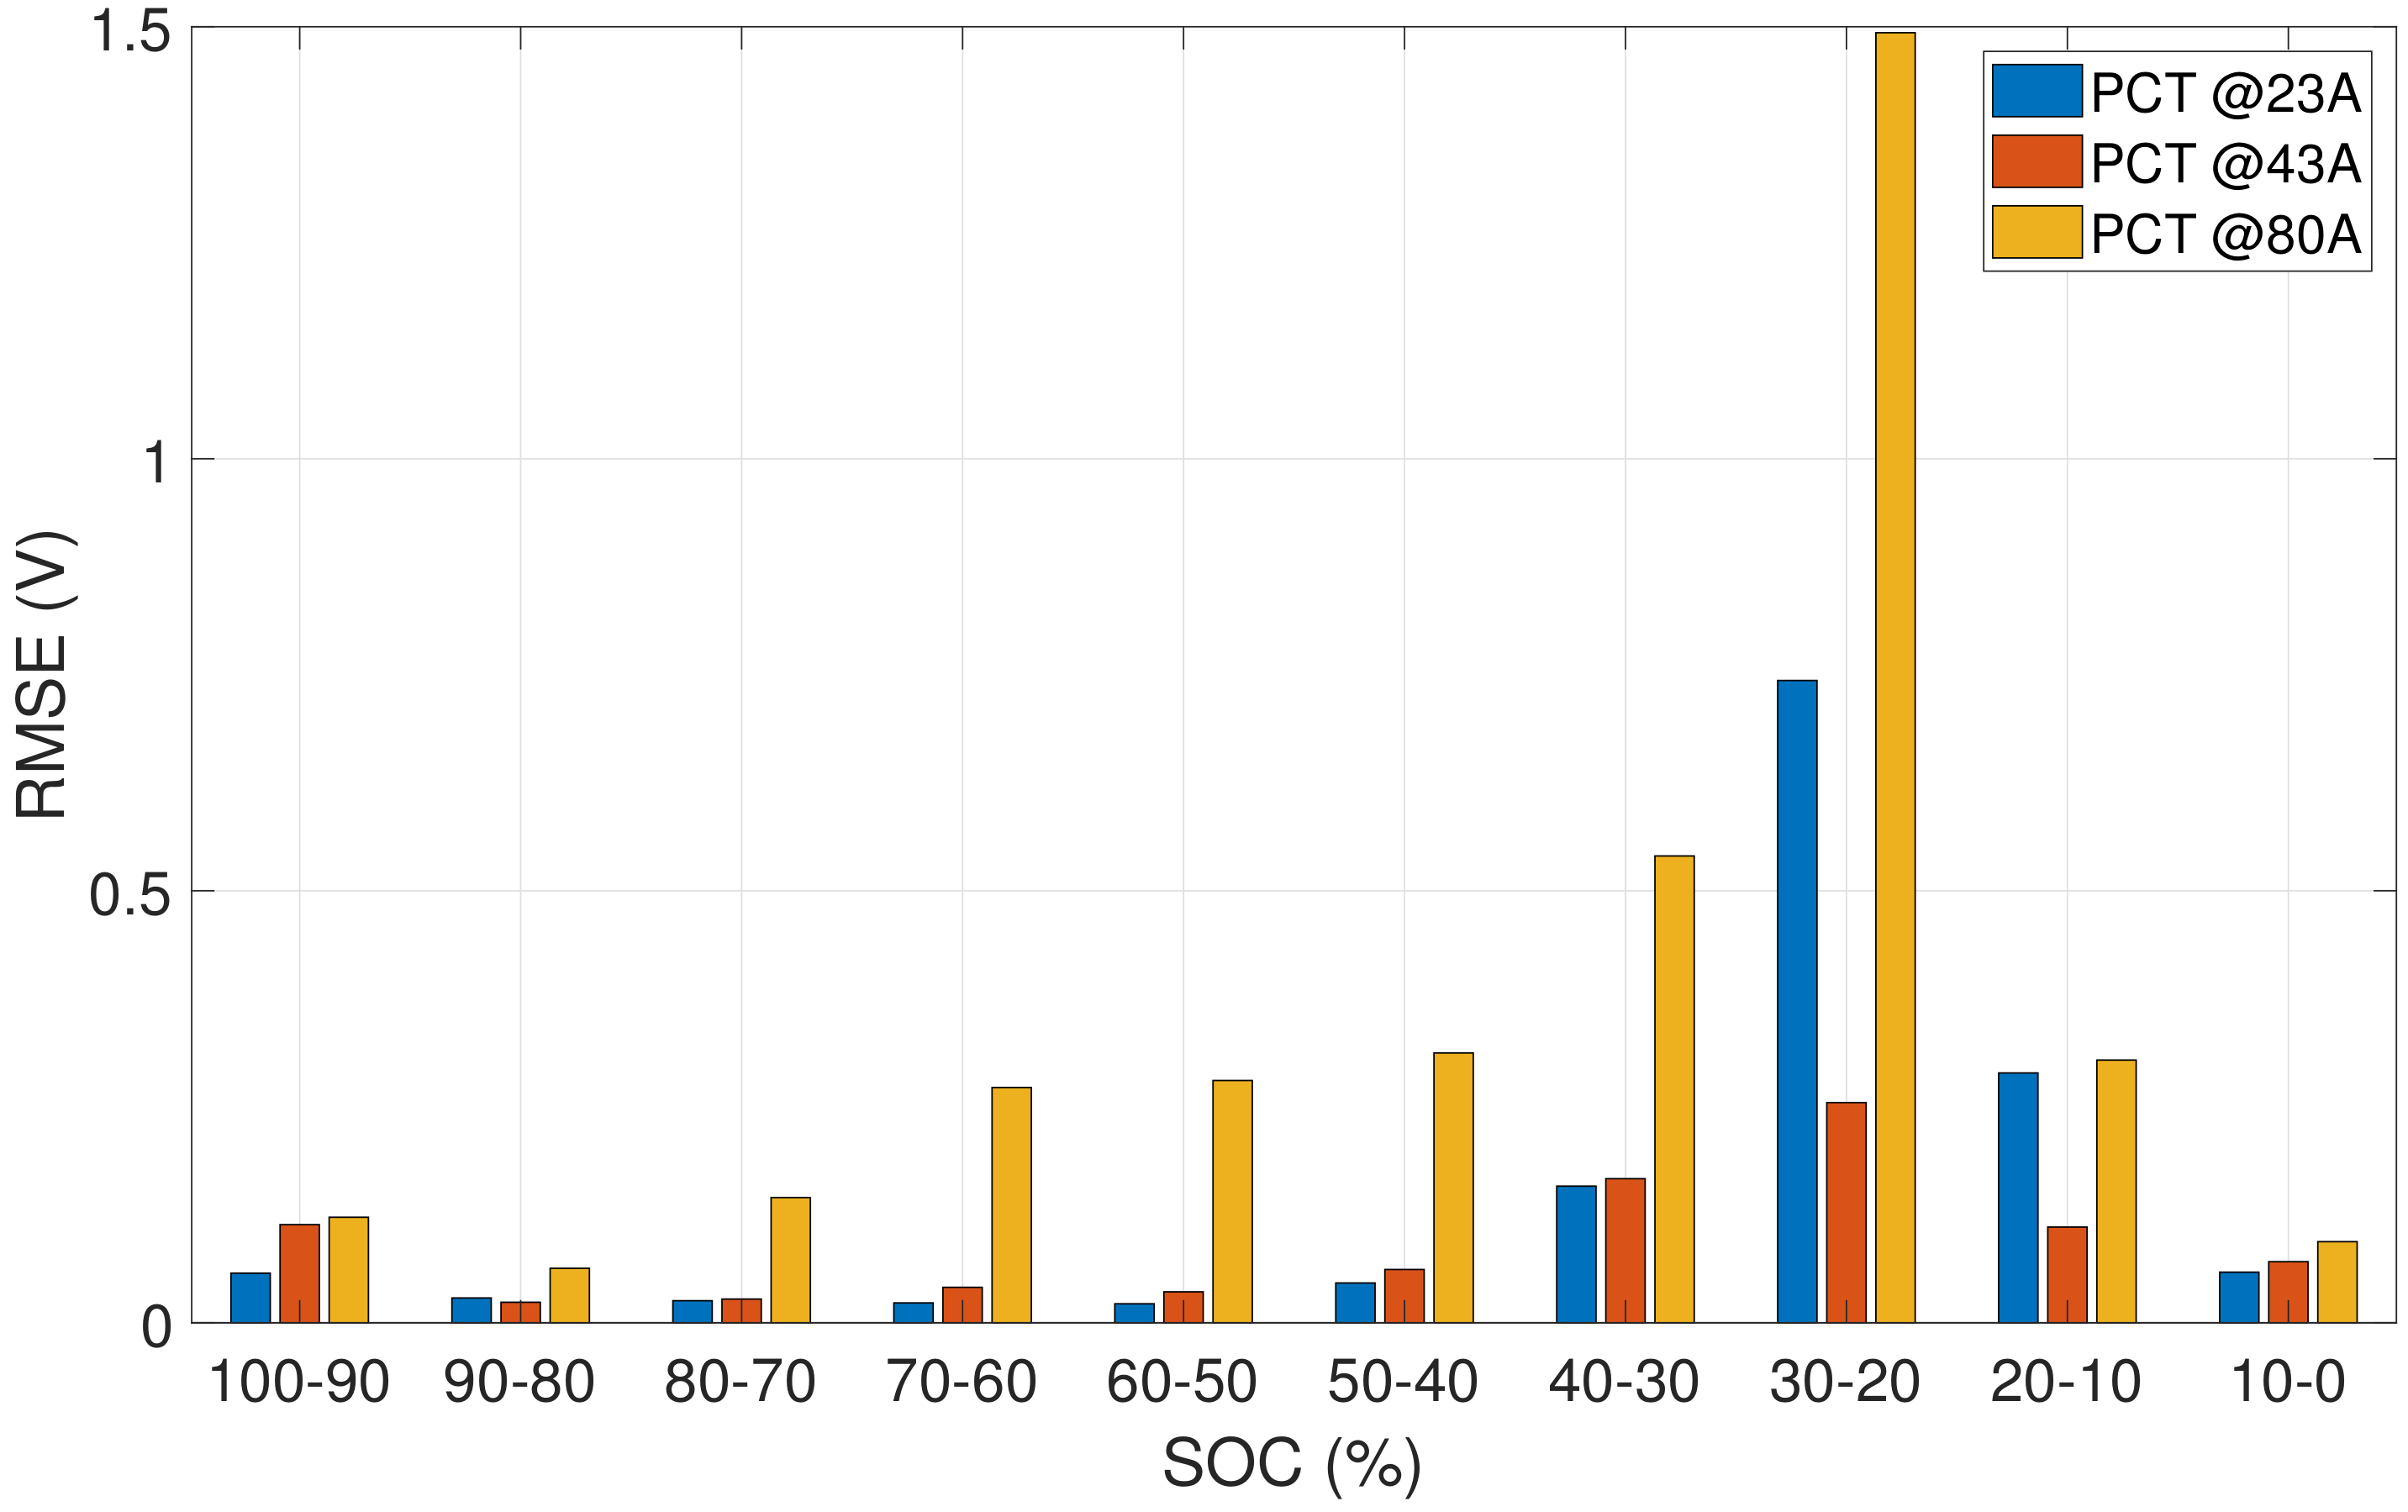
Figure 9 finally shows the RMSE in the model reconstruction for string #1. The reconstruction is divided in SOC zones of 10% each, to span the entire SOC range. It is reported for the three experiments described. We note that the maximum values of the error occur around the 20–30% SOC zone, where reaction (
2) takes place together with reaction (
1). Moreover, the current rate is also important, as the error increases with the current rate down to 30% SOC, as the iron reaction is turned on earlier. The higher errors found in the tests around the 20–30% SOC zone at low and high current rates show the reduced accuracy of the model in that zone. The accuracy strongly depends on the test condition in which the parameter identification process was performed.
Finally, we can draw the conclusion that the model for the sodium–nickel chloride battery proposed in [
24] and experimentally investigated in this paper is accurate for low-current rates, but it is not able to reproduce the battery behavior with the same fidelity for high current rates and in the case when the secondary reaction involving the iron component is activated. The experimental campaign described in this paper stands as a starting point and suggests efforts for the improvement of the model about this aspect. Similar considerations about the accuracy of this model are drawn in [
29]. A commercial sodium–nickel chloride battery composed of 240 cells of 40 Ah series-connected is tested with a PCT consisting of current pulses of 5 A. In particular, the authors show that modeling the iron reaction can be improved and propose a possible variation of the circuit model which accounts the variation of
and
with the SOC and still maintains independent one to another the two model branches. Another possible improvement of the model could be to consider the variation of the model parameters with the load current value. Moreover, it seems to us important that the Ni and Fe reactions cannot be considered independent to one another, because they are strongly coupled. Their interaction should be taken into account by increasing the iron branch complexity, using more complex components, such as constant phase elements or Warburg impedance type elements, and/or combining the two branches with mutually interacting components. These aspects will be investigated in future works.


 and
and 


