Investigation of an Innovative Rotor Modification for a Small-Scale Horizontal Axis Wind Turbine

Abstract
:1. Introduction
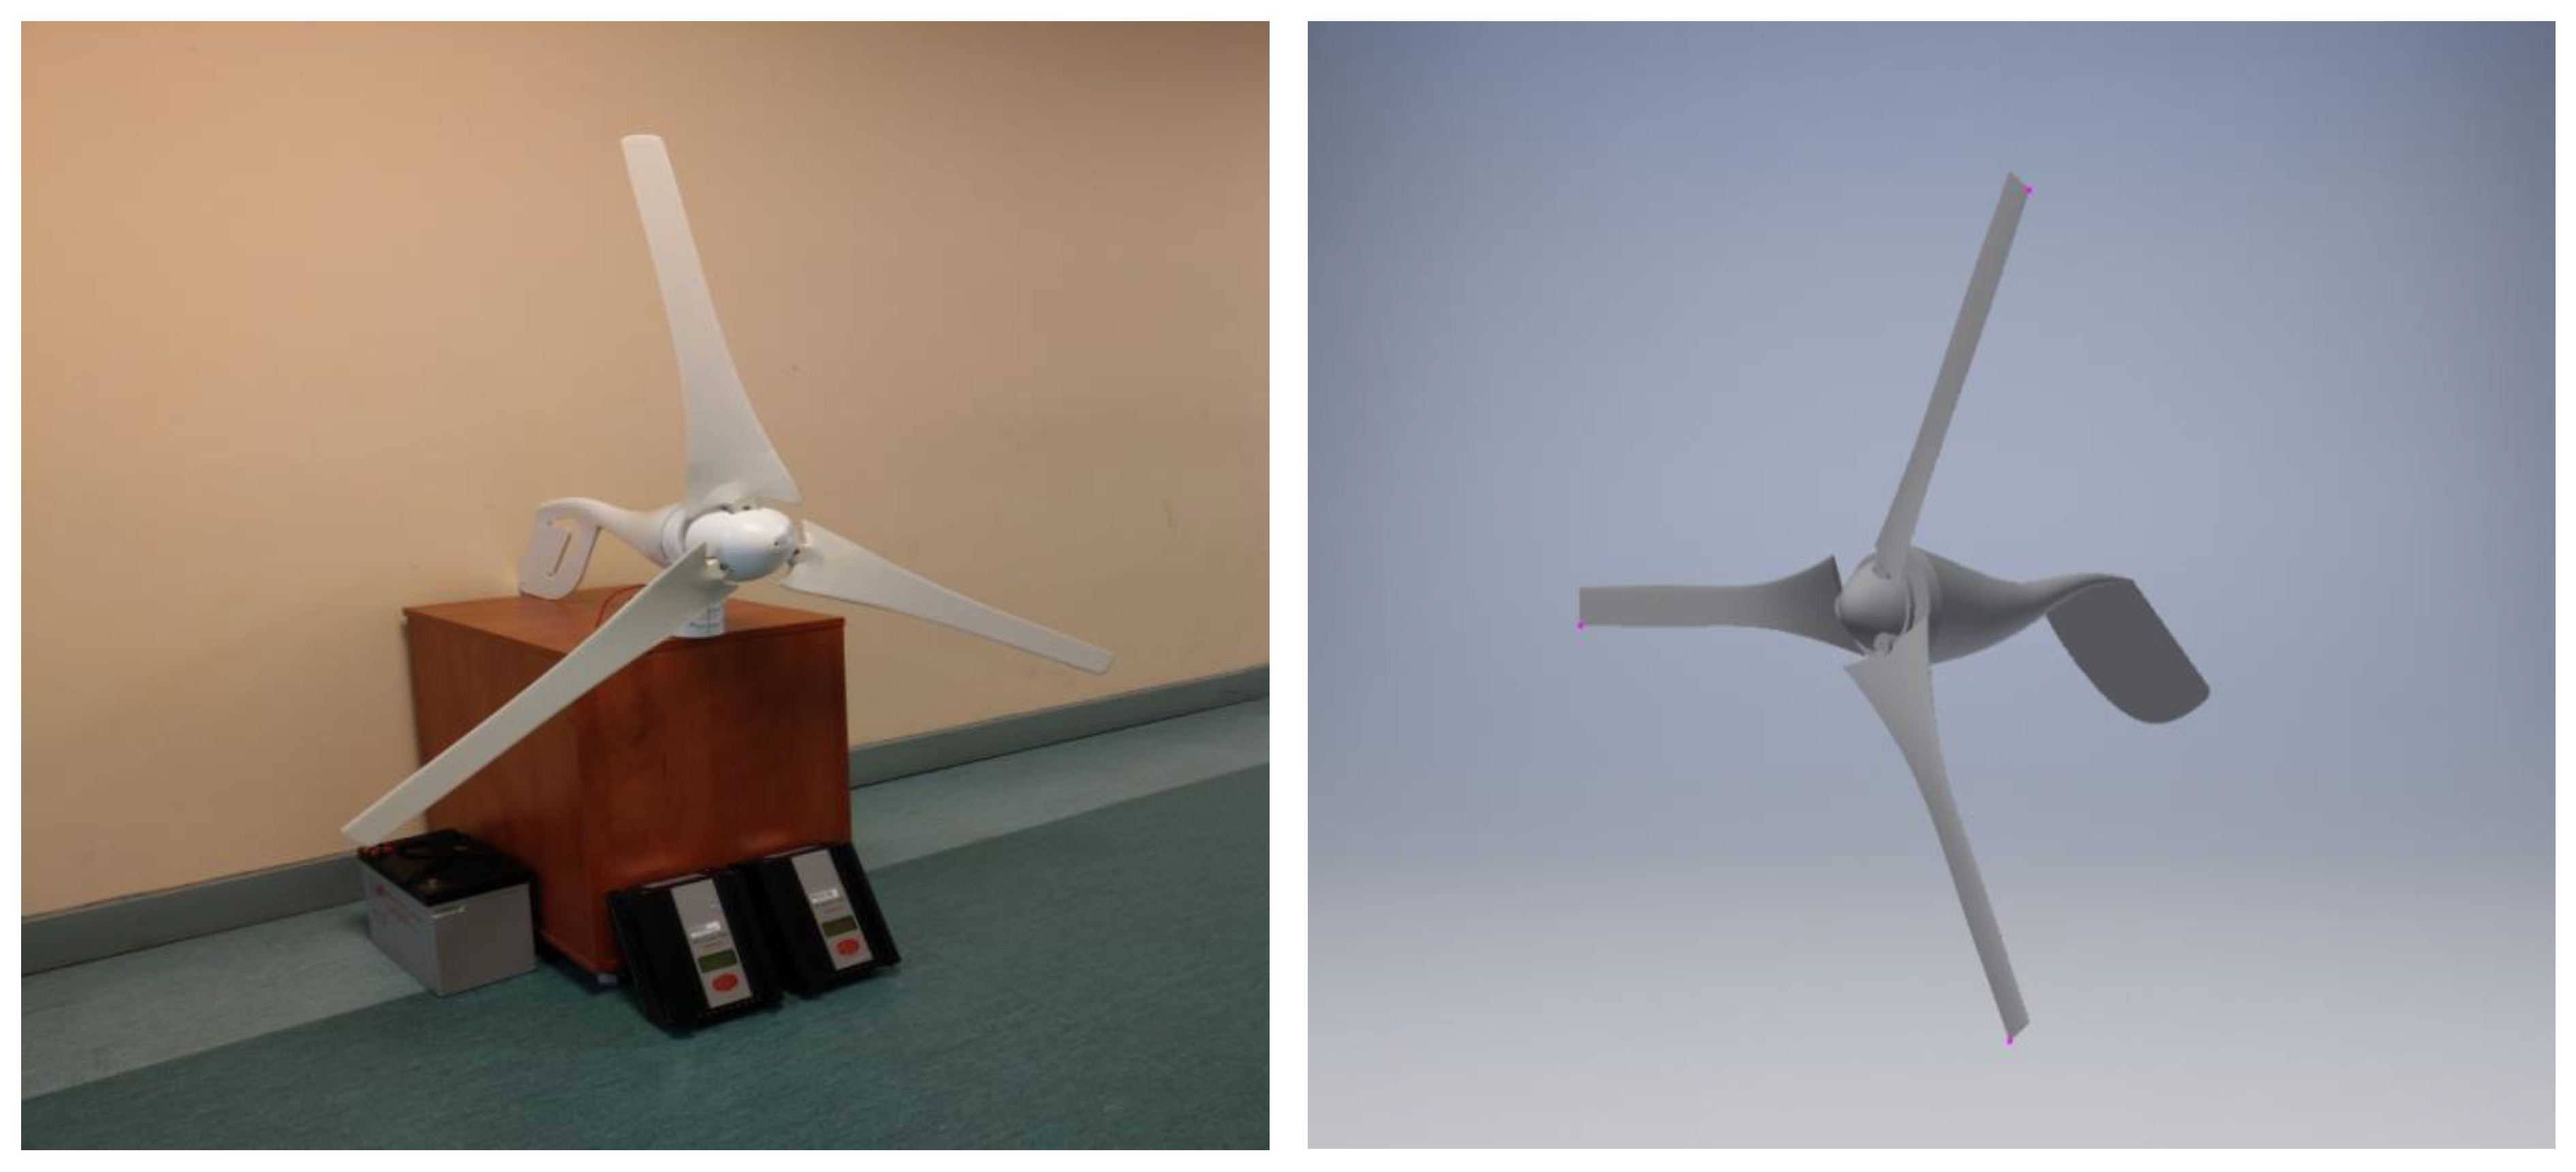
2. Materials and Methods
3. Computer Simulation Analysis
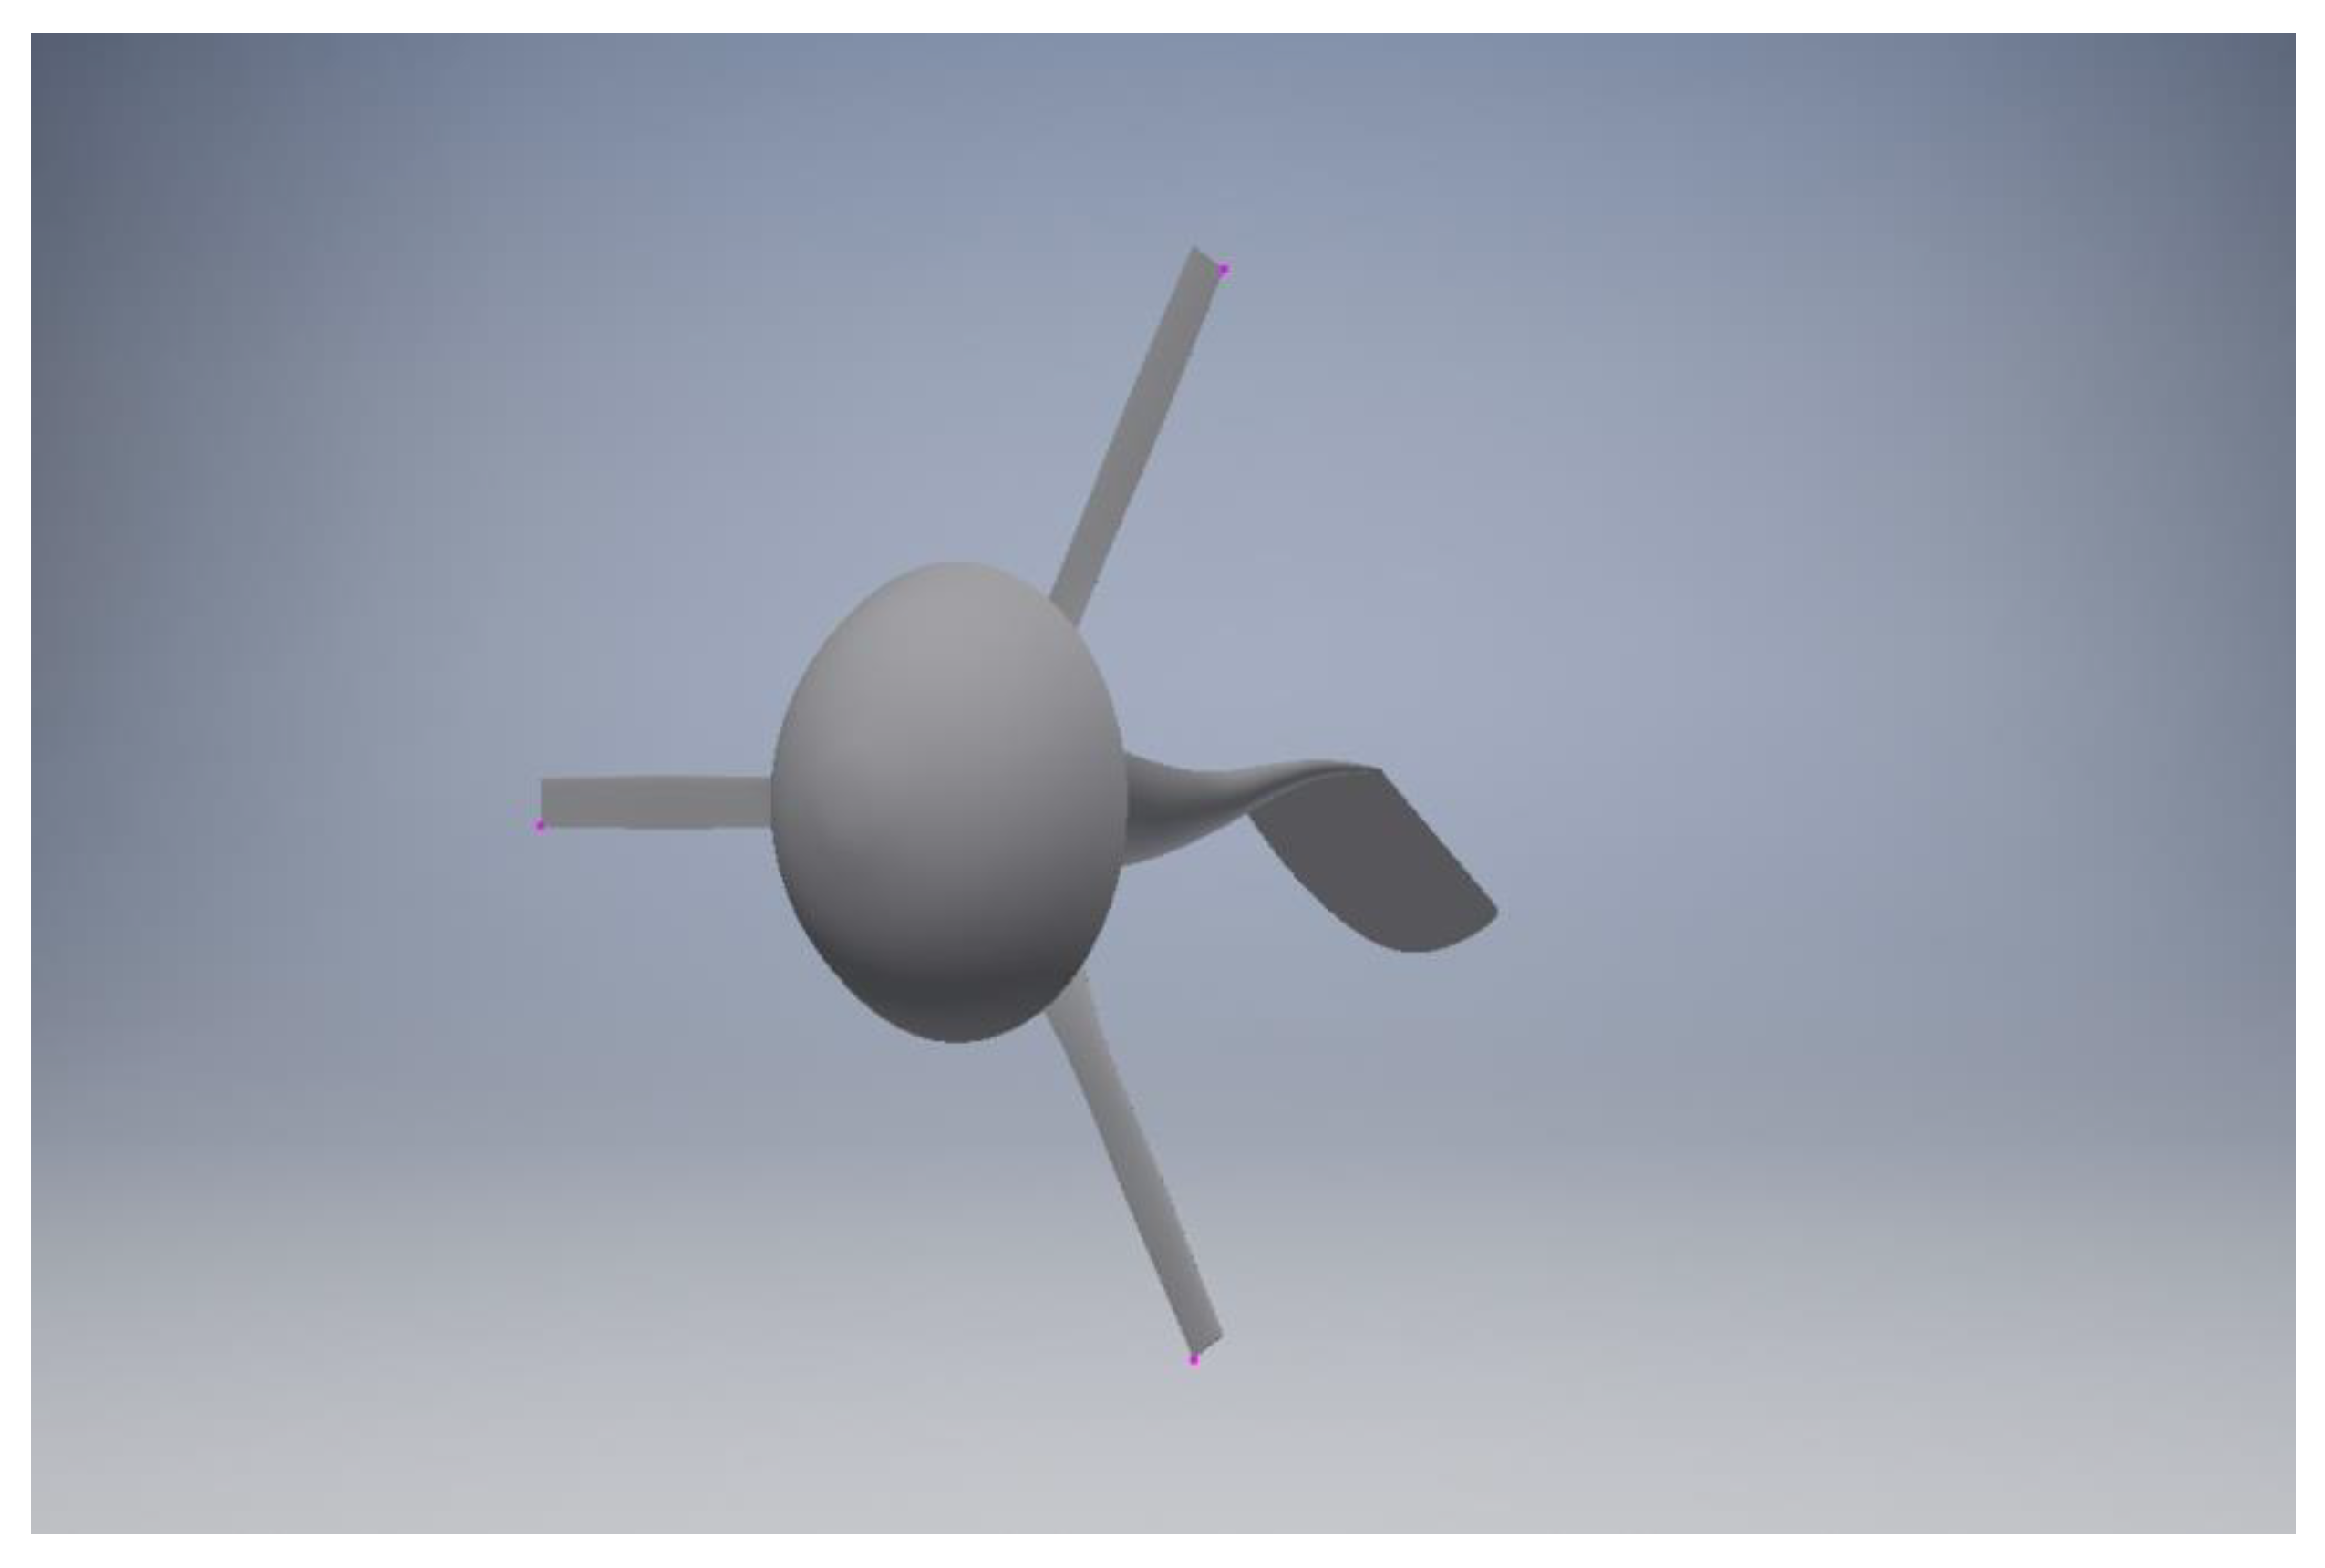
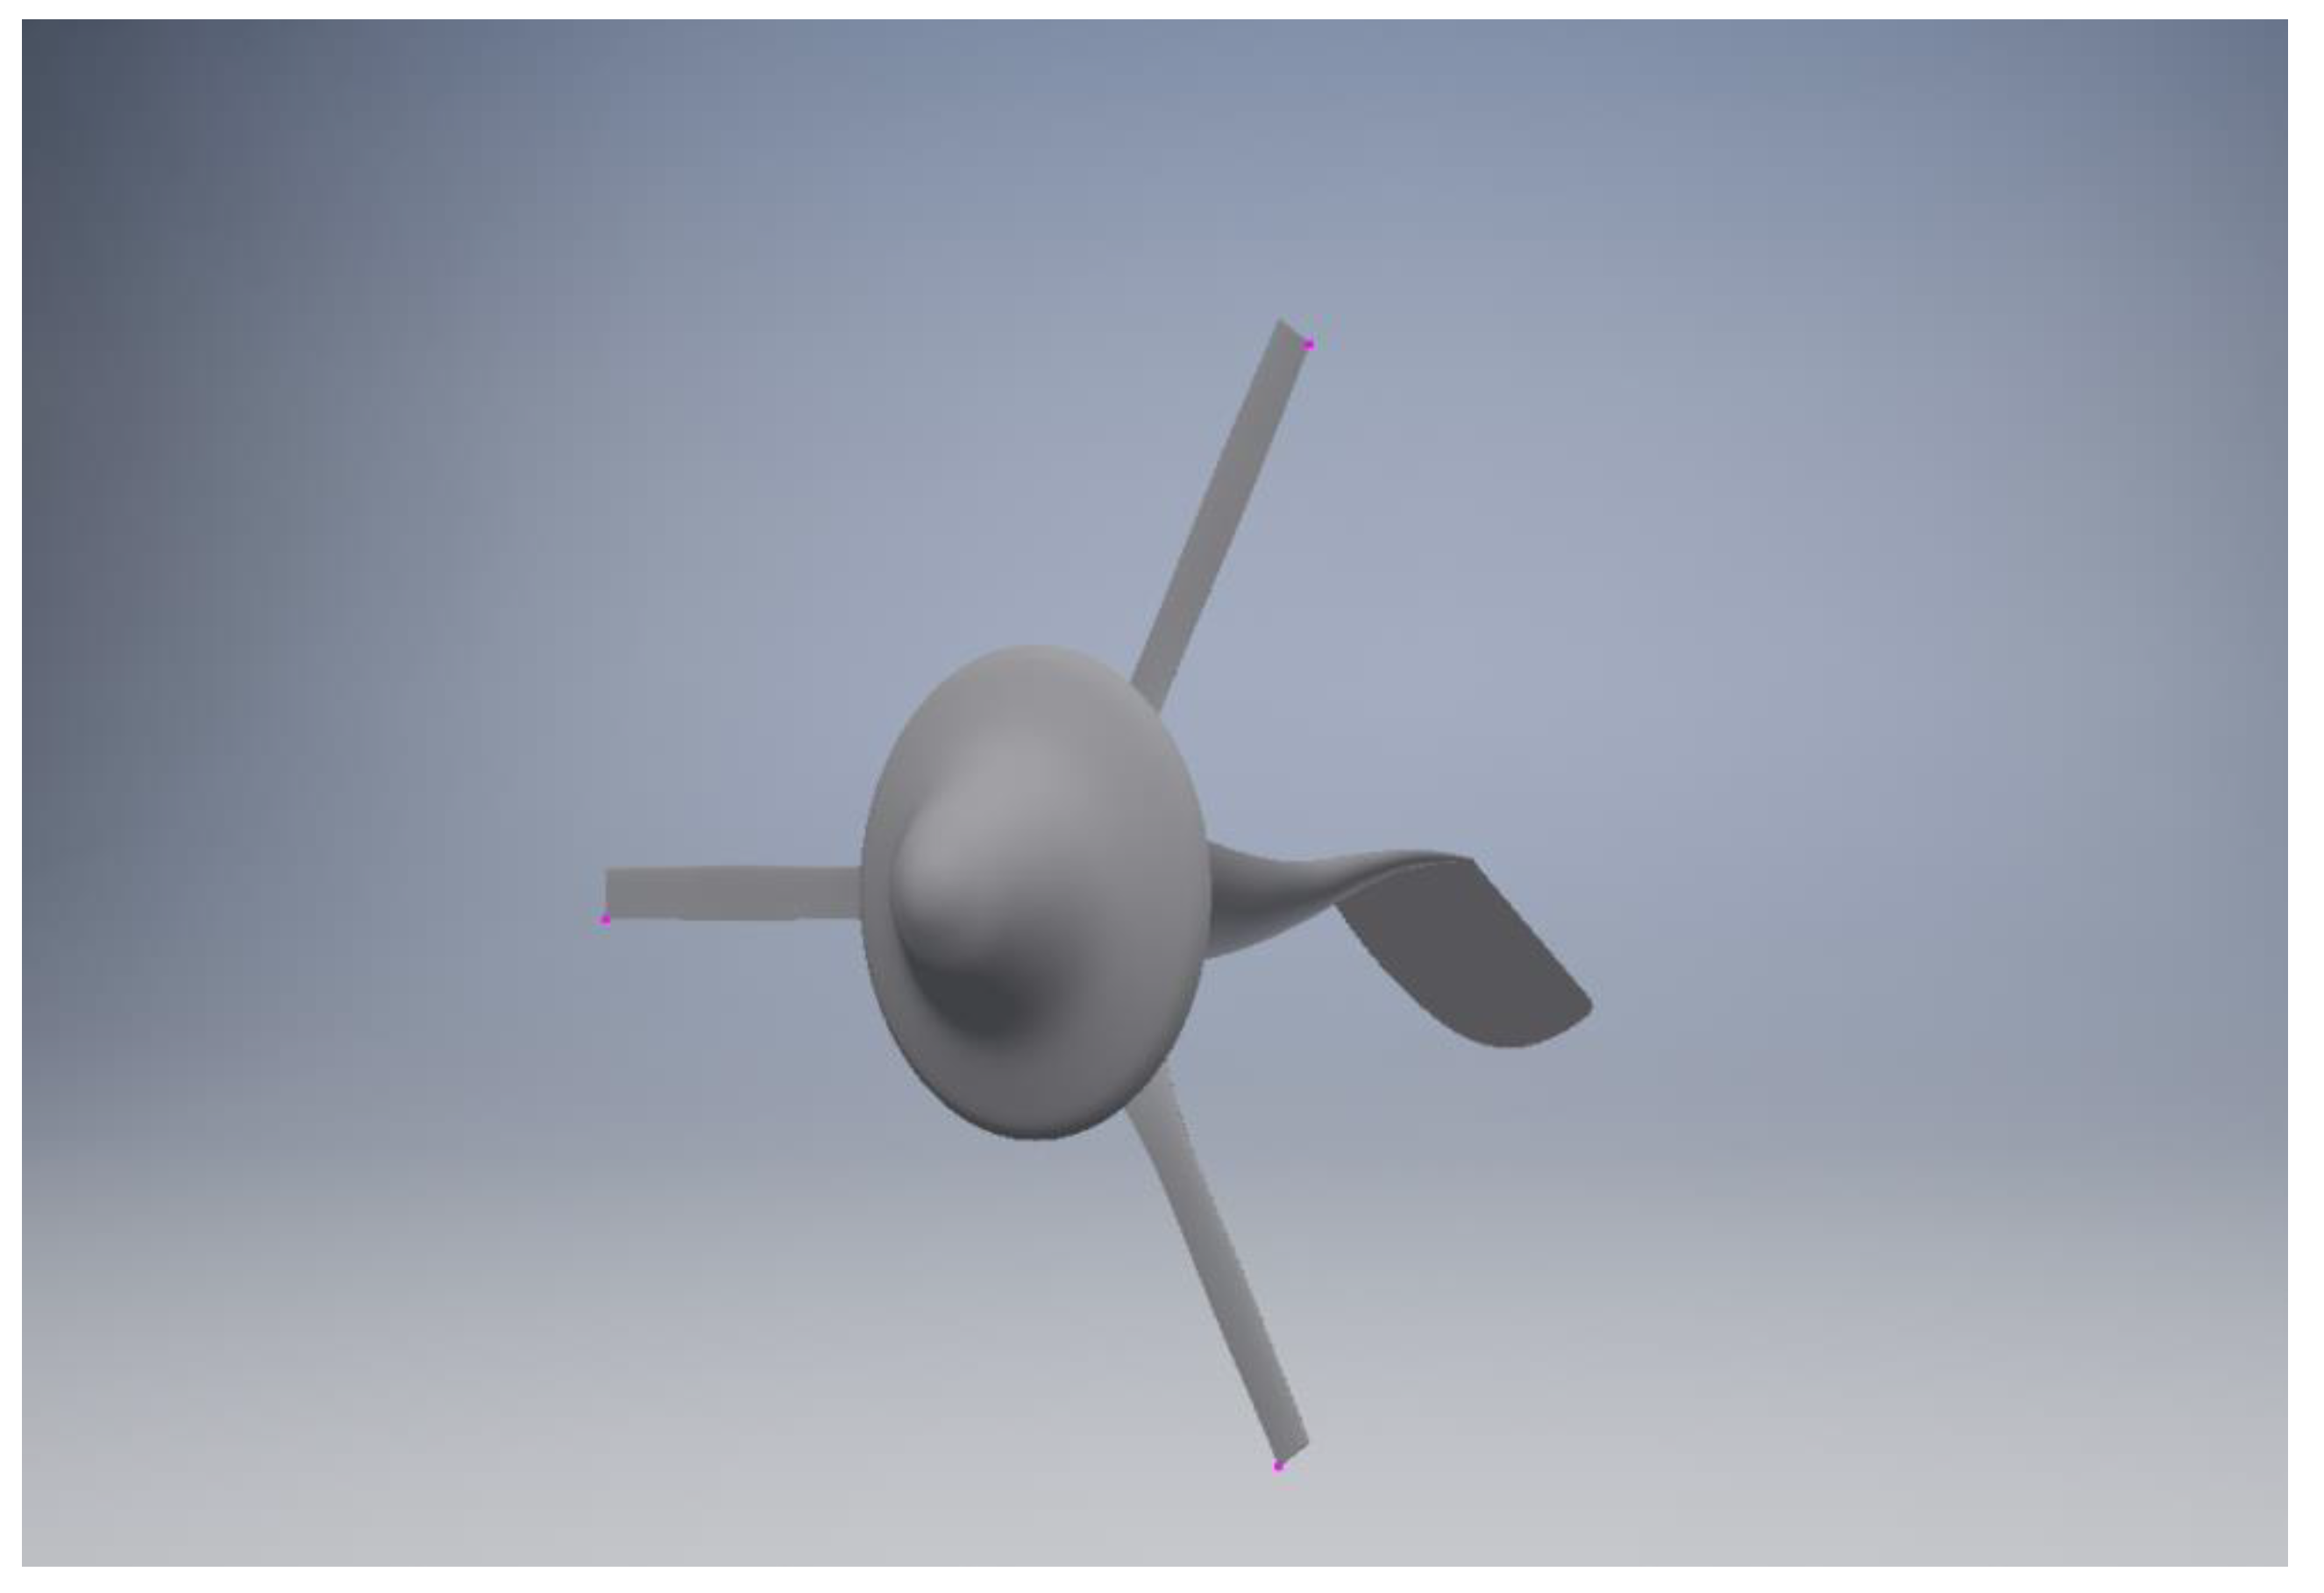
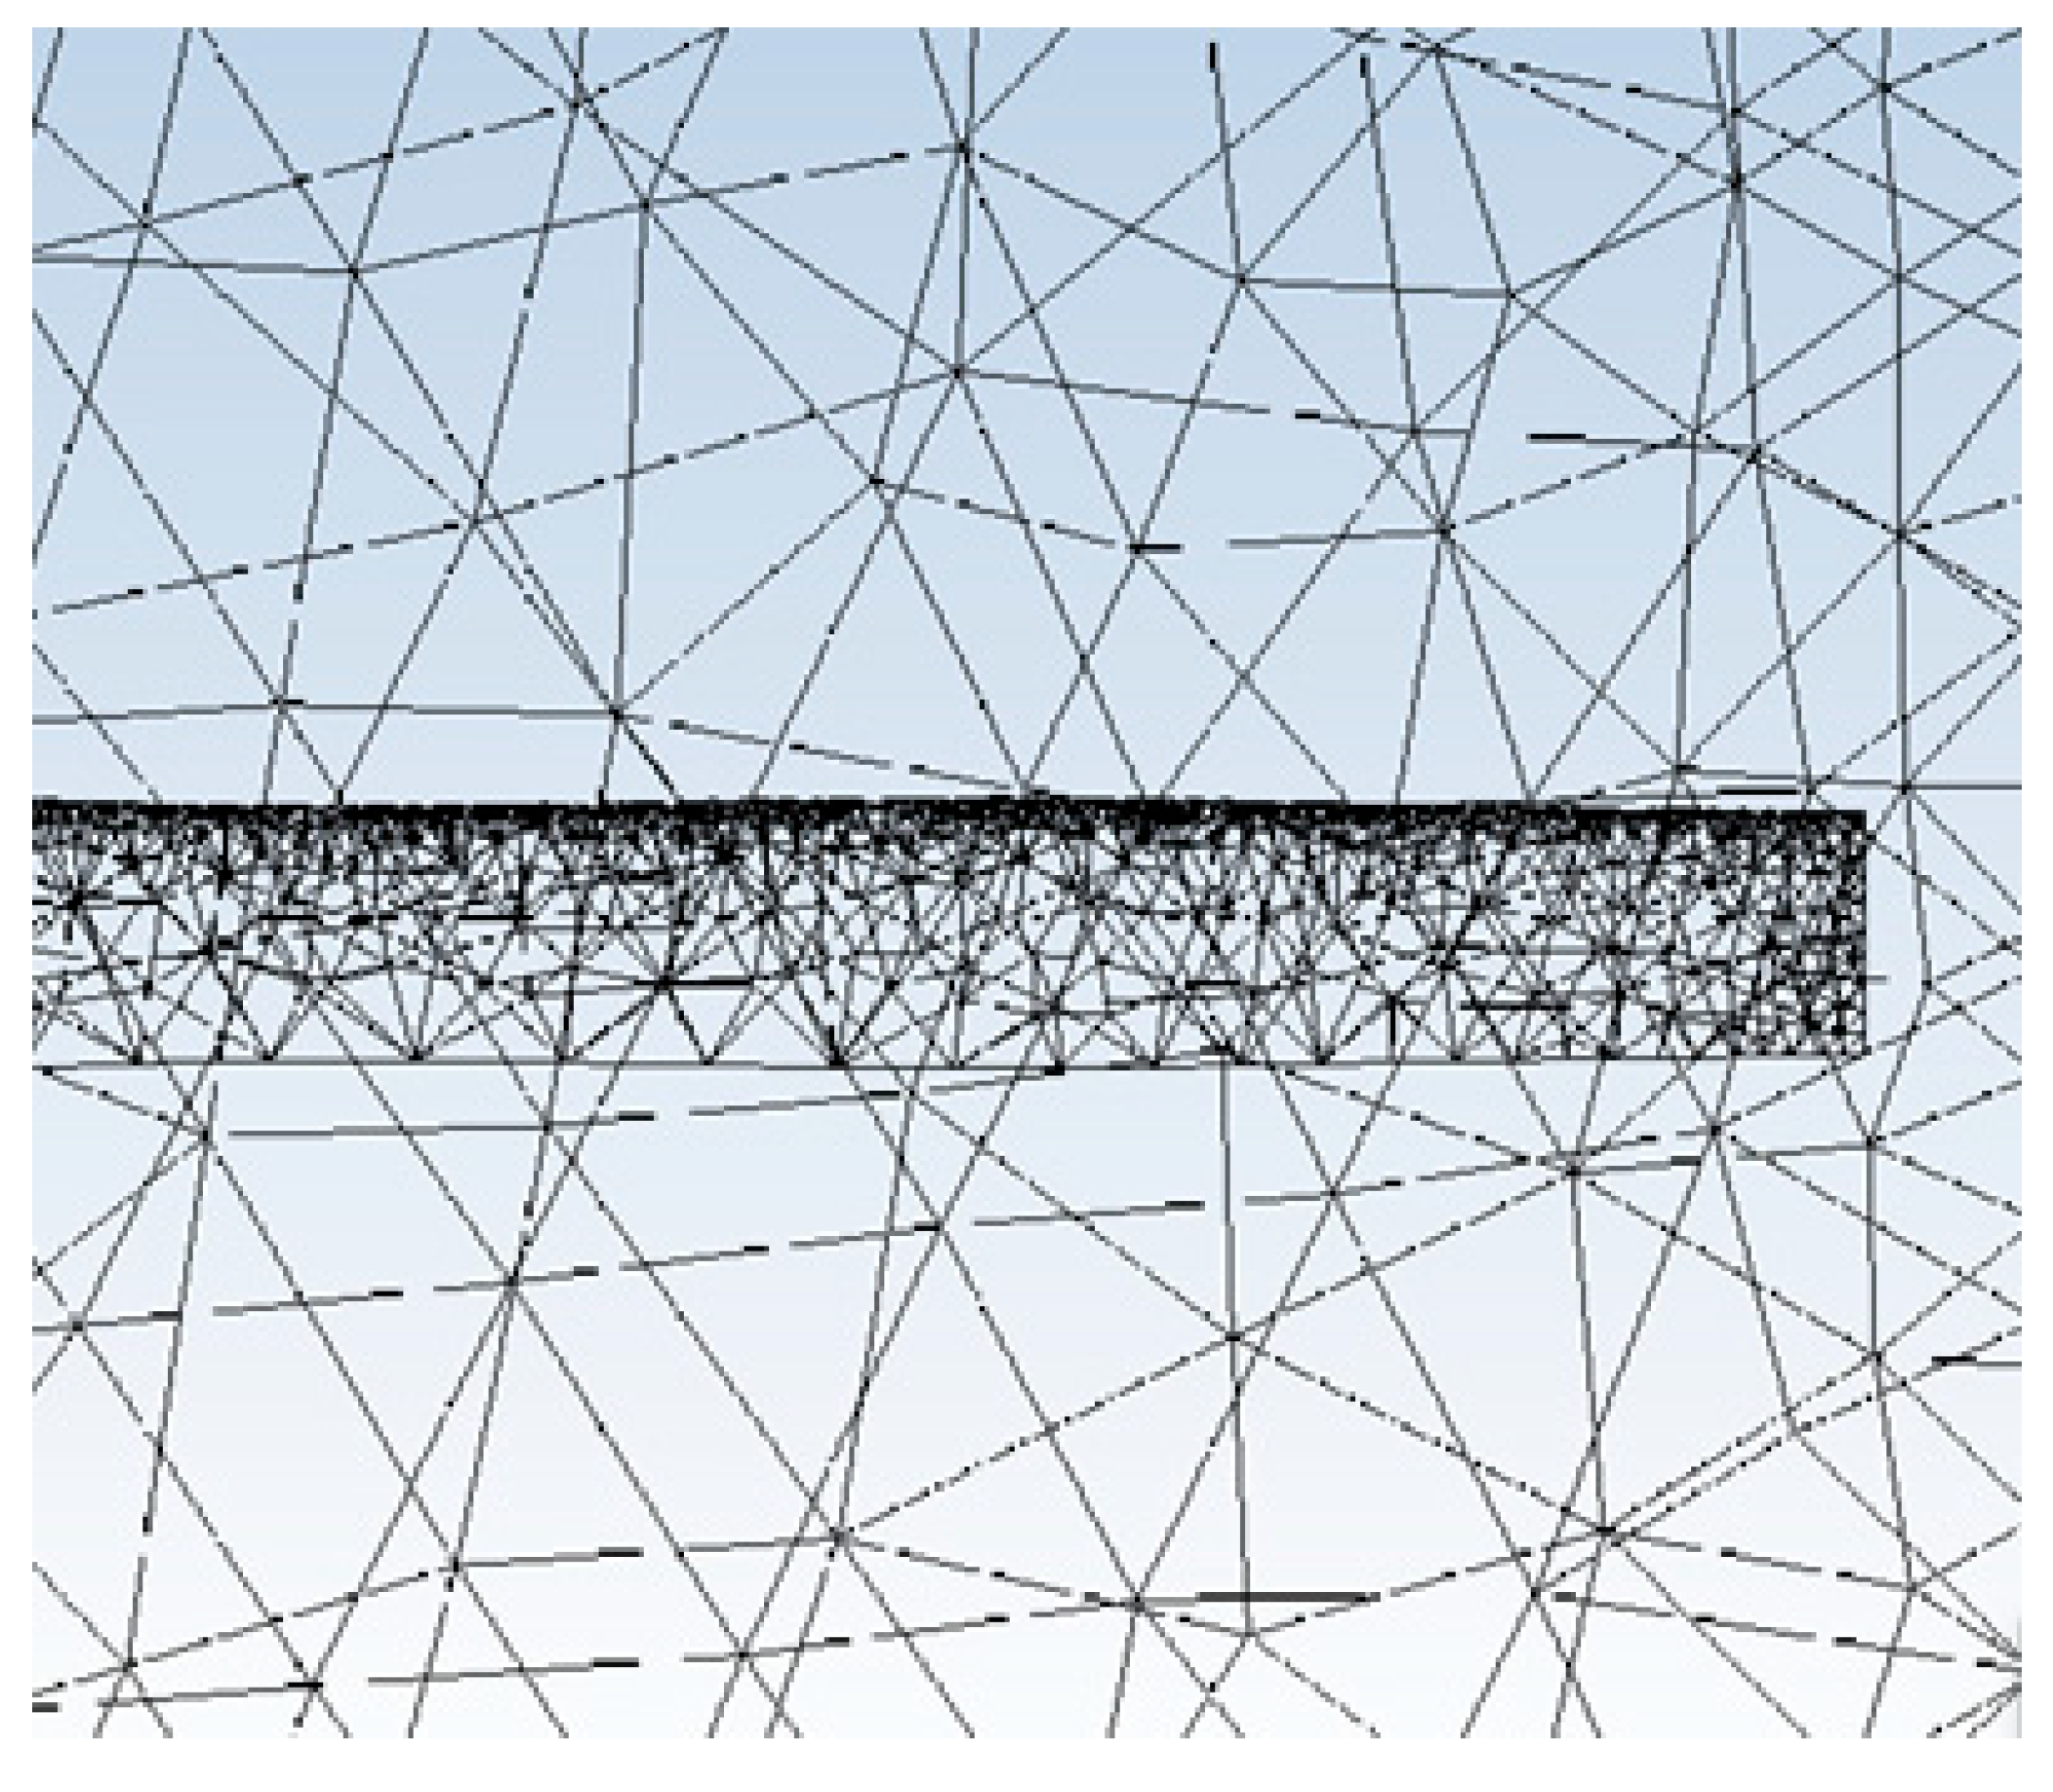
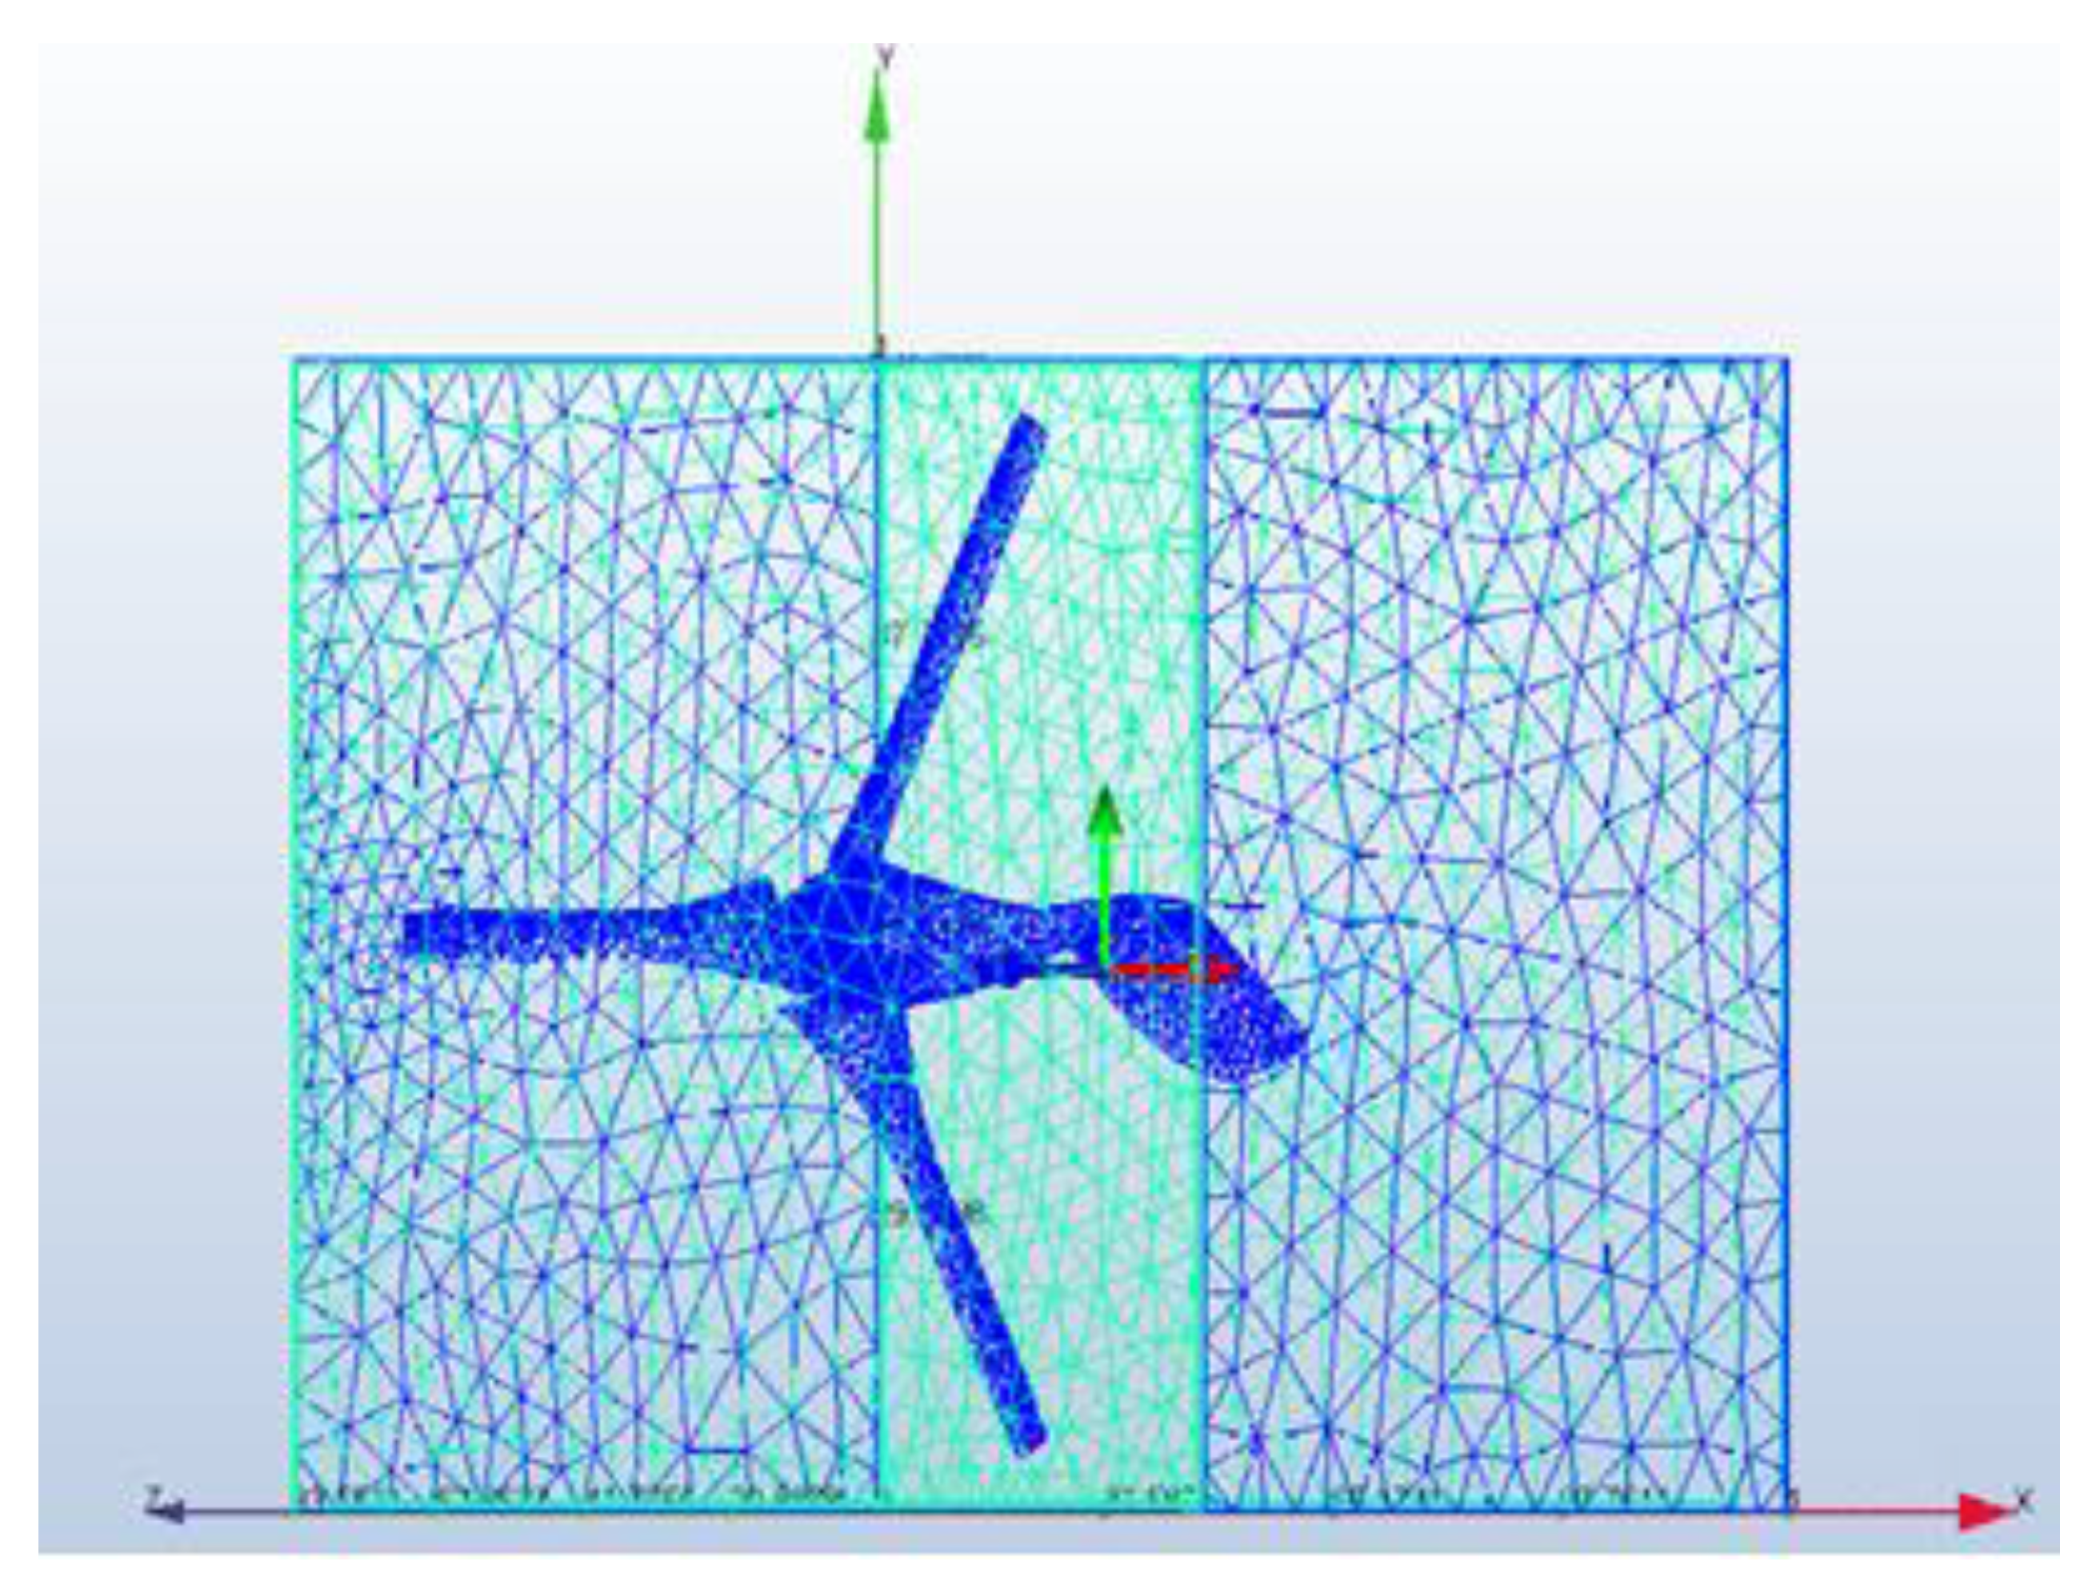
3.1. Simulation Model and Geometry
3.2. Computer Simulation Parameters
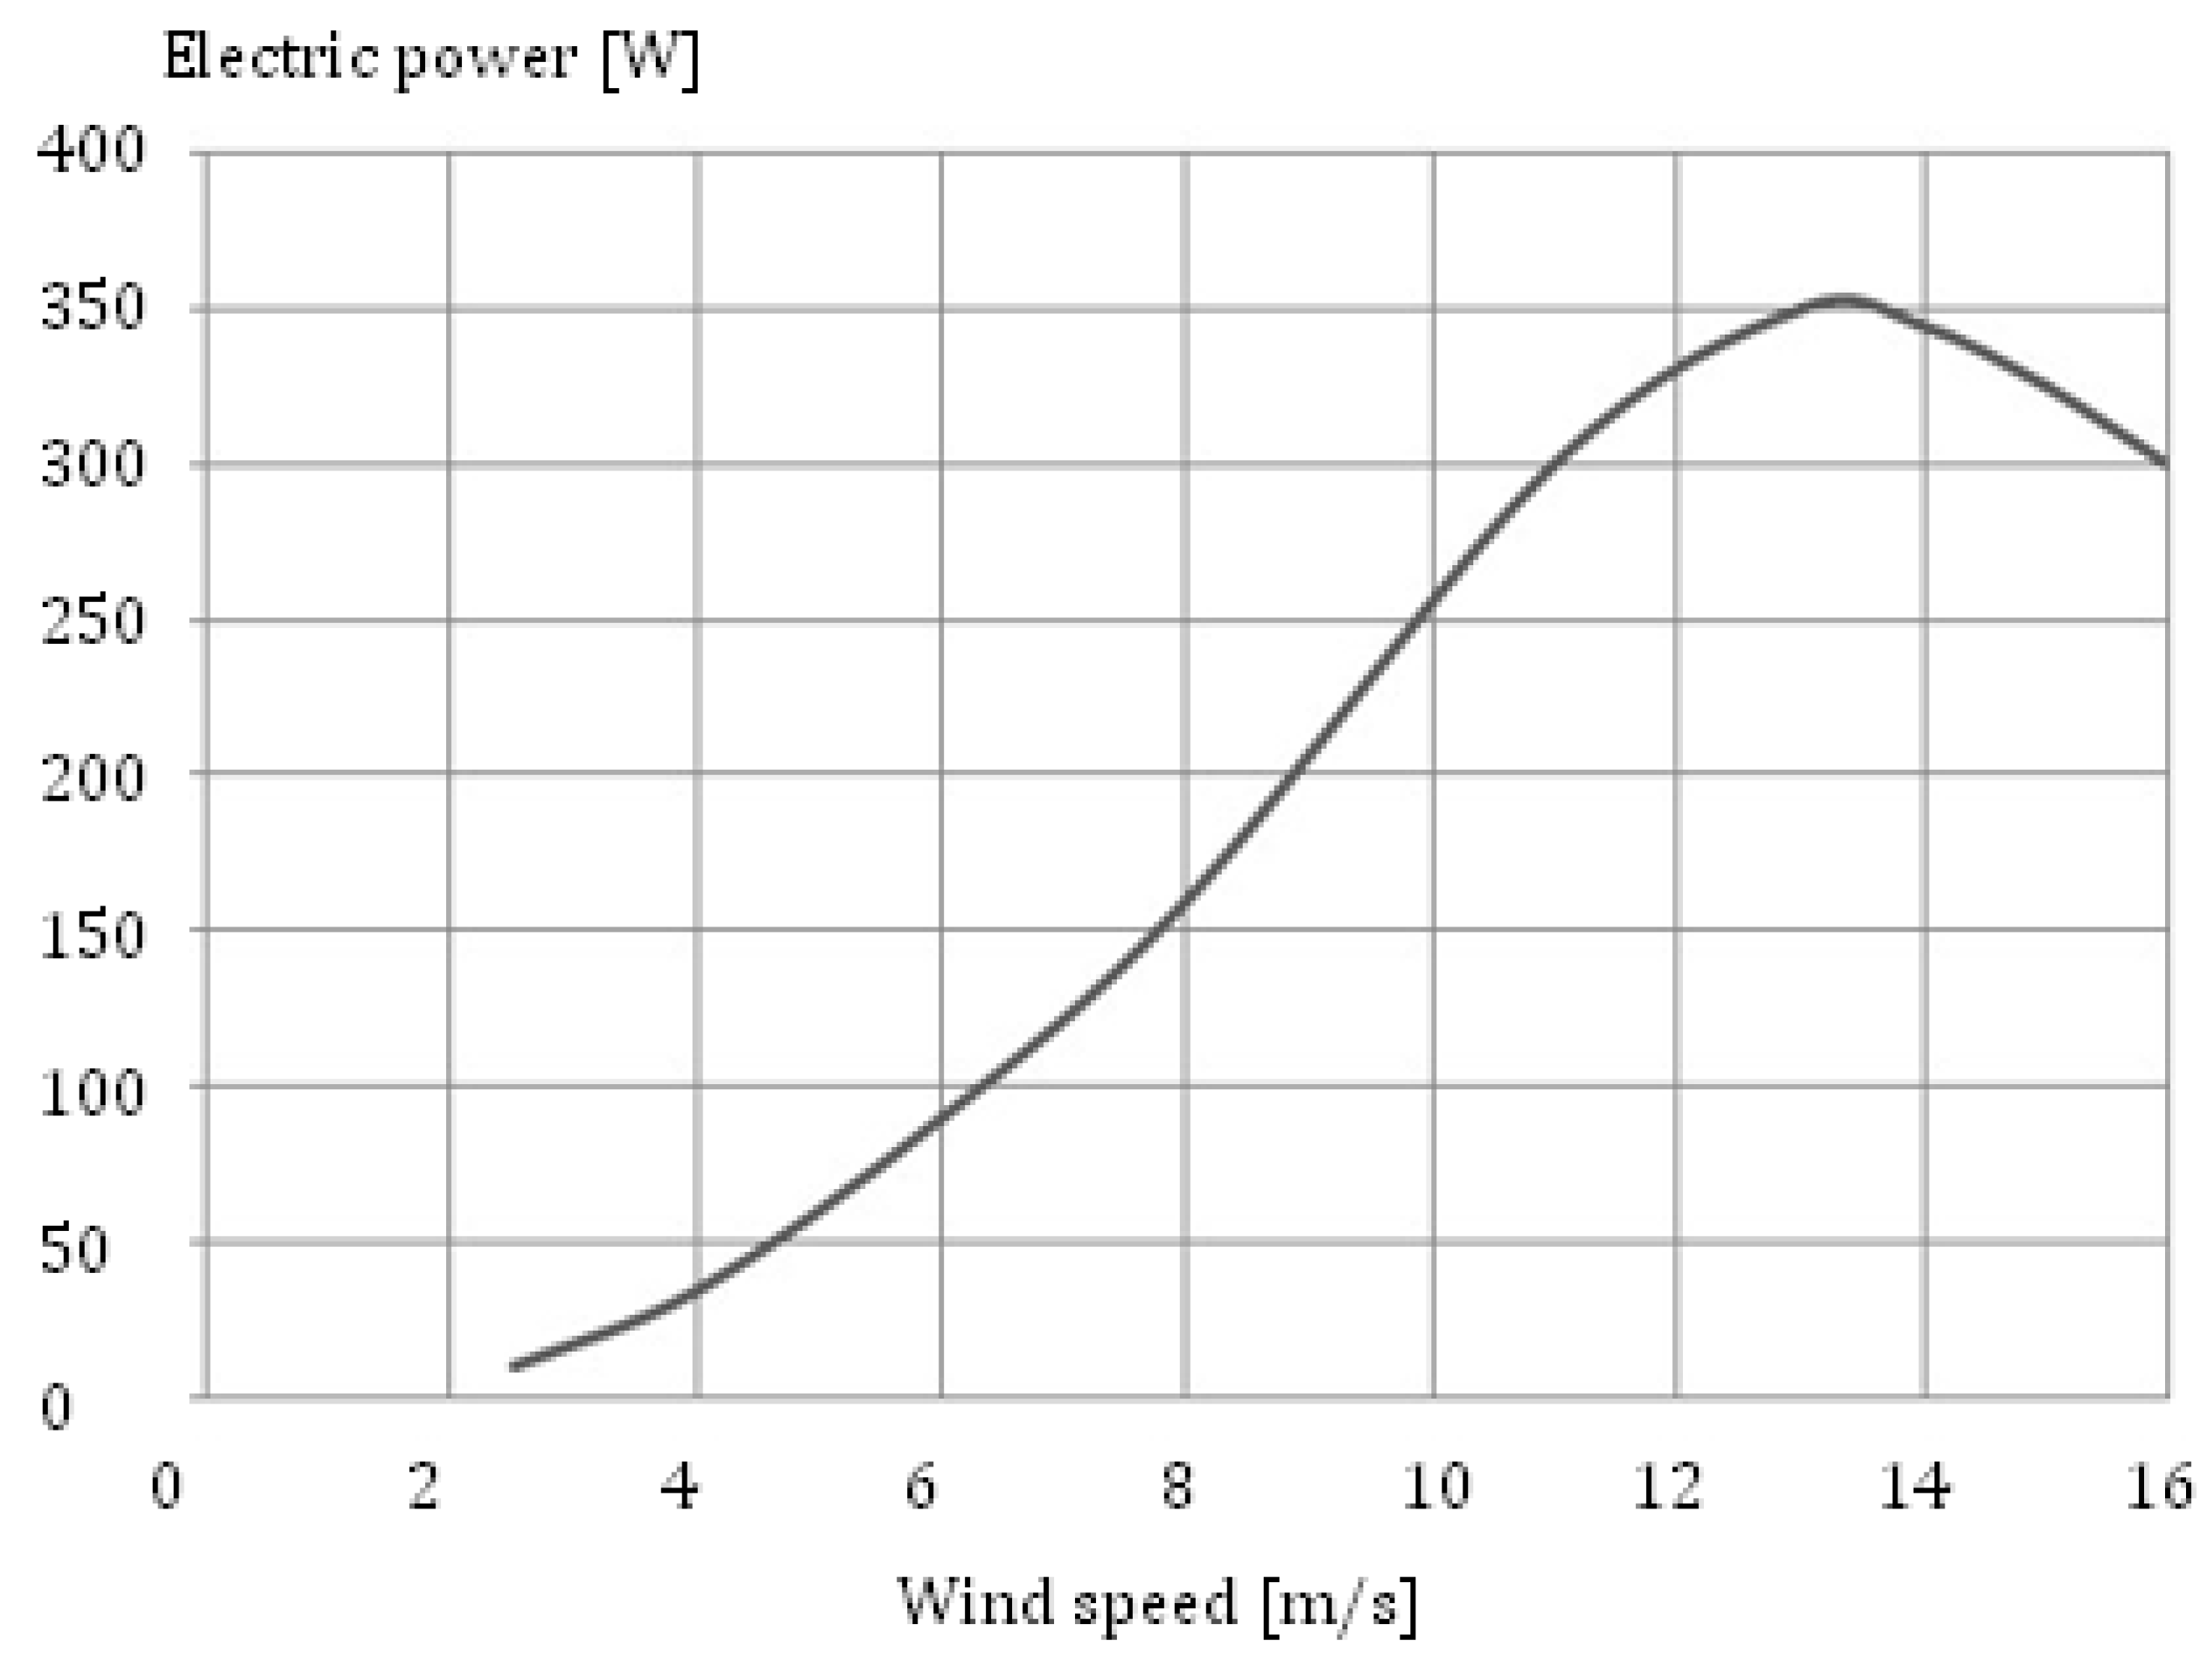
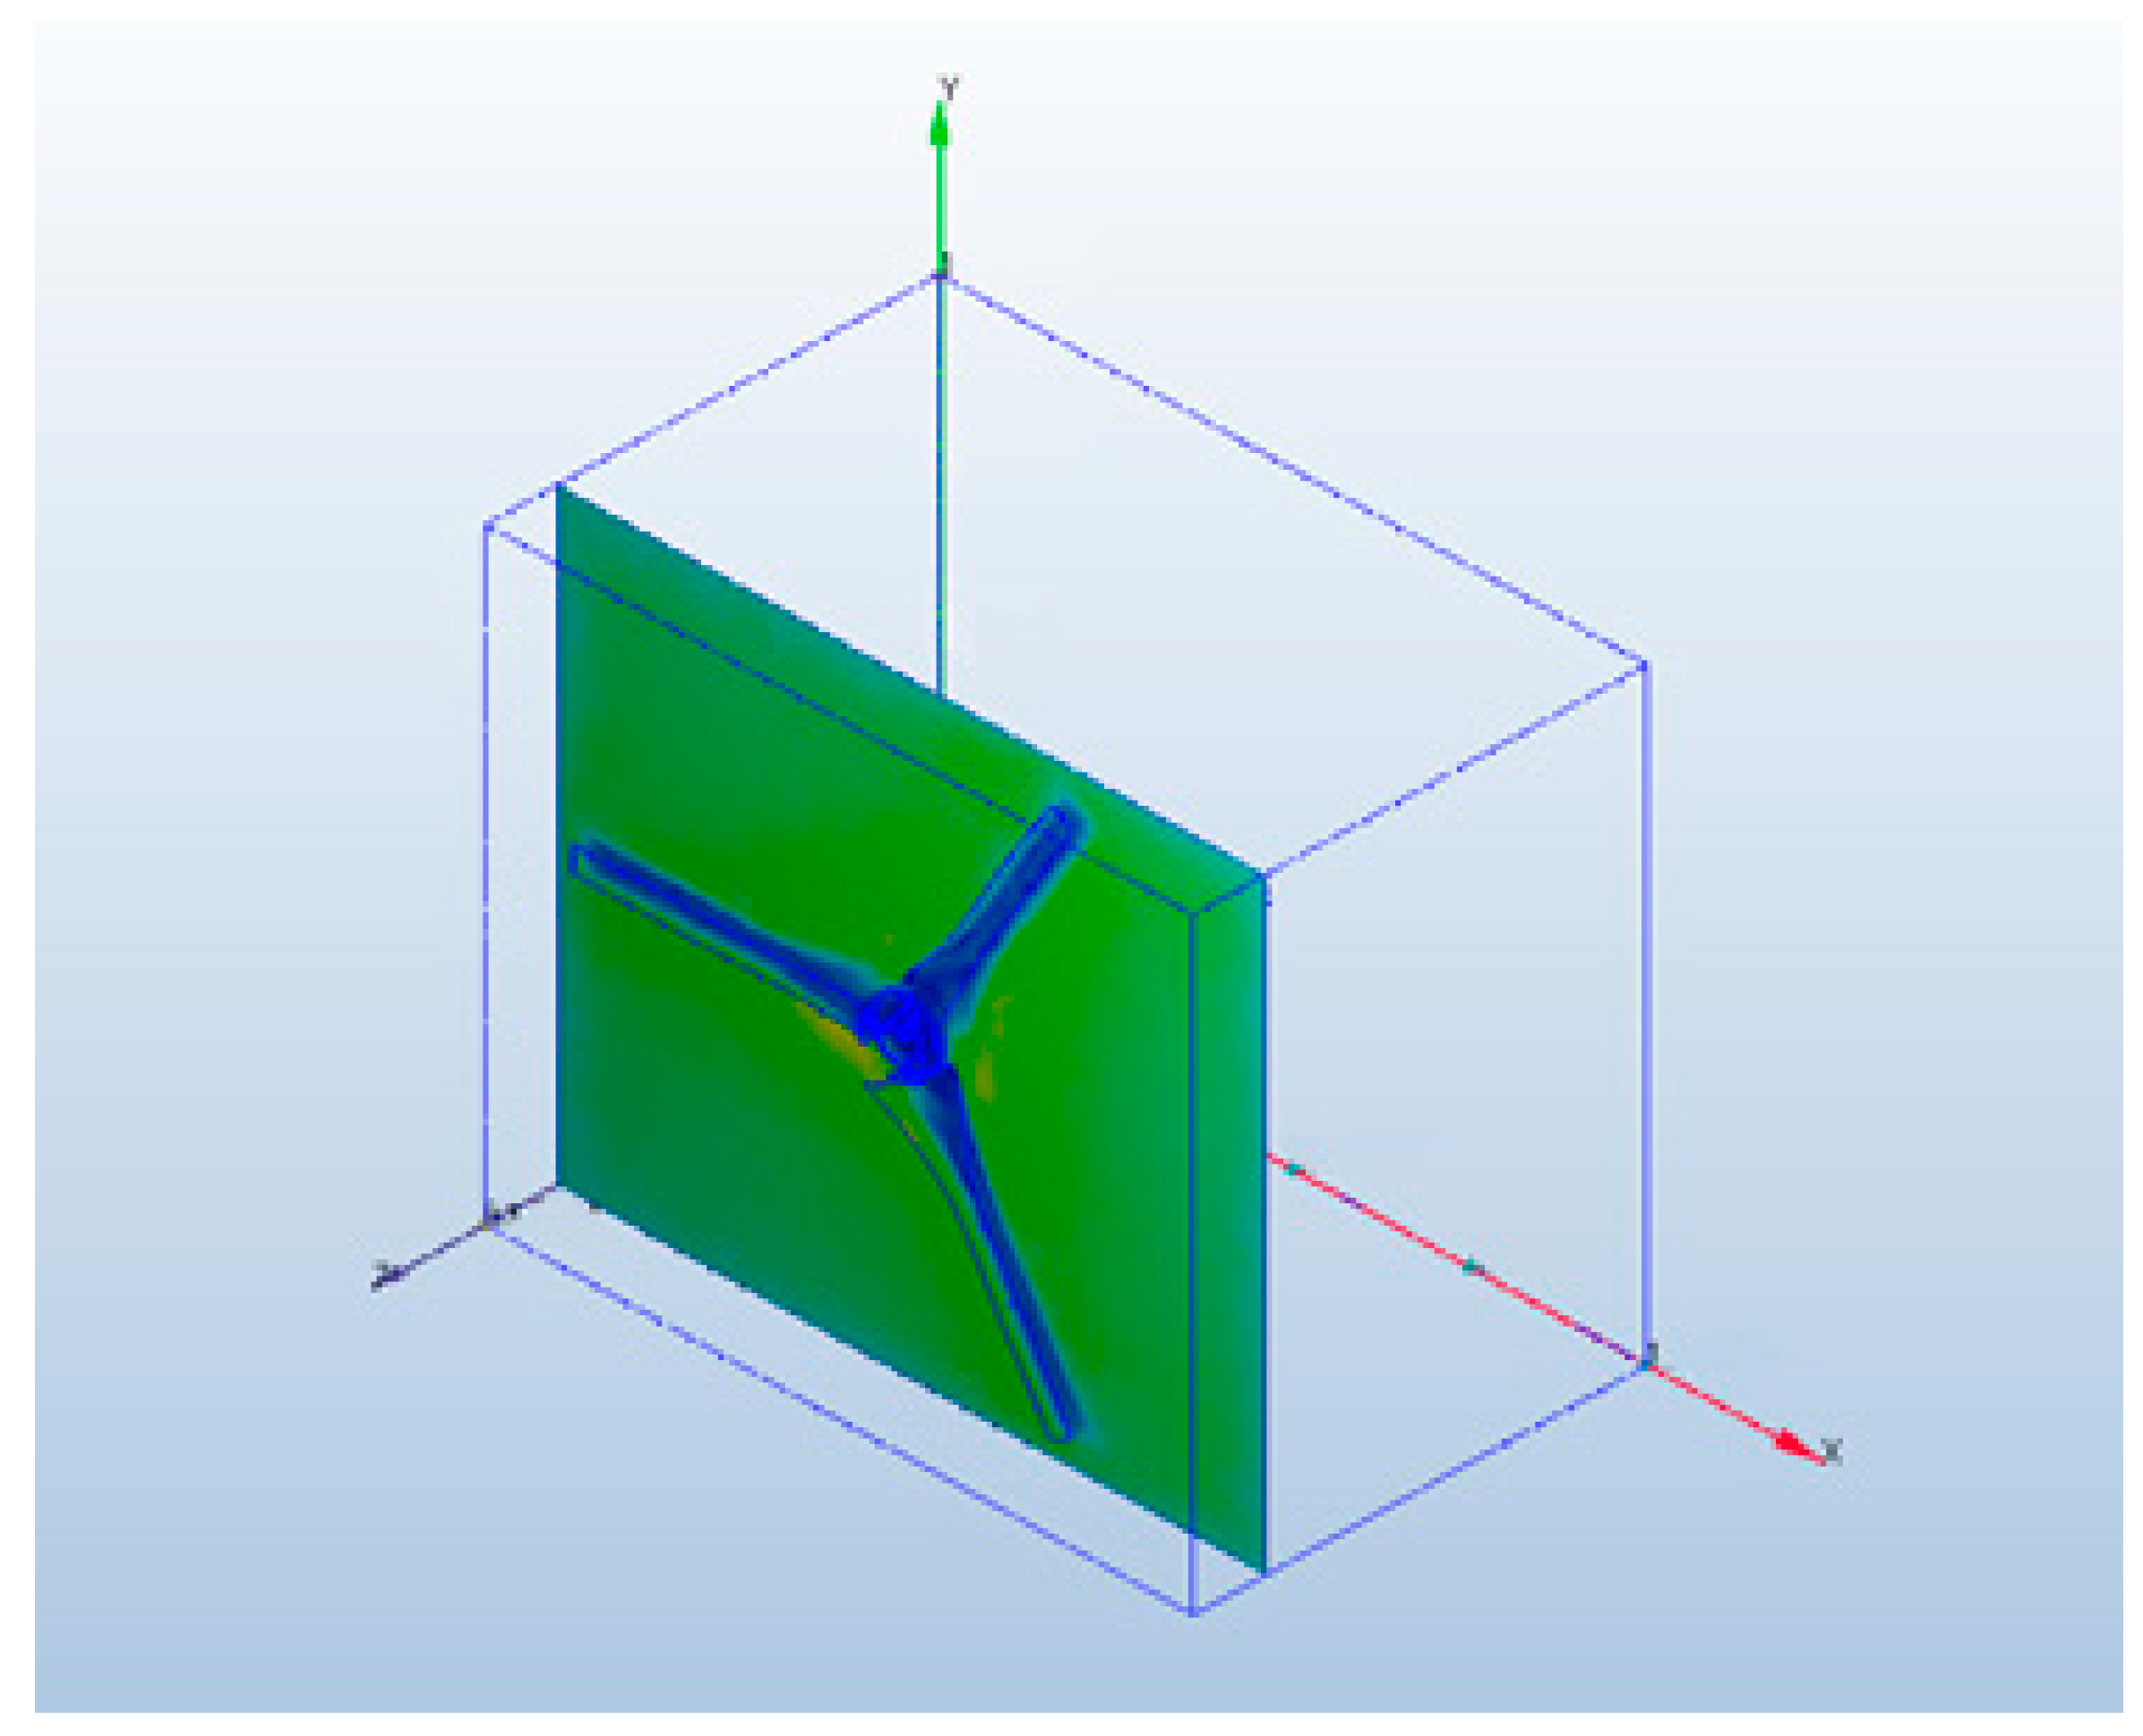
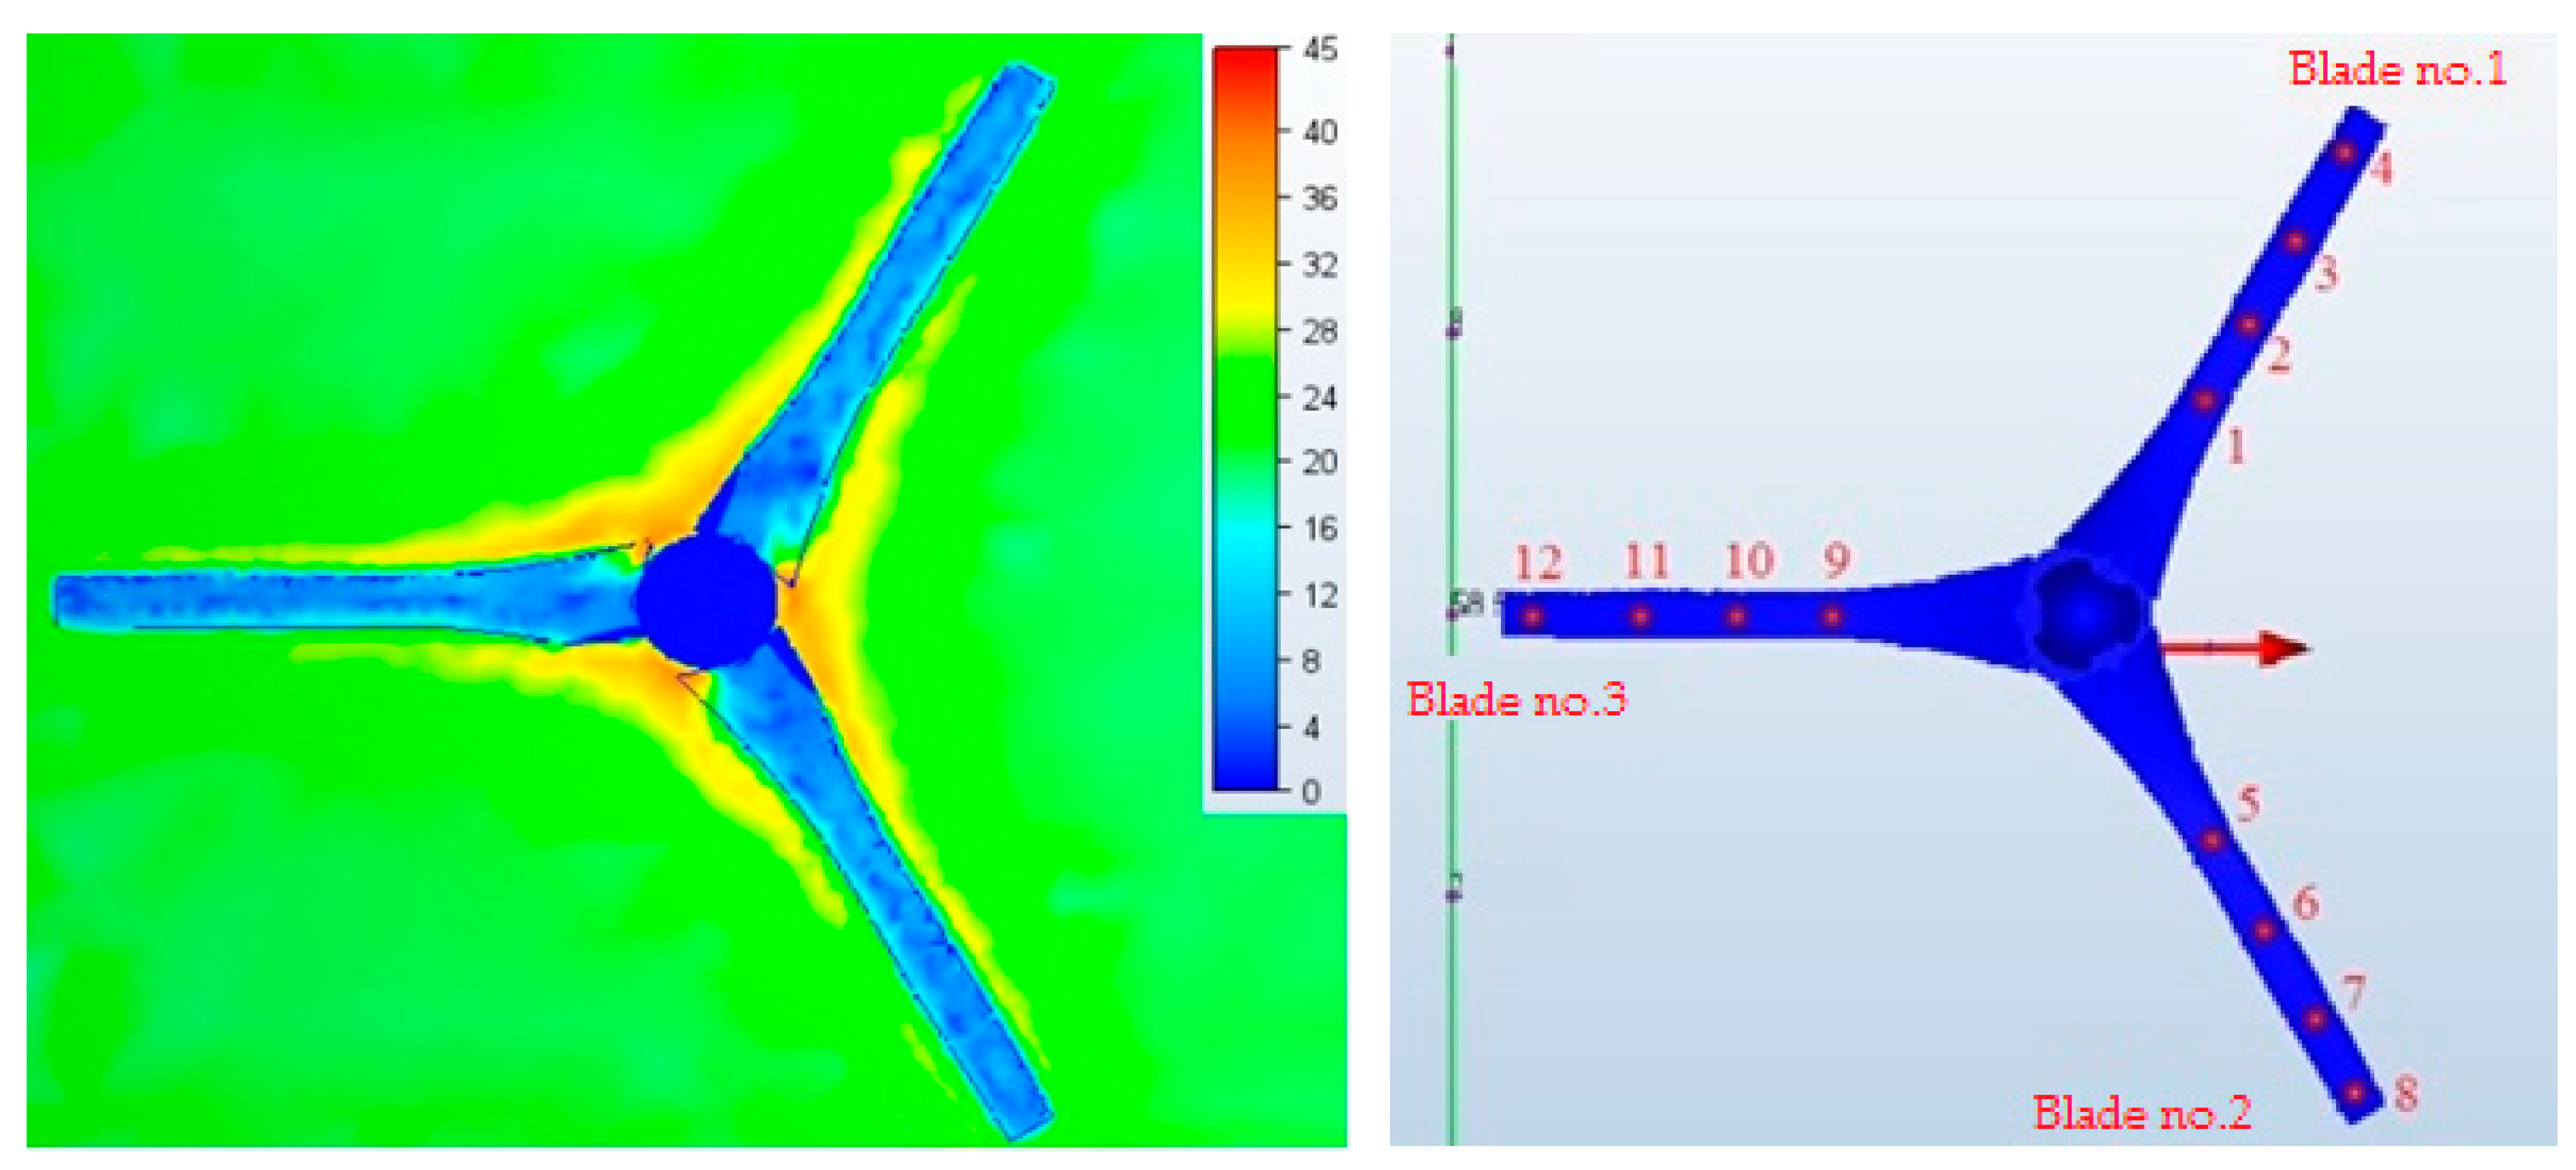
4. Results of the CFD Simulation
5. Discussion
6. Conclusions
Author Contributions
Funding
Conflicts of Interest
Nomenclature
| Acronym | Meaning | Units |
| AC | Alternating Current | - |
| BEMT | Blade Element Momentum Theory | - |
| CAD | Computer Aided Design | - |
| CFD | Computational Fluid Dynamics | - |
| Cp | Power Coefficient | - |
| CWHZ | Bowl convex in the center, with a hyperbolic disappearance of convexity at sites distant from the axis of rotation of the rotor | - |
| FEM | Finite Element Method | - |
| HAWT | Horizontal Axis Wind Turbine | - |
| LLT | Lifting Line Theory | - |
| μ | Dynamic viscosity | kg/m·s |
| p | Pressure | Pa |
| Pr | Prandtl number | - |
| PW | Bowl plano-convex | - |
| σ | Standard deviation | - |
| Re | Reynolds number | - |
| Rφ,i | Nodal residual at node i | - |
| ρ | Density of the air | kg·m−3 |
| TSR | Tip Speed Ratio | - |
| τ | Components of the stress tensor | - |
| u | Velocity component in x direction | m·s−1 |
| v | Velocity component in y direction | m·s−1 |
| VAWT | Vertical Axis Wind Turbine | - |
| w | Velocity component in z direction | m·s−1 |
References
- URE. Available online: www.ure.gov.pl (accessed on 4 February 2020).
- Kalvig, S.; Manger, E.; Hjertager, B. Comparing different CFD wind turbine modelling approaches with wind tunnel measurements. In Proceedings of the The Science of Making Torque from Wind, Oldenburg, Germany, 9–11 October 2012. [Google Scholar]
- Okeola, F.O.; Odebunmi, E.O.; Ameen, O.M.; Amoloye, M.A.; Lawal, A.A.; Abdulmumeen, A.G. A CFD Analysis of a Micro Horizontal Axis Wind Turbine Blade Aerodynamics. Arid Zone J. Eng. Technol. Environ. 2015, 11, 13–23. [Google Scholar]
- Cheng, C.Y.; Song, D.H.; Tsai, G.C. CFD Analysis and Blade Optimization of a Small Horizontal Axis Wind Turbine. Adv. Mat. Res. 2012, 591, 231–235. [Google Scholar] [CrossRef]
- Lee, M.H.; Shiah, Y.C.; Bai, C.J. Experiments and numerical simulations of the rotor-blade performance for a small-scale horizontal axis wind turbine. J. Wind Eng. Ind. Aerodyn. 2016, 149, 17–29. [Google Scholar] [CrossRef]
- Sudarsono, S.; Susastriawan, A.; Sugianto, S. Three-dimensional CFD Analysis of Performance of Small-scale Hawt based on Modified NACA-4415 Airfoil. Int. J. Technol. 2019, 10, 212. [Google Scholar] [CrossRef] [Green Version]
- Mezaal, N.A.; Osintsev, K.V.; Alyukov, S.V. The computational fluid dynamics performance analysis of horizontal axis wind turbine. Int. J. Power Electron. Drive Syst. 2019, 10, 1072–1080. [Google Scholar] [CrossRef]
- Maalawi, K.Y.; Badawy, M.T.S. A direct method for evaluating performance of horizontal axis wind turbines. Renew. Sustain. Energy Rev. 2001, 5, 175–190. [Google Scholar] [CrossRef]
- Xudong, W.; Shen, W.Z.; Zhu, W.J.; Sørensen, J.N.; Jin, C. Shape optimization of wind turbine blades. Wind Energy 2009, 12, 781–803. [Google Scholar] [CrossRef]
- Abdelrahman, M.A.; Abdellatif, O.E.; Moawed, M.; Eliwa, A.; Mišák, S. The CFD performance analysis for horizontal axis wind turbine with different blade shapes and tower effect. In Proceedings of the 16th International Scientific Conference on Electric Power Engineering (EPE), Kouty nad Desnou, Czech Republic, 20–22 May 2015; pp. 754–759. [Google Scholar]
- Khaled, M.; Ibrahim, M.M.; Hamed, H.E.A.; Gawad, A.F.A. Aerodynamic Design and Blade Angle Analysis of a Small Horizontal–Axis Wind Turbine. Am. J. Mod. Energy 2017, 3, 23–37. [Google Scholar] [CrossRef] [Green Version]
- Chandrala, M.; Choubey, A.; Gupta, B. Aerodynamic Analysis of Horizontal Axis Wind Turbine Blade. Int. J. Eng. Res. Appl. 2012, 3, 1244–1248. [Google Scholar]
- Yigit, C.; Durmaz, U. Wind Turbine Blade Design with Computational Fluid Dynamics Analysis. Int. J. Comput. Exp. Sci. Eng. 2017, 3, 44–49. [Google Scholar]
- Duquette, M.M.; Visser, K.D. Numerical Implications of Solidity and Blade Number on Rotor Performance of Horizontal-Axis Wind Turbines. J. Sol. Energy Eng. 2003, 125, 425–432. [Google Scholar] [CrossRef]
- Younas, M.F.; Ali, A.; Shafique, M.D. CFD Simulation of HAWT Blade and Implementation of BEM Theory. Sukkur IBA J. Emerg. Technol. 2019, 2, 21–35. [Google Scholar]
- Sayed, M.A.; Kandil, H.A.; Morgan, E.I. Dynamic stall analysis of horizontal-axis-wind-turbine blades using computational fluid dynamics. AIP Conf. Proc. 2012, 1440, 953. [Google Scholar]
- Congedo, P.M.; De Giorgi, M.G. Optimizing of a wind turbine rotor by CFD modeling. In Proceedings of the 2008 ANSYS Italian Conference: Inspiring Engineering and Sciences, Venice, Italy, 16–17 October 2008. [Google Scholar]
- Premalatha, P.; Rajakumar, S. Design of the small horizontal axis wind turbine blade with and without winglet. Int. J. Res. Sci. Technol. 2016, 6. [Google Scholar]
- Lanzafame, R.; Messina, M.M. Numerical and experimental analysis of micro HAWTs designed for wind tunnel applications. Int. J. Energy Environ. Eng. 2016, 7, 199–210. [Google Scholar] [CrossRef] [Green Version]
- Foster, E.; Contestabile, M.; Blazquez, J.; Manzano, B.; Workman, M.; Shah, N. The unstudied barriers to widespread renewable energy deployment: Fossil fuel price responses. Energy Policy 2017, 103, 258–264. [Google Scholar] [CrossRef]
- Browne, O.; Poletti, S.; Young, D. How does market power affect the impact of large scale wind investment in ’energy only’ wholesale electricity markets? Energ Policy 2015, 87, 17–27. [Google Scholar] [CrossRef]
- Wang, F.; Bai, L.; Fletcher, J.; Whiteford, J.; Cullen, D. The methodology for aerodynamic study on a small domestic wind turbine with scoop. J. Wind Eng. Ind. Aerodyn. 2008, 96, 1–24. [Google Scholar] [CrossRef] [Green Version]
- Queau, J.P.; Trompette, P. Optimal Shape Design of Turbine Blades. J. Vib. Acoust. Stress Reliab. 1983, 105, 444–448. [Google Scholar] [CrossRef]
- Anim-Mensah, S. The Optimum Design of a Wind Turbine Blade: In-depth View; Lap Lambert Academic Publishing: Saarbrücken, Germany, 2011. [Google Scholar]
- Brondsted, P.; Nijssen, R.P.L. Advances in Wind Turbine Blade Design and Materials, 1st ed.; Woodhead Publishing: Sawston, UK, 2013. [Google Scholar]
- Jureczko, K.; Pawlak, M.; Mężyk, A. Optimisation of wind turbine blades. J. Mater. Process. Technol. 2005, 167, 463–471. [Google Scholar] [CrossRef]
- Jeong, J.; Park, K.; Junand, S.; Lee, D.H. Design optimization of a wind turbine blade to reduce the fluctuating unsteady aerodynamic load in turbulent wind. J. Mech. Sci. Technol. 2012, 26, 827–838. [Google Scholar] [CrossRef]
- Canale, T.; Ismail, K.A.R.; Lino, F.A.M.; Arabkoohsar, A. Comparative Study of New Airfoils for Small Horizontal Axis Wind Turbines. J. Sol. Energy Eng. 2020, 142. [Google Scholar] [CrossRef]
- Duz, H.; Yildiz, S. Numerical Performance Analyses of Different Airfoils for Use in Wind Turbines. Int. J. Renew. Energy Dev. 2018, 7, 151–157. [Google Scholar] [CrossRef]
- NASA. Available online: www.grc.nasa.gov (accessed on 1 April 2020).
- Sanderse, B.; Van der Pijl, S.P.; Koren, B. Review of CFD for wind-turbine wake aerodynamics. Phys. Rev. Lett. 2010, 1, 1–28. [Google Scholar]


| Set Wind Speed vz (m/s) | Blade No. | Point No. | Base Model | PW Model | CWHZ Model | |||
|---|---|---|---|---|---|---|---|---|
| Wind Speed at the Point v (m/s) | v/vz (%) | Wind Speed at the Point v (m/s) | v/vz (%) | Wind Speed at the Point v (m/s) | v/vz (%) | |||
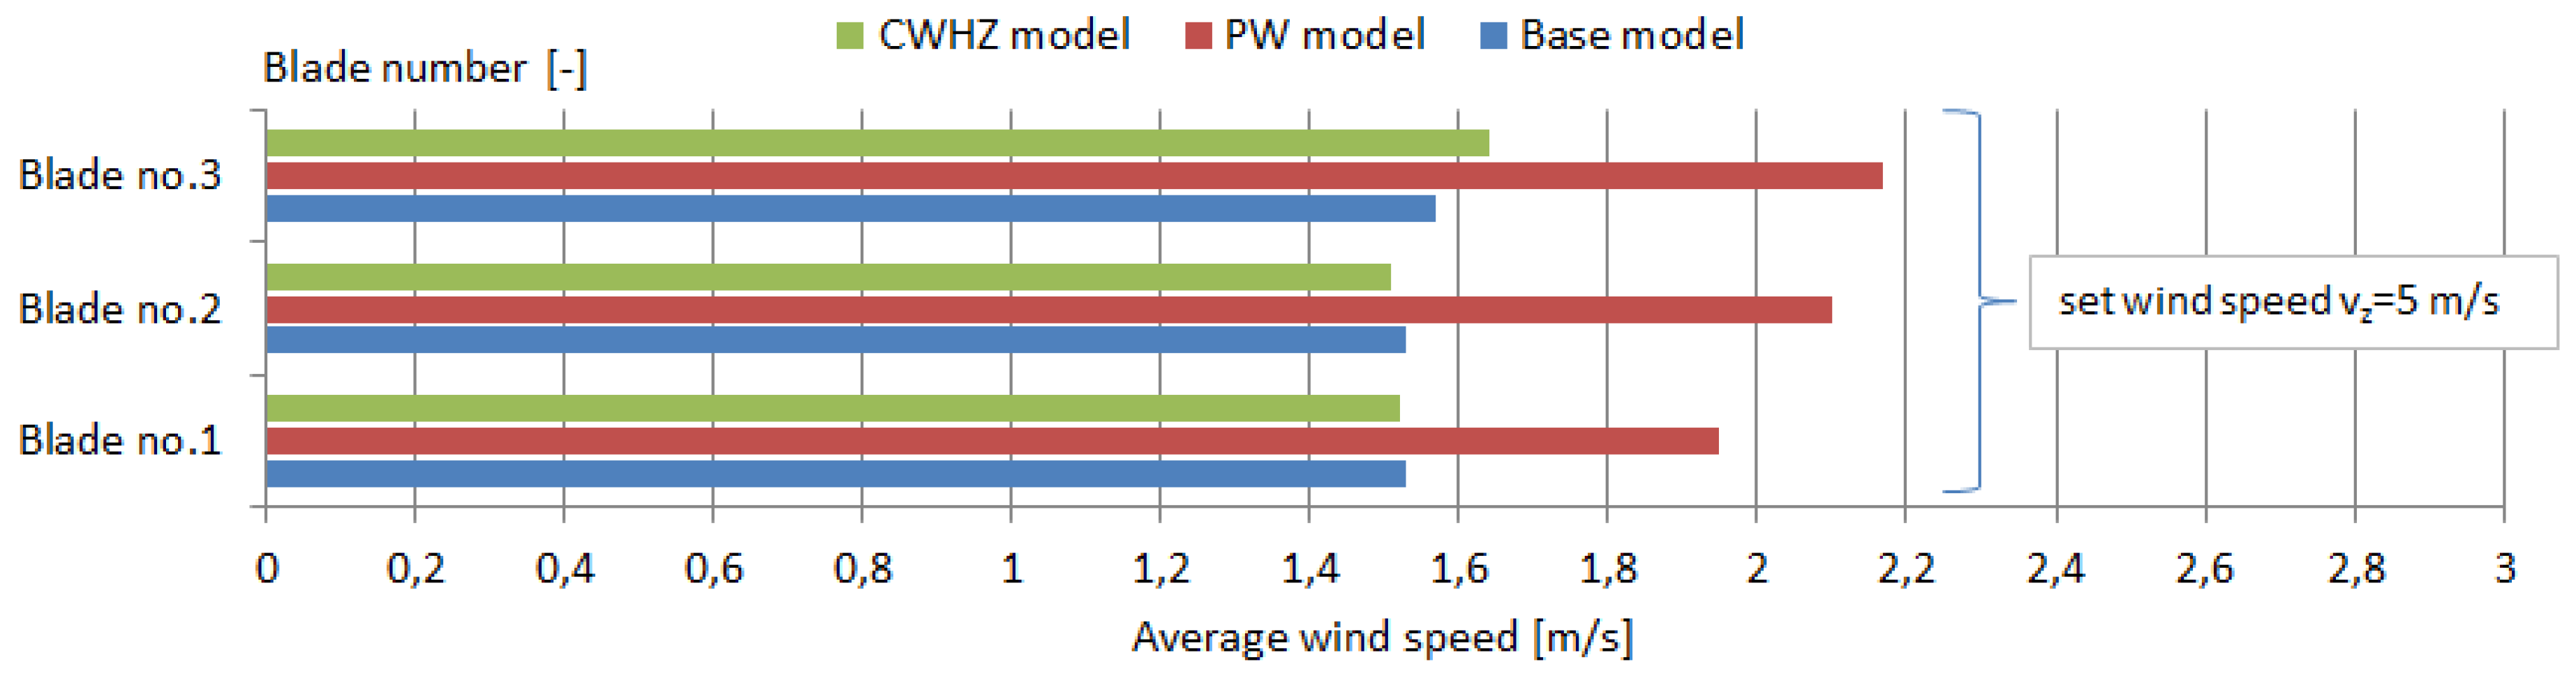
| 5 | 1 | 1 | 1.45 | 29.00 | 2.13 | 42.60 | 2.15 | 43.00 |
| 2 | 1.60 | 32.00 | 1.98 | 39.60 | 1.53 | 30.60 | ||
| 3 | 1.42 | 28.40 | 1.70 | 34.00 | 1.28 | 25.60 | ||
| 4 | 1.66 | 33.20 | 2.00 | 40.00 | 1.11 | 22.20 | ||
| Average | 1.53 | 30.65 | 1.95 | 39.05 | 1.52 | 30.35 | ||
| σ | 0.10 | - | 0.16 | - | 0.39 | - | ||
| 2 | 5 | 1.64 | 32.80 | 2.49 | 49.80 | 2.25 | 45.00 | |
| 6 | 1.36 | 27.20 | 2.15 | 43.00 | 1.55 | 31.00 | ||
| 7 | 1.50 | 30.00 | 1.66 | 33.20 | 0.95 | 19.00 | ||
| 8 | 1.62 | 32.40 | 2.09 | 41.80 | 1.29 | 25.80 | ||
| Average | 1.53 | 30.60 | 2.10 | 41.95 | 1.51 | 30.20 | ||
| σ | 0.11 | - | 0.30 | - | 0.48 | - | ||
| 3 | 9 | 1.69 | 33.80 | 2.61 | 52.20 | 2.34 | 46.80 | |
| 10 | 1.57 | 31.40 | 2.32 | 46.40 | 1.80 | 36.00 | ||
| 11 | 1.70 | 34.00 | 1.94 | 38.80 | 1.27 | 25.40 | ||
| 12 | 1.30 | 26.00 | 1.88 | 37.60 | 1.14 | 22.80 | ||
| Average | 1.57 | 31.30 | 2.17 | 43.75 | 1.64 | 30.75 | ||
| σ | 0.16 | - | 0.30 | - | 0.47 | - | ||
| Set Wind Speed vz (m/s) | Blade No. | Point No. | Base Model | PW Model | CWHZ Model | |||
|---|---|---|---|---|---|---|---|---|
| Wind Speed at the Point v (m/s) | v/vz (%) | Wind Speed at the Point v (m/s) | v/vz (%) | Wind Speed at the Point v (m/s) | v/vz (%) | |||
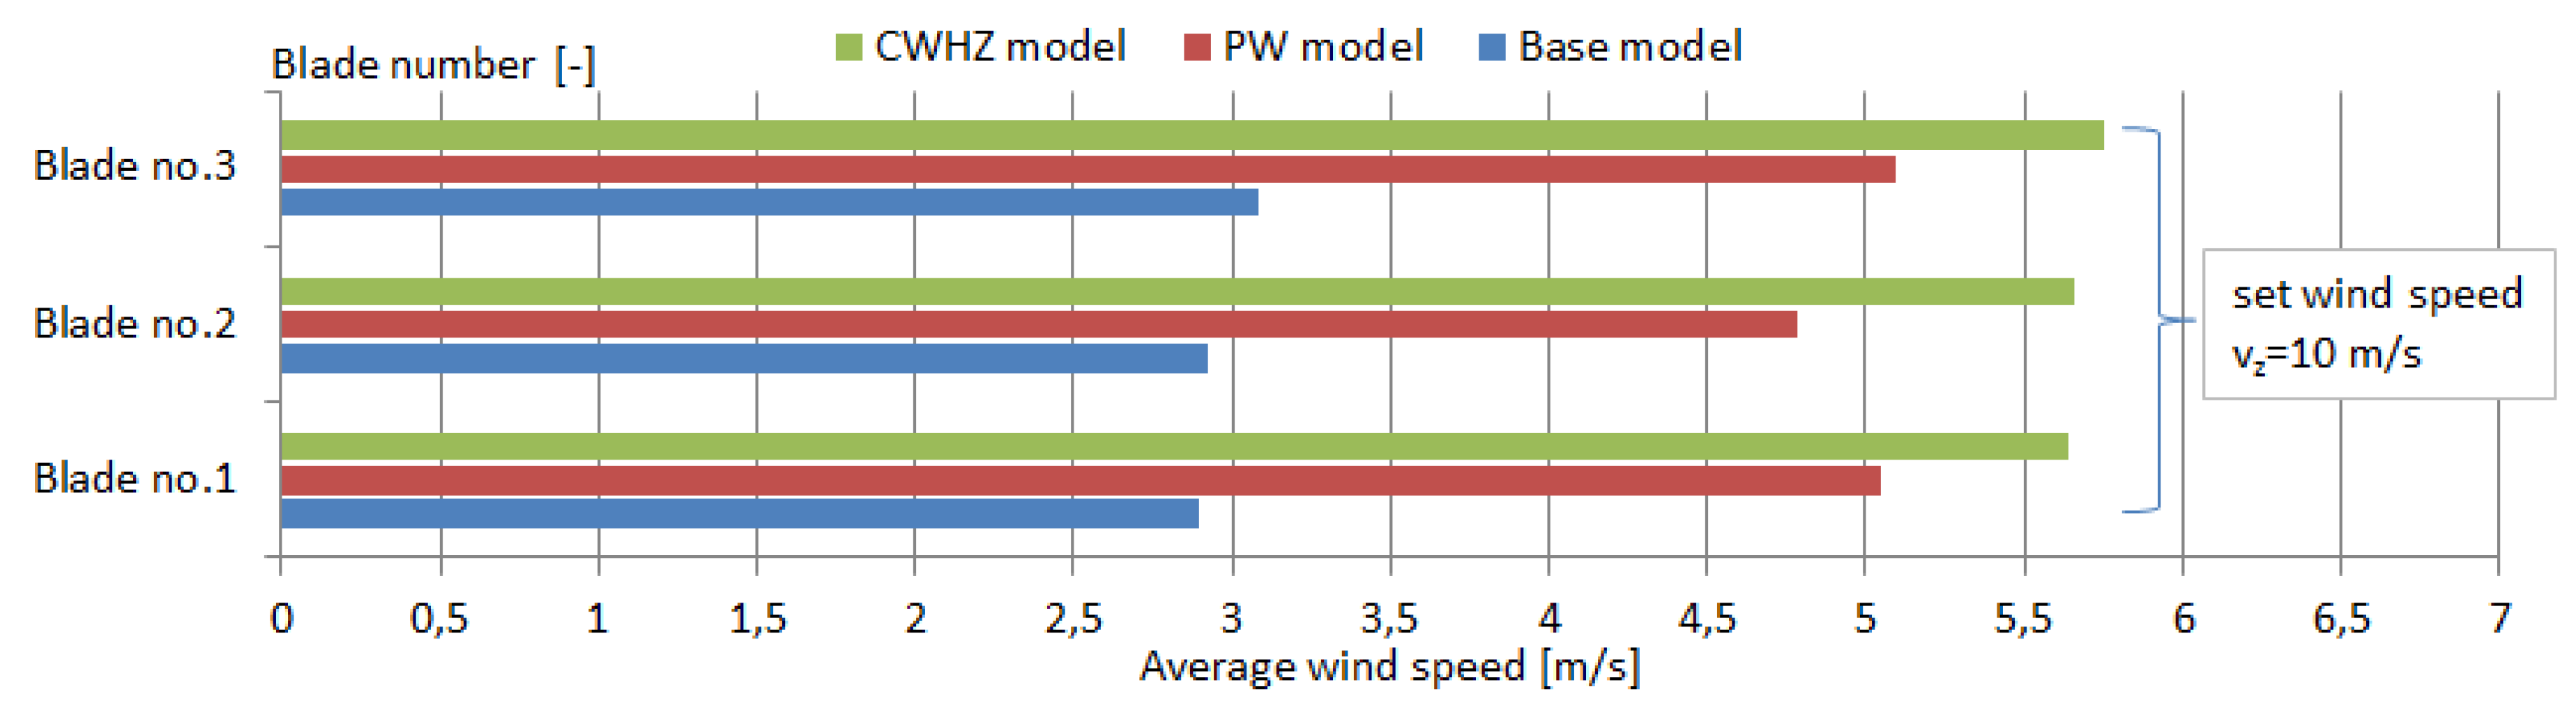
| 10 | 1 | 1 | 2.60 | 26.00 | 5.13 | 51.30 | 6.57 | 65.70 |
| 2 | 2.82 | 28.20 | 6.59 | 65.90 | 5.99 | 59.90 | ||
| 3 | 2.71 | 27.10 | 4.36 | 43.60 | 4.87 | 48.70 | ||
| 4 | 3.45 | 34.50 | 4.11 | 41.10 | 5.14 | 51.40 | ||
| Average | 2.90 | 28.95 | 5.05 | 50.48 | 5.64 | 56.63 | ||
| σ | 0.33 | - | 0.97 | - | 0.71 | - | ||
| 2 | 5 | 2.66 | 26.60 | 4.89 | 48.90 | 6.67 | 66.70 | |
| 6 | 2.59 | 25.90 | 6.68 | 66.80 | 5.34 | 53.40 | ||
| 7 | 3.01 | 30.10 | 3.89 | 38.90 | 5.25 | 52.50 | ||
| 8 | 3.42 | 34.20 | 3.66 | 36.60 | 5.39 | 53.90 | ||
| Average | 2.92 | 29.20 | 4.78 | 47.80 | 5.66 | 56.43 | ||
| σ | 0.33 | - | 1.19 | - | 0.58 | - | ||
| 3 | 9 | 3.08 | 30.80 | 5.33 | 53.30 | 7.65 | 76.50 | |
| 10 | 3.28 | 32.80 | 6.13 | 61.30 | 5.96 | 59.60 | ||
| 11 | 3.21 | 32.10 | 5.02 | 50.20 | 4.36 | 43.60 | ||
| 12 | 2.73 | 27.30 | 3.89 | 38.90 | 5.04 | 50.40 | ||
| Average | 3.08 | 30.75 | 5.09 | 50.93 | 5.75 | 57.53 | ||
| σ | 0.21 | - | 0.80 | - | 1.23 | - | ||
| Set Wind Speed vz (m/s) | Blade No. | Point No. | Base Model | PW Model | CWHZ Model | |||
|---|---|---|---|---|---|---|---|---|
| Wind Speed at the Point v (m/s) | v/vz (%) | Wind Speed at the Point v (m/s) | v/vz (%) | Wind Speed at the Point v (m/s) | v/vz (%) | |||
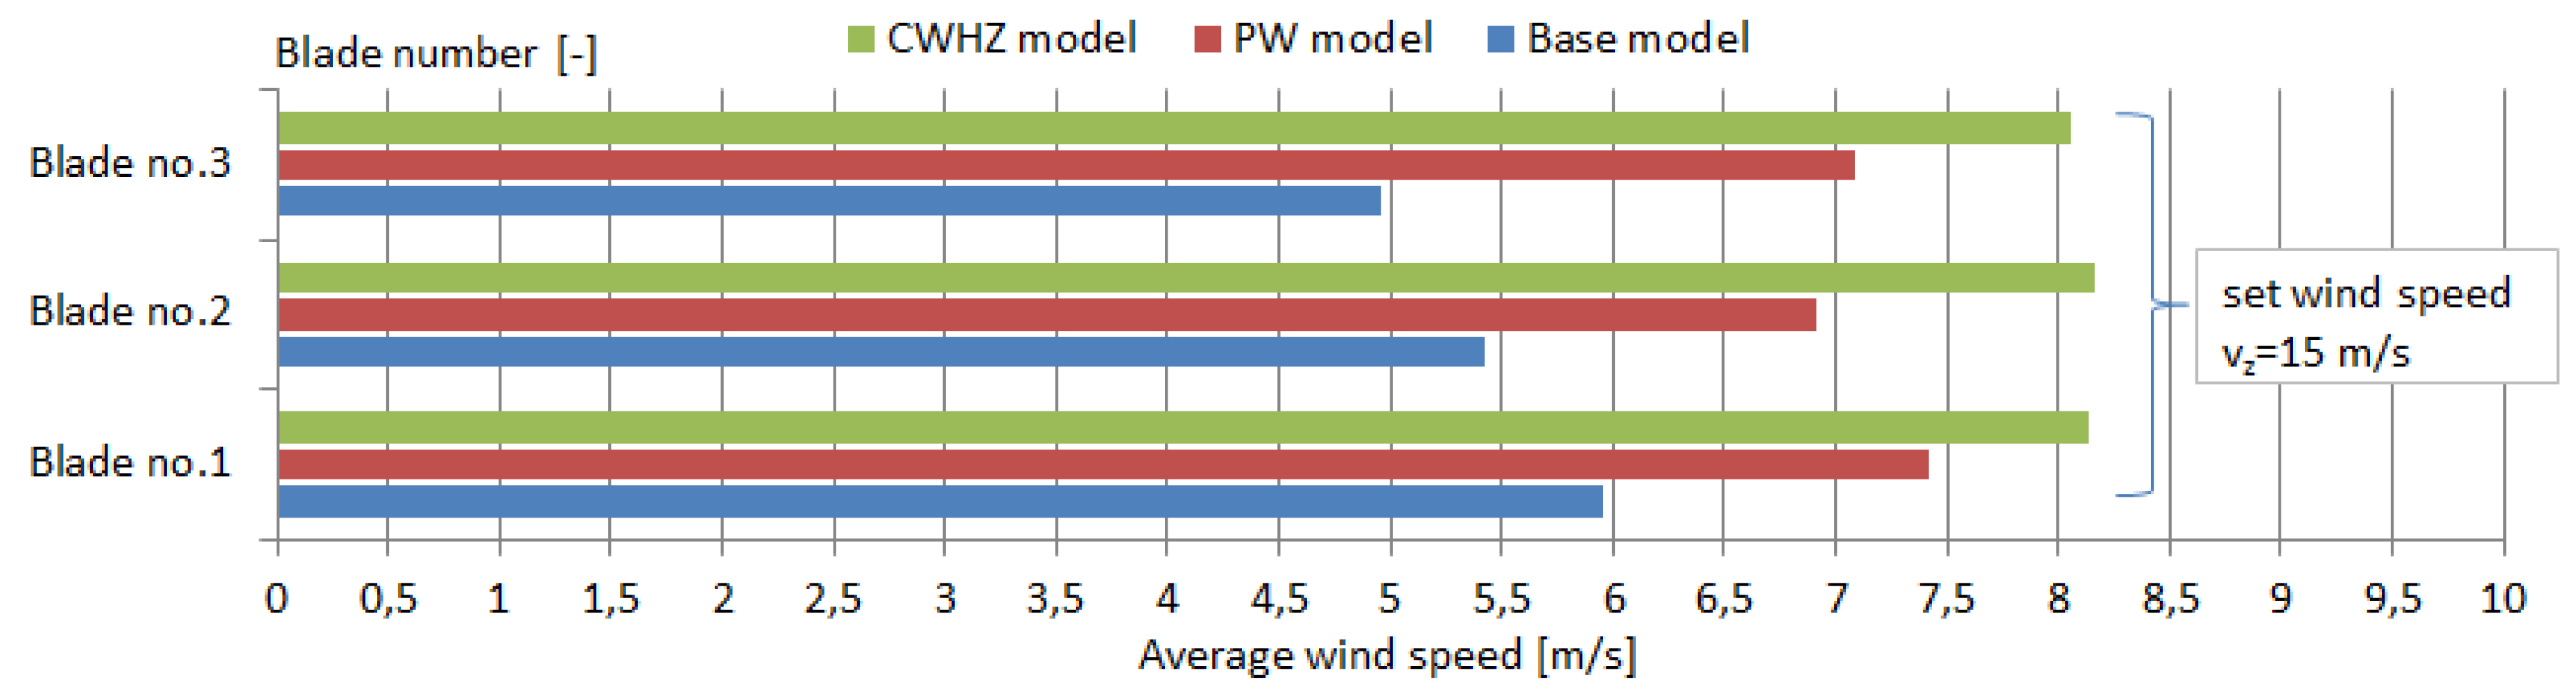
| 15 | 1 | 1 | 7.03 | 46.87 | 8.31 | 55.40 | 10.08 | 67.20 |
| 2 | 4.60 | 30.67 | 8.30 | 55.33 | 8.04 | 53.60 | ||
| 3 | 4.49 | 29.93 | 5.84 | 38.93 | 7.18 | 47.87 | ||
| 4 | 7.68 | 51.20 | 7.21 | 48.07 | 7.26 | 48.40 | ||
| Average | 5.95 | 39.67 | 7.42 | 49.43 | 8.14 | 54.27 | ||
| σ | 1.42 | - | 1.01 | - | 1.17 | - | ||
| 2 | 5 | 6.66 | 44.40 | 6.69 | 44.60 | 9.85 | 65.67 | |
| 6 | 4.35 | 29.00 | 7.78 | 51.87 | 7.31 | 48.73 | ||
| 7 | 5.80 | 38.67 | 7.10 | 47.33 | 7.46 | 49.73 | ||
| 8 | 4.86 | 32.40 | 6.06 | 40.40 | 8.02 | 53.47 | ||
| Average | 5.42 | 39.12 | 6.91 | 46.05 | 8.16 | 54.4 | ||
| σ | 0.89 | - | 0.63 | - | 1.01 | - | ||
| 3 | 9 | 4.84 | 32.27 | 8.63 | 57.53 | 10.87 | 72.47 | |
| 10 | 6.38 | 42.53 | 7.51 | 50.07 | 8.04 | 53.60 | ||
| 11 | 4.32 | 28.80 | 6.55 | 43.67 | 5.79 | 38.60 | ||
| 12 | 4.30 | 28.67 | 5.64 | 37.60 | 7.53 | 50.20 | ||
| Average | 4.96 | 33.07 | 7.08 | 47.22 | 8.06 | 53.72 | ||
| σ | 0.85 | - | 1.11 | - | 1.83 | - | ||
| Set Wind Speed vz (m/s) | Blade No. | Point No. | Base Model | PW Model | CWHZ Model | |||
|---|---|---|---|---|---|---|---|---|
| Wind Speed at the Point v (m/s) | v/vz (%) | Wind Speed at the Point v (m/s) | v/vz (%) | Wind Speed at the Point v (m/s) | v/vz (%) | |||
| 20 | 1 | 1 | 9.17 | 45.85 | 10.90 | 54.50 | 13.46 | 67.30 |
| 2 | 4.99 | 24.95 | 10.44 | 52.20 | 10.88 | 54.40 | ||
| 3 | 5.96 | 29.80 | 8.51 | 42.55 | 9.83 | 49.15 | ||
| 4 | 9.08 | 45.40 | 10.29 | 51.45 | 9.66 | 48.30 | ||
| Average | 7.30 | 36.50 | 10.04 | 50.18 | 10.96 | 54.79 | ||
| σ | 1.86 | - | 0.91 | - | 1.52 | - | ||
| 2 | 5 | 8.65 | 43.25 | 10.91 | 54.55 | 13.00 | 65.00 | |
| 6 | 5.40 | 27.00 | 9.77 | 48.85 | 9.94 | 49.70 | ||
| 7 | 7.30 | 36.50 | 9.38 | 46.90 | 10.64 | 53.20 | ||
| 8 | 5.61 | 28.05 | 8.78 | 43.90 | 10.37 | 51.85 | ||
| Average | 6.74 | 33.70 | 9.71 | 48.55 | 10.99 | 54.94 | ||
| σ | 1.33 | - | 0.78 | - | 1.19 | - | ||
| 3 | 9 | 6.51 | 32.55 | 12.72 | 63.60 | 14.58 | 72.90 | |
| 10 | 7.92 | 39.60 | 9.50 | 47.50 | 11.10 | 55.50 | ||
| 11 | 4.96 | 24.80 | 7.71 | 38.55 | 7.56 | 37.80 | ||
| 12 | 4.58 | 22.90 | 8.75 | 43.75 | 10.07 | 50.35 | ||
| Average | 5.99 | 29.96 | 9.67 | 48.35 | 10.83 | 54.14 | ||
| σ | 1.33 | - | 1.87 | - | 2.52 | - | ||
| Set Wind Speed vz (m/s) | Blade No. | Point No. | Base Model | PW Model | CWHZ Model | |||
|---|---|---|---|---|---|---|---|---|
| Wind Speed at the Point v (m/s) | v/vz (%) | Wind Speed at the Point v (m/s) | v/vz (%) | Wind Speed at the Point v (m/s) | v/vz (%) | |||
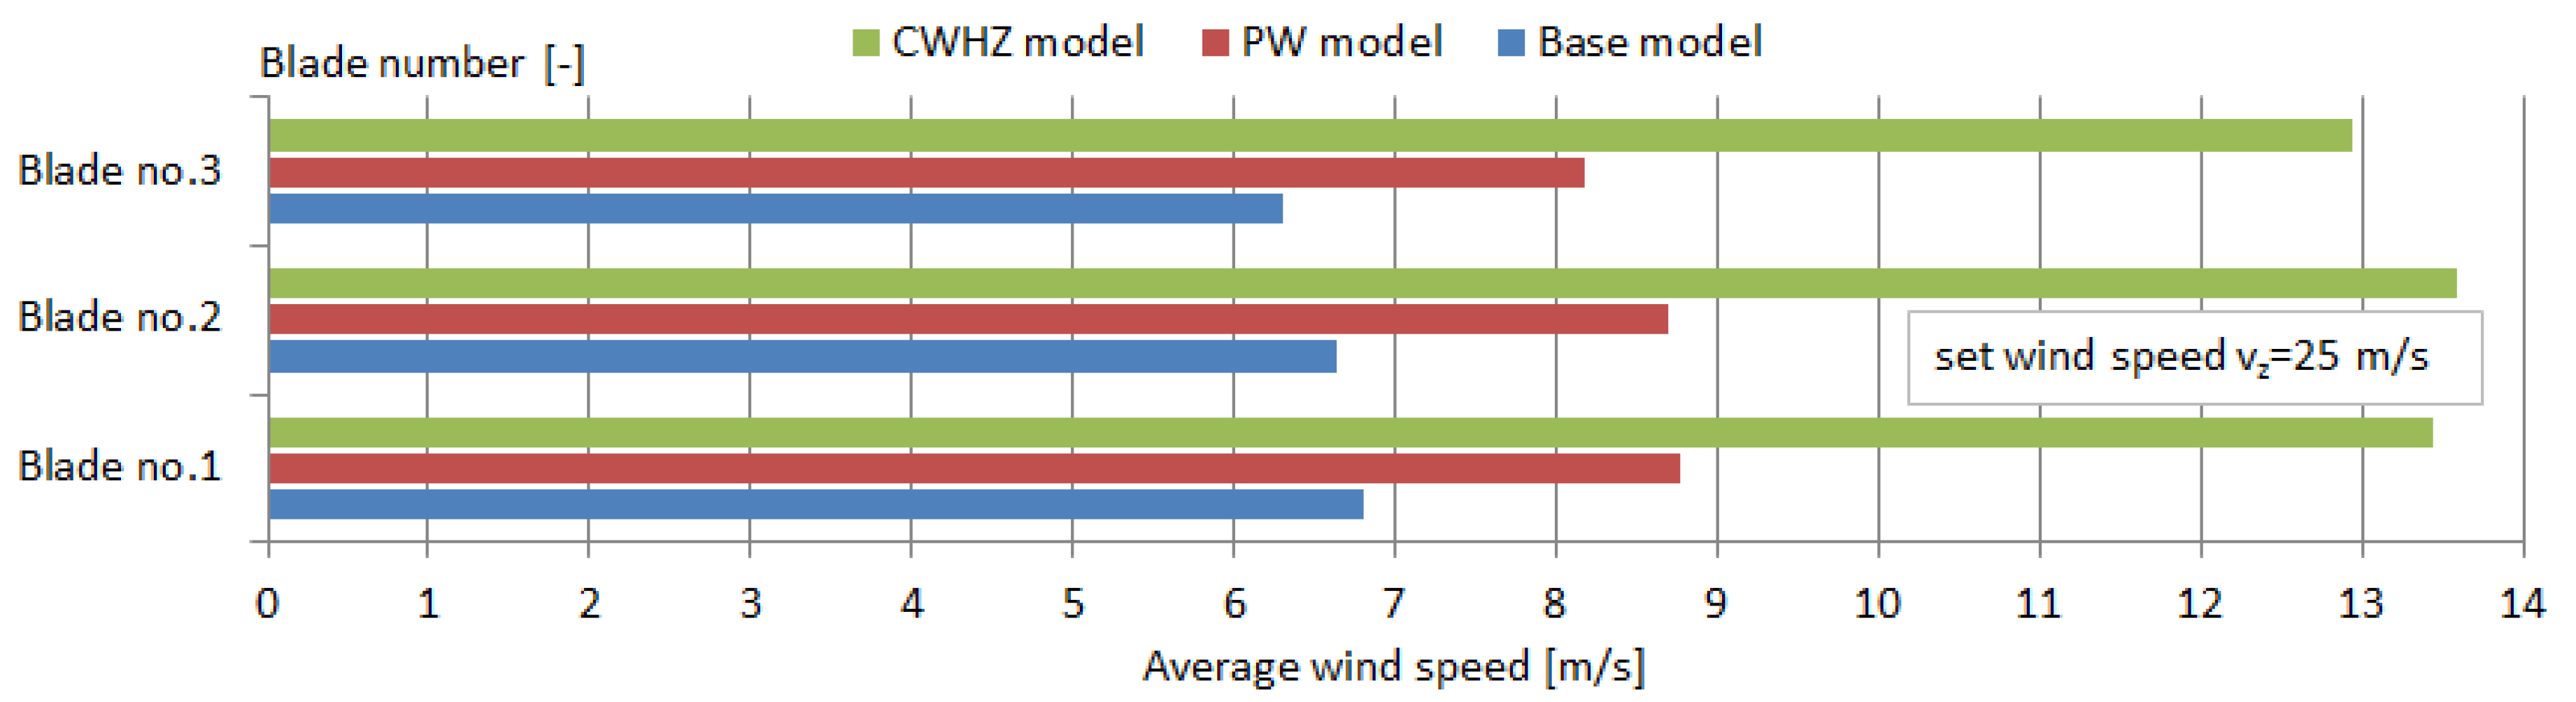
| 25 | 1 | 1 | 8.13 | 32.52 | 8.96 | 35.84 | 16.58 | 66.32 |
| 2 | 4.88 | 19.52 | 8.73 | 34.92 | 13.39 | 53.56 | ||
| 3 | 5.34 | 21.36 | 7.29 | 29.16 | 12.38 | 49.52 | ||
| 4 | 8.89 | 35.56 | 10.08 | 40.32 | 11.39 | 45.56 | ||
| Average | 6.81 | 27.24 | 8.77 | 35.06 | 13.44 | 53.74 | ||
| σ | 1.73 | - | 3.94 | - | 1.95 | - | ||
| 2 | 5 | 7.44 | 29.76 | 9.33 | 37.32 | 15.95 | 63.80 | |
| 6 | 5.64 | 22.56 | 8.30 | 33.20 | 12.79 | 51.16 | ||
| 7 | 6.73 | 26.92 | 8.38 | 33.52 | 13.24 | 52.96 | ||
| 8 | 6.75 | 27.00 | 8.75 | 35.00 | 12.32 | 49.28 | ||
| Average | 6.64 | 26.56 | 8.69 | 34.76 | 13.58 | 54.30 | ||
| σ | 0.64 | - | 0.41 | - | 1.41 | - | ||
| 3 | 9 | 6.63 | 26.52 | 9.89 | 39.56 | 17.48 | 69.92 | |
| 10 | 7.49 | 29.96 | 7.57 | 30.28 | 13.41 | 53.64 | ||
| 11 | 5.55 | 22.20 | 6.91 | 27.64 | 8.66 | 34.64 | ||
| 12 | 5.52 | 22.08 | 8.35 | 33.40 | 12.17 | 48.68 | ||
| Average | 6.30 | 25.19 | 8.18 | 32.72 | 12.93 | 51.72 | ||
| σ | 0.82 | - | 1.11 | - | 3.15 | - | ||
© 2020 by the authors. Licensee MDPI, Basel, Switzerland. This article is an open access article distributed under the terms and conditions of the Creative Commons Attribution (CC BY) license (http://creativecommons.org/licenses/by/4.0/).
Share and Cite
Bugała, A.; Roszyk, O. Investigation of an Innovative Rotor Modification for a Small-Scale Horizontal Axis Wind Turbine. Energies 2020, 13, 2649. https://doi.org/10.3390/en13102649
Bugała A, Roszyk O. Investigation of an Innovative Rotor Modification for a Small-Scale Horizontal Axis Wind Turbine. Energies. 2020; 13(10):2649. https://doi.org/10.3390/en13102649
Chicago/Turabian StyleBugała, Artur, and Olga Roszyk. 2020. "Investigation of an Innovative Rotor Modification for a Small-Scale Horizontal Axis Wind Turbine" Energies 13, no. 10: 2649. https://doi.org/10.3390/en13102649