Article

Analysis of Internal Overvoltages in Transformer Windings during Transients in Electrical Networks

Power Electrical Engineering Division, AGH University of Science and Technology, al. Mickiewicza 30, 30-059 Kraków, Poland
*
Author to whom correspondence should be addressed.
Energies 2020, 13(10), 2644; https://doi.org/10.3390/en13102644
Submission received: 30 March 2020 / Revised: 15 May 2020 / Accepted: 19 May 2020 / Published: 22 May 2020
(This article belongs to the Special Issue Electric Distribution System Modeling and Analysis)

Abstract

:
Due to the increasing requirements for the reliability of electrical power supply and associated apparatus, it is necessary to provide a detailed analysis of the overvoltage risk of power transformer insulation systems and equipment connected to their terminals. Exposure of transformer windings to overvoltages is the result of the propagation condition of electromagnetic waves in electrical networks and transformer windings. An analysis of transformer winding responses to transients in power systems is of particular importance, especially when protection against surges by typical overvoltage protection systems is applied. The analysis of internal overvoltages in transformers during a typical transient related to switching operations and selected failures is of great importance, particularly to assess the overvoltage exposure of insulation systems in operating conditions. The random nature of overvoltage phenomena in electrical networks implies the usage of computer simulations for the analysis of overvoltage exposures of electrical devices in operation. This article presents the analysis of the impact of transient phenomena in a model of a medium-voltage electrical network during switching operations and ground faults on overvoltages in the internal insulation systems of transformer windings. The basis of the analysis is simulations of overvoltages in the windings, made in the Electromagnetic Transients Program/Alternative Transients Program (EMTP/ATP) using a model with lumped parameters of transformer windings. The analysis covers the impact of the cable line length and the ground fault resistance value on internal overvoltage distributions.

Graphical Abstract

1. Introduction

An analysis of insulation system overvoltage exposure and overvoltage protection effectiveness is of high importance. The need for such analyses is reinforced by the constant increase in the requirements of electrical network reliability. The most common structure which can be distinguished in the power system topology is a series connection. In this kind of topology, the weakest element determines the overall reliability of the system. Due to the lumped character of a power transformer, its reliability is one of the most important components in the power system structure. Analysis of the most common failures in a power transformer shows that more than one-third of cases are associated with a dielectric failure of insulation systems [1]. The internal winding transient’s waveforms and their maximal values are related to the overvoltages at the transformer terminal and transient phenomena inside the windings [2,3,4,5,6,7]. Transients in power systems have two origins: first, an external energy injection, such as atmospheric lightning; and, second, internal system events, such as switching operations, faults, and resonance events [8,9]. The main mechanism behind transients is the interruption to the steady-state of a network. This process can happen in an intended way, such as in switching and reconfiguration of a network topology, or due to an unpredicted event, such as due to faults, emergency trips, or lightning strikes. During this process, the parameters of the object in the electrical network determine the parameters of overvoltages. A lightning strike is a natural atmospheric phenomenon, assumed as a current impulse, providing fast transients in power systems. These transients are characterized by high slopes and high maximal values exceeding by several times the nominal voltage. Protection against lightning strikes is made by lightning protection wires in overhead lines or special spires in air-insulated substations [10,11]. The interaction between the power system components is mainly imposed by the network topology, surge impedance of transmission lines, power equipment, and electromagnetic wave velocity. In certain electrical network topologies, overvoltages at the power transformer terminals magnify their values and expose internal insulation systems with overvoltages above the nominal values. The literature [3,4] shows the causes and effects of power transformers’ failures caused by overvoltages propagated in a power system network. The strong influence of the overvoltage phenomena in transformers impacts the interaction between a transformer and power systems, which was reported by CIGRE WG A2/C4.39 [4,12]. The consequence of the critical network topology caused by the interaction between network components can be an increase of voltage inside the transformer windings as a result of the resonance phenomena. Resonance can occur when the main frequency component of overvoltage at the transformer terminals matches the resonant frequency of windings. The common cases in which resonance can occur are the switching of a circuit breaker or ground faults at a feeding power line. During these events, the transient voltage appearing in the network contains oscillating components whose frequencies depend on the propagation condition in power lines, the length of lines, and power transformer electrical parameters. The calculation of natural frequencies in the electrical network–power line–power transformer system during the fast transient (FT) and very fast transient (VFT) events assumes that power transformers can be represented as a lumped equivalent capacitance CT. Assuming that in a cable line with surge impedance Zk power loses are neglected, the frequency of oscillating waves in the electrical network–cable line–power transformer system can be calculated according to [13,14]:
f = v 4 l k [ 1 2 π arctan ( 2 π f C T Z k ) ]
where v is the velocity of voltage wave in the cable line (ms–1), and lk is the length of cable line connected to transformer terminals (m).
Equation (1) shows that increasing the fCTZk component causes a decrease of the oscillation frequency of the analyzed system in comparison with a similar system with a no-load cable line; its frequency is equal to:
f 4 t = 1 4 t = v 4 l k
where: t—time in which EM wave reaches the end of the cable, s.
The frequency of the voltage wave f in relation to f4t is determined by the length of the cable line. The shorter a cable line, the higher the natural frequency in the transient overvoltage; thus, a shorter lines’ frequency is more sensitive to the length variation. Many research centers have analyzed the impact of a circuit breaker switching on transient overvoltages appearing in the system of an underground cable and power transformer [3,13,14,15]. This setup is used for the connection of an offshore wind park [16,17,18], and the main focus of the analysis is on the overvoltages at the transformer terminals. Unfortunately, the knowledge of overvoltages at the transformer terminals is insufficient for an analysis of the winding’s internal overvoltages. The analysis of the overvoltage distributions inside of a transformer winding during overvoltages at the transformer terminals can be conducted with an additional calculation based on a detailed high-frequency winding model and overvoltage measurements [19,20,21]. Internal overvoltages can differ from the overvoltages at the initial parts of the windings. The internal overvoltages are a result of the response of the winding circuit, which has a complex structure. Its structure reflects the geometry, material properties, and capacitive and inductive couplings between every element in the power transformer. The testing of power transformers can also stress the internal insulation of the power transformer [7].
One example of an unpredicted events in a power system is a ground fault. Faults can provide high overcurrent transients in the circuit depending on the network topology and the type of fault [8]. A second example of undesirable transients are voltage oscillations traveling along the conductors. The parameters of the overvoltages during the fault are related to the type of fault and the grid parameters. A metallic short circuit can occur after electrical isolation is broken by a sharp-edged cut. This type of a fault is characterized by a low-ohmic connection between grounded elements and the conductor. The attenuation of the wave produced during a low-ohmic fault is low. The second type of ground fault is related to the dielectric breakdown of insulation caused by electrical and thermal aging, constant degradation of the insulation system, or by impurities on the conductor’s surface or inside the dielectric. The second type of ground fault is characterized by high impedance between the conductor and its grounded surroundings, which is at the beginning of the breakdown process.
The overvoltage distribution in a transformer winding has three main physical mechanisms [22]. The first is related to low transients, which depend on the relationship of inductances with resistances of the winding. This is mostly connected with the properties of the magnetic core and topology of the winding. The frequency characteristics show that this distribution mechanism occurs up to several kilohertz and the distribution has a linear relationship. The second mechanism of the overvoltage distribution is related to longitudinal and ground capacitances of the winding. These parameters are related to the dielectric properties of the insulation system and winding geometry. The second mechanism is related to the phenomena of fast transients, very fast transients, and initial overvoltage distribution. The initial overvoltage distribution is usually a nonlinear curve based on nonlinear capacitance distribution in the winding. Several popular techniques, such as the addition of screens or the use of interlaced windings, are used for uniformization of the capacitance distribution. The third mechanism of the overvoltage distribution is related to the resonance phenomena and is unpredictable at the design stage of a transformer. Resonance distribution is related to the RLCM parameters of the winding and can be harmful to the insulation system of the power transformer. During the resonance, overvoltages appearing inside the transformer winding usually have a nonlinear distribution. Maximal values exceed the nominal values, and the amplification of the overvoltages in the middle part of the winding in comparison to the overvoltage at full winding is common.
The basis for the analysis of internal insulation overvoltage stresses for in-service transformers is the overvoltage waveform measurements at selected points of the windings. Undertaking internal overvoltage measurements in transformer windings during the transformer’s operation is almost impossible due to the mechanical interference of the insulation system, the random process of overvoltage generation, and high maximal voltage values during resonance. This constraint implies the use of computer simulation results as a basis for the winding internal overvoltage analysis. The authors of the paper [23,24] present the simulation analysis of the internal distribution of overvoltages caused by a lightning strike. The quality of the simulation results is dominated by the implemented mathematical models of power objects used in the analysis. A model suitable for internal overvoltage analysis should behave like models used for fast transient (FT) analysis. FT transformer models should take in to account the wideband behavior of the windings and high-frequency phenomena, such as the skin effect in conductors and the “lack” of a silicon steel magnetic core. High importance should be placed on the analysis of overvoltage stress while the transformer terminals are protected with surge protective devices (SPD) such as metal oxide varistors (MOVs).
This article presents the analysis of the internal overvoltages in power transformer windings caused by selected switching operations of a circuit breaker and failure states in electrical networks. The basis for the analysis was simulation results of internal overvoltages performed in the Electromagnetic Transients Program/Alternative Transients Program (EMTP/ATP) [25]. The developed power transformer model has lumped parameters. The results obtained with the model were verified by laboratory measurements. This model can be implemented in a model of an electrical power network for the analysis of overvoltages at selected points inside the winding during selected events. The simulations covered cases with energization of a cable line–power transformer system, and single-phase ground faults.
The main contributions of this paper are the following:
(1)
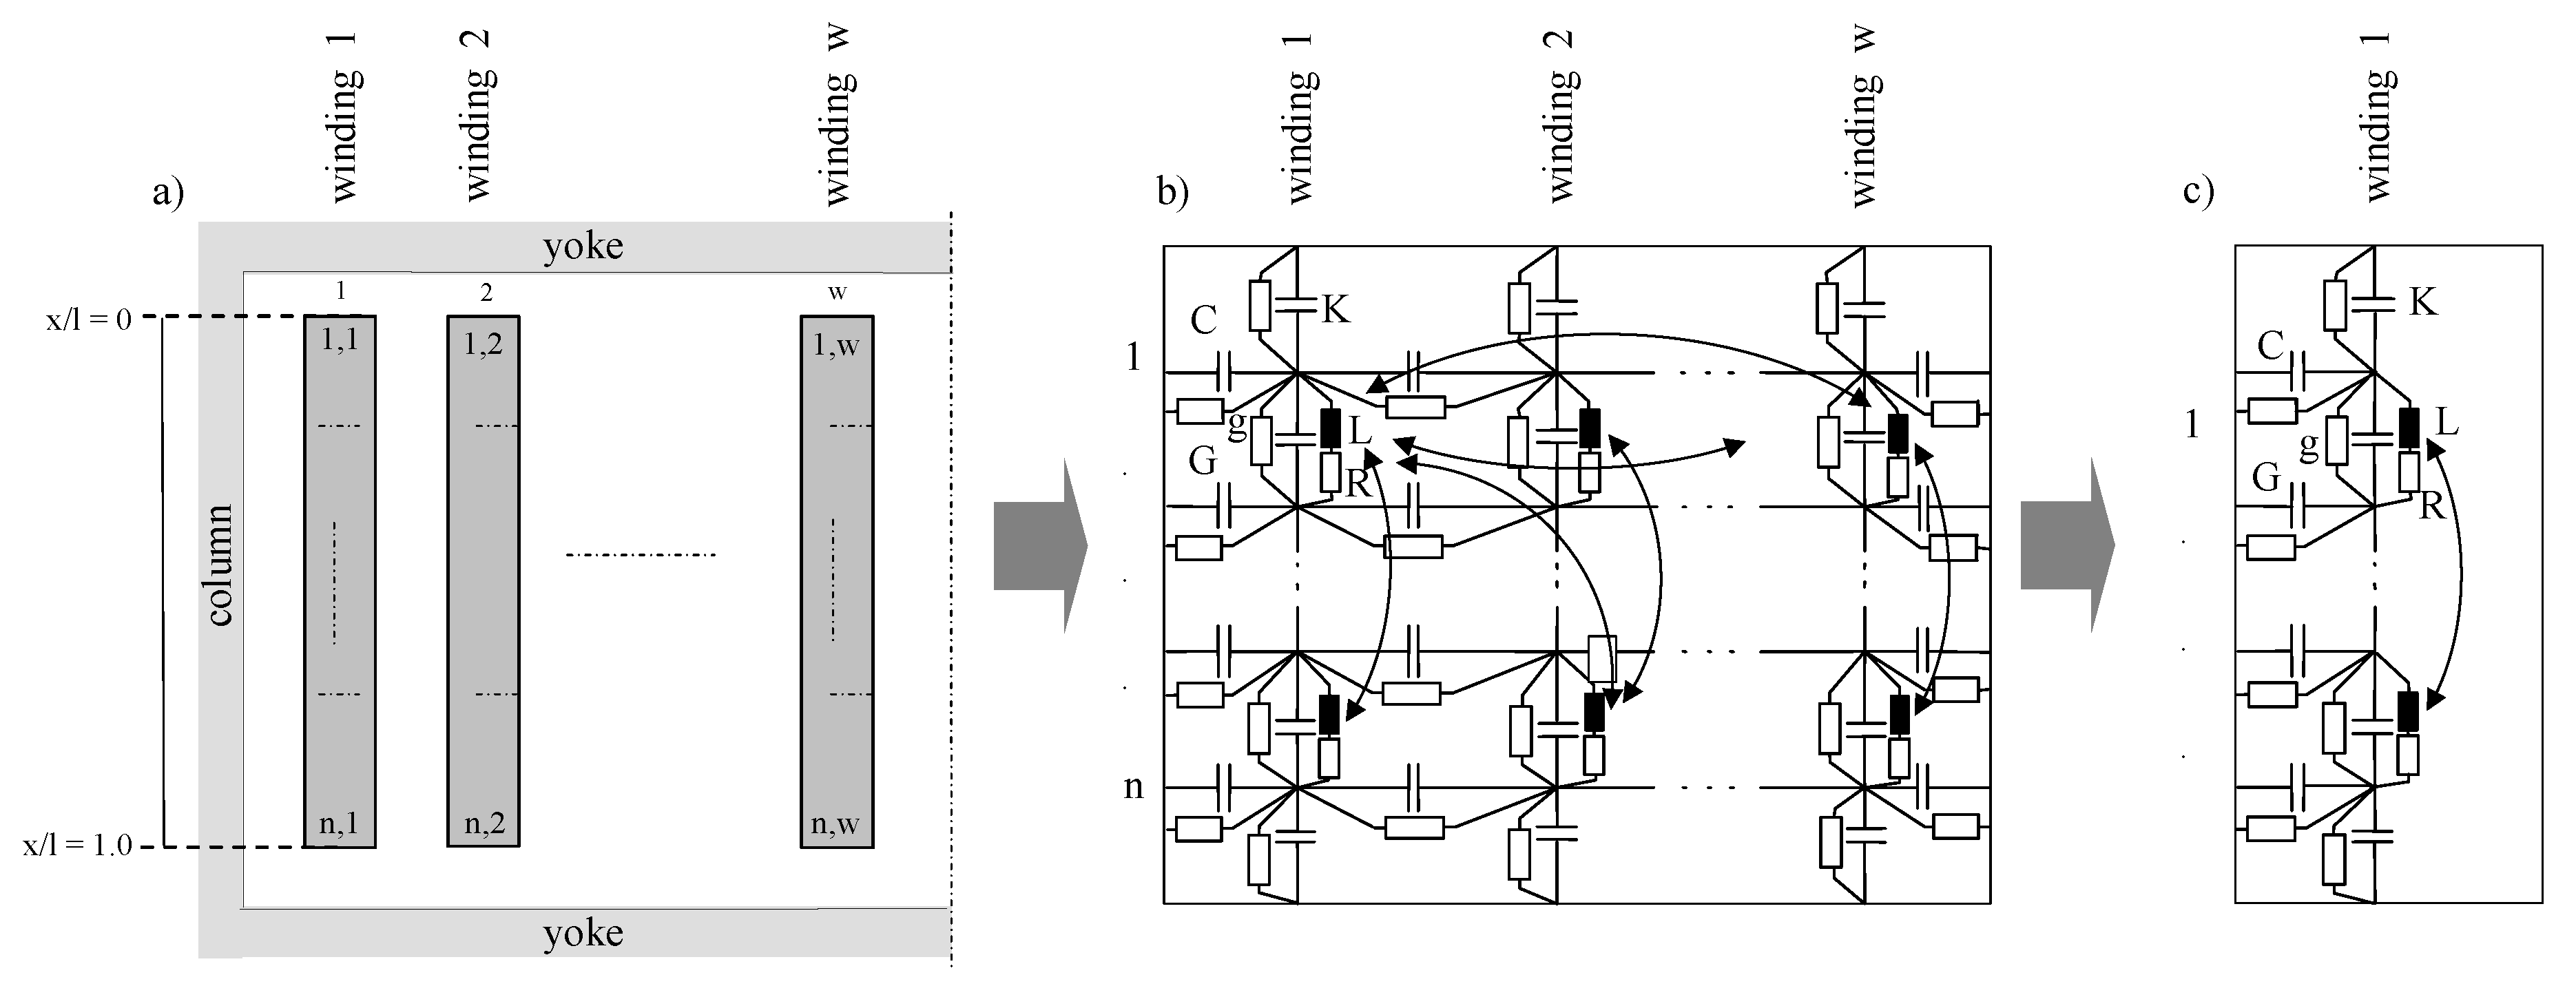
A proposition of a transformer winding model, which can be implemented in EMTP-type software, for the analysis of overvoltages at selected points inside the winding during the transient state in an electrical network;
(2)
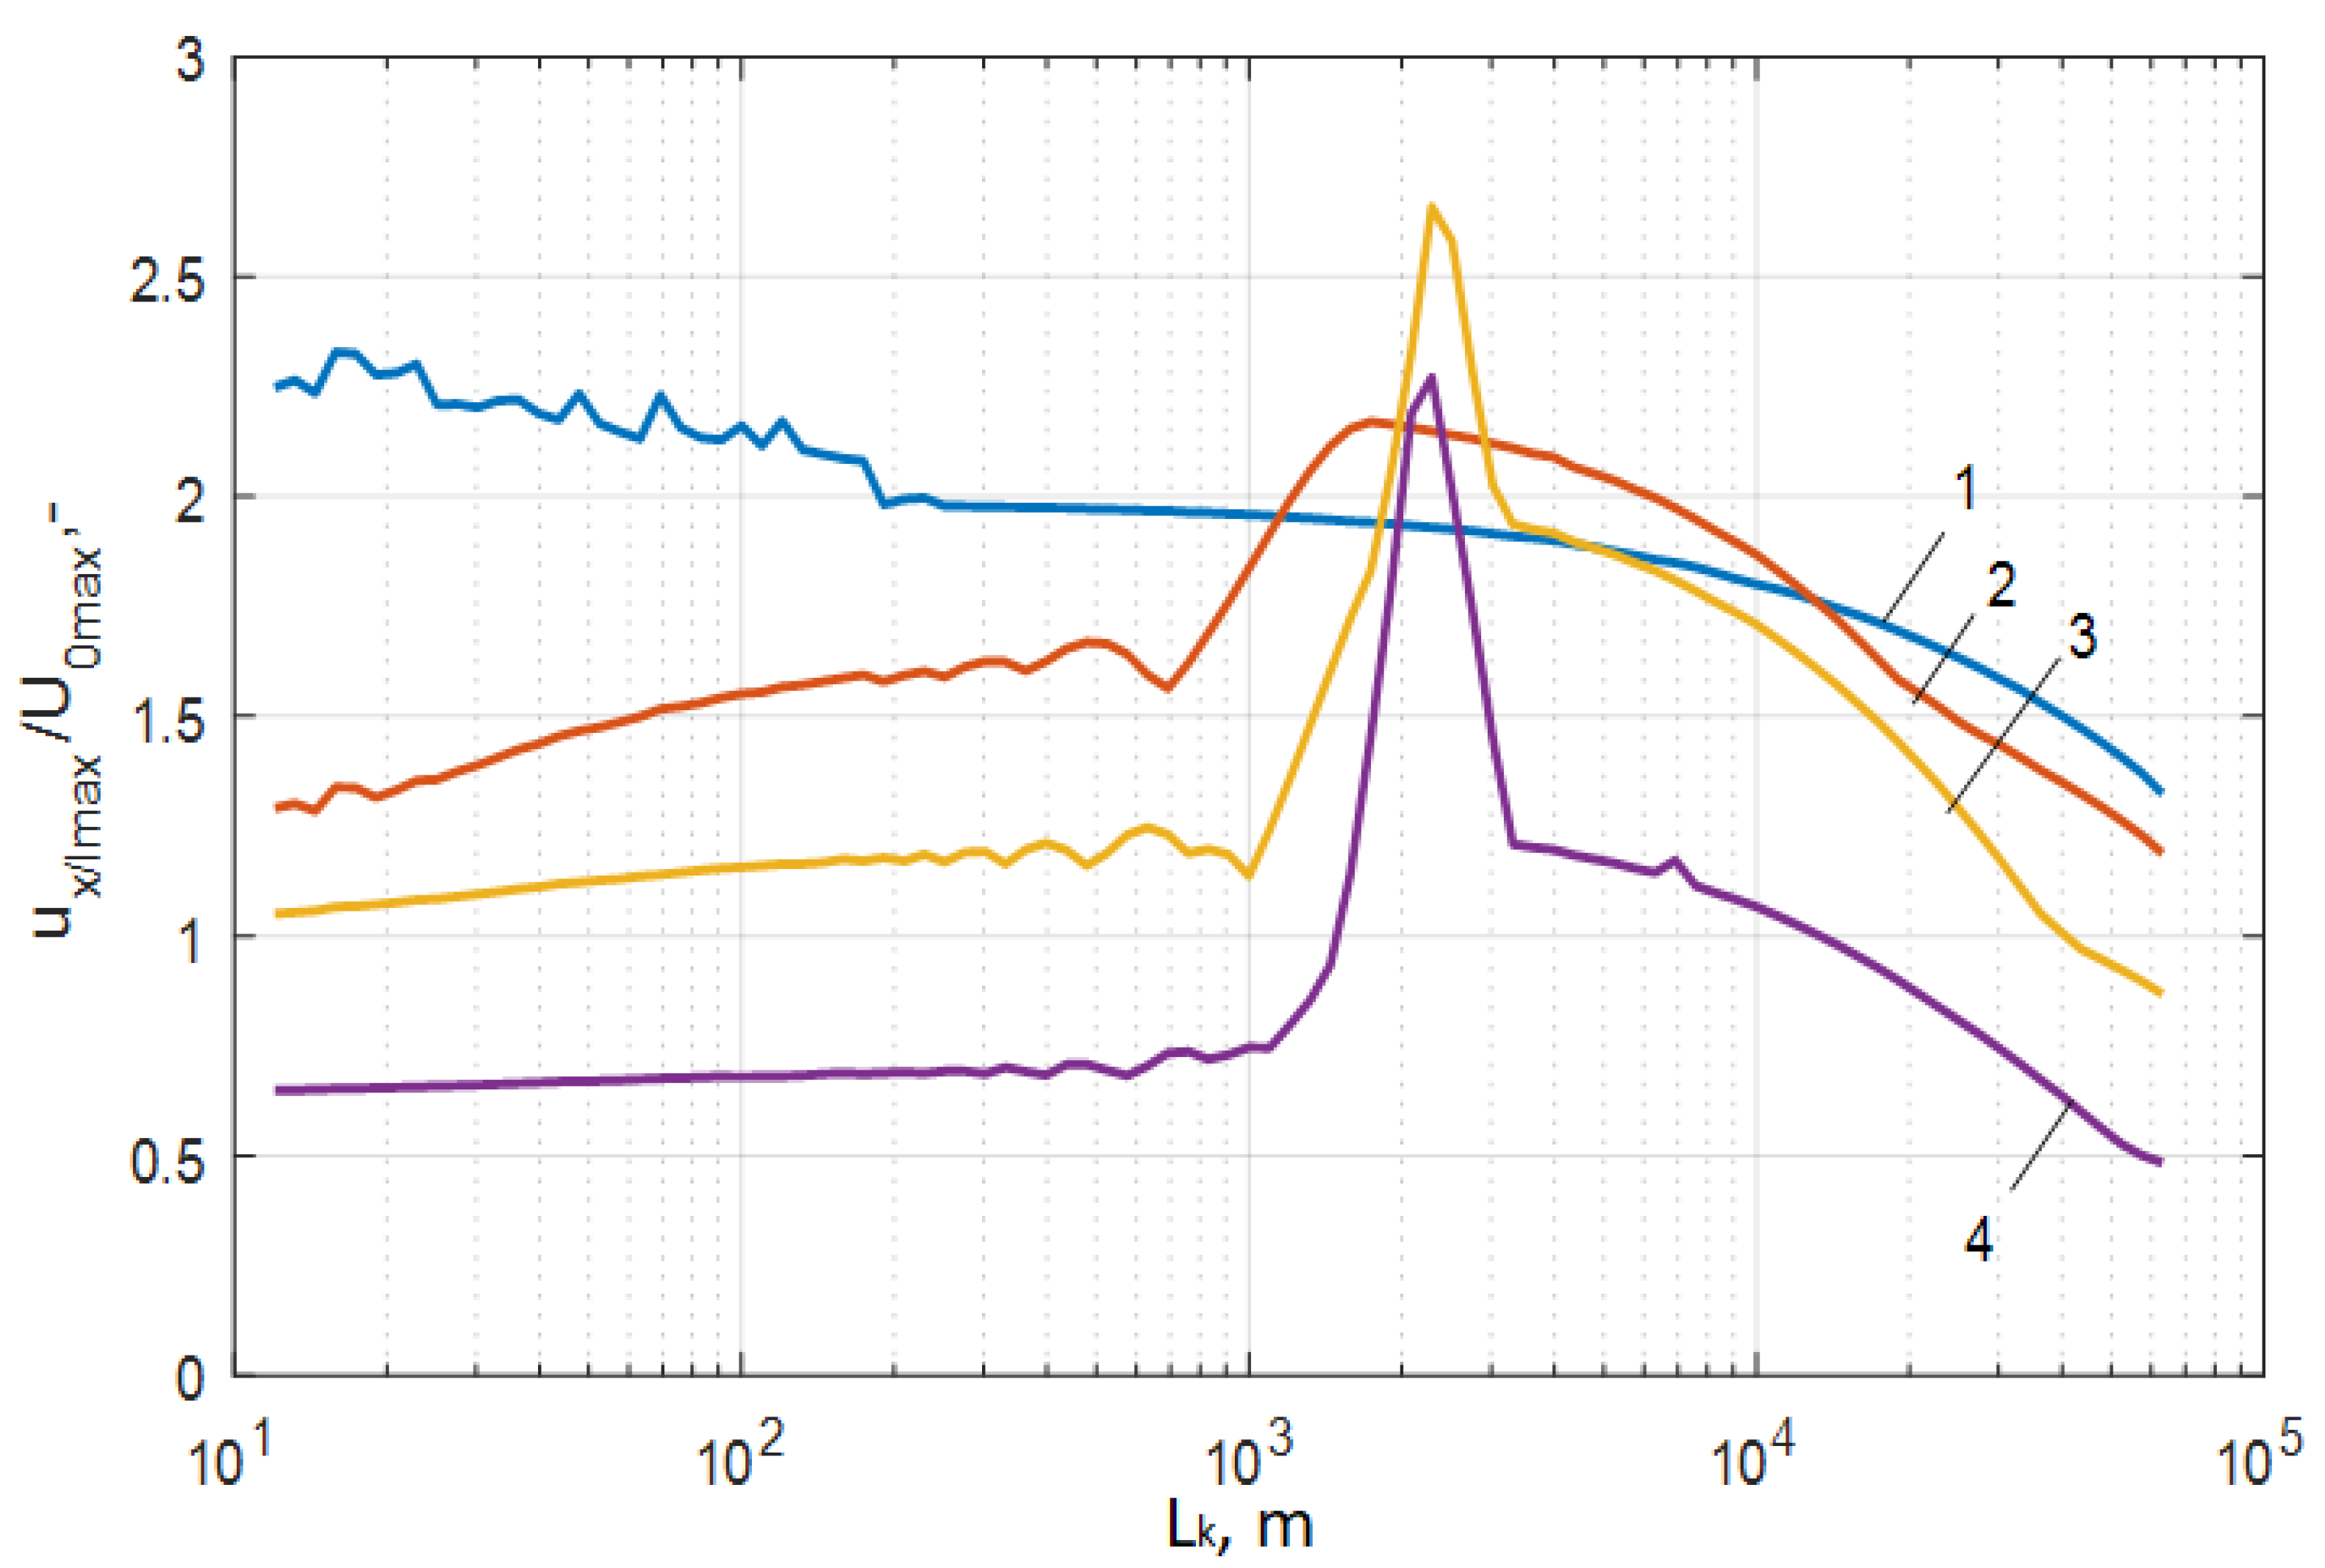
A definition of a critical cable length in the setup with a circuit breaker in which the highest internal overvoltage level is observed; these kinds of overvoltages are related to the resonance phenomena;
(3)
A presentation of the impact of ground fault resistance on the mechanism of overvoltage distribution inside the winding.

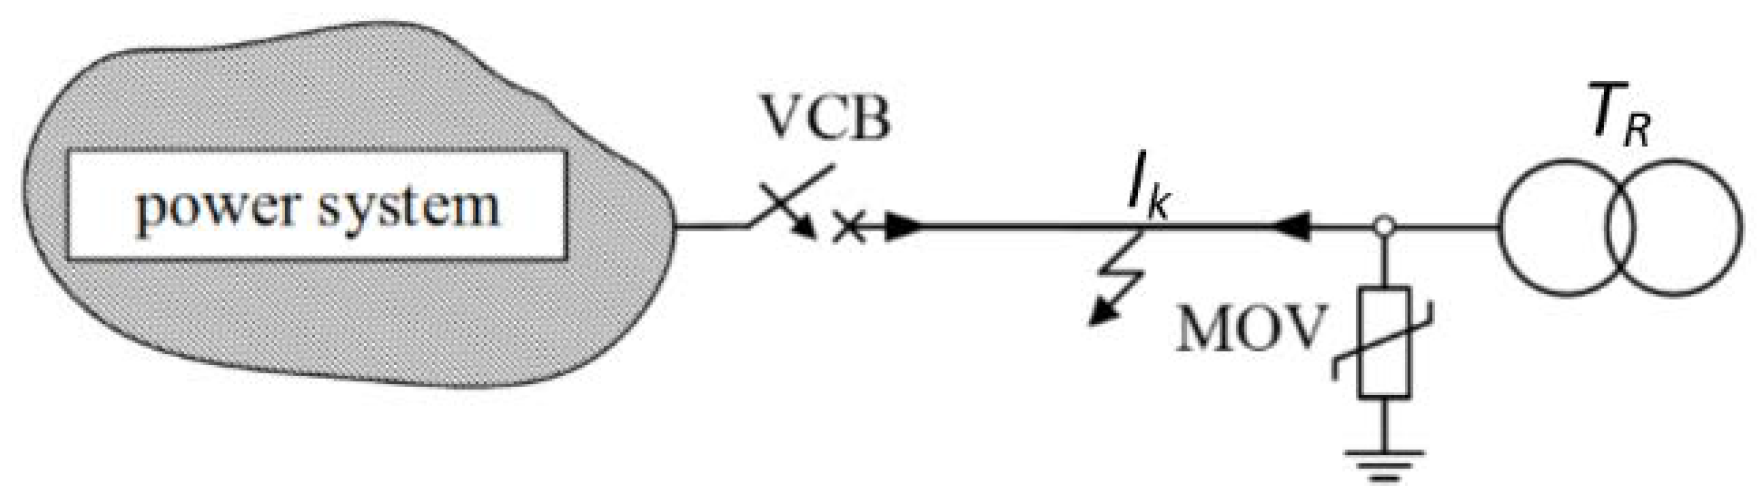
2. The Model System with a Cable Line and Distribution Transformer

The general single line diagram of a system used in the simulation is shown in Figure 1. This system consists of a variable length cable line Lk, distribution transformer (Table 1) Tr, vacuum circuit breaker (VCB), and the MOV. The overall analysis is focused on the measurements in phase A of the medium voltage side of the transformer.
The basic electrical and construction parameters of the transformer Tr are presented in Table 1. The parameters of the cable line Lk are presented in Table 2. The parameters of the used MOV are shown in Table 3 [26,27].
The overvoltage analysis covered the simulation cases:
(1)
energization of the distribution transformer connected with line Lk with variable length;
(2)
single-phase earth fault in the cable line Lk with different distances from the transformer and different values of the short circuit resistance.
The internal overvoltages were normalized to the maximal value of the nominal voltage at the transformer terminals. Due to the assumption of the linearity of the power transformer model, the level of voltage does not have an impact on the overvoltage waveforms. For steep and high-frequency signals, the transformer can be treated as a linear time-invariant class object [7,22,28], ignoring the silicon steel magnetic core.

3. The Simulation of Winding Internal Overvoltages

3.1. Simulation Models of a Power Transformer and Power Apparatus

Modeling of power transformers is a complex procedure. A developed model should take into account all physical phenomena related to the performed analysis. Three groups of phenomena related to the analyzed frequencies bands can be found in the literature, i.e., low frequency, mid-frequency, and high-frequency (HF) models can be distinguished [23,24,29]. The analysis of the overvoltage distribution in a transformer winding requires the use of the high-frequency transformer model, which should take into account magnetic and electric couplings between turns and frequency-dependent relationships such as the skin effect. The modeling of the magnetic core can be ignored due to the properties of the silicon steel and low penetration level of the magnetic field at higher frequencies. The HF transformer model can be divided into several subgroups depending on the topology and the input data. The first division which can be made is the finite element method (FEM) and RLC circuit models. FEM transformer models [30,31] are developed based on geometrical and material property data; due to the relatively large dimensions of the windings, computing power is the main issue in these analyses. The second group of transformer models is the RLC-based circuit models, which can be divided into transmission line modeling (TLM) models, black-box models, white-box models, and gray-box models [32]. The basis for the construction of the RLC models is the construction parameters of the transformer or the measured values and frequency characteristics.
In the current work, the simulation of overvoltages during switching of a circuit breaker was carried out in the Electromagnetic Transients Program/Alternative Transients Program (EMTP/ATP), version 7.0 [25]. The equivalent scheme of the lumped RLC winding model used in the simulations is presented in Figure 2 [33,34,35,36]. The input parameters of the model were determined according to the literature [14,22,28,33,37,38,39]. The transformer winding was divided into eight sections with an equal number of turns. The winding model was based on the L, R, K, C, G, g electrical parameters and can be easily implemented in EMTP software. (Version 7.0, H. K. Høidalen, NTNU-Norway)
The transformer winding model presented in Figure 2 was verified by the comparison of simulation results to the corresponding measurement results. The measurements were taken inside the transformer winding at selected points (1, x/l = 0; 2, x/l = 0.18; 3, x/l = 0.33; 4, x/l = 0.62). The points refer to the actual x position on the overall high voltage (HV) winding length l. The position of the measurement point is calculated in relation to the input terminal of the transformer, x/l = 0, where the end of the winding is defined as x/l = 1. The measurements covered the transient overvoltage waveforms and frequency characteristics. The frequency characteristics were obtained with the sweep frequency response method (SFR) [5]. Rectangular surge mimic overvoltages were limited by the MOV surge arrester.
The selected model was used for the simulations of internal overvoltages during the action of a rectangular surge or normalized lightning voltage impulse on phase A at the input terminal. The frequency characteristics of overvoltages at selected points on the HV side winding were also determined. The frequency characteristics show the response of the winding on the oscillating component with a particular frequency. The simulation results are presented in Figure 3. Results presented in Figure 4 show laboratory measurements performed in a similar setup to that simulated (Figure 1).
The measurements were performed in a test setup with a waveform generator AFG2021, which has a 50 Ω output. The generator was connected directly to the test transformer terminals. The measurements of the overvoltages were taken by oscilloscope and voltage probes. The maximal value of the voltage signal at the transformer terminals was 10 V. The use of the AFG20201 determines the damping in the circuit; the equivalent computer simulations considered the worst-case scenario without a 50 Ω resistor at the output of the voltage source. The signals used in the simulation in comparison with the measurements were an ideal 1.2/50 µs double exponential voltage impulse and rectangular wave with 5 ns rising time.
The comparison of the simulation (Figure 3) with the measurement results (Figure 4) shows that the winding model developed in EMTP/ATPDraw (Version 7.0, H.K. Høidalen, NTNU-Norway) shows good similarity to the real behavior of a transformer winding during stimulation with a rectangular surge, normalized lightning impulse and oscillation waves in a wide frequency range. The shapes of simulation overvoltage waveforms overlap with measurements in the range of maximal values, oscillating components, and attenuation. The resonant frequency of the simulation model was 17.6 kHz and the measurements revealed the resonant frequency of the real transformer winding of 15.2 kHz. The comparison between real and simulation cases proves that these values are in good approximation. The most important fact in this simulation is the higher amplification of voltage at resonant frequency at point 3 (x/l = 0.33) and 4 (x/l = 0.62) in comparison with the point lying closer to the transformer terminal, i.e., point 2 (x/l = 0.18). This phenomenon shows (Figure 3c, Figure 4c) that for this kind of transformer the parts of the winding insulation system lying in the middle and final part of winding are more affected by resonant overvoltages. The developed model passes the verification and can be used in further analysis.

3.2. The Simulation of Winding Internal Overvoltages During a Switching Operation and Ground Faults

The simulated part of the electrical network with a variable length of cable line and power transformer is shown in Figure 5. This model consisted of a high-frequency winding model from Section 3.1, cable line Lk with variable length, surge arrester POLIM-D 12, circuit breaker W, power system equivalent model, and ground fault model. The cable line was modeled as a JMarti procedure [25] with geometrical parameters according to Table 2. The surge arrester model was simulated as an IEEE WG 3.4.11 model [40] with a residual voltage equal to Table 3. The simulations were made in a single-phase model. The ground fault was modeled as an ideal switch connecting the conductor line to the ground by resistor Rf.
The scope of the simulation was the following:
(1)
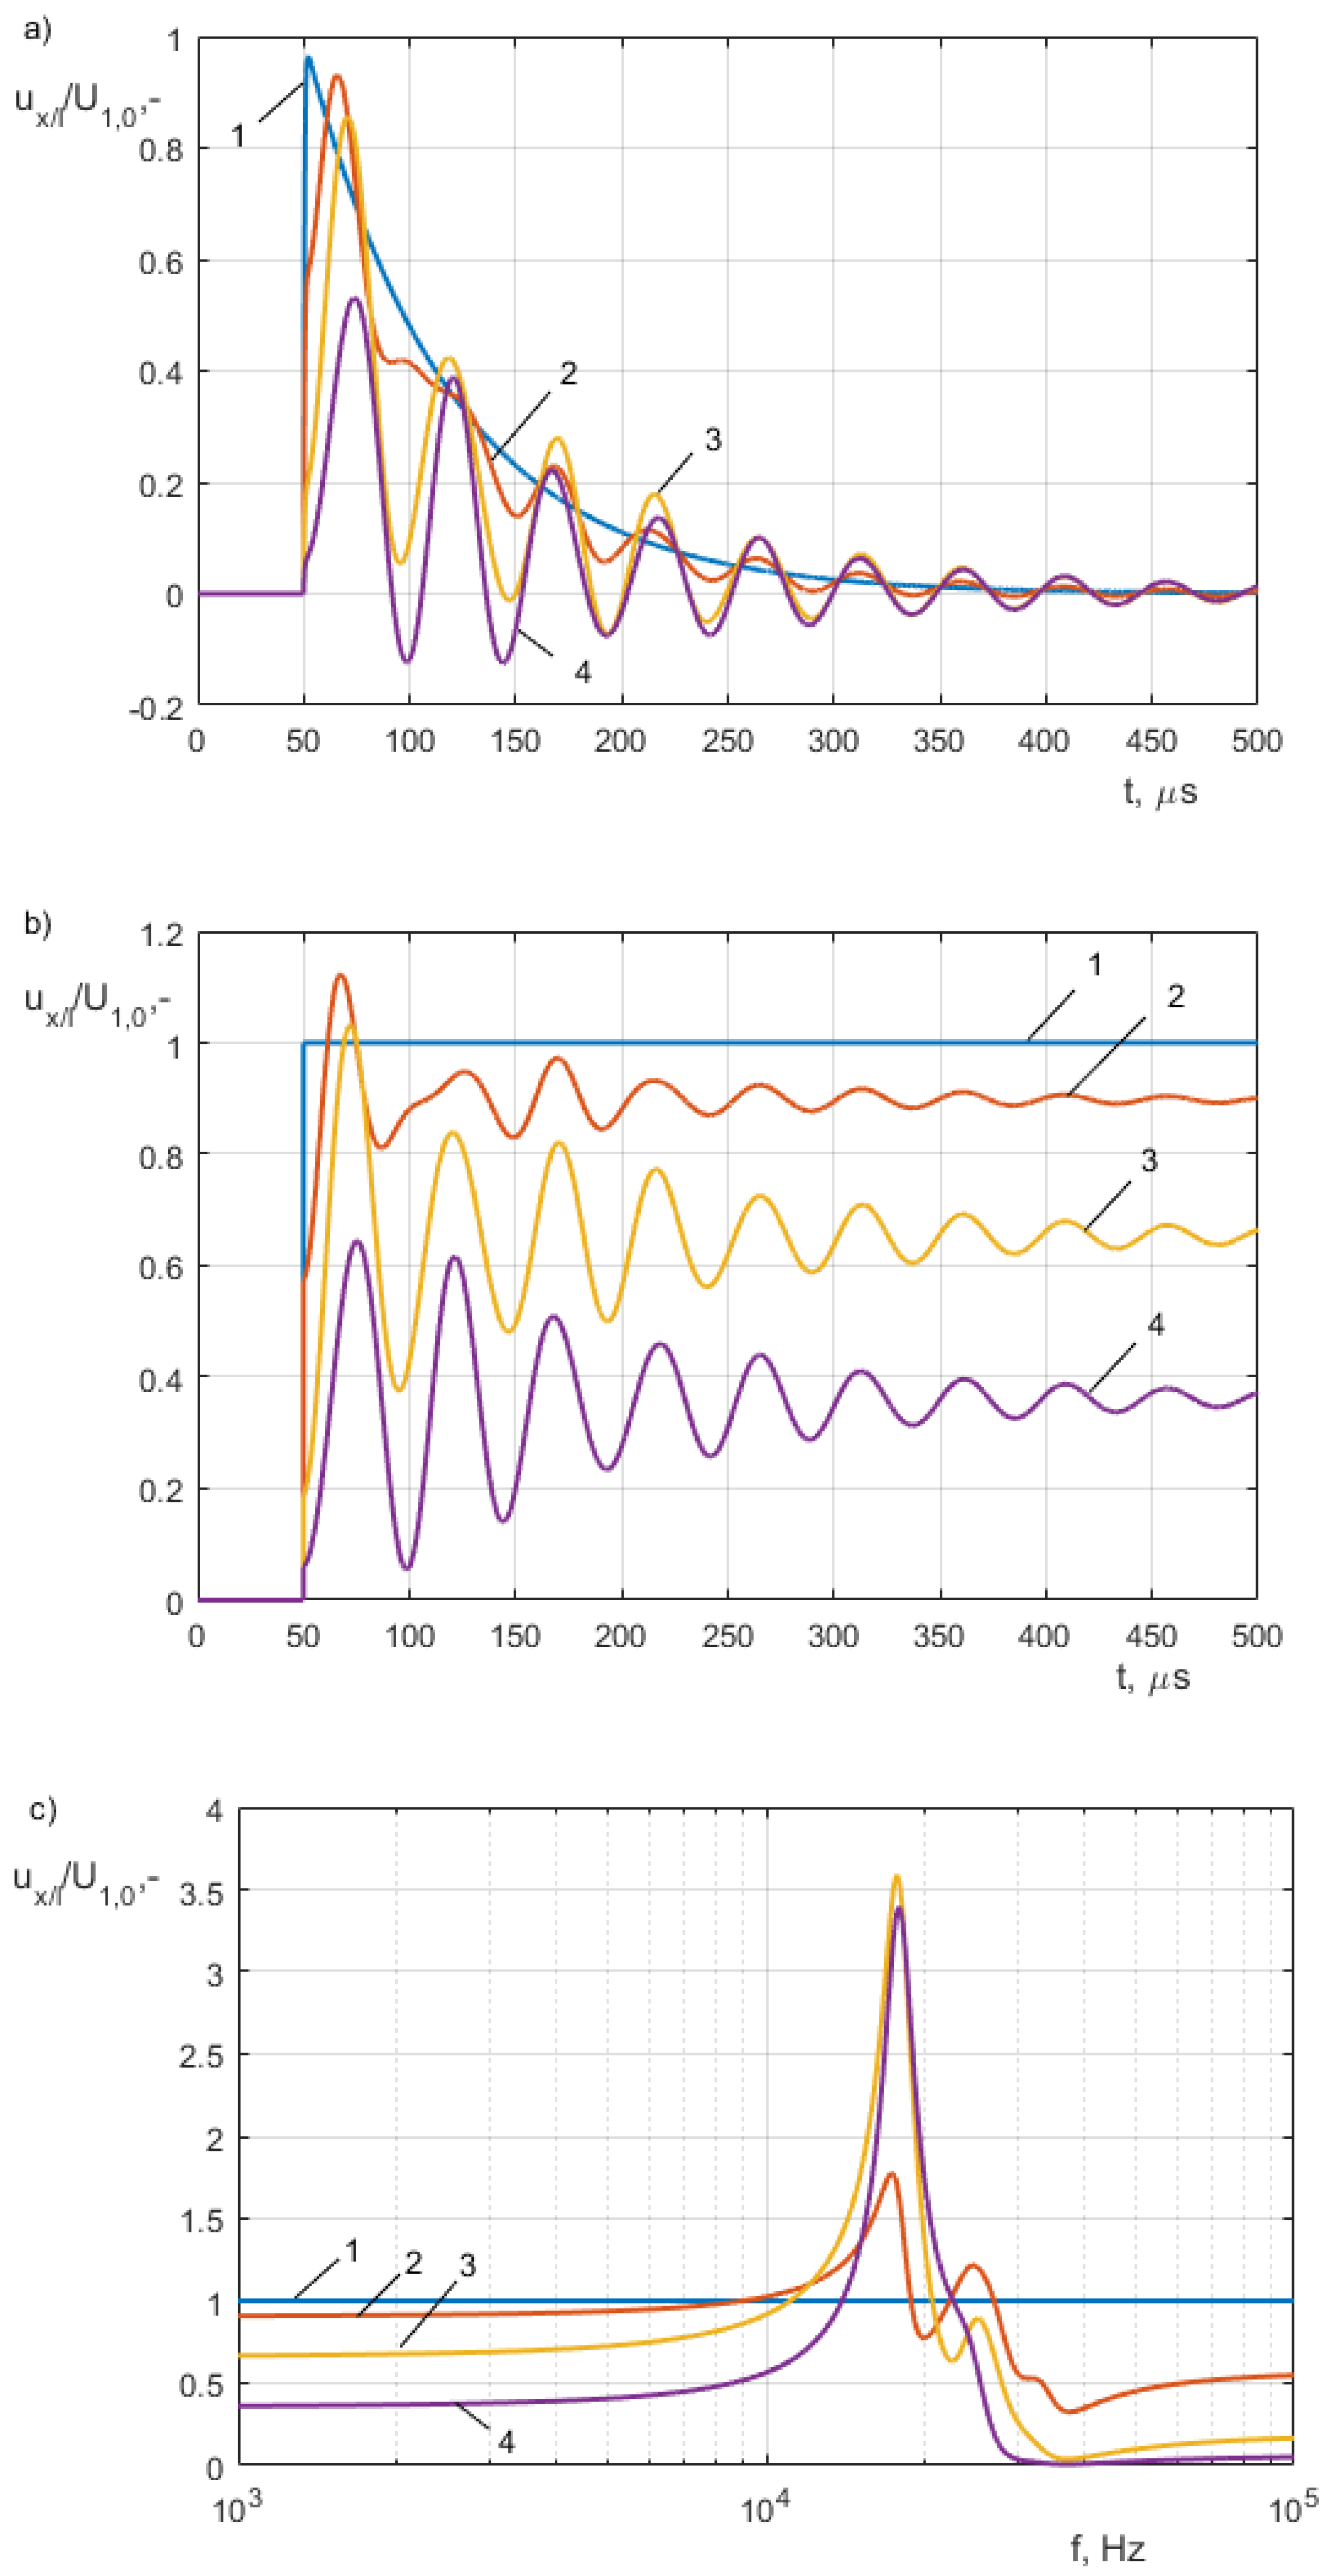
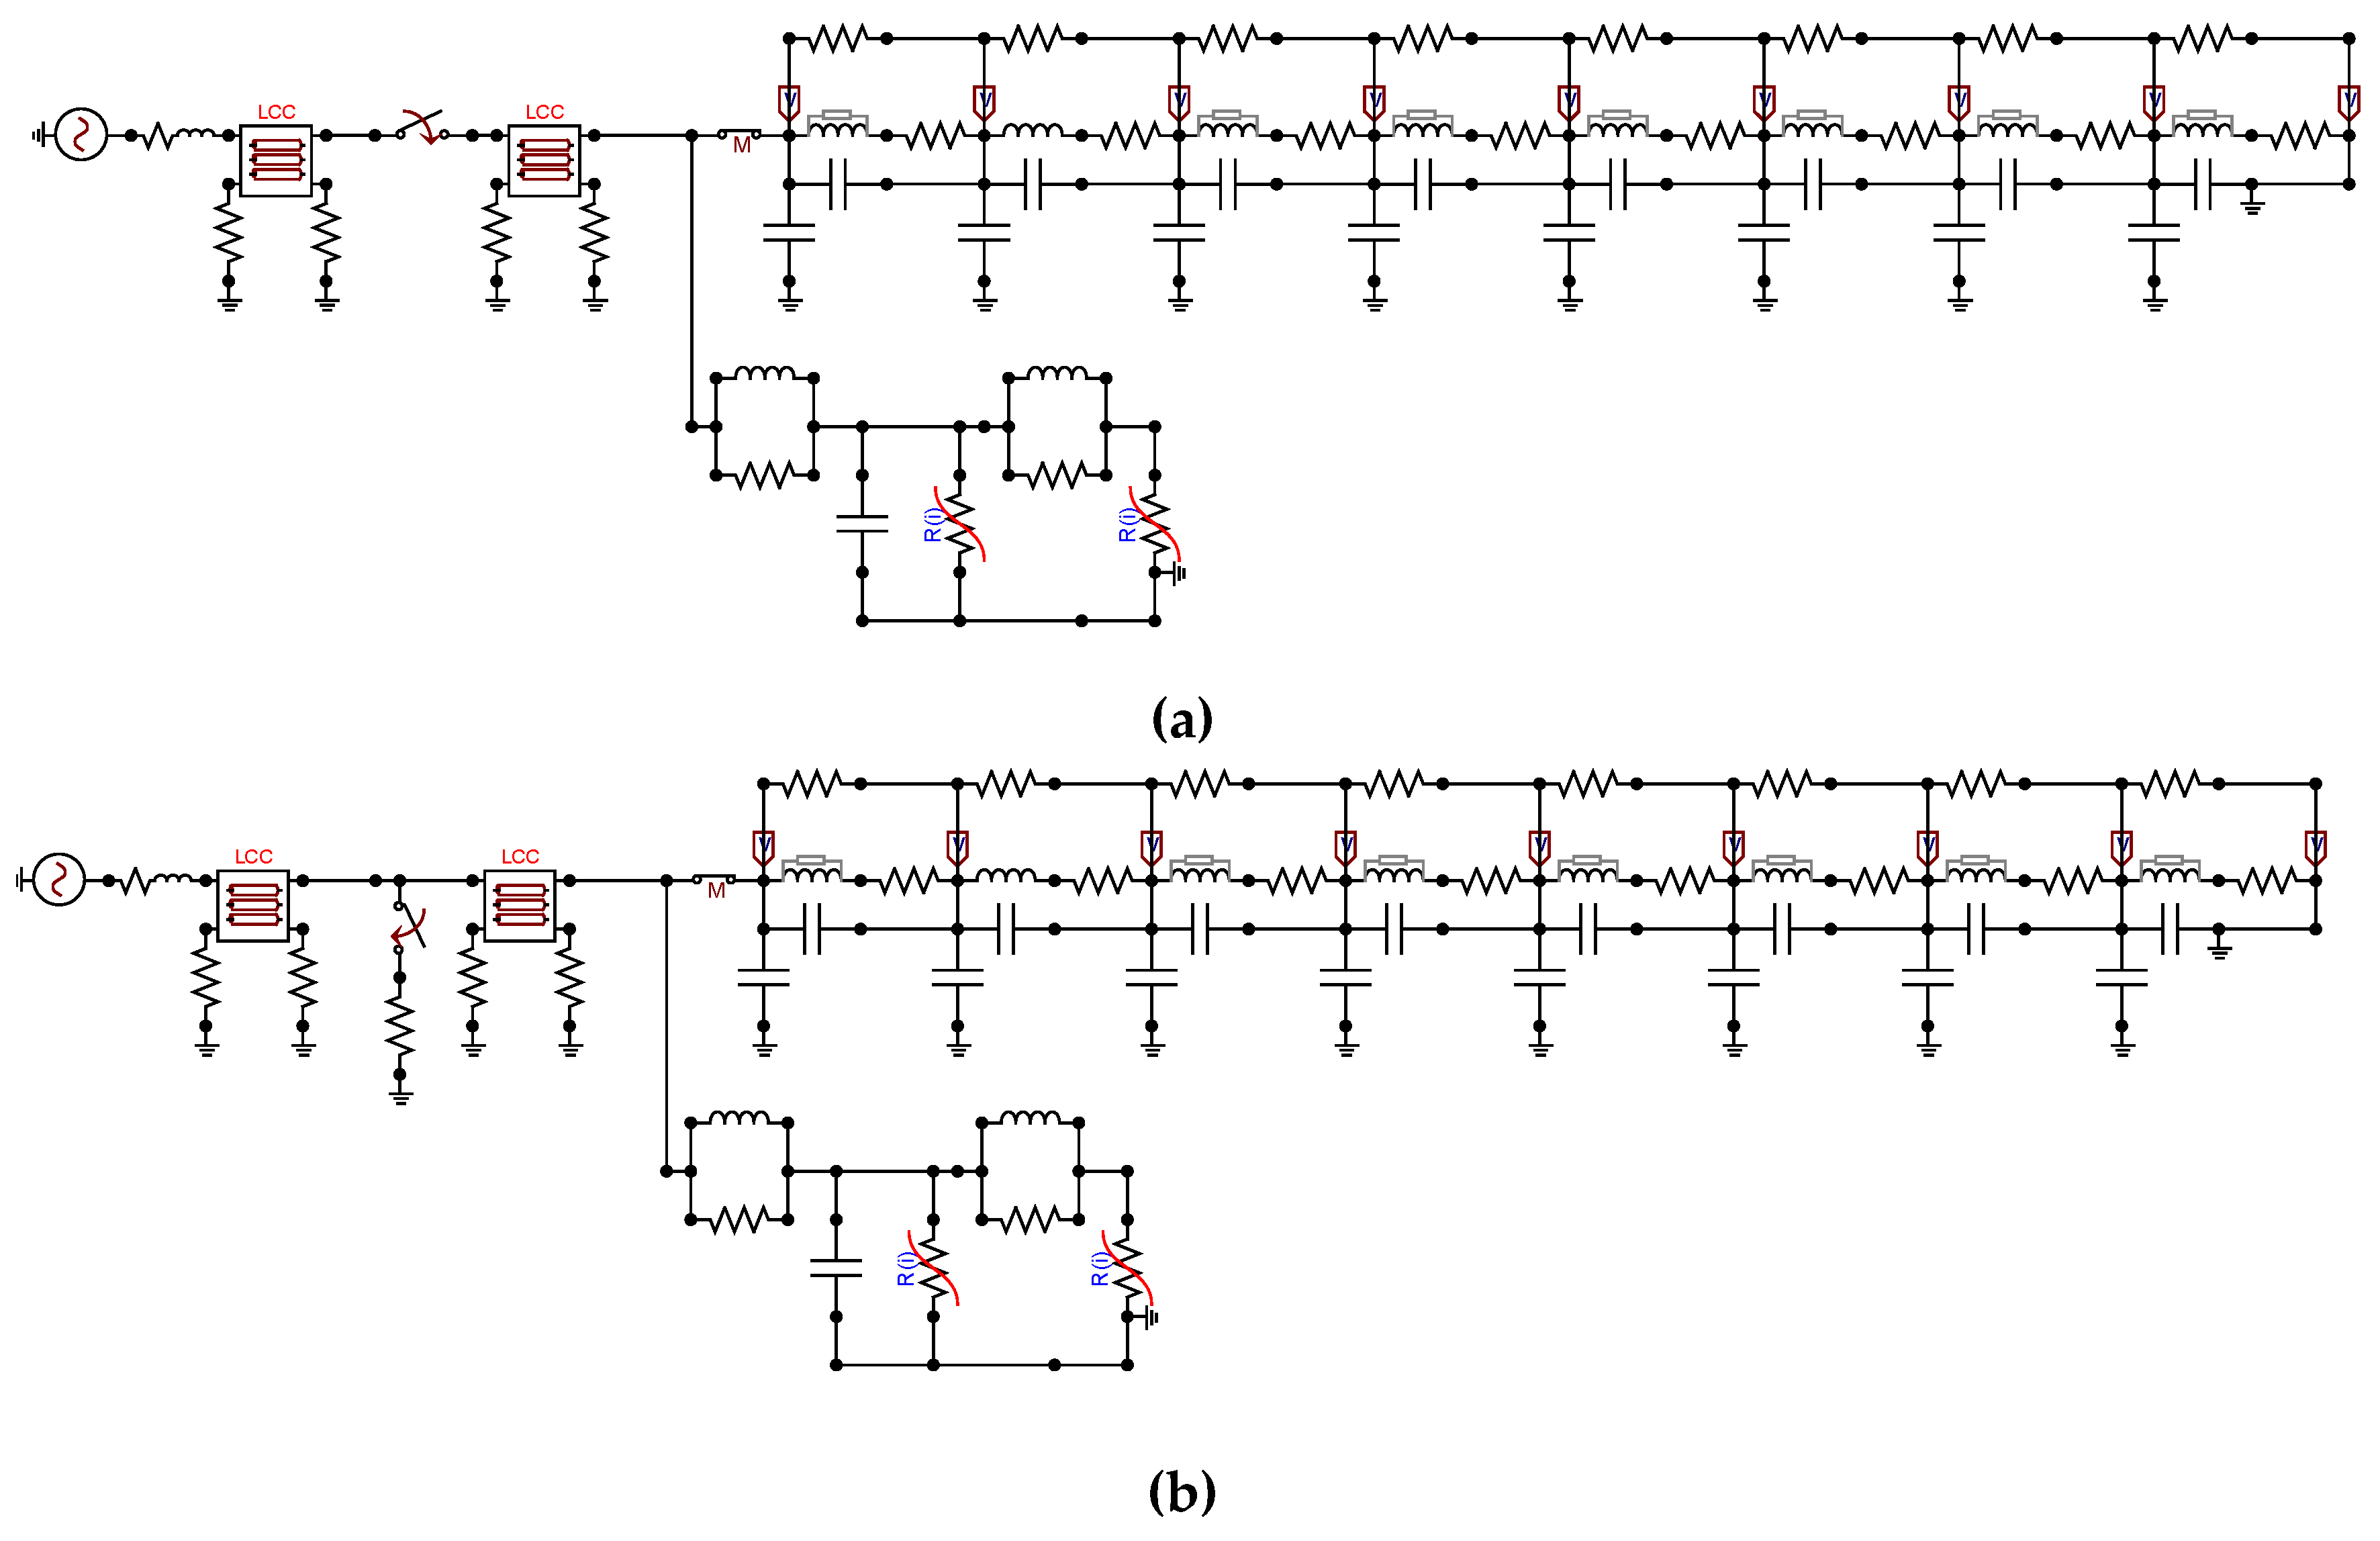
closing the circuit breaker VCB connected to the cable line Lk and the HF transformer winding model, the variable length of the cable was changed in a range of 10 m to 60 km (Figure 5a);
(2)
analysis of the impact of a single-phase line to a ground fault with distance changing from 10 m to 60 km from the transformer terminals (Figure 5b);
(3)
analysis of the impact of short circuit resistance during a ground fault on the level and mechanism of internal overvoltage distribution; the analysis covered low and high ohmic faults, Rf = {0.01 Ω, 1 Ω, 2 Ω, 10 Ω, 100 Ω}.
The simulated internal overvoltages for the selected cable length Lk obtained for the points with the coordinates x/l = 0; 0.18; 0.33 and 0.62 of the HV winding (Figure 2) are presented in Figure 6, Figure 7, Figure 8, Figure 9, Figure 10, Figure 11, Figure 12, Figure 13, Figure 14, Figure 15, Figure 16, Figure 17, Figure 18 and Figure 19. The characteristics ux/lmax/U0max = f(Lk) of the overvoltage maximal values in relation to the cable length during a switching operation are presented in Figure 6.
The second case of the analysis covered the impact of the length of the cable line on overvoltages appearing during a single-phase ground fault (Figure 8, Figure 9, Figure 10, Figure 11, Figure 12, Figure 13, Figure 14, Figure 15, Figure 16, Figure 17, Figure 18 and Figure 19). This scenario includes the analysis of the value of the fault resistance on the propagation conditions of overvoltages in the transformer windings. The fault resistance varied from the low-ohmic fault, for which Rf = 0.01 Ω, to a high-ohmic fault (Rf = 100 Ω). For every tested resistance the characteristics of overvoltages in the cable length domain were determined. The waveforms of overvoltages for critical lengths of the cable are also presented. The low-ohmic fault represents the case for which the cable is mechanically damaged by an external factor, e.g., the cable insulation is cut by a sharp edge. The high-ohmic case is related to the electrical breakdown of the cable caused by the aging or degradation of the insulation system.

4. Discussion

The analysis of the simulation results (Figure 6) shows that the length of the cable has an impact on the overvoltages appearing in the transformer winding. The value of overvoltage at the input terminal of the transformer is determined by the reflection phenomena in the cable–transformer system. The internal overvoltages in a winding have a strong relationship with the cable line which impacts the oscillating component of the transient voltage. The critical length of the line for which the oscillation frequency matches the natural frequency of the winding causes the resonant overvoltages. For the analyzed case the critical length for the test object was 2291 m. For this cable length, the overvoltages inside the transformer, at the section of turns in the middle and at the end of the winding, have higher values than the overvoltages at the transformer input terminal and the upper part of the winding. The maximal values of overvoltages, in the setup with the critical length of cable, exceed the nominal values and, for the measured points, are equal to 1 = 1.93 p.u., 2 = 2.15 p.u., 3 = 2.66 p.u., 4 = 2.27 p.u.
Figure 7 shows the overvoltage waveforms at selected points of a winding during the closing of circuit breaker VCB (Figure 1) in the setup with the critical length of cable line Lk. For this line length, the oscillating component in the network matches the resonant frequency of the analyzed winding, i.e., 17.6 kHz. The oscillating component in the transient voltage appears because of the reflection phenomena between the points to which objects with different surge impedances (e.g., a cable line and transformer, circuit breaker) are connected. The frequency of oscillation is also affected by the speed of the EM wave in a cable, the length of the cable, and the ratio of surge impedances (1) [8].
The analysis of the results presented in Section 3.2 shows that the value of the fault resistance has a strong impact on the mechanism of the distribution of critical overvoltages in the transformer winding. In the low-ohmic earth faults (Figure 8, Figure 9, Figure 10, Figure 11, Figure 12, Figure 13, Figure 14, Figure 15 and Figure 16), the dominant phenomena causing the formation of transient overvoltages are related to the reflection of the wave in the system comprising the high surge impedance power transformer–cable line and a low impedance fault from which the wave reflects, as for a shorted point. The case of the fault with Rf = 0.01 Ω is similar to the switching of the circuit breaker case, and the critical length of the line for this fault is equal to lcrit = 2291 m. The overvoltages at the critical length in a low-ohmic fault are determined by the resonance phenomena inside the windings. The increase of the fault resistance Rf causes modification of propagation and reflection conditions of waves. The rise of the Rf value up to the value equal to the surge impedance Zf of the cable line causes an increase of the damping of the reflected wave, which stimulates the resonances of the power transformer winding in a similar manner. The increase of the earth’s fault resistance reveals high-frequency oscillations in the cable conductor caused by the insulation capacitance, and is particularly visible for small cable lengths (Figure 11, Figure 14, Figure 17 and Figure 19). These oscillations have small damping, thus, after reaching the transformer terminals, are distributed along the winding due to the internal longitudinal and ground capacitance C, K distribution. It can be stated that higher fault resistance Rf causes lower critical cable length lcrit (Table 4).
Table 4 presents a summary of the results obtained in the simulations. The highest electrical stress in the internal insulation system of a power transformer winding is measured at point 3 (x/l = 0.33) for the switching operation and the critical length of the cable lcrit = 2291 m. The ground fault overvoltages are less risky to the transformer insulation system. The simulation showed that the analyzed cases generate overvoltages at the transformer terminals with values smaller than the residual voltages of the MOV surge arrester. The overvoltages pass the applied overvoltage protection without changes in the maximal values. Due to the resonance phenomena inside the transformer winding the overvoltages amplify to values higher than transients at the transformer terminal. Overvoltage protection placed at the transformer terminals is not efficient for protection against internal resonance overvoltages.

5. Summary

The simulation results of overvoltages inside transformer windings performed in the EMTP/ATP show that transient overvoltages appearing at transformer terminals during a switching operation or ground faults are a source of internal overvoltages which exceed the nominal values. The worst-case scenario assumes the frequency component of transient overvoltages appearing during the analyzed events matches the natural frequency of the winding which causes the resonant overvoltages. This can be fulfilled when, in the system of a cable line–transformer, electromagnetic wave propagation conditions cause reflection of the wave with the traveling time between the elements equal to the period of the resonant frequency. The factors influencing the propagation conditions are velocity of the Electromagnetic (EM) wave in the lines, surge impedance of the line and transformer, and attenuation of the EM wave in the conductor. The construction parameters of the winding and material properties of the insulation system determine the propagation condition inside the winding, its resonant frequencies, and the distribution of internal overvoltages. The critical length of the cable is related to several factors, such as cable design, parameters of the transformer, and parameters of the event providing the transients, and, in a general case, predicting these values is difficult. Newly designed electrical networks with similar topologies should be analyzed to minimize the risk related to the resonant overvoltages inside transformer windings. Systems comprising a circuit breaker–long cable line–power transformer arrangement are common in offshore wind parks. The results presented in this article show that the EMTP/ATPDraw software can be used as a tool for the analysis of the critical length in newly constructed networks.

Author Contributions

Conceptualization, J.F. and M.K.; Methodology, J.F.; Software, M.K. and P.P.; Validation, J.F., M.K. and P.P.; Formal Analysis, J.F. and P.P.; Investigation, J.F., M.K. and P.P.; Writing-Original Draft Preparation, M.K.; Writing-Review & Editing, J.F., M.K. and P.P.; All authors have read and agreed to the published version of the manuscript.

Funding

This research received no external funding.

Conflicts of Interest

The Authors declare no conflict of interest.

References

  1. Tenbohlen, S.; Jagers, J.; Vahidi, F. Results of a standardized survey about the reliability of power transformers. In Proceedings of the the 20th International Symposium on High Voltage Engineering, Buenos Aires, Argentina, 27 August–1 September 2017. [Google Scholar]
  2. Gustavsen, B.; Brede, A.P.; Tande, J.O. Multivariate analysis of transformer resonant overvoltages in power stations. IEEE Trans. Power Deliv. 2011, 26, 2563–2572. [Google Scholar] [CrossRef]
  3. Gustavsen, B. Study of transformer resonant overvoltages caused by cable-transformer high-frequency interaction. IEEE Trans. Power Deliv. 2010, 25, 770–779. [Google Scholar] [CrossRef]
  4. Rocha, A.C.O. Electrical Transient Interaction between Transformers and the Power System; CIGRÉ Session: Paris, France, 2008; p. C4-106; pp. 1–4. [Google Scholar]
  5. Florkowski, M.; Furgał, J.; Kuniewski, M. Propagation of overvoltages in distribution transformers with silicon steel and amorphous cores. IET Gener. Trans. Distrib. 2015, 9, 2736–2742. [Google Scholar] [CrossRef]
  6. Hori, M.; Nishioka, M.; Ikeda, Y.; Naguchi, K.; Kajimura, K.; Motoyama, H.; Kawamura, H. Internal winding filure due to resonance overvoltages in distribution transformer caused by winter lightning. IEEE Trans. Power Deliv. 2006, 21, 1600–1606. [Google Scholar] [CrossRef]
  7. Florkowski, M.; Furgał, J.; Kuniewski, M. Propagation of Overvoltages in the Form of Impulse, Chopped and Oscillating Waveforms in Transformer Windings—Time and Frequency Domain Approach. Energies 2020, 13, 304. [Google Scholar] [CrossRef] [Green Version]
  8. Van der Sluis, L. Transients in Power Systems; John Wiley & Sons Ltd.: Hoboken, NJ, USA, 2001; ISBN 0-471-48639-6. [Google Scholar]
  9. Debnath, A.D.; Chakrabarti, A. A Study on the Impact of Low-Amplitude Oscillatory Switching Transients on Grid Connected EHV Transformer Windings in a Longitudinal Power Supply System. IEEE Trans. Power Deliv. 2009, 24, 679–686. [Google Scholar]
  10. Christodoulou, C.A.; Vita, V.; Ekonomou, L. Studies for the more effective protection of MV/LV substations against lightning overvoltages. Int. J. Circuits Electron. 2017, 2, 11–15. [Google Scholar]
  11. Christodoulou, C.A.; Vita, V.; Ekonomou, L. Lightning performance of an air insulated high voltage substation. In Proceedings of the 21st International Symposium on High Voltage Engineering (ISH 2019), Budapest, Hungary, 26–30 August 2019. [Google Scholar] [CrossRef]
  12. Joint Working Group A2/C4.39-CIGRE. Electrical Transient Interaction between Transformers and the Power System (Part 1-Expertise, Part 2: Case Studies); CIGRE: Paris, France, 2014; ISBN 978-2-85873272-2. [Google Scholar]
  13. Larin, V.S.; Matveev, D.A.; Zhuikov, A.V. Approach to Analysis of Resonance Phenomena and Overvoltages due to Interaction between Power Transformer and External Network; CIGRE SC A2 & C4 Joint Colloquium: Zurich, Switzerland, 2013; pp. 1–8. [Google Scholar]
  14. Furgał, J.; Kuniewski, M.; Pająk, P. Propagation of switching overvoltages in transformer windings. In Przegląd Elektrotechniczny; Publisher Sigma-NOT: Warsaw, Poland, 2018; pp. 61–64. ISBN 0033-2097. [Google Scholar] [CrossRef]
  15. Hoogendorp, G.; Popov, M.; Van der Sluis, L. The Influence of a Cable on the Voltage Distribution in Transformer Windings. In Proceedings of the International Conference on Power System Transients-IPST2011, Delft, The Netherlands, 14–17 June 2011; pp. 1–6. [Google Scholar]
  16. Zhou, Z.; Guo, Y.; Jiang, X.; Liu, G.; Tang, W.; Deng, H.; Li, X.; Zheng, M. Study on Transient Overvoltage of Offshore Wind Farm Considering Different Electrical Characteristics of Vacuum Circuit Breaker. J. Mar. Sci. Eng. 2019, 7, 415. [Google Scholar] [CrossRef] [Green Version]
  17. Liu, G.; Guo, Y.; Xin, Y.; You, L.; Jiang, X.; Zheng, M.; Tang, W. Analysis of Switching Transients during Energization in Large Offshore Wind Farms. Energies 2018, 11, 470. [Google Scholar] [CrossRef] [Green Version]
  18. Soloot, A.H.; Høidalen, H.K.; Gustavsen, B. Influence of the winding design of wind turbine transformers for resonant overvoltage vulnerability. IEEE Trans. Dielectr. Electr. Insul. 2015, 22, 1250–1257. [Google Scholar] [CrossRef]
  19. McBride, J.; Lopez-Fernandez, X.M.; Alvarez-Mariño, C. Integration of TDSF Analysis into TECAM Transformer on Line Monitoring System. In Proceedings of the 2019 6th International Advanced Research Workshop on Transformers (ARWtr), Cordoba, Spain, 7–9 October 2019. [Google Scholar]
  20. Theocharis, A.; Popov, M.; Terzija, V. Computation of internal voltage distribution in transformer windings by utilizing a voltage distribution factor. Electr. Power Syst. Res. 2016, 138, 11–17. [Google Scholar] [CrossRef] [Green Version]
  21. Luna López, Z.; Gómez, P.; Espino-Cortés, F.P.; Pena-Rivero, R. Modeling of Transformer Windings for Fast Transient Studies: Experimental Validation and Performance Comparison. IEEE Trans. Power Deliv. 2017, 32, 1852–1860. [Google Scholar] [CrossRef]
  22. Heller, B.; Veverka, A. Surge Phenomena in Electrical Machines; Czechoslovak Academy of Sciences: Prague, Czech Republic, 1968. [Google Scholar]
  23. Trkulja, B.; Drandić, A.; Milardić, V.; Župan, T.; Žiger, I.; Filipović-Grčić, D. Lightning impulse voltage distribution over voltage transformer windings—Simulation and measurement. Electr. Power Syst. Res. 2017, 147, 185–191. [Google Scholar] [CrossRef]
  24. Župan, T.; Trkulja, B.; Štih, Ž. Power transformer winding model for lightning impulse testing. Procedia Eng. 2017, 202, 297–304. [Google Scholar] [CrossRef]
  25. Dommel, H.W. Electromagnetic Transients Program Reference Manual; (EMTP Theory Book); Prepared for BPA: Portland, OR, USA, 1986. [Google Scholar]
  26. Selection Guide for ABB HV Surge Arresters. Zinc Oxide Surge Arrester. Publ SESWG/A 2300 E, Techn. Inform. ABB. 2017. Available online: www.abb.pl (accessed on 2 February 2020).
  27. Surge Arrester POLIM-D. Data Sheet. Available online: www.abb.pl (accessed on 2 February 2020).
  28. Wilcox, D.J.; Conlon, M.; Hurley, W.G. Calculation of self and mutual impedances for coils in ferromagnetic cores. IEE Proc. 1988, 135 Pt A, 470–476. [Google Scholar] [CrossRef]
  29. Rezaei-Zare, A. Enhanced Transformer Model for Low- and Mid-Frequency Transients—Part I: Model Development. IEEE Trans. Power Deliv. 2015, 30, 307–315. [Google Scholar] [CrossRef]
  30. Tahir, M.; Tenbohlen, S.A. Comprehensive Analysis of Windings Electrical and Mechanical Faults Using a High-Frequency Model. Energies 2020, 13, 105. [Google Scholar] [CrossRef] [Green Version]
  31. Gunawardana, M.; Fattal, F.; Kordi, B. Very Fast Transient Analysis of Transformer Winding Using Axial Multiconductor Transmission Line Theory and Finite Element Method. IEEE Trans. Power Deliv. 2019, 34, 1948–1956. [Google Scholar] [CrossRef]
  32. Aghmasheh, R.; Rashtchi, V.; Rahimpour, E. Gray Box Modeling of Power Transformer Windings for Transient Studies. IEEE Trans. Power Deliv. 2017, 32, 2350–2359. [Google Scholar] [CrossRef]
  33. Su, C.Q. Electromagnetic Transients in Transformer and Rotating Machine Windings; IGI Global: Hershey, PA, USA, 2012. [Google Scholar]
  34. Degeneff, R.C.A. General Method for Determining Resonances in Transformer Winding. IEEE Trans. Power Appar. Syst. 1977, 96, 423–430. [Google Scholar] [CrossRef]
  35. Florkowski, M.; Furgał, J. Experimental and Theoretical Determination of Transfer Function of Transformer Windings. Arch. Electr. Eng. 2003, 52, 137–152. [Google Scholar]
  36. Rahimpour, E.; Christian, J.; Feser, K.; Mohseni, H. Modellierung der Transformatorwicklung zur Berechnung der Übertragungsfunktion für die Diagnose von Transformatoren. Elektrie 2000, 54, 18–31. [Google Scholar]
  37. Massarini, A.; Kazimierczuk, M.K.; Grandi, G. Lumped Parameter Model for Single- and Multiple-Layer Inductors. In Proceedings of the Power Electronics Specialists Conference, Baveno, Italy, 23–27 June 1996; pp. 295–301. [Google Scholar]
  38. Mombello, E.E.; Ratta, G.; Rivera, J.F. Study of Internal Stresses in Transformer Windings Due to Lightning Transient Phenomena. Electr. Power Syst. Res. 1991, 21, 161–172. [Google Scholar] [CrossRef]
  39. De Leon, F.; Semlyen, A. Detailed Modelling of Eddy Current Effects for Transformer Transients. IEEE Trans. Power Deliv. 1994, 9, 1143–1150. [Google Scholar] [CrossRef]
  40. IEEE W G 3.4.11. Modelling of metal oxide surge arresters. Trans. Power Deliv. 1992, 7, 302–309. [Google Scholar] [CrossRef]
Figure 1. A single line diagram of the 15 kV model network used in simulations.
Energies 13 02644 g001
Figure 2. Equivalent scheme of a winding model with lumped RLC parameters: (a) distribution of w turns in the single transformer winding; (b) RLC topology of w windings; (c) equivalent scheme of single winding. K, C—capacitances: longitudinal and to ground; L, M—inductances: self and mutual between turn sections; R—resistance of turns; G, g—conductance of insulation system of turns; 1, n—sections of winding.
Energies 13 02644 g002
Figure 3. Results of overvoltage waveforms u = f(t) and frequency characteristics u = g(f) inside a transformer winding at selected points x/l of the high voltage (HV) winding phase A, transformer model 20 kVA, 15/0.4 kV (Table 1): (a) waveforms during the action of normalized voltage impulse 1.2/50 µs; (b) waveforms during the action of a rectangular surge; (c) frequency characteristics u = g(f); 1, x/l = 0; 2, x/l = 0.18; 3, x/l = 0.33; 4, x/l = 0.62.
Energies 13 02644 g003
Figure 4. Measurement results of overvoltage waveforms u = f(t) and frequency characteristics u = g(f) inside a transformer winding at selected points x/l of the HV winding phase A, transformer model 20 kVA, 15/0.4 kV (Table 1): (a) waveforms during the action of normalized voltage impulse 1.2/50 µs; (b) waveforms during the action of rectangular surge; (c) frequency characteristics u = g(f); 1, x/l = 0; 2, x/l = 0.18; 3, x/l = 0.33; 4, x/l = 0.62.
Energies 13 02644 g004
Figure 5. Simulation setup of the medium voltage 15kV electrical network with a high-frequency (HF) winding model used for the voltage distribution analysis and variable-length cable line Lk, developed in the EMTP/ATPDraw software: (a) simulation model used for the analysis of the impact of cable line length on the distribution of switching overvoltages in a transformer winding, (b) simulation model used for the analysis of overvoltage distribution in a winding during a ground fault at different distances from transformer terminals.
Energies 13 02644 g005
Figure 6. Characteristics of overvoltage maximal values ux/lmax/U0max = f(Lk) in relation to the cable length Lk determined at selected points x/l of the HV winding, in the case of a switching operation of a circuit breaker: 1, x/l = 0; 2, x/l = 0.18; 3, x/l = 0.33; 4, x/l = 0.62.
Energies 13 02644 g006
Figure 7. Waveforms of overvoltages at selected points x/l of the HV side transformer winding during closing of a circuit breaker, in the case with critical cable Lk length 2291 m: 1, x/l = 0; 2, x/l = 0.18; 3, x/l = 0.33; 4, x/l = 0.62.
Energies 13 02644 g007
Figure 8. Characteristics of overvoltage maximal values ux/lmax/U0max=f(Lk) in relation to the cable length Lk determined at selected points x/l of the HV winding, in the case of a ground fault Rf = 0.01 Ω low ohmic fault: 1, x/l = 0; 2, x/l = 0.18; 3, x/l = 0.33; 4, x/l = 0.62.
Energies 13 02644 g008
Figure 9. Waveforms of overvoltages at selected points x/l of the HV side transformer winding during a single-phase ground fault Rf = 0.01 Ω low-ohmic fault, in the case with a critical cable Lk length 2291 m: 1, x/l = 0; 2, x/l = 0.18; 3, x/l = 0.33; 4, x/l = 0.62.
Energies 13 02644 g009
Figure 10. Characteristics of overvoltage maximal values ux/lmax/U0max=f(Lk) in relation to the cable length Lk determined at selected points x/l of the HV winding, in the case of a ground fault Rf = 1 Ω low-ohmic fault: 1, x/l = 0; 2, x/l = 0.18; 3, x/l = 0.33; 4, x/l = 0.62.
Energies 13 02644 g010
Figure 11. Waveforms of overvoltages at selected points x/l of the HV side transformer winding during a single phase ground fault Rf = 1 Ω low-ohmic fault, in the case with critical cable Lk length 144 m: 1, x/l = 0; 2, x/l = 0.18; 3, x/l = 0.33; 4, x/l = 0.62.
Energies 13 02644 g011
Figure 12. Waveforms of overvoltages at selected points x/l of the HV side transformer winding during a single phase ground fault Rf = 1 Ω low-ohmic fault, in the case with critical cable Lk length 2291 m: 1, x/l = 0; 2, x/l = 0.18; 3, x/l = 0.33; 4, x/l = 0.62.
Energies 13 02644 g012
Figure 13. Characteristics of overvoltage maximal values ux/lmax/U0max = f(Lk) in relation to the cable length Lk determined at selected points x/l of the HV winding, in the case of a ground fault Rf = 2 Ω low-ohmic fault: 1, x/l = 0; 2, x/l = 0.18; 3, x/l = 0.33; 4, x/l = 0.62.
Energies 13 02644 g013
Figure 14. Waveforms of overvoltages at selected points x/l of the HV side transformer winding during a single-phase ground fault Rf = 2 Ω low-ohmic fault, in the case with critical cable Lk length 109 m: 1, x/l = 0; 2, x/l = 0.18; 3, x/l = 0.33; 4, x/l = 0.62.
Energies 13 02644 g014
Figure 15. Waveforms of overvoltages at selected points x/l of HV side transformer winding during a single-phase ground fault Rf = 2 Ω low-ohmic fault, in the case with critical cable Lk length 2291 m: 1, x/l = 0; 2, x/l = 0.18; 3, x/l = 0.33; 4, x/l = 0.62.
Energies 13 02644 g015
Figure 16. Characteristics of overvoltage maximal values ux/lmax/U0max = f(Lk) in relation to the cable length Lk determined at selected points x/l of the HV winding, in the case of a ground fault Rf = 10 Ω low-ohmic fault: 1, x/l = 0; 2, x/l = 0.18; 3, x/l = 0.33; 4, x/l = 0.62.
Energies 13 02644 g016
Figure 17. Waveforms of overvoltages at selected points x/l of the HV side transformer winding during a single-phase ground fault Rf = 10 Ω low-ohmic fault, in the case of critical cable Lk length 52.5 m: 1, x/l = 0; 2, x/l = 0.18; 3, x/l = 0.33; 4, x/l = 0.62.
Energies 13 02644 g017
Figure 18. Characteristics of overvoltage maximal values ux/lmax/U0max = f(Lk) in relation to the cable length Lk determined at selected points x/l of the HV winding, in the case of a ground fault Rf = 100 Ω low-ohmic fault: 1, x/l = 0; 2, x/l = 0.18; 3, x/l = 0.33; 4, x/l = 0.62.
Energies 13 02644 g018
Figure 19. Waveforms of overvoltages at selected points x/l of the HV side transformer winding during a single-phase ground fault Rf = 100 Ω low-ohmic fault, in the case of critical cable Lk length 22.9 m: 1, x/l = 0; 2, x/l = 0.18; 3, x/l = 0.33; 4, x/l = 0.62.
Energies 13 02644 g019
Table 1. Rated construction parameters of the 20 kVA 15/0.4 kV distribution transformer.
ParameterValue
Apparent power Sn, kVA20
Primary side voltage UnHV, kV15
Secondary side voltage UnLV, kV0.4
number of phases3
Short circuit voltage Uz, %4.2
No-load losses ∆PFe, kW0.114
Load losses ∆PCu, kW0.525
Magnetizing current I0, %2.8
type of coilsuc*rc **
number of turns in the coil, -810650
number of coils, -44
height of the winding l, mm280250
internal diameter do, mm157157
external diameter di, mm205205
width of the coil h, mm2525
*uc—standard coils, **rc—strengthened coils (insulation systems of coils have greater electrical strength).
Table 2. Parameters of 15 kV cable line Lk.
Cross SectionInsulation ThicknessScreen ThicknessOuter DiameterR
mm2mmmmmmΩ km−1
954.52.531.60.193
Table 3. Residual voltages of the metal oxide varistor (MOV) POLIM-D 12 used in the simulations [27].
Rated Voltage Residual Voltage Ures at Specified Impulse Current
UrUc1/2.5 µs8/20 µs30/60 µs
5 kA10 kA1 kA2.5 kA5 kA10 kA20 kA125 A250 A500 A
kV
151243.347.934.937.039.142.047.731.132.233.2
Table 4. Comparison of the overvoltages during switching and ground faults in the system with the critical cable length.
CaseSwitchingGround Fault
Rf = 0.01 ΩRf = 1 ΩRf = 2 ΩRf = 10 ΩRf = 100 Ω
Critical cable length, lcrit2291 m2291 m144 m
(2291 m)
109 m
(2291 m)
52.5 m22.9 m
1 − x/l = 01.9311.521.711.521.15
2 − x/l = 0.182.151.261.161.281.190.978
3 − x/l = 0.332.661.86(1.23)(0.78)0.750.69
4 − x/l = 0.622.271.78(1.09)(0.43)0.510.4

