Article

Quantitative Analysis of Consumer Preferences of Windows Set in South Korea: The Role of Energy Efficiency Levels

1
LG Hausys, One IFC 10 Gookjegeumyoong-Ro, yeongdeungpo-Gu, Seoul 07326, Korea
2
Technology Management Economics and Policy Program, College of Engineering, National University, 1 Gwanak-ro, Gwanak-gu, Seoul 08826, Korea
3
Graduate School of Engineering Practice, Seoul National University, 1 Gwanak-ro, Gwanak-gu, Seoul 08826, Korea
*
Author to whom correspondence should be addressed.
Energies 2019, 12(9), 1816; https://doi.org/10.3390/en12091816
Submission received: 28 March 2019 / Revised: 27 April 2019 / Accepted: 5 May 2019 / Published: 13 May 2019
(This article belongs to the Special Issue Energy Policy in South Korea)

Abstract

:
The building sector is considered to be important for Korean energy issues as it accounts for approximately 20% of Korea’s final energy consumption. As one of Korea’s passive strategies in its emission reduction plan is reducing energy consumption through improvements in energy efficiency because the energy loss mostly occurs from window sets, this study aims to examine the preferences and role of the energy efficiency level of window sets in South Korea. Given that the lifespan of a building exceeds 20 years, a building’s energy efficiency significantly impacts accumulated energy savings. However, window sets affect not only energy efficiency, but also the interior appearance of the building; therefore, it is important to understand consumer preferences and to examine their effect on building energy reduction accordingly. Using a mixed logit model, this study analyzes window set preferences and energy savings. As a result, this study determines that consumers consider the energy efficiency level to be the second most important factor in determining window preference, following the cost of the window. In addition, this study found that the marginal willingness to pay for efficiency level 2 window sets compared to level 3 window sets is USD 1256. For level 1 window sets, this figure increases to USD 3140. Further, a scenario analysis is conducted to analyze the government incentive program’s effectiveness in encouraging consumers to purchasing higher energy efficiency more efficient products, and thus in promoting the eco-friendly consumption of in households. Taking into consideration of households’ willingness to pay and cost saving amount for using energy efficient window sets, the optimal value of government incentives of is found to be approximately USD 700 is found to be optimal.

1. Introduction

Global warming, caused by the emission of greenhouse gases (GHGs) such as carbon dioxide, methane, and nitrous oxide, is a serious global environmental problem. Even a slight increase in the average global temperature might cause a dramatic transformation and bring severe consequences to ecosystems [1]. The IPCC synthesis report explained that there have been observed changes in climate systems such as in the atmosphere, ocean, cryosphere, and sea level [1]. The surface of the Earth has been consecutively warmer for the last three decades. For instance, the ocean warmed by 0.11 °C per decade for the period from 1971 to 2010, glaciers continued to shrink worldwide, and the global mean sea level rose by 0.19 m over the period 1901 to 2010 [1]. A further increase in GHG emissions entails an underlying risk of severe and irreversible impacts upon ecosystems and people. In response to such threats of climate change and global warming, many countries agreed to take action with nationally determined contributions (NDCs) at the Paris Agreement on December 12, 2015 [2].
South Korea also contributes to global GHG emissions and so has agreed to the reduction efforts. Driven by increasing energy consumptions, South Korea’s total GHG emissions increased from 38,952 to 182,065 tonnes of oil equivalent (TOE) (an increase of 367%) between 1980 and 2009 [3,4]. Accordingly, it ranked seventh in the global amount of carbon dioxide emissions and 12th for the total amount of GHG emissions [5]. South Korea pledged to the Paris Agreement to reduce its emission levels by 37% (i.e., 3.15 million tons of CO2eq) for the business-as-usual scenarios (BAU) by 2030 [6]. Achieving this goal requires reduction strategies and policies in all sectors action is needed in the industrial, transport, domestic/commercial, and public sectors.
This study focuses on the policies that attempt to reduce emissions in the domestic/commercial sector, specifically examining the reduction of energy consumption in buildings. As for the domestic/commercial and public sectors, the efforts that aim to achieve the reduction goals are mainly focused on the building sector as there is significant potential for making dramatic improvements [7]. The building sector accounts for 40% of global energy consumption [8,9]. In South Korea, energy consumption in the building sector accounted for 19% of final energy consumption in 2015, and it is projected to increase by 2% annually until 2035 (The Second Energy Master Plan) [10]. Of all energy consumption in the building sector, residential buildings have accounted for 48% of total energy consumption as of 2015 [7].
In an effort to reduce energy consumption in the building sector, South Korea’s government announced green building plans that included both mandatory regulations and incentive-based measures, which aim to improve energy efficiency in buildings [11]. The mandatory regulations include strengthening standards and criteria for the green home design, promoting environmentally-friendly certifications, and supporting the use of renewable energy in public buildings [6].
An IPCC report projected that GHG reductions from energy efficiency improvements in the building, transport, industrial, and public sectors will be more than 12.1 Gt CO2 per year in 2030 [12]. As the present study focuses on energy efficiency improvements in the building sector, several policy recommendations will be provided regarding the zero-energy building plan (ZEB). ZEB, which is characterized by net zero energy consumption through the minimization of energy demand, includes both passive and active strategies. The passive strategies focus on methods that dramatically reduce heating energy, including a passive, sustainable, and energy-saving design, while the active strategies focus on using solar energy, geothermal heat, and other mechanical devices to build and supply renewable energy [13].
In order to achieve energy saving through the reduction in heating energy, it is necessary to consider the heat loss occurring from the building. The major source of heat loss in buildings is the window set According to a study that estimated the heat loss rate per residential buildings’ envelope parts, the proportion of heat/energy loss attributable to window sets was analyzed to be the largest at 45.3%, with 22.0%, 18.2% and 14.5% attributable to the outer, roof, and floor respectively. [14]. Buildings have a longer lifespan than other industrial products. The mean life span is 22.4 years for the Seoul Metropolitan Government’s inventory of buildings, with the highest life span recorded at 45 years [15]. As it is difficult for buildings to achieve additional energy efficiency once constructed, the accumulated energy usage reductions via initial energy efficient improvements are huge. Thus, an energy reduction plan should be considered in the initial design phase of the building’s construction.
Window sets have crucial effects on a building’s interior design, and consumer preference is therefore an important factor to be considered in addition to energy efficiency. This study examines the reduction of energy consumption through the improvement of energy efficiency based on consumer preferences for window sets, which are voluntary choices that are not mandatory or politically enforced. In fact, construction companies more often make the decisions regarding which building materials to use than the customers do. This means that, often, the agent that selects the building materials and the agent who lives in and pays for the energy consumption costs are different entities [16]. However, consumer involvement in environmental quality improvement is important due to their recognition and awareness of the problem, and thus consumer’s choices should not be ignored. The OECD’s publication about green household behavior highlighted the point that household consumption patterns and behaviors strongly impact climate change, and this influence is expected to increase even more significantly [17]. Therefore, this study aims to analyze selections of the energy efficiency grade of window sets as one of the ZEB passive strategies, and to analyze energy savings according to consumer preferences of window sets, using the choice experiment method. The remainder of this paper is organized as follows. Section 2 reviews window markets, consumer preferences, and the related energy saving policies in South Korea’s building sectors. Section 3 proposes the study design and methodology and Section 4 presents the results. Finally, Section 5 discusses the study’s implications and conclusions.

2. Background and Literature Review

2.1. Window Sets Market Review

As window sets are a significant aspect of building construction, they have constantly developed alongside the development of human civilization. Window sets, which at first merely functioned as a doorway or to block wind and rain, have developed to be more efficient and user-friendly. Nowadays, they not only function as windows, providing lighting and ventilation, they also fulfil an aesthetic purpose for a building’s interior design. The global market value for window sets has continuously grown and exceeded USD 190 billion as of 2017. With technological advancements and product innovations fueling demand, the global window sets market is expected to continue growing to an additional 3.5 percent by 2024 [18].
In the past, only the window’s functions of lighting, viewing, and ventilation were considered to be important. However, the trends of the window market have changed. In addition to the primary window functions, the technological developments of two or three additional window functions, such as photovoltaic systems, have become important [19]. Currently, in South Korea, the majority of related research focuses on improving thermal insulation, which is due to the government’s energy saving policy. Window regulations are determined by air tightness and by the experimental grade of the adiabatic property. Along with government regulations, the window’s insulation performance is improving as the low-emission (low-E) glass, triple-layered window, and vacuumed window technologies have developed [19]. Although the application of high-performance windows to improve the energy conservation of buildings is important, it is also necessary for windows to become multi-functional. These efforts are all necessary in order for the technological characteristics of windows to enable a passive, zero-energy house and meet users’ needs [20].
Looking at recent window technology trends, the insulation standard for windows in new buildings has been strengthened from 1.0 to 0.9 W/m2K. This is a step towards the mandatory zero energy requirement for all new buildings that will be enacted in 2020, according to the national roadmap [21]. The Korean government has established a national plan to promote zero energy buildings in response to climate change and energy crises. The government acknowledged the need to transform how buildings are designed, constructed, and utilized. With the goal of achieving a 31% reduction in GHG emissions from the building sector by 2020, the strategies for green city and green building initiatives were developed. It is anticipated that the window insulation standards will be further strengthened. Furthermore, with an increased concern for fine dusts, there is a need and an interest for research and development (R&D) on insect screens that are equipped with a dust protection function [22]. In addition, environmentally-friendly marks for window and window accessories have exceeded 2700 species, and 166 companies are in the process of accelerating the environmentally-friendly process. This suggests that demand for multifunctional and eco-friendly windows is increasing in the market, which is happening alongside the environmentally-friendly trend [23]. Based on previous studies and technological trends, it can be seen that energy and the environment play a central role in guiding future window technologies. In addition, environmental and energy regulations are being strengthened, and companies are required to prepare for and make efforts in line with such regulations. As mentioned above, various aspects of window sets including the designs, energy efficiency levels, and environmental friendliness, are considered in the selection process. Previous studies have discussed these consumer choices and preferences regarding the building materials [24,25].

2.2. Energy Consumption Efficiency Rating Indication System for Window Sets in South Korea
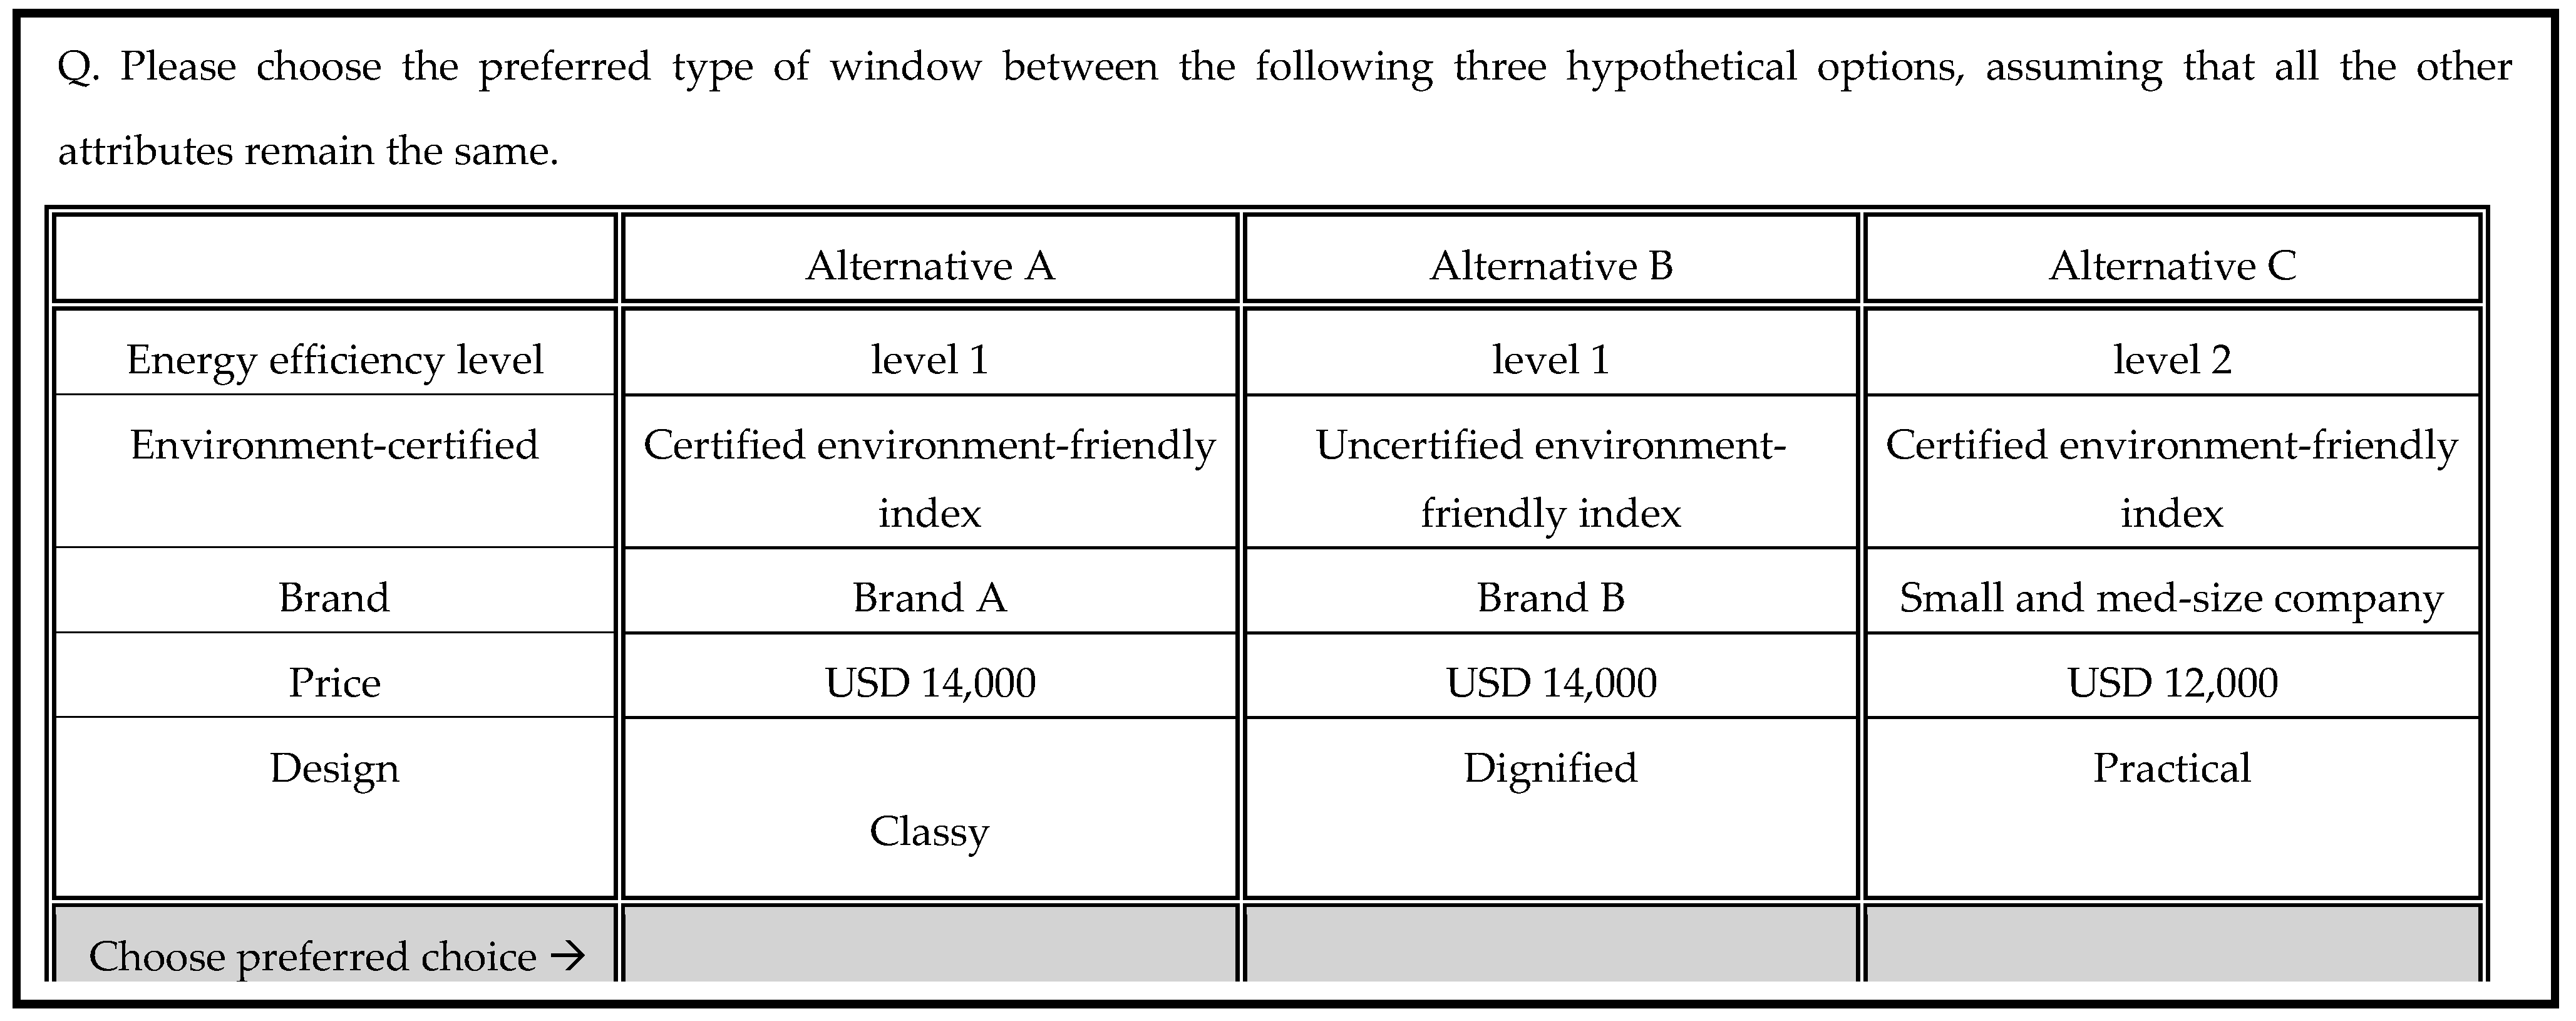
In response to climate change and the energy crisis, the Korean government has established a “green growth policy,” which includes energy-saving features with a vision of “building an advanced green country” [21]. Given that the provisions intend to strengthen the requirements on energy-saving features (i.e., building energy management systems), Korean firms have developed high-tech windows.
Korea operates three major energy efficiency programs: (1) the energy efficiency label and standard program, (2) the high-efficiency appliance certification program, and (3) the e-standby program. Of these, the energy efficiency label and standard program applies to window sets. The efficiency of a window set is determined by its energy efficiency grade. The window set with the efficiency level 1 is the most efficient window set. Under this program, manufacturers are required to indicate and report the energy efficiency grade levels from 1 to 5, and manufacturers are prohibited from producing or selling any products that fall below level 5 in accordance with the minimum energy performance standard (MEPS). The MEPS regulates the production or sale of low efficiency products that fall below the minimum standards, and there is a fine of up to USD 19,000 in case of violation [26]. Thirty-two products, including window sets, refrigerators, freezers, air conditioners, washing machines, dishwashers, dish driers, rice cookers, automobiles, TVs, etc., are included in the energy efficiency label and standard program.
Because windows sets are such a major contributor to heat loss in residential buildings, it became mandatory to indicate window sets’ energy efficiency grades (levels 1 to 5) in July 2012. The window with the efficiency level 1 denotes the most energy efficient window. The efficiency of a window set is determined by its energy efficiency grade, which is identified by measuring the overall heat transfer coefficient in accordance with KS F 2278 and by measuring the air tightness in accordance with KS F 2292 [27]. The labeling standards are shown in Table 1. The U-Value is used to express the insulation value, indicating the rate of heat loss of windows. The lower the U-Value, the greater a window’s resistance to heat flow and the better its insulating properties. In South Korea, the standard test for thermal resistance for window sets, KS F 2278 is used. Air tightness is the aspect of a window which measures the air infiltration and exfiltration. Poor airtightness may lead to large infiltration rates and corresponding energy consumption. In measuring the airtightness, KS F 2292, the standard method of measuring airtightness for window sets in Korea is used [28].

3. Research Design

As it is important to understand customer preferences in various fields, demand forecasts for new products and services across many fields are often conducted. The present study uses a conjoint analysis to examine window set preferences as this type of analysis enables researchers to observe customer preferences on all of a product’s different attributes. A conjoint analysis is a widely-used survey tool for analyzing consumers’ preferences for green products or services [29,30]. Koo et al. (2013) and Jung and Koo (2018) used discrete choice models to analyze consumer preferences for new incentive programs that promote green consumption and car-sharing services, respectively. Conjoint analysis is a useful method in understanding preferences for a product or service as the estimated results can be used to analyze consumers’ marginal utility and MWTP for key attributes of window sets. Thus, and users’ calculate acceptance levels of users can be calculated for specific levels of attributes.
Using research techniques used to identify customer preferences, the present study analyzes customers’ needs and selects the importance of the window set attributes with a conjoint analysis. Then, using the preference results, we examine the possible energy savings from the selection of different energy efficiency labels. For the conjoint analysis, we investigated the attributes that consumers consider to be important when purchasing windows. Pilot surveys were conducted before the main survey was offered in order to confirm whether or not the attributes and levels were appropriately selected and whether or not there were errors present in the questionnaires.
The following attributes and levels were chosen for the conjoint analysis as in Table 2: energy efficiency level, environment-certified, brand, price, and design. The energy efficiency level of window sets ranges from 1 to 5, with efficiency level 1 window sets being the most efficient. The more energy efficient the window, the less heat loss occurs. Further, energy savings can be achieved through the reduction in heating. Thus, the energy efficiency level is a significant factor to examine preference towards window sets. The Eco-Labeling Program is designed to display a logo (environment-certified mark) on the product to provide environmental information to the consumer, encouraging voluntary environmental purchasing and inducing firms to produce eco-products in line with consumers’ eco-friendly product purchasing preferences [31]. Environment certification (eco-labeled) is also used as an important attribute in this analysis. Brand, price, and design are other attributes used for the window sets’ preference examination. Pictures of window sets of different design levels are given with the description to help the explanation.
The choice experiments were designed using five attributes that a consumer considers in purchasing window sets. Based on the combinations of each attribute’s level, as presented in Table 2, there are a total of 162 (=3×2×3×3×3) attribute combinations. However, due to the difficulty in asking each respondent to evaluate all 162 alternatives, we used a fractional factorial design to select 18 orthogonal alternatives in order to assure the orthogonality of each attribute within and between alternatives. After reducing the number of alternatives to 18 for the conjoint survey, a total of eight questions were constructed by combining three alternatives for each question, as shown in Figure 1. Then, the respondents were asked to select their most preferred alternative among the three alternatives. These were further divided into eight choice sets, comprising four randomly arranged alternatives. After analyzing the consumer window set preferences, we conducted a scenario analysis to examine changes in the choice probability.

4. Results and Discussion

4.1. Data Description

The data for this study were collected from 530 people (20–65 years old) residing in South Korea from April 19 to April 24, 2017 through an random sampling online survey method. Table 3 summarizes the respondents’ demographic characteristics and Table 4 summarizes the respondents’ residence characteristics.

4.2. Analysis Results

In this study, a mixed logit model was used to estimate the survey results. The mixed logit model [32] is widely used to analyze consumer preferences, allowing for the consideration of individual preference heterogeneity by assuming that a set of preference parameters follows a continuous normal distribution. As the mixed logit model is a flexible model that can estimate taste variations, unrestricted substitution patterns, and correlations between unobserved factors over time [33], it has been used in various studies to analyze behavior change at the individual level [28,29,34,35].
Equation (1) shows the utility function that was used to estimate the preferences for product attributes. The utility for the window product was determined by energy level, environment-index certificate, window brand, price, and design. Table 2 includes additional explanations for each attribute. Attributes for energy, environment, brand, and design were included as dummy variables (e.g., D e n e r g y   e f f   l e v 1 = 1 if the window energy level is 1 and D e n e r g y   e f f   l e v 1 = 0 otherwise). Table 5 illustrates the results of the attribute estimation.
Unj = βn,energy eff lev1Denergy eff lev1
+ βn,energy eff lev2Denergy eff lev2 + βn,env-certifiedDenv-certified
+ βn,brandADbrandA + βn,brandBDbrandB + βn,priceXprice
+ βn,design_dignifiedDdesign_dignified
+ βn,design_practicalDdesign_practical + εnj
The positive coefficient sign indicates that the utility of the attribute increases as the attribute level increases. For the attribute of energy efficiency, the lower the energy consumption efficiency grade, the less energy loss the window will have. Thus, it is reasonable that the estimated results indicated that level 1 was more preferred over the energy efficiency levels 2 and 3. The certified environment-friendly index was preferred. For the brand attribute, brand A, the largest window company in South Korea was the most preferred, followed by brand B and then small–medium companies. For the design attribute, practical designs were most preferred over classy and dignified designs.
As a next step, consumers’ marginal willingness to pay (MWTP) is calculated todetermine the amount of consumer utility change as the level of attribute changes in monetary terms.
M e d i a n   M W T P X j t = M e d i a n ( U n j / x j t U n j / x j p r i c e ) = M e d i a n ( β t β p r i c e )
The MWTP estimates indicate the amount that a consumer is willing to pay in exchange for one additional unit of the attribute. For example, a customer would be willing to pay USD 3224 more for the certified environmentally-friendly indexed window. Furthermore, the relative importance measure enables researchers to compare across attributes and thereby, identify which attributes have the greatest impact on decision-making equation (3) depicts this calculation [36].
R I K = p a r t w o r t h K k p a r t w o r t h k × 100
According to the calculated relative importance of the attributes, price is the attribute that is considered to be most important when purchasing windows, followed by energy efficiency level, the environment, design, and brand. A notable result is that consumers consider the price to be the most important attribute, with the second-most important attribute being the window sets’ energy efficiency levels. Consumers who are aware of the energy savings arising from energy-efficient window sets will be willing to pay more for the more energy-efficient windows.

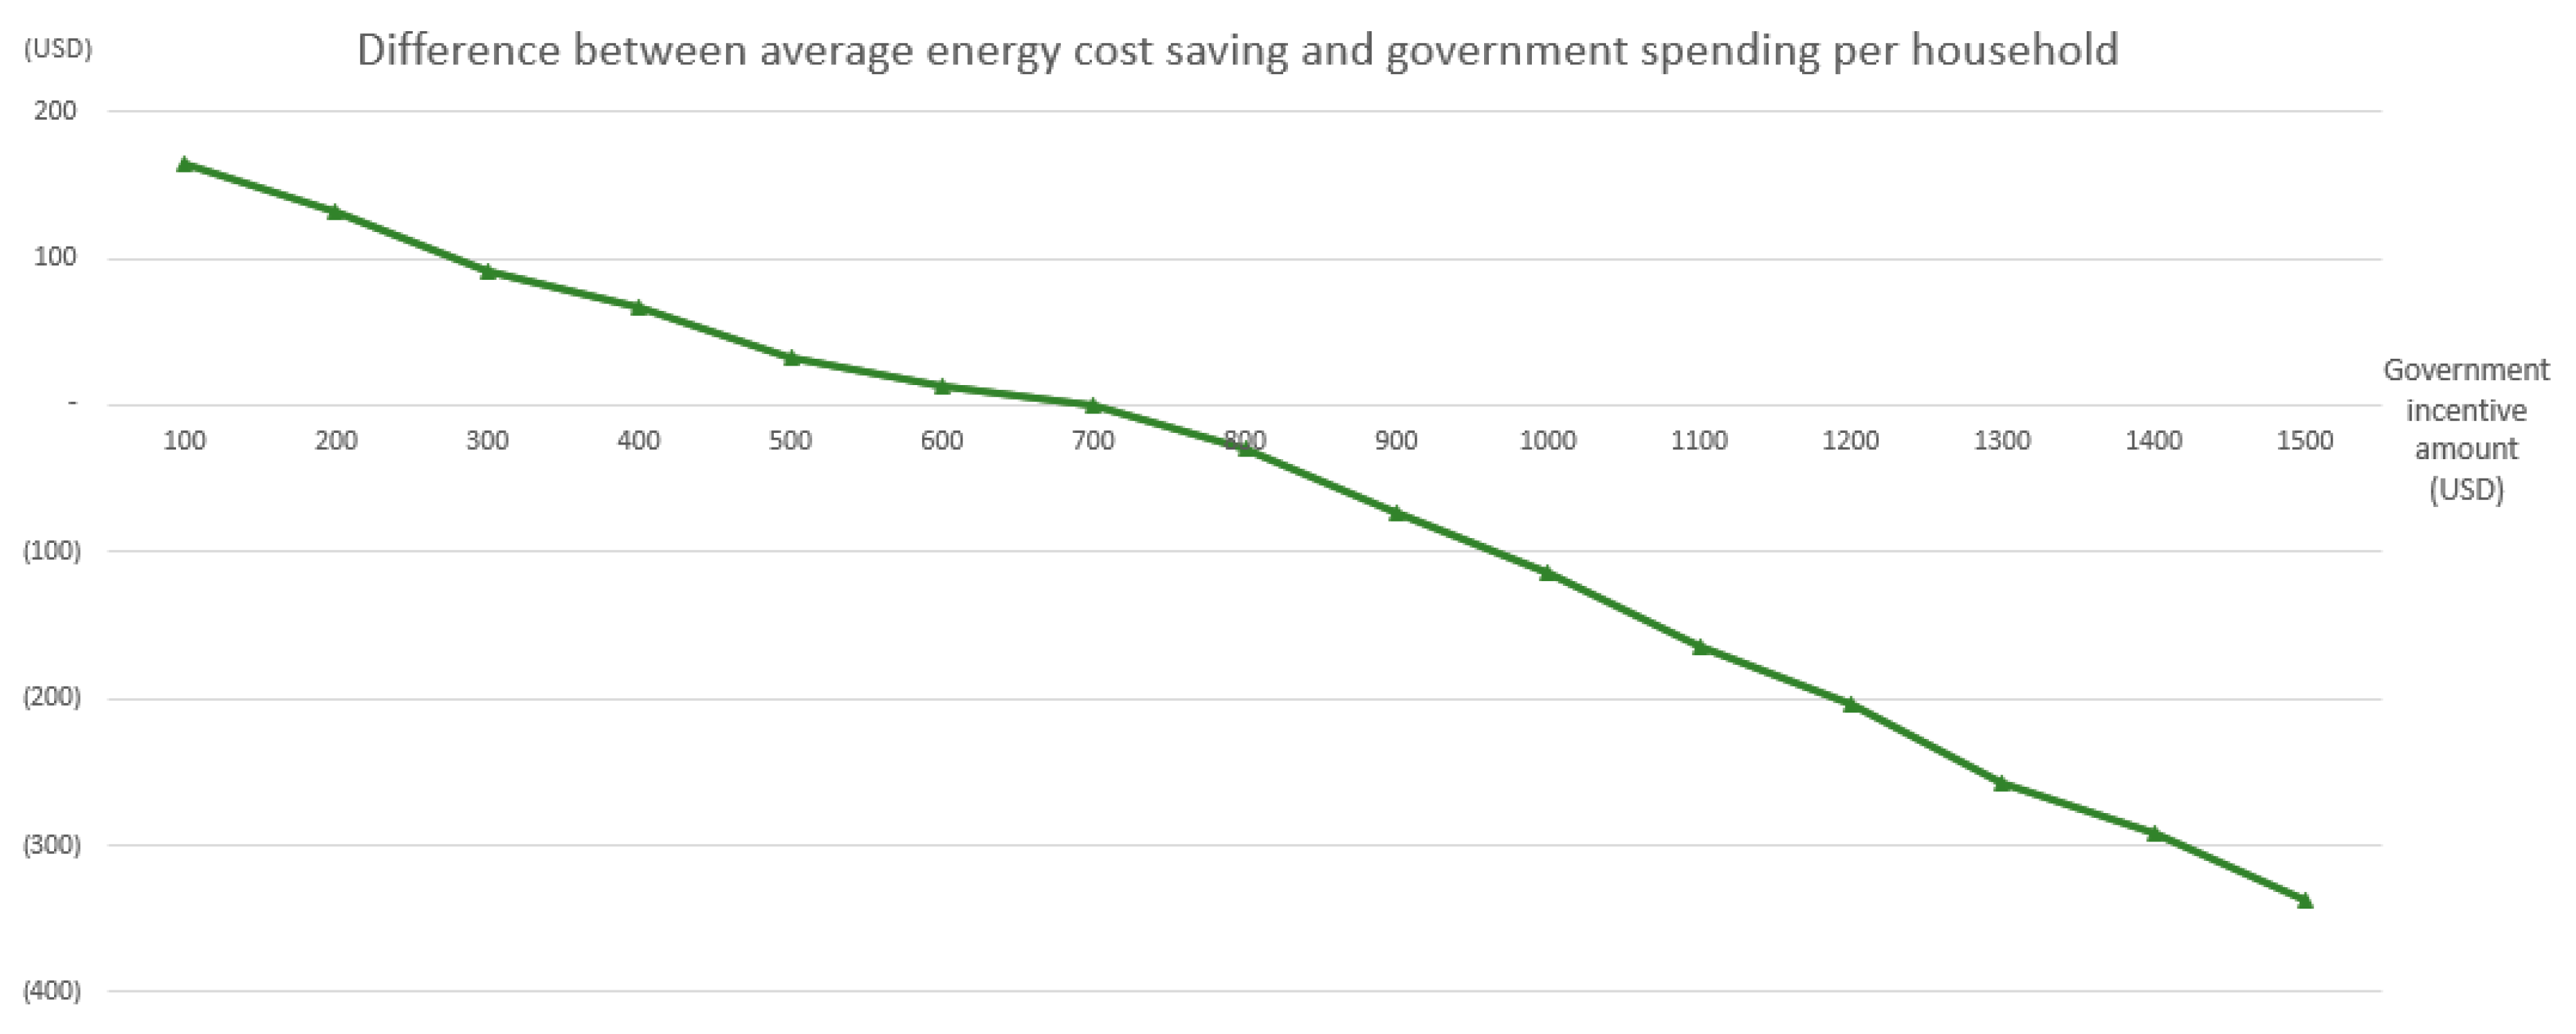
4.3. Simulation Analysis

Using the estimation results, choice probability was calculated based on the change of each window attribute. The choice probability of a mixed logit model was calculated using Equation 4 [37].
C P n i = ( e β n x n j i e β n x n j ) f ( β ) d β
As for the scenario analysis, Table 6 replicated the real market situation as the base scenario of the window market. The current window market share for brand A, B, and small–med size companies are approximately 40%, 30%, and 30%, respectively, in South Korea. The market share for each energy efficiency level from 1 to 5 are 27.4%, 38.5%, 27.0%, 5.6%, and 1.4%, respectively [38]. Taking the real market percentage of each energy efficiency level for brand A, B, and small–med size companies and price in the market accordingly, a scenario is constructed with ten alternatives as in Table 6.
The alternative A indicates that the window is brand A, energy efficiency level 1, certified with an environment-friendly index, and has a classy design. When the window market is stipulated as in Table 1, the choice probability for the alternative A type of window is 23.4%. In this scenario, the choice probability for the window by energy efficiency accumulates to 52.4% for level 1, 22.3% for level 2, 25.2% for level 3 or lower.
Further, a scenario analysis is designed to examine the preference changing of the efficiency level of window sets when incentives are provided. In promoting the eco-friendly consumption of households, the Korean government has implemented a program in which the government returns 10% of the purchase price back to the household who purchased the high energy efficiency products during a certain period [39]. Although this program was limited to electronic products, including televisions, air conditioners, refrigerators, kimchi refrigerators, and air cleaners, this program was designed to encourage households to purchase high efficiency products. As such incentives encourage households to purchase products of high efficiency, this study conducts an incentive scenario analysis considering the individual household’s willingness to pay for window sets of efficiency level 1. For the analysis, the following assumption is made: every household is a rational consumer, meaning that households behave rationally in purchasing window sets and consider the potential energy saving cost of energy efficient windows. The scenario analysis result is shown in Figure 2. The difference between household’s energy cost savings from using higher energy efficiency windows and government incentives to window sets of the energy efficiency level is calculated on the y-axis. The negative difference value indicates that the effect of the government incentive is higher than the household’s willingness to pay for a window set of energy efficiency level 1. According to the scenario analysis result, a government incentive of USD 700 would be the appropriate amount to encourage households to purchase high-efficiency windows. An incentive higher than USD 700 is more than enough to change a household’s willingness to use window set of energy efficiency level 1.
The average household expenditure on energy and heat consumption is KRW 96,969 (approximately USD 97) per month, with the standard deviation of KRW 13,250 (approximately USD 13) [40]. As the average lifespan of a building is 22.4 years [14], and the energy saving rate of using the window sets that have energy efficiency level 1 instead of 2 is 3~4% [41], the average energy consumption cost savings from using window with energy efficiency level 1 instead of 2 accumulates to KRW 781,955 (≈USD 782) to 1,042,606 (≈USD 1043) per residential unit. This approximated calculation is similar to the results of the scenario analysis above. However, the energy consumption is not just a matter of spending money, but also a matter environmental impact. The carbon dioxide emissions from the total energy consumption in the residential sector is 3.275 tCO2/year [42] and it is important to keep in mind that energy saving affects the environment as well.

5. Conclusions

This study analyzed the preferences and role of energy efficiency level of the window sets in South Korea. One of Korea’s passive strategies in its emission reduction plan is reducing energy consumption through the use of the energy-efficient building materials. As one of the main materials used in buildings, windows have a significant influence on energy and the environment. As most heat and energy loss in buildings occurs through windows, this study examined the possible energy savings resulting from using more energy efficient windows. While comparing the choice probability of window sets based on preferences for energy efficiency levels, this study included consumer preferences for brand, design, and price of window sets. The estimated results indicated that energy efficiency level 1 was preferred over levels 2 and 3. Environment-friendly certified windows were preferred over uncertified windows. Furthermore, the estimation results and the scenario analysis illustrate that window prices and energy efficiency levels are the two important attributes which influence consumers in their decision to purchase window sets.
This study examined South Korea’s energy reduction policies in its building sectors, especially focusing on window sets, as this is an included in component of the ZEB policies’ passive strategy. Additionally, the possible energy cost savings gained through choosing energy-efficient windows were examined in the scenario analysis.
As window sets are important to a building’s interior appearance, it was necessary to consider consumer preferences. However, one limitation with this approach is that there are cases in which the construction agents, as opposed to the consumers, decide which building materials will be used. The residents that incur the energy savings or consumption are often not the same individuals (i.e., the construction agents) who paid for the building materials. Although the amount of energy savings gained by choosing energy efficient windows is not large enough to strictly regulate windows, it is still meaningful for consumers to consider and participate in environmental policies. There are various R&D efforts being undertaken to improve the energy efficiency of products, including window sets. This study contributes to the existing literature by reviewing energy policies in the building sector, specific to South Korea’s passive strategies, and examined consumers’ choices regarding the energy efficiency level of window sets.

Author Contributions

The main framework of this research is developed by Y.K., K.B.M. and J.J., K.B.M. constructed the theoretical part of the study and designing the survey for the data collection, while J.J. conducted the empirical analysis. Y.K. administrated overall review and editing of the paper.

Funding

This research received no external funding.

Acknowledgments

This study is restructured based on the M.S. thesis titled, “Window Consumer preference study & establish a technology roadmap (Using conjoint analysis & quality functional deployment)” conducted at Seoul National University (2018). Additionally, this work is supported by the Korea Ministry of Environment (MOE) as part of the “Climate Change Correspondence Program” (2014001300001).

Conflicts of Interest

The authors declare no conflict of interest.

References

  1. IPCC. AR5 Synthesis Report: Climate Change 2014. 2014. Available online: https://www.ipcc.ch/report/ar5/syr/ (accessed on 2 April 2019).
  2. International Energy Agency. Towards Sustainable Urban Energy Systems; ETP (Energy Technology Perspective) Annual Report; IEA: Paris, France, 2016. [Google Scholar]
  3. Kamal-Chaoui, L.; Grazi, F.; Joo, J.; Plouin, M. The Implementation of the Korean Green Growth Strategy in Urban Areas; OECD Regional Development Working Papers; OECD Publishing: Paris, France, 2011. [Google Scholar] [CrossRef]
  4. Korea Energy Economics Institute (KEEI). Korean Energy Statistics Information. 2011. Available online: www.kesis.net (accessed on 11 May 2011).
  5. Rhodes, C.J. The 2015 Paris Climate Change Conference: Cop21. Sci. Prog. 2016, 99, 97–104. [Google Scholar] [CrossRef] [PubMed]
  6. NRDC. Issue Brief. In Proceedings of the 2015 Paris Climate Conference, Paris, France, 30 November–12 December 2015. [Google Scholar]
  7. Korea Energy Economics Institute (KEEI). A Study on the Energy Policy of Building by Analyzing Energy Consumption Factor of Residential Building. 2017. Available online: http://www.keei.re.kr/web_keei/d_results.nsf/0/8B487340CA0DFABB49258260001B3410/$file/.pdf (accessed on 2 April 2019). (In Korean).
  8. United Nations Environment Programme (UNEP). Buildings and Climate Change Summary for Decision-Makers; UNEP DTIE Sustainable Consumption and Production Branch: Paris, France, 2009; p. 62. [Google Scholar]
  9. Schuetze, T. Zero emission buildings in Korea—History, status quo, and future prospects. Sustainability 2015, 7, 2745–2767. [Google Scholar] [CrossRef]
  10. Korea Energy Master Plan: Outlook & Policies to 2035; Ministry of Trade Industry and Energy: Sejong City, Korea, 2014.
  11. Program for Promoting NRE Deployment: 1 Million Green Homes Program. Korea Energy Management Corporation. Available online: www.kemco.or.kr/new_eng/pg02/pg02040602.asp (accessed on 11 March 2019).
  12. IPCC. AR4 Synthesis Report. 2007. Available online: https://www.ipcc.ch/report/ar4/syr/ (accessed on 11 March 2019).
  13. Oh, J.; Hong, T.; Kim, H.; An, J.; Jeong, K.; Koo, C. Advanced strategies for net-zero energy building: Focused on the early phase and usage phase of a building’s life cycle. Sustainability 2017, 9, 2272. [Google Scholar] [CrossRef]
  14. Shim, S.; Park, B.; Kim, S.; Ko, J.; Shin, J. A study on estimation of heat loss rate per envelope-part of residential building. J. Archit. Inst. Korea 2017, 37, 1021–1022. (In Korean) [Google Scholar]
  15. Seo, S.; Hwang, Y. An estimation of construction and demolition debris in Seoul, Korea: Waste amount, type, and estimating model. J. Air Waste Manag. Assoc. 1999, 49, 980–985. [Google Scholar] [CrossRef] [PubMed]
  16. Murtishaw, S.; Sathaye, J. Quantifying the Effect of the Principal-Agent Problem on U.S. Residential Energy Use; Rep. No. LBNL-59773; Lawrence Berkeley National Laboratory (LBNL): Berkeley, CA, USA, 2006.
  17. Organisation for Economic Co-operation and Development. Greening Household Behaviour: The Role of Public Policy; OECD Publishing: Paris, France, 2011. [Google Scholar]
  18. Global Market Insights: HVAC and Construction. Windows and Doors Market Size by Material, by Application, Industry Analysis Report, Regional Outlook, Growth Potential, Price Trends, Competitive Market Share & Forecast, 2018–2024. 2018. Available online: https://www.gminsights.com/industry-analysis/windows-and-doors-market-size (accessed on 2 April 2019).
  19. Cho, S. Domestic and overseas window performance. Korean Inst. Archit. Sustain. Environ. Build. Syst. 2010, 6, 27–34. (In Korean) [Google Scholar]
  20. Cho, S. Window Technologies for Realization of Passive & Zero Energy House. Korean Inst. Archit. Sustain. Environ. Build. Syst. 2014, 58, 21–25. (In Korean) [Google Scholar]
  21. EU Gateway. Construction & Building Technologies: Korea Market Study; EU-Gateway to Korea: Seoul, Korea, 2016; pp. 1–91. [Google Scholar]
  22. Kim, Y.D. Proposal of Enhanced Law on Fine Particle Filtering Criteria in Building Ventilation System. News1 Korea. 3 March 2013. Available online: http://news1.kr/articles/?2136168 (accessed on 2 April 2019).
  23. Market, O.D. Global Industry Analysis, Size, Share, Growth, Trends and Forecast, 2013–2019; Transparency Market Research: Albany, NY, USA, 2015. [Google Scholar]
  24. Costa, S.; Garcia, S.; Ibanez, L. Do taste and quality perception influence consumer preferences for wood? An econometric model with latent variables. For. Sci. 2011, 57, 89–101. [Google Scholar]
  25. Goucher-Lambert, K.; Cagan, J. The impact of sustainability on consumer preference judgments of product attributes. J. Mech. Des. 2015, 137, 081401. [Google Scholar] [CrossRef]
  26. Ministry of Knowledge Economy and Korea Energy Management Corporation. Korea’s Energy Standards & Labeling. 2015. Available online: http://www.kemco.or.kr/nd_file/kemco_eng/KoreaEnergyStandards&Labeling.pdf (accessed on 2 May 2019).
  27. Korean Standard Association. KS F 2278 Standard Test Method for Thermal Resistance for Windows and Doors; Korean Standard Association: Seoul, Korea, 2014. (In Korean) [Google Scholar]
  28. Koo, S.; Park, S.; Song, J.H.; Song, S.Y. Effect of surface thermal resistance on the simulation accuracy of the condensation risk assessment for a high-performance window. Energies 2018, 11, 382. [Google Scholar] [CrossRef]
  29. Koo, Y.; Lee, M.; Cho, Y. A point card system for public transport utilization in Korea. Transp. Res. D 2013, 22, 70–74. [Google Scholar] [CrossRef]
  30. Jung, J.; Koo, Y. Analyzing the Effects of Car Sharing Services on the Reduction of Greenhouse Gas (GHG) Emissions. Sustainability 2018, 10, 539. [Google Scholar] [CrossRef]
  31. KEITI (Korea Environmental Industry & Technology Institute). What Is Korea Eco-Lable? Available online: http://el.keiti.re.kr/service/page.do?mMenu=1&sMenu=1 (accessed on 2 April 2019). (In Korean).
  32. Dikmen, I.; Birgonul, M.T.; Kiziltas, S. Strategic use of quality function deployment (QFD) in the construction industry. Build. Environ. 2005, 40, 245–255. [Google Scholar] [CrossRef]
  33. McFadden, D.; Train, K. Mixed MNL models for discrete response. J. Appl. Econom. 2000, 15, 447–470. [Google Scholar] [CrossRef] [Green Version]
  34. Train, K.E. Discrete Choice Methods with Simulation; Cambridge University Press: Cambridge, UK, 2009. [Google Scholar]
  35. Hong, J.; Koo, Y.; Jeong, G.; Lee, J. Ex-ante evaluation of profitability and government’s subsidy policy on vehicle-to-grid system. Energy Policy 2012, 42, 95–104. [Google Scholar] [CrossRef]
  36. Moon, H.; Choi, H.; Lee, J.; Lee, K.S. Attitudes in Korea toward introducing smart policing technologies: Differences between the general public and police officers. Sustainability 2017, 9, 1921. [Google Scholar] [CrossRef]
  37. Moon, H.; Park, S.Y.; Jeong, C.; Lee, J. Forecasting electricity demand of electric vehicles by analyzing consumers’ charging patterns. Transp. Res. Part D Transp. Environ. 2018, 62, 64–79. [Google Scholar] [CrossRef]
  38. Park, G.; Kim, Y.; Lee, S. Report from Korea Energy Economics Institute (KEEI). 2017, pp. 1–109. Available online: http://www.keei.re.kr/web_keei/d_results.nsf (accessed on 2 April 2019). (In Korean).
  39. Korea Energy Agency (KEA). KEA Brief Issues of Energy: Incentive Programs for the Household Products of Energy Consumption Efficiency Level 1. 2016. Available online: http://www.energy.or.kr/web/kem_home_new/energy_issue/issue_y/pdf/energyissue_2016.pdf/ (accessed on 2 April 2019).
  40. Ministry of Land, Infrastructure, and Transport (MOLIT). A Study on the Improvement of System to Achieve Eco-Friendly Housing Energy Saving Goals. 3 November 2014. Available online: http://www.prism.go.kr/homepage/origin/retrieveOriginDetail.do?cond_organ_id=1613000&research_id=1613000-201500076&pageIndex=1&leftMenuLevel=120 (accessed on 2 April 2019). (In Korean)
  41. Korea Energy Agency Website. Energy Consumption Efficiency Level by Window Sets. 2019. Available online: http://eep.energy.or.kr/certification/certi_list_144.aspx?searhfield=MODEL_TERM&searchword=&record_cnt=108x=98&y=22 (accessed on 2 April 2019). (In Korean).
  42. Korea Energy Economics Institute (KEEI). Energy Consumption Survey. 2017. Available online: http://www.keei.re.kr/keei/download/ECS2017.pdf (accessed on 2 April 2019). (In Korean).
Figure 1. Sample questionnaire used for the conjoint analysis.
Energies 12 01816 g001
Figure 2. Market scenario analysis for the level of government incentive in promoting purchasing of window sets of energy efficiency level 1.
Energies 12 01816 g002
Table 1. Fenestration energy performance rating system in South Korea.
Energy Efficiency LevelHeat Transmission Coefficient or U-Value (W/m2·K)Airtightness (m3/m2·h)
1Below 1.0Level 1
2Below 1.4Below level 1
3Below 2.1Below level 2
4Below 2.8None
5Below 3.4None
Table 2. Window sets’ attributes and levels used for the conjoint analysis.
AttributeAttribute LevelDescription
Energy efficiency levellevel 1The energy efficiency level of a window set is determined by U-Value and airtightness as in Table 1. The lower the energy efficiency level, the more energy efficient the window sets are, which means that the window with efficiency level 1 is the most efficient.
level 2
Below level 3 (base)
Environment-certifiedCertified environment-friendly indexThe energy eco-labeled window is presented as the environment-certified window to provide environmental information to the customers to encourage environmental purchasing.
Uncertified environment-friendly index (base)
BrandBrand AThree brands options are available
Brand B
Small and med-size company (base)
Price USD 16,000 (KRW 16 million)Three price levels are set for the price of the windows
USD 14,000 (KRW 14 million)
USD 12,000 (KRW 12 million)
DesignClassy (base)Windows’ main color, frame, and accessories are defined.
Dignified
Practical
Table 3. Demographic characteristics of the respondents.
ClassificationCategoryRespondentsPercentage
Total530100%
GenderMale19336.4%
Female33763.6%
Age20s15829.8%
30s19737.2%
40s12724.0%
50s417.7%
60s71.3%
Monthly household income (USD *)Less than 999 163.0%
1000–1999 6111.5%
2000–2999 9818.5%
3000–3999 9417.7%
4000–4999 9818.5%
5000–599914527.4%
More than 10,000 183.4%
Number of family membersLess than two16230.6%
Three15328.9%
Four16731.5%
More than five489.1%
* USD 1 ≒ KRW 1000.
Table 4. Residence characteristics of the respondents.
ClassificationCategoryRespondentsPercentage
Total530100%
OwnershipOwned31359.1%
Monthly/yearly rent19737.2%
Not owned203.8%
Residence typeApartment44584.0%
Single house6111.5%
Studio (apartment)152.8%
Other91.7%
Size (unit: pyeong) [1 pyeong = 0.00081 acre = 3.30579 m2]Less than 9224.2%
10–1910820.4%
20–2918234.3%
30–3916931.9%
40–49356.6%
More than 50142.6%
Heating bill in the wintertime (unit: USD *)Less than 100 14226.8%
100–199 25948.9%
200–299 9618.1%
More than 300336.2%
* USD 1 ≒ KRW 1000.
Table 5. Estimation results for the preferences of the window sets’ attributes.
AttributeMeanVarianceMedian MWTP
(unit: USD)
RI
energy efficiency lev12.109 **1.504 **314024.2%
energy efficiency lev20.866 **0.0981256
below lev3 (base)---
environment-certified2.044 **2.978 **322423.5%
environment-uncertified (base)---
brand_A1.167 **0.381 **169311.8%
brand_B1.131 **0.0081639
small/med-size company (base)---
price−0.686 **0.226 **-27.5%
design_classy (base)---13.1%
design_dignified−1.304 **0.076−1904
design_practical0.261 **0.106 **372
** indicates statistical significance of p < 0.01.
Table 6. The base scenario of the window market.
AttributeABCDEFGHIJ
Energy efficiency levelLevel 1Level 2Level 3+Level 3+Level 1Level 2Level 3+Level 1Level 2Level 3+
Environment-friendly indexCertifiedCertifiedCertifiedUncertifiedCertifiedUncertifiedUncertifiedCertifiedUncertifiedUncertified
BrandBrand ABrand BSmall and med-size company
Price (USD)18,00015,00014,00013,00018,00015,50013,00016,00014,00011,500
DesignClassyClassyClassy
Choice probability23.4%20.6%6.6%4.5%3.0%0.0%0.9%26.0%1.7%13.2%

