Article

Energy Performance Comparison between Liquid-Desiccant-Assisted Air Conditioning System and Dedicated Outdoor Air System in Different Climatic Regions

1
Department of Architectural Engineering, College of Engineering, Hanyang University, 222 Wangsimni-Ro, Seongdong-Gu, Seoul 04763, Korea
2
School of Architecture, Korea National University of Transportation, Chungju 27469, Korea
*
Author to whom correspondence should be addressed.
Energies 2019, 12(9), 1798; https://doi.org/10.3390/en12091798
Submission received: 25 April 2019 / Revised: 8 May 2019 / Accepted: 9 May 2019 / Published: 11 May 2019

Abstract

:
The main purpose of this research is to analyze and compare the energy performance of two different novel air conditioning systems; one is a dedicated outdoor air system (DOAS) with a parallel system and the other is a heat-pump-integrated liquid-desiccant and evaporative-cooling-assisted 100% outdoor air system (HPLD-IDECOAS). It was assumed that office buildings served by each system were located in six cities representing four different climatic regions in China. The hourly thermal loads of the office buildings meeting the local building design codes of each selected city were predicted by the TRNSYS 18 software package. The hourly thermal load data were imported into the commercial engineering equation solver (EES) program to estimate the operating energy consumption of each system via detailed energy simulations performed using valid system simulation models. The results show that the HPLD-IDECOAS has higher energy-saving potential than the DOAS with a parallel system in climate regions with high humidity, whereas, in dry regions, the difference in energy consumption between the two systems was not significant.

1. Introduction

In China, the energy consumed in the building sector accounts for approximately 30% of the national energy consumption [1], because of increased heating and air conditioning energy consumption. Because various climate regions exist in China, the selection of appropriate energy-conservative heating, ventilation, and air-conditioning (HVAC) systems for each climate region becomes extremely important for reducing the nationwide building energy consumption.
Among the several energy-conserving HVAC systems, two novel applications, the dedicated outdoor air system (DOAS) with a parallel system, and the liquid-desiccant and indirect-direct evaporative-cooling-assisted air conditioning system (LD-IDECOAS) [2,3,4] have been attracting more interest because of their desirable energy-saving and indoor environmental quality enhancement potentials [5,6] compared with conventional variable air volume systems. The LD-IDECOAS is the system that similar to the conventional VAV systems that are maintaining a constant supply air temperature by controlling the air flow volume according to the change of the thermal load values of the server room. In previous studies [3,4], due to a free cooling way by the use of indirect and direct evaporative cooling, the LD-IDECOAS showed high energy-saving potential. The previous studies [3,4] have shown that this liquid-desiccant-assisted (LD) system requires a large amount of thermal energy for aqueous solution regeneration and solution cooling during the summer. Existing research [7,8,9,10,11] indicated that it is generally used to supply heat by the use of low-quality heat sources (e.g., solar energy) or waste heat of district heating [9,10] in the regeneration of the desiccant solution and applying a water-side free cooling approach to the absorber for cooling the desiccant solution to reduce the thermal energy demand of the LD system. However, this way makes the operation and package of the system complicated. A heat-pump can meet the cooling demand and heating demand at the same time, therefore, a heat-pump-integrated liquid-desiccant (HPLD) system is simultaneously suggested to providing solution heating in the regenerator and solution cooling in the absorber to make the operation and package of the LD-IDECOAS more simply. The heat-pump-integrated liquid-desiccant (HPLD) system [11,12] also showed desirable energy saving potential and the HPLD-IDECOAS have been suggested. The DOAS with a parallel system has been indicated as a highly energy-conservative HVAC option for the last decade and has gained popularity as a system for decoupling temperature control from humidity control, in addition to maintaining acceptable indoor air quality [13]. The DOAS is a ventilation system by introducing the minimum ventilation [14], and it is generally used to remove the latent heating load of the server room; therefore, it is regularly used with a parallel system to remove the sensible heating load, and due to the use of 100% outdoor air in the DOAS, it will raise the thermal loads of the server room. Therefore, it is commonly used the enthalpy wheel (EW) to recover heat from the exhaust air (EA) for energy saving, and as a result it shows energy-saving potentials compared to the conventional VAV systems [13,15].
Although one may find several established studies investigating the energy-saving potential of the DOAS with a parallel system or the HPLD-IDECOAS over conventional VAV systems, investigations evaluating the energy performance of both systems in various climate zones are very rare. Consequently, in this study, we compare and analyze the energy performance of both novel air conditioning systems via a series of detailed energy simulations performed for six Chinese cities representing four different climate regions. From the results of this research, one may see the relative energy benefits of both novel HVAC systems in each climate region.

2. System Overview

2.1. HPLD-IDECOAS System Overview

The HPLD-IDECOAS is an evaporative liquid-desiccant system that uses 100% outdoor air. The system shown in Figure 1 consists of an HPLD, an indirect evaporative cooler (IEC), and a direct evaporative cooler (DEC). The HPLD is used to achieve the design humidity ratio of the supply air ( ω S A ). The IEC is used to sensibly cool the process air until the wet-bulb temperature (WBT) of the air leaving the IEC meets the target supply air (SA) WBT. The DEC adiabatically cools the process air until the condition of the air leaving the DEC reaches the target SA temperature on the process air side.
A heating coil (HC) and a sensible heat exchanger (SHE) are employed to sensibly heat the EA on the EA side to heat the process air such that it can meet the neutral deck temperature set point. Two air decks for the process air, a cold one (i.e., 15 °C, cooling season) and a neutral one (i.e., 20 °C, heating season), can be selected depending on the thermal environmental demands of the serving room. Dual duct or multi-zone systems can be used. With respect to the IEC, we will choose the lower one of the WBT in the OA and the return air (RA), then it will be sent to the secondary channel to achieve a better cooling effect in the cooling season. The adopted system was integrated with ceiling radiation heating panels as a parallel sensible heating system, which is applied when the process air supplied by the system is insufficient to meet the sensible heat load in the room in the heating season.

2.1.1. HPLD-IDECOAS Operation Modes

Based on existing research [2,3,4], the operation modes of the LD-IDECOAS can be divided into four modes according to the thermodynamic conditions of the incoming fresh air (OA) on the psychrometric chart in Figure 2. As shown in Figure 2, the psychrometric chart is divided by three lines, “a”, “b”, and “c”. Line “a” stands for the target humidity ratio (HR) of the SA, line “b” represents the wet bulb or the enthalpy of the SA set point, and line “c” is the dry-bulb temperature (DBT) line of the SA set point.
When the OA condition is in Region A, the OA is primarily dehumidified by the LD system, and sensibly cooled by the IEC and isentropically cooled by the DEC to meet the target cold deck supply air temperature (i.e., 15 °C and saturation). When the OA condition is in Region B, the HR of the OA is too low to activate the LD system. Consequently, the LD part is “off”, the OA passes through the IEC and the DEC to reach the SA set point condition. In Region C, the LD and the IEC are bypassed, the process air is only cooled by the DEC to meet the target SA DBT, and the enthalpy of the process air is lower than that the SA target point. In Region D, the LD, IEC, and DEC are turned off, the IEC is considered an SHE, whose efficiency is set to 70%, and thus the OA is only sensibly heated by the IEC and the SHE on the neutral deck. When the sensible heating load of the target room is not demanded by the SA, the parallel sensible heating system is enabled.

2.1.2. Heat-Pump-Driven Liquid-Desiccant (HPLD) Unit

The HPLD system consists of a regenerator to regenerate the solution, an absorber to dehumidify the process air, a sensible heat exchanger (SHE2) for solution heat exchange, and a heat pump is used for solution heating and cooling, as shown in Figure 1.
Compared to the conventional LD system, the condenser and evaporator parts of the heat pump replace the heating and cooling coils. The weak solution is heated by the heat released by the condenser before entering the regeneration section, and the strong solution is cooled after passing through the evaporator (the heat of the strong solution is absorbed by the evaporator).
In this research, the heat pump is operated in a variable-speed compressor-controlled (i.e., inverter control) cooling mode to adjust the capacity of the heat pump to meet the solution cooling demand. An auxiliary heater is required when the heating capacity of the heat pump is below the solution heating demand.

2.2. DOAS with Parallel System Overview

As seen in Figure 3, the DOAS is a ventilation and dehumidification system that uses 100% outdoor air. The system adopted in this study consists of an enthalpy wheel (EW), a cooling coil (CC), and a heating coil (HC), and is integrated with ceiling radiant panels as a parallel sensible cooling and parallel sensible heating system. The EW is used to recover both sensible and latent energy of the EA (primarily dehumidify the process air in the cooling season). The CC is used to dehumidify the process air to meet the target HR. The HC is used to preheat in the cooling season (i.e., 15 °C) and heat the process air to achieve the SA set point temperature in the heating season (i.e., 20 °C). When the space sensible is higher than DOAS capacity, the parallel system is enabled to remove the remaining sensible load. Otherwise, the parallel system is turned off. When the parallel system is enabled, the chiller is supplied to both the CC and the parallel system [13].

DOAS with Parallel System Operation Modes

Referring to previous research [2,15,16], the operation modes of the adopted DOAS are classified as four modes. These are represented by four regions divided by three lines, according to the thermodynamic conditions of the OA on the psychrometric chart shown in Figure 4. The three lines dividing the psychrometric chart are named lines “1”, “2”, and “3”. Line “1” is the enthalpy line of the EA. Line “2” is the line of the target HR of the SA, and line “2” is adjusted according to the change in the latent heat load in the target room. Line “3” is the DBT line of the SA (i.e., 15 °C in the cooling season, 20 °C in the heating season).
During the cooling season, if the enthalpy of the OA is higher than the EA, the enthalpy of the process air reduced after passing through the EW; if not, the EW is inactive. Then the process is air cooled by the CC to meet the target HR (dehumidification process); if the process air temperature through the cooling coil is below the set value, then the HC is enabled to heat the process air to achieve the SA set point temperature. When the space sensible load is not completely removed with the SA, the radiant cooling panels are enabled.
During the heating season, if the HR of the OA is higher than the target HR, then the process air enters the CC for dehumidification to meet the target HR; if the process air temperature is lower than the SA set value, then reheating is required by the HC to meet the SA set value. The radiant heating panels eliminate the part of the space sensible load that was not met with the SA.

3. Experiments Simulation

3.1. Selection of the Region

China has a vast territory, a special geographical location, and complex terrain. Owing to its different geographical latitudes, topography, and other conditions, the climate varies greatly from place to place. Therefore, for different climatic conditions, the energy-saving design of buildings around the country should be different. In order to clarify the scientific relationship between architecture and climate, China’s General Principles for Civil Building Design GB 50352-2005 [17] divides China into seven main climate zones. These regions mainly include severe cold regions, cold regions, hot summer and cold winter regions, hot summer and warm winter regions, and mild regions.
According to the description of the representative cities of various climate regions in China’s “Public Building Energy Efficiency Design Standards” GB 50189-2015 [18], one representative city from each of six climate regions, excluding the severe cold regions as shown in the Figure 5, which were selected to simulate the energy performance of the adopted systems under different outdoor conditions in this study.
The six selected cities are part of six different climate regions, as shown in Figure 5. They are Beijing, Lhasa, Kashi (severe cold regions), Shanghai (hot summer and cold winter regions), Guangzhou (hot summer and warm winter regions), and Kunming (mild regions). These have distinctly different outdoor air conditions and different annual changes. The first three cities belong to a relatively dry climate region, Kunming is a relatively neutral climate region, and the rest are relatively humid climate regions. The differences in the temperature and humidity ratios for the six selected cities can be seen in Figure 6 and Figure 7.

3.2. Building Model Overview

The model building is an office building with a typical floor area of 400 m 2 ( 20   m × 20   m ) and 20 occupants. Each occupant has a computer and performs light work. The meteorological data (i.e., DBT, effective sky temperature, HR, percent relative humidity, and atmospheric pressure) of the six selected cities are input by using the weather data in Type 15-2 provided by TRNSYS18. Through this simulation studio, the OA conditions and the hourly thermal loads of the model building in each city are obtained and used in the simulation calculation. Each computer added 20 KJ/h sensible heat to the serving space, and the heat generation density of the lighting fixtures was set to 17 W/m2 by TRNSYS18. The schedules for the lights, computers, office occupants, and HVAC were set according to ASHRAE90.1 [19]. The set point temperature of the serving room in the cooling and heating seasons were set according to existing standard [20], and the relative humidity was set according to China’s “Code for Design of Heating, Ventilation and Air Conditioning for Civil Buildings” [21]. In the cooling season, the design SA temperature was set to 15 °C, and 20 °C in the heating season. The above conditions are summarized in Table 1.
As shown in Table 1, according to the relevant provisions of China’s “Public Building Energy Efficiency Design Standards” GB 50189-2015 [18], the u-values of the roof, exterior wall, and window, and the window-to-wall ratio of the model building were determined.

3.3. Simulation Overview

This study compared the annual energy consumption of two 100% outdoor air systems (i.e., HPLD-IDECOAS and DOAS, integrated with ceiling radiant panels) for the same model building.

3.3.1. HPLD-IDECOAS Simulation Overview

The main energy-saving potential of this system lies in the HPLD part. The regenerated high-temperature dehumidification solution removes heat from the evaporator of the heat pump, causes the solution to cool to the target temperature, and then supplies it to the dehumidifier. The dehumidification solution removes moisture from the process air in the dehumidifier and becomes a low-concentration solution. After being heated by the condenser of the heat pump, it is regenerated by the regenerator and becomes a high-concentration dehumidification solution. A large amount of heat is usually required during the regeneration of the solution. Most of the existing studies [7,9,10] use a boiler or renewable energy system as the heat source. The heat pump has attracted attention because it can provide solution cooling and heating at the same time and has been applied to the LD-IDECOAS. In order to reduce the consumption of the regeneration part of LD, this study used the HPLD system that the energy consumed by the heat pump to provide the load required for solution cooling and heating of the LD part. It is much lower than the energy consumption of other existing LD systems (i.e., the LD that uses water-side free cooling for the solution cooling, and renewable energy system heat sources for the solution heating), especially the heat required for the solution heating (solution regeneration) [12]. The process air conditions of each component of the HPLD-IDECOAS are calculated using Equations (1)–(15) [2].

Liquid-Desiccant Unit Model

In the absorber, the process air passes through the absorber to remove excess moisture to reach the target HR, because IEC only performs sensible heat exchange. The effectiveness of dehumidification of the LD system is defined as the ratio of the actual moisture removal rate to the maximum rate or the changes in temperature of the process air (it is assumed that ε ab , T is equal to ε ab or ε ab , w in the public literature [9,22]) in the absorber, which is based on the equilibrium HR, as shown in Equations (1) and (2). In these equations, the model proposed by Chung and Luo [23] (Equation (3)) was selected to predict the ε ab value, the value of aZ was set to 100, and the mass flow rate ratio of the process air to the solution was assumed to be 1 in this research:
ε ab , w = ω OA ω LD , out ω OA ω eq , in
ε ab , T = DBT OA DBT LD , out DBT OA T sol , in
ε ab = ( 1 0.024 ( m ˙ a , in m ˙ sol , in ) 0.6 exp ( 1.057 DBT OA T sol , in ) ( aZ ) 0.185 π 0.638 ) ( 1 0.192 exp ( 0.615 DBT OA T sol , in ) π 21.498 )
The equilibrium HR is determined by Equation (4). To obtain the vapor pressure at the saturation condition of the desiccant solution, the equation suggested by Fumo and Goswami [24] is adapted in Equation (5). The coefficients for Equation (5) are shown in the Table 2.
ω eq , in = 0.622 p s 101.325 p s
P s = ( a 0 + a 1 · T sol , in + a 2 · T sol , in 2 ) + ( b 0 + b 1 · T sol , in + b 2 · T sol , in 2 ) · C sol , in + ( c 0 + c 1 · T sol , in + c 2 · T sol , in 2 ) · C sol , in 2
In the regenerator, similar to the absorber, the effectiveness of regeneration of the LD system is expressed by Equations (6) and (7). In this work, it assumed that the effectiveness value of the regeneration is same as that of the absorber. Consequently, ε reg , w and ε reg , T can be obtained. The temperature and humidity ratio of the process air passing through the LD unit is calculated:
ε reg , w = ω air , reg , out ω OA ω reg , w ω OA
ε reg , T = DBT OA DBT LD , out DBT OA T sol , in
In addition, it is assumed this study that LiCl solution is used in the LD system. The desiccant solution of the absorber inlet side and regenerator outlet side were set to 20 °C and 55 °C, respectively. The employed Licl solution concentration is 40%. In the absorber, the mass balance of the desiccant solution is expressed as Equations (8)–(13). The mass flow rates of the desiccant solution at points P1 and P2 are identical (Equation (8)). The mass exchange of the solution in the absorber is as shown by Equations (9)–(11). The concentration of the absorber-leaving solution is estimated using Equation (12). The enthalpy of the absorber-leaving solution is obtained using Equation (13):
m ˙ P 1 , s o l = m ˙ P 2 , s o l
m ˙ P 1 , s o l = m ˙ O A   ( m ˙ a , i n m ˙ s o l , i n = 1 )
m ˙ P 3 , m o i = m ˙ O A ( ω O A ω L D , o u t )
m ˙ P 3 , m o i + m ˙ P 2 , s o l = m ˙ P 4 , s o l
m ˙ P 1 , s o l · C P 1 = m ˙ P 4 , s o l · C P 4
m ˙ P 2 , s o l · h P 2 . s o l + m ˙ P 3 , m o i · h P 3 , m o i = m ˙ P 4 , s o l · h P 4 , s o l
Thus, the mass flow rate, concentration, and enthalpy of the regeneration-leaving desiccant solution are obtained in the same way as shown in Equations (14)–(18):
m ˙ P 5 , s o l = m ˙ P 6 , s o l
m ˙ P 7 , m o i = m ˙ P 3 , m o i
m ˙ P 6 , s o l m ˙ P 7 , m o i = m ˙ P 8 , s o l
m ˙ P 8 , s o l · C P 8 = m ˙ P 6 , s o l · C P 6
m ˙ P 7 , s o l · h P 7 . s o l + m ˙ P 8 , m o i · h P 8 , m o i = m ˙ P 6 , s o l · h P 6 , s o l
The temperature of the solution leaving SHE2 is obtained by Equation (19). In this study, the effectiveness of SHE2 is assumed as 70%. m m i n is the smallest value between m P 8 and m P 4 . Consequently, the solution cooling and heating loads are estimated by Equations (20) and (21):
ε SHE 2 = m P 8 · ( T P 8 T P 1 ) m m i n · ( T P 8 T P 4 ) = m P 4 · ( T P 5 T P 4 ) m m i n · ( T P 8 T P 4 )
Q c o o l i n g = m ˙ P 1 , s o l · C p P 1 , s o l · ( T P 1 T P 2 )
Q h e a t i n g = m ˙ P 5 , s o l · C p P 5 , s o l · ( T P 6 T P 5 )

IEC and DEC Unit Models

Using the temperature and HR of the process air leaving the LD unit, the DBT of the process air leaving the IEC ( DBT IEC , pri , out ) can be determined by Equation (22), which is calculated by the WBT of the return air through the secondary IEC channel ( WBT IEC , sec , in ) and the effectiveness of the IEC ( ε IEC ) [2,3]. Similarly, the WBT of the process air leaving the DEC ( WBT IEC , pri , in ) can be obtained. Since, in the IEC in HPLD-IDECOAS, neither condensation nor dehumidification will occur, the HR of the IEC-leaving process air ( WBT IEC , pri , in ) is equal to that of the LD-leaving process air ( ω LD , out ). In this work, the effectiveness of the IEC and the DEC are assumed as 70% and 90%, respectively:
ε IEC = DBT LD , out DBT IEC , pri , out DBT LD , out WBT IEC , sec , in
ε DEC = DBT IEC , pri , out DBT DEC , out DBT IEC , pri , out WBT IEC , pri , out

Target Air Conditions

The target space conditions are assumed as a DBT of 26 °C and RH of 50% in summer and intermediate seasons, and are set to a DBT of 20 °C and RH of 50% in winter. Consequently, the design SA flow rate is determined by Equation (24). The design SA HR is obtained by Equation (25):
Q sen = m ˙ SA c p ( DBT RA DBT SA )
Q lat = h fg m ˙ SA ( ω RA ω SA )

Heat Pump Model

In this study, the heat pump is in the variable-speed compressor control by using cooling mode. The capacity of the evaporator (i.e., load-side, Equation (26)) of the heat pump can be represented by four operating parameters (the volumetric flow rates ( V ˙ s o u r c e ,   V ˙ l o a d ) and inlet temperatures ( T s o u r c e , i n , T l o a d , i n ) of the solution on the source and load sides). The load-side and source-side capacities are the cooling and heating capacities of the heat pump at the evaporator and condenser, respectively. The reference values and coefficients used in Equation (26) are presented in Table 3 [25]. Consequently, the heat-pump cooling capacity (i.e., evaporator capacity) is modulated to match the solution cooling demand, the power and heat-pump heating capacity (i.e., condenser capacity) are adjusted accordingly, and the compressor frequency ( F r e q P L R c ) and power ( P o w e r P L R c ) as a function of the part-load ratio ( P L R c ) were used based on the research by Madani et al. [26], as shown in Equations (27)–(29). The power ( P o w e r P L R c ) is the power required by the heat pump operation. The adjusted heating capacity of the heat pump is presented by Equation (30), and an auxiliary heating is required when it cannot achieve the solution heating load ( Q h e a t i n g ):
Q l o a d , c Q l o a d , c , r e f = A 1 + A 2 · [ T l o a d , i n T r e f ] + A 3 · [ T s o u r c e , i n T r e f ] +   A 4 · [ V ˙ l o a d V ˙ l o a d , r e f , ] + A 5 · [ V ˙ s o u r c e V ˙ s o u r c e , r e f ]
P L R c = Q c o o l i n g Q l o a d , c
F r e q P L R c = 1.28329127 · e x p 2 + 4.55418482 · e x p 1 · P L R c + 5.40172160 · e x p 1 · P L R c 2
P o w e r P L R c = 4.74753792 · F r e q P L R c · e x p 2 + 6.20369156 · F r e q P L R c · P L R c · e x p 1 + 3.35400111 · e x p 1 · F r e q P L R c 2
Q s o u r c e , P L R c = Q c o o l i n g + P o w e r P L R c

3.3.2. DOAS with Parallel Simulation Overview

The highest energy conservation benefit comes from the EW part. The EW is an energy recovery process that utilizes the exchange of sensible heat and latent heat between the EA and the OA to achieve energy conservation and maintain good ventilation. In the summer, the OA can be pre-cooled and dehumidified, and can be preheated and humidified in winter, thus reducing the cooling load and power consumption during air conditioning operation. Simultaneously, for more energy-efficient ventilation, the minimum ventilation is used, and the minimum ventilation is calculated according to the ASHRAE standard 62.1-2013 [14] regulations.

Enthalpy Wheel Control

According to existing research [13], the EW works in three modes, which are changed by adjusting the rotational speed to achieve the enthalpy exchange efficiency (sensible and latent exchange efficiency) required by each operation. According to the SA set point and the enthalpy of the return air (RA) and OA (Mumma and Shank 2001 [27,28]), the control models of EW are divided into full speed operation, wheel-off operation, and speed modulation.
Based on existing research [13], when the enthalpy of the OA is higher than that of the RA (Region A), the EW operates in full-speed mode with the highest enthalpy exchange efficiency, which is set to 80% in this study, and it is assumed here that the sensible efficiency (SE) is equal to the latent one (LE). When the OA condition is in Region B of Figure 4, activating the EW will increase the enthalpy of the OA; that is, the temperature and humidity will increase, thereby increasing the CC load, which is contrary to the energy saving target. As a result, the EW is turned off. When the OA condition is in Region C, the EW will run in variable-speed driven (speed modulation) mode to maintain the SA target conditions.
In the variable-speed driven model, the SE and the LE are not necessarily equal. To express the EW performance, the driving force ratio (DFR) is proposed, which is related to the ratio of the latent load ( Q l a t ) to the sensible load ( Q s e n ) and the OA RH, as shown in Equation (31) [13]. Based on existing research, when the DFR is less than 1.5, the SE leads the LE in this model. Otherwise, the LE leads the SE:
DFR = Q l a t Q s e n × 1 ( R H O A / 100 ) 2
The LE required is derived from the Equation (32). The EW speed ( Spd ) and the SE can be determined based on the value of the DFR and the LE, as shown in Equations (33) and (34). The coefficients for the Spd function are shown in Table 4. And the EW has an efficiency of 80% at maximum operating speed:
LE = ω S A ω O A ω R A ω O A
Spd = c 1 + c 2 ( DFR ) + c 3 ( DFR ) 2 + c 4 ( L E ) + c 5 ( L E ) 2 + c 6 ( DFR ) ( L E ) + c 7 ( DFR ) 2 ( L E ) + c 8 ( DFR ) ( L E ) 2 + c 9 ( DFR ) 2 ( L E ) 2
SE = 13.844 · ln ( Spd ) + 38.469 100

4. Simulation Results and Discussion

According to the EES simulation results of the peak day, monthly, seasonal, and annual energy consumptions of the two systems in each selected city, the applicability difference between the two systems in the selected climate regions represented by each selected city is analyzed, to find the lowest energy consumption in both systems. The operating energy consumed in each system was concerted to primary energy by using local conversion factors of 0.1229 kgce/kWh and 0.03412 kgce/MJ (0.009478 kgce/kWh) for electricity and thermal energy, respectively [29].

4.1. Comparison of Peak Day Energy Consumption

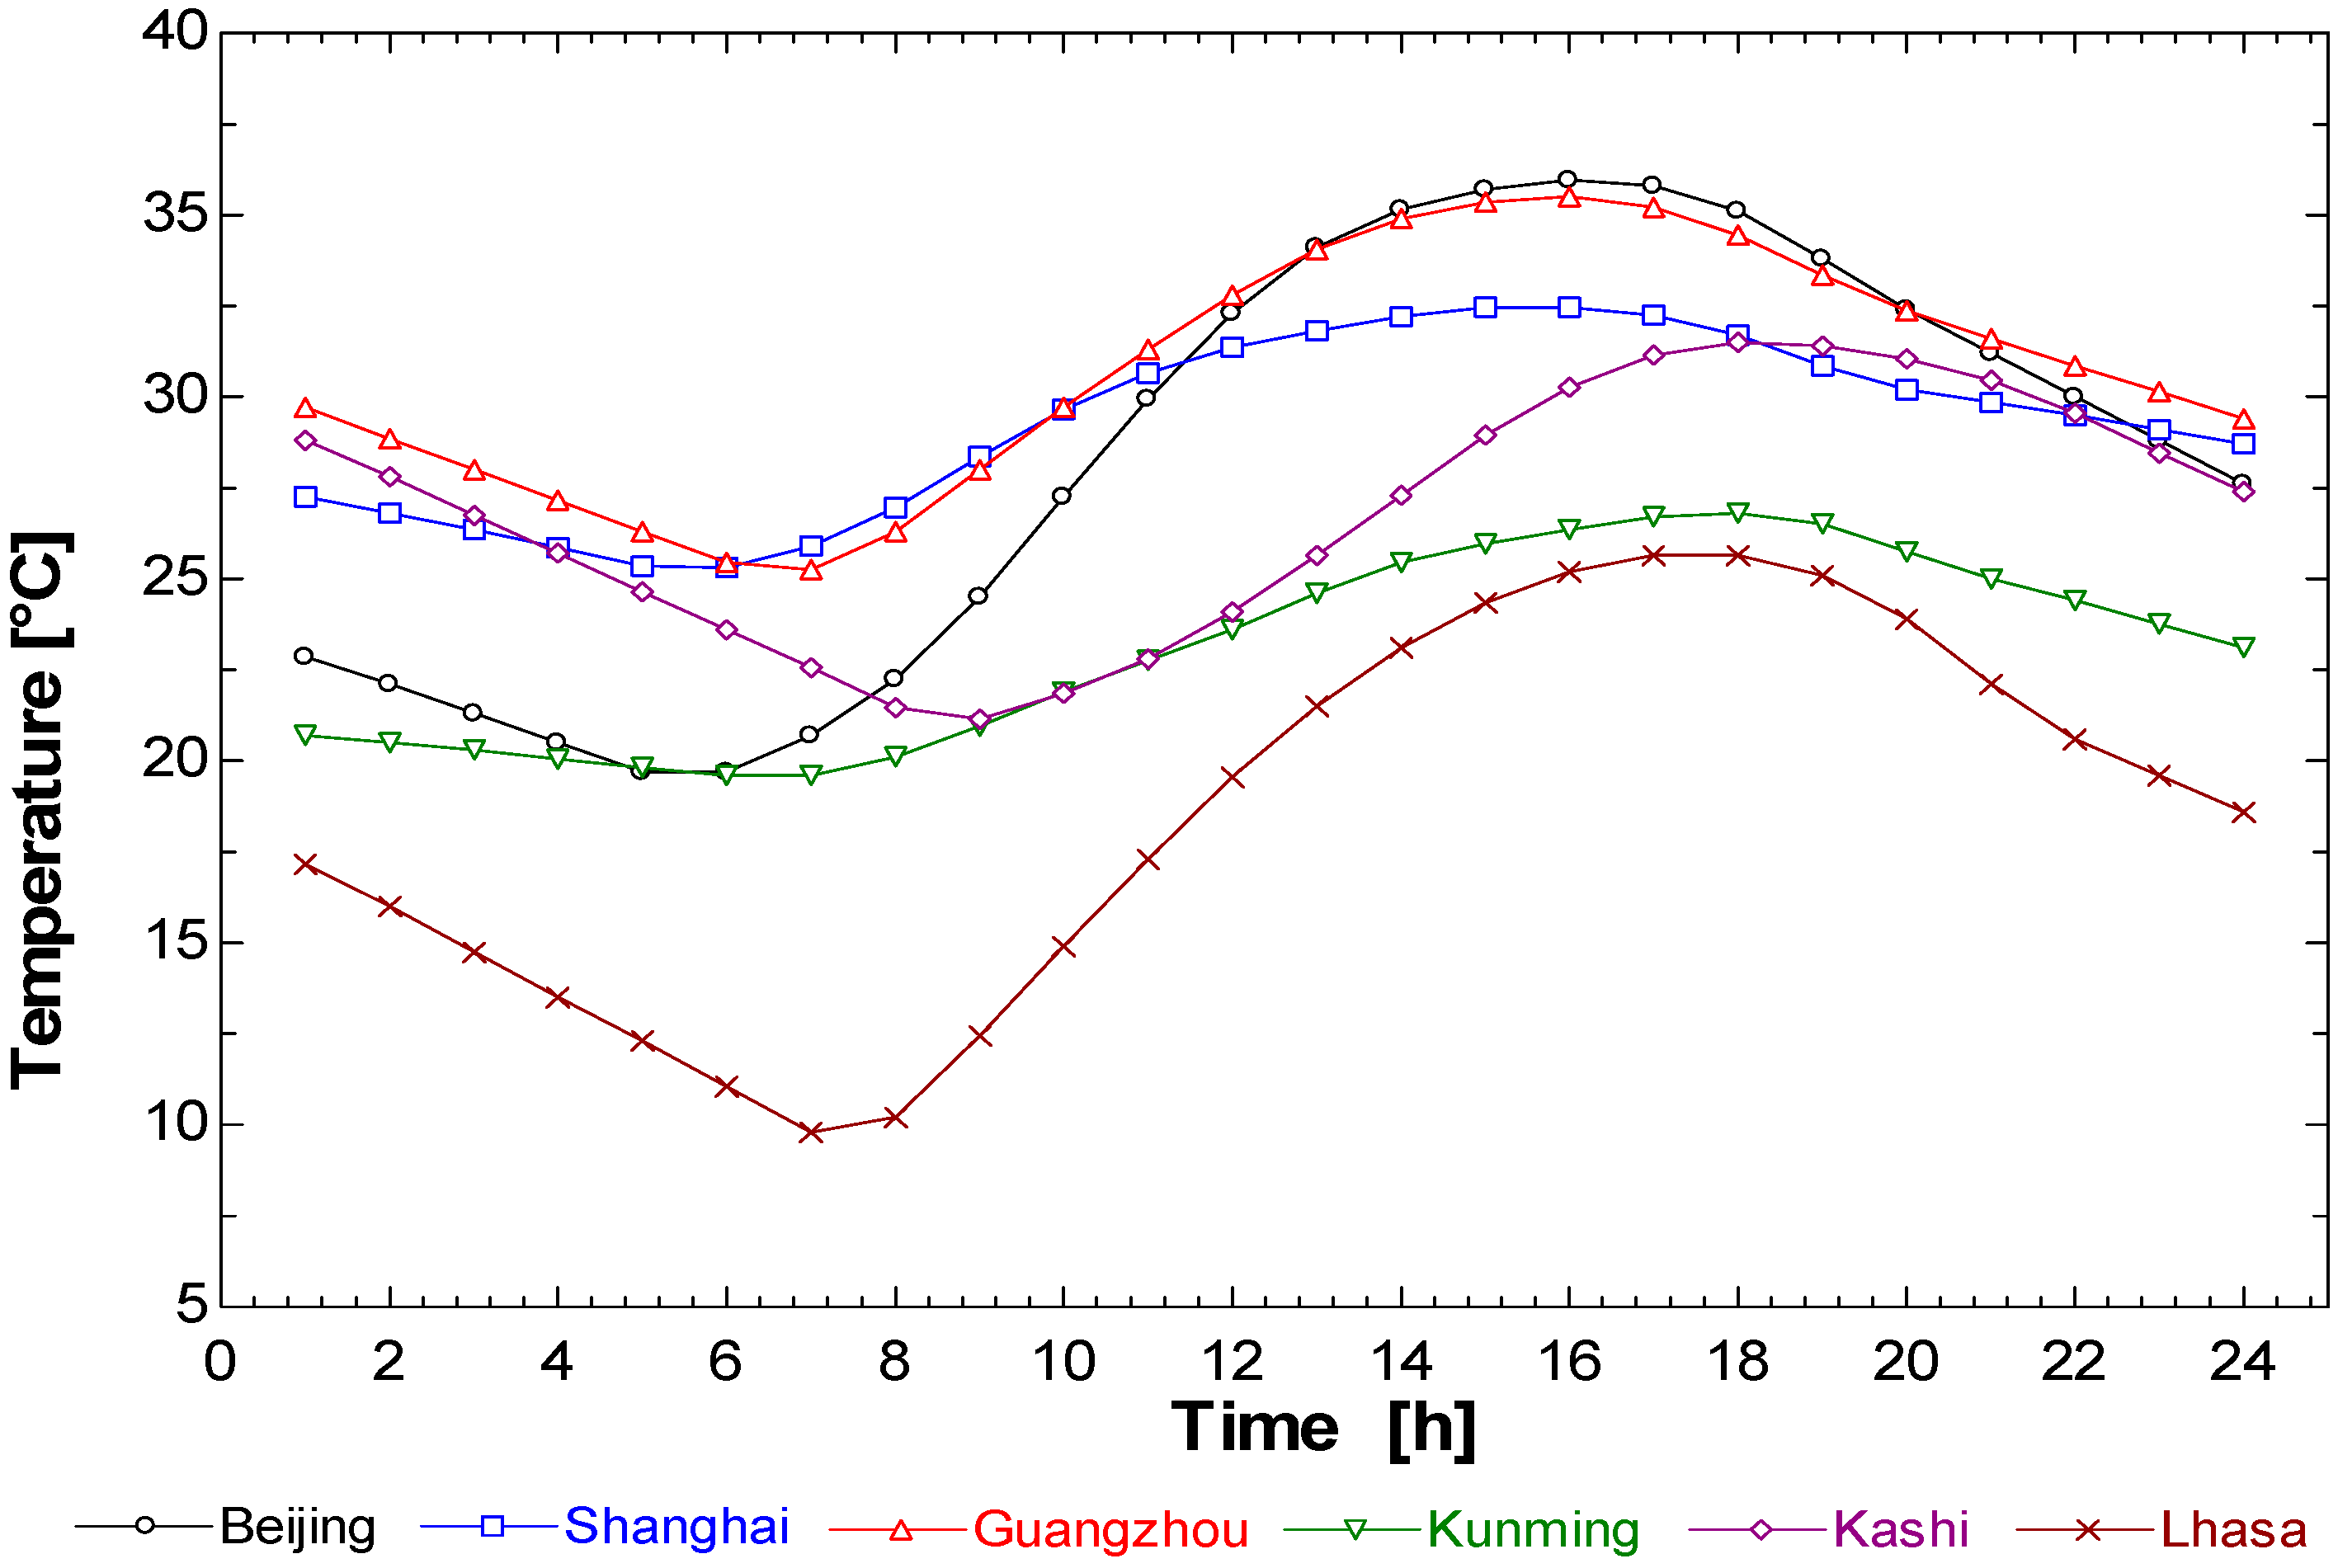
In order to more clearly see the performance characteristics of each system in different climate regions, we selected the peak days of each city as objects for comparison. This part selects the peak day of each selected city and conducts a detailed comparative analysis through thermal conditions from TRNSYS18, such as the temperature (
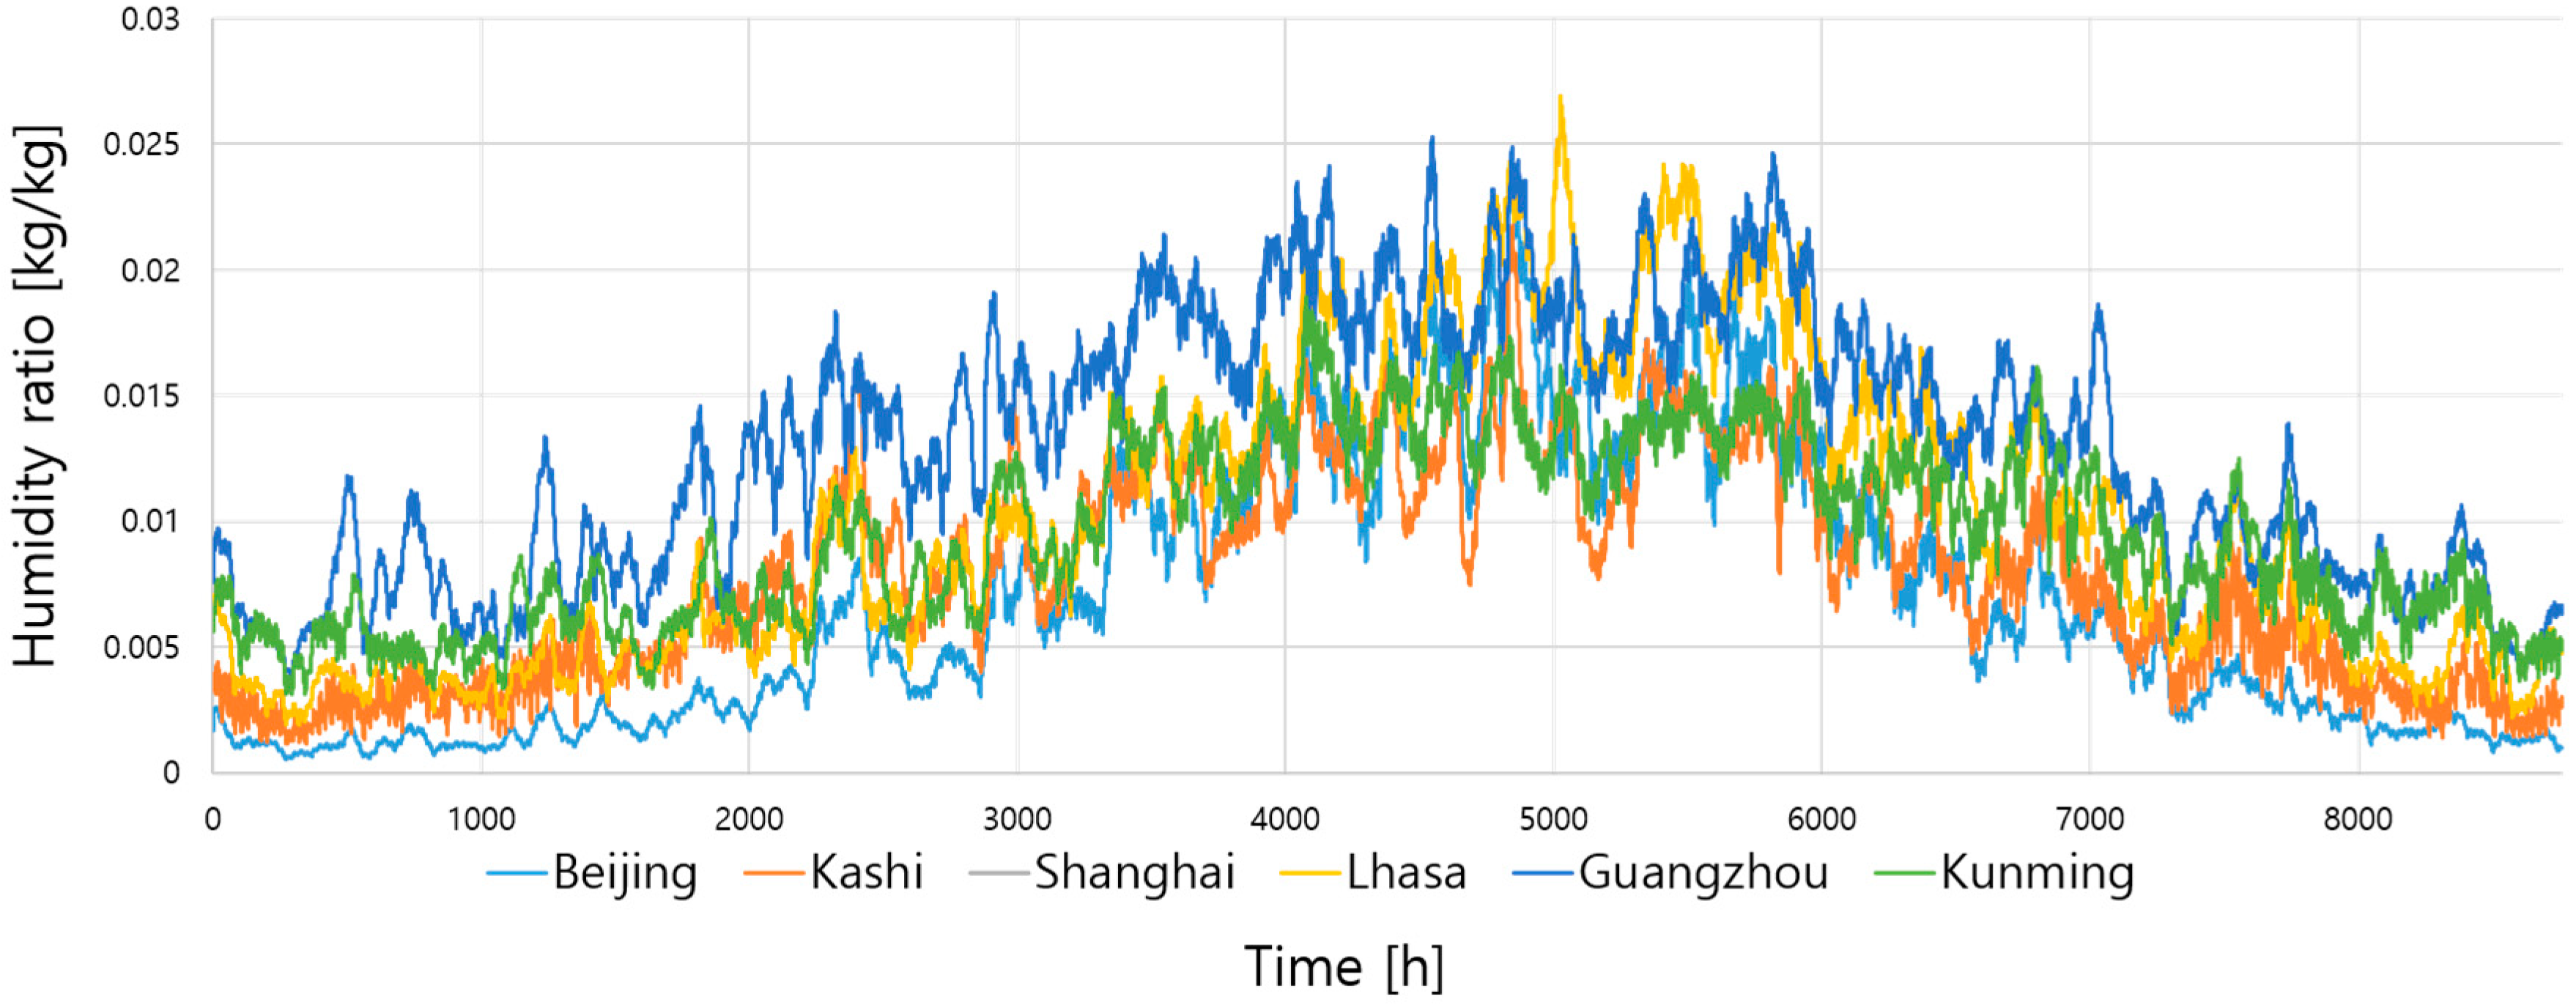
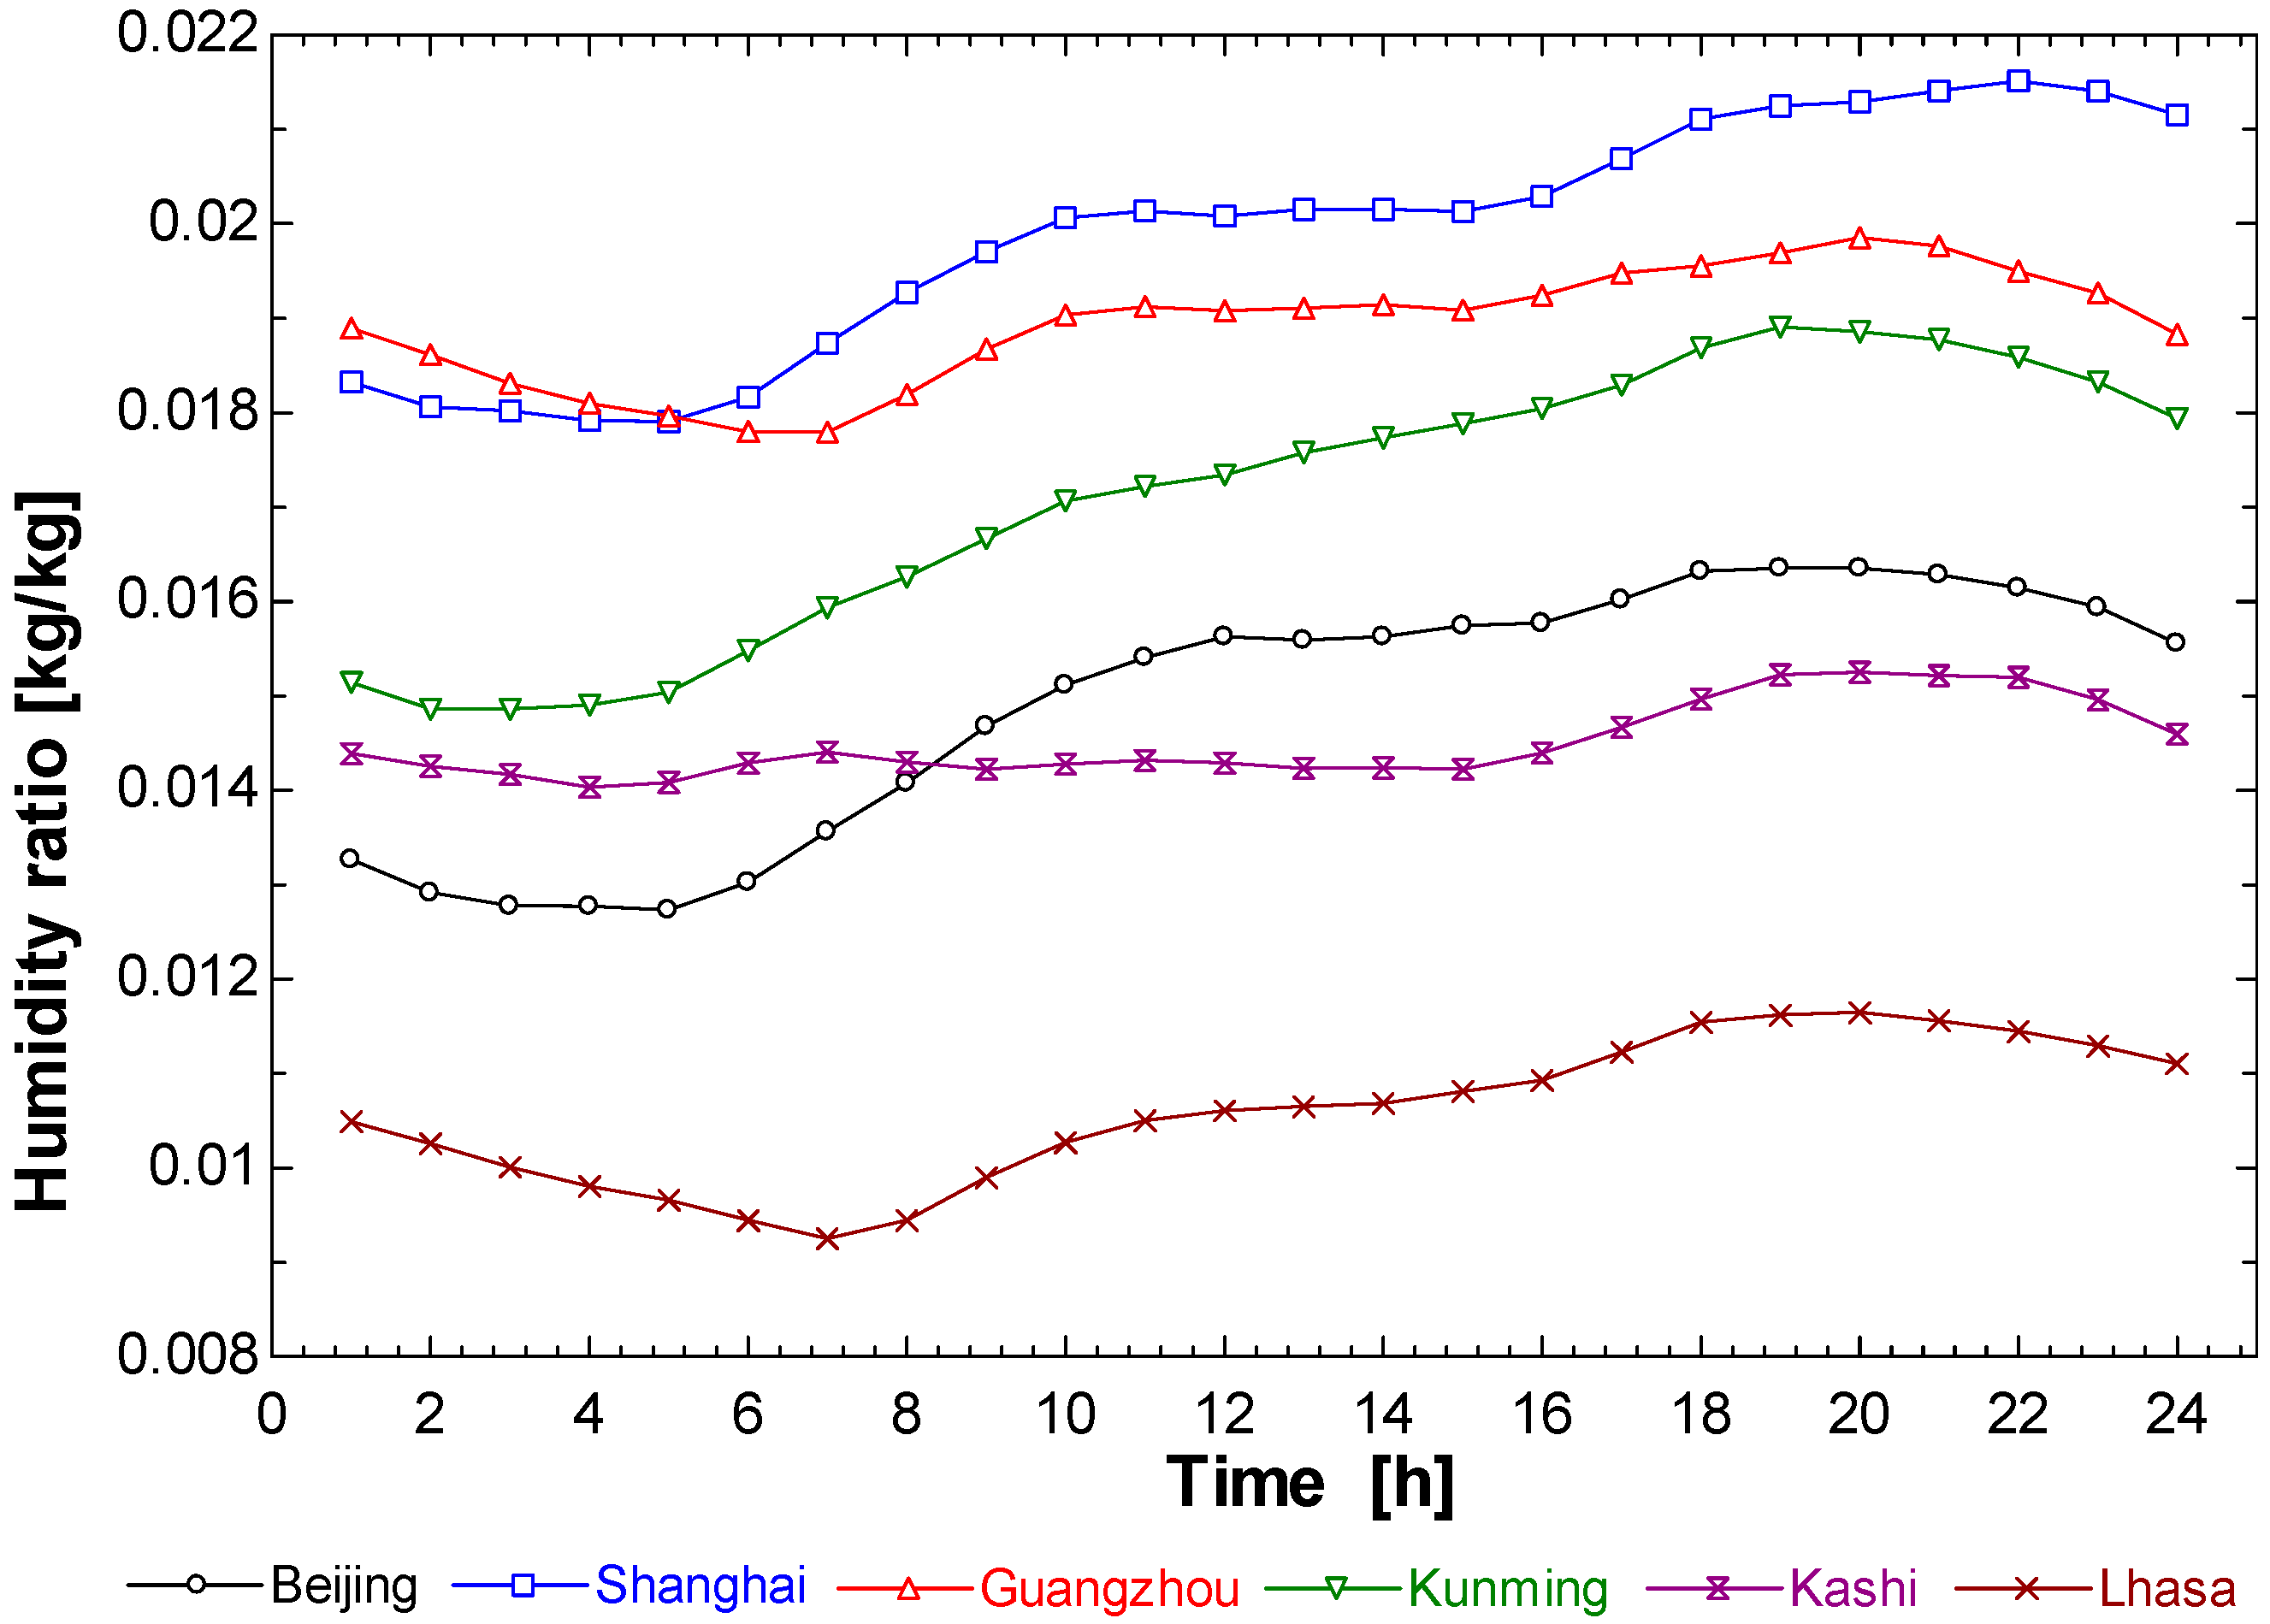
Figure 8), HR (
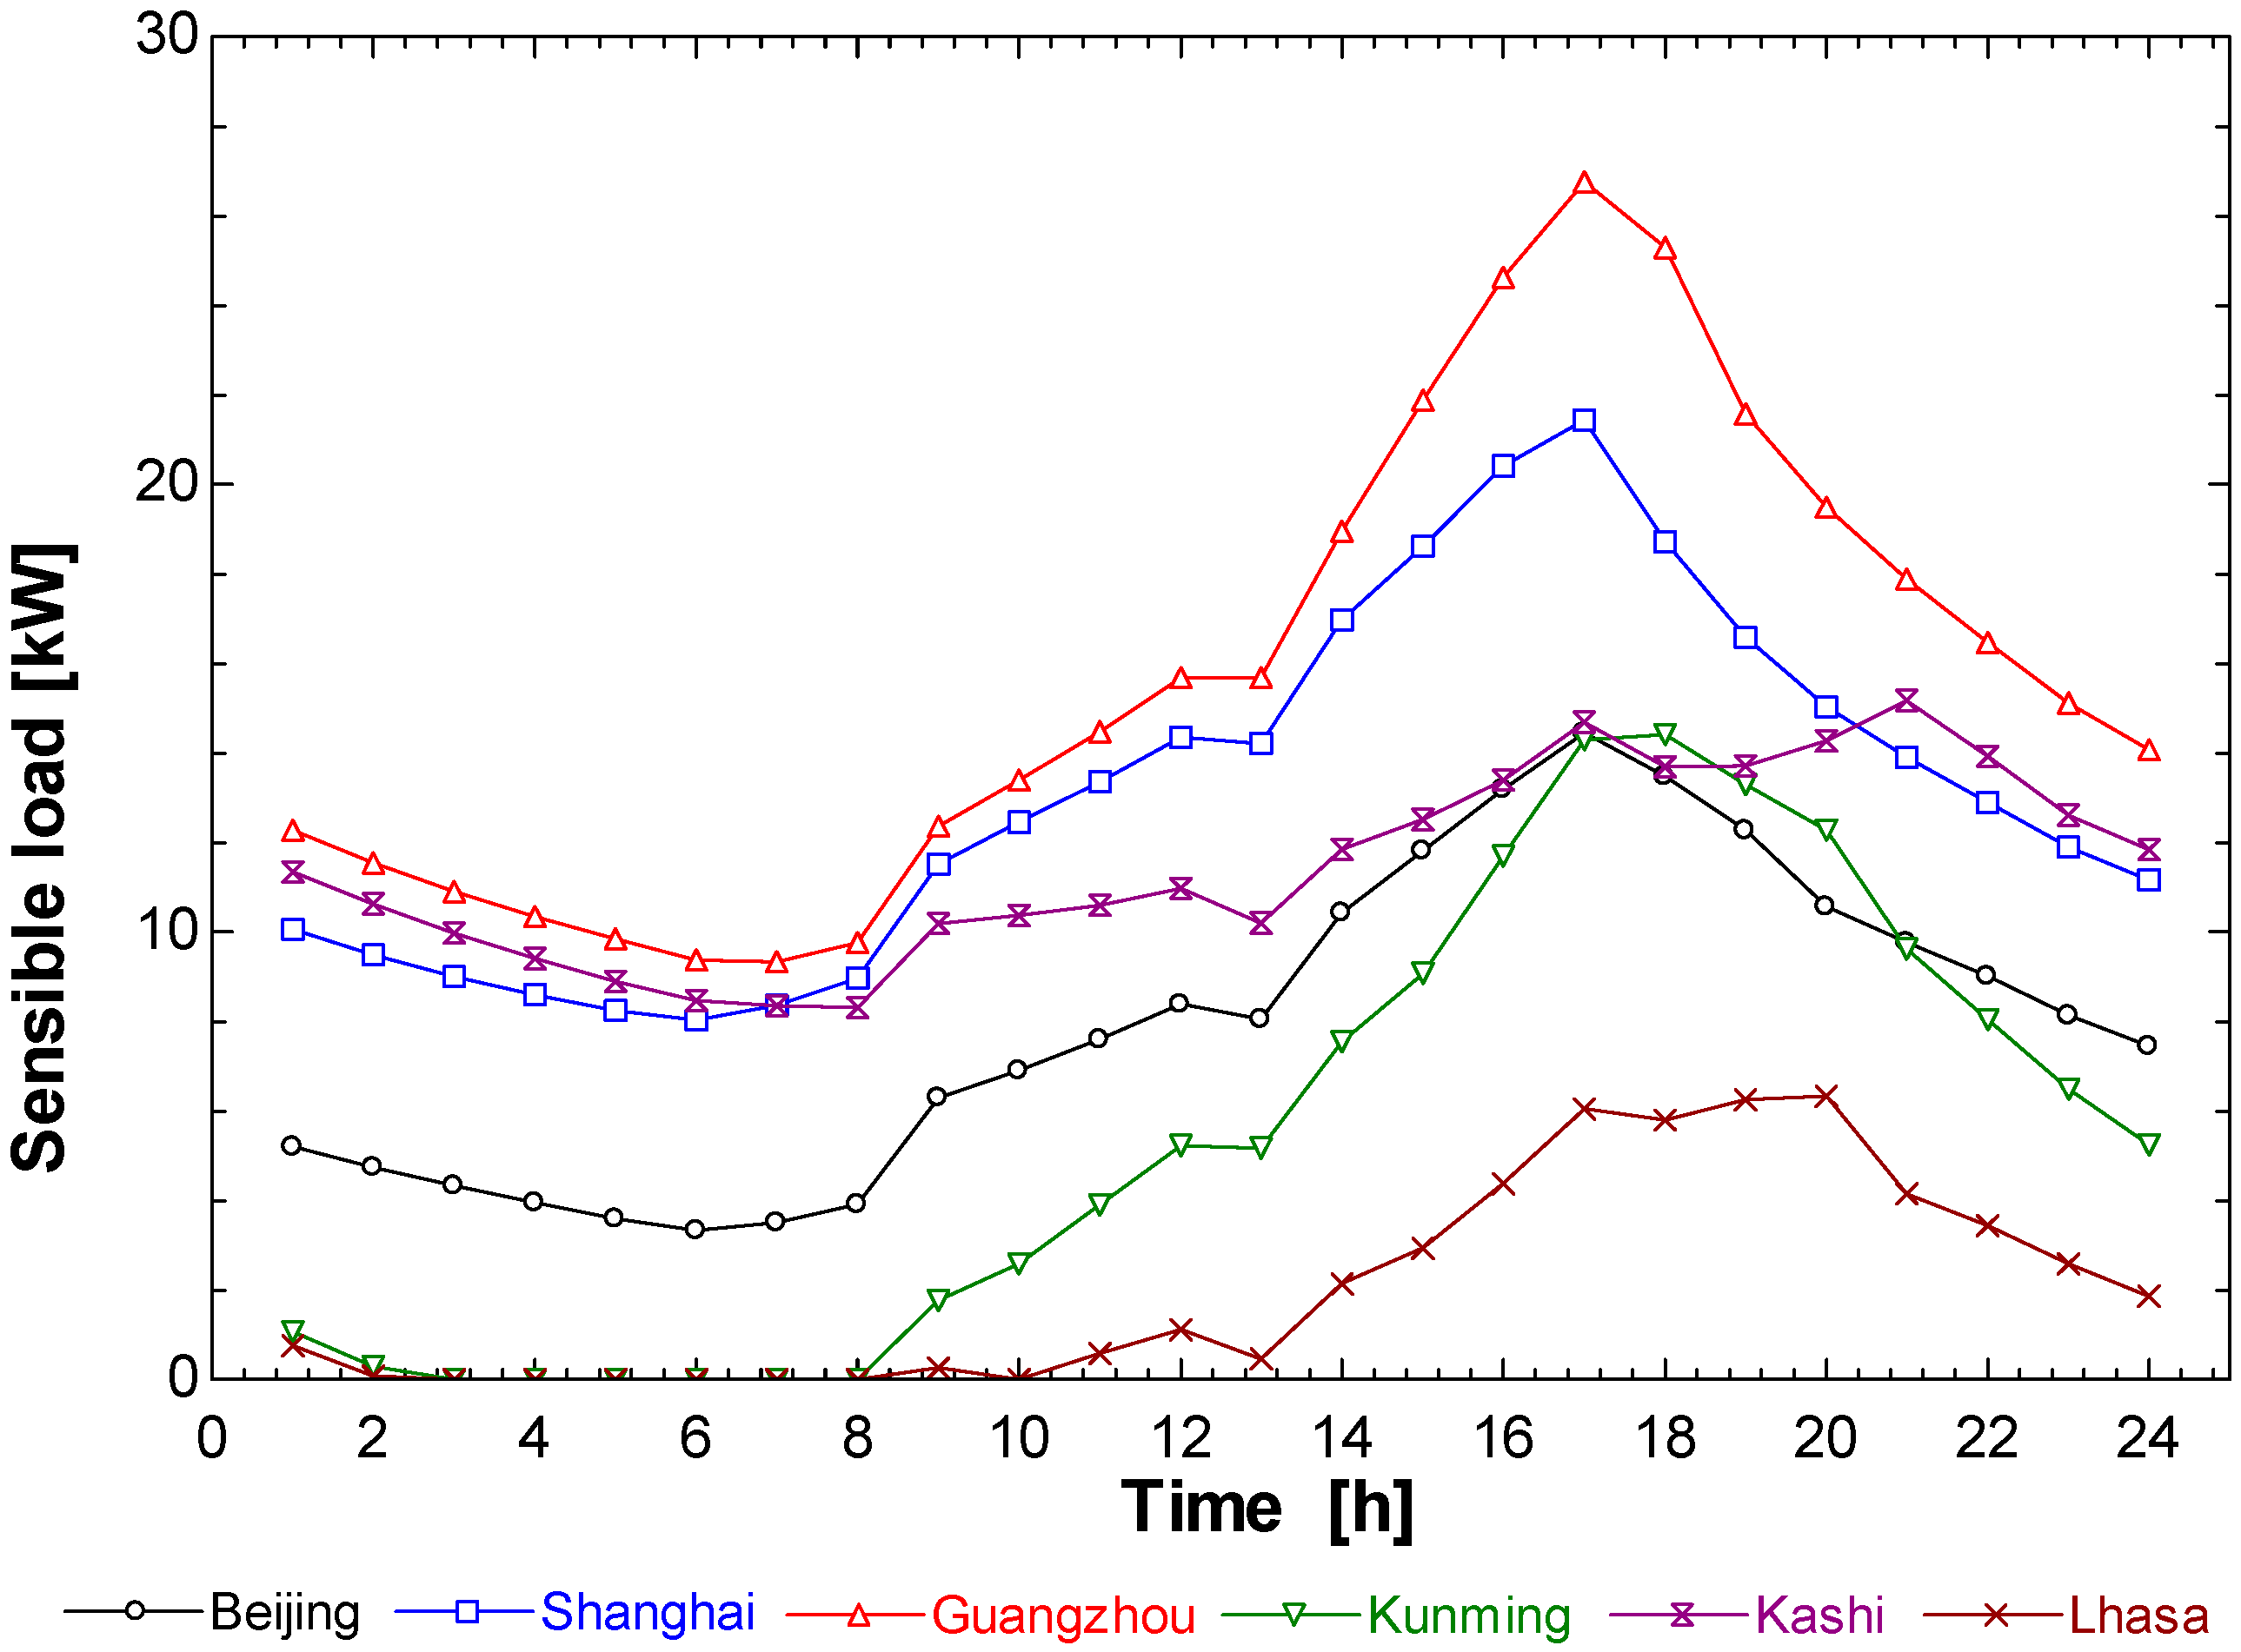
Figure 9), and cooling load (Figure 10). Comparisons of the temperature, HR, and cooling load of each selected city are shown in Figure 8, Figure 9 and Figure 10. Since the latent heat load values of the various cities are similar, they are not shown in the cooling load figure.
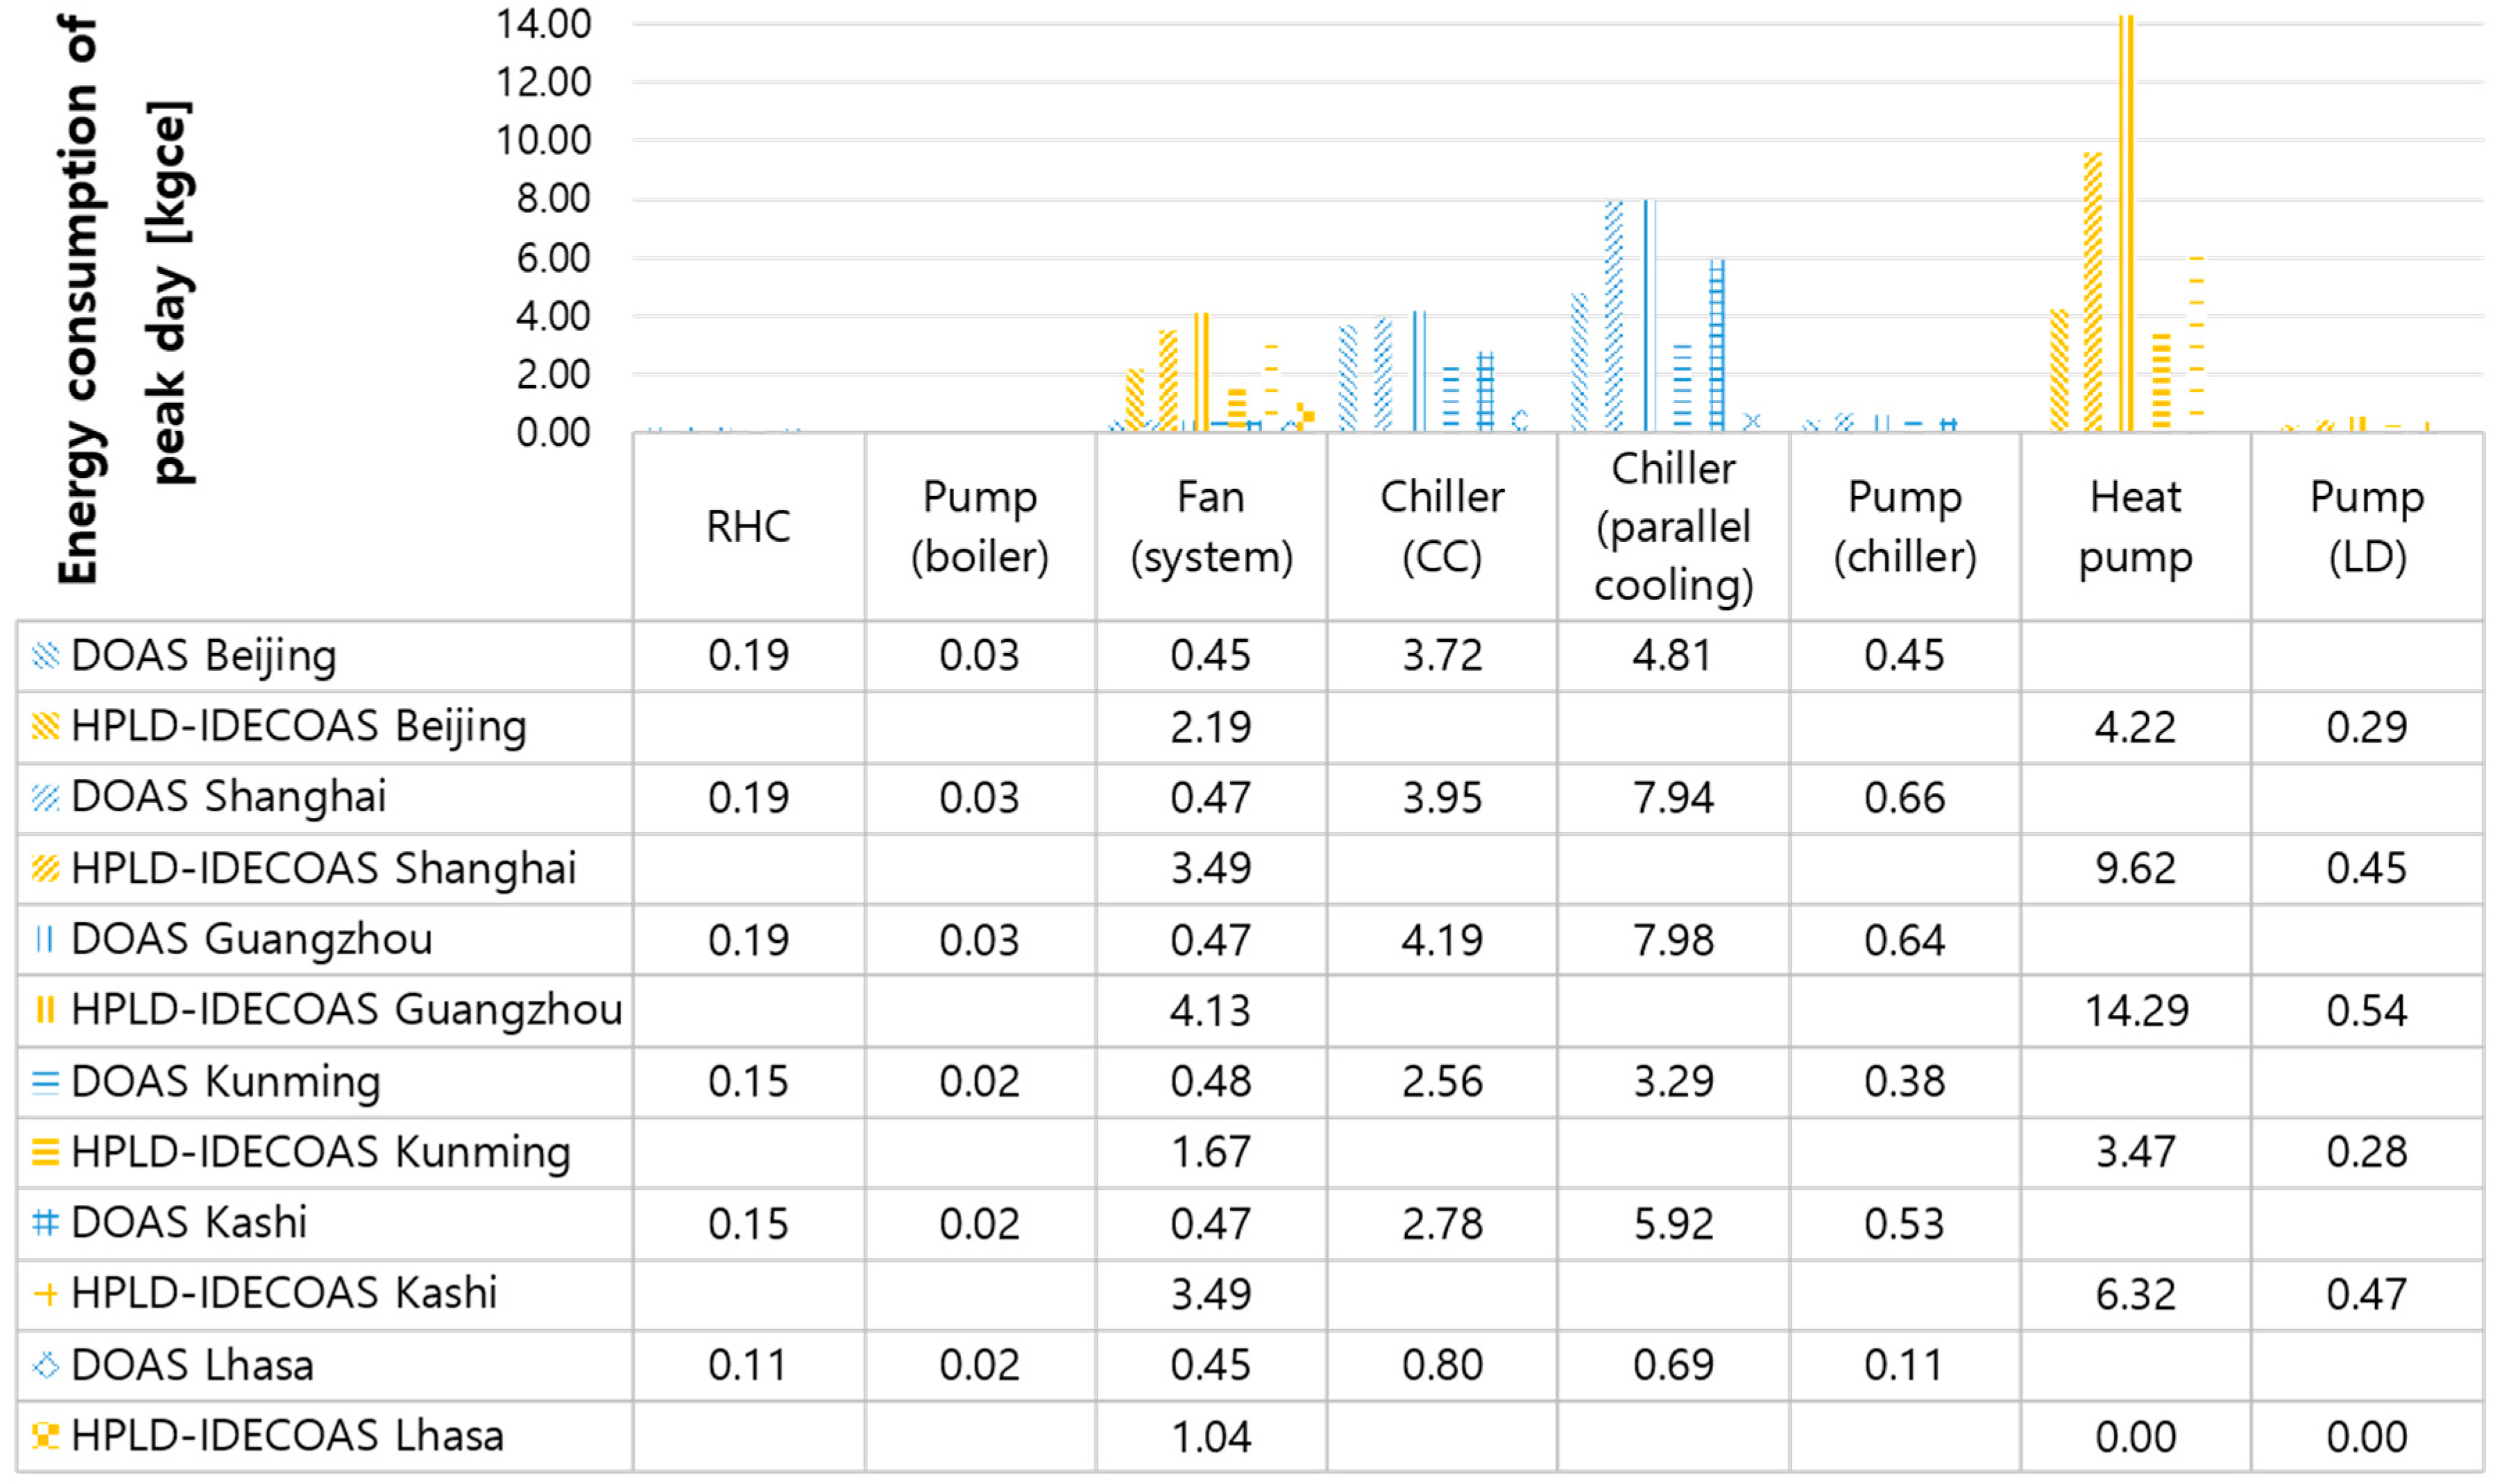
According to Figure 11 and Figure 12, the peak day energy consumption is analyzed from two aspects: systematic difference and city characteristics. Since the peak day of the comparison is the hottest day, there is no heating load.
From the viewpoint of system differences, the following describe the aspects of Figure 12 in order from left to right, according to the data of the figure.
The DOAS used in this study is a system that targets ventilation and dehumidification. After the first dehumidification of the air through the EW in the cooling season, the air is dehumidified again to the target HR through the CC. If the temperature of the process air is lower than the SA set point, reheating is required. The reheat coil (RHC) heats the air to reach the target temperature; consequently, even in the cooling seasons, the system has energy consumption due its boiler and pump.
Since the DOAS is a ventilation system, the SA flow rate was maintained at the minimum required ventilation rate based on the ASHRAE standard 62.1-2010 [14]. However, the HPLD-IDECOAS, as an air conditioner, needs to perform the function of removing the thermal load in the room, and as a fully external air system, 100% fresh air is used. Accordingly, the energy consumption of the fan for the air supply and exhaust is significantly greater than that of the DOAS.
The main energy consumption of the DOAS is the use of the dehumidification part of the CC and RHC, whereas the main energy consumption of the HPLD-IDECOAS is the heat-pump-integrated LD system.
The HPLD-IDECOAS uses more energy than the DOAS for dehumidification (scilicet, the energy consumption of the HPLD system is more than that of the chiller (CC), RHC, and pump (boiler) of the DOAS). However, owing to the use of the IEC and DEC for cooling in HPLD-IDECOAS, the overall energy consumption is lower than the DOAS using a chiller (parallel cooling).
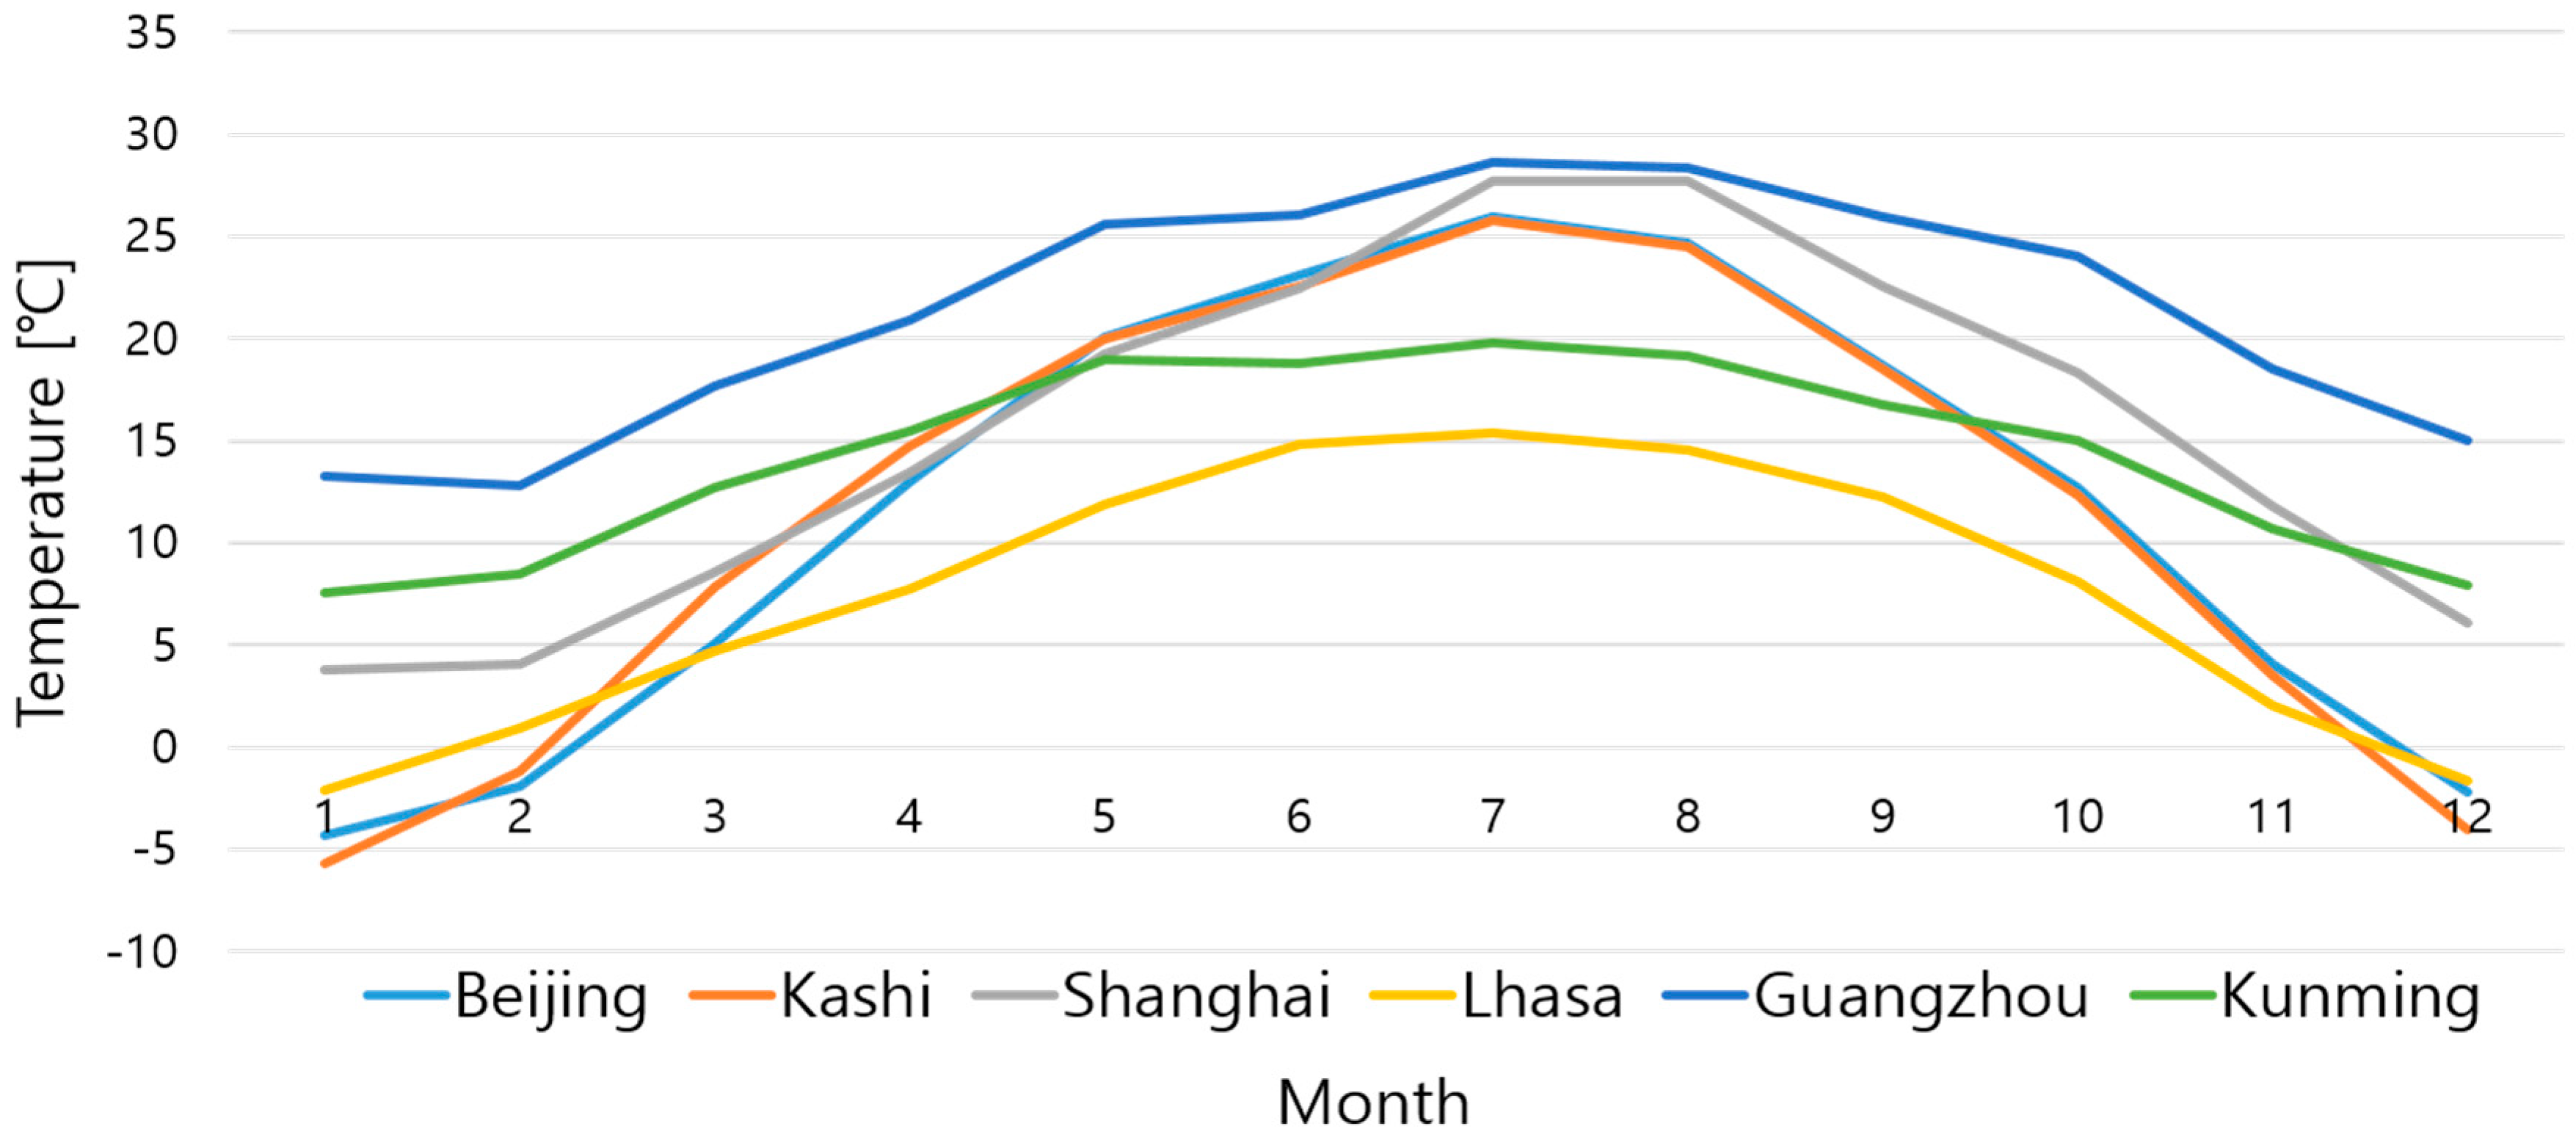
The analysis of the different climate characteristics of each selected city is as follows. It seen from Figure 8, Figure 9 and Figure 10 of the six selected cities that the thermal environments of the peak days of each city have distinct characteristics. Although Beijing, Kashi, and Lhasa belong to the same climate region, they show significant differences in Figure 11 and Figure 12 because of their special geographical location and geographical environment, but generally exhibit the three lowest HRs of the six selected cities.
As can be seen from Figure 11, in the peak day of the cooling season, the daily energy consumption of the HPLD-IDECOAS operating in Guangzhou is the highest of the 12 cases, and the daily energy consumption of the HPLD-IDECOAS operating in Lhasa is the lowest. In terms of the peak day, the energy consumption of the HPLD-IDECOAS in Guangzhou is 40% higher than the DOAS, and is similar to the DOAS in Shanghai and Kashi, and in other cities, the daily energy consumption of the HPLD-IDECOAS is generally lower than that of the DOAS operating under the same conditions. The energy saving rates of the system operating the different cities are, from high to low, 52% in Lhasa, 30% in Beijing, and 21% in Kunming.
From Figure 12, it can be seen that Guangzhou has the highest daily average temperature of the peak day and the highest daily average HR in the six cities. In order to make the temperature and HR of process air reach the set point after passing the IEC and DEC, the HPLD system requires a large degree of dehumidification. As a result, the daily energy consumption of the HPLD-IDECOAS is 40% higher than that of the DOAS, owing to the power consumption of its heat pump and the energy consumption of the pump therein. For the DOAS, the energy consumption for dehumidification is lower than that of the HPLD-IDECOAS during the peak day, because of the use of the EW.
In Lhasa, as shown in Figure 8, Figure 9 and Figure 10, the temperature and HR during the peak day is the lowest of all six cities, and the temperature difference between morning and evening is large. As it is the driest of the selected cities, the HPLD-part is not activated, and the process air reached the SA setting only by the IEC and DEC. However, in the operation mode of the DOAS, whether the volume flow rate of the SA is higher than the minimum ventilation is calculated according to the latent load that must be cleared from the room; therefore, the two functions of the chiller, dehumidification, and eliminating the sensible load in the room, are activated. As shown in Figure 11, running the HPLD-IDECOAS in Lhasa on the peak day can save up to approximately 52% of the energy compared to the DOAS. In fact, it is known from the existing research that IDECOAS (without the LD system) is more suitable in such dry regions.
The analysis of other two of the three drier cities, Beijing and Kashi, is as follows.
As shown in Figure 8, Figure 9 and Figure 10, Beijing’s daily average temperature is in third place and its daily average HR is in fourth place of the six selected cities on the peak day. Although the temperature is high, the temperature difference between day and night is large, and it is dry. Thus, as can be seen from Figure 12, the DOAS system running on Beijing’s peak day not only needs to deal with the latent load of process air but also with the sensible load when using the chiller to dehumidify. Thus, in terms of dehumidification, it consumes more energy than the HPLD part that only needs to deal with the latent load of the process air. Using the HPLD-IDECOAS as an air conditioner, the dehumidified air can satisfy the air supply condition without using the chiller, thereby saving more energy. As shown by the broken line diagram in Figure 11, the overall energy savings are approximately 30%.
Kashi’s daily average temperature is the fourth highest and its daily average HR is the second lowest on the peak day; thus, it is concluded that the drying condition is similar to that in Beijing, but the temperature is slightly lower than that in Beijing. However, because the elevation is much higher than that of Beijing, the sensible load in the room is higher than that in Beijing. Therefore, a more sensible load needs to be eliminated in the operation of the HPLD-IDECOAS. Consequently, its energy-saving potential is not as good as that in Beijing. As a result, the energy consumption of the HPLD-IDECOAS is similar to that of the DOAS.
In Kunming, the annual solar projection angle is large, and the hot-weather conditions are not extreme. The average daily temperature is far lower than that of Beijing, and the HR shows that this is a mild place, but the HR is higher than that in Beijing, at third place. Thus, the latent load in the room that needs to be eliminated in Kunming is higher than that in Beijing when running the HPLD-IDECOASD. The energy-saving potential is not as good as that of Beijing, but it is higher than the DOAS in the same region, which is approximately 21%.
In Shanghai, the average daily temperature and the sensible load treated in the room are the second highest, and the daily average HR is the highest. Due to its high humidity, the HPLD-IDECOAS has the lowest energy-saving potential among the selected cities. However, owing to its mild climate, Figure 8, Figure 9 and Figure 10 show that the daily temperature difference is small, but the sensible load in the room is higher than in Beijing. As mentioned earlier, the HPLD-IDECOAS needs to remove more latent load owing to the efficiency effects of the IEC and DEC (set to 70% in this study), such that the process air can reach the SA set condition after passing through the IEC and DEC, therefore, there is no significant different in energy consumption between the two system on the peak day.
In summary the results of the peak day energy consumption analysis are as follows.
(1)
The energy-saving potential of the HPLD-IDECOAS is most affected by the sensible load that needs to be eliminated from the room. For example, the energy-saving potential of Lhasa is greater than those of Beijing, Kashi, Shanghai, and Guangzhou in turn.
(2)
When the difference in the HR is large, the energy-saving potential of the HPLD-IDECOAS is more affected by the HR, such as is Beijing and Kunming.
(3)
The energy performance of the DOAS in each representative city is opposite to that of the HPLD-IDECOAS. For example, when there is too much sensible load eliminated from the room, the energy-saving effect is significantly higher than the HPLD-IDECOAS, and at other times, the energy consumption is much higher than the HPLD-IDECOAS.

4.2. Comparison of Monthly Energy Consumption

(1)
In the cooling season and heating season, the energy consumption of the HPLD-IDECOAS running in each city is lower than that of the DOAS operating in the same environment every month.
(2)
In the heating season, except for Guangzhou and Kunming that are not cold in winter, there is no signification different in the monthly energy consumption between the two system.
(3)
It is concluded that in places with higher temperature and HR, in months of higher temperature and HR, the HPLD-IDECOAS has better energy-saving potential than the DOAS.

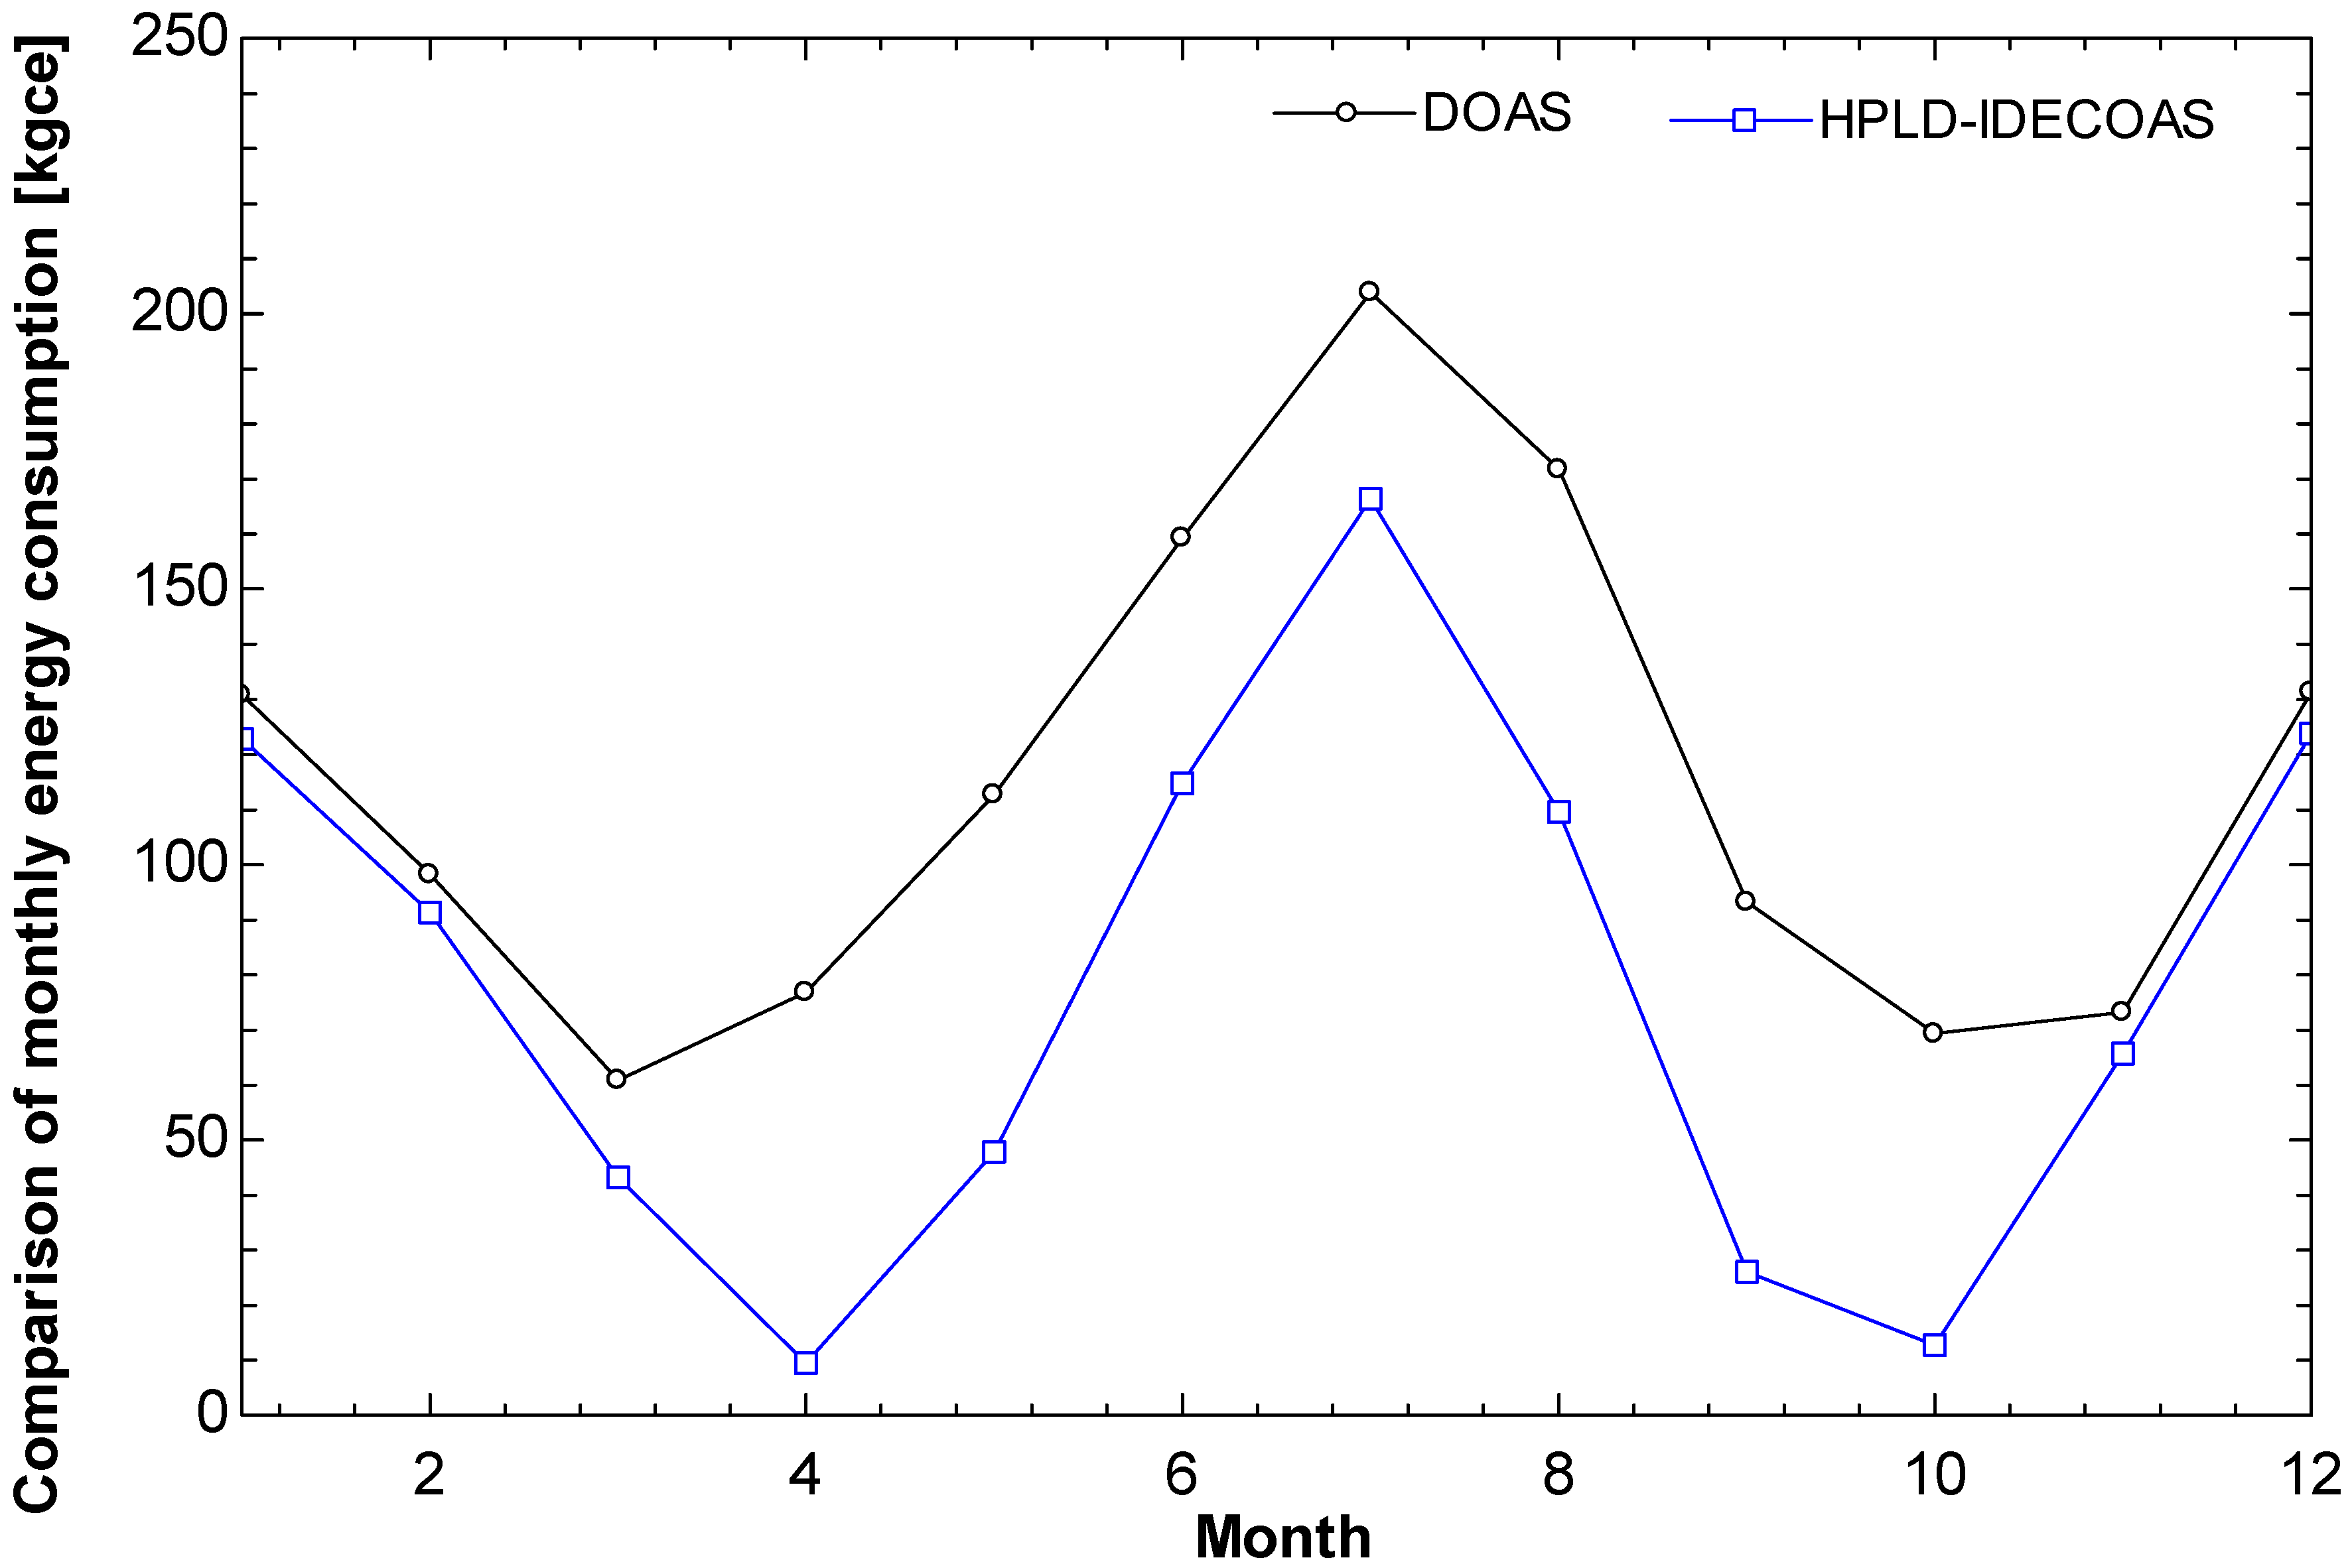
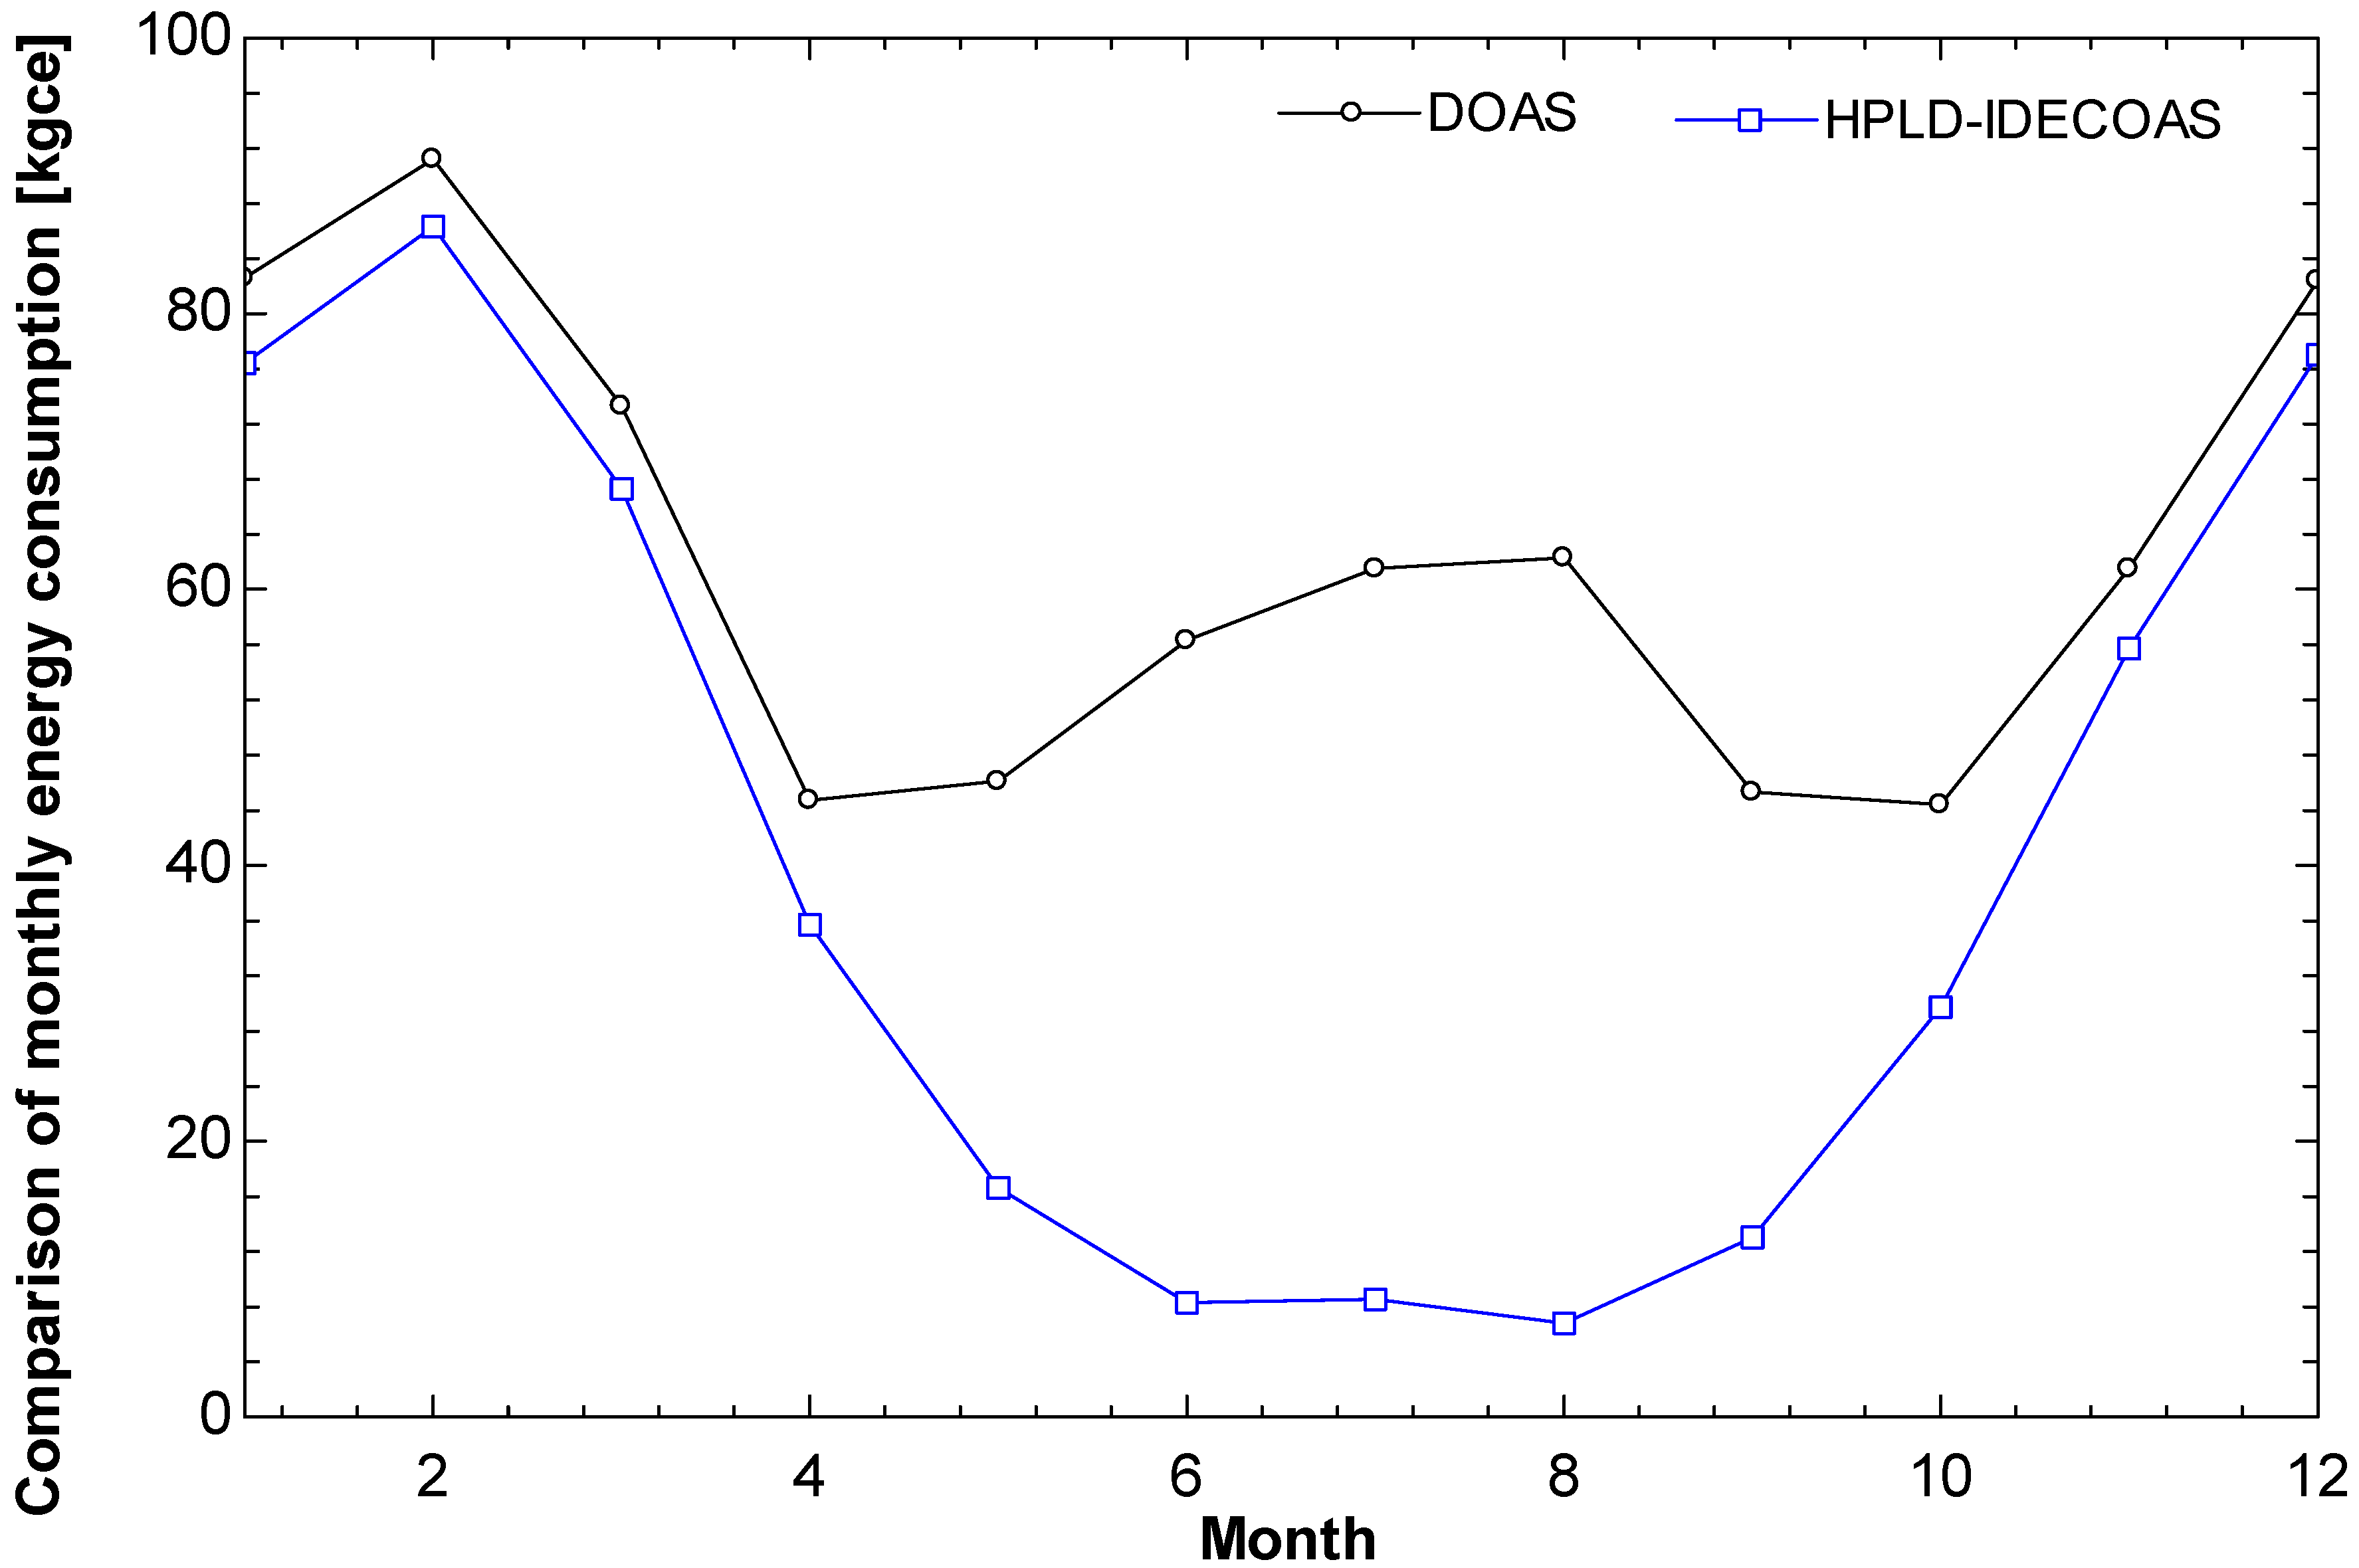
4.3. Comparison of Seasonal Energy Consumption (Cooling Season and Heating Season)

Figure 19, Figure 20, Figure 21, Figure 22, Figure 23 and Figure 24 show the energy consumption of the two comparison systems operating in each city during the cooling and heating seasons.
In Beijing, as shown in Figure 19, during the cooling season, the two systems heat the SA differently. In the LD-IDECOAS, using the HC to heat the RA first and using the IEC as the sensible heat exchanger, the OA reaches the SA temperature by heat transfer between the process air and the RA on the IEC. In the DOAS, the OA is preheated by the EW and then directly heated to the SA set temperature by the HC. Therefore, it is seen from the different heating modes of the two systems during the cooling season that the energy consumption of the HC of the LD-IDECOAS is higher than that of the DOAS. It is concluded that the greater the difference, the lower the local air temperature, which shows that Beijing’s winter is cold.
In Shanghai, the difference in energy consumption between the dehumidifying parts of the two systems seems to be larger than in Beijing (i.e., the energy consumption of the heat pump in the HPLD-IDECOAS and that in the CC plus the RHC in the DOAS seem to be larger than in Beijing) Similar to Beijing, the energy consumption of the RHC in the HPLD-IDECOAS seems to be larger than that in DOAS. The difference in the energy consumption of the two systems is divided into two. One appears in the dehumidification section and one has the ability to save energy compared to the DOAS, because the HPLD-IDECOAS does not require parallel cooling and, instead, uses the IEC and DEC.
The difference in energy consumption is mainly in two aspects. First, the energy consumption of the chiller and RHC for dehumidification is the highest of the six selected cities. Owing to the large difference, the proportion of the total energy consumption is also large. The relates to parallel cooling, and accounts for a larger proportion. From the perspective of energy saving, the HPLD-IDECOAS using the IEC and DEC instead of the chiller, in regions that have a higher temperature and need more cooling, has a higher energy-saving potential.
The annual solar projection angle of Kunming is large. The humidity is not high and, thus, the energy consumption of the chiller and RHC for dehumidification is the lowest of the six selected regions. The main difference is in the removal of the sensible load and latent load from the room, although the difference is small. However, the total energy consumption is low and, thus, the proportion is significant. In such climatic conditions, the HPLD-IDECOAS has more energy-saving potential in terms of sensible load and latent load in the room compared with the DOAS.
The temperature of Kashi in winter is low but not extreme, there is a large change in the annual temperature and daily temperature, and the temperature difference between day and night is large. Therefore, it seen that in Kashi, heating consumes much energy compared to cooling and dehumidification. Since both systems use parallel heating, the difference between the two systems is not large in this region.
Lhasa has a large daily temperature difference, such that one can feel the temperature of four seasons in a single day. However, it is on the whole a cold and dry city, with the energy consumption mainly accounted for by heating. Therefore, the energy consumption of the two systems was essentially similar.
In summary, it can be seen that during the cooling season, similar to the peak day, owing to the use of the heat pump in the HPLD-IDECOAS to reduce the regenerative heat, and then through the IEC and DEC for cooling, the energy-saving effect in each comparison city is better than the DOAS, which uses a chiller. In the heating season, because the HPLD-IDECOAS is designed to supply the same temperature as the DOAS (i.e., 20 °C), parallel heating is required. The overall heating energy consumption of the HPLD-IDECOAS is slightly lower than that of the DOAS, as the DOAS uses the EW to recycle the EA and, thus, the heating energy consumption is slightly lower than that of the HPLD-IDECOAS.

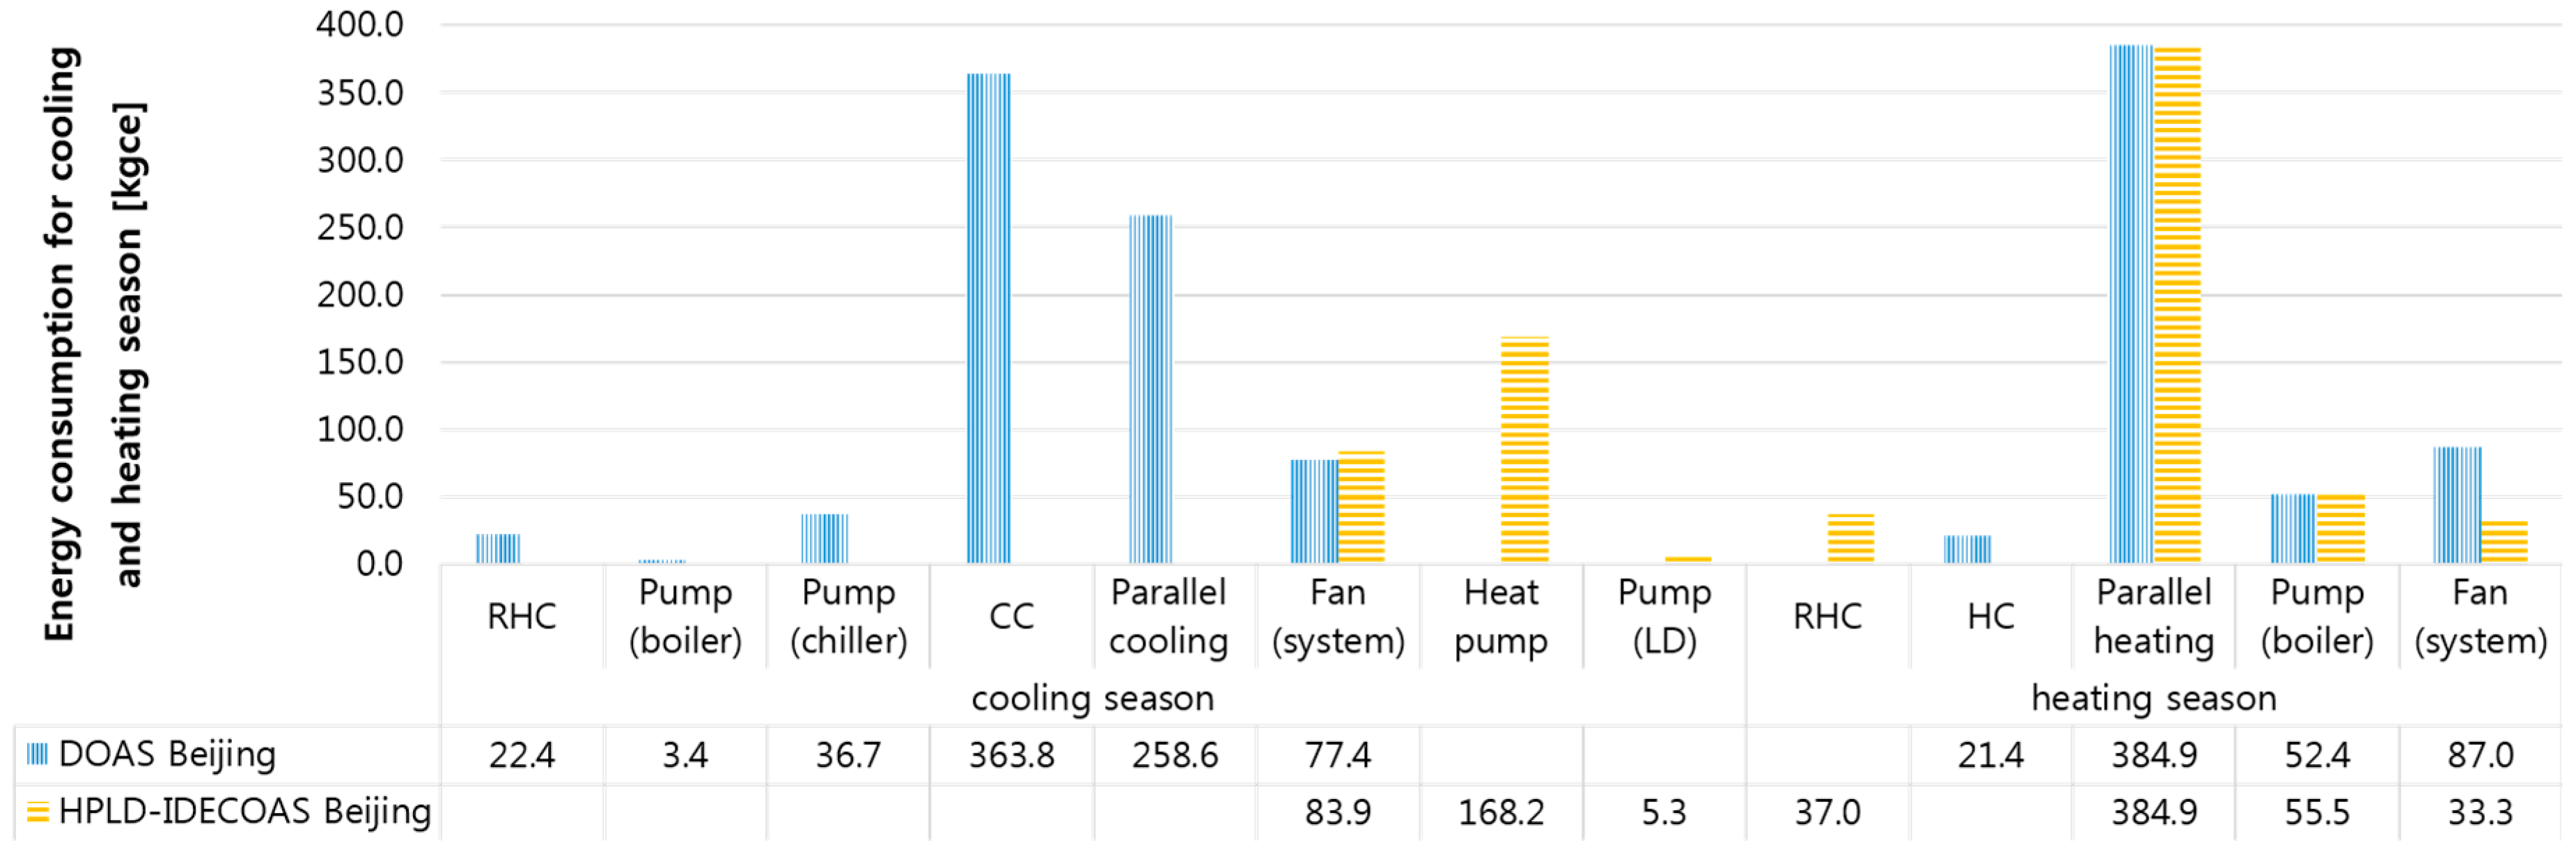
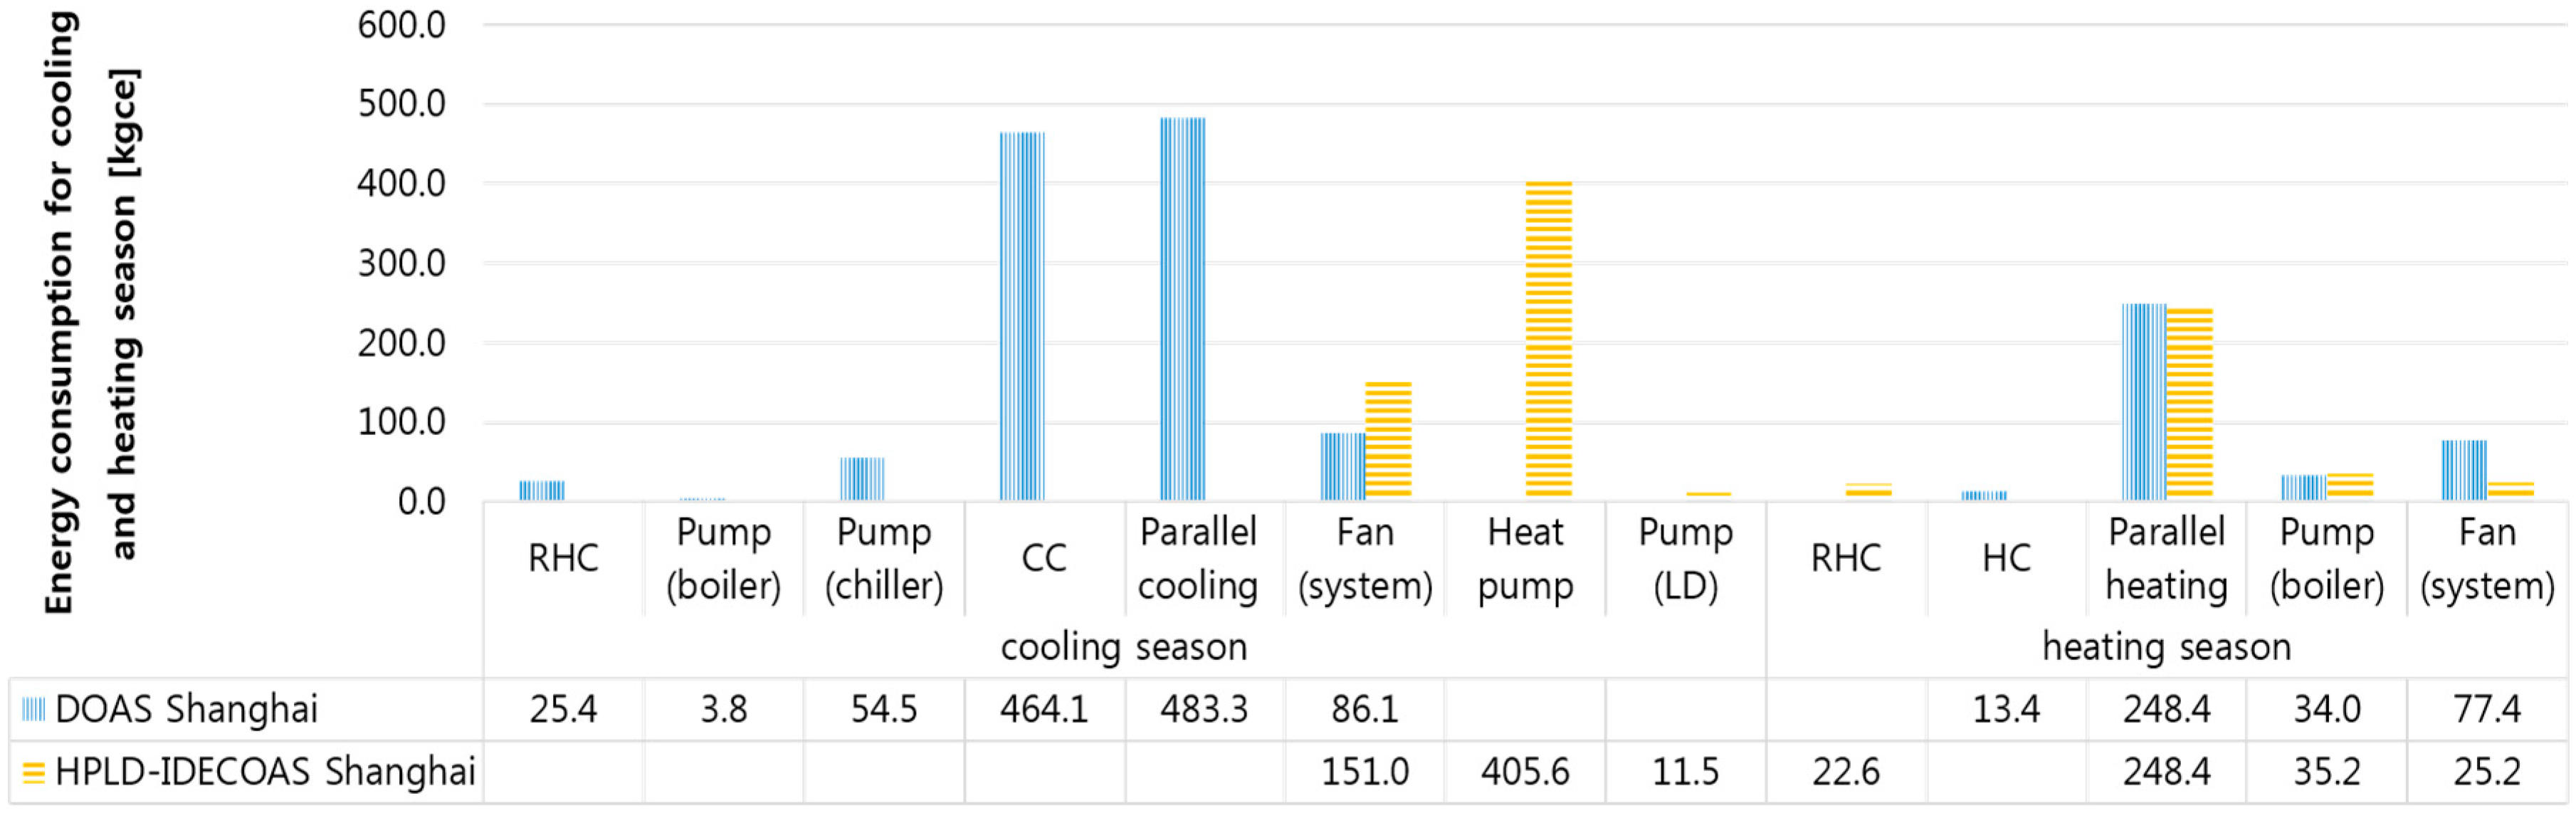
4.4. Comparison of Annual Energy Consumption

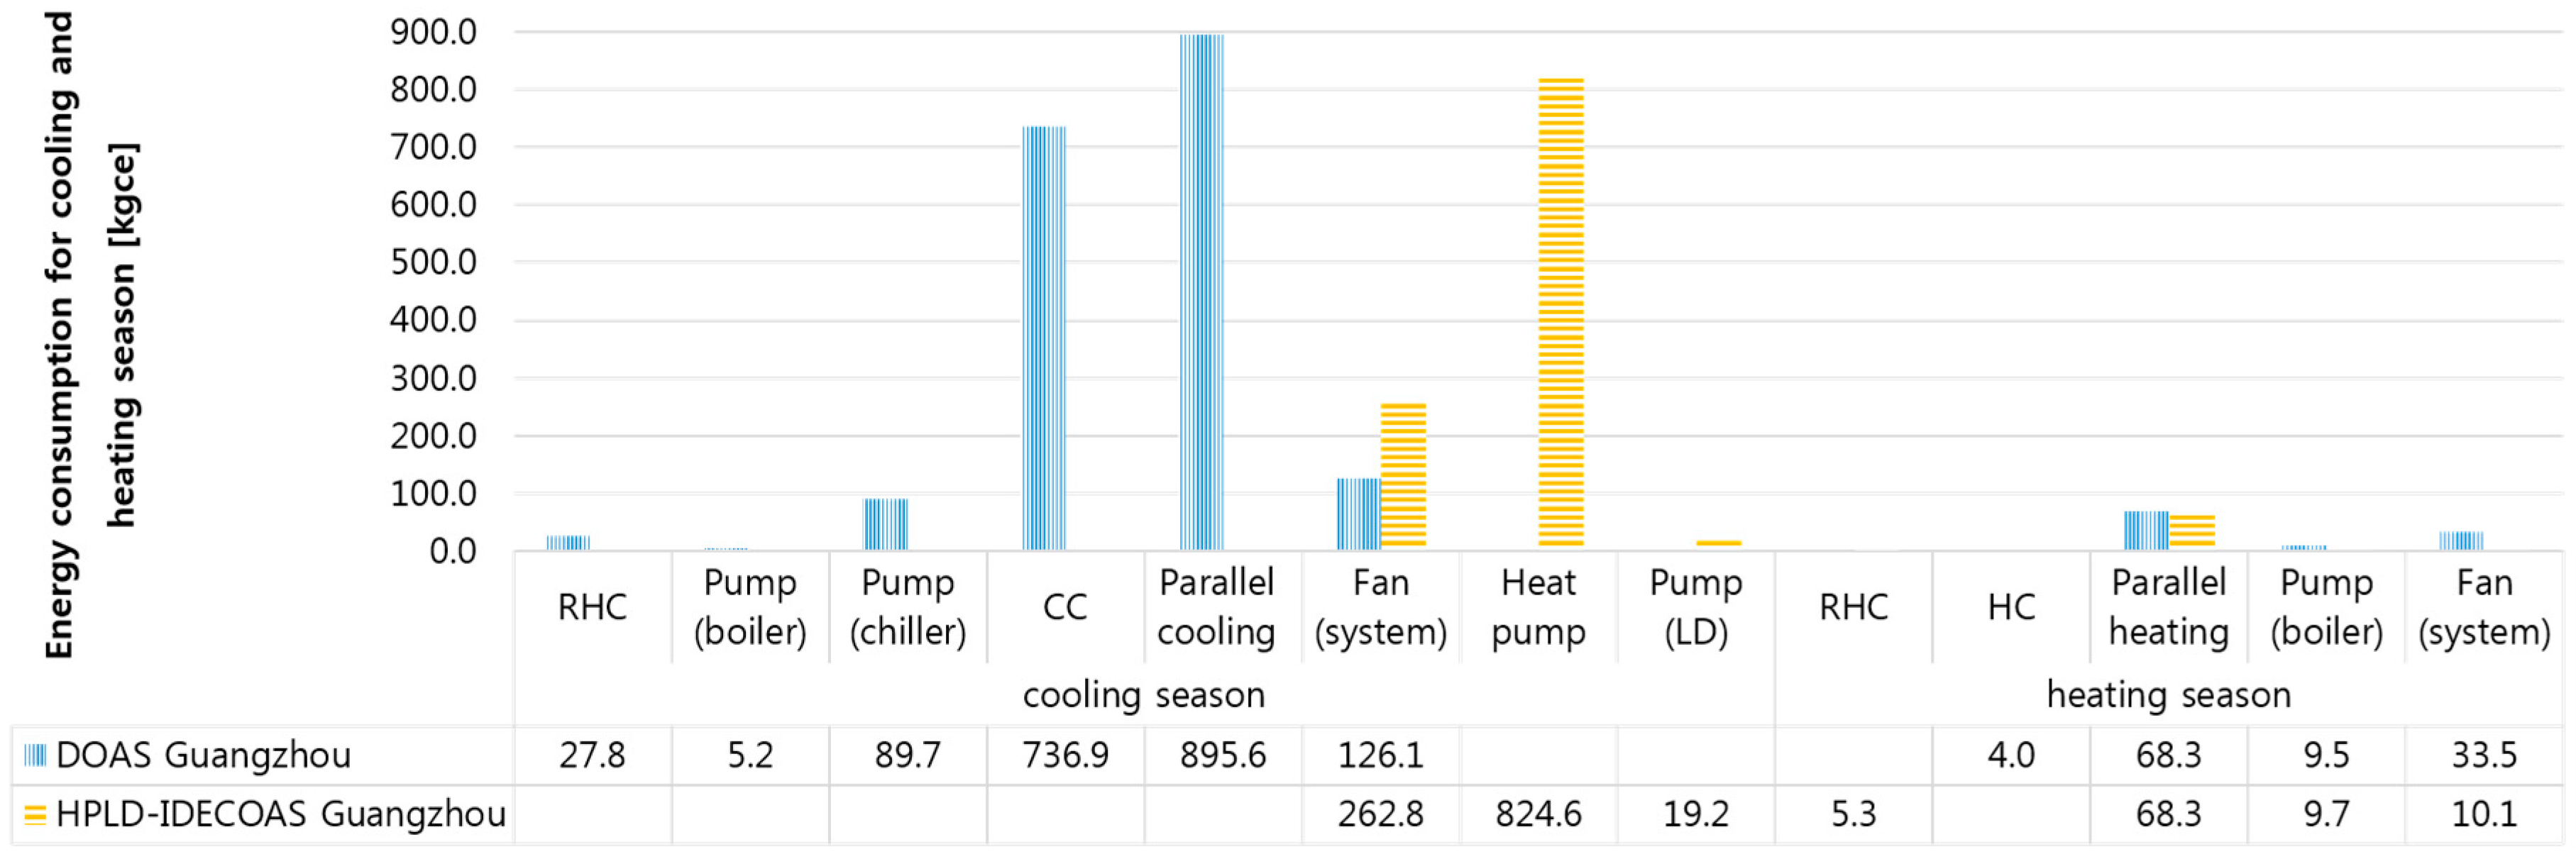
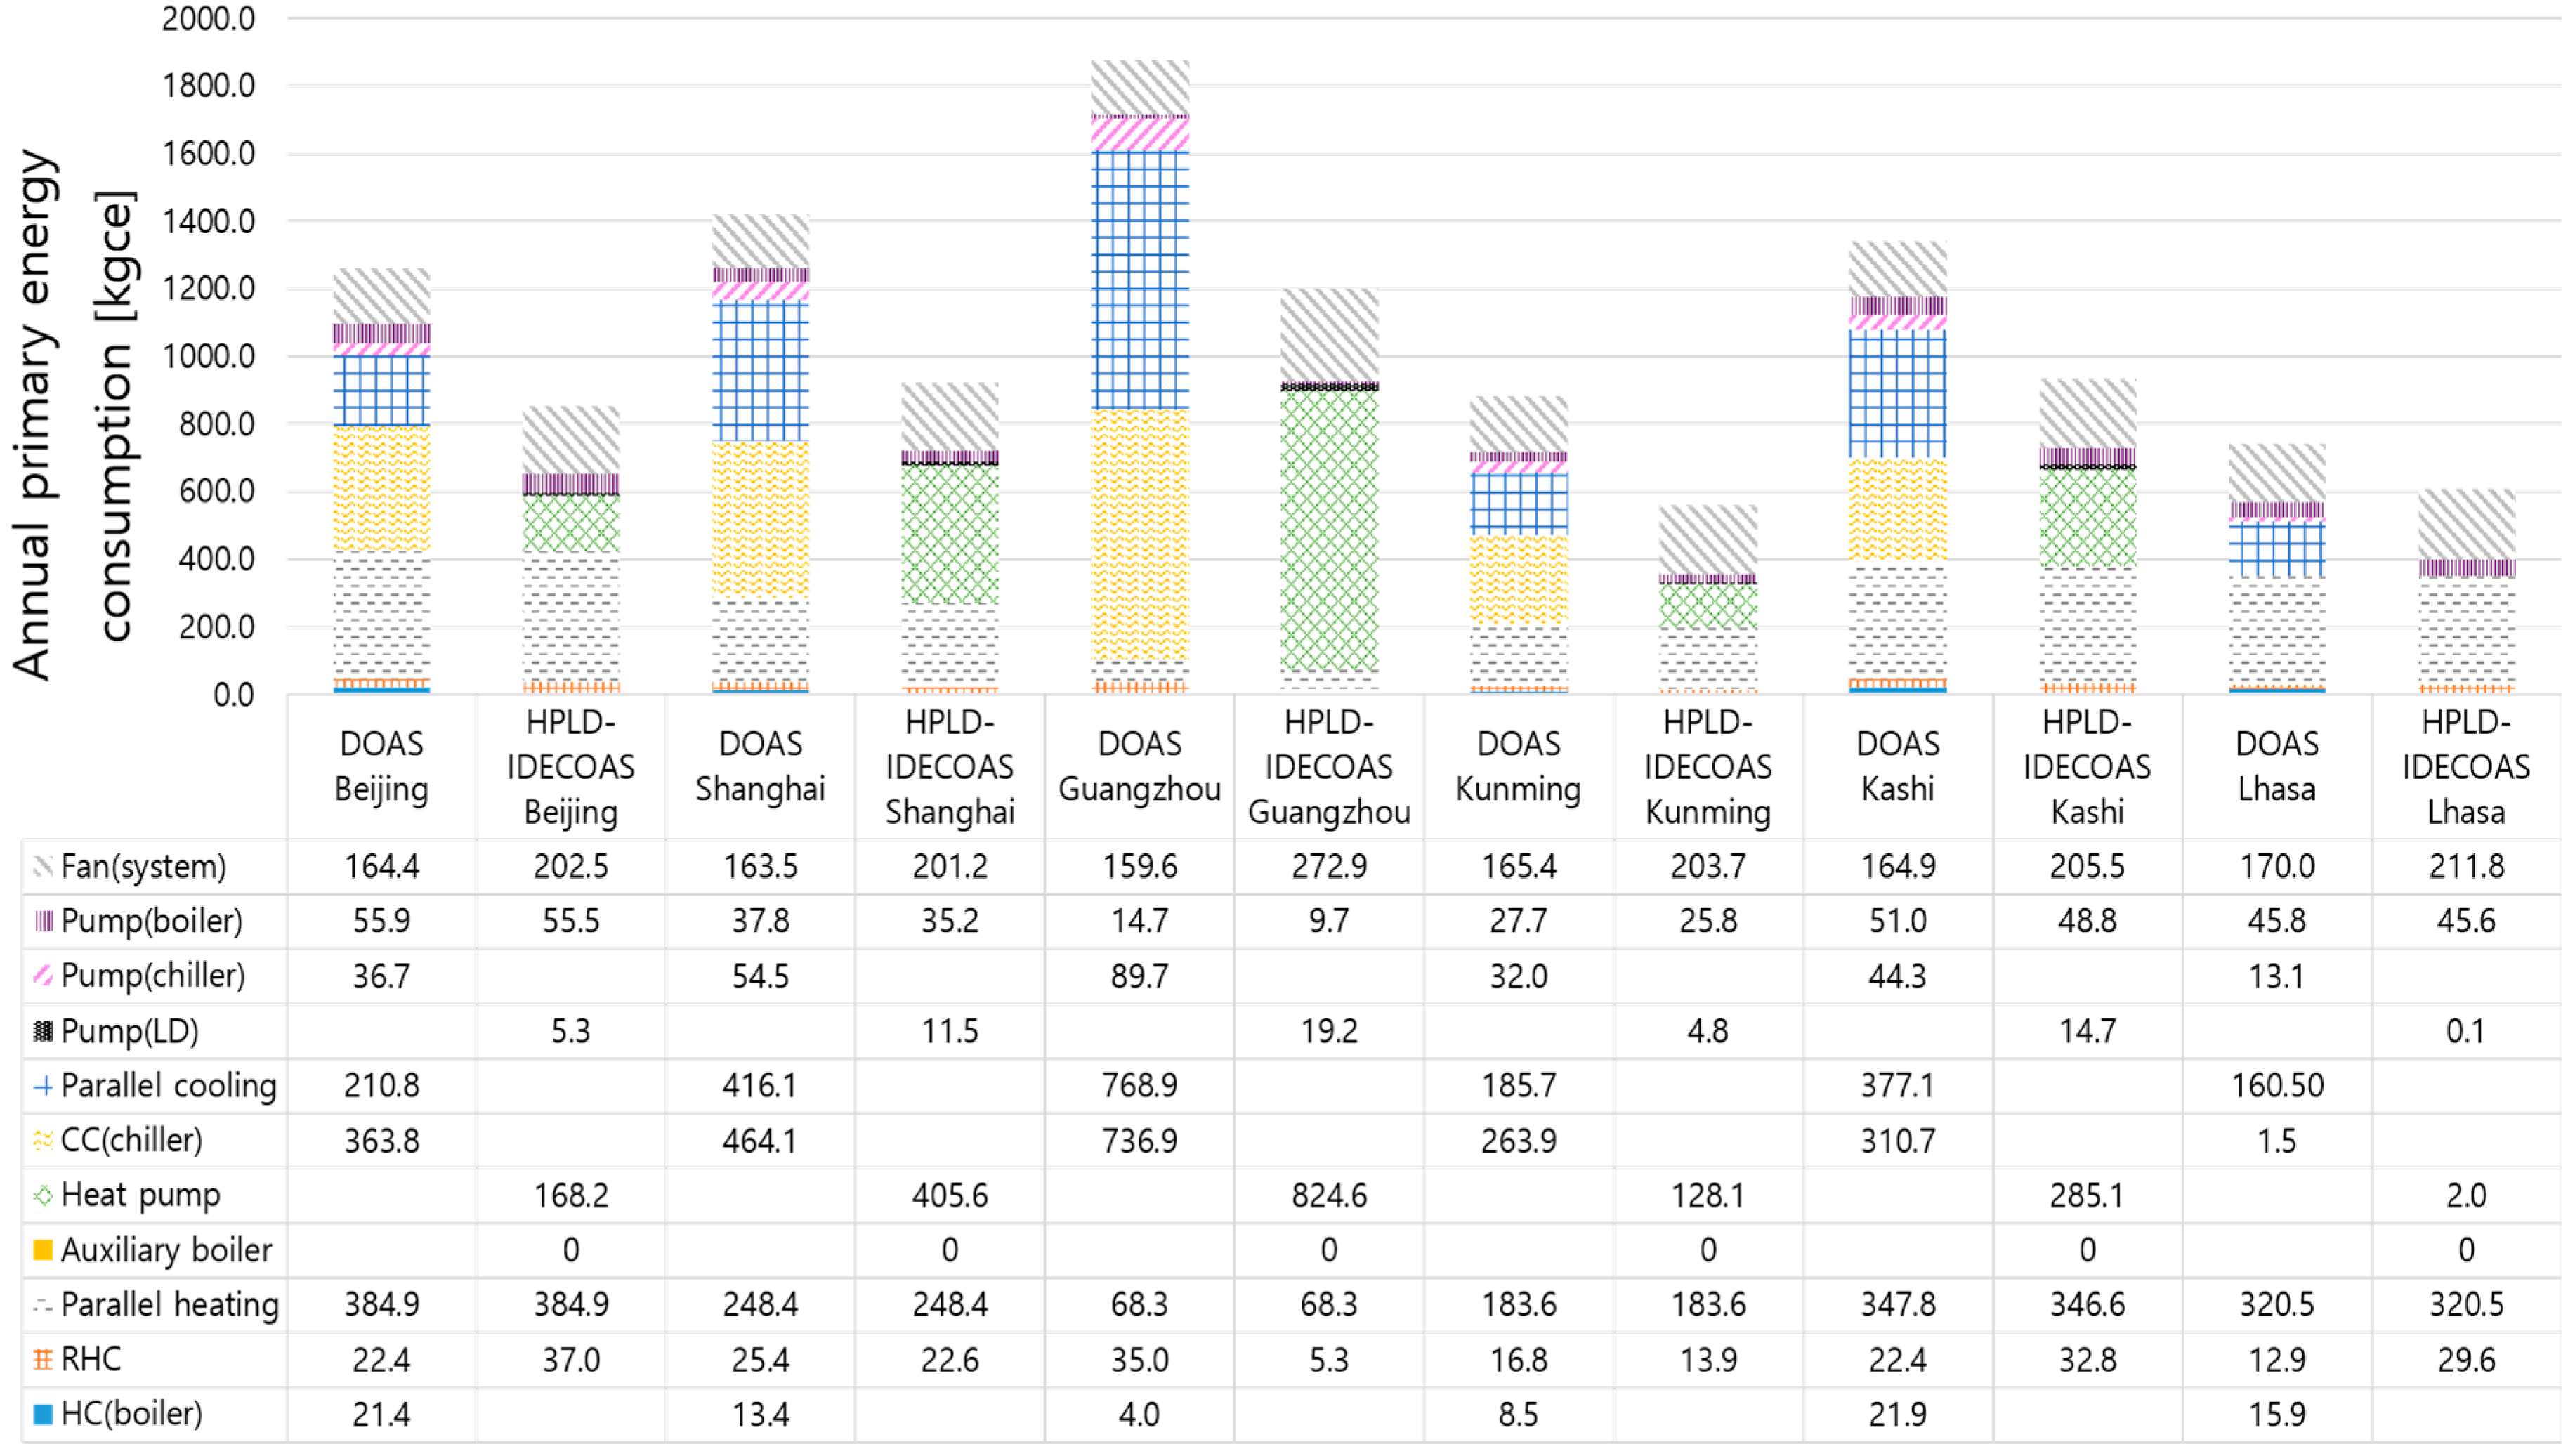
Beijing has four distinct seasons; summer is hot and rainy, the rainy season is concentrated in summer, which often includes heavy raining, and winter is cold and dry. The RHC of the LD-IDECOAS is mainly used in winter, and the RHC of the DOAS is mainly used in summer. The difference in energy consumption between the HPLD-IDECOAS and DOAS is mainly reflected in the dehumidification part; although the difference is large, the overall proportion is not large. The overall energy difference is 39%, shown in Figure 25.
Shanghai has four distinct seasons, with a mild and humid climate. It exhibits a short spring and autumn, and a long winter and summer. There is a moderate rainy season throughout the year, with high humidity in winter. The total energy consumption of the HPLD-IDECOAS saves 14.8% compared to the DOAS.
Guangzhou has a long summer and a short winter. It has a high temperature and high humidity. In this case, the savings compared to the DOAS is 36%.
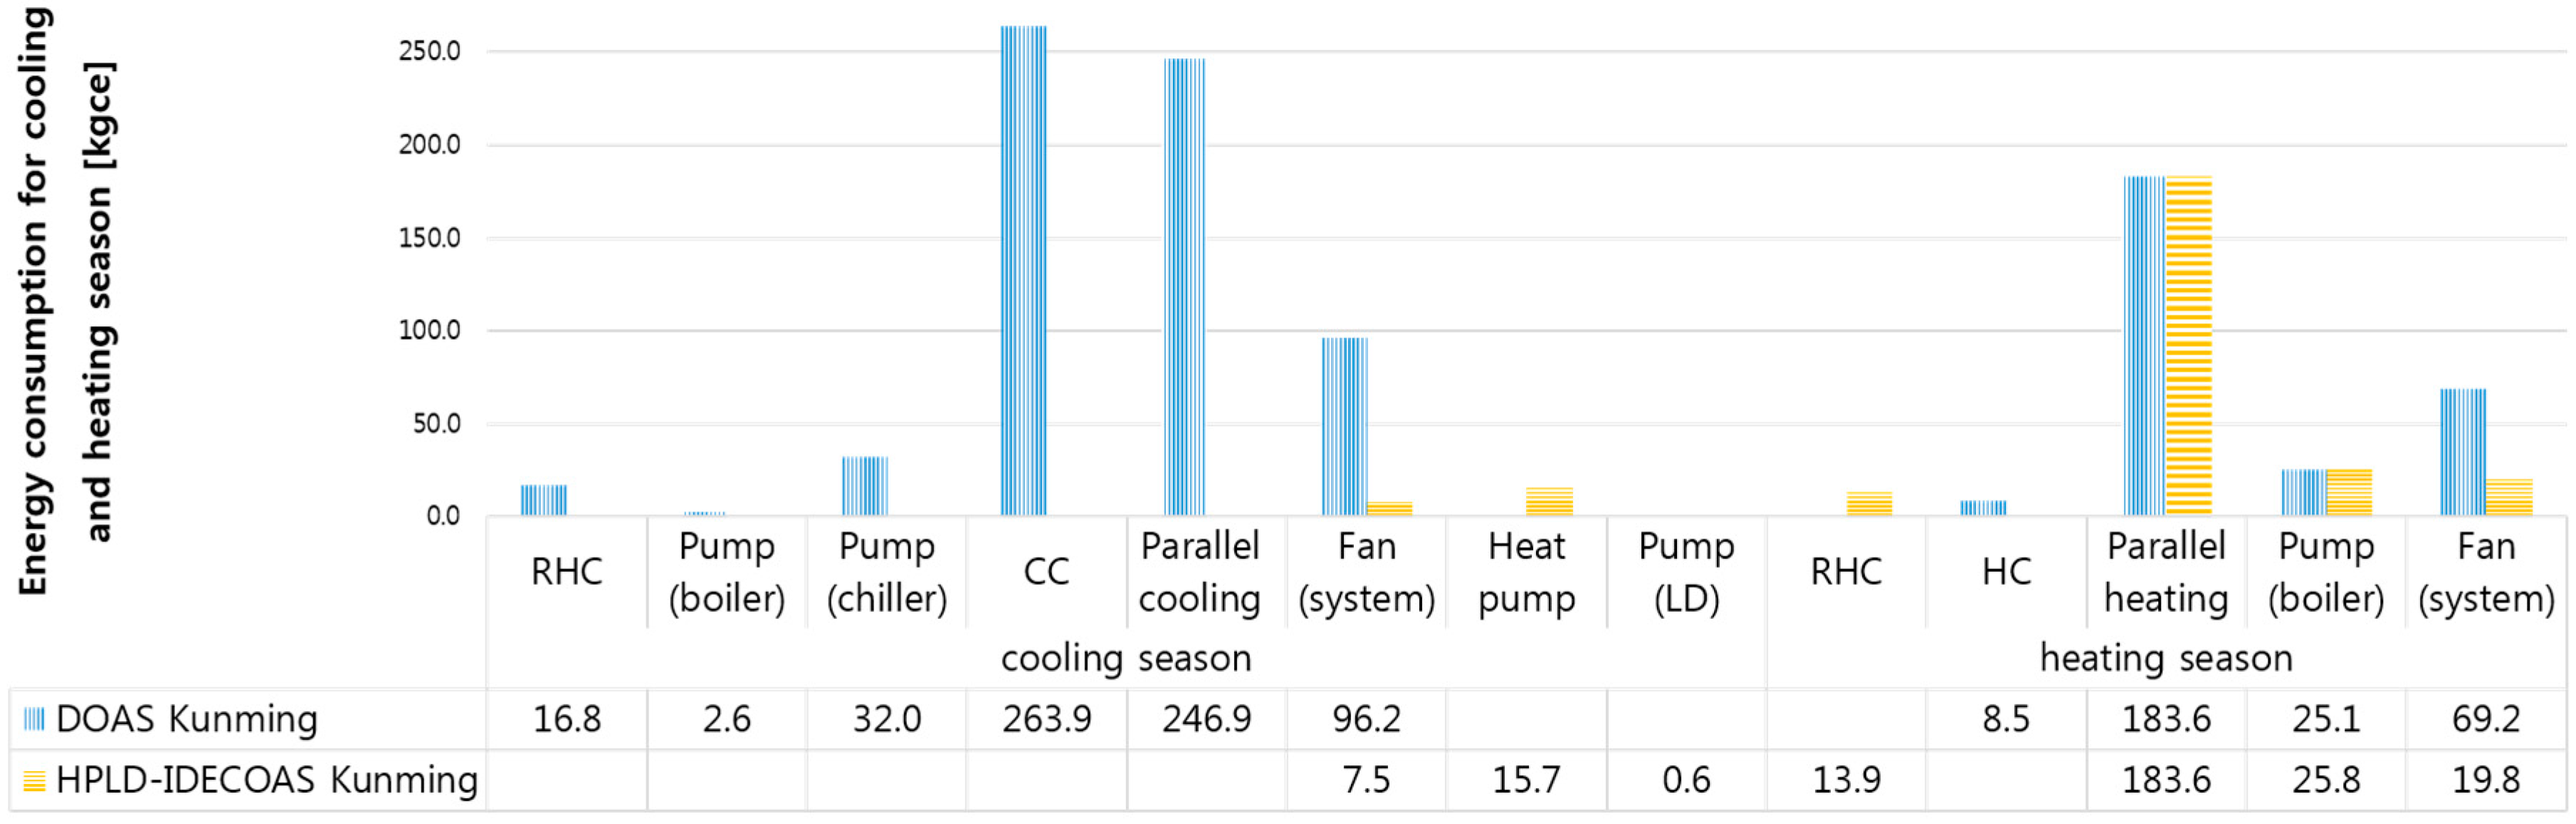
The summer in Kunming is not particularly hot, the winter is not particularly cold, and the four seasons are as warm as spring. Therefore, the total energy consumption is lower in the six comparison cities, only higher than the driest Lhasa. The annual energy consumption of the HPLD-IDECOAS saves a total of 51% compared to the DOAS.
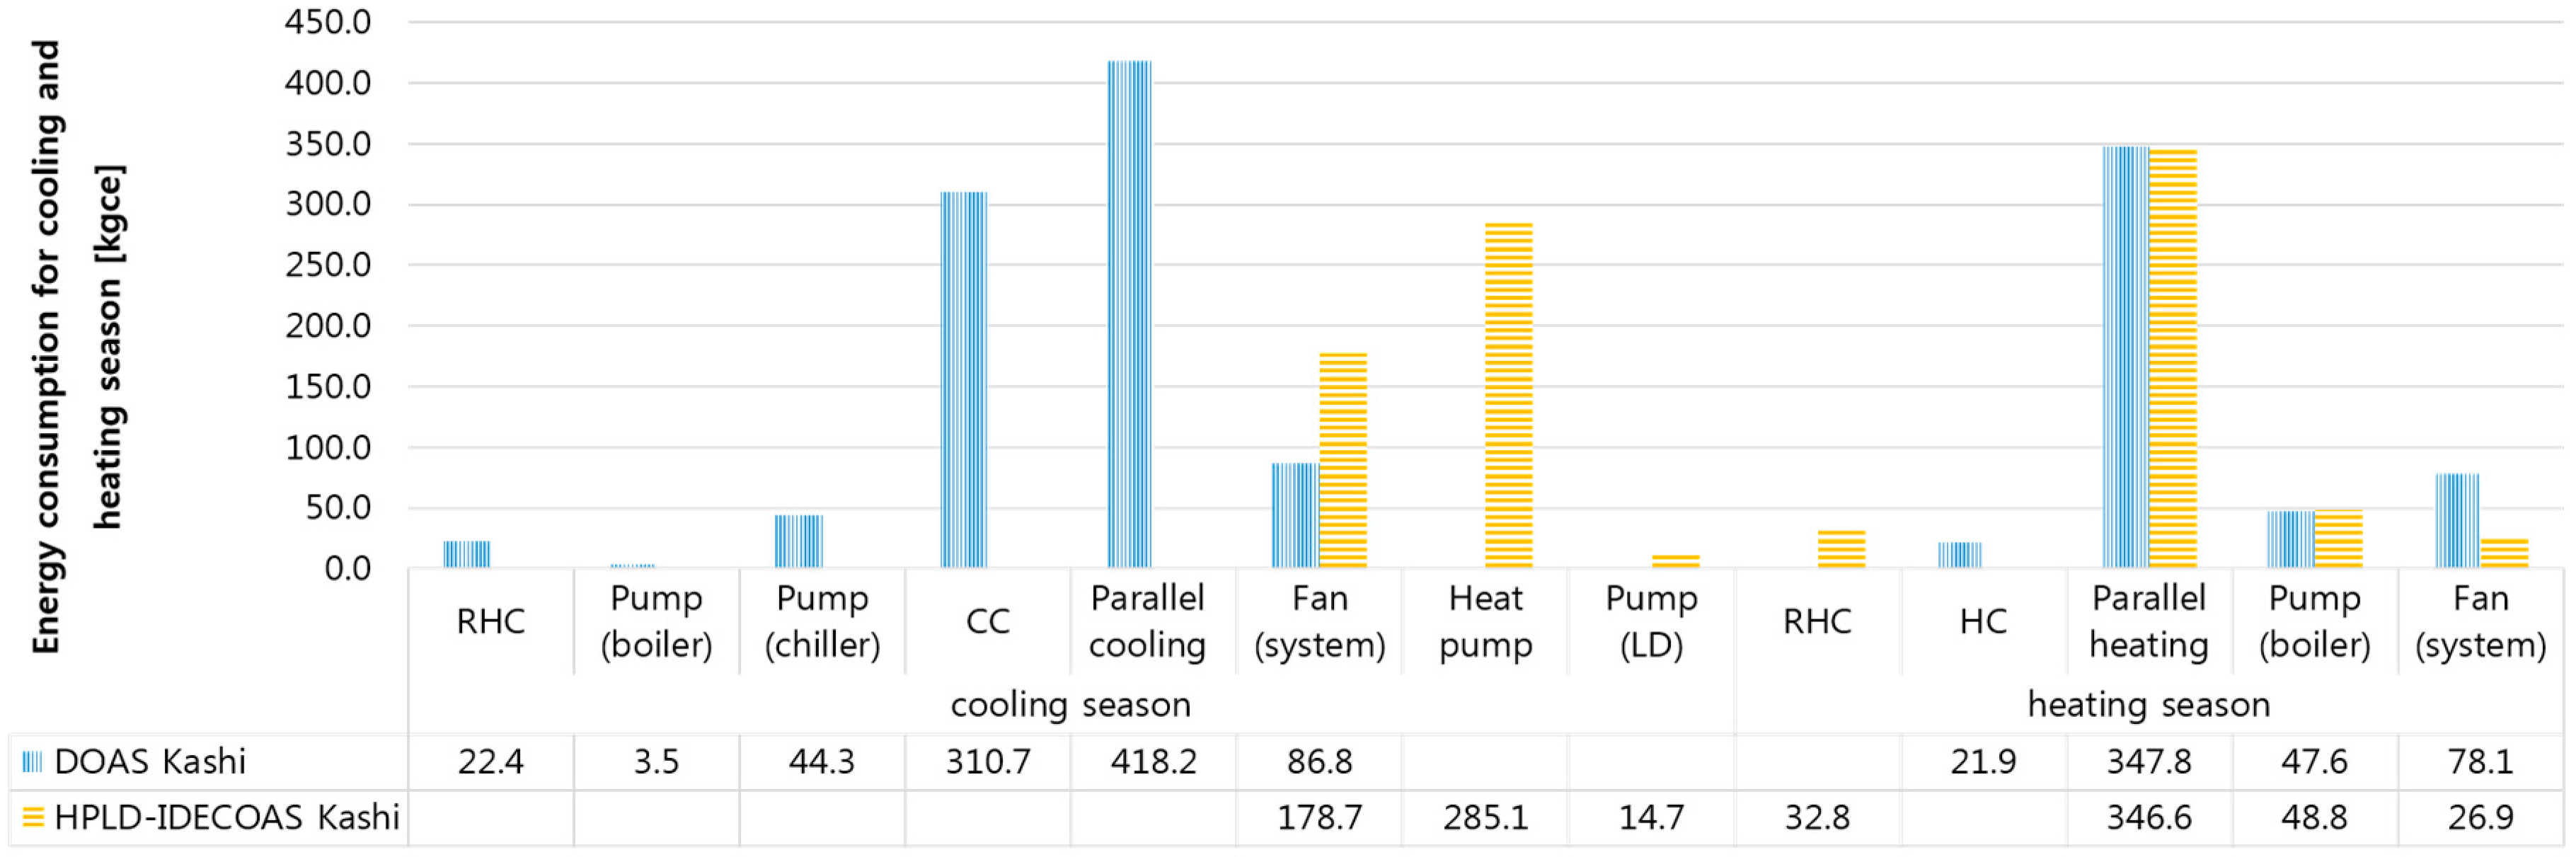
Although the summer of Kashi is long and hot, the low-temperature period is long. The total energy consumption of the two systems is similar to Beijing at 30%.
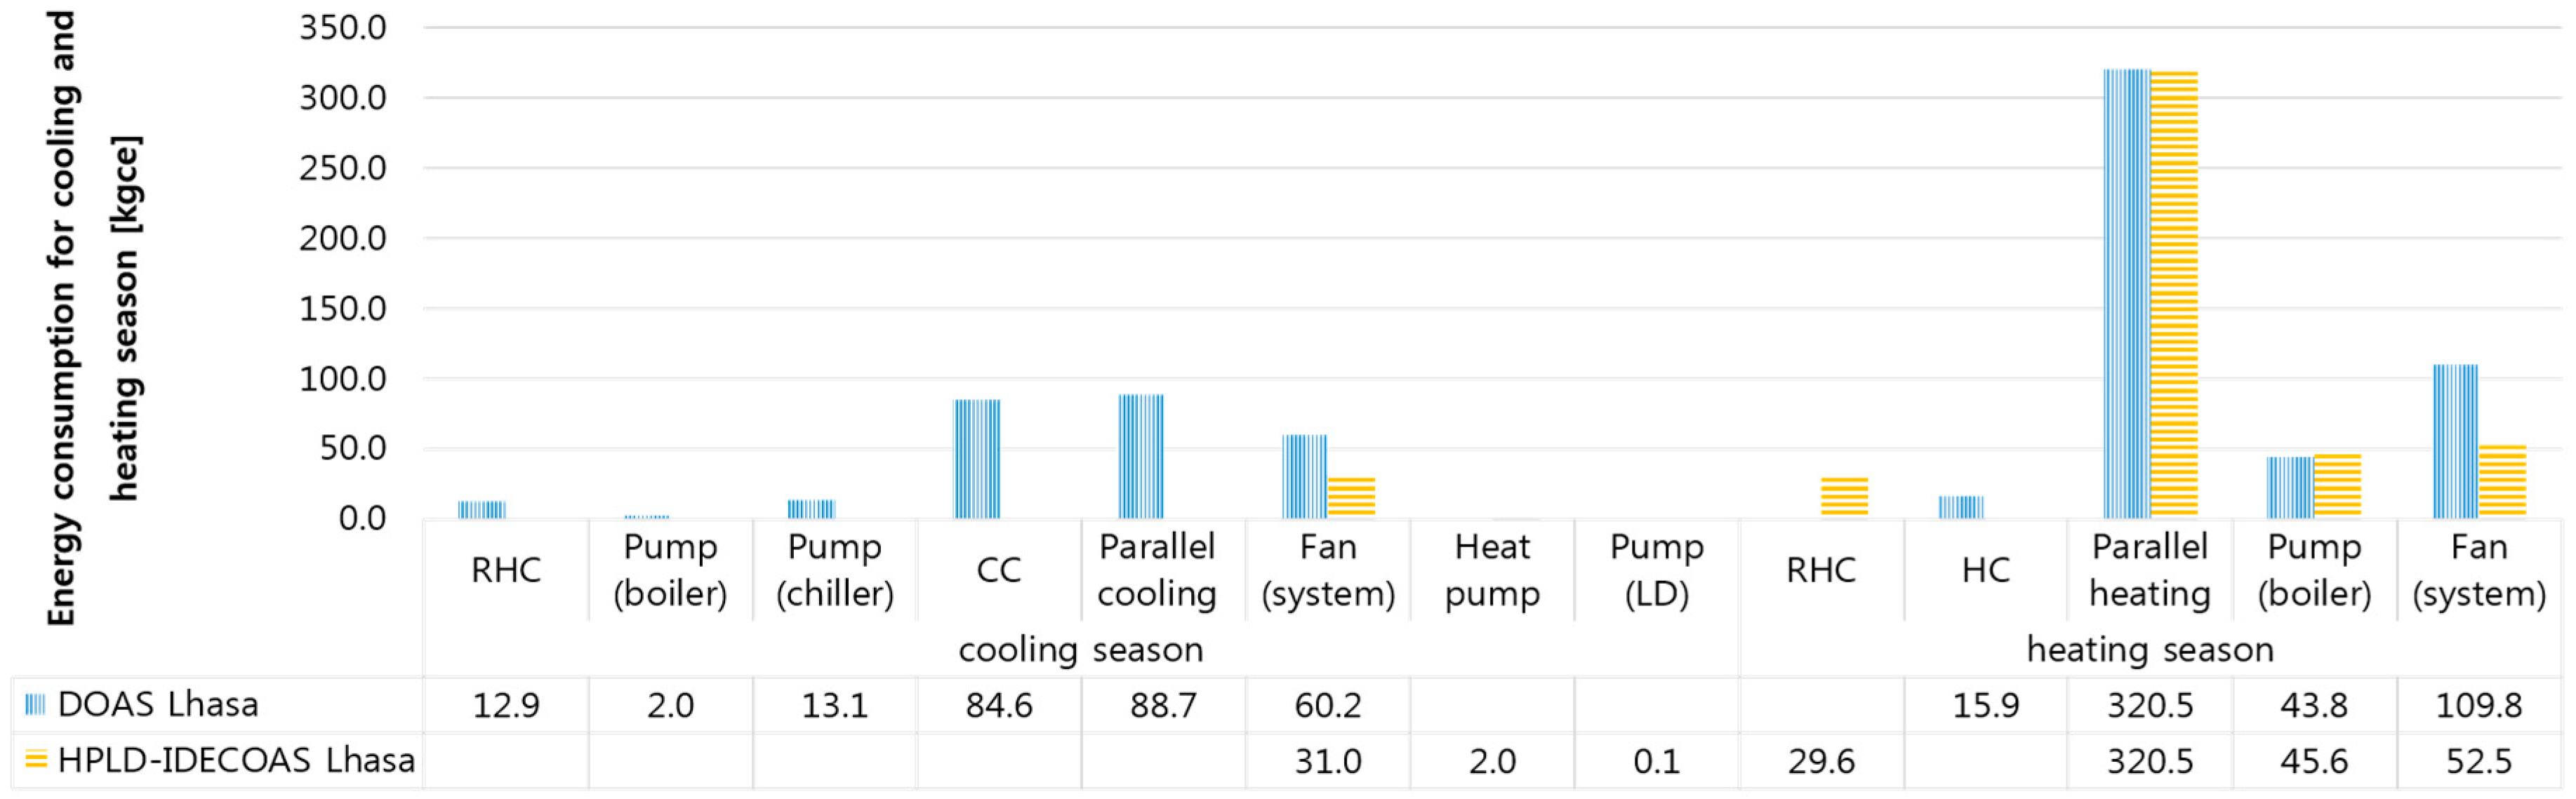
Lhasa is a relatively dry place, and does not experience particularly extreme heat in summer; it has the lowest temperature in summer compared to other cities, and the temperature of winter is not too low. Because of the dryness, the LD system is not activated. In order to deal with the sensible heat load in the room, the HPLD-IDECOAS exhibits higher energy-saving potential at 35% due to the use of IEC and the DEC than the DOAS using a chiller.

4.5. Discussion

In the previous study, Kim et al. [3] compared the annual energy consumption of the LD-IDECOAS with the traditional VAV system, and found that the energy-saving potential of the LD-IDECOAS system is 68%. On this basis, Li et al. compared the energy-saving performance of the conventional VAV system and the LD-IDECOAS in different climate regions of China, and the results show the LD-IDECOAS can save considerable energy in all regions. Therefore, in this study, we obtained the difference in energy consumption between the DOAS and the HPLD-IDECOAS in various climate regions.
Similar to Li et al. [5], the simulation results also showed the HPLD-IDECOAS has higher energy-saving potential in hot and humid areas, even in warm regions such as Kunming. Moreover, the system which is used the CC to remove the sensible heating loads of the server room or dehumidification will consume more energy compared to the system that is not used the CC. For Li et al. the LD-IDECOAS, which does not used the CC, showed more energy-saving potential compared to the VAV system that used the CC. In this study, the HPLD-IDECOAS, which does not used the CC, showed higher energy-saving performance compared the DOAS with a parallel system that used the CC. The reason is as follows, to demand the sensible heating loads of the server room, the HPLD-IDECOAS used the direct and indirect evaporation cooling, what means that there is no energy consumption in this part, however, the DOAS with a parallel system used a chiller (the energy consumption of the chiller is expressed in Figure 25 as “parallel cooling”) to demand the sensible heating loads, which consumes much energy. To remove the latent heating loads of the server room, the HPLD-IDECOAS used an HPLD unit and the energy consumption of this part is expressed as “heat pump” in Figure 25, and the DOAS with a parallel system used an EW for free cooling and then the remaining latent heating loads will be removed by the chiller, which is expressed as “CC(chiller)” in Figure 25. Although the DOAS with a parallel system had already used an EW to recycle the waste heat from the RA to reduce the energy consumption, however, it can be easily seen in Figure 25 that the sum of the energy consumption of the chiller part (the sum of the “parallel cooling” and the “CC (chiller)” in Figure 25) is much higher than that of the “heat pump”.
Compared to the Li et al. [5], this study uses an HPLD unit instead of the LD system which is used in Li et al. [5] to make control manageable, and existing results show the HPLD system is more energy efficient than the LD system at the energy level [12].

5. Conclusions

This study compared the annual energy consumption of two 100% outdoor air systems by using the same model building under the climatic conditions of six selected representative cities. The conclusions drawn from this study are as follows:
  • The higher the humidity, the higher the energy-saving potential of the HPLD-IDECOAS compared to that of the DOAS. According to the humidity change chart (Figure 9) of the peak day, in Guangzhou as the wettest city, the annual energy-saving potential between the selected systems is 36%. As the second wettest city, Shanghai has an annual energy-saving potential of 35%, and as the relatively cold and dry cities in the six cities, Beijing, Kashi, and Lhasa, the annual energy-saving potential is 32%, 30%, and 18%.
  • The HPLD-IDECOAS has more energy-saving potential in the selected cities than the DOAS, because of the use of an HP instead of a chiller. Compared with the DOAS, the city that uses the HPLD-IDECOAS, which has the most annual energy-saving potential, saving 37% of energy, is Kunming, due to the use of the IEC and the DEC.
  • In dry regions with high altitudes, the difference in annual energy consumption between the two systems is small at 18%, such as the performance of the two systems in Lhasa.
  • Compared to the DOAS, the HPLD-IDECOAS has higher energy-saving potential in warmer regions, which is shown from the comparison of the energy-saving potential of the two systems in wet regions (36% in Guangzhou, 37% in Kunming, and 35% in Shanghai) and relatively dry regions (32% in Beijing, 30% in Kashi, and 18% in Lhasa).

Author Contributions

S.L., S.-T.N., and J.-W.J. performed the simulation, data analysis and wrote this paper based on the obtained results.

Funding

This work was supported by the Korean Agency for Infrastructure Technology Advancement (KAIA) grants (19CTAP-C141826-02), by the Korean Institute of Energy Technology Evaluation and Planning (KETEP) (no. 20184010201710), and by the National Research Foundation of Korea (NRF) grant (no. 2019R1A2C2002514).

Conflicts of Interest

The authors declare no conflict of interest.

Abbreviations

DOASDedicated outdoor air system
HPLD-IDECOASHeat-pump-integrated liquid-desiccant and evaporative-cooling-assisted 100% outdoor air system
HPLDHeat-pump-integrated liquid-desiccant system
IDECOASIndirect and direct evaporative-cooler-assisted 100% outdoor air system
LDLiquid desiccant
LD-IDECOASLiquid-desiccant and indirect and direct evaporative-cooler-assisted 100% outdoor air system
EESEngineering equation solver
HVACHeating ventilation and air conditioning
VAVVariable air volume
RAReturn air
SASupply air
OAOutdoor air
EAExhausted air
DECDirect evaporative cooler
IECIndirect evaporative cooler
WBTWet-bulb temperature (°C)
HCHeating coil
CCCooling coil
RHCReheat coil
SHESensible heat exchanger
HRHumidity ratio
EWEnthalpy wheel
DBTDry-bulb temperature (°C)
RHRelative humidity (%)
DFRDriving force ratio
SESensible efficiency
LELatent efficiency

Nomenclature

aSurface area-to-volume ratio of the packing (m2/m3)
ZPacking height (m)
TTemperature (°C)
T a , in Indoor air temperature (°C)
p s Vapor pressure of desiccant solution (kPa)
CSolution concentration (-)
c p Specific heat capacity (kJ/kg⋅K)
p a Water-vapor partial pressure (Pa)
QLoad (kW)
h fg Heat of water vaporization (=2257 kJ/kg)
m ˙ Mass flow rate (kg/s)
m i n Minimum
P L R c Function of the part-load ratio
F r e q Compressor frequency
V ˙ Volumetric flow rate (m3/s)
WEffective mechanical power (W/m2)

Greek Symbols

ε Effectiveness (-)
ωHumidity ratio (kg/kga)
πFunction of the vapor-pressure depression of the desiccant solution to the vapor pressure of pure water ((pa − ps)/pa)

Subscripts

airAir
outOutlet
inInlet
solDesiccant solution
senSpace sensible
latSpace latent
eqEquilibrium
regRegenerator
priPrimary side
secSecondary side
dehDehumidification
SpdSpeed

References

  1. China Association of Building Energy Efficiency. The Overall Situation of China’s Building Energy Consumption. 2019, pp. 26–31. Available online: https://berc.bestchina.org/Files/CBEU2018.pdf (accessed on 5 March 2019).
  2. Kim, M.H.; Park, J.S.; Jeong, J.W. Application of desiccant systems for improving the performance of an evaporative cooling-assisted 100% outdoor air system in hot and humid climates. Energy 2013, 59, 726–736. [Google Scholar] [CrossRef]
  3. Kim, M.; Park, J.; Sung, M.; Choi, A.; Jeong, J. Annual operating energy savings of liquid desiccant and evaporative-cooling-assisted 100% outdoor air system. Energy Build. 2014, 76, 538–550. [Google Scholar] [CrossRef]
  4. Kim, M.H.; Park, J.Y.; Park, J.S.; Jeong, J.W. Application of desiccant systems for improving the performance of an evaporative cooling-assisted 100% outdoor air system in hot and humid climates. J. Build. Perform. Simul. 2015, 8, 173–190. [Google Scholar] [CrossRef]
  5. Li, S.; Jeong, J.W. Energy performance of liquid desiccant and evaporative cooling-assisted 100% outdoor air systems under various climatic conditions. Energies 2018, 11, 1377. [Google Scholar] [CrossRef]
  6. Mumma, S.A. Dedicated OA Systems. ASHRAE Trans. 2001, 104, 1232. [Google Scholar]
  7. Gommed, K.; Grossman, G. Experimental investigation of a liquid desiccant system for solar cooling and dehumidification. Sol. Energy 2007, 81, 131–138. [Google Scholar] [CrossRef]
  8. Jain, S.; Tripathi, S.; Das, R.S. Experimental performance of a liquid desiccant dehumidification system under tropical climates. Energy Convers. Manag. 2011, 52, 2461–2466. [Google Scholar] [CrossRef]
  9. Katejanekarn, T.; Chirarattananon, S.; Kumar, S. An experimental study of a solar-regenerated liquid desiccant ventilation pre-conditioning system. Sol. Energy 2009, 83, 920–933. [Google Scholar] [CrossRef]
  10. Alizadeh, S. Performance of a solar liquid desiccant air conditioner—An experimental and theoretical approach. Sol. Energy 2008, 82, 563–572. [Google Scholar] [CrossRef]
  11. Bergero, S.; Chiari, A. Performance analysis of a liquid desiccant and membrane contactor hybrid air-conditioning system. Energy Build. 2010, 42, 1976–1986. [Google Scholar] [CrossRef]
  12. Shin, J.H.; Park, J.Y.; Jo, M.S.; Jeong, J.W. Impact of heat pump-driven liquid desiccant dehumidification on the energy performance of an evaporative cooling-assisted air conditioning system. Energies 2018, 11, 345. [Google Scholar] [CrossRef]
  13. Jeong, J.W.; Mumma, S.A.; Bahnfleth, W.P. Energy conservation benefits of a dedicated outdoor air system with parallel sensible cooling by ceiling radiant panels. ASHRAE Trans. 2003, 109 Pt 2, 627–636. [Google Scholar]
  14. Stanke, D.A.; Danks, R.A.; Muller, C.O.; Hedrick, R.L.; Fisher, F.J.; Osborn, J.E.; Butler, D.S.; Gallo, F.M.; Rasmussen, R.D.; Alevantis, L.E.; et al. Ventilation for acceptable indoor air quality. ASHRAE Stand. 2010, 2007, 1–70. [Google Scholar]
  15. Kim, M.H.; Kim, J.K.; Lee, K.H.; Baek, N.C.; Park, D.Y.; Jeong, J.W. Performance investigation of an independent dedicated outdoor air system for energy-plus houses. Appl. Therm. Eng. 2019, 146, 306–317. [Google Scholar] [CrossRef]
  16. Cheon, S.-Y.; Lim, H.; Jeong, J.-W. Applicability of thermoelectric heat pump in a dedicated outdoor air system. Energy 2019, 173, 244–262. [Google Scholar] [CrossRef]
  17. Standards, C.N. Code for Design of Civil Buildings GB 50352-2005. Available online: www.gbstandards.org (accessed on 5 March 2019).
  18. Standards, C.N. Design Standard for Energy Efficiency of Public Buildings GB50189-2015. Available online: www.gbstandards.org (accessed on 5 March 2019).
  19. Pacific Northwest National Laboratory ANSI/ASHRAE/IES Standard 90.1-2010 Performance Rating Method Reference Manual. Pnnl-255130 2016. Available online: https://www.pnnl.gov/main/publications/external/technical_reports/PNNL-25130.pdf (accessed on 5 March 2019).
  20. Standards, C.N. Thermal Environmental Conditions for Human Occupancy GB/T5701-2008. Available online: www.gbstandards.org (accessed on 5 March 2019).
  21. Standards, C.N. Code for Design of Heating, Ventilation and Air Conditioning for Civil Buildings GB50736-2012. Available online: www.gbstandards.org (accessed on 5 March 2019).
  22. Katejanekarn, T.; Kumar, S. Performance of a solar-regenerated liquid desiccant ventilation pre-conditioning system. Energy Build. 2008, 40, 1252–1267. [Google Scholar] [CrossRef]
  23. Chung, T.W.; Luo, C.M. Vapor pressures of the aqueous desiccants. J. Chem. Eng. Data 1999, 44, 1024–1027. [Google Scholar] [CrossRef]
  24. Goswami, D.Y.; Fumo, N. Study of an aqueous lithium chloride desiccant system: Air dehumidification and desiccant regeneration. Sol. Energy 2002, 72, 351–361. [Google Scholar]
  25. Jin, H.; Spitler, J.D. A parameter estimation based model of water-to-water heat pumps for use in energy calculation programs. ASHRAE Trans. 2002, 108 Pt 1, 3–17. [Google Scholar]
  26. Madani, H.; Claesson, J.; Ahmadi, N.; Lundqvist, P. Experimental Analysis of a Variable Capacity Heat Pump System Focusing on the Compressor and Inverter Loss Behavior. In Proceedings of the International Refrigeration and Air Conditioning Conference, West Lafayette, IN, USA, 12–15 July 2010. [Google Scholar]
  27. Mumma, S.A.; Shank, K.M. Achieving dry outside air in an energy-efficient manner. ASHRAE Trans. 2001, 107, 553–561. [Google Scholar]
  28. Mumma, S.A. Dedicated outdoor air-dual wheel system control requirements. ASHRAE Trans. 2001, 107, 147–155. [Google Scholar]
  29. Standards, C.N. General Principles for Caculation of Total Production Energy Consumption Gb/T 2589-2008. Available online: www.gbstandards.org (accessed on 5 March 2019).
Figure 1. Schematic diagram of HPLD-IDECOAS.
Energies 12 01798 g001
Figure 2. Four regions of psychrometric chart of HPLD-IDECOAS.
Energies 12 01798 g002
Figure 3. Schematic diagram of DOAS with parallel system.
Energies 12 01798 g003
Figure 4. Four regions of psychrometric chart of DOAS.
Energies 12 01798 g004
Figure 5. Selected cities on the climate distribution map of China.
Energies 12 01798 g005
Figure 6. Comparison of outdoor temperatures of the selected cities.
Energies 12 01798 g006
Figure 7. Comparison of humidity ratios of the selected cities.
Energies 12 01798 g007
Figure 8. Comparison of temperatures of each selected city.
Energies 12 01798 g008
Figure 9. Comparison of humidity ratios of each selected city.
Energies 12 01798 g009
Figure 10. Comparison of cooling load of each selected city.
Energies 12 01798 g010
Figure 11. Comparison of total energy consumption for peak day in each selected city.
Energies 12 01798 g011
Figure 12. Comparison of energy consumption for the peak day in each selected city.
Energies 12 01798 g012
Figure 13. Comparison of monthly energy consumption in Guangzhou.
Energies 12 01798 g013
Figure 14. Comparison of monthly energy consumption in Shanghai.
Energies 12 01798 g014
Figure 15. Comparison of monthly energy consumption in Kunming.
Energies 12 01798 g015
Figure 16. Comparison of monthly energy consumption in Beijing.
Energies 12 01798 g016
Figure 17. Comparison of monthly energy consumption in Kashi.
Energies 12 01798 g017
Figure 18. Comparison of monthly energy consumption in Lhasa.
Energies 12 01798 g018
Figure 19. Comparison of seasonal energy consumption in Beijing.
Energies 12 01798 g019
Figure 20. Comparison of seasonal energy consumption in Shanghai.
Energies 12 01798 g020
Figure 21. Comparison of seasonal energy consumption in Guangzhou.
Energies 12 01798 g021
Figure 22. Comparison of seasonal energy consumption in Kunming.
Energies 12 01798 g022
Figure 23. Comparison of seasonal energy consumption in Kashi.
Energies 12 01798 g023
Figure 24. Comparison of seasonal energy consumption in Lhasa.
Energies 12 01798 g024
Figure 25. Comparison of annual energy consumption.
Energies 12 01798 g025
Table 1. Physical information of the model buildings studied herein.
Weather DataType15-2 weather data (TRNSYS18)
Building TypeOffice building (400 m2) (20 m × 20 m)
SchedulesOffice occupants and HVAC schedules in ASHRAE90.1
Room Set PointCooling seasonTemperature     26 °C
Relative humidity  50%
Heating seasonTemperature     20 °C
Relative humidity  50%
Supply Air Set PointCooling seasonTemperature     15 °C
Heating seasonTemperature     20 °C
Internal Heat GainNumber of occupants20 occupants (100 m2/occupant)
Computer20 kJ/h (TRNSYS18)
Lighting17 W/m2 (TRNSYS18)
CityBeijingLhasaKashiShanghaiGuangzhouKunming
Atmospheric Pressure (kPa)99.466.986.599.999.981.1
U-Values (W/m2‧K)Roof0.40.40.40.40.50.5
Exterior Wall0.450.450.450.60.80.8
Window2.82.82.83.55.25.2
Window-to-Wall Ratio0.2
Table 2. Coefficients of vapor pressure equation.
Group 0Group 1Group 2
a 0 a 1 a 2
4.582−0.1590.007
b 0 b 1 b 2
−18.3820.567−0.019
c 0 c 1 c 2
21.312−0.6660.013
Table 3. Reference values and coefficients for cooling mode.
Reference Values
V ˙ l o a d , r e f (m3/s)5.678 × 10−4
V ˙ s o u r c e , r e f (m3/s)5.678 × 10−4
Q l o a d , c , r e f (nominal capacity) (W)14,215.35
T r e f (K)283.00
Model Coefficients
A1A2A3A4A5
−2.8581 × 1004.3425 × 100−9.6592 × 10−11.0978 × 10−14.6779 × 10⁻²
Table 4. Coefficients for the Spd function.
LEC1C2C3C4
<50%2.344−3.7141.444−0.005421
≥50%−21.284.65228.50.6905
C5C6C7C8C9
0.0022860.05852−0.0431−0.0016760.0006397
−0.00218−0.4167−0.87880.0044810.006532

