1. Introduction
Manufacturing activities account for one-third of the total energy consumption and CO2 emissions worldwide. Thus, energy-efficient production has been the focus of research over the last decade and is considered one of the major decision-making attributes of manufacturing today. This paper takes into account both the energy efficiency of the manufacturing process and the system. In mass production industries energy-efficient processes have received much interest, for example from the automotive industry.
The energy use depends on the process technology of the machine conducting each process. This paper concerns energy efficiency in welding, specifically with RLW (Remote Laser Welding) as compared to spot welding.
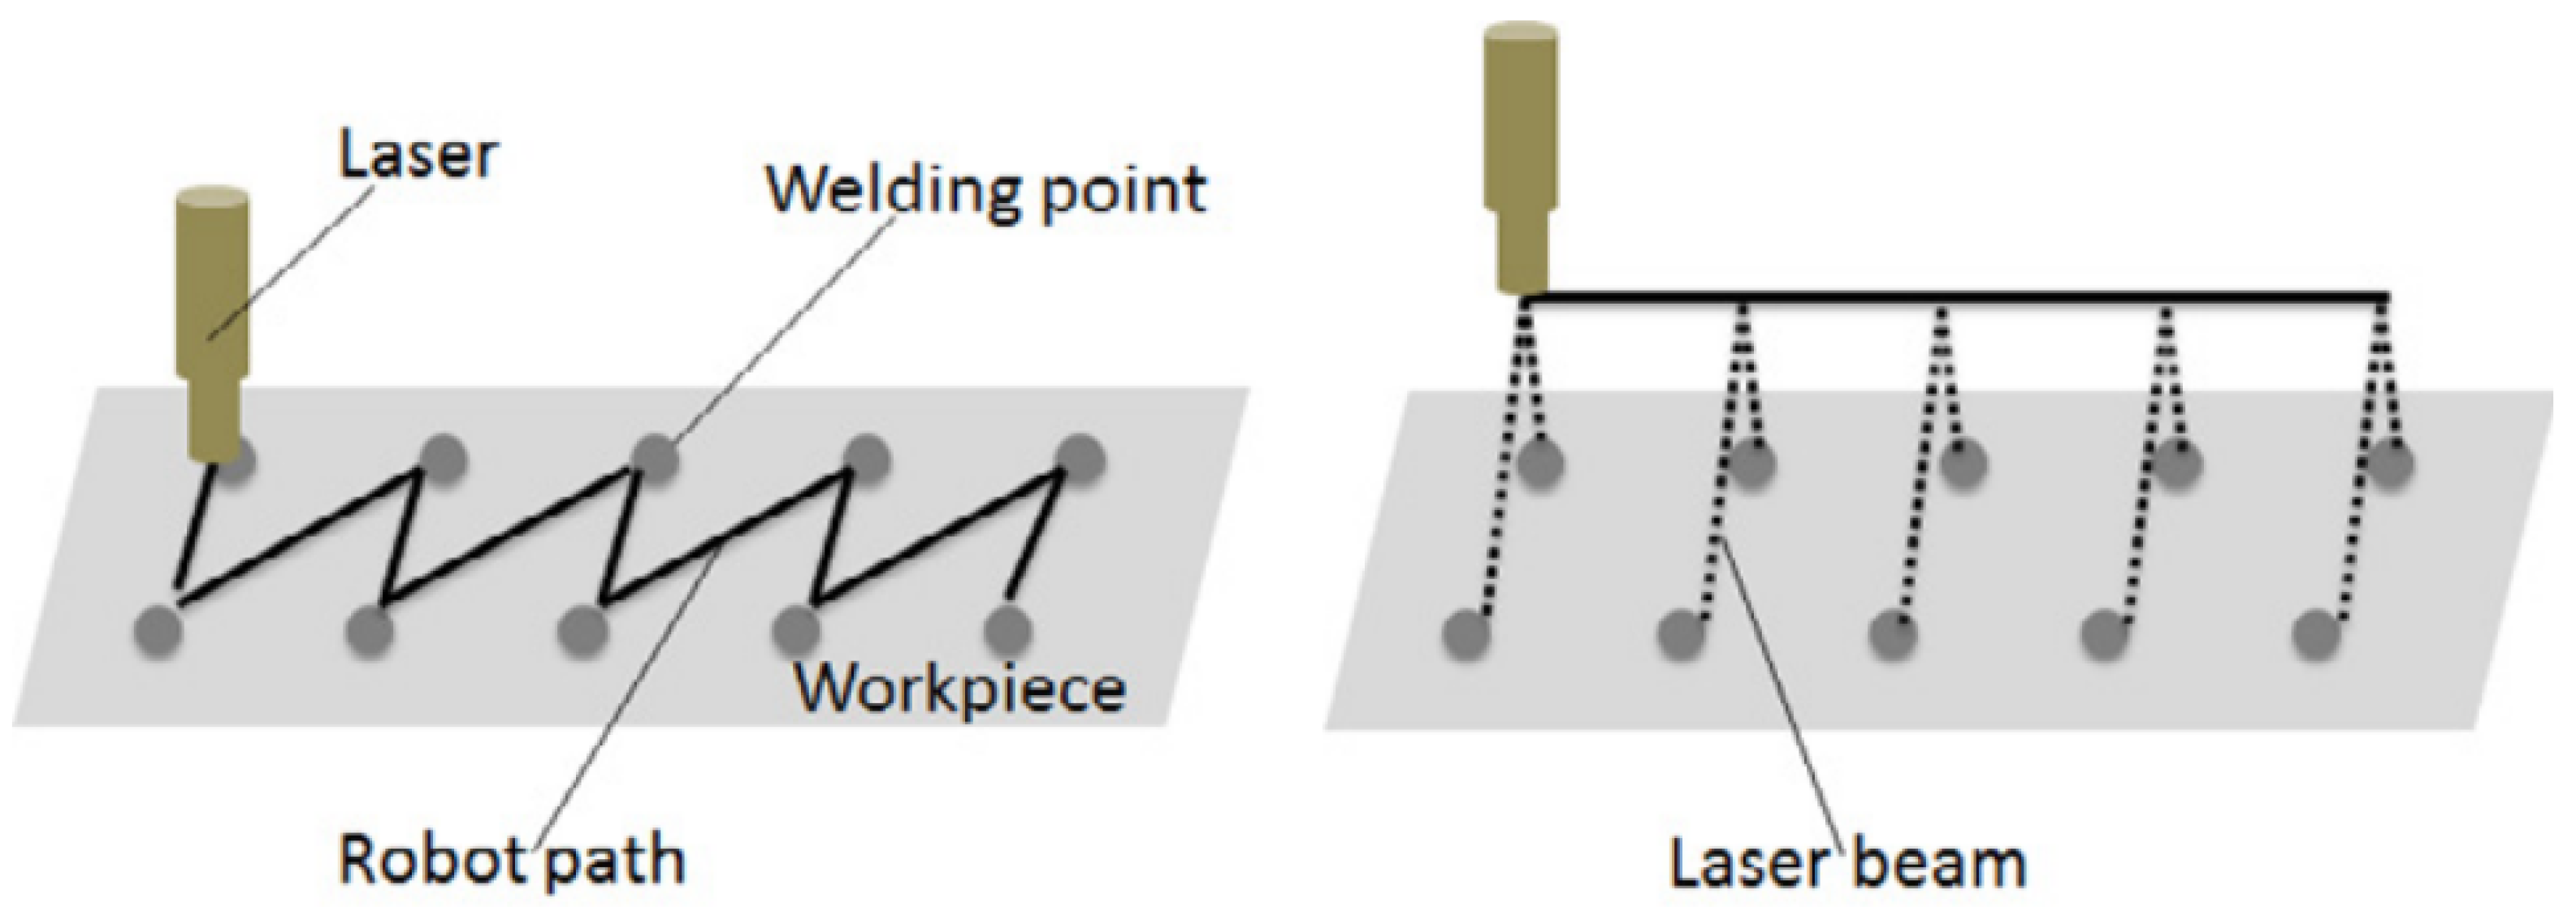
Figure 1 illustrates one aspect of movement differences between spot welding and remote welding. A spot welding robot visits all positions of stitches (
Figure 1 (Left)) and consumes energy for movement to welding positions as well as for the welding itself whereas in remote welding the robot performs welding at a distance and hence can use simpler movement paths (
Figure 1 (Right)).
Bearing this in mind, it can be seen that the process technology influences the energy consumption of other components in a machine. To reduce the total energy use, measurement and estimation of the whole process are required. As pointed out in [
1], when new processes are introduced into factory production lines, energy consumption is a significant factor in machine selection in addition to productivity needs. In this respect, RLW is interesting because it dramatically reduces both lead time and energy use in the assembly phase of production. Because of these benefits, RLW is of interest in mass production, notably in automotive assembly lines. However, it is necessary to be able to evaluate accurately potential benefits in order to see when the high initial investment is defrayed with savings. The current approach to new machine selection is to compare the technical specifications of energy use, which is a simple static number. The specification usually seldom shows the variation of the energy profile occurring in the process of specific products.
It is necessary for approaches to estimate the energy profile occurring when a welding robot attaches a specific set of stitches, as well as the energy efficiency of the overall processes. To do this, an energy estimation model is required before a new welding robot is introduced into the assembly line. The literature on laser welding focuses on measuring the energy profile of welding a specific assembly. Most research about welding energy consumption concerns estimation of the robot kinetic energy. Currently, there are many energy models of robot arms in the literature. The major energy consumers of RLW are the robot arm, the laser machine because laser generation energy is higher than conventional lasers, and cooling equipment. The ratio of robot motion among major consumers is relatively smaller than for a spot welding robot, which is measured with only kinetic energy use. For this reason, the energy use of each assembly process is different from others because the laser equipment is an additional variable causing fluctuations in the energy profile compared with the spot welding process.
The mechanism of the laser machine consists of the series of laser generation, concentration, delivery, and focusing, which are relatively more complicated than robot motion. The energy consumption model also reflects the mechanism and main consumption by using weighting factors. Using rule-based approaches, it is difficult to develop common models for different processes and machines. Thus, an energy estimation model for laser machines is proposed in this paper using a machine learning approach. In particular, a deep learning model is utilized for training and correlation with process parameters and extracted feature data.
This paper proposes a comprehensive energy estimation model for RLW and its energy efficiency model. In
Section 2, the basic concept and existing models for energy estimation are introduced.
Section 3 describes the deep learning approach to simulate estimated energy use, followed by
Section 4 explaining the results of experiments with the welding process for an automotive rear door assembly. Then, in
Section 5, the difference between the proposed approach and conventional models is described. Conclusions are given in
Section 6.
2. Literature Survey
In this section, previous models of energy efficiency of manufacturing resources, which are specifically for machine tools, are discussed. Then, some methods and strategies for estimating energy use, which is a key input for calculation of energy efficiency, are introduced from aspects of energy efficiency and energy consumption of functional analysis and process analysis. Finally, the use of machine learning to estimate energy profiles is evaluated in terms of pros and cons.
2.1. Energy Efficiency of Machine Tools
Fundamentally, energy efficiency started from a power-based energy efficiency model proposed by Sebastian [
2]. Zhou et al. [
3] also discussed other approaches to distinguish instantaneous energy efficiency and process energy efficiency to categorize changes in mechanical design and process optimization. Relatively speaking, instantaneous energy efficiency can be estimated using the machine specification. However, process energy efficiency is calculated using process parameters, as well as machine configurations. As evaluated by Zhou et al. [
3], the energy efficiency method has improved from optimization of machine design and process planning. Both approaches led to integrated design and planning to incorporate real-time data, a kinematic-based model, the consideration of the NC code, etc.
Pagone et al. [
4] also pointed out the limitation of total energy consumption in the energy efficiency of ferrous material processing. In particular, the material characteristics, such as the aspect of thermal dynamics, are comprised of the internal energy storage, which are seldom measured by external sensors. Comparison between two different processes is also needed to decompose a whole process into the components and unit process.
2.2. Energy Consumption Model of Machine Tools
Improving the accuracy of efficiency models requires an accurate energy decomposition model even though process parameters and machine configurations are changed. Gustawski et al. [
5,
6,
7] illustrated the spectrum of energy consumption of a three-axis CNC milling machine and the different contributions of machine components to energy use. Gontarz et al. [
8] described the need for measurement at the component level with an electric analogue structure of a milling machine. In terms of laser processes, Um et al. [
1] compared the machine components of RLW with electric analogue structures as well.
2.2.1. Early Estimation of Energy Consumption
The dominant approach to early energy estimation is direct measurement of specific conditions. The purpose of this approach is to find optimal process parameters. For process optimization, Winter [
9] measured energy use of a grinding machine and extended the concept to eco-efficiency [
10]. In terms of laser processes, the laser device of an additive process has been investigated. Ma et al. [
11] built the formulation of energy consumption for the laser device of a Selective Laser Sintering (SLS) machine. The energy consumption correlated with material characteristics was discussed by Zhu et al. [
12].
2.2.2. Process-Driven Approaches
Practically, simple measurement provides only an intuitive view of the energy consumption of a new process. It is necessary to decompose it into process aspects. Gregory [
13] investigated robot trajectory planning and optimized energy use with an estimation model. Avram [
14] proposed an energy evaluation model of a 2.5D milling machine by decomposing the process into machining working steps. Duflow [
15] emphasized the process approach to find more accurate energy consumption estimates because of the need to compare a variety of machine tools. Newman et al. [
16] proposed energy efficiency process planning with consideration of the cutting parameters, which are the feed rate, depth of cut, and spindle speed.
2.3. Integrated Approaches and Neural Networks
As with Duflow [
15], the integration of process-driven approaches and measurement-driven approaches is proposed by discretizing the energy profile into unit blocks. Recent research on eco-efficiency focuses on estimating consumed energy depending on the process plan and structure of the machine tool. Um et al. [
1] proposed the integration of process and machine specification, but it is still necessary to have an advanced method for determining the energy profile in order to improve the accuracy of the energy consumption model, as well as for energy efficiency.
In order to fill the accuracy gap, machine learning is used in integrated approaches. The major application of deep learning concerns homes. The field of energy estimation models was introduced in the building industry to estimate the energy profile of electricity use. This is intended to draw a continuous and smooth curve relating time and energy use. This energy estimation model is typically applied to buildings and houses where a large amount of uncontrollable parameters influences the profile with repeated daily or monthly patterns. The characteristics of these applications lead to time series data analysis, such as recurrence neural networks applied to home electricity use [
17]. This application focuses on observation of the uncontrollable patterns of energy use [
18]. With energy estimation of building energy use, the following features can be discerned: (1) multiple variables are considered; (2) the distribution of events influencing energy consumption is high.
In contrast, manufacturing resources are more controllable than building systems because of repeatable, planned operations. However, the energy profiles of production facilities are determined by changes of the product model, machine configuration, line balance, scheduling, etc. The quantity of measured data is relatively smaller than for buildings because optimized machine programs are achieved prior to reaching the factory, so they do not lead to loss by cost and failure of quality. Being controllable and predictable, the factory facility is reflected in the energy estimation model. Since around 2010, an increasing amount of research has been conducted in deep learning applications over a diverse range of areas from home to factory. This paper introduces the current state of deep learning applications for energy estimation and in particular assesses contributions made in the field of manufacturing systems.
3. Methodology of Estimating Energy Use of RLW
3.1. Energy Efficiency of RLW
The intention of this section is two-fold. Firstly, we introduce the formulation of energy efficiency for RLW, which is a new area of research on energy estimation models in manufacturing facilities. Secondly, the energy decomposition derived from the analysis of the e-scheme is introduced to give the details of the proposed energy efficiency formulation. We will then discuss how to apply both models to RLW.
In this section, we introduce some definitions that support easier understanding of the laser welding process based on power demand (
Figure 2). Sebastian [
2] proposed the formulation of energy efficiency of machine tools that remove volumes of material. The opposite direction to metal cutting is to produce products by combining material, in the welding process by combining two or more parts. For this reason, there is a series of questions about how to calculate production rates.
How do we count the amount of work? Typically, the work of metal cutting is measured by the removal volume. This factor is directly correlated to the feed rate, depth of cut, and cutting speed of milling and turning.
How do we measure the productivity of each shape of a stitch? Each stitch has a shape, i.e., a line, S-line, C-curve, etc., with different depths and widths. The energy use depends on all aspects.
The velocity of the robot arm is another factor, but with the same effect on energy consumption as for metal cutting.
Even though the same process parameters of laser welding are applied, the absorption rate of different materials is a factor that should be considered.
3.2. Energy Consumption Estimation of RLW
The energy decomposition of the e-scheme shows the major consumer of electricity. However, to estimate an accurate profile, the mechanism of energy consumption based on a theoretical model, such as kinematics or thermal dynamics, is required. Modeling all aspects of a specific machine is hard to achieve for machine users. Compensation with experimental data and process parameters is necessary. Additionally, experimental data of unit processes support adjustment of specific factors, which are difficult to represent as a theoretical model. Both approaches are breakthroughs in the limitations of theoretical models of energy consumption.
In this paper, the authors propose an integrated approach connecting function and process approaches by utilizing theoretical models and experimental compensation.
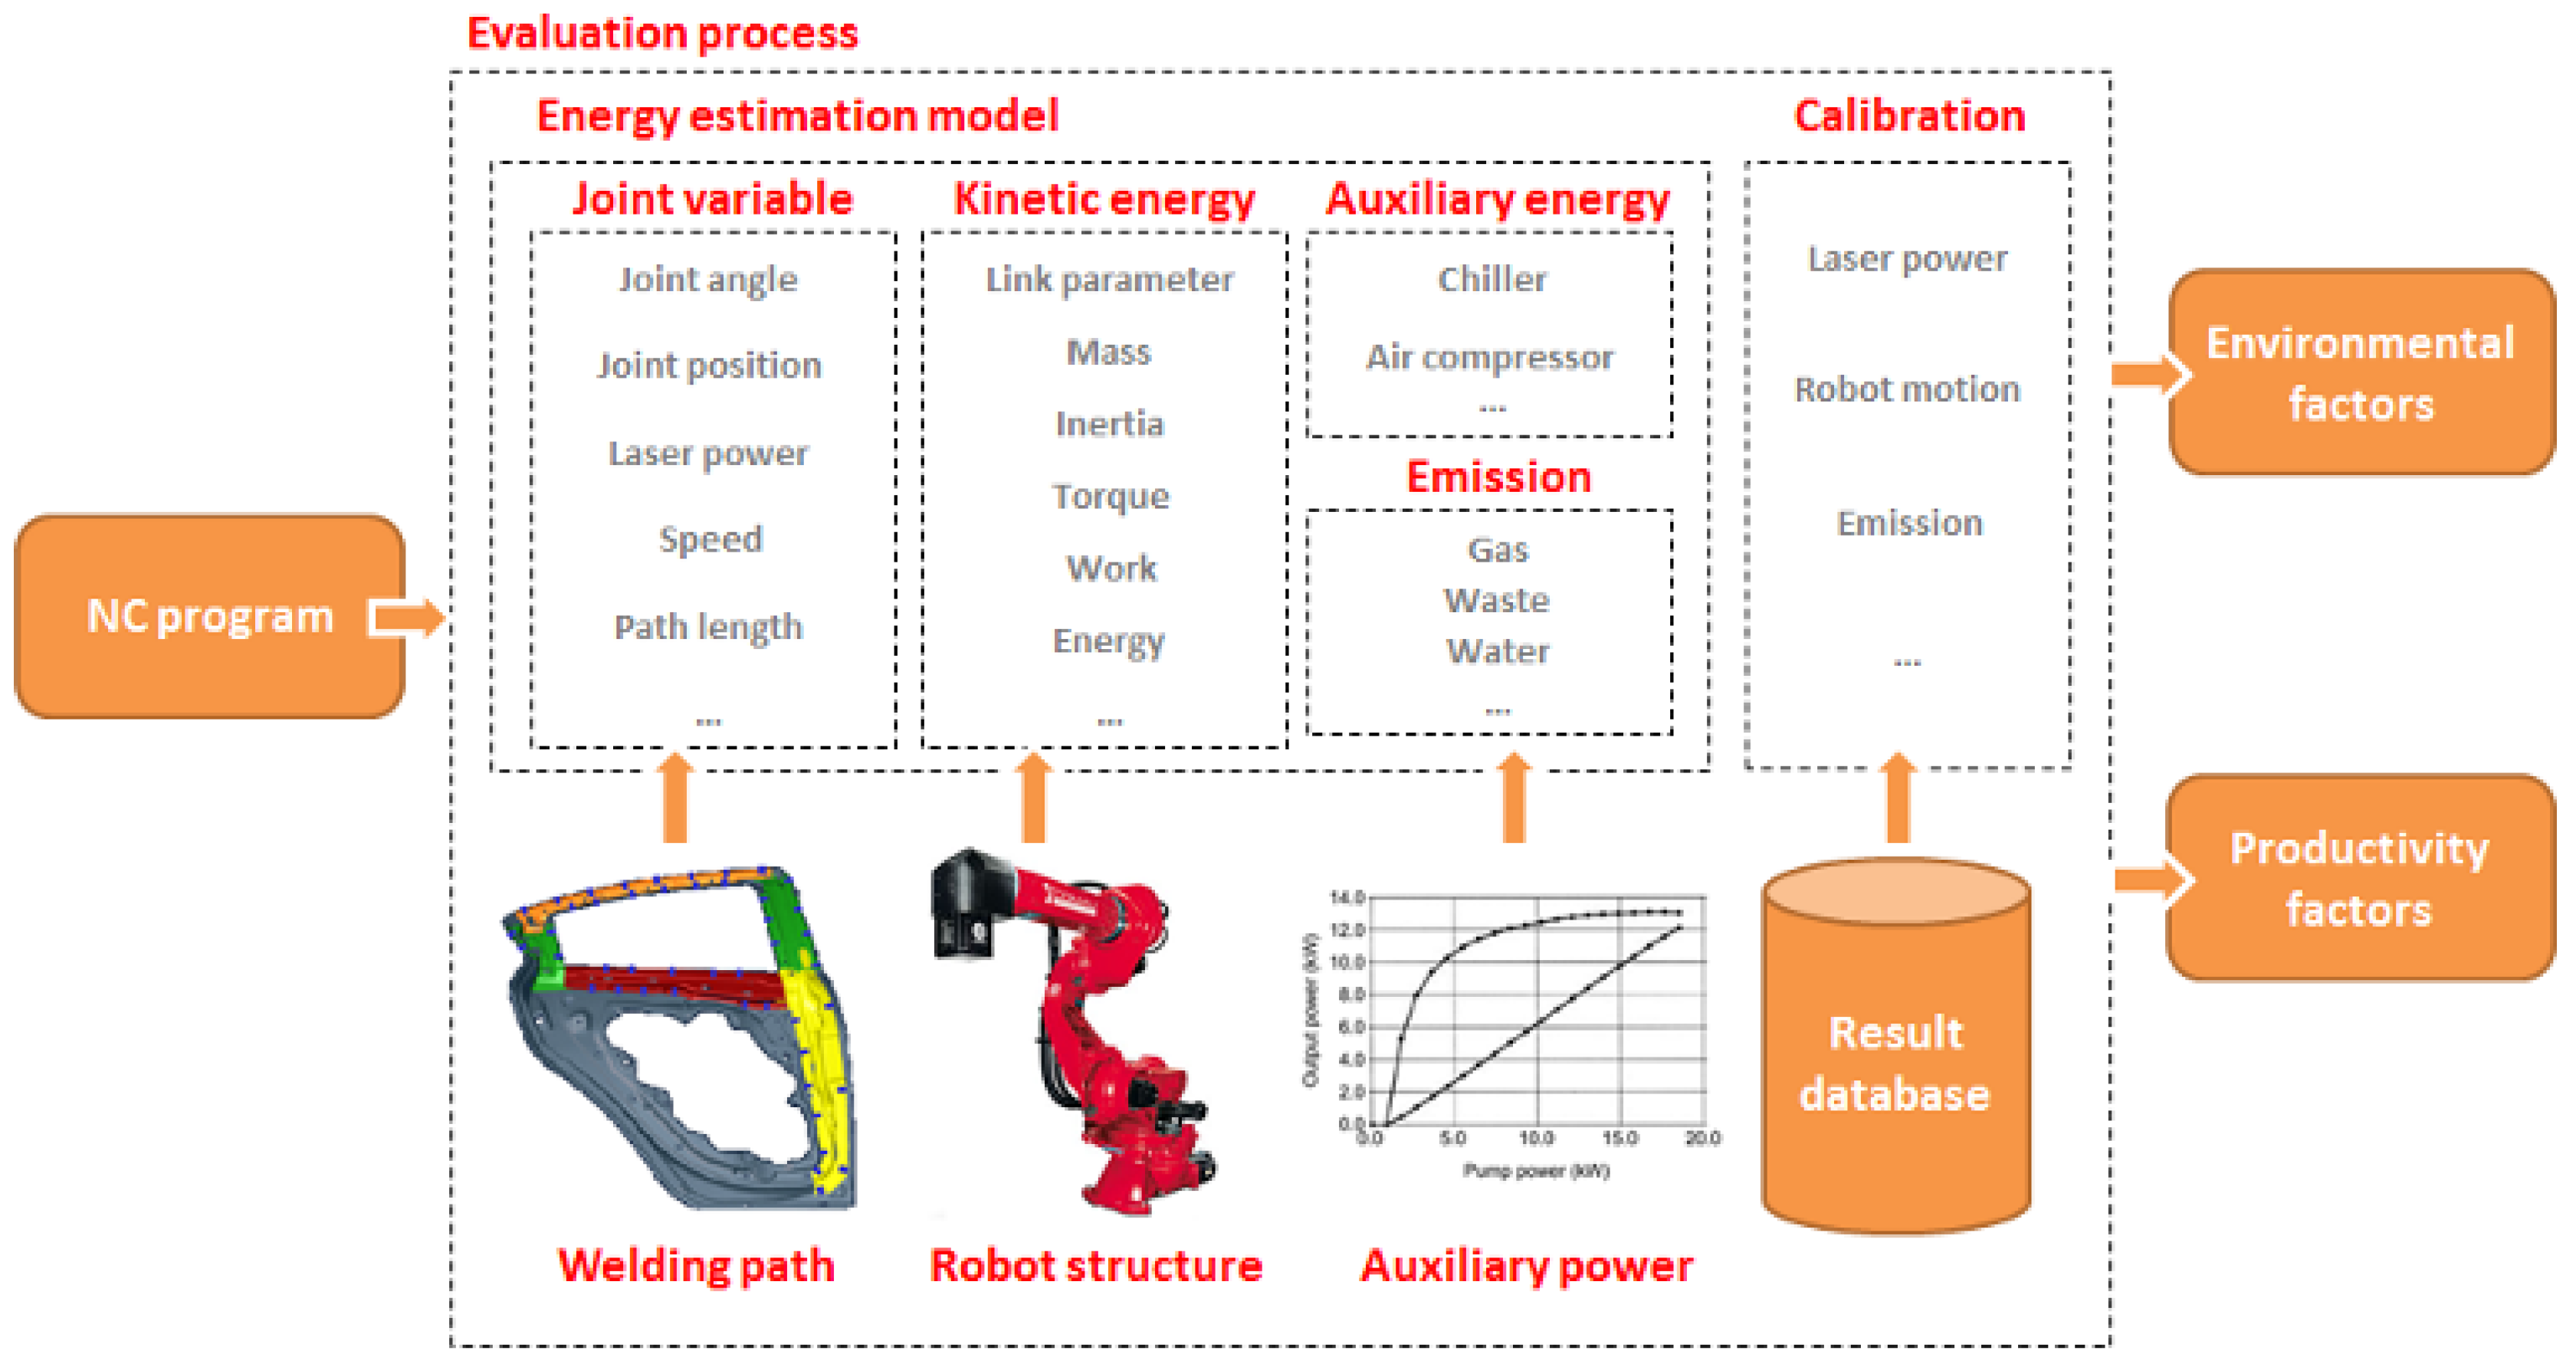
Figure 3 shows the proposed evaluation model, which is a procedure to merge function and process data and derive a compensated estimated energy profile. The functional approach consists of deriving the main functions, decomposing machine components, and establishing the theoretical model of major components. The process approach starts by analyzing the NC program and continues by measuring the energy profiles of each component and classifying the profiles into unit processes. Compensation links the output of the theoretical model with the energy profile of unit processes by a regression approach.
3.2.1. Functional Approach
In this section, the procedure proposed by Um et al. [
1] is described. It consists of functional analysis and component decomposition. The purpose of this approach is to find major energy consumers among components and to draw the approximate energy profile. However, component specifications given by machine builders provide insufficient information to estimate the energy profile of the specific product.
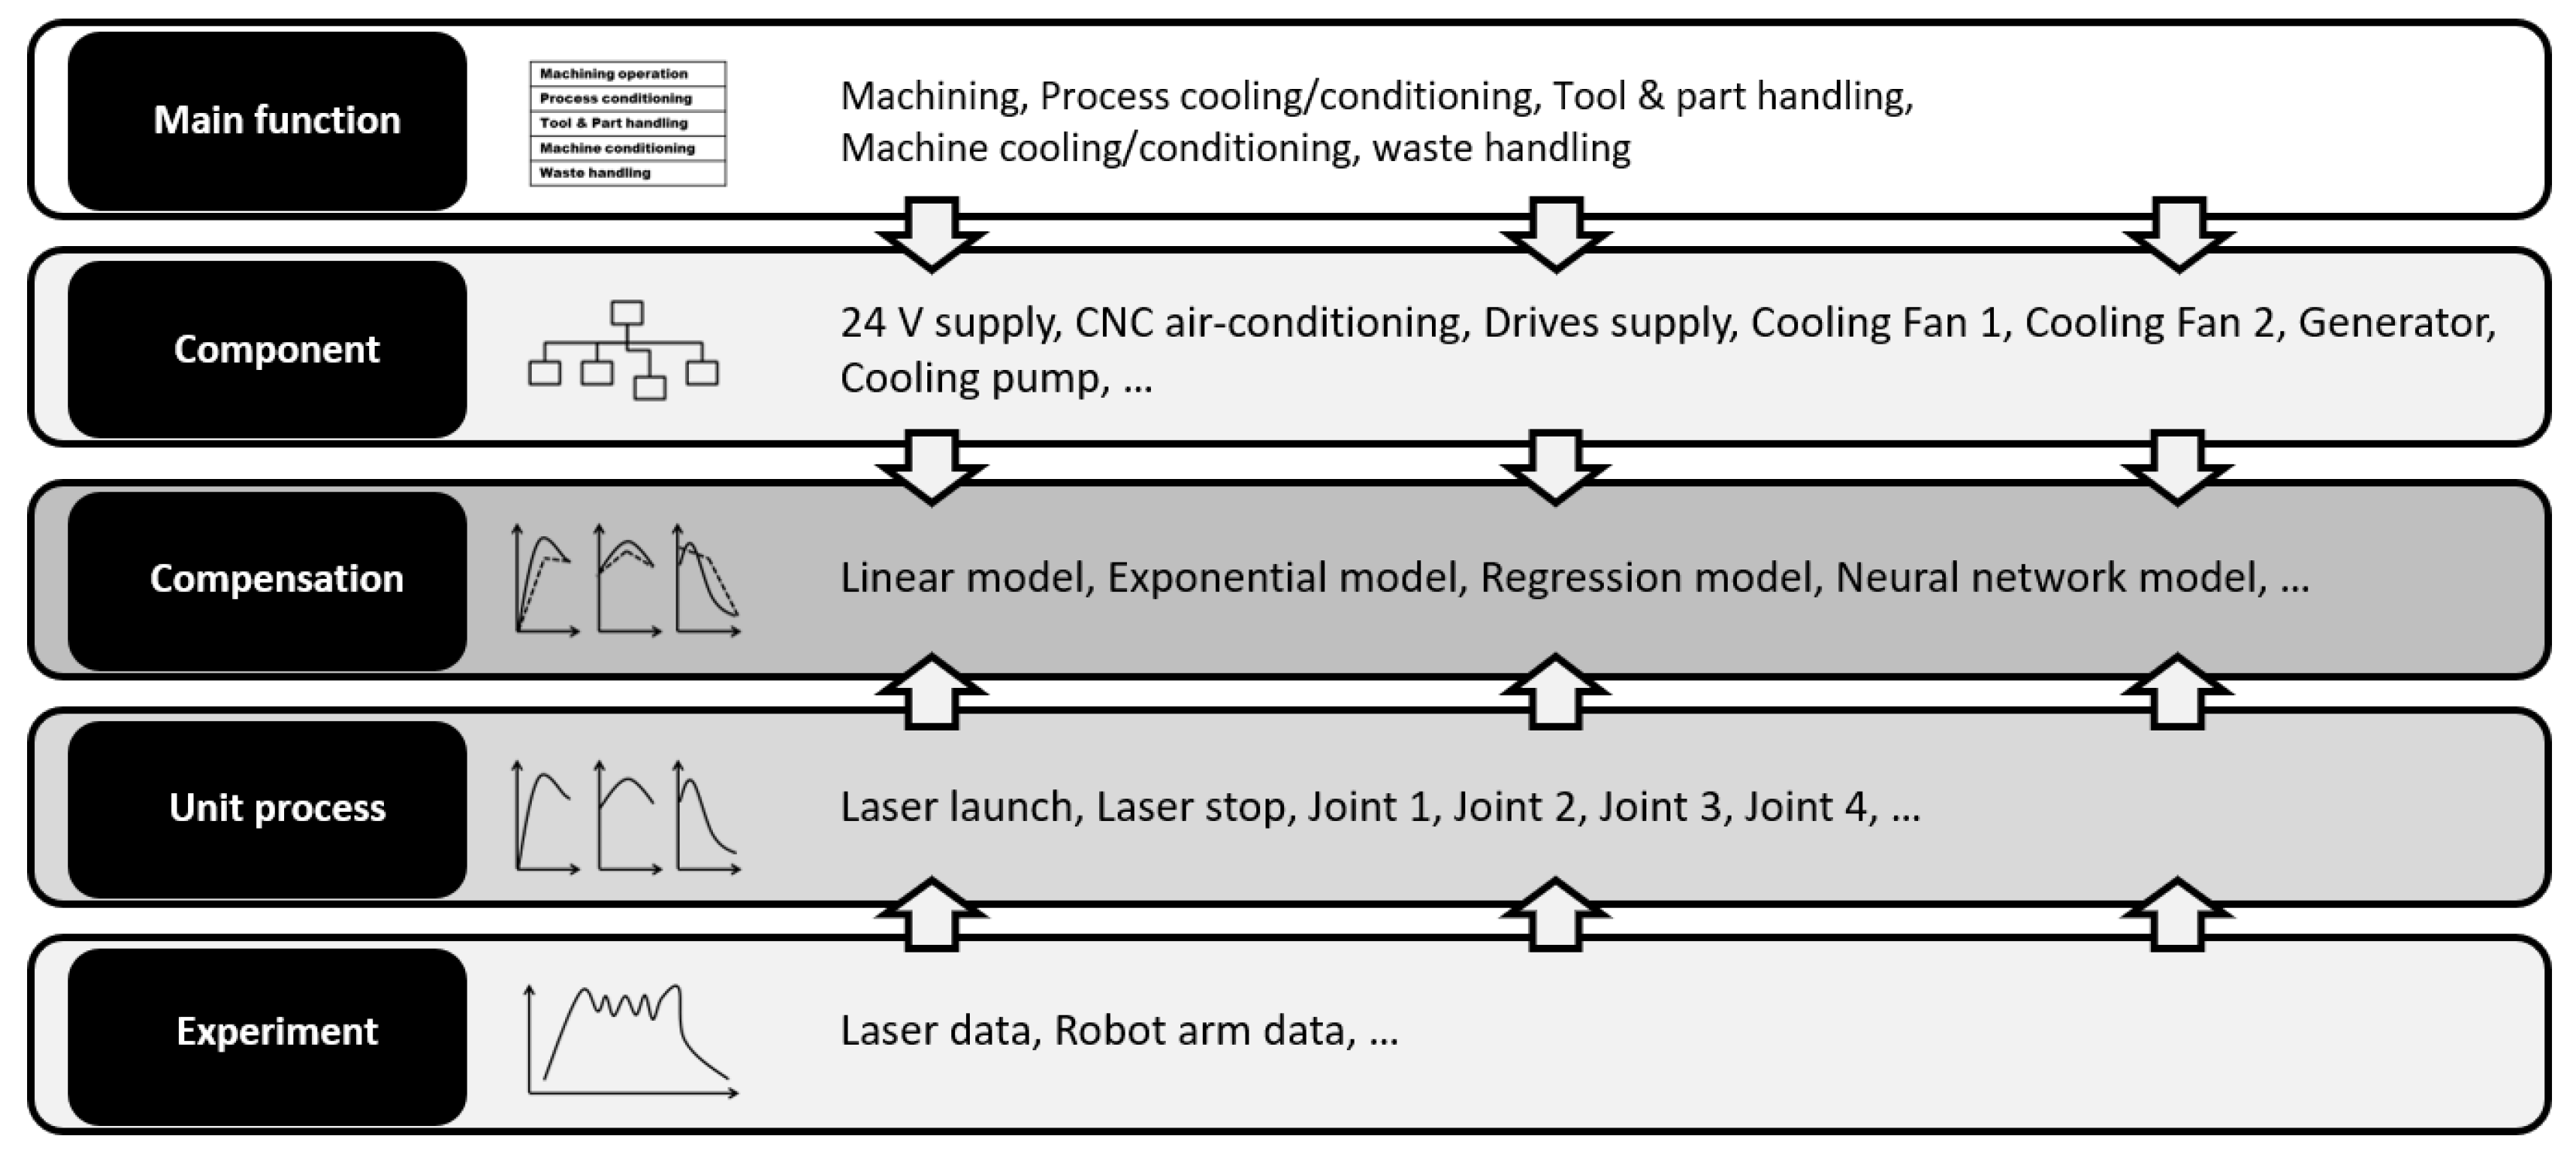
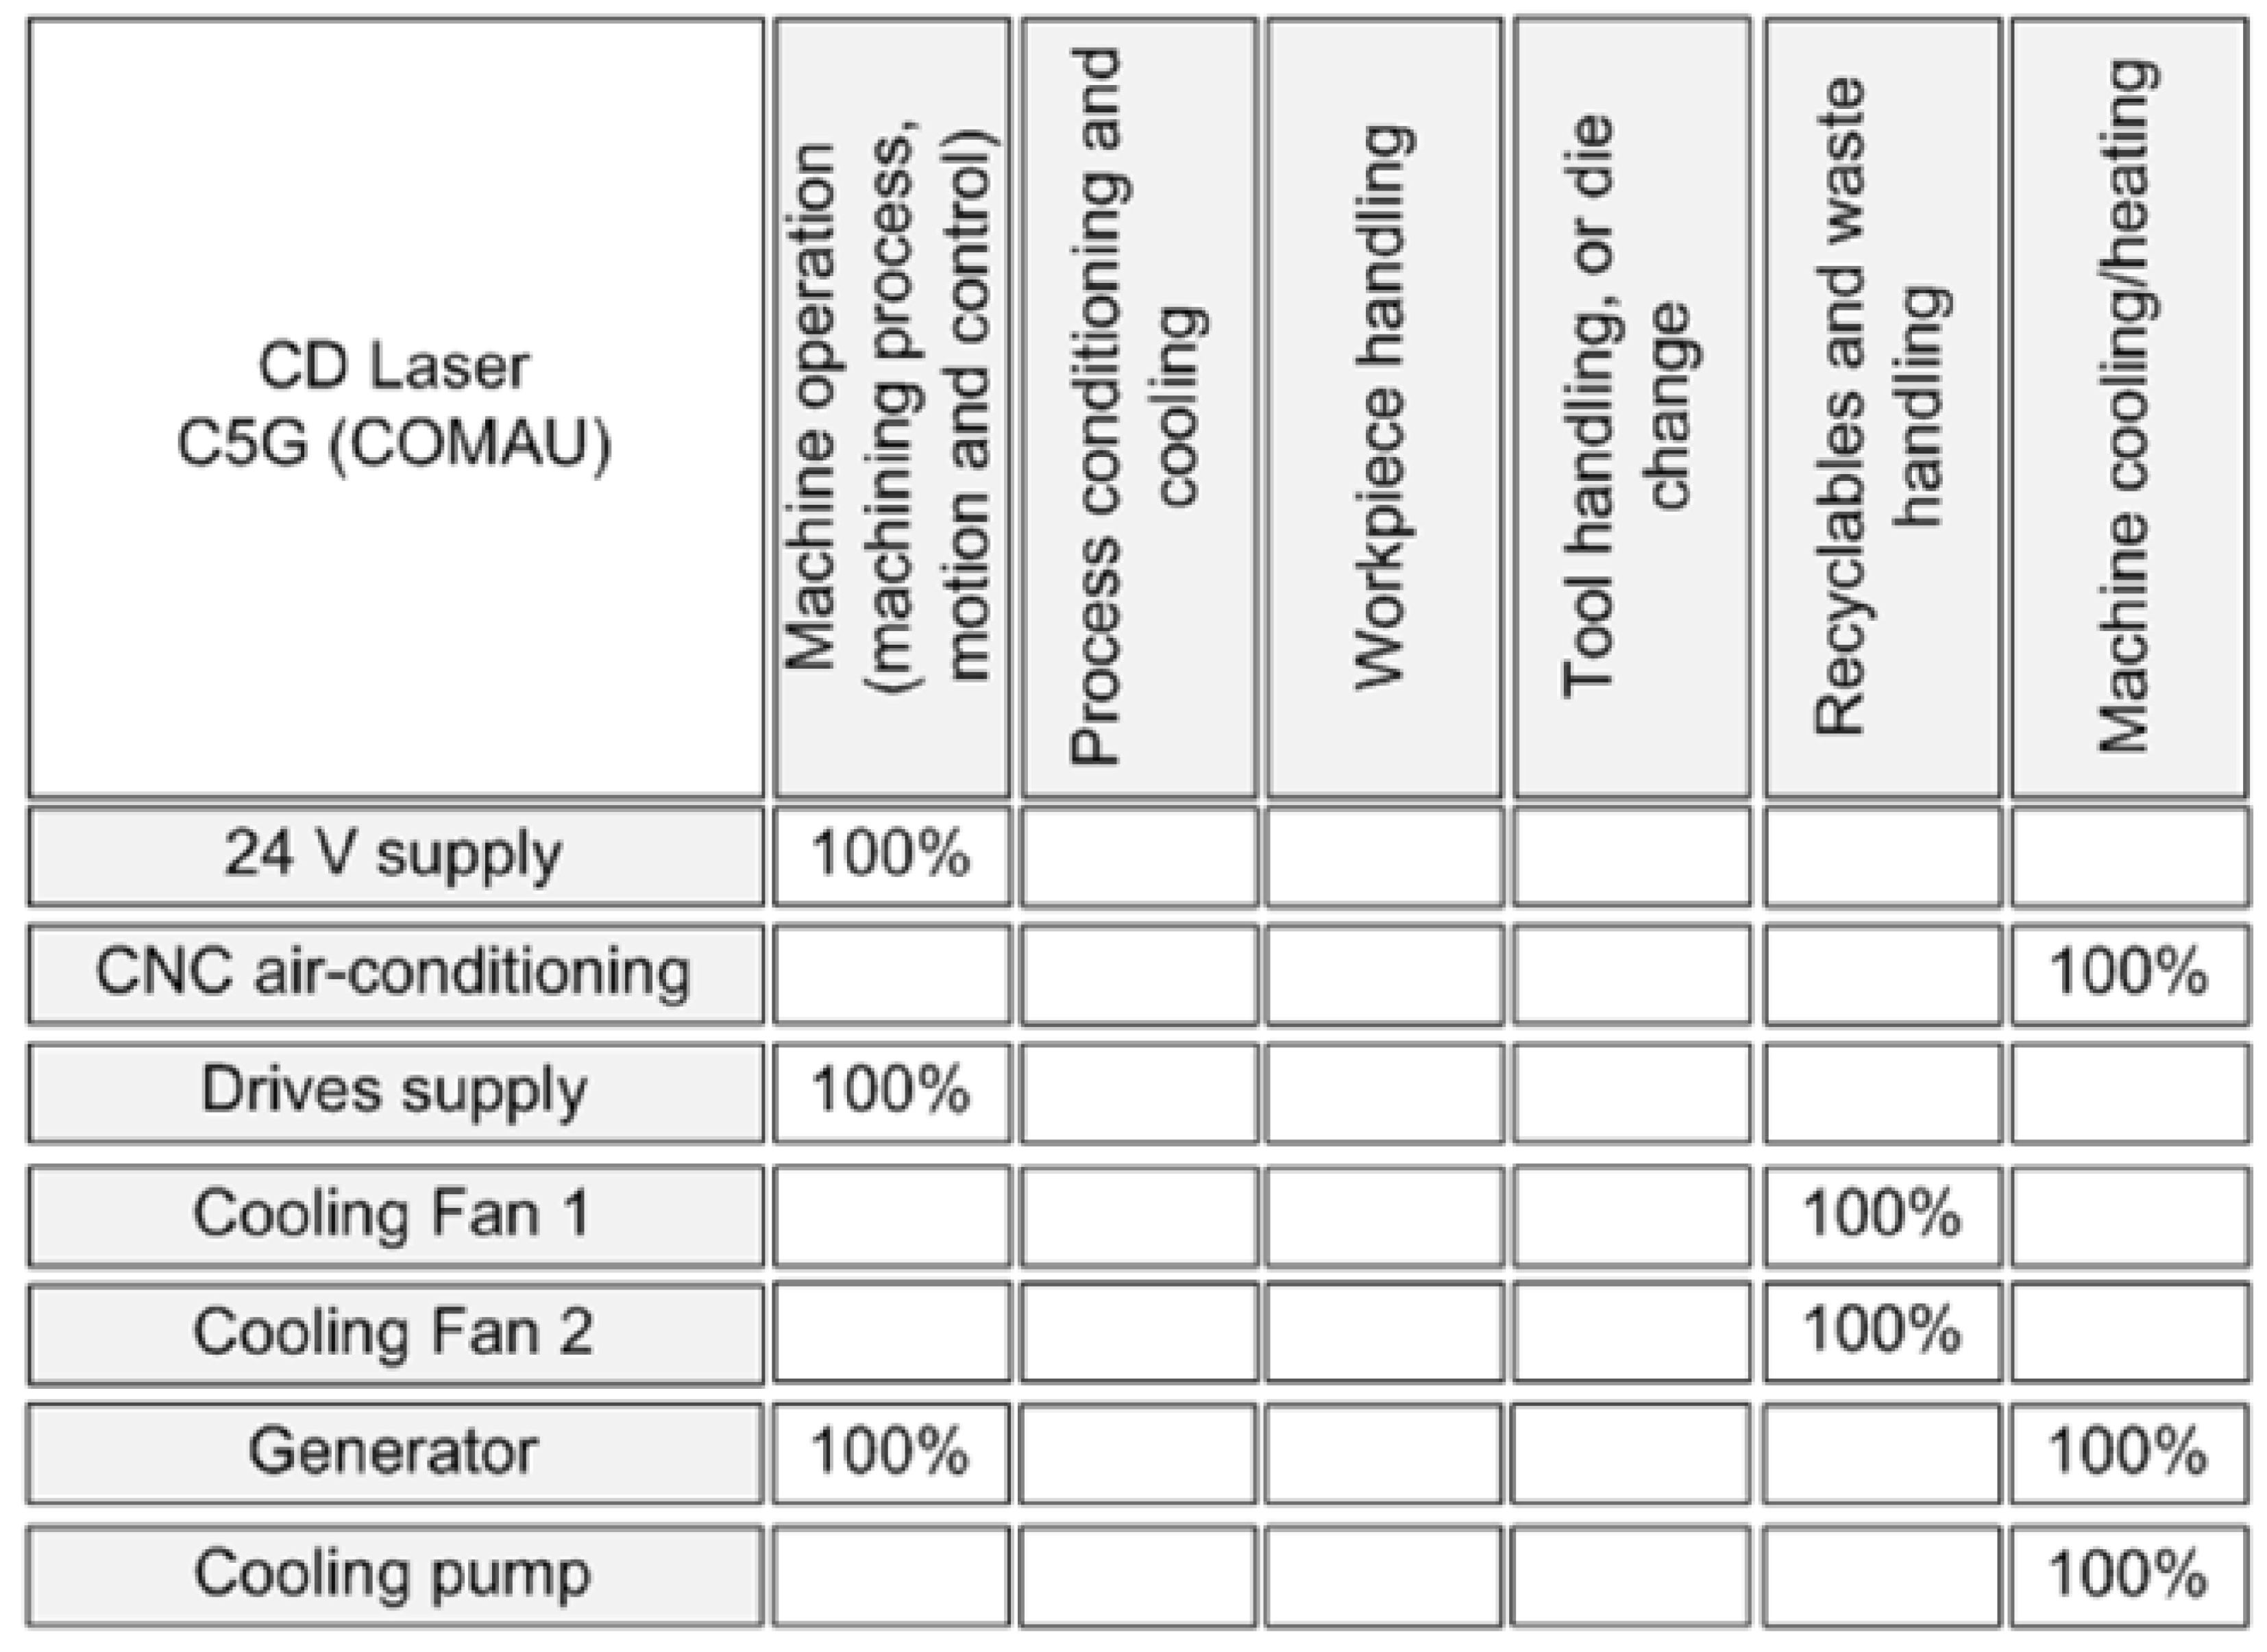
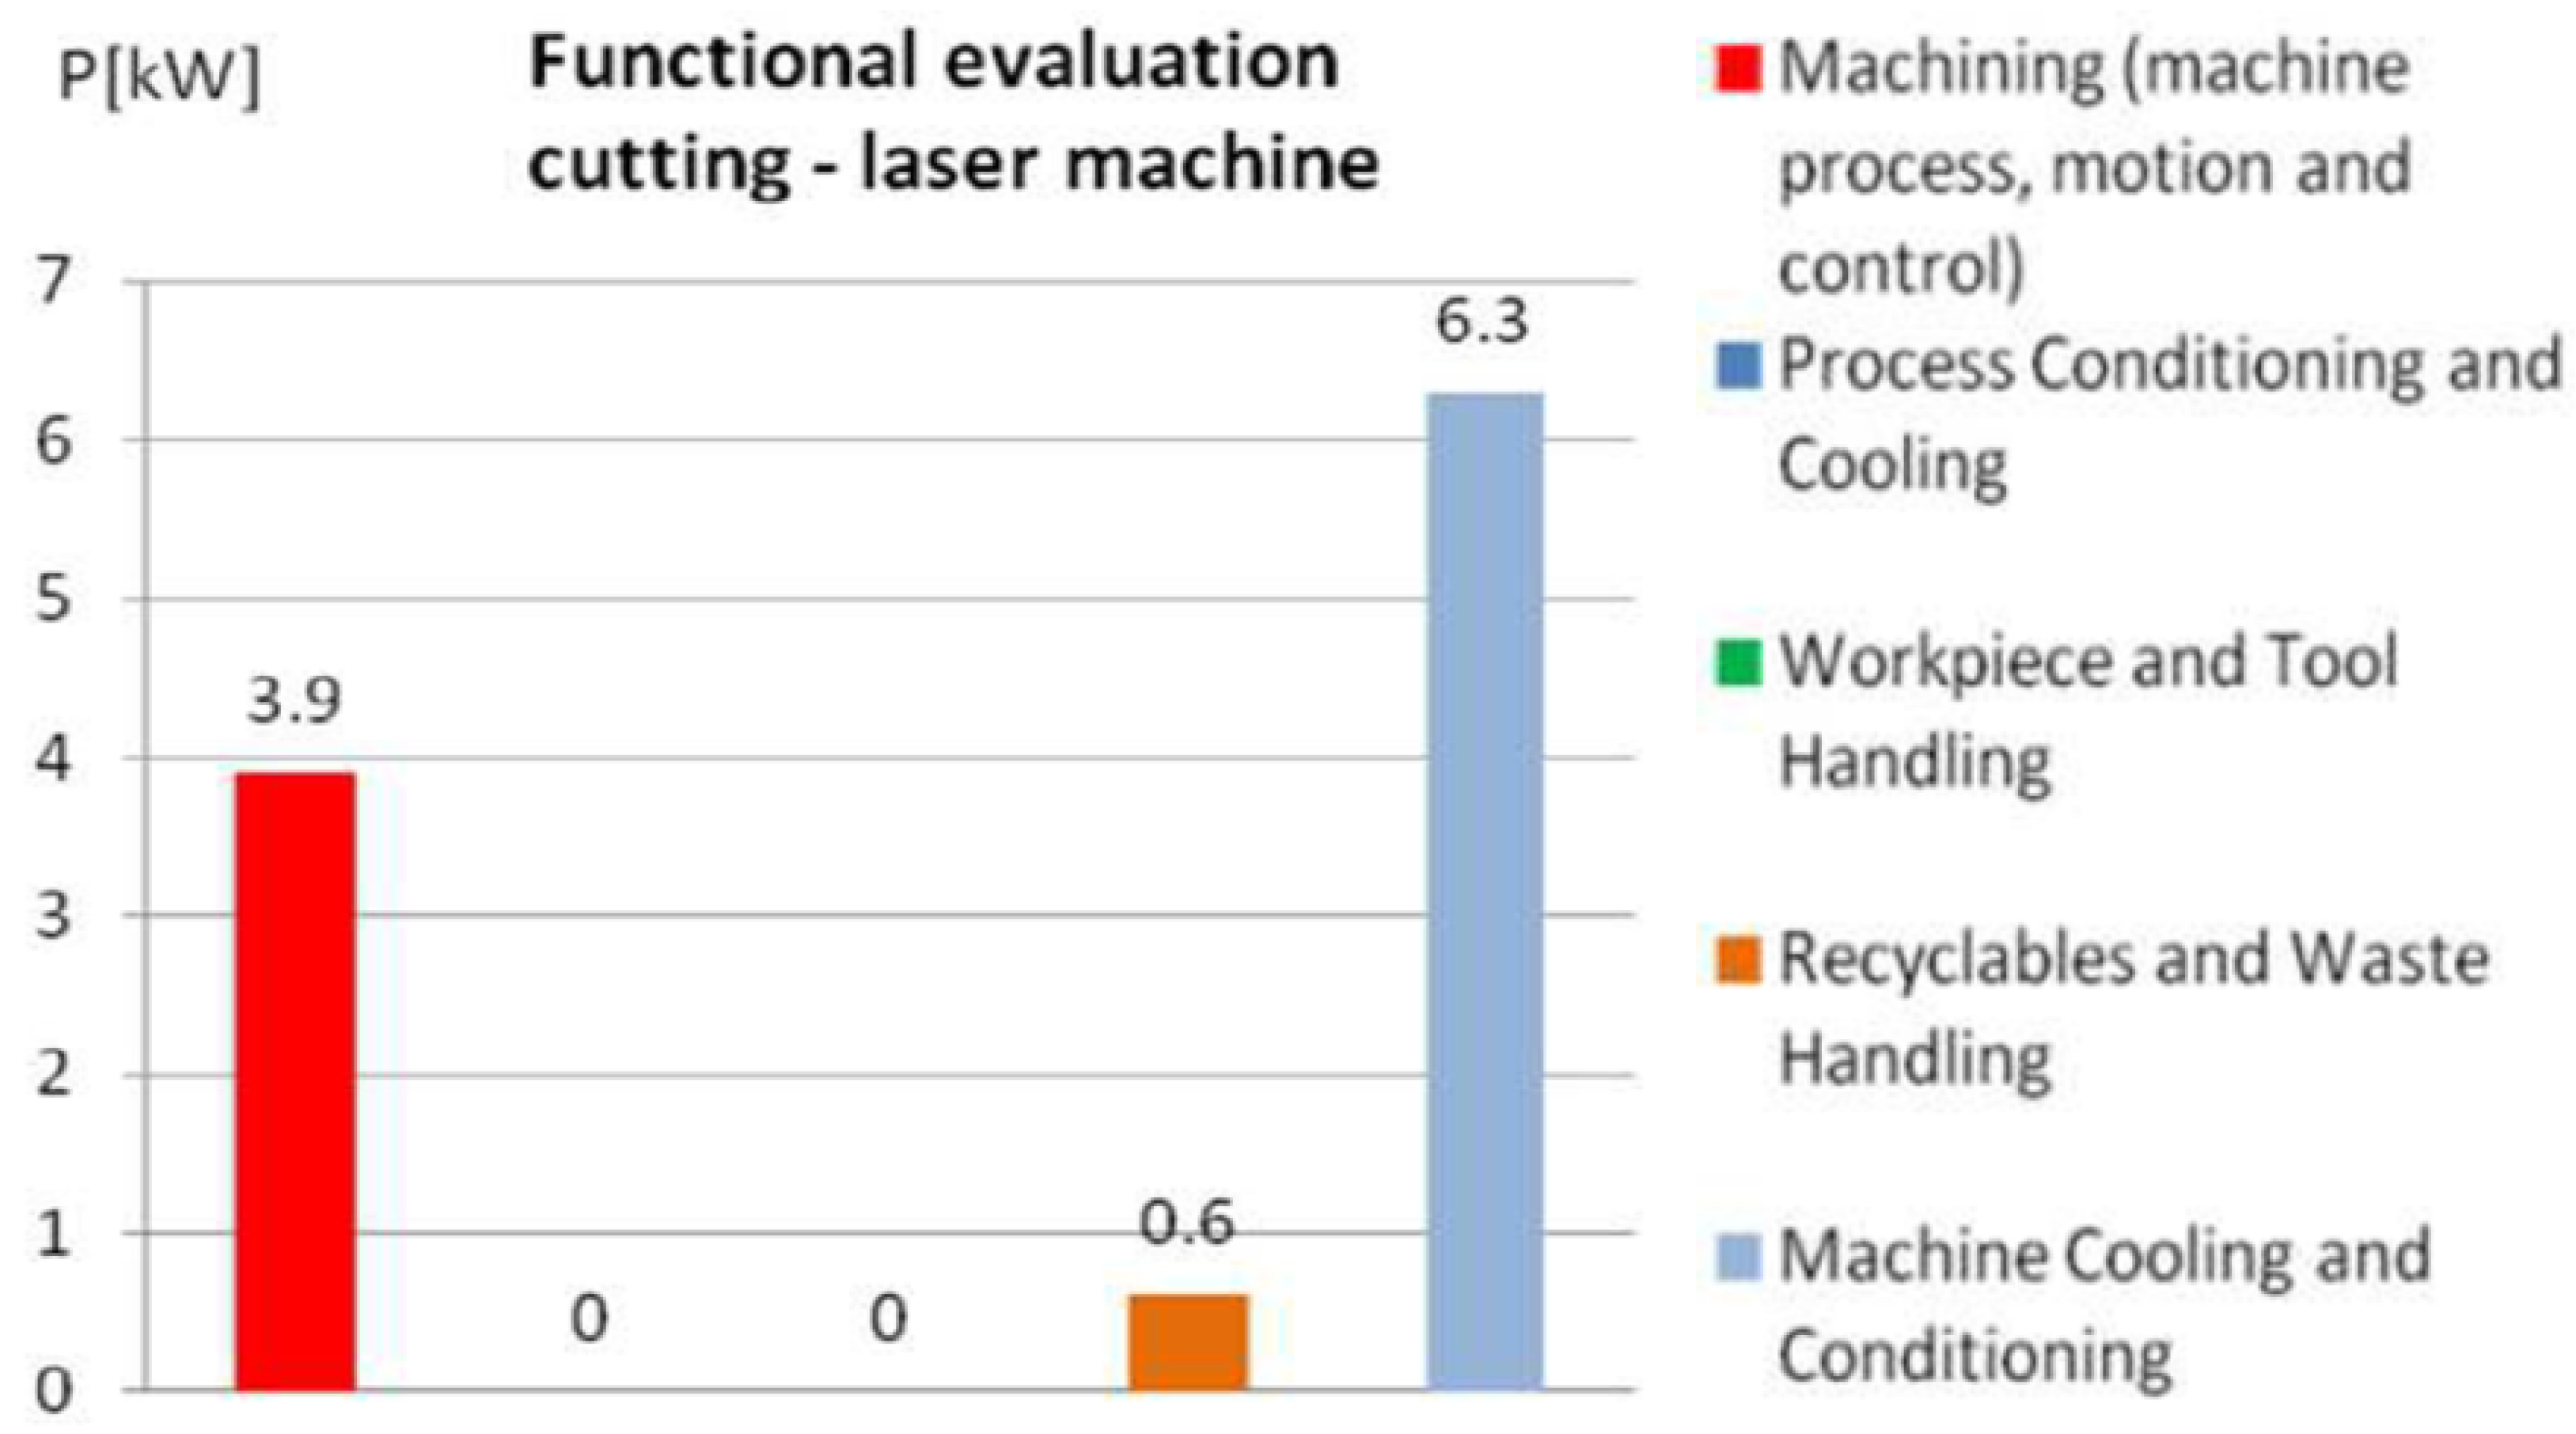
Function level: This approach classifies functions into predefined general parts that consist of machine operation, workpiece manipulation, process conditioning, tool handling and die change, machine cooling and heating, and recyclables and waste handling. In the case of RLW, the machine operation function is laser generation.
Component level: RLW consists of a 24-V power supply, CNC air-conditioning, drive power supply, two cooling fans, a generator, and a cooling pump, which are described in the e-scheme of RLW.
Each component was assigned to predefined functions according to ISO 14955-1 as shown in
Figure 4 and
Figure 5. Representing the connected load of the component, the e-scheme was used for selecting components from the whole machine. The estimation results showed which components were significant energy consumers. The proposed functional analysis was that machining and cooling conditioning were major consumers. Physically, machining functions were conducted by a robot arm and laser generator. For cooling conditioning, the chiller was the major part. The sub-components of major consumers were joint motors, laser diodes, laser disks, and the water compressor. The laser scanner of the robot arm was a relatively minor consumer compared with joint motors.
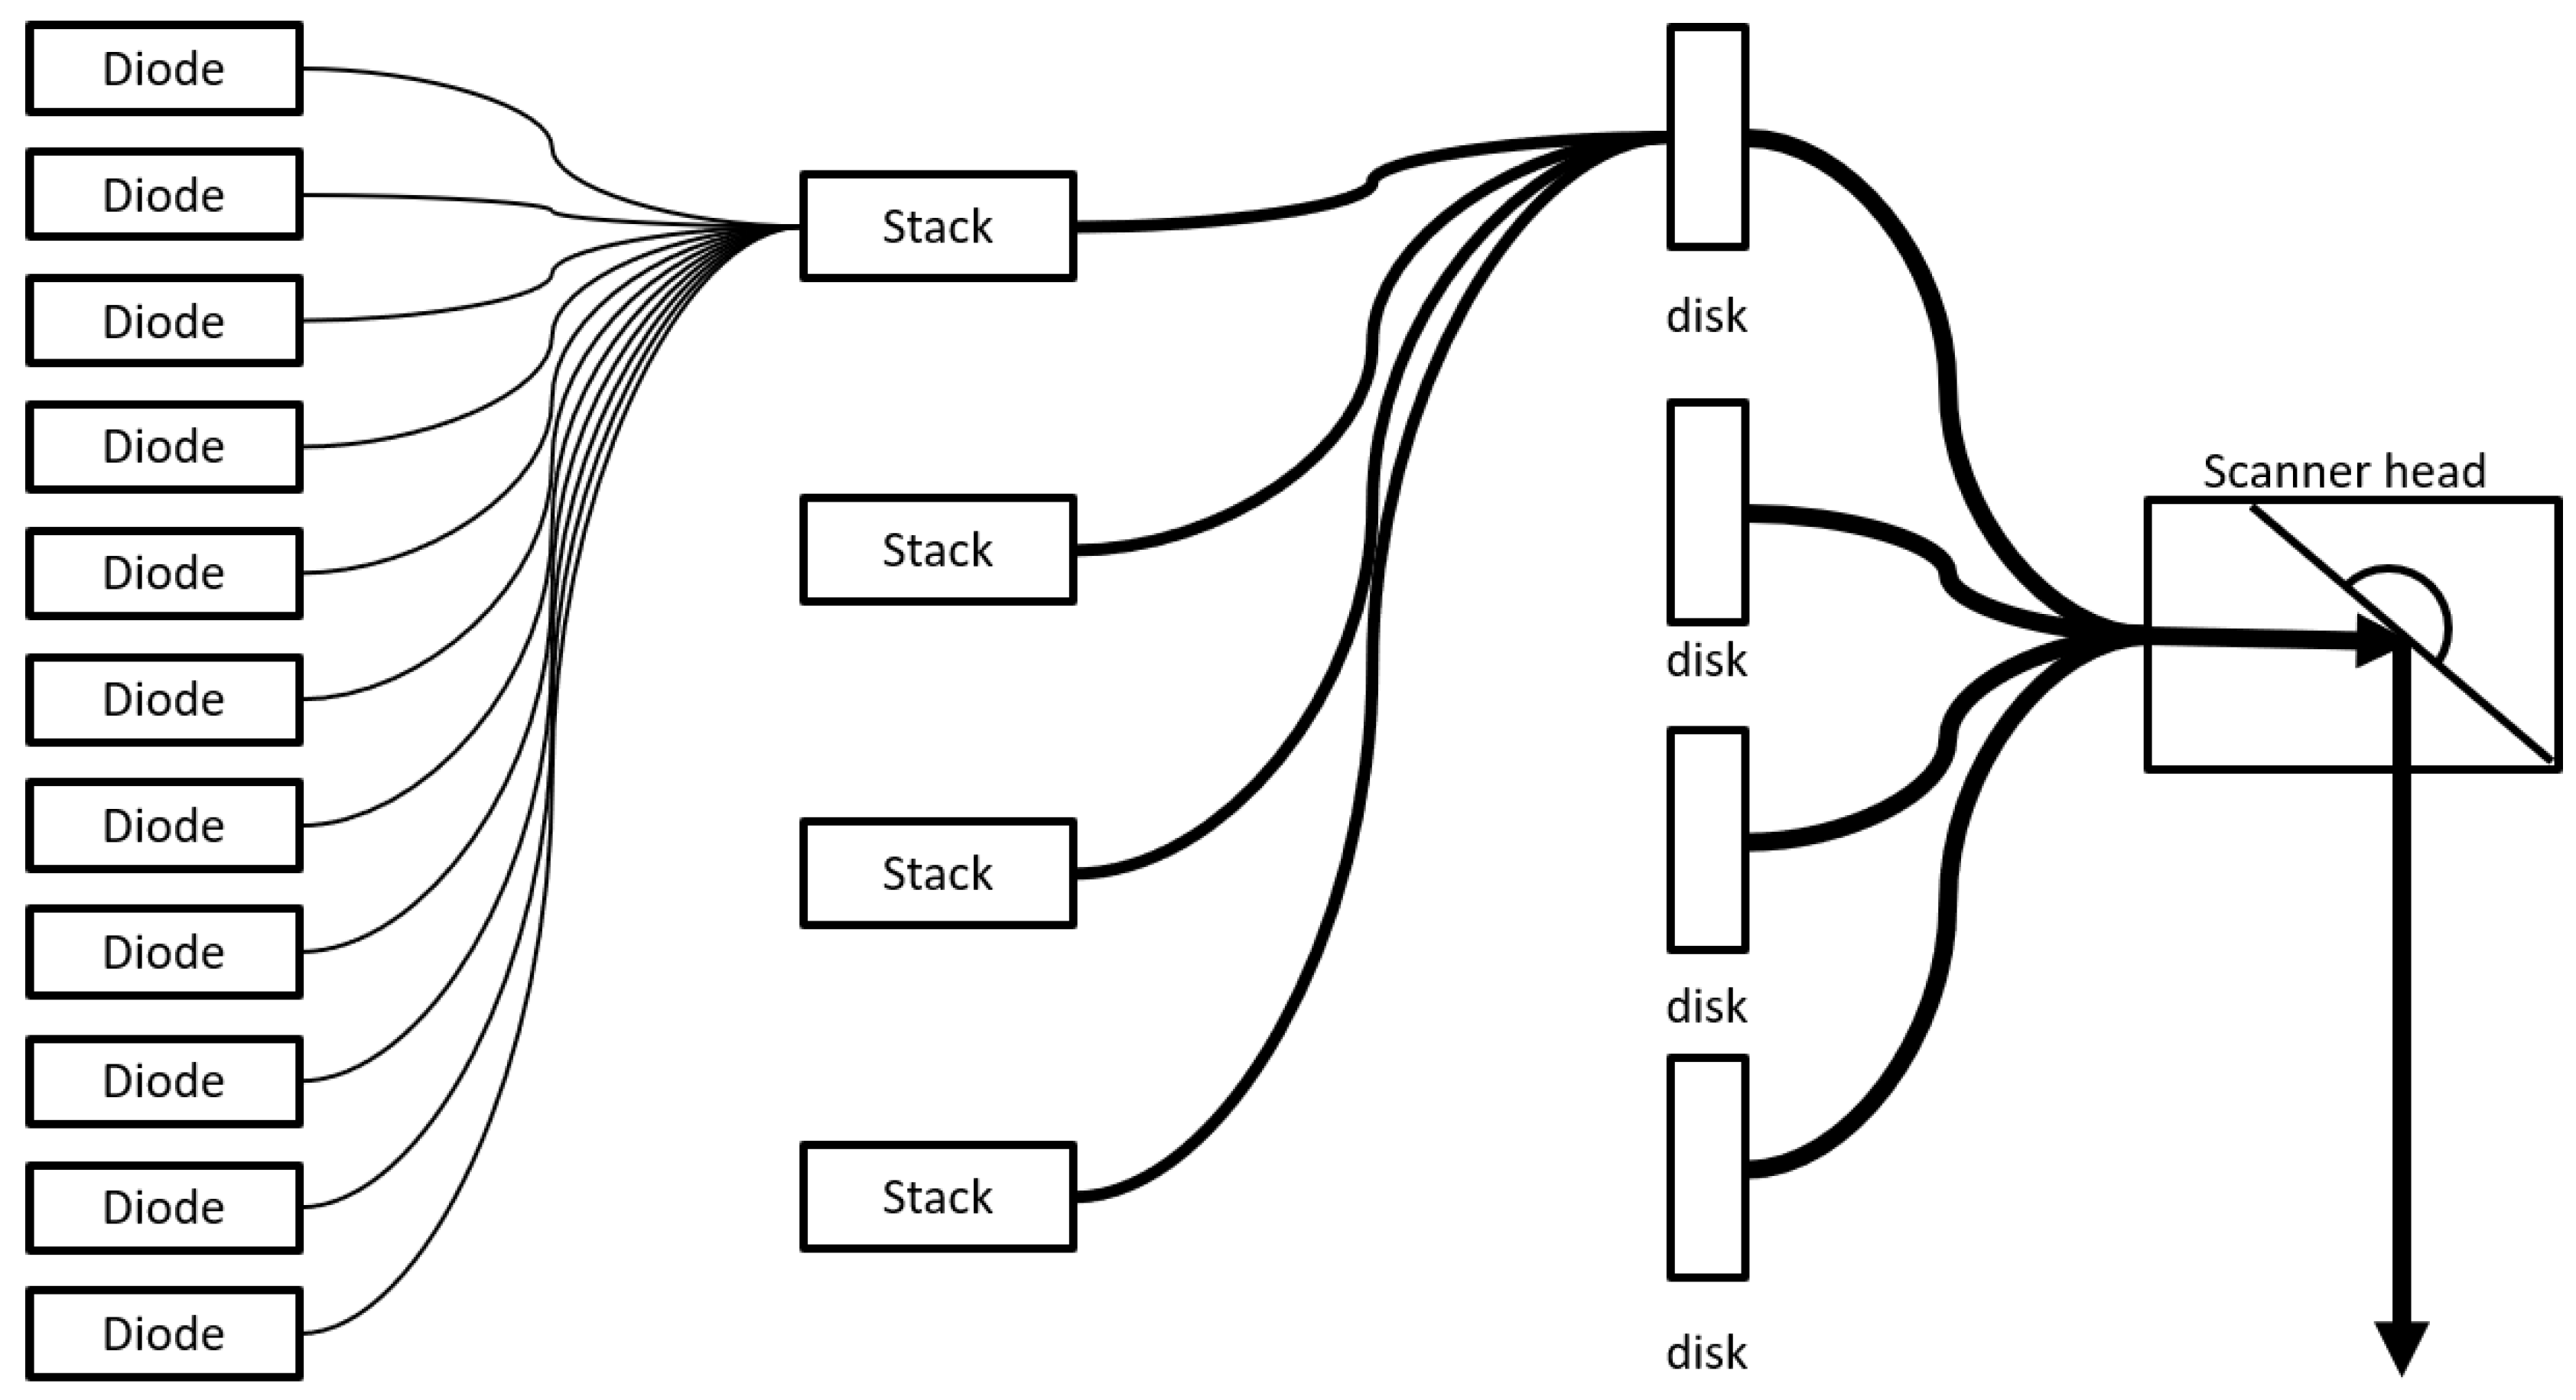
The structure of the laser source influences the energy produced by laser generation. For the case study, a Trumpf TruDisk 4002 was used. This is a high-power laser source concentrating 176 low-power diode laser sources through four disks [
20]. A single stack consisted of 11 diode bars generating 100 W of laser power. Sixteen stacks transferred the laser into 4fourserial disks chilled by the coolants. The overall structure is illustrated in
Figure 6. Each disk was connected with the optical structure to collect small diode laser sources. Collected laser power reached 4 KW and a 1-Mfocal length. This performance enabled welding robots to cover a wide area with only laser scanner movement [
21].
With this performance specification, the proposed energy estimation model was designed with the following assumptions.
Each laser diode was activated when a laser machine was ready to launch. Only optical control, such as mirror blocking, was conducted without deactivating the didoes if the laser was not used.
Otherwise, a laser machine was equipped with a chiller to cool disks by coolant. The chiller consumed more energy if laser disks concentrated more laser power than before. This means that the chiller energy increased if laser output power rose.
3.2.2. Process Approach
The functional approach started from the static characteristics of the welding machine. However, there are various factors that affect energy use, such as the number of stitches, product shape, and type of stitches, which are dynamic characteristics in specific products. The process parameters of the welding machine need to be adjusted according to these factors. The unit process model found the correlation between the energy profile and the process parameters. The objective of the process approach was to make the link between process parameters and variations of unit processes. The process approach consisted of interpreting the controller program as unit processes and of analyzing the impact of process parameters on energy profiles of unit processes.
Parameters of unit processes: As discussed previously, process-oriented approaches are improved by using unit block models and their experimental data. The behavior of the laser machine was composed of ready state, first laser launch, and continuous laser launch and cooling. Laser output power was the parameter to be considered in energy estimation.
Experimental data of each process: The part program was converted into a sequence of unit processes. To estimate the energy consumption, each unit process was mapped to the experimental data of the energy profile.
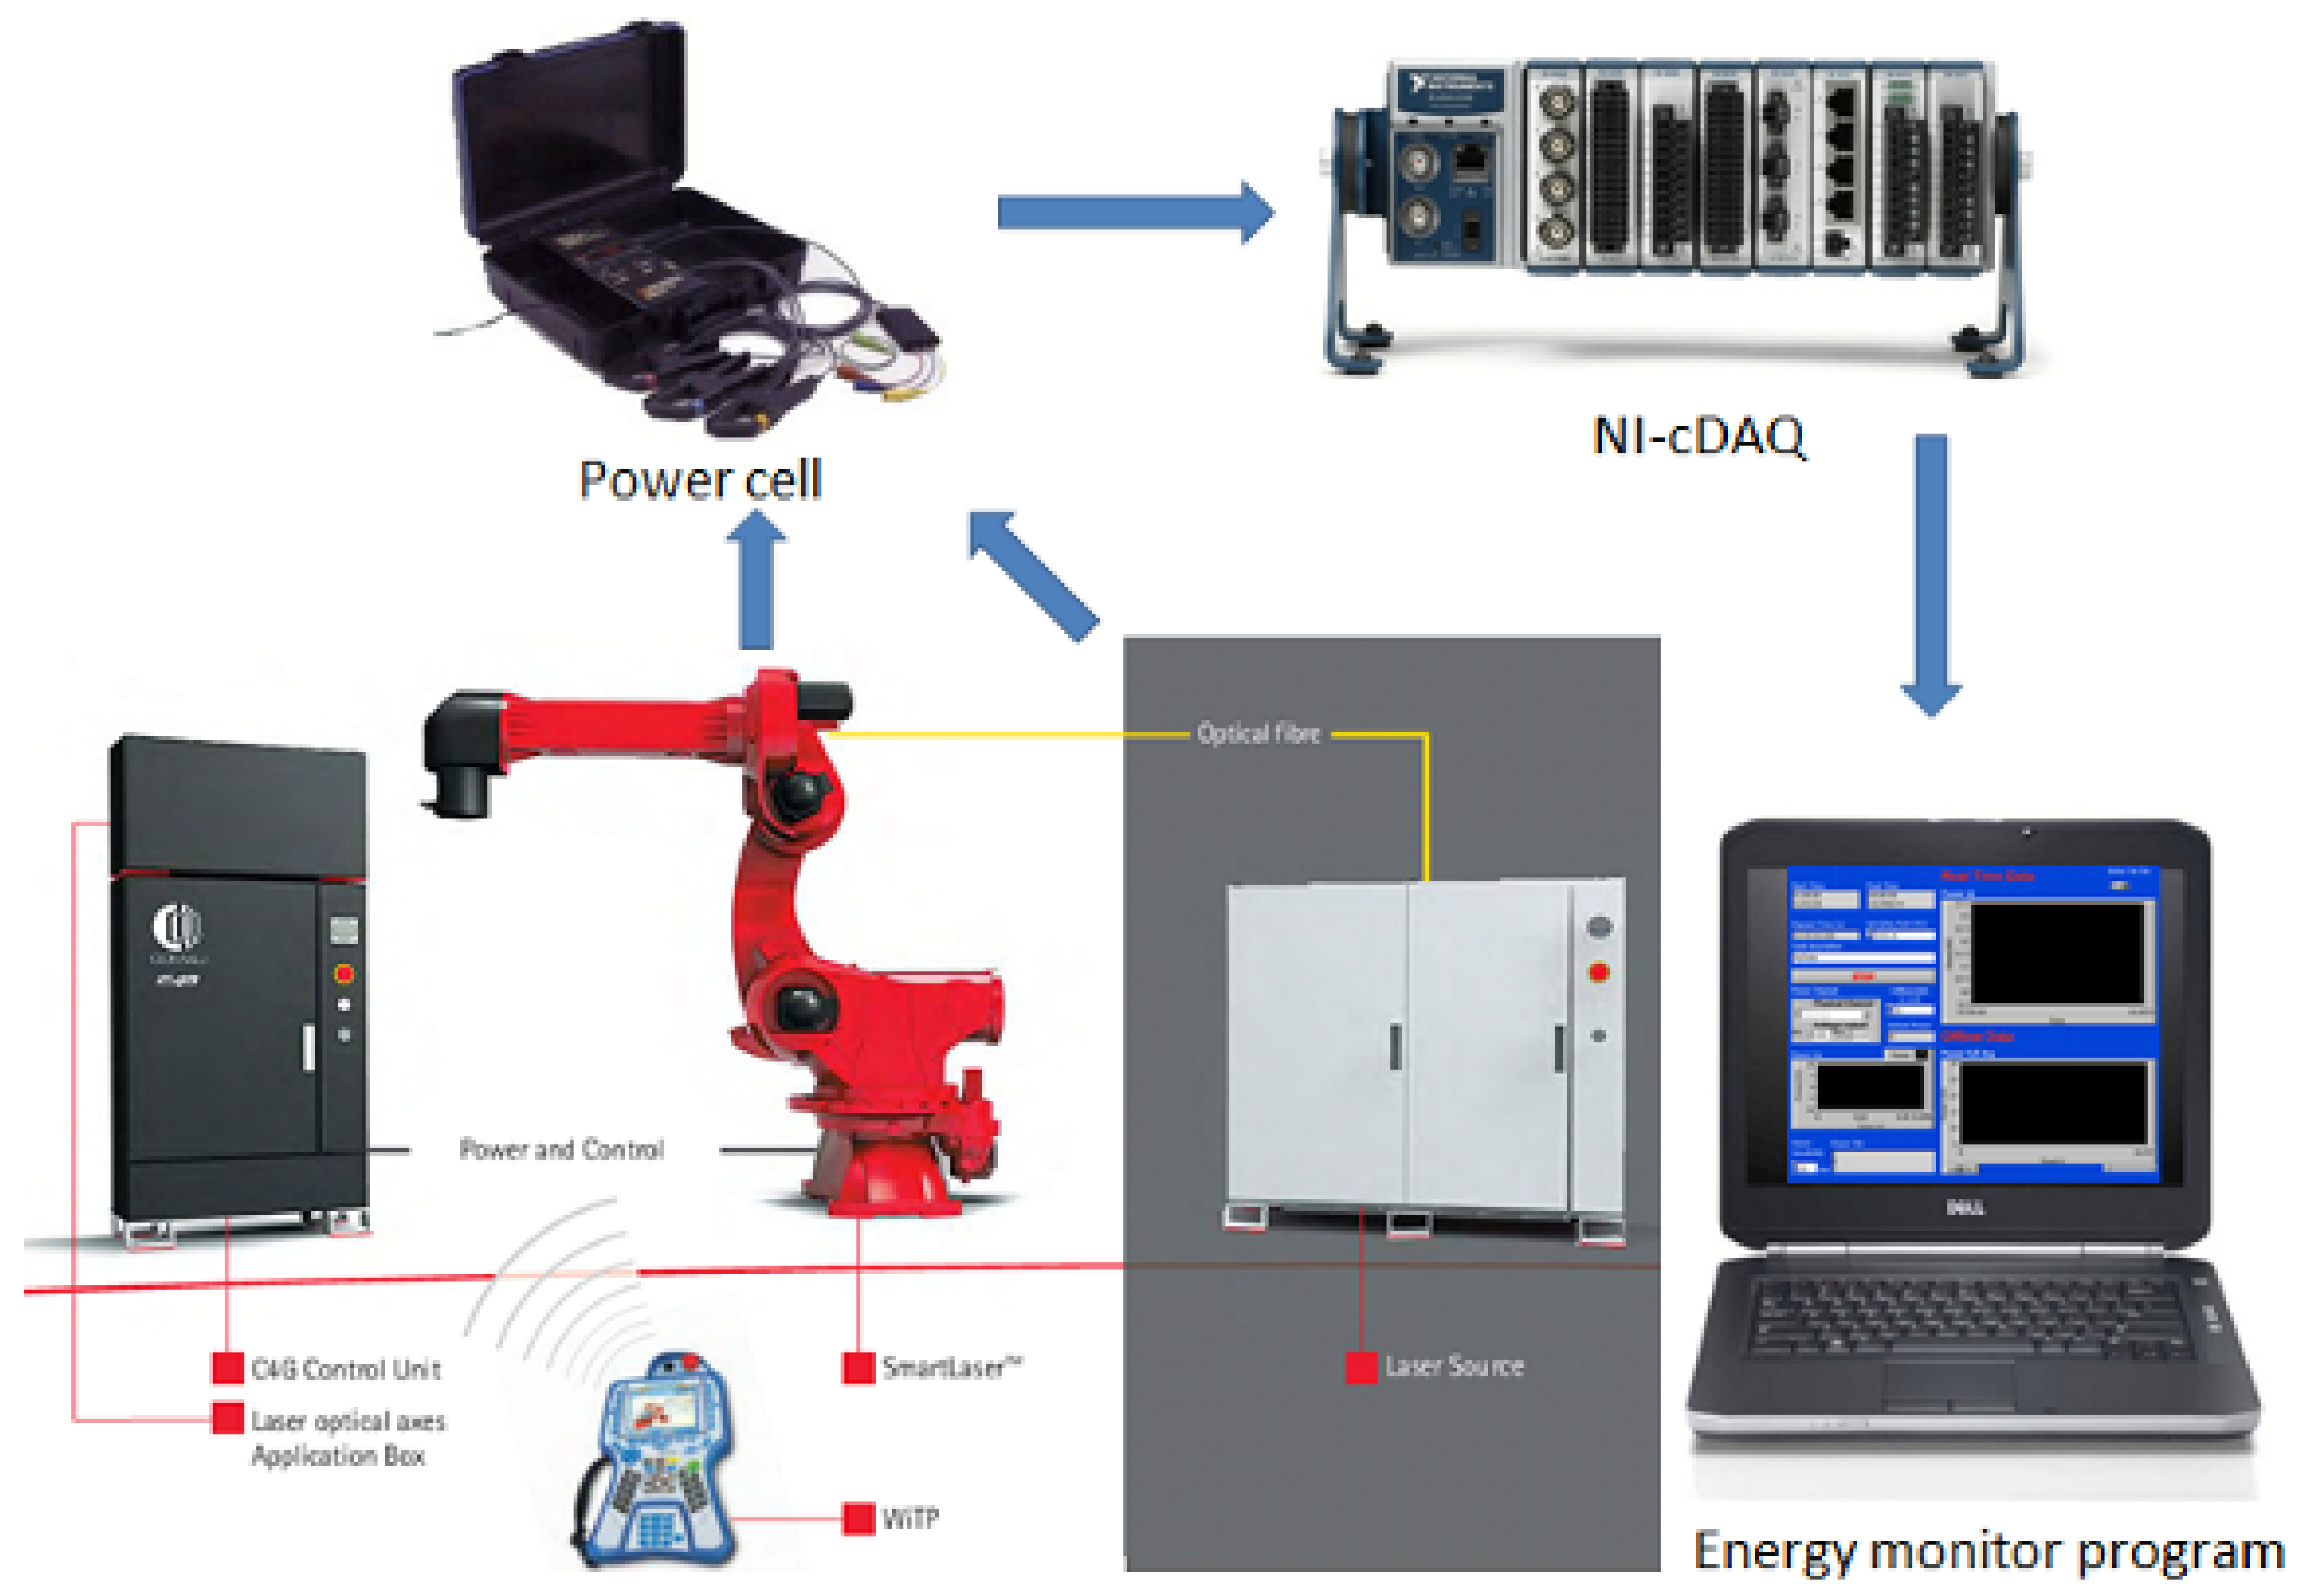
For this reason, compensation was necessary for filling the gap between theory and reality. For the experiments, the LabView data acquisition module from the energy meter was implemented. Preliminary experimental planning involved determining a set of sample geometries and welding conditions that could be measured to provide an initial database.
Figure 7 shows the setup of the measurement device.
Collection of compensation data involved integrating an energy measurement system with the welding equipment. The system included a power cell, a data acquisition device, and an energy monitoring program. The power cell was connected with the power supply of the robot controller and the laser machine to measure the current and voltage used. The calculated power was transferred to the data acquisition device, which converted the power signal into digital values sampled at a rate of 5000 Hz. The energy monitoring program stored the resulting energy profile with a time series dataset.
3.2.3. Compensation by Machine Learning Model
Theoretical estimation is not enough to represent sensitive changes in energy profiles. A compensation step used experimental data from unit processes stored in a database. Each set of experimental data was sorted by energy profile and process parameters. The database scheme represented the relationship with component specifications and input parameters. This section investigates the various methods to draw the estimated profile. Linear regression and deep neural networks were used for developing the estimation model with the feature engineering reflecting the machine configuration of RLW.
Profile Generation Algorithm
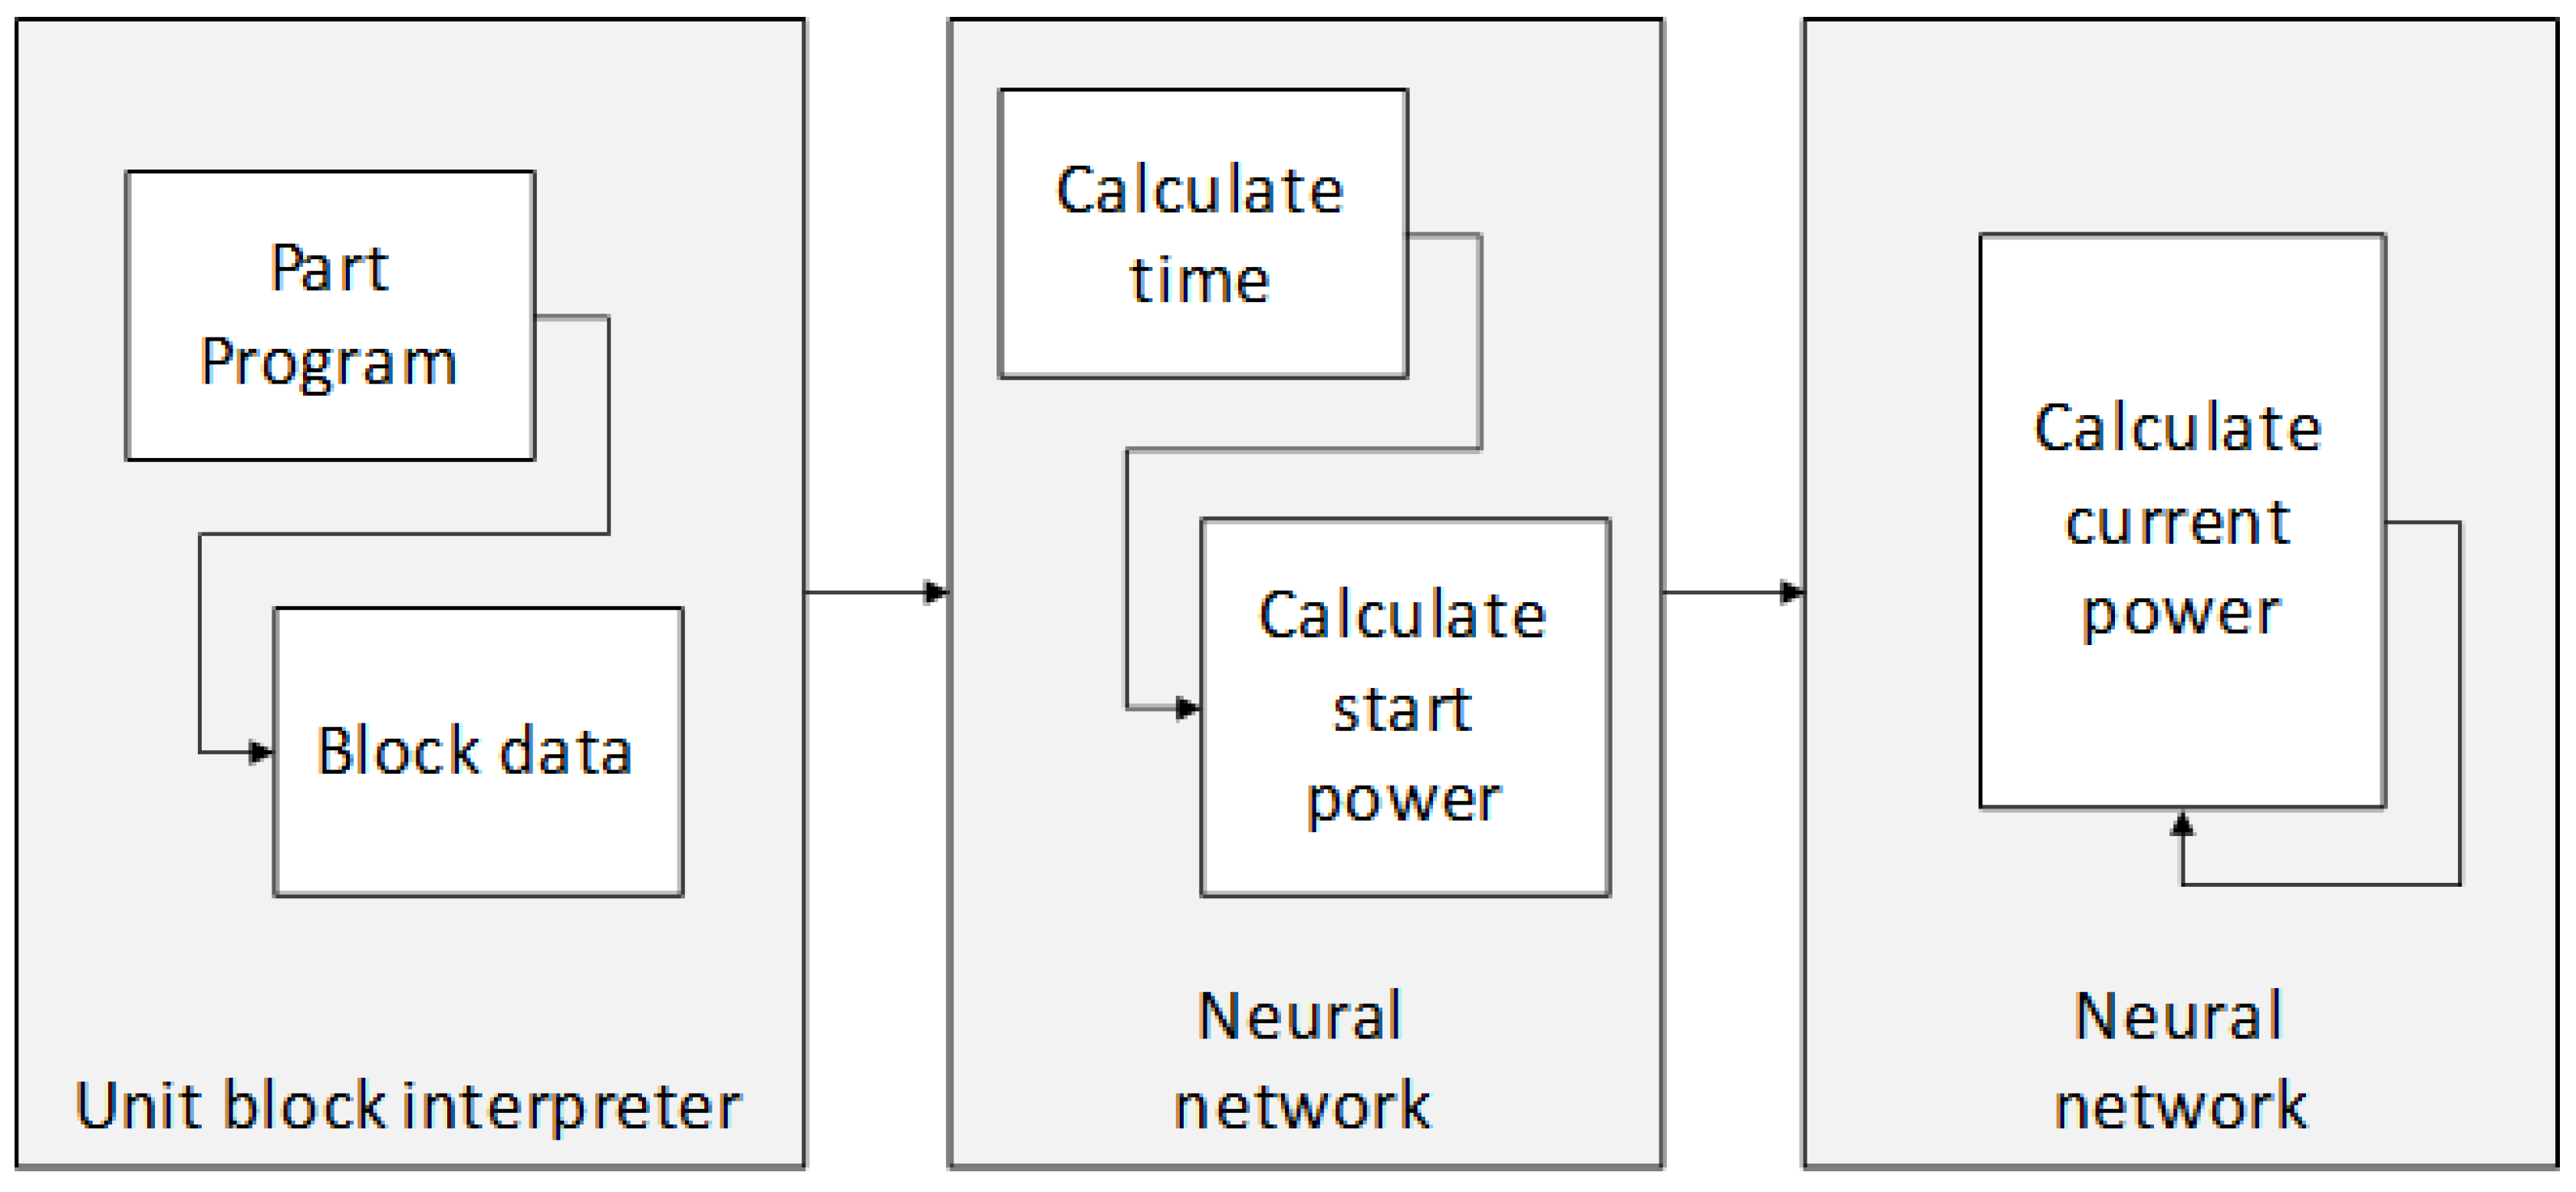
First of all, feature generation and model development were carried out in this layer, as shown in
Figure 8. Process data and measured data were combined into single tables along a time-series. Measured data were counted at 5000 Hz and converted into second units. This was necessary for calculating the duration time of each command execution.
Feature Engineering
Feature engineering is a means for utilizing the process parameters so as to estimate the detail of the energy profile by overcoming the limitation of localization. In the case of RLW, the given parameters were smaller than for the other cases of big data problems. It is necessary to focus on the specific data and find the important relationships. As mentioned in the analysis of the electric connection, cooling and generation of the laser were the major components. Laser generation showed rapid jumps in energy consumption. Cooling followed the motor behaviors to reduce the temperature of disks and diodes. The key features of laser energy consumption were the current status of the laser machine and laser control data. In order to build a common model of laser cooling, the details of the cooling system were included in the formulation. For this reason, the model followed the assumption that the electrical energy of the motor had a positive correlation with the current status of the laser machine. The given data had the current power as the current status.
As discussed in the paper by Zhou et al. [
3], the localization of the deep learning model is a limitation even though its accuracy is high. The derivation of key features is needed to overcome the localized learning. The authors of this paper proposed that the following features be used as the means to train the neural network with the characteristics of laser welding: (1) mode is the feature to separate each operation of the laser controller or status of the laser machine; (2) starting time and (3) starting power: starting time and power are the factors influencing the current power by each initial status of laser launch.
Generally, a time-series dataset is applied to neural networks because of the correlation between current status and previous status. The energy profile of laser welding has fluctuations at the microscopic level from 2500 Hz–5000 Hz. This feature easily causes an over-fitting problem of the neural network. The collected data included the laser controller program. By using the controller program, the fluctuation was reduced. The procedure of feature engineering consisted of smoothing, peak detection, and synchronizing with the controller program.
The Savitzky–Golay filter was used as the smoothing filter. The filter windows were estimated by the welding time derived from the controller program. For example, the window was set as 500 Hz if each welding process time was 0.1 s. This number was the half of each peak profile. The welding energy profile followed the fourth polynomial. This was determined by the analysis of experimental data.
Figure 9 shows raw data and the smoothing result.
The filtered data were applied to the peak detection algorithm, which utilized continuous wavelet transform-based pattern matching to find the highest point in each welding process. The algorithm was described by Pan et al. [
22] with detail. Low peaks were collected in
, while high peaks were stored in
. The measured power data were represented in
. Mode 1 used process time
and starting power
of each welding profile as the input of neural network. Mode 2 divided each welding profile into welding status and cooling status. Welding mode and cooling mode are defined in the following equation.
The next section describes the proposed estimation methods of energy consumption and the calculation of the energy efficiency of RLW.
Linear Regression
The first estimation model was linear regression using the modes of laser launching and cooling defined in the feature engineering section. The energy profile consisted of a series of curves. Therefore, the regression model was applied to find coefficients in order to generalize the experimental data. After trying a linear model, exponential model, and power model, the highest accuracy model was utilized as the estimation model. Each piece of the estimated profile was merged into a single profile to show the overall energy consumption.
Neural Network Model
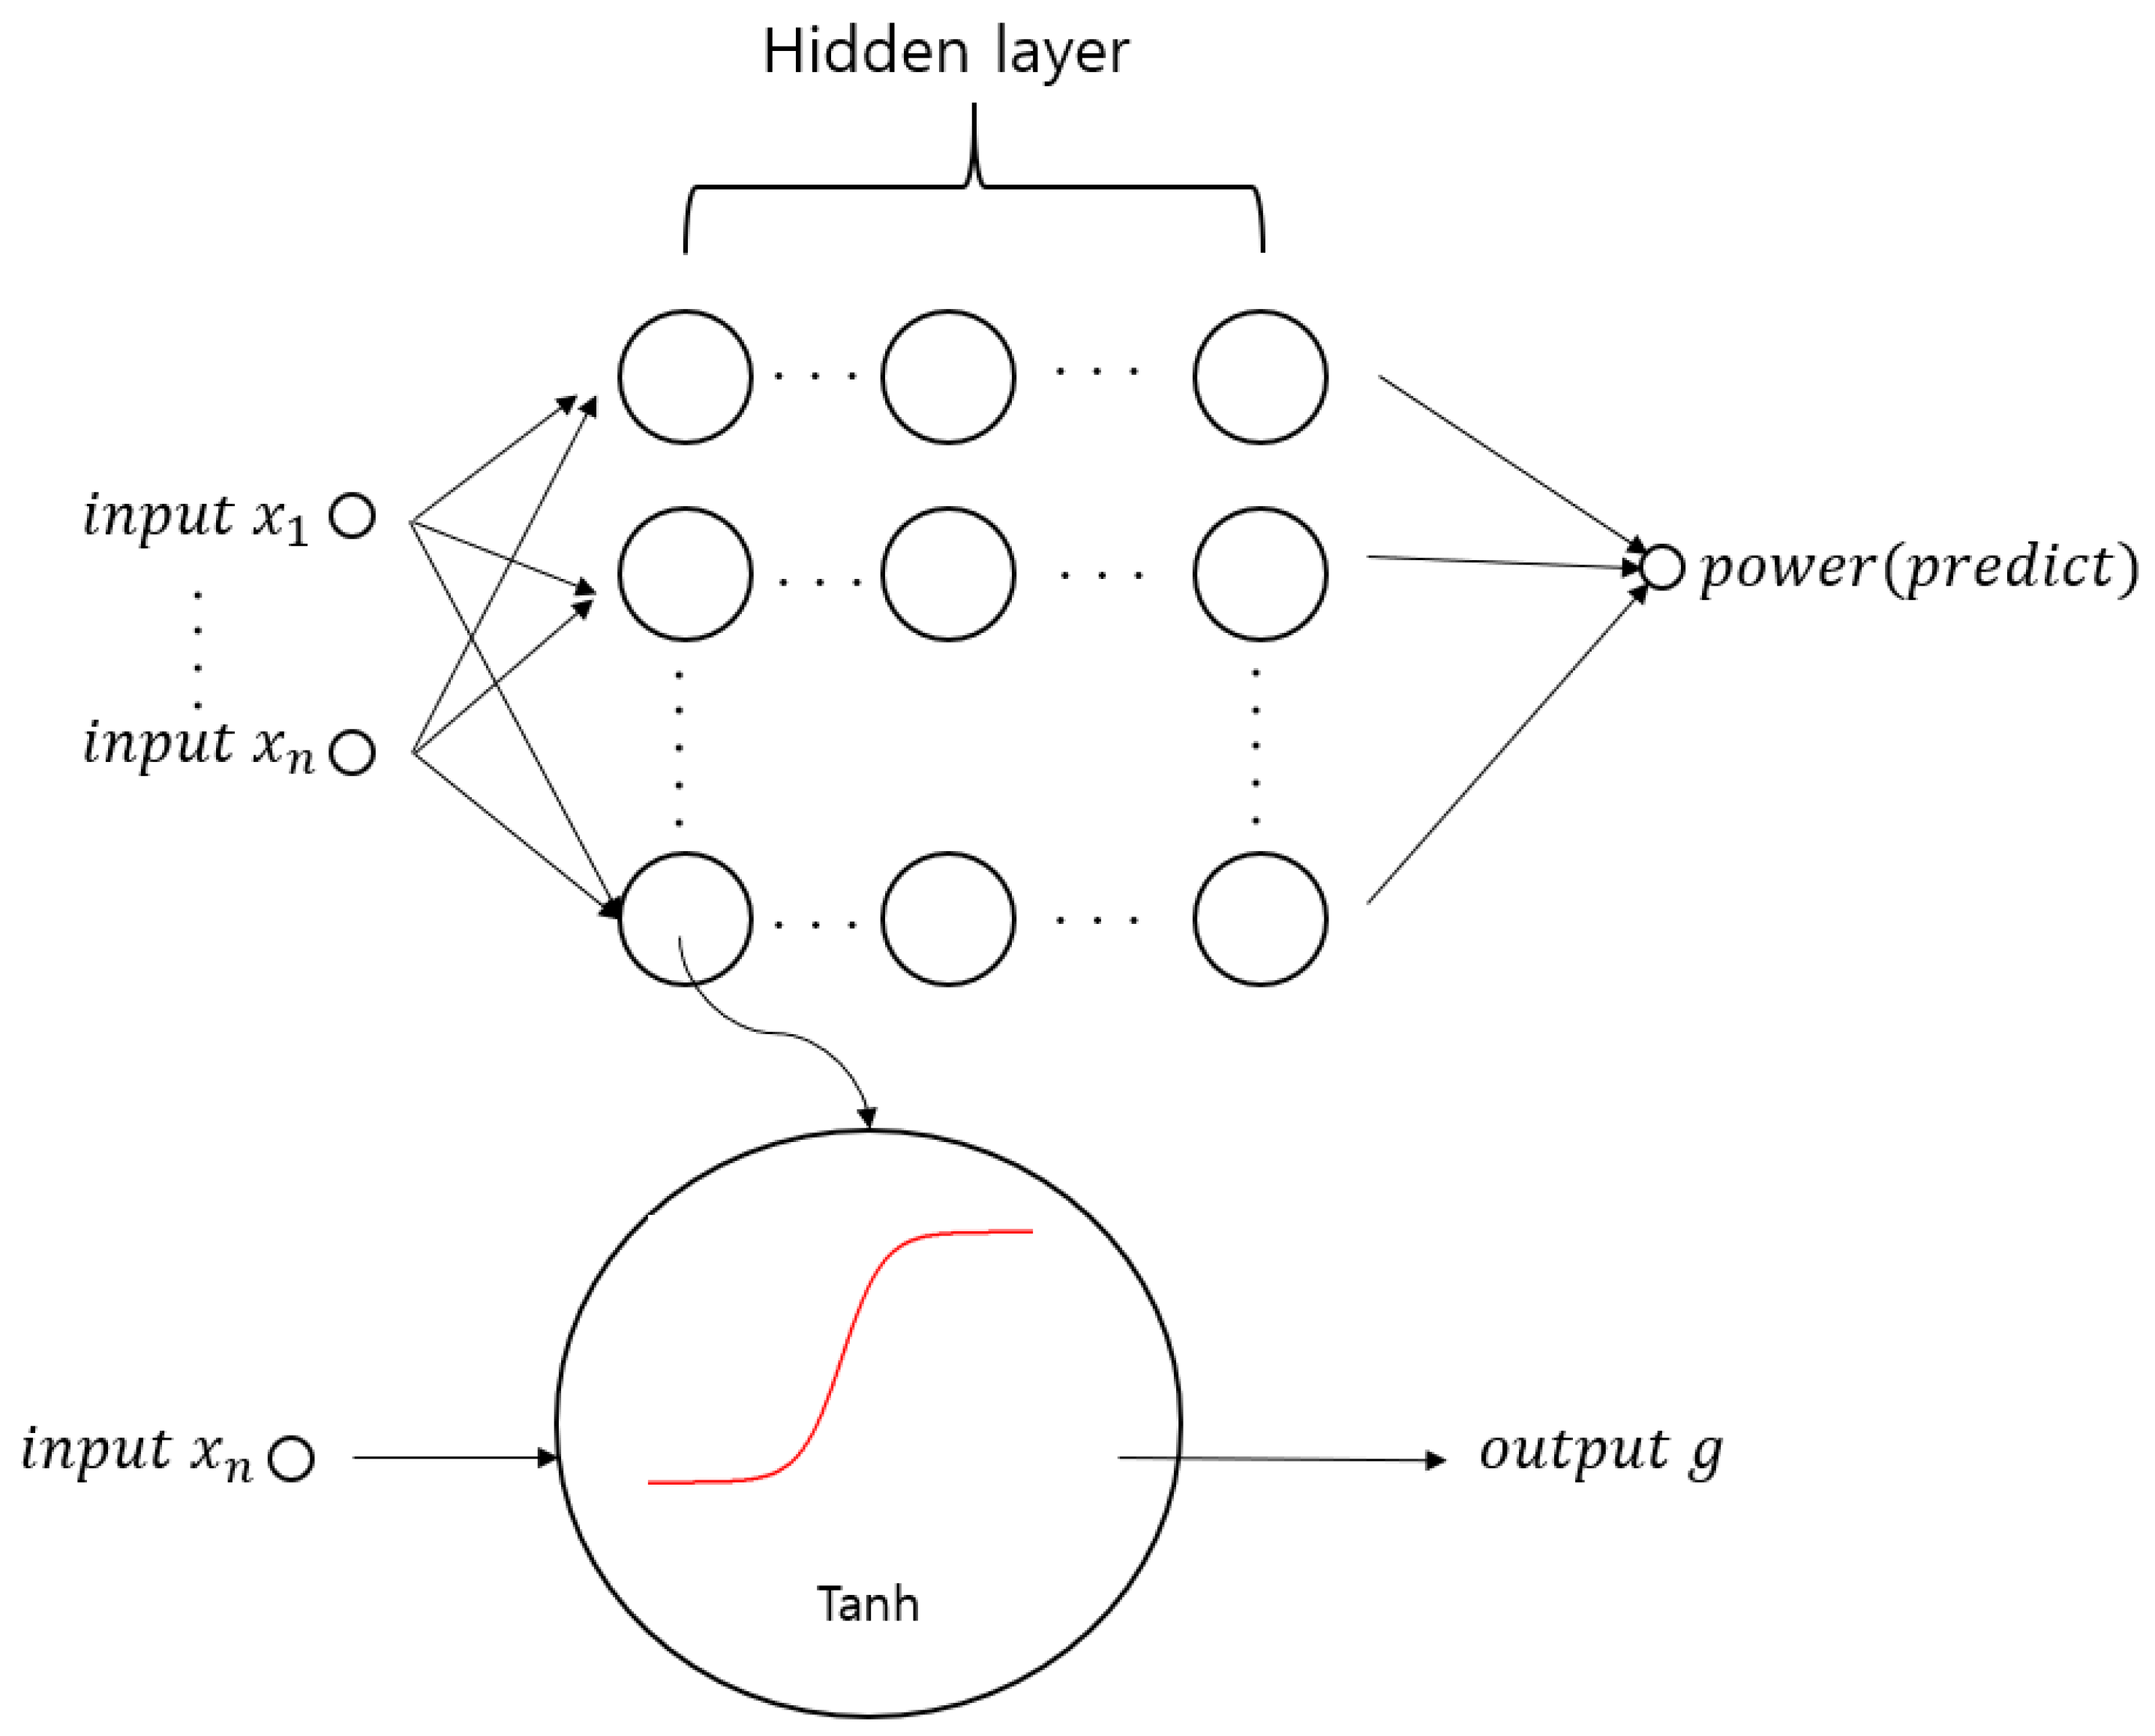
Secondly, the proposed neural network models were trained with two mode types in order to show how much the distinction between cooling and laser launch affected the accuracy. The variations of the network model generated up to 10 nodes and three layers, as shown in
Figure 10. The random seed was changed automatically. Each variation was tested with different layer configurations so as to find the best configuration.
The learning rate is one of the significant factors in neural network optimization. In a pre-test, 1000 cycles, a 0.1 learning rate, and 0.2 momentum were effective for the convergence of the network learning. Each model was compared with linear regression and compared with two different modes. The root mean squared and R squared were calculated on each model and were the criteria for selection of the optimal model to be used for energy efficiency.
In the efficiency calculation, comparison with alternative processes was needed. The welding speed of each stitch was already fixed because of the effect on welding quality. The rapid movement between stitches was the means to vary the process characteristics. The case study included variation of rapid movement.
4. Case Study
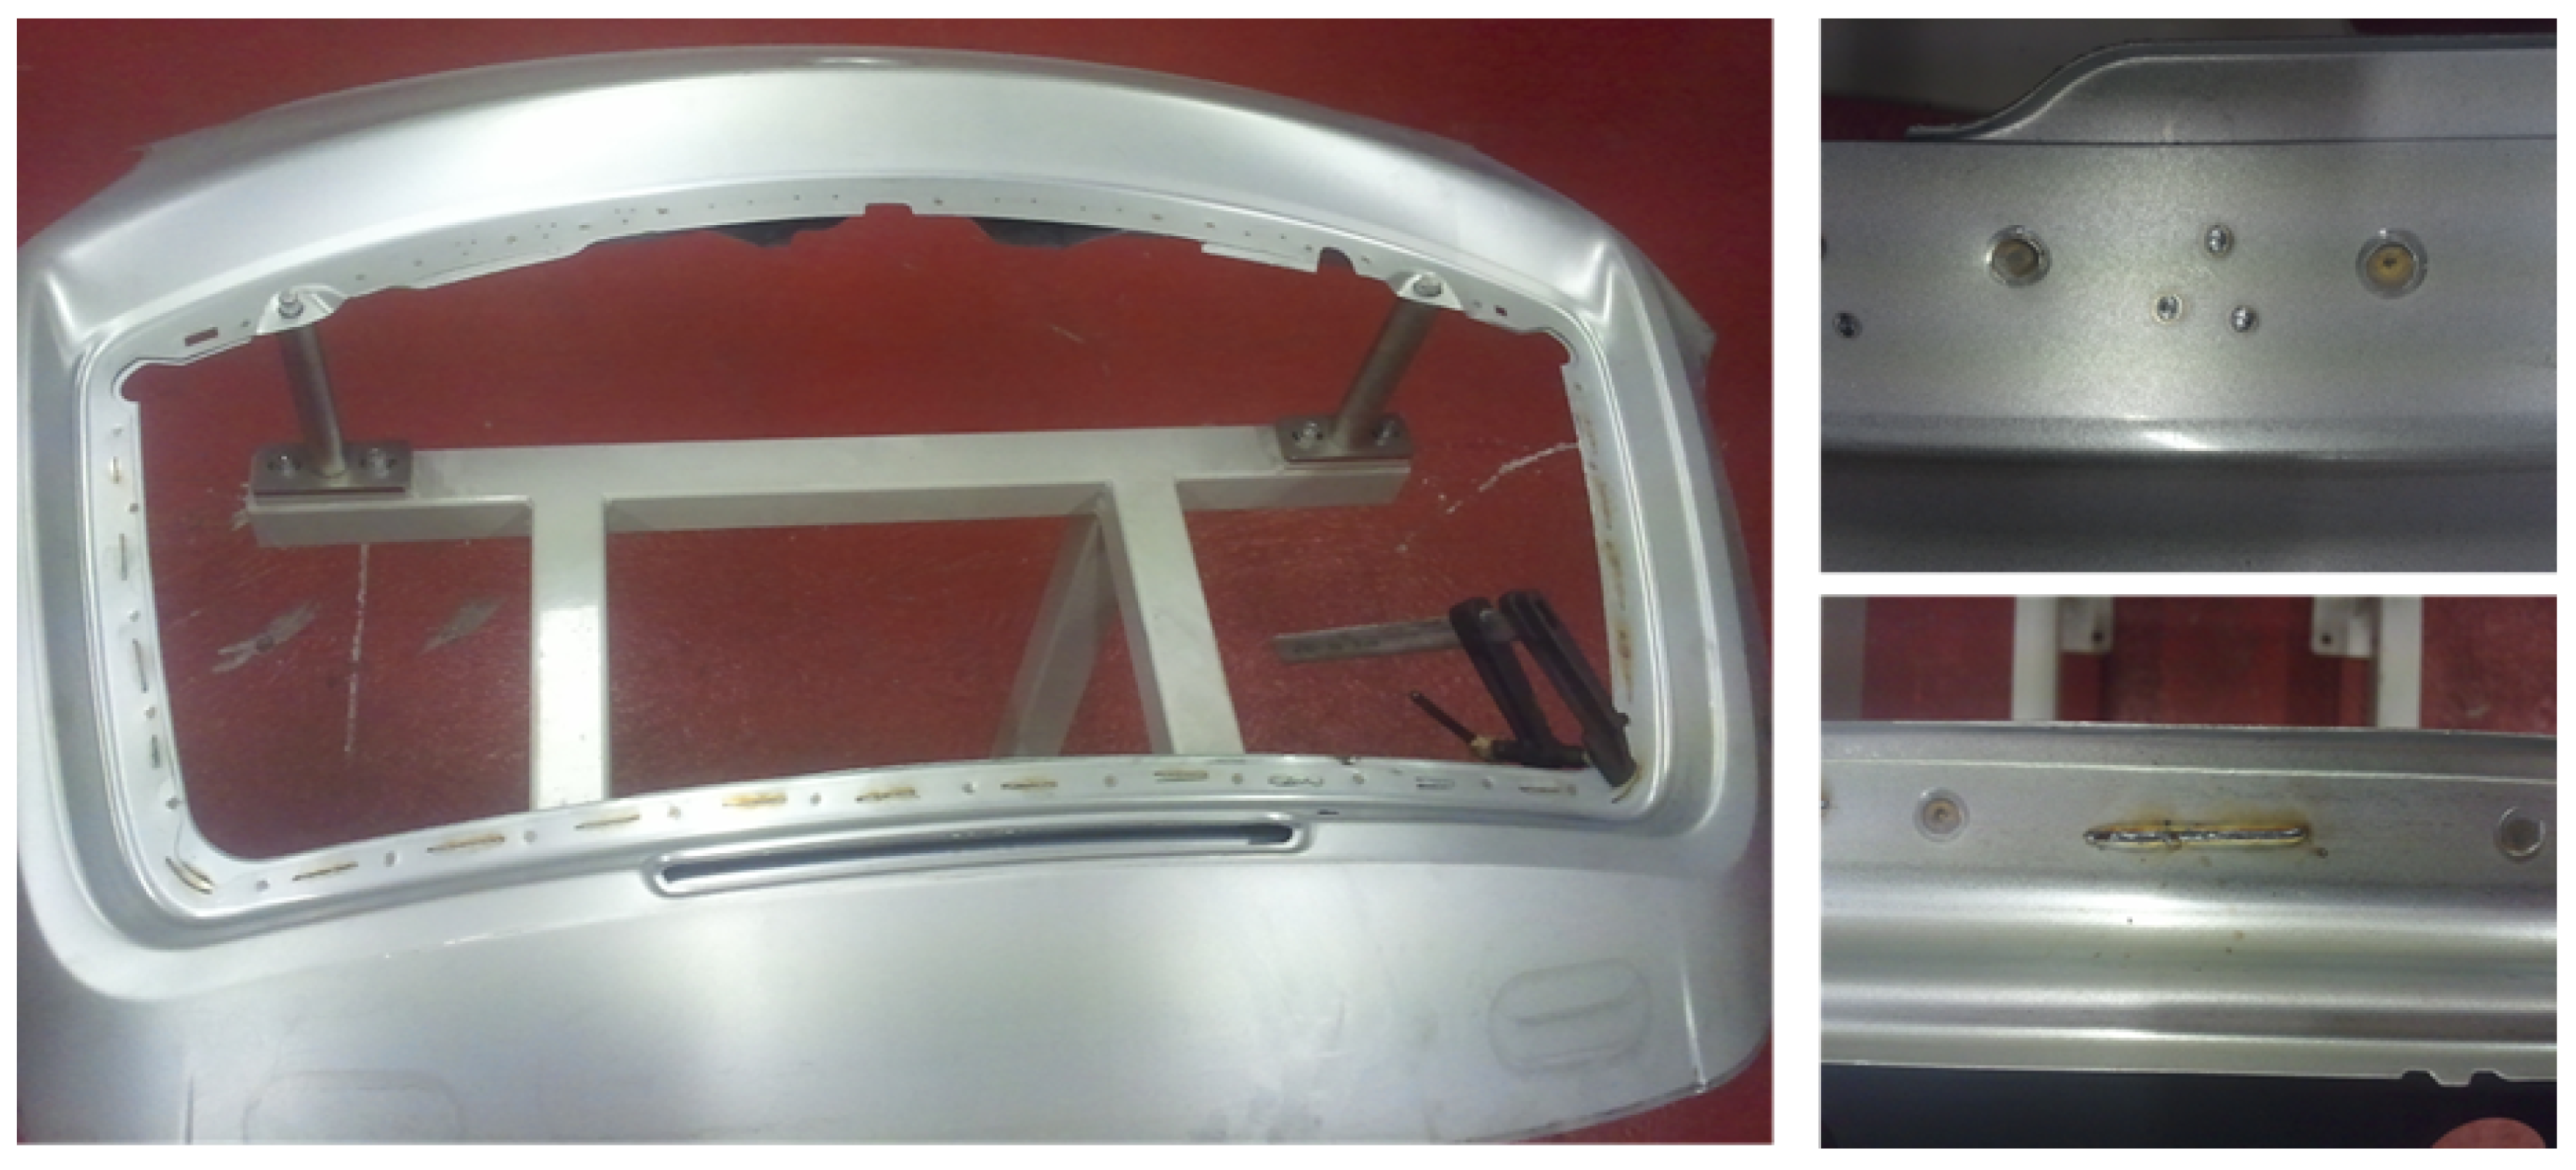
The proposed methodology described in the previous section was applied to the RLW of a car rear door assembly. This case study introduced the method for application of the integrated approach to a real product and showed how the proposed approach can improve the accuracy. The estimation model was implemented using RapidMiner 9.2. The process approach was applied to robot programming written in COMAUPDL2. Assembly of the car rear door parts involved a combination of welding positions in a set of 10 continuous stitches and 19 dimples made by a single laser welding robot with a fixed work-in-process on a single fixture (
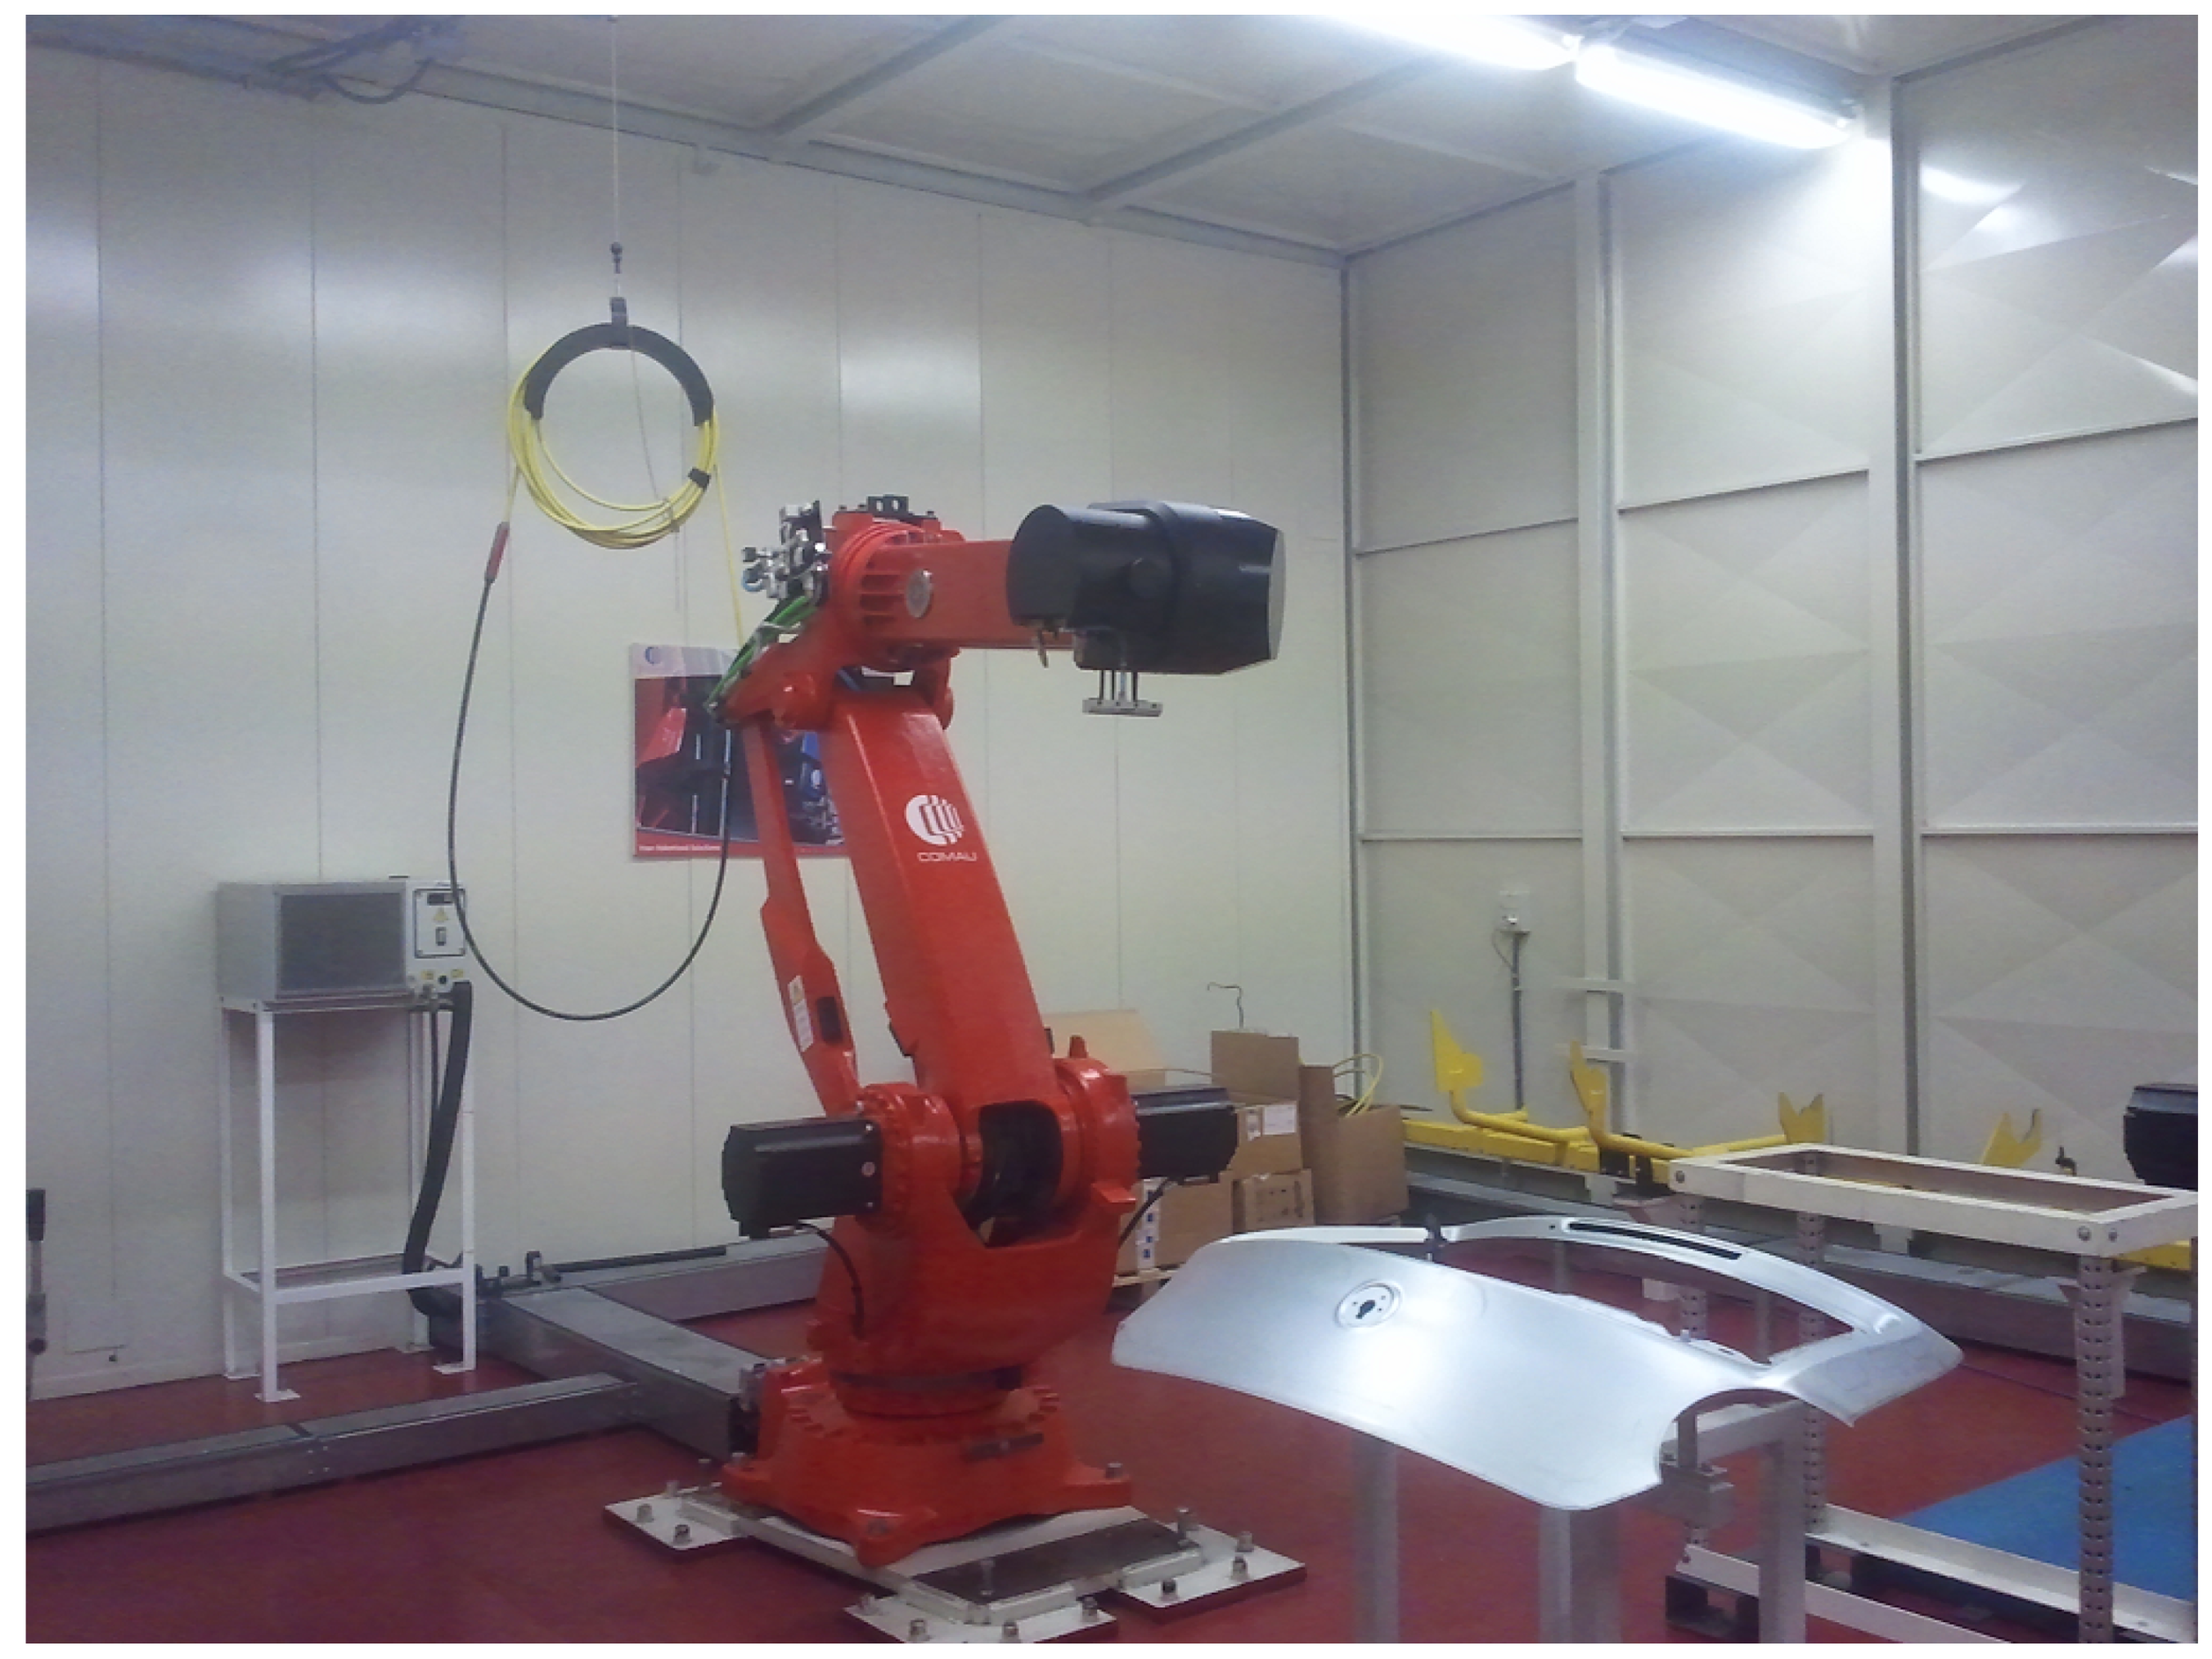
Figure 11). The COMAU SmartLaser consisted of a robot arm and laser machine. The robot arm had two parts. The first part had four revolute joints and the second part another three laser manipulators.
Figure 12 shows the experimental setting of the SmartLaser and the rear door assembly on the fixture. Further details of the robot arm can be found in Erdős et al. [
23].
This section analyzes the results of all experiments and compares these with each other. The estimation results for energy consumption and the errors in the estimated energy profile were investigated. First of all, the estimated profile was generated with a linear formulation by using a regression model for fluctuation. A first order polynomial was used for drawing the profile. Each cooling and launching cycle was divided into decrease direction and increase direction, respectively. Linear regression was applied to find the coefficients of the exponential function on laser launch and of the log function on the cooling operation.
The second approach is the mean to utilise the neural network model to estimate energy profile with hyperbolic tangential activation function. The overall structure of single network is shown in
Figure 13. the variety of the neural network which are generated iteratively from one layer to three layers with increasing of each layer from 4 nodes to 12 nodes. As mentioned in the feature engineering section, laser mode, starting time and starting power are added into the training data by derivation from the time-series power data of the training set. To compare the effectiveness of each aspect, the following four conditions are investigated.
(1) Linear formulation generated by the chain of linear regressions cooling and launching
(2) Profile generated by neural network trained only using mode and time
(3) Profile generated by neural network trained with additional data, which are Starting power and starting time (mode 1)
(4) Profile generated by neural network trained with the additional conditions on cooling and launching (mode 2)
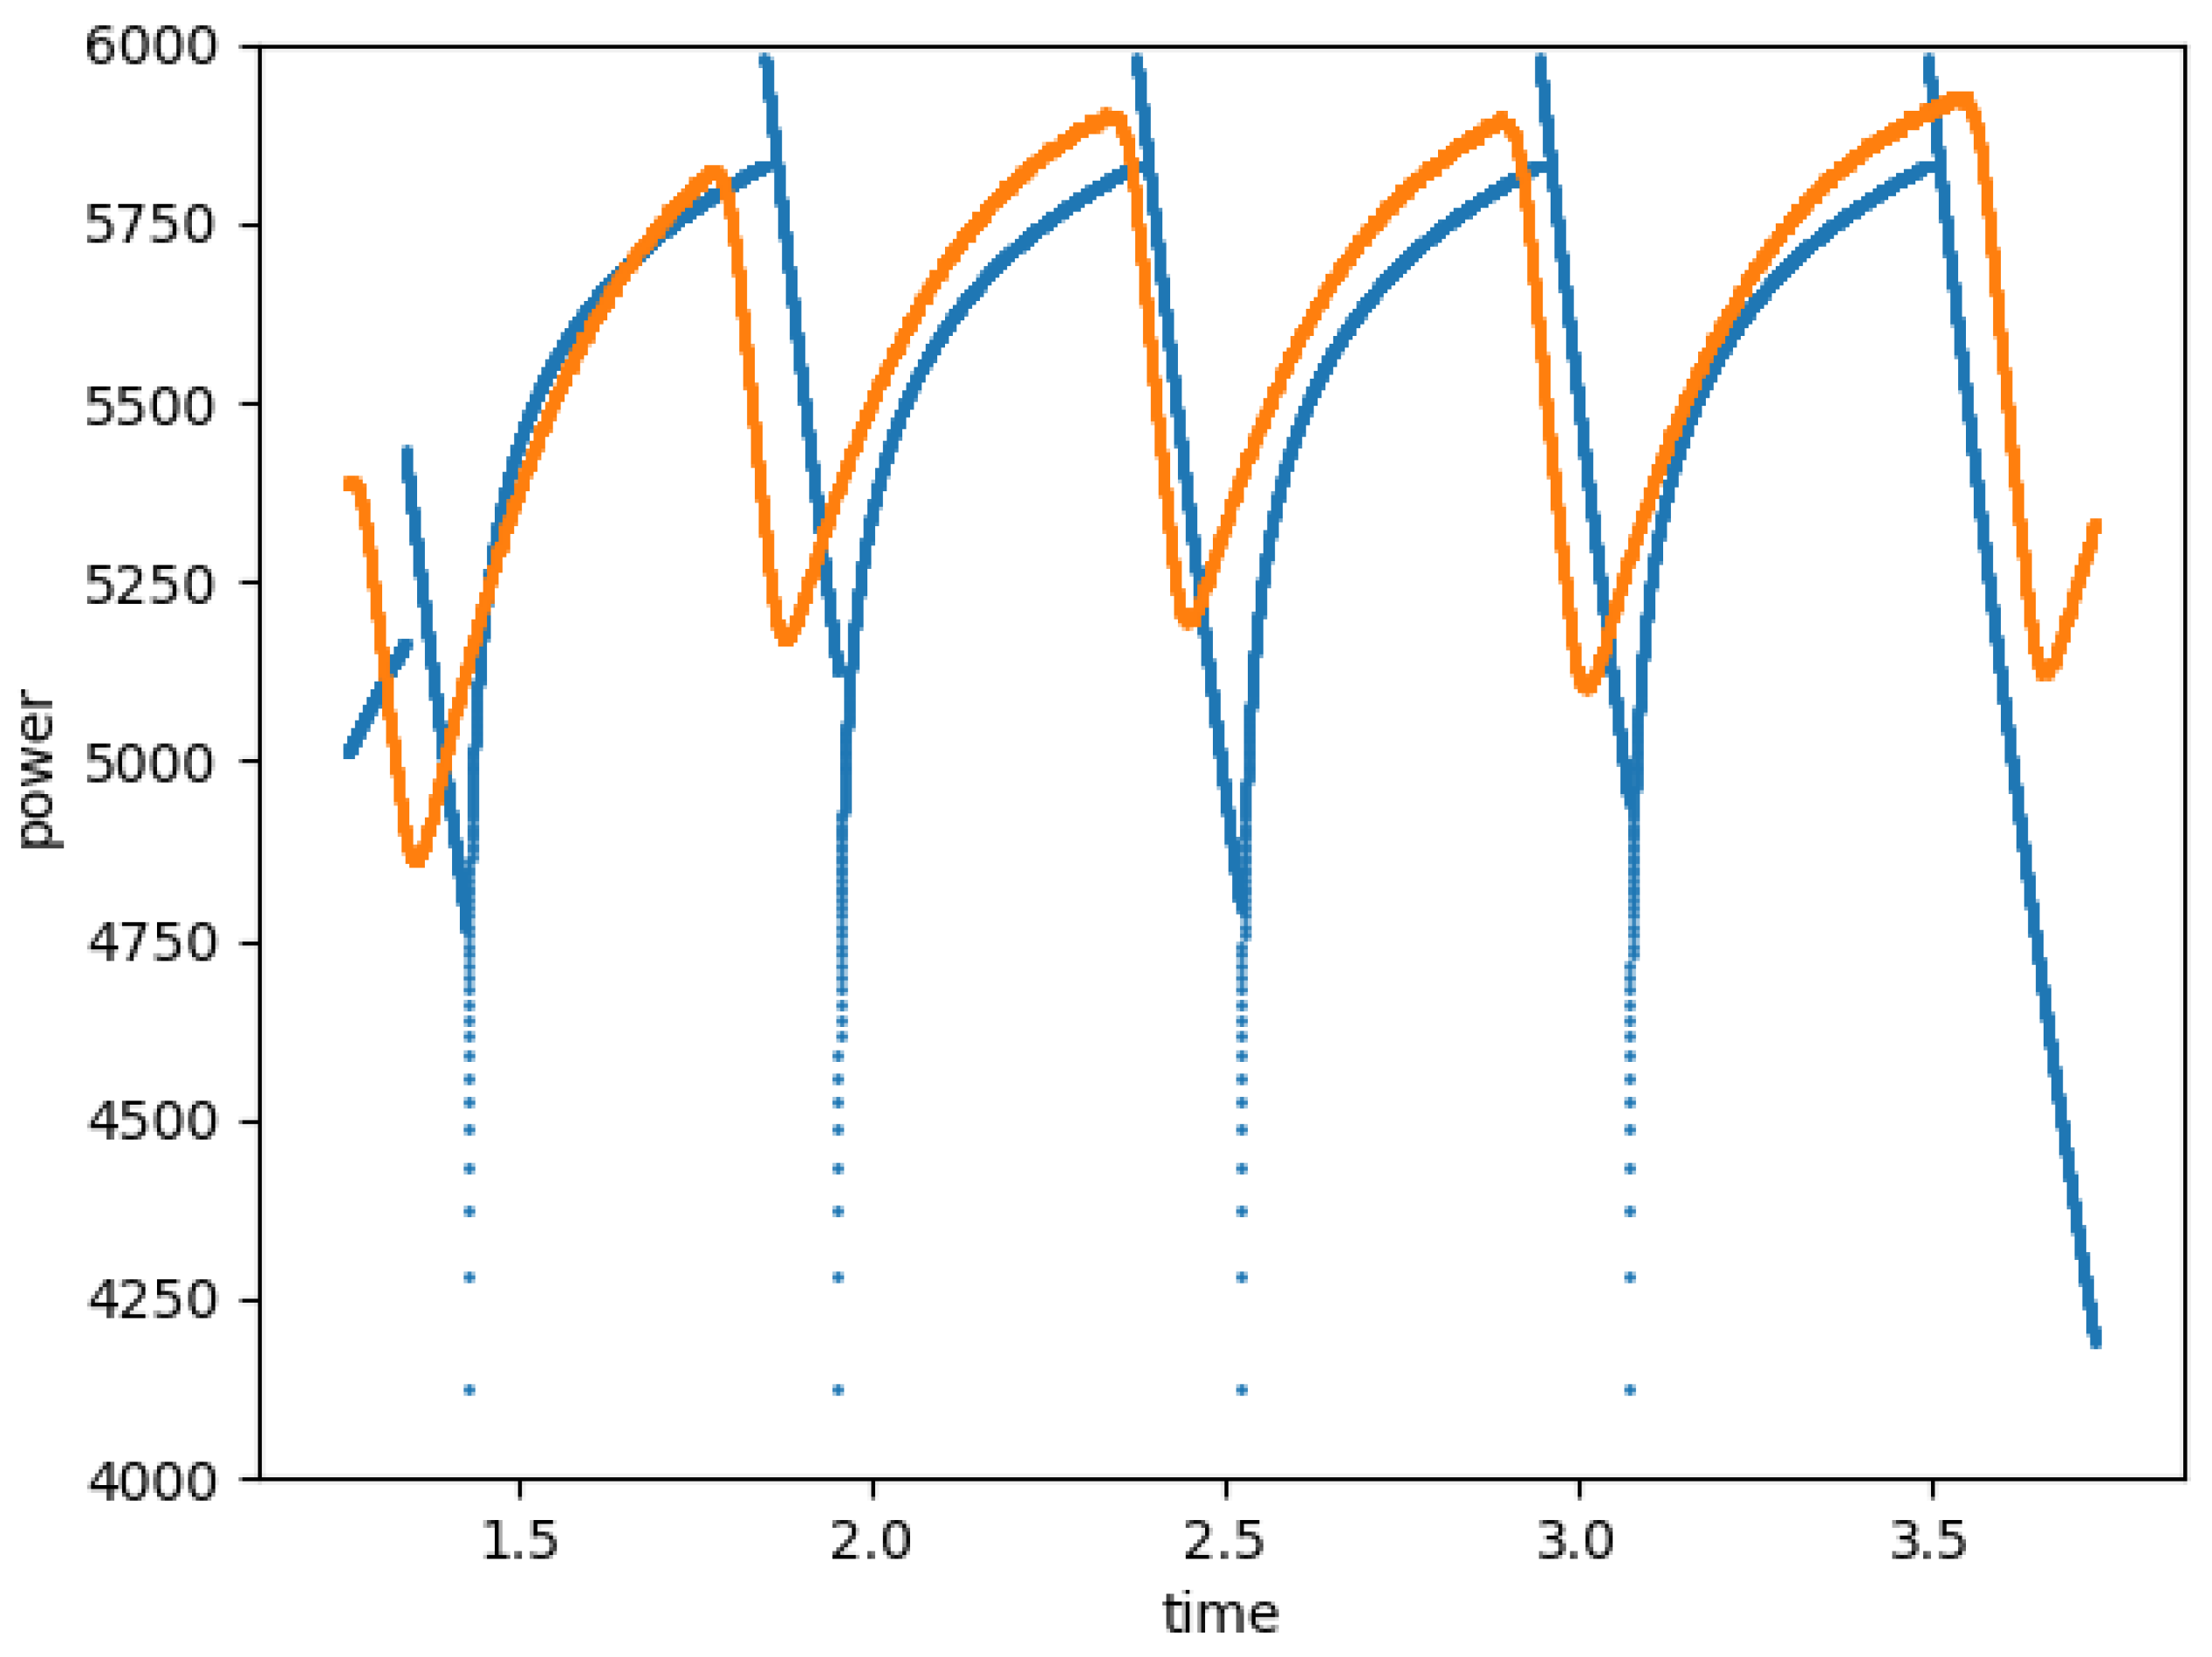
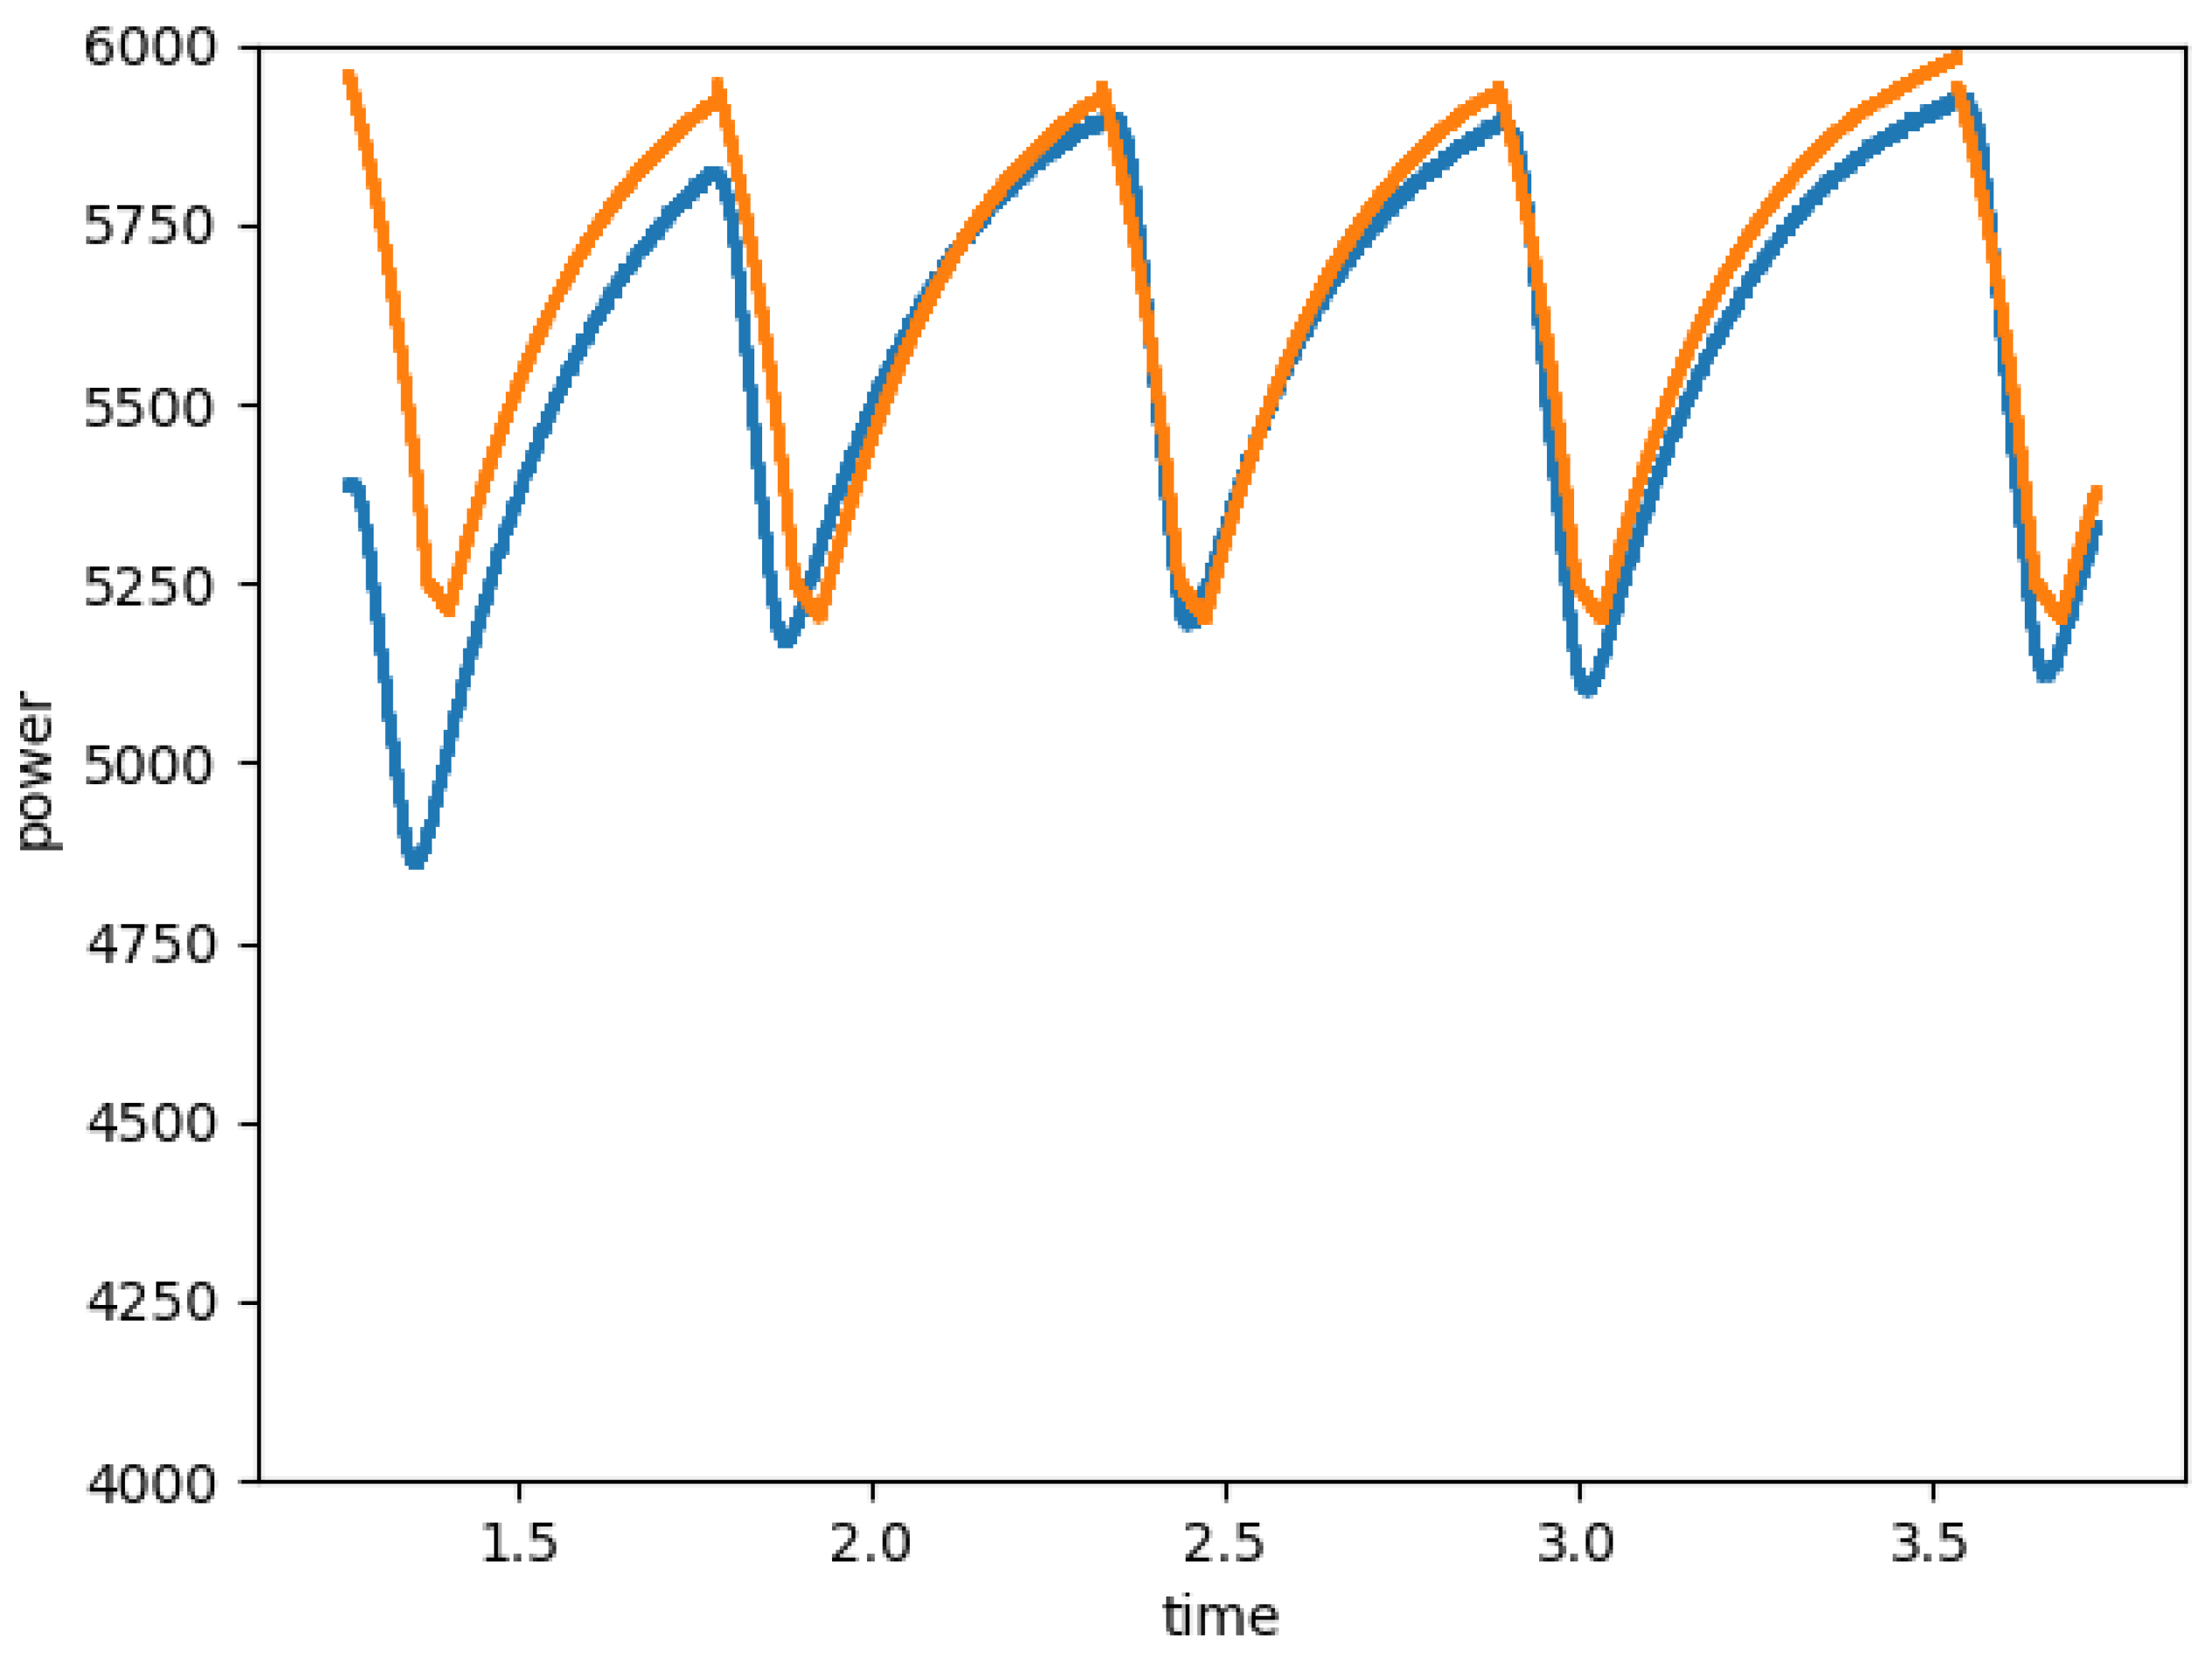
Condition (2) did not lead to convergence of the loss function. The comparison between (1) and (3) is shown in
Figure 14 and
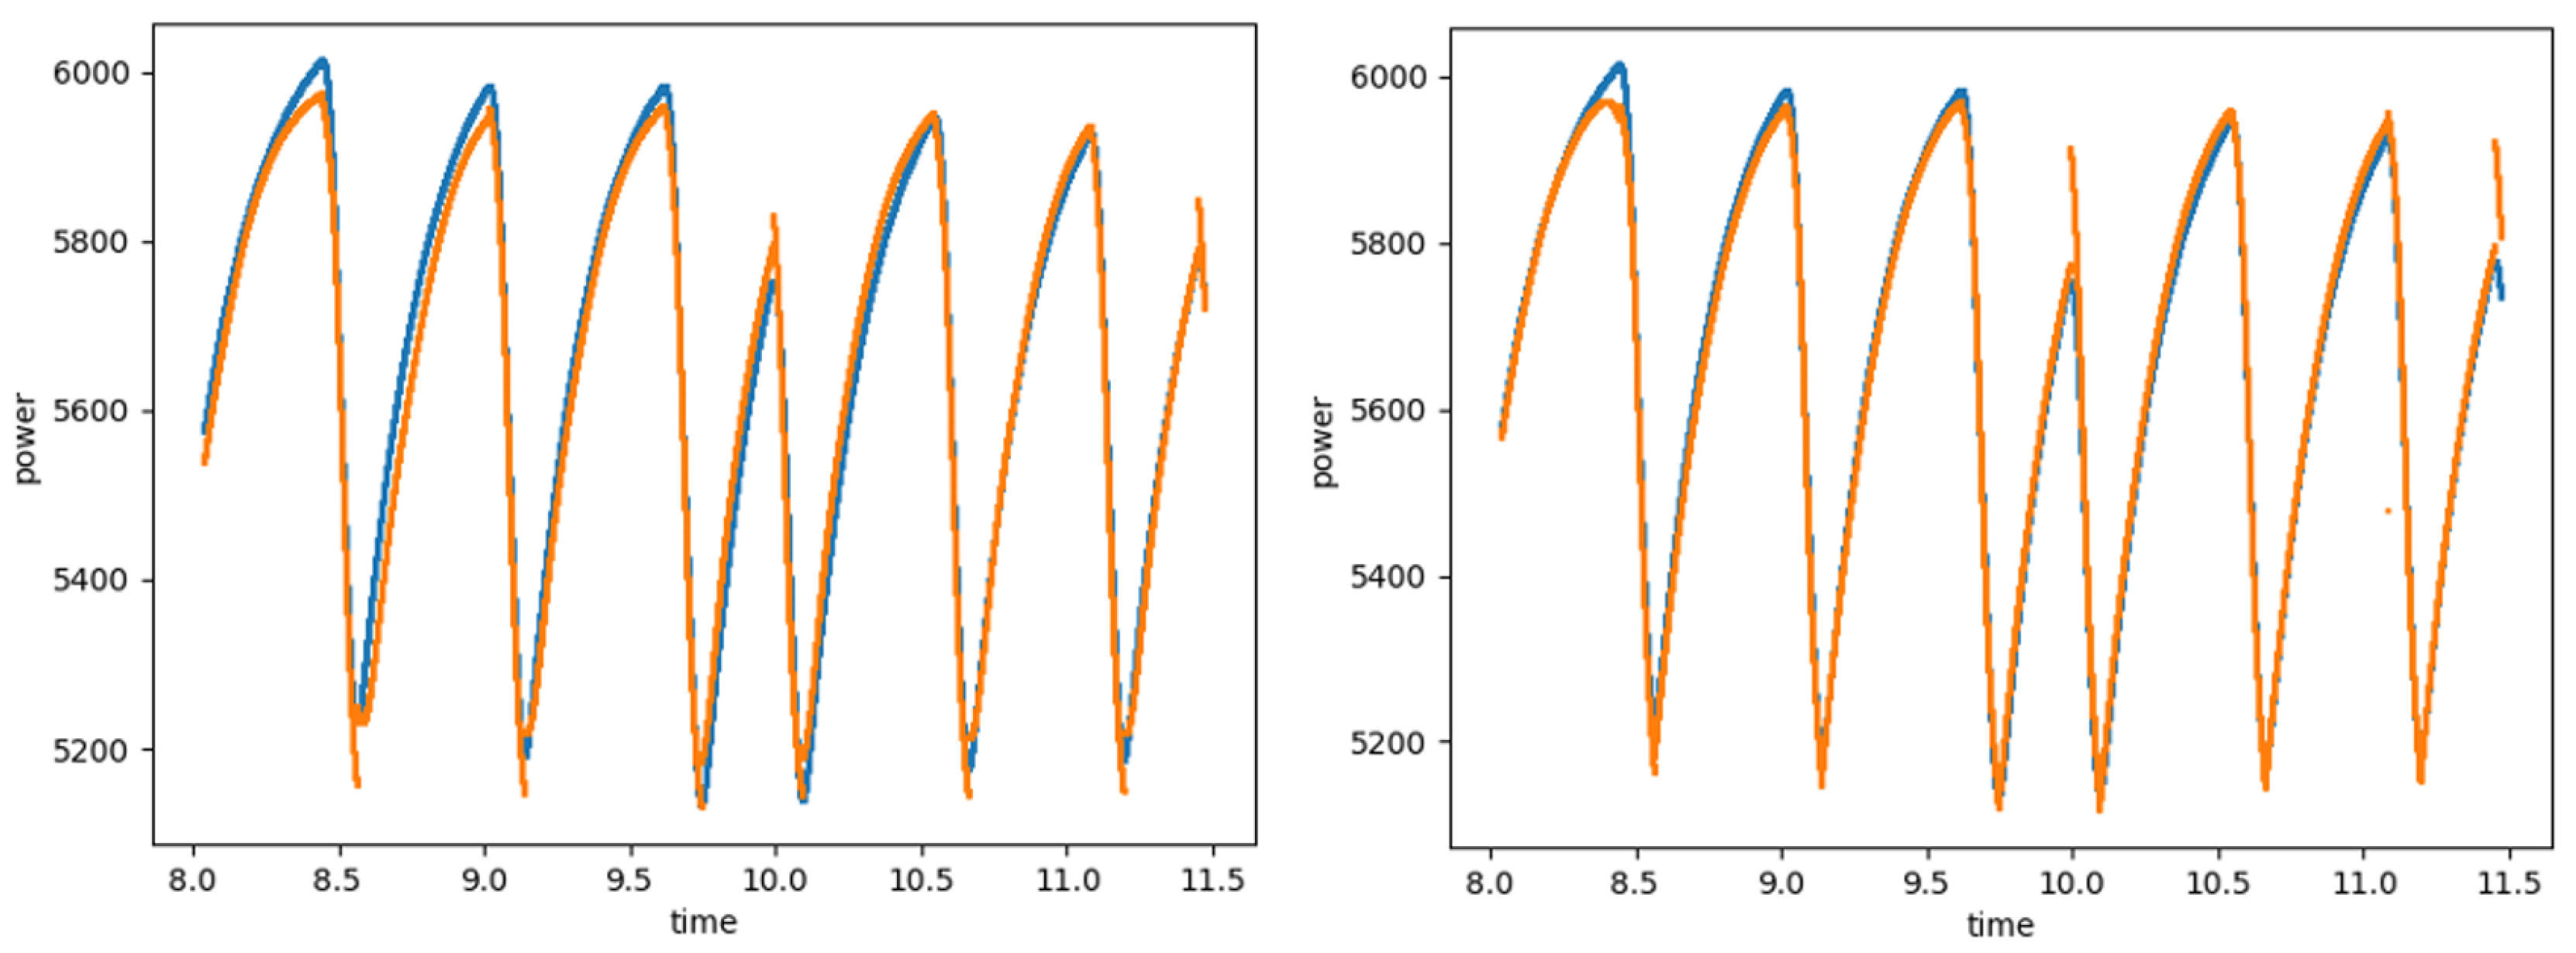
Figure 15. The features of exponential and log functions caused the high peaks of each stitch. In the comparison between Mode 1 and Mode 2, the 5 × 10 two-layered network showed the highest accuracy in Mode 1, while the 10 × 15 × 5 network was better in Mode 2, as shown in
Figure 16 and
Figure 17 and
Table 1. In the table, MAPE (Mean Absolute Percentage Error) showed the gap between the estimated value and the measured value with the following equation.
The detail of this function was described by Wang et al. [
24] Both networks showed high performance in terms of drawing an accurate profile; three layers showed a fine graph, then the one of high RMS and R squared.
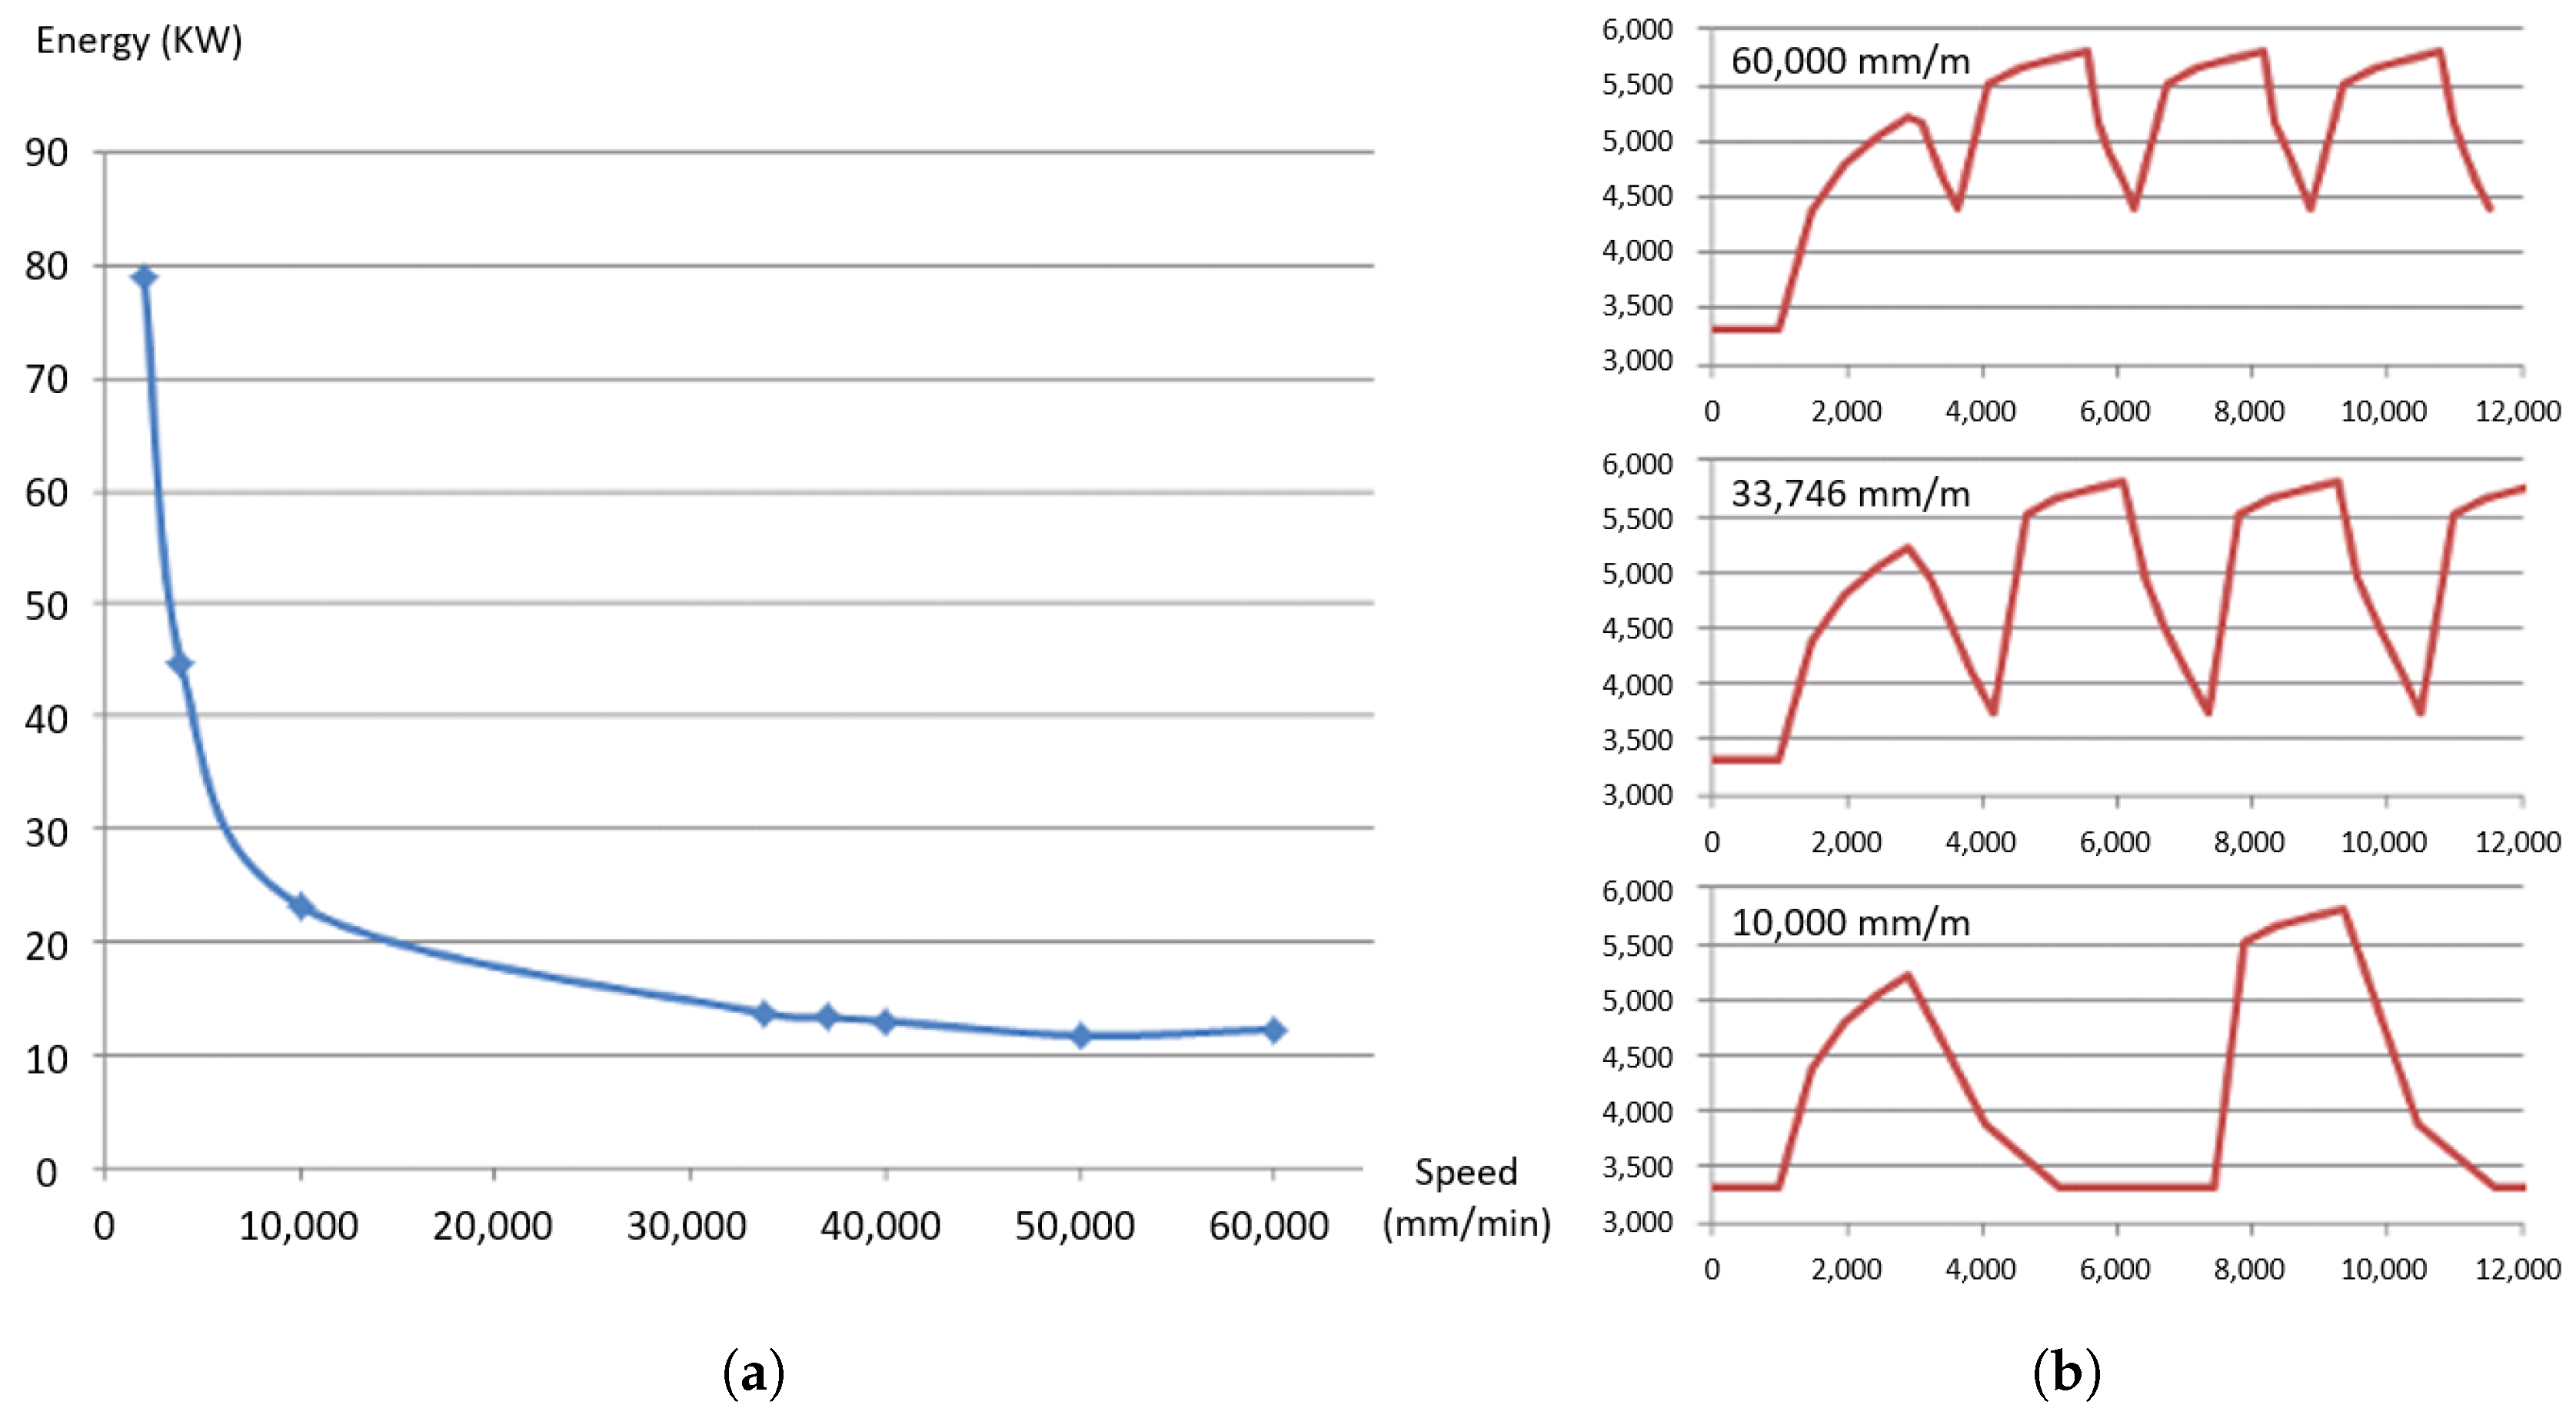
In terms of the energy efficiency, welding speed cannot be changed because it is optimized for the material characteristics and shape of the parts being welded as a precondition. Rapid movement is the only option for changing the process parameters.
Figure 18 shows the estimated energy profile generated by three rapid movements using the linear regression model. Scan speed was ten-times faster than joint motion. If rapid movements were only done by scanning, then the total efficiency could be increased. Rapid movement had a tremendous influence with low speeds, but for high speeds, the variation was small. The optimal speed of rapid movement was related to cooling time to get steady state energy. A longer time than this for movement was not necessary because it caused meaningless energy loss. If the cooling time was long, it caused long steady state and increased energy, while shorter time was better because cooling dropped exponentially.
5. Discussion
This section summarizes the major aspects of the proposed estimation model for RLW. The proposed energy estimation model involved component selection by functional analysis and machine learning compensation by using process parameters and experimental data. To conclude this paper, we highlight those aspects of the proposed energy estimation model that can produce energy profiles for a given welding program and a small amount of experimental data.
5.1. Provision of the Correlation with Laser Power and Process Time
This paper has formalized the effects of functional specification and process parameters in an energy consumption model. This is based on the fact that the laser source determines energy efficiency in the RLW processes. By providing a functional analysis and process analysis, this paper shows how energy profiles were measured and the determination of key factors that influence total energy consumption.
As shown, laser power and process time affected energy consumption in the RLW process. Both analyses showed that the laser source and the chiller used more electrical energy than the robot motors. Laser power is a significant criterion for estimating the energy profile. It is noted that low power laser welding leads to low energy efficiency. However, door materials determine the laser power and welding speed. Hence, rapid movements between welding stitches should be reduced. The integrated approach showed the correlation between laser power and process time in a single dimension. For this reason, the proposed approach is beneficial for optimization of path planning in terms of process time and energy use.
The integration of both analyses is an interesting illustration. In some areas, for example in “energy use distribution”, the laser machine had a higher rate of energy consumption than the rate of the industrial robot. This was the opposite to the rate of metal cutting. The steady state energy consumption was relatively lower than for machine tools. In the “reduction of process time”, the shortest rapid movement time was not the best solution to minimize the total energy use. Very long continuous welding caused an unstoppable increase in the temperature of the laser disks and, hence, an increase in cooling.
5.2. Machine Learning
Linear regression and neural networks were applied in the energy profile estimation model. The three major process parameters of metal cutting were not given in laser welding. In the laser controller part of the program, unit blocks were separated into steady state and laser launching and cooling. The unit block was the minimum criterion for training in the machine learning approach, and the starting power and starting time were counted from each laser launch to improve the accuracy of the neural network approach. The given training dataset showed the highest accuracy for a two-layered neural network. Linear regression was possible if all stitch profiles were divided into cooling and launching of the laser. However, the recurrent neural network approach showed over-fitting and was rarely trained. The profile data included small fluctuations causing disruptions in the results of the loss functions. Program-based parameters were required in the case of small datasets and were applied to the training data as time-series information to improve the learning rate. Even though front and end training data showed highly accurate results, due to the small amount of training data, a high learning rate was required. Increasing the size of training data is difficult for users of RLW. Mode 2 did not show high improvement compared with Mode 1 even if more features were applied. The dis-connectivity of each launch and cooling caused inaccuracy in finding the starting point of the shift to cooling and to launching.
6. Conclusions
This paper proposed an integrated approach merging a functional model and a process model with machine learning-based compensation. The research was done in the domain of remote laser welding, an assembly technique that has benefits for assembly in terms of energy savings. The characteristics of remote laser welding were applied to the features of the machine learning model and showed improved learning performance. This lead to optimization of performance for the process.
As described in the Discussion Section, the correlation between laser power and process power had been formalized and the use of machine learning described. The formalization led to a better understanding of the parameter settings in planning, as well as evaluation of the benefits of new equipment. This is important in order to allow manufacturers to appreciate the benefits of new equipment and processes, as well as quantifying energy savings. The machine learning aspects showed an example of the application of artificial intelligence technology to overcome the lack of formal understanding of the problem domain. The Discussion Section described the benefits and shortcomings encountered in this application domain. The paper also described the differences between the RLW application methods and those applied to metal cutting processes.
Future work is intended to adapt more features that have two cases: domain knowledge-based feature (model driven) and data science-based feature (data driven). Treatment of data was done from two perspectives. The first was the classical approach for data, which is called the data-driven method. The second method used deep learning and is powerful also for use in other fields.
Author Contributions
Conceptualization, Methodology–J.U.; Funding acquisition, Investigation, Project administration, Resources, Supervision–I.A.S.; Software, Validation & Visualization–J.U. and Y.-k.P.; Writing—original draft–J.U.; Writing—review & editing–J.U. and I.A.S.
Funding
This work has been supported by EU FP7 grant RLW Navigator No. 285051 (Remote Laser Welding System Navigator for Eco and Resilient Automotive Factories, FoF-ICT-2011.7, No. 285051) and by a grant from Kyung Hee University in 2018 (No. 20182219).
Conflicts of Interest
The authors declare no conflict of interest.
References
- Um, J.; Stroud, I.A. Total energy estimation model for remote laser welding process. In Proceedings of the 46th CIRP Conference on Manufacturing Systems, Sesimbra, Portugal, 29–31 May 2013. [Google Scholar]
- Sebastian, T. Energy Efficiency in Manufacturing Systems; Springer: Berlin, Germany, 2012. [Google Scholar]
- Zhou, L.; Li, J.; Li, F.; Meng, Q.; Li, J.; Xu, X. Energy consumption model and energy efficiency of machine tools: A comprehensive literature review. J. Clean. Prod. 2016, 112, 3721–3734. [Google Scholar] [CrossRef]
- Pagone, E.; Salonitis, K.; Jolly, M. Energy and material efficiency metrics in foundries. In Proceedings of the 15th Global Conference on Sustainable Manufacturing, Haifa, Israel, 25–27 September 2017. [Google Scholar]
- Gutowski, T.; Dahmus, J.; Thiriez, A. Electrical energy requirements for manufacturing processes. In Proceedings of the 13th CIRP International Conference on Life Cycle Engineering, Leuven, Belgium, 31 May–2 June 2006. [Google Scholar]
- Gutowski, T. The Carbon and Energy Intensity of Manufacturing. In Proceedings of the 40th CIRP International Manufacturing Systems Seminar, Liverpool, UK, 30 May–2 June 2007. [Google Scholar]
- Gutowski, T.; Branham, M.; Dahmus, J.; Jones, A.; Thiriez, A. Thermodynamic analysis of resources used in manufacturing processes. Environ. Sci. Technol. 2009, 43, 1584–1590. [Google Scholar] [CrossRef] [PubMed]
- Gontarz, A.; Weiss, L.; Wegener, K. Evaluation approach with function-oriented modeling of machine tools. In Proceedings of the 1st International Conference on Sustainable Intelligent Manufacturing, Leiria, Portugal, 29 June–1 July 2011. [Google Scholar]
- Winter, M.; Herrmann, C. Eco-Efficiency of alternative and conventional cutting fluids in external cylindrical grinding. In Proceedings of the 21st CIRP Conference on Life Cycle Engineering, Trondheim, Norway, 18–20 June 2014. [Google Scholar]
- Winter, M.; Thiede, S.; Herrmann, C. Influence of the cutting fluid on process energy demand and surface roughness in grinding—A technological, environmental and economic examination. Int. J. Adv. Manuf. Technol. 2015, 77, 2005–2017. [Google Scholar] [CrossRef]
- Ma, F.; Zhang, H.; Hon, K.K.B.; Gong, Q. An optimization approach of selective laser sintering considering energy consumption and material cost. J. Clean. Prod. 2018, 199, 529–537. [Google Scholar] [CrossRef]
- Zhu, Y.; Peng, T.; Jia, G.; Zhang, H.; Xu, S.; Yang, H. Electrical energy consumption and mechanical properties of selective-laser-melting-produced 316L stainless steel samples using various processing parameters. J. Clean. Prod. 2019, 208, 77–85. [Google Scholar] [CrossRef]
- Gregory, J.; Olivares, A.; Staffetti, E. Energy-optimal trajectory planning for robot manipulators with holonomic constraints. Syst. Control Lett. 2012, 61, 279–291. [Google Scholar] [CrossRef]
- Avram, O.I.; Xirouchakis, P. Evaluating the use phase energy requirements of a machine tool system. J. Clean. Prod. 2011, 19, 699–711. [Google Scholar] [CrossRef]
- Duflou, J.R.; Sutherland, J.W.; Dornfeld, D.; Herrmann, C.; Jeswiet, J.; Kara, S.; Hauschild, M.; Kellens, K. Towards energy and resource efficient manufacturing: A processes and systems approach. CIRP Ann. 2012, 61, 587–609. [Google Scholar] [CrossRef]
- Newman, S.T.; Nassehi, A.; Imani-Asrai, R.; Dhokia, V. Energy efficient process planning for CNC machining. CIRP J. Manuf. Sci. Technol. 2012, 5, 127–136. [Google Scholar] [CrossRef]
- Marvuglia, A.; Messineo, A. Using recurrent artificial neural networks to forecast household electricity consumption. In Proceedings of the 2011 2nd International Conference on Advances in Energy Engineering, Bangkok, Thailand, 27–28 December 2011. [Google Scholar]
- Biswas, M.R.; Robinson, M.D.; Fumo, N. Prediction of residential building energy consumption: A neural network approach. Energy 2016, 117, 84–92. [Google Scholar] [CrossRef]
- Um, J.; Gontarz, A.; Stround, I. Developing energy estimation model based on Sustainability KPI of machine tools. Procedia CIRP 2015, 26, 217–222. [Google Scholar] [CrossRef]
- Giesen, A.; Speiser, J. Fifteen years of work on thin-disk lasers: Results and scaling laws. IEEE J. Quantum Electron. 2007, 13, 598–609. [Google Scholar] [CrossRef]
- Reinhart, G.; Munzert, U.; Vogl, W. A programming system for robot-based remote-laser-welding with conventional optics. CIRP Ann. Manuf. Technol. 2008, 57, 37–40. [Google Scholar] [CrossRef]
- Du, P.K.; Warren, A.; Lin, S.M. Improved peak detection in mass spectrum by incorporating continuous wavelet transform-based pattern matching. Bioinformatics 2006, 22, 2059–2065. [Google Scholar] [CrossRef]
- Erdős, G.; Kardos, C.; Kemény, Z.; Kovács, A.; Váncza, J. Process planning and offline programming for robotic remote laser welding systems. Int. J. Comput. Integr. Manuf. 2016, 29, 1287–1306. [Google Scholar] [CrossRef]
- Wang, S.; Liang, Y.C.; Li, W.D.; Cai, X.T. Big Data enabled Intelligent Immune System for energy efficient manufacturing management. J. Clean. Prod. 2018, 195, 507–520. [Google Scholar] [CrossRef]
© 2019 by the authors. Licensee MDPI, Basel, Switzerland. This article is an open access article distributed under the terms and conditions of the Creative Commons Attribution (CC BY) license (http://creativecommons.org/licenses/by/4.0/).


