Article

Optimal Design of a Novel ‘S-shape’ Impeller Blade for a Microbubble Pump

1
Department of Mechanical Engineering, Hanyang University, 55 Hanyangdeahak-ro, Sangnok-gu, Ansan, Gyeonggi-do 15588, Korea
2
Department of Land, Water and Environment Research, Korea Institute of Civil Engineering and Building Technology, 283, Goyangdae-ro, Ilsanseo-gu, Goyang-si, Gyeonggi-do 10223, Korea
*
Author to whom correspondence should be addressed.
Energies 2019, 12(9), 1793; https://doi.org/10.3390/en12091793
Submission received: 13 April 2019 / Revised: 3 May 2019 / Accepted: 8 May 2019 / Published: 11 May 2019
(This article belongs to the Section B: Energy and Environment)

Abstract

:
The newly designed impeller blade, a so-called novel ‘S-shape’ blade, used for microbubble pumps has been introduced to enhance pump performance. Unlike a conventional blade having separated blades, like cantilever-shape blades, the newly designed impeller has a continuous blade, thus having a relatively robust structure as compared to a conventional impeller. The optimal blade design of the ‘S-shape’ blade has been demonstrated to obtain a higher pump efficiency. To analyze the three-dimensional flow field inside the pump by numerical simulation, a general analysis code, ANSYS CFX, is employed in the present work. The computed pump efficiency has a maximum error of 4 percent compared to the experimental data. The optimal design of the pump impeller blade is based on geometric constraints considering blade manufacturing, and uses three design variables: the number of blades, the blade thickness and the radius of the blade rib. The response surface method, a global optimization method, is employed to optimize the pump impeller blade. Throughout the blade optimization of the ‘S-shape’ blade, it is found that the chief influence on the pump efficiency is the number of the impeller blades. Pump efficiency, an object function, is increased by up to 35.3 percent, which corresponds to a 3.7 percent increase compared to the reference one. It is no use to say that the ‘S-shape’ blade having a continuously connected blade has more rigid characteristics. The larger pressure increases of the optimized pump along with the volute casing wall is observed from the middle position of the rotational direction, which comes from the increase of momentum energy due to larger circulating flow inside each blade passage as compared to the reference one. The detailed flow field inside the pump blades is also analyzed and compared.

1. Introduction

The blade optimization of a microbubble pump has been performed to enhance the pump performance in the present study. The microbubble pump can produce microbubbles of high precision without any additional mechanical device while the manufacturing cost is relatively high due to precision parts processing. Microbubble pumps have been applied in a variety of fields including water treatment, biogas refining, green algae processes, fisheries, and life health. Microbubbles pumps generate microscale gas bubbles due to the strong mixing with the gas and liquid induced by the rotation of the impeller inside the pump. The pump impeller is rotated by a motor and needs to produce a high pressure in order to generate microbubbles, thus requiring a lot of motor power. To reduce the need for such motor power, it is necessary to develop high-efficiency pump impeller. Conventional impeller blades of microbubble pumps have an open channel type impeller and require a more rigid blade shape due to the high pressure inside the impeller blades. Open channel type impellers, one of those being the regenerative pump impeller, are becoming more widely selected in the industrial field due to the relatively lower manufacturing and maintenance costs.
A variety of research on regenerative pumps has been carried out in order to understand the theoretical phenomena concerning pump performance by analytical, experimental and numerical methods [1]. For example, Wilson et al. [2] proposed a momentum exchange theory, which describes a spiral flow pattern in a regenerative pump. Senoo [3] compared the turbulent shear force theory with the momentum exchange theory using mathematical models and showed that the two theories were interchangeable. Badami and Mura [4] also proposed a theoretical model of a regenerative blower utilizing two components: a tangential component, which determines the effective flow rate, and a meridional component that determines the circulatory flow rate.
Parametric designs of regenerative pumps have been performed to enhance pump performance using design parameters obtained by experimental measurements and numerical simulations. Shimosaka and Yamazaki [5] carried out experiments on a regenerative pump by introducing design parameters: the dimension of the flow channel, and the impeller clearance. They showed that allowable clearance is decided by the dimension of the flow channel and pump performance depends on a combination of blade length, thickness, and channel dimension. Kanase et al. [6] performed an experimental and numerical analysis to identify the effects of the geometric parameters in the performance of a regenerative pump. They showed that higher pump efficiency can be obtained by the optimal selection of the number of blades and the chevron angle of those blades. Nejadrajabali et al. [7] found that a regenerative pump with symmetric angles and forward-facing blades have better performance than radial blades under design flow conditions. Pei et al. [8] analyzed the effects of the wrapping angles of a regenerative pump on the rise in pump pressure and efficiency. They showed that the size of the wrapping angle has a significant effect on the pump pressure rise while the pump efficiency increases slightly. Choi et al. [9] performed an experimental study on the effect of the blade angle of a regenerative pump. Using a 10-blade configuration, with 7 inclined blade angles and 3 chevron angles, it was found that the radial blades and the chevron blades with an angle of approximately 30 degrees impart a comparatively high pump efficiency.
With the rapid development of computing processes over recent decades, the optimal design method using computational fluid dynamics has been introduced to improve the performance of regenerative blowers and pumps. The optimal design method coupled with computational fluid dynamics is promising and can effectively improve the performance of turbomachinery. Wang and Choi [10] studied the effects of the impeller blade angles and the hub configurations on the efficiency of regenerative blowers by introducing the optimal design method. The results showed that the shape of a hub has a greater effect on the pump efficiency than the outflow angles of blades. Jang and Lee [11] introduced an optimal design for a regenerative blower using the RSM (responses surface method) and numerical simulation. They selected two design variables, the extension angle and the number of impeller blades, to enhance pressure and showed that the extension angle is more effective to increase blower efficiency. Heo et al. [12] performed the optimization of a regenerative blower using a hybrid MOEA (multi-objective evolutionary algorithm) and RBNN (radial basis neural network) surrogate modeling to improve the blower efficiency under design flow condition. They reported that the blower efficiency successively increases by reducing locally high-velocity regions generated inside the blades using three design variables: the blade height, the blade width and the angles between the inlet and outlet ports. Jeon et al. [13] studied the performance of regenerative pumps to increase pump efficiency using the optimal design method and the RSM with two design variables, which were the impeller upper blade height, and the hub height. They showed that the hub height is more effective than the upper blade height to increase pump efficiency. As described above, all of the research on the regenerative blowers and the pump are conducted with the blades having a cantilever shape. Therefore, the microbubble pump which operates at high pressure by mixing the air and water is required to be more structurally robust and to have the optimum design with high efficiency.
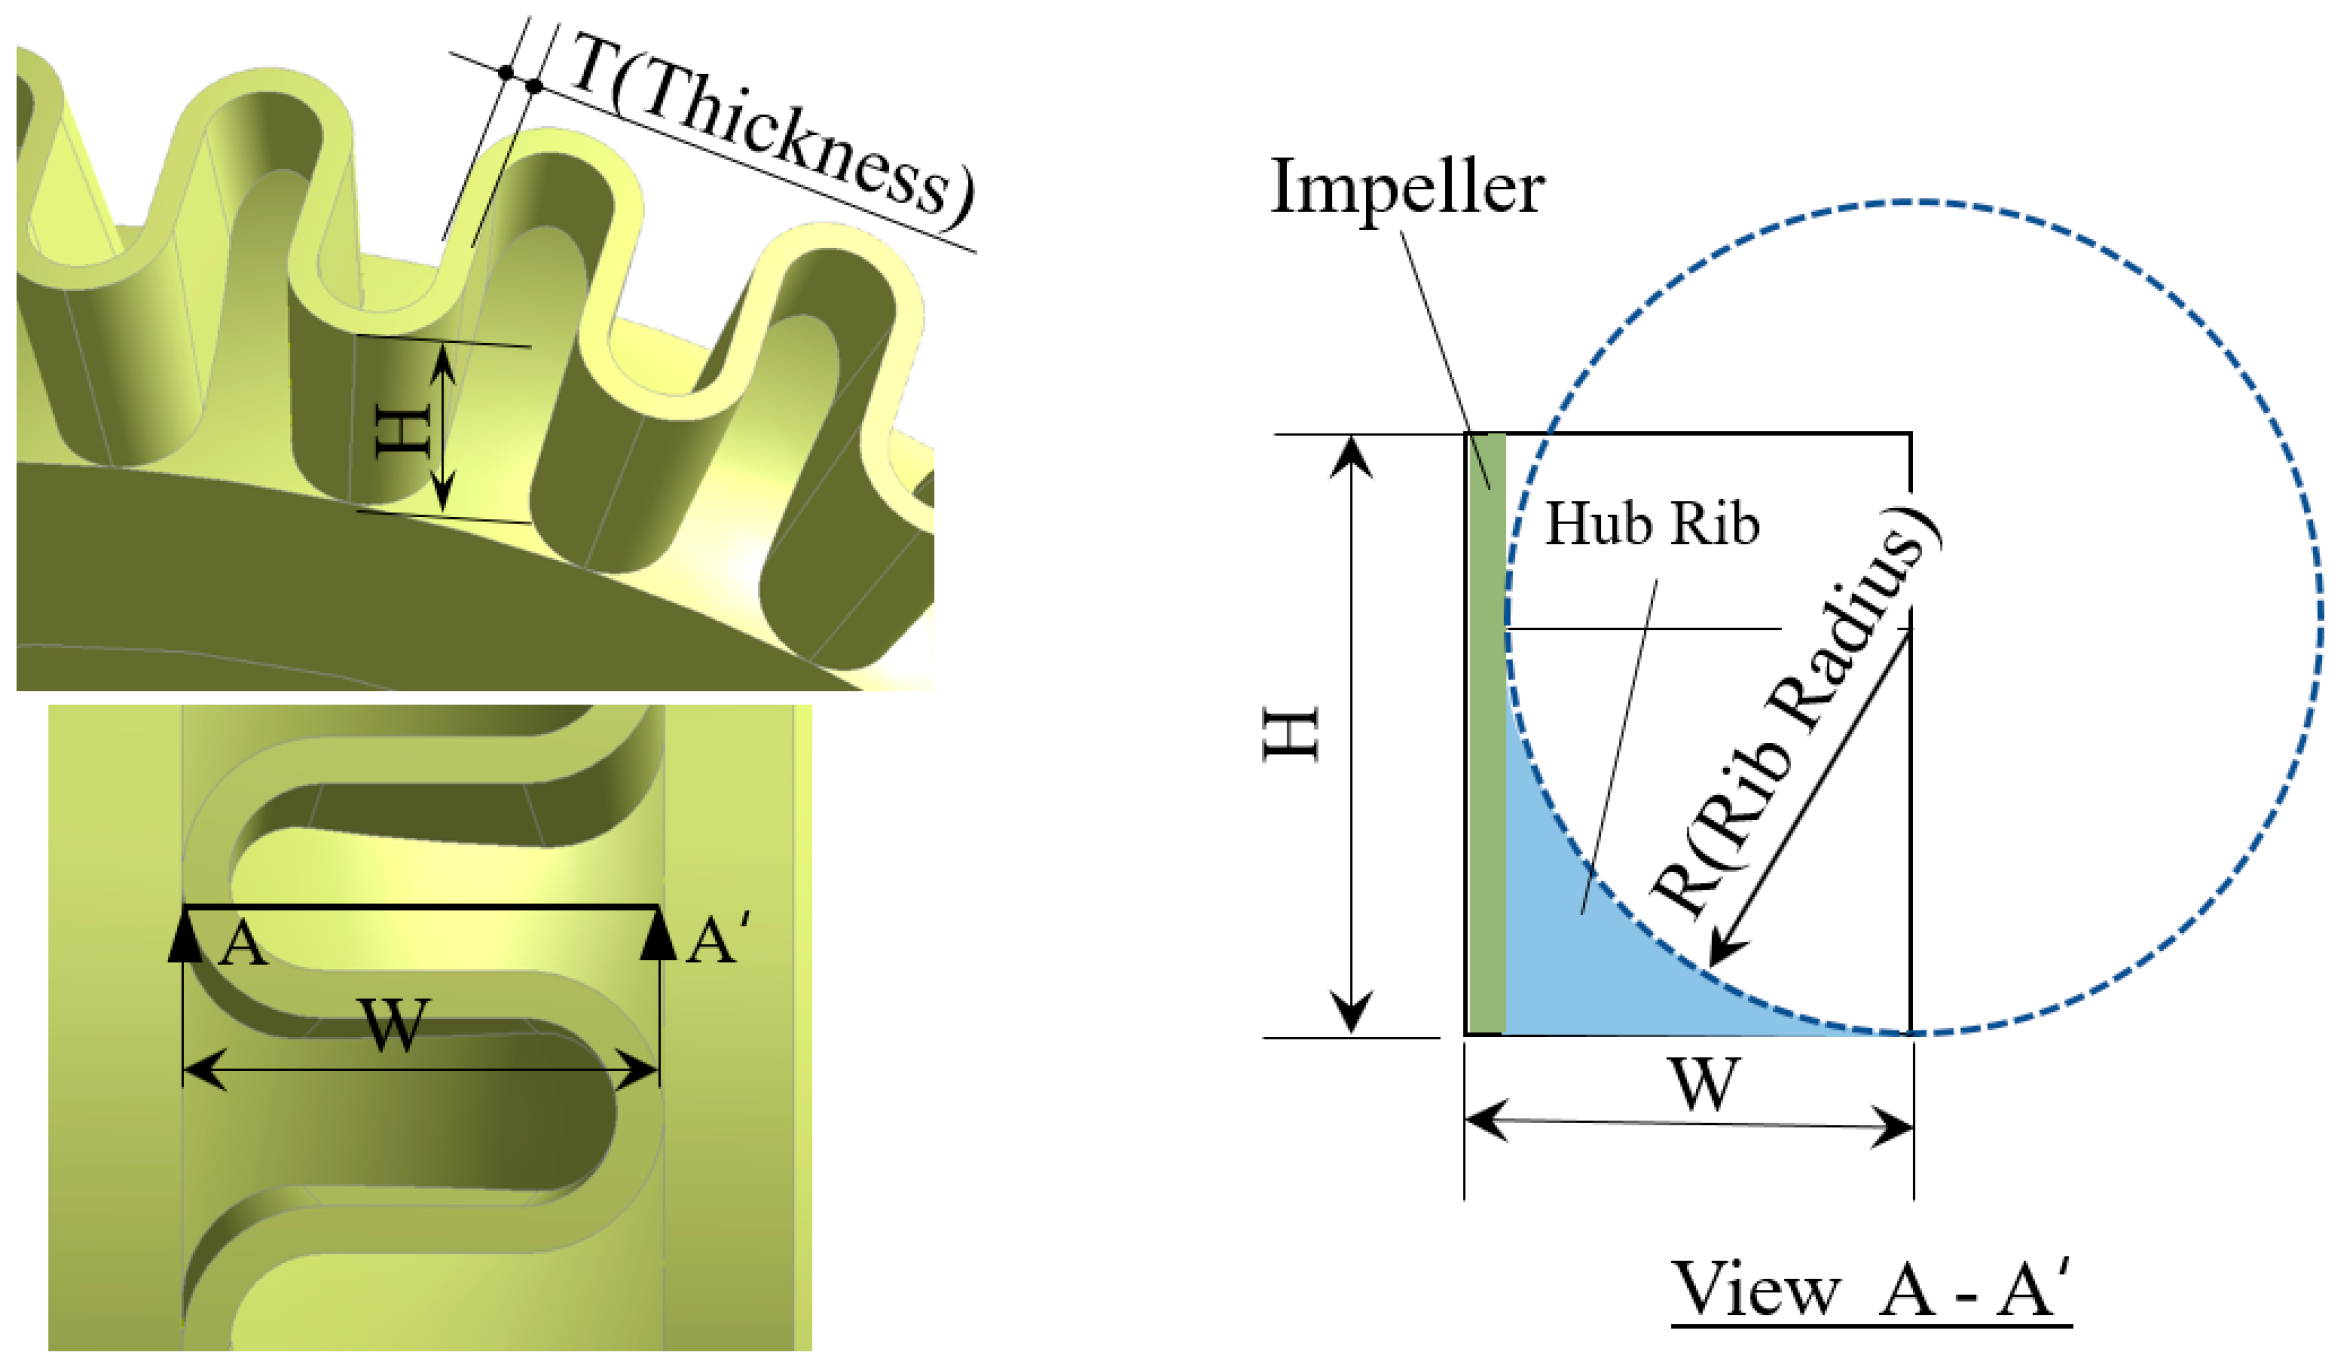
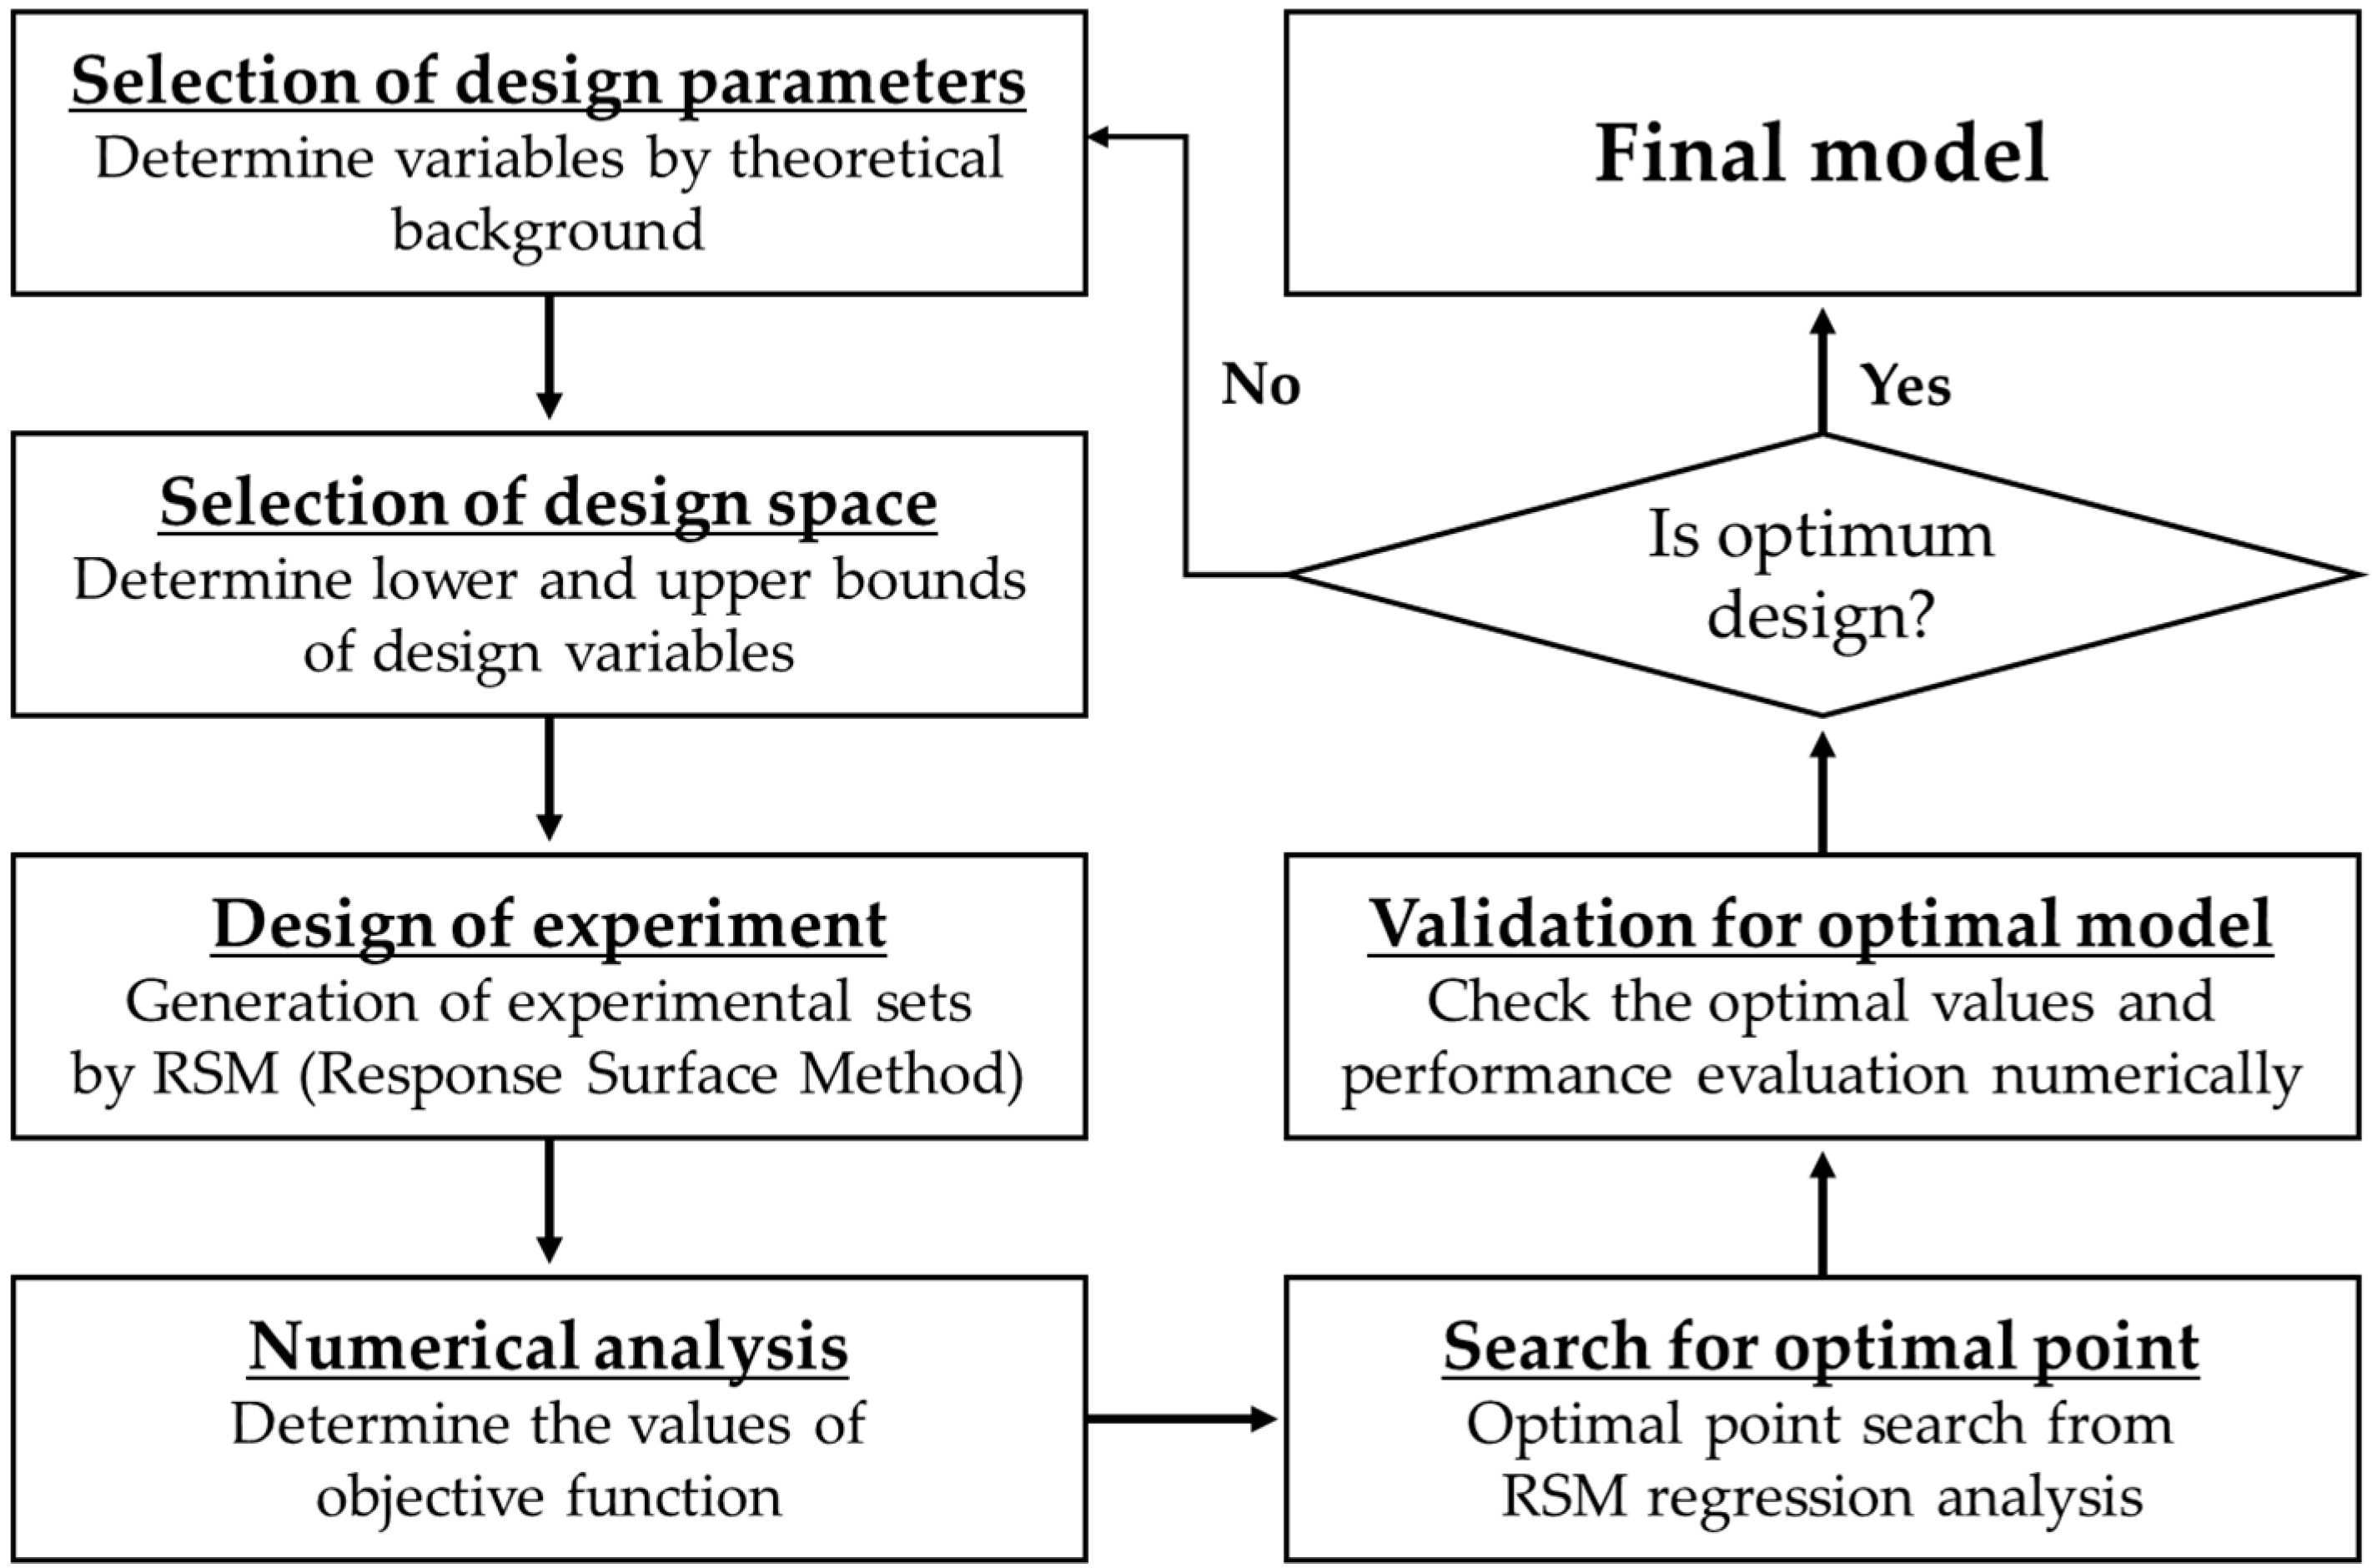
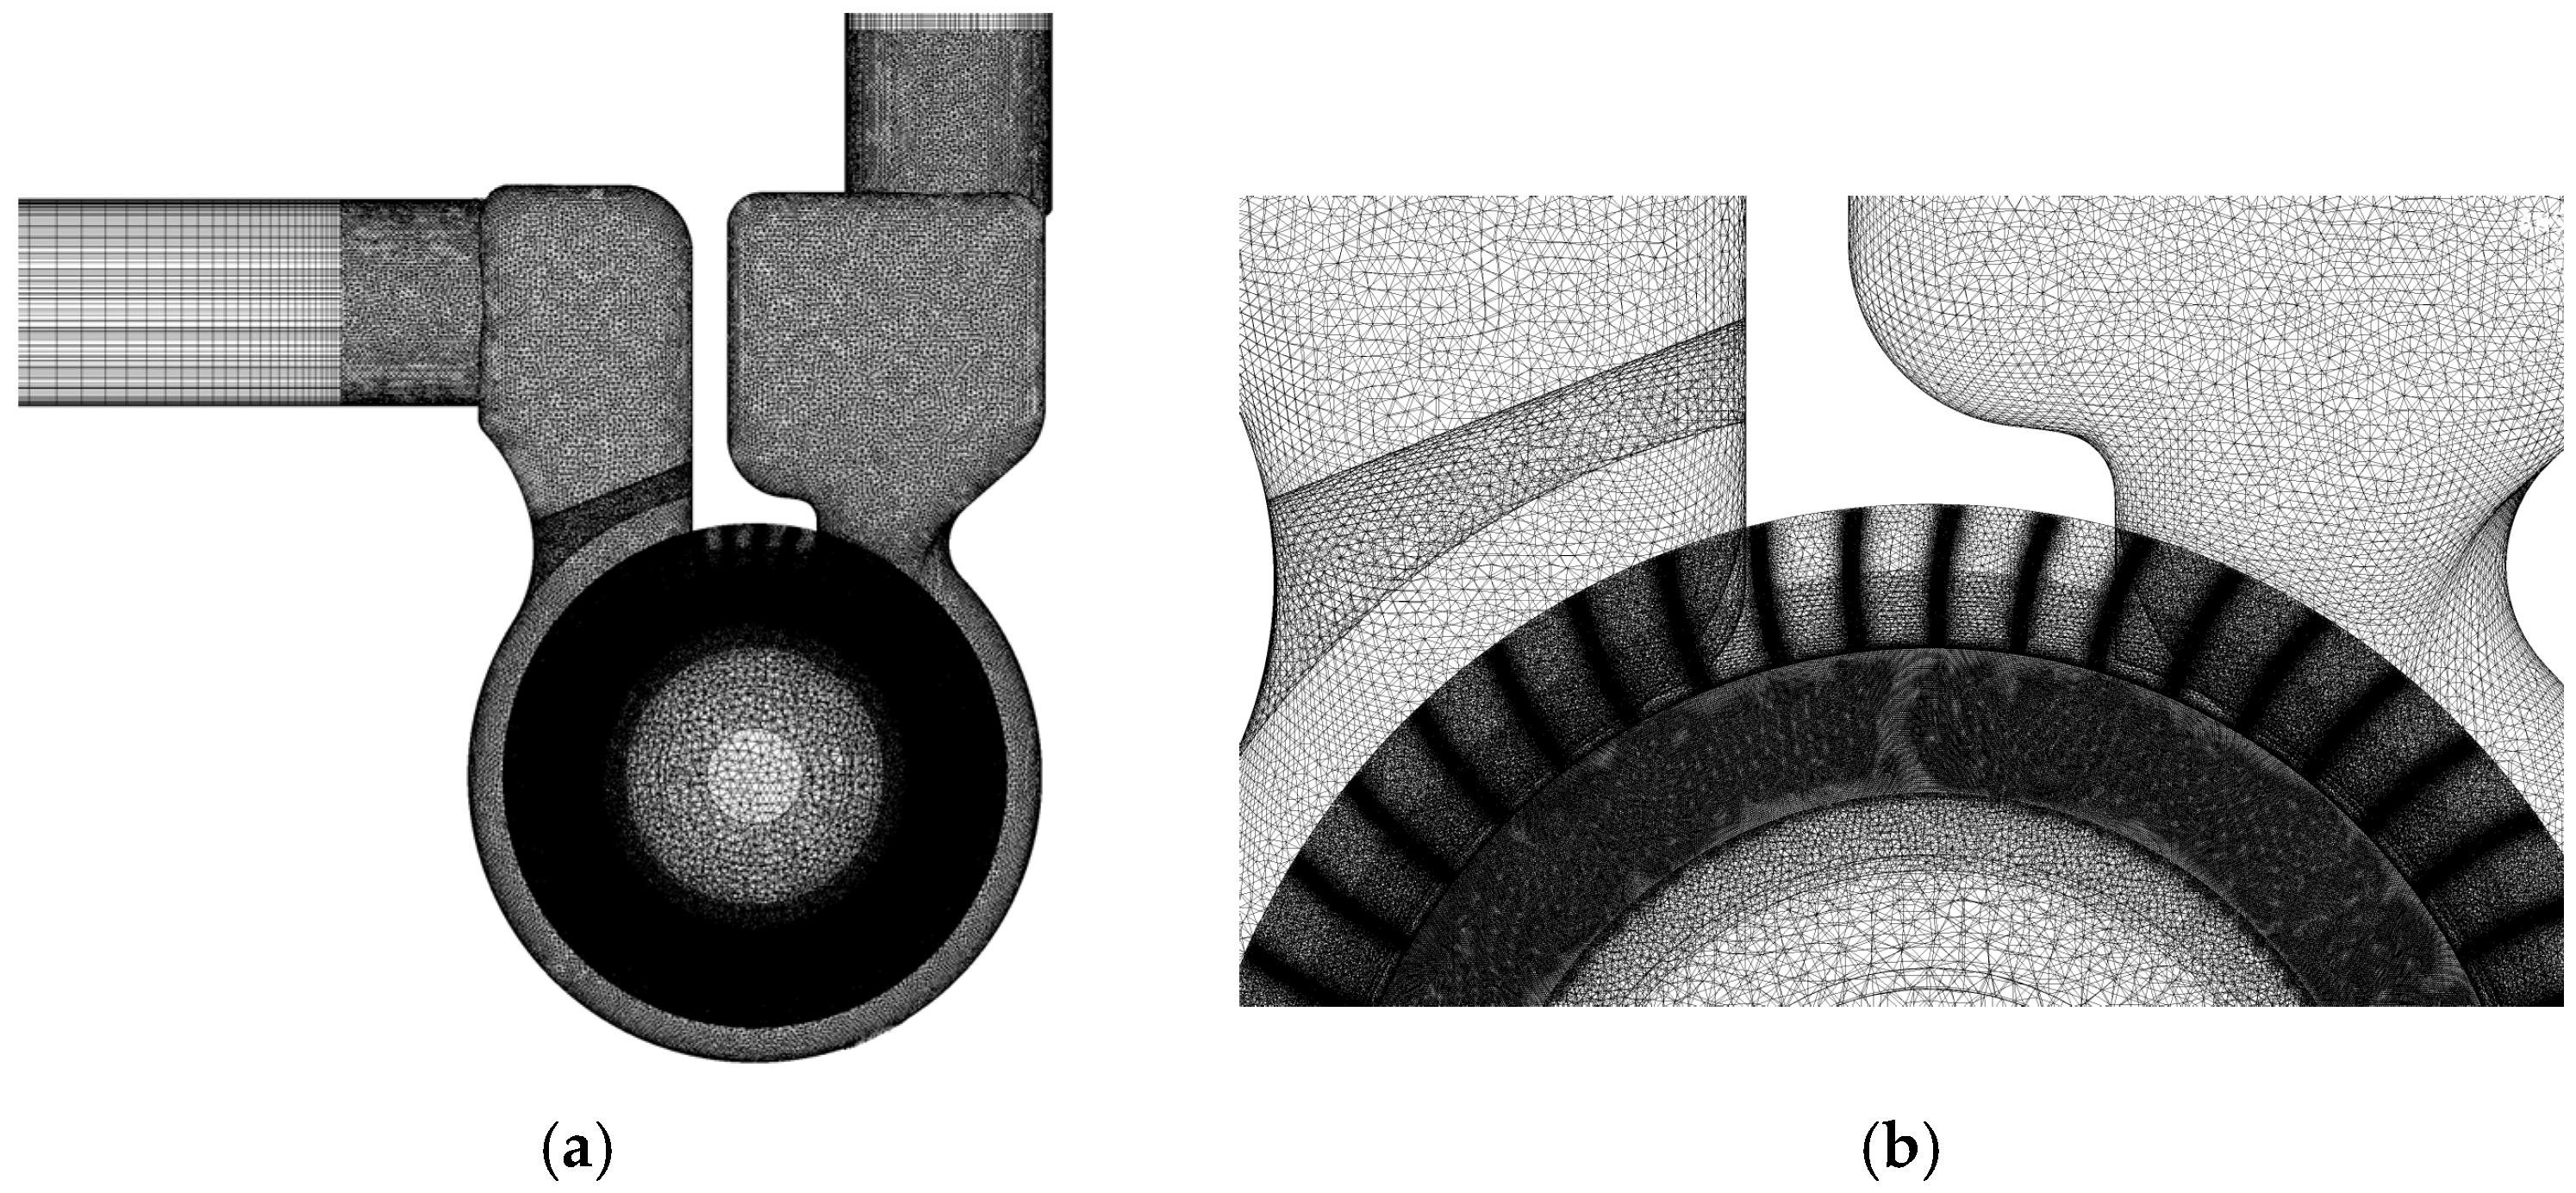
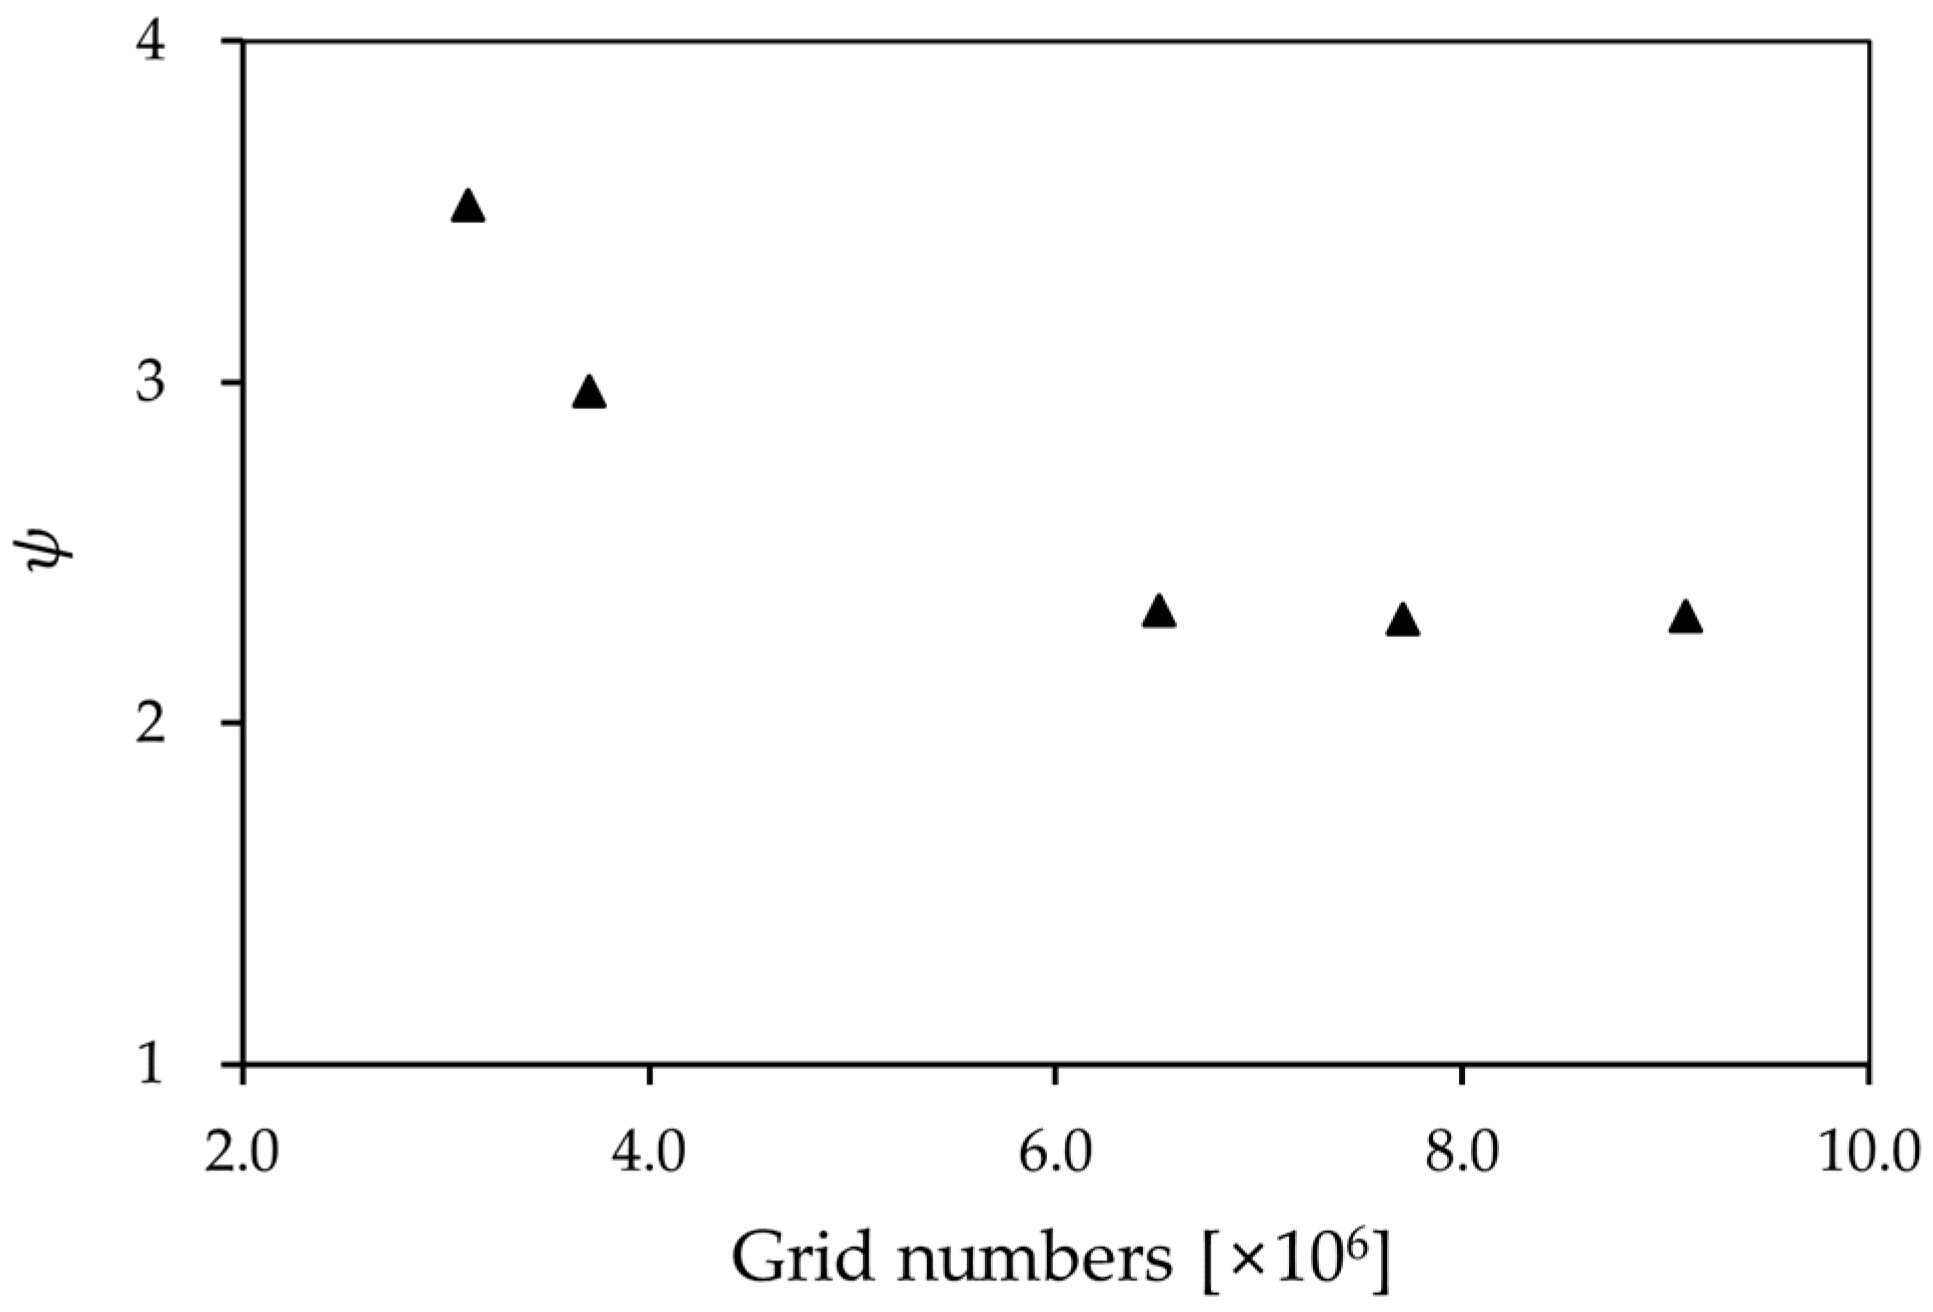
In the present study, the optimization of the impeller blades used for a microbubble pump was performed to obtain a higher efficiency pump using numerical simulations. A three-dimensional numerical simulation is introduced to analyze the internal flow and to predict the performance of the pump. The SST turbulence model is employed to estimate the eddy viscosity. For the optimal design of the pump impeller blades, the response surface method is adopted with three design variables: the number of blades, the blade thickness and the radius of the hub rib. An experimental apparatus was designed and fabricated to verify the computational results. The pump efficiency is selected as an objective function in the present study. Comparisons of internal flow and the performance of the reference and optimal pumps are also investigated and discussed in detail.

2. Microbubble Pump with Novel ‘S-shape’ Impeller

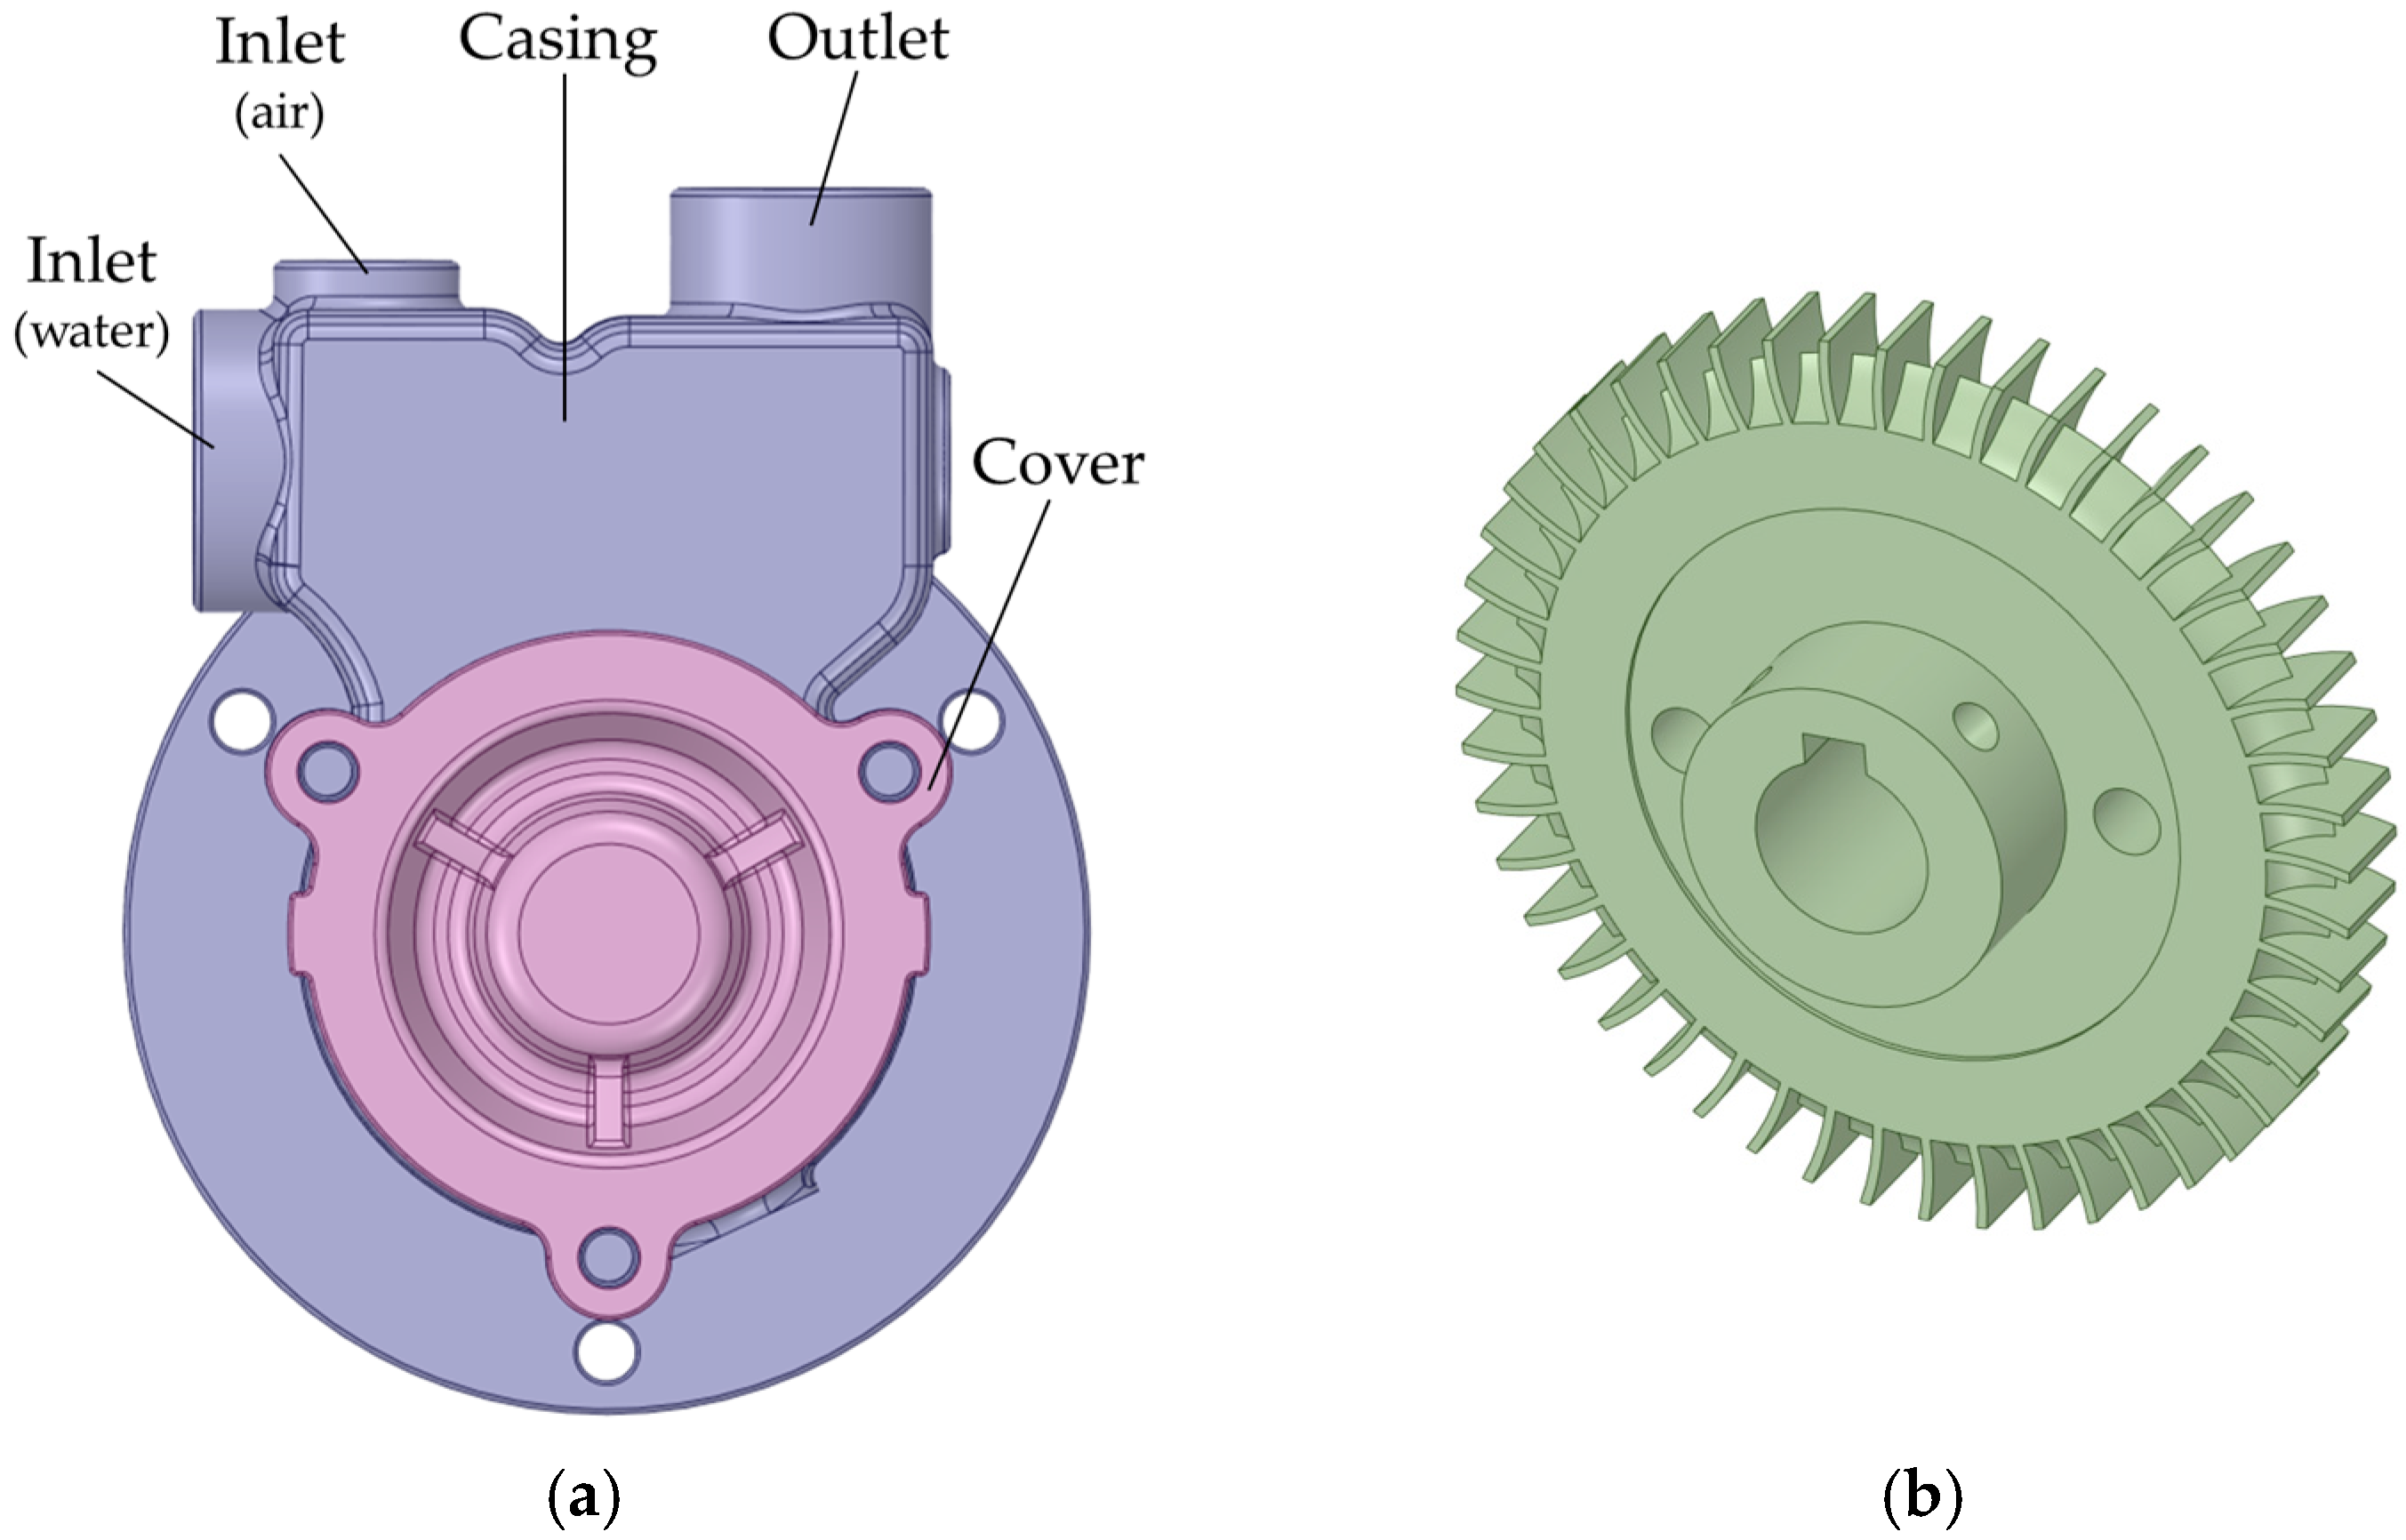
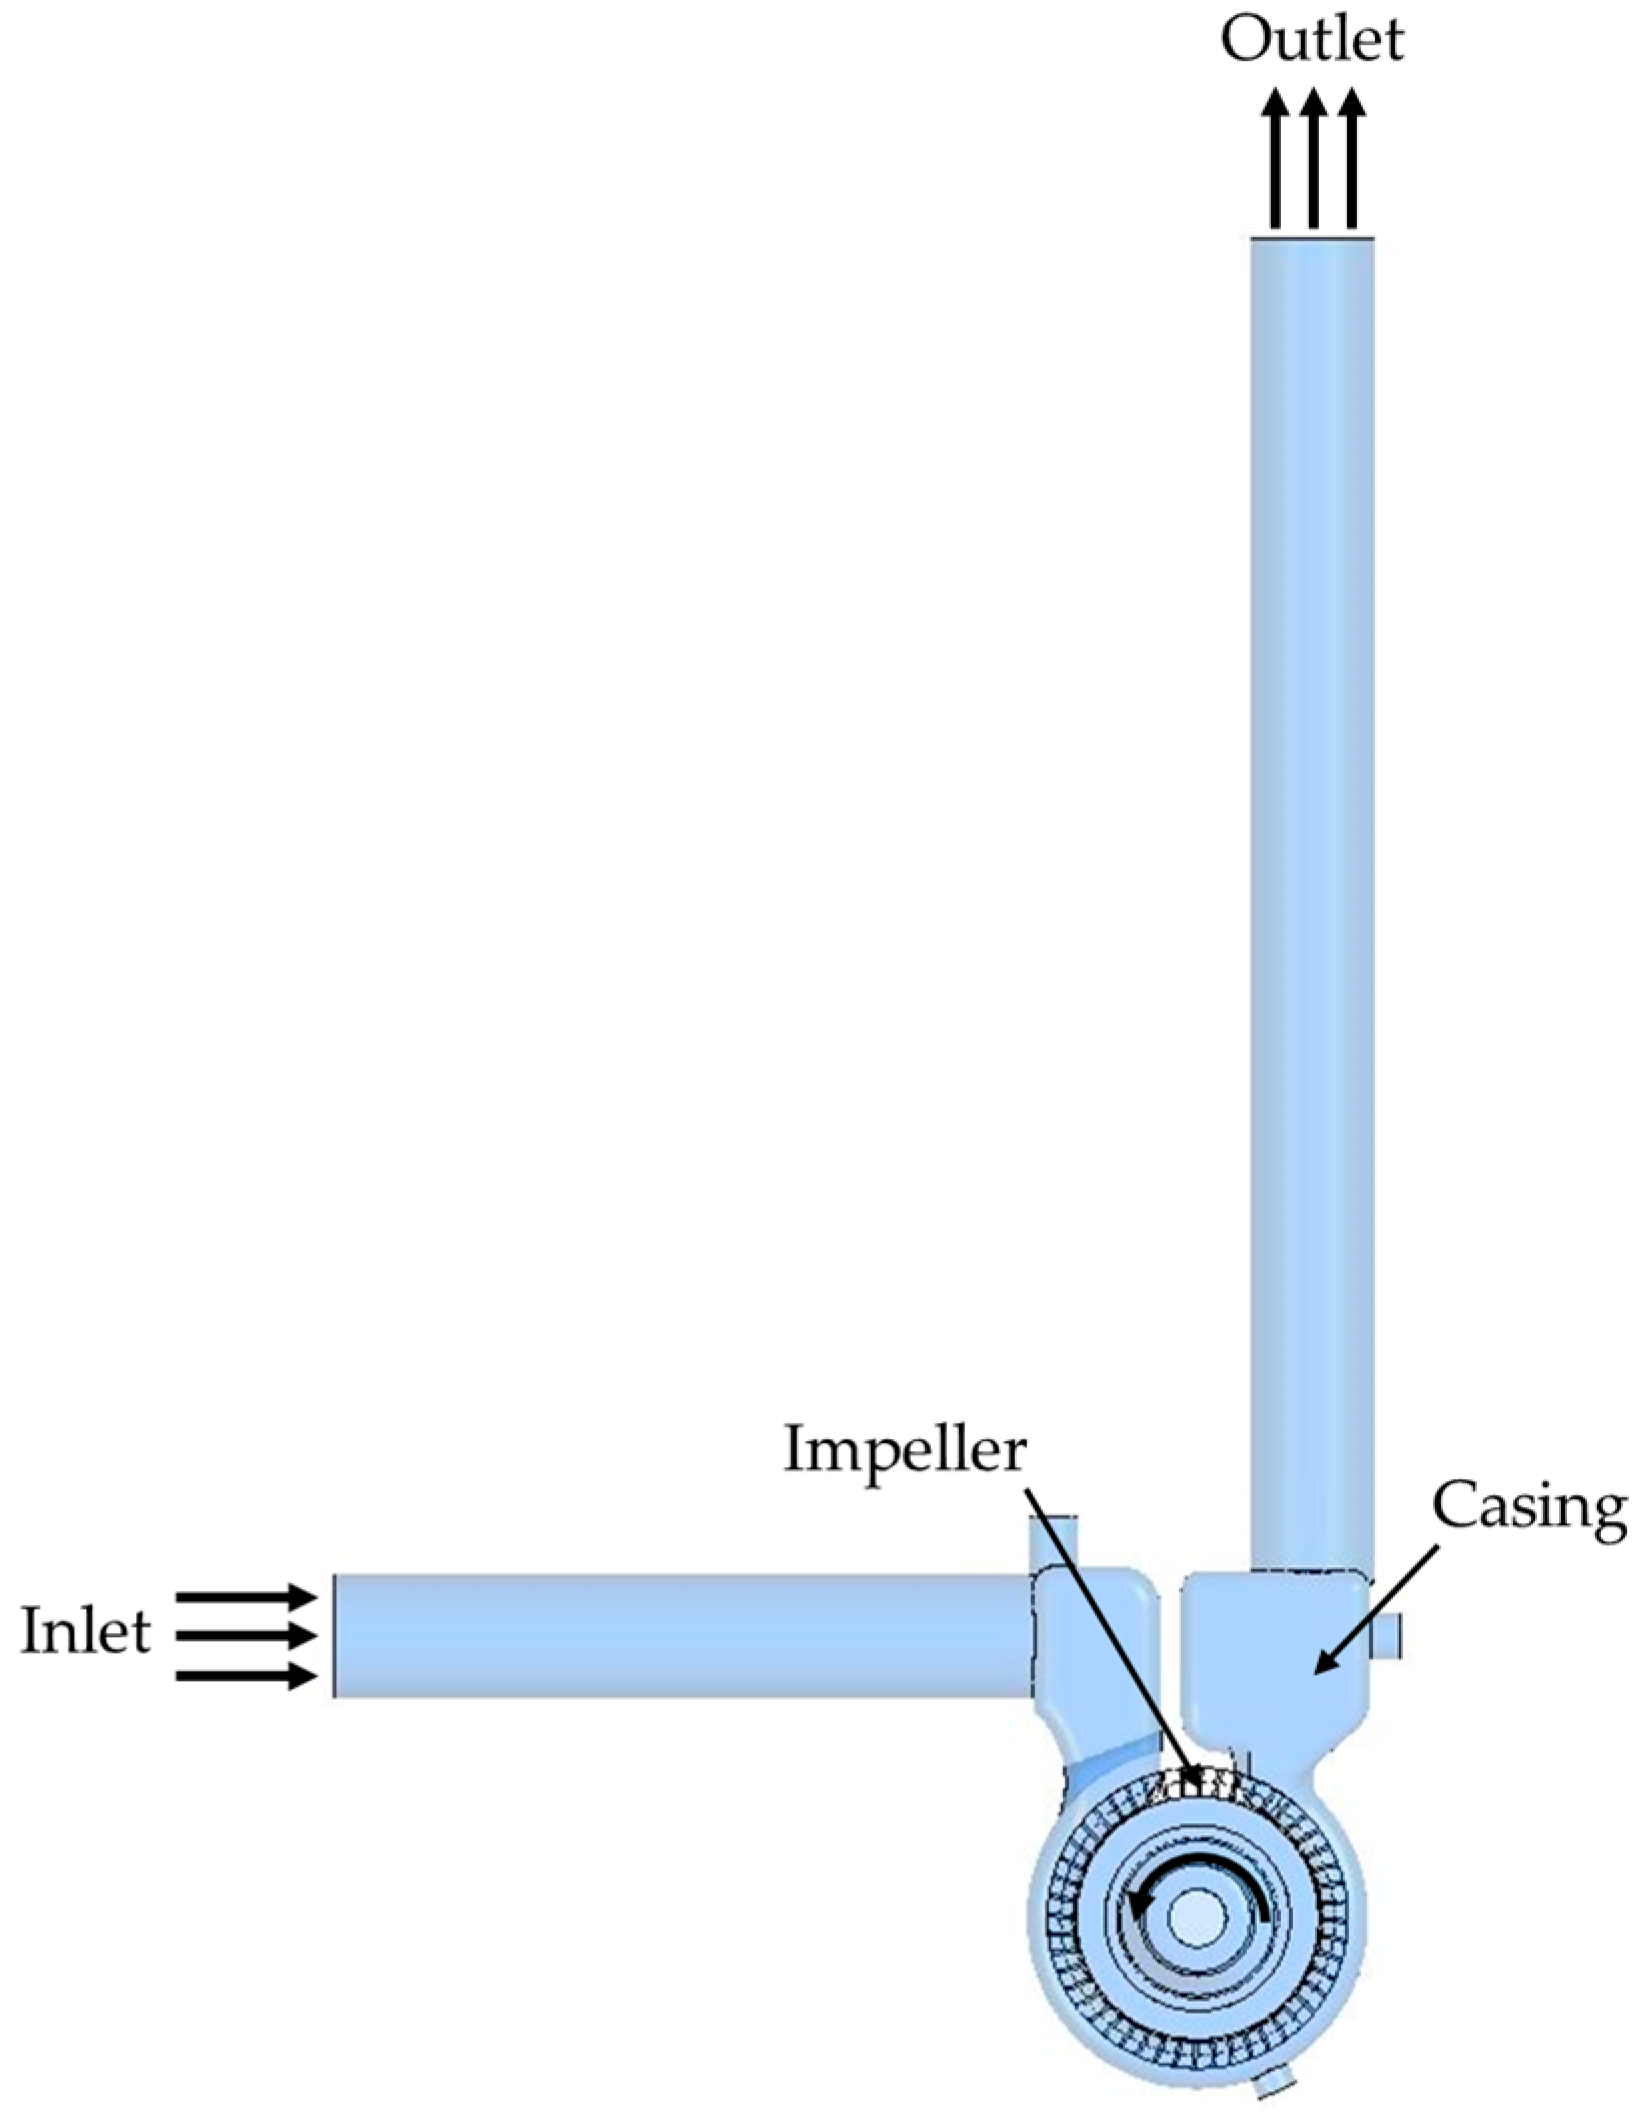
A reference microbubble pump is a fluid machine that produces microbubbles by mixing air and water inside the pump, which has a regenerative impeller, as shown in Figure 1. The pump has the capacity of 1.1 kW and consists of a regenerative impeller, two inlets, one each for water and air, a casing, a cover, and an outlet. The specifications of the pump under operating conditions are summarized in Table 1.
The flow coefficient ( ϕ ) and the pressure coefficient ( ψ ) of the pump are defined as
ϕ = Q A U t
ψ = 2 Δ p ρ U t 2
where Q is the volumetric flow rate of water, Δ p is the pressure rise, U t is the impeller tip speed, ρ is the density of water, and A is the cross-sectional area at the outlet duct of the pump.
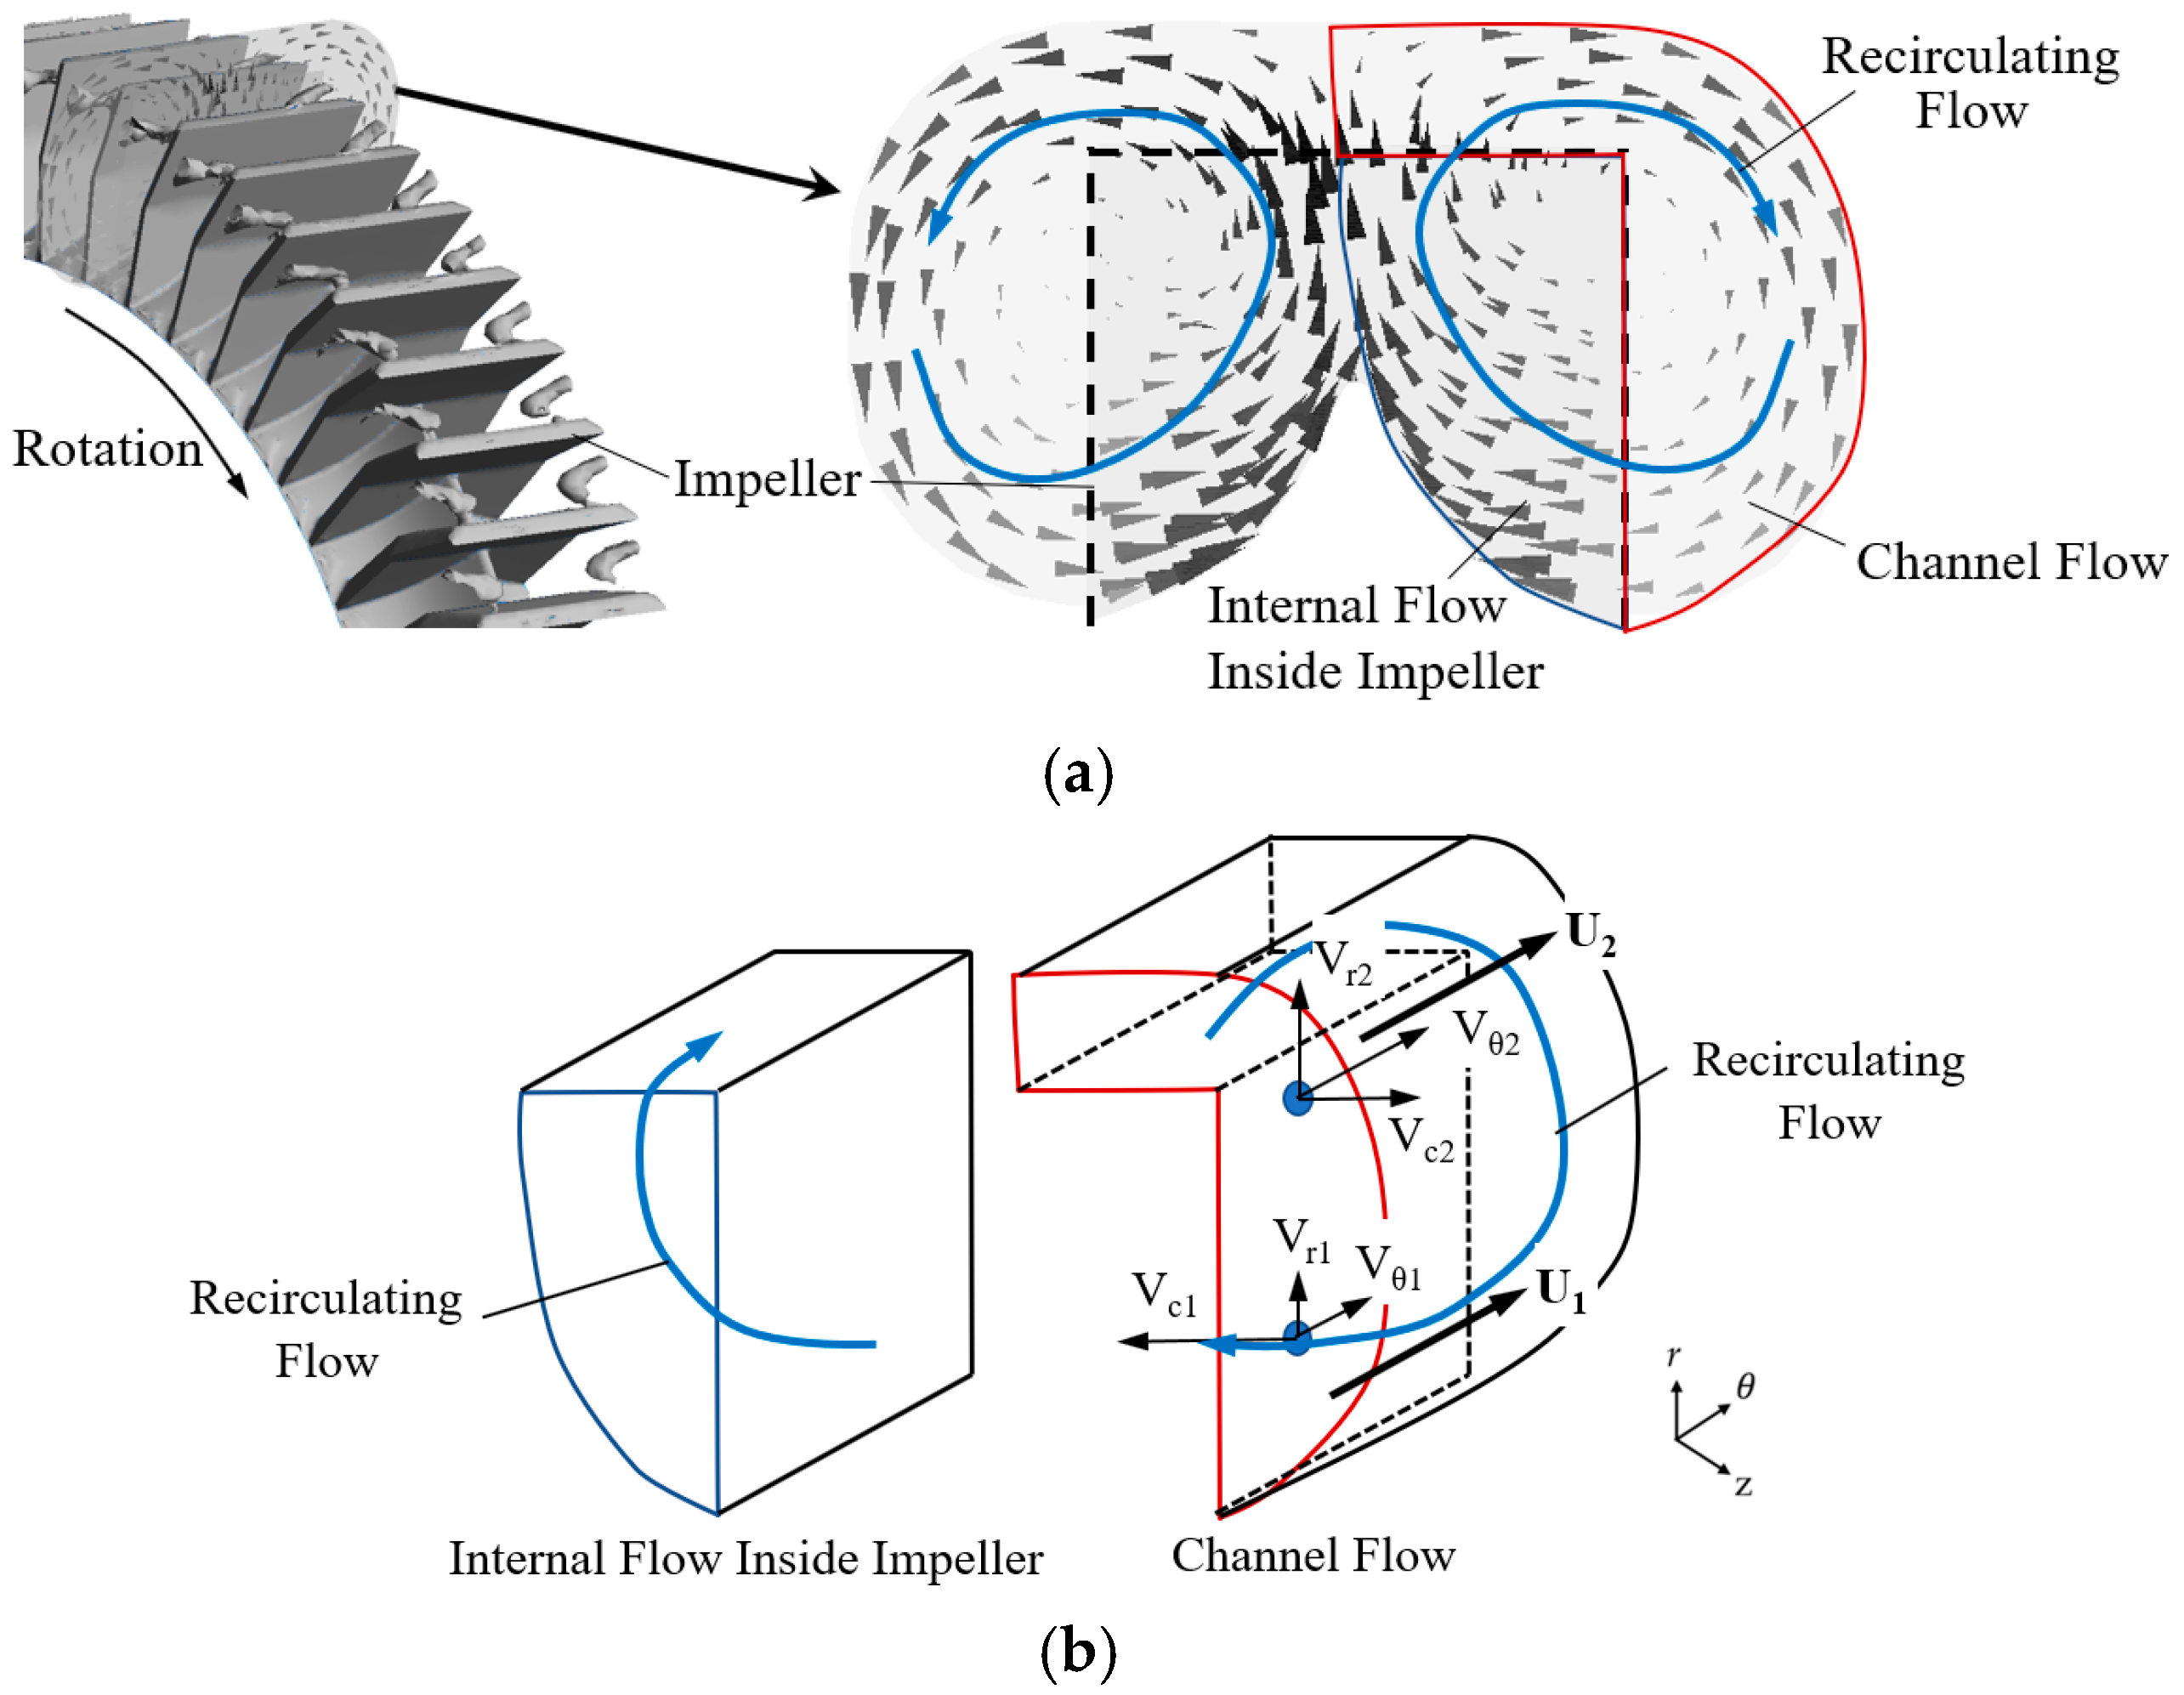
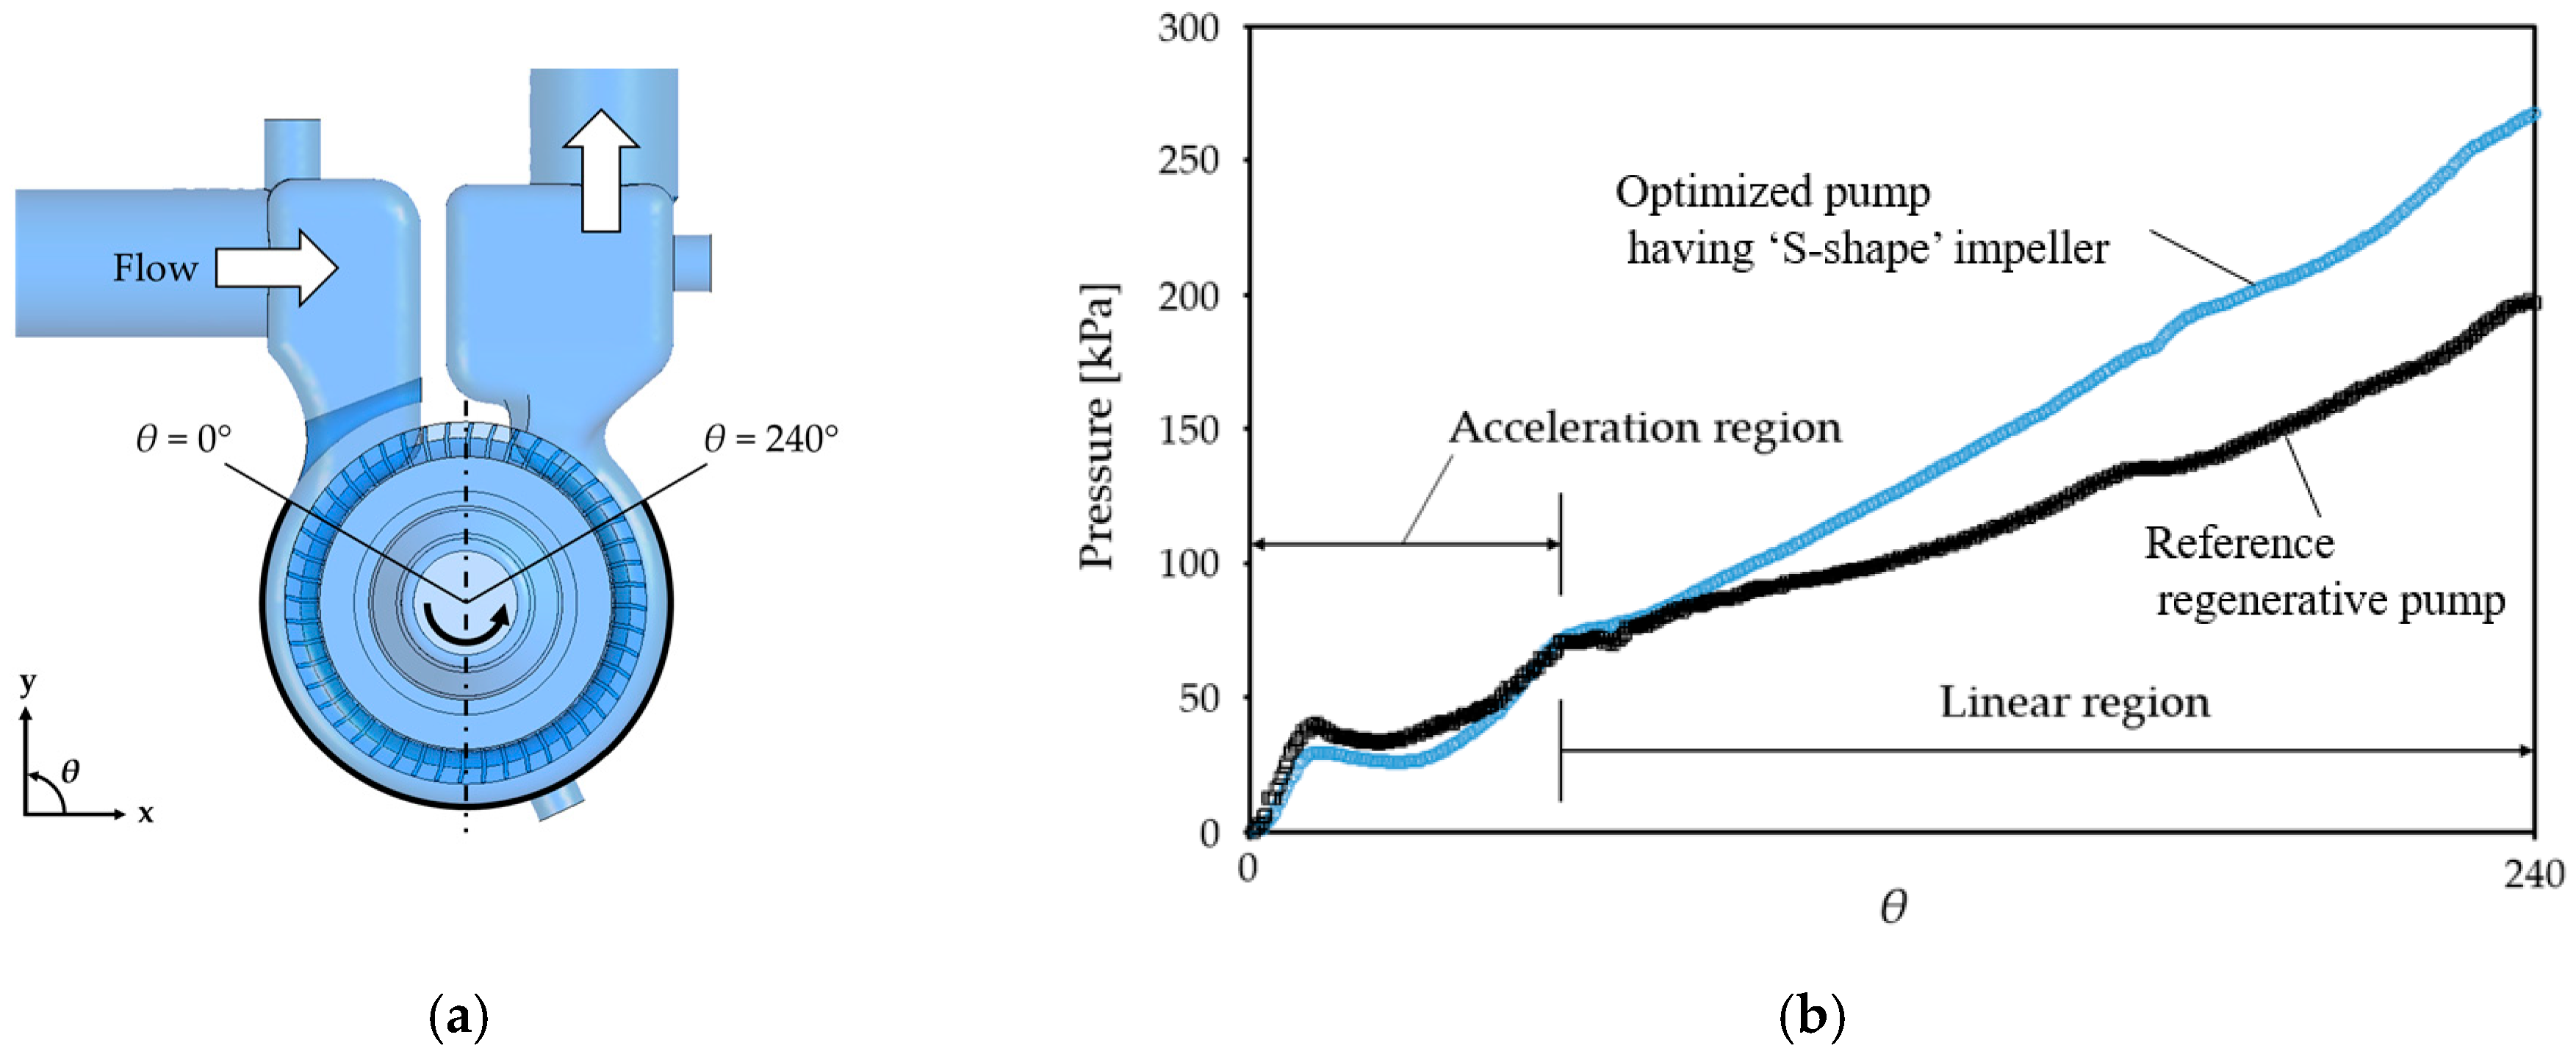
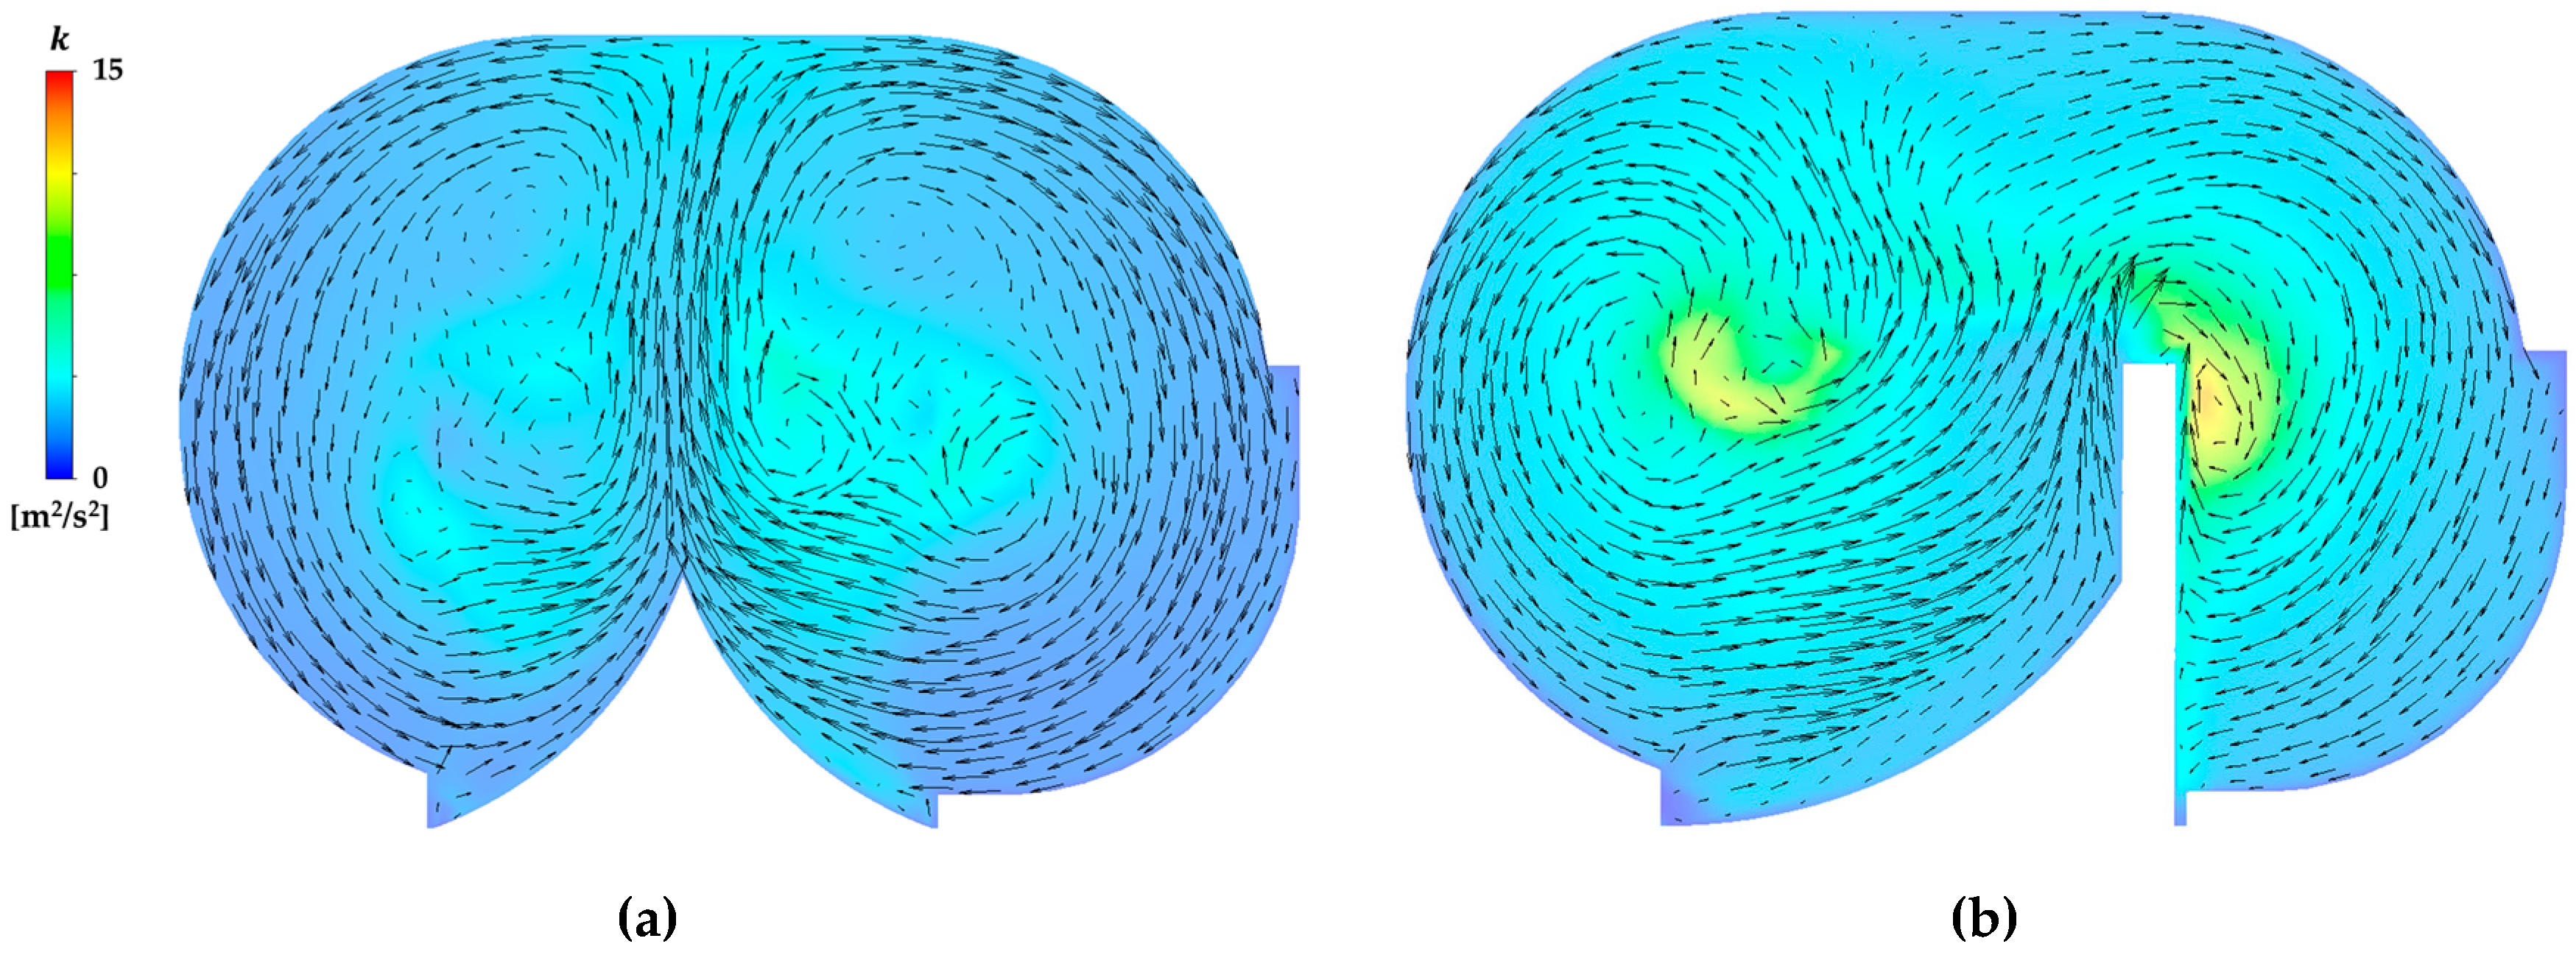
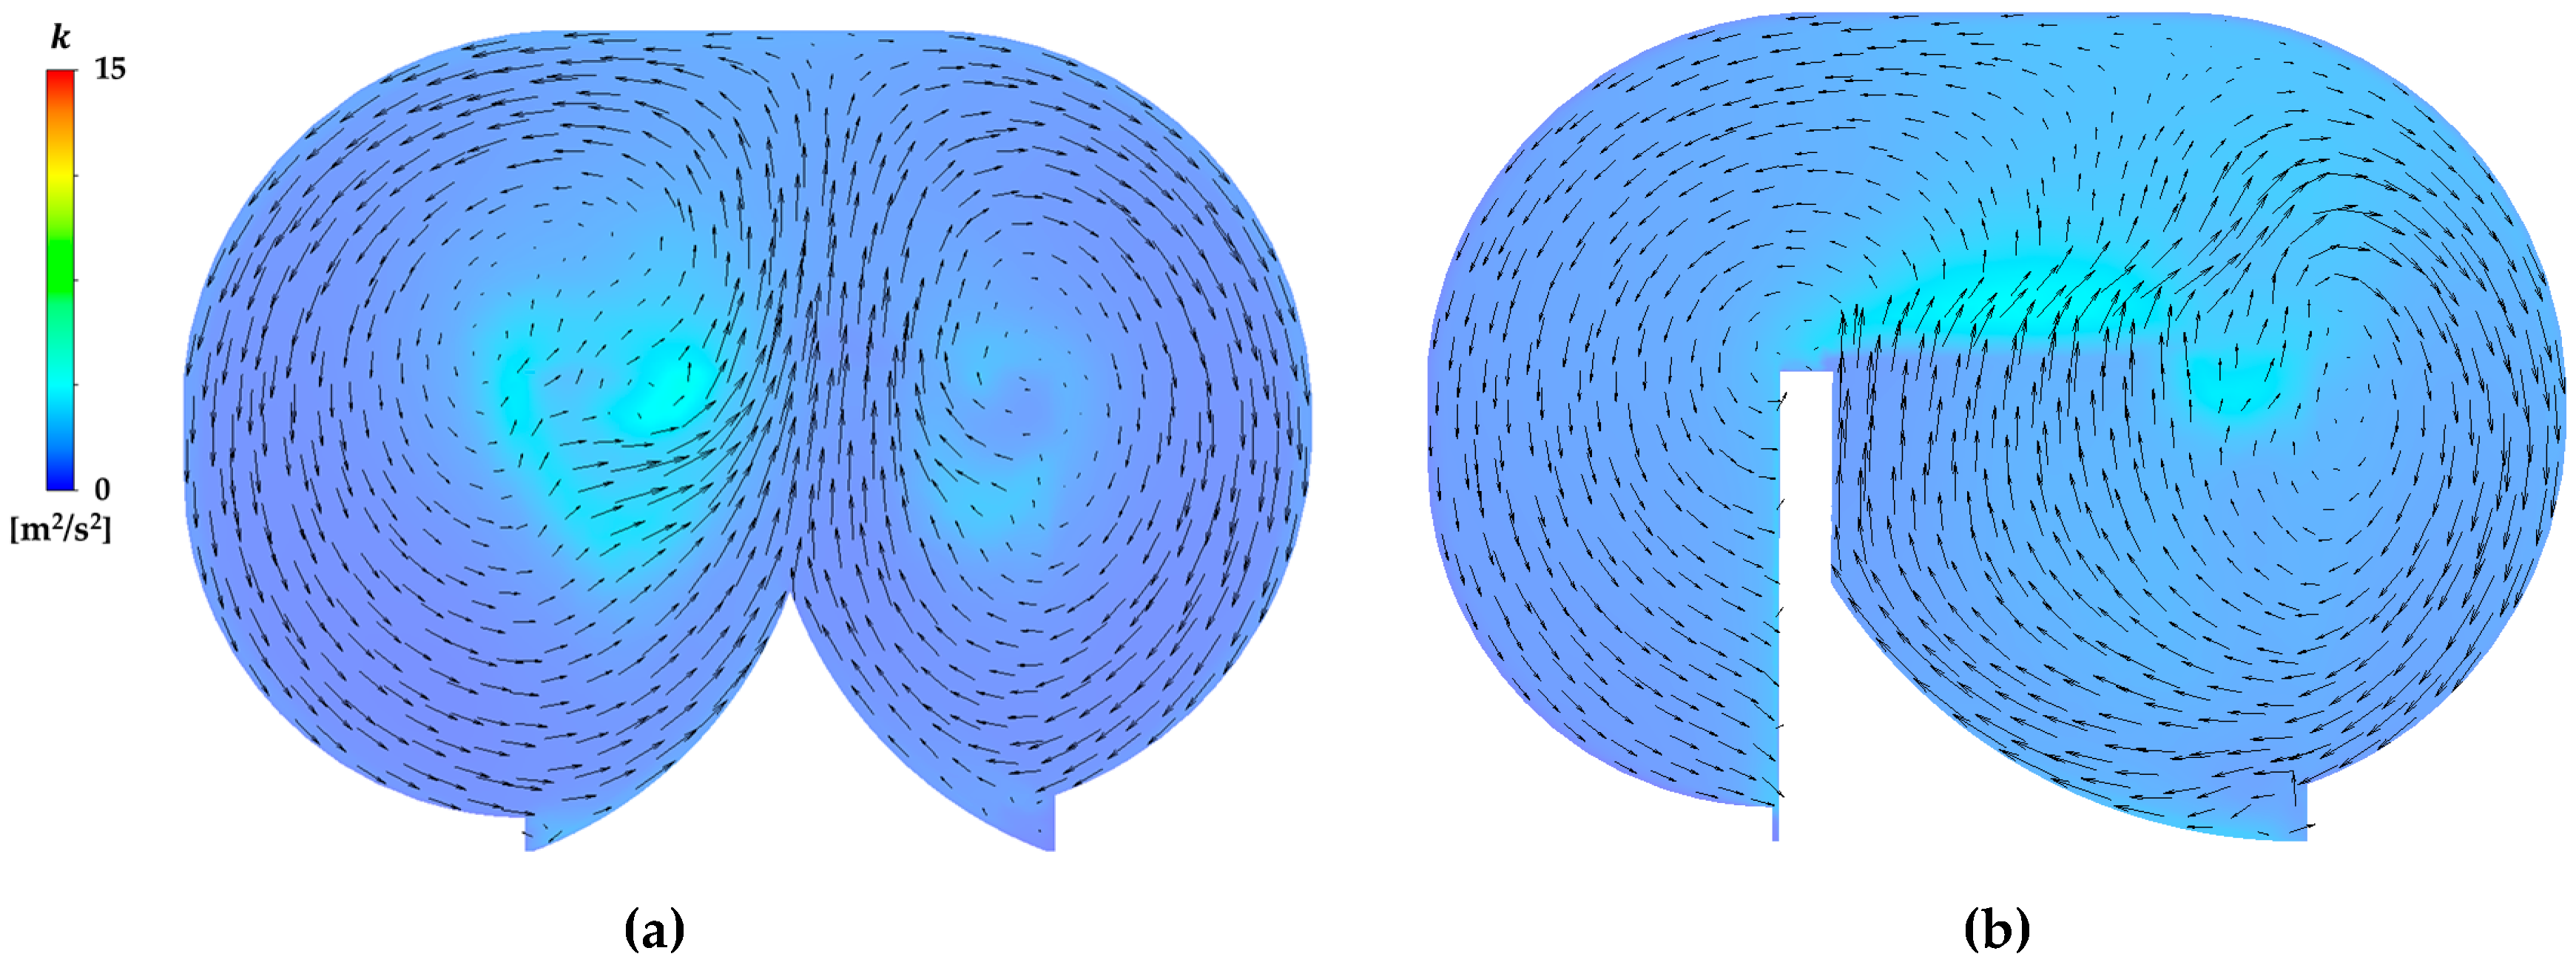
In regenerative pumps, such as the reference microbubble pump, Choi [14] described the flow inside the pump by dividing it into two aspects based on the momentum exchange theory proposed by Wilson [2]. First is through (or tangential) flow surrounded by the impeller, and the other is the recirculating flow formed inside an impeller, as shown in Figure 2. The recirculating flow passes through the impeller and the channel in centrifugal and centripetal directions, respectively. It is noted that the recirculating flow including the axial, radial and tangential components and is responsible for energy transport, which causes violent mixing between the internal flow inside impeller and the channel flow. Considering the momentum exchange, the Euler head for the average streamline radius of the recirculating flow due to the rotational speed of the fluid and the average tangential velocity due to the rotation of the impeller are expressed as Equation (3).
g h E = U 2 V θ 2 U 1 V θ 1
where g is the gravitational acceleration, h E is the Euler head, U is the average rotational velocity, and V θ is the average tangential velocity of the recirculating flow due to the rotation of the impeller.
In a typical turbomachine, the hydrodynamic power transmitted by the rotating impeller to the working fluid is derived by calculating the product of the recirculating flow and the Euler head. The major difference between a regenerative machine and an axial or centrifugal one is that the hydraulic power of the centrifugal or axial machine is determined by the total flow rate while the regenerative type power is determined by the recirculating flow rate.
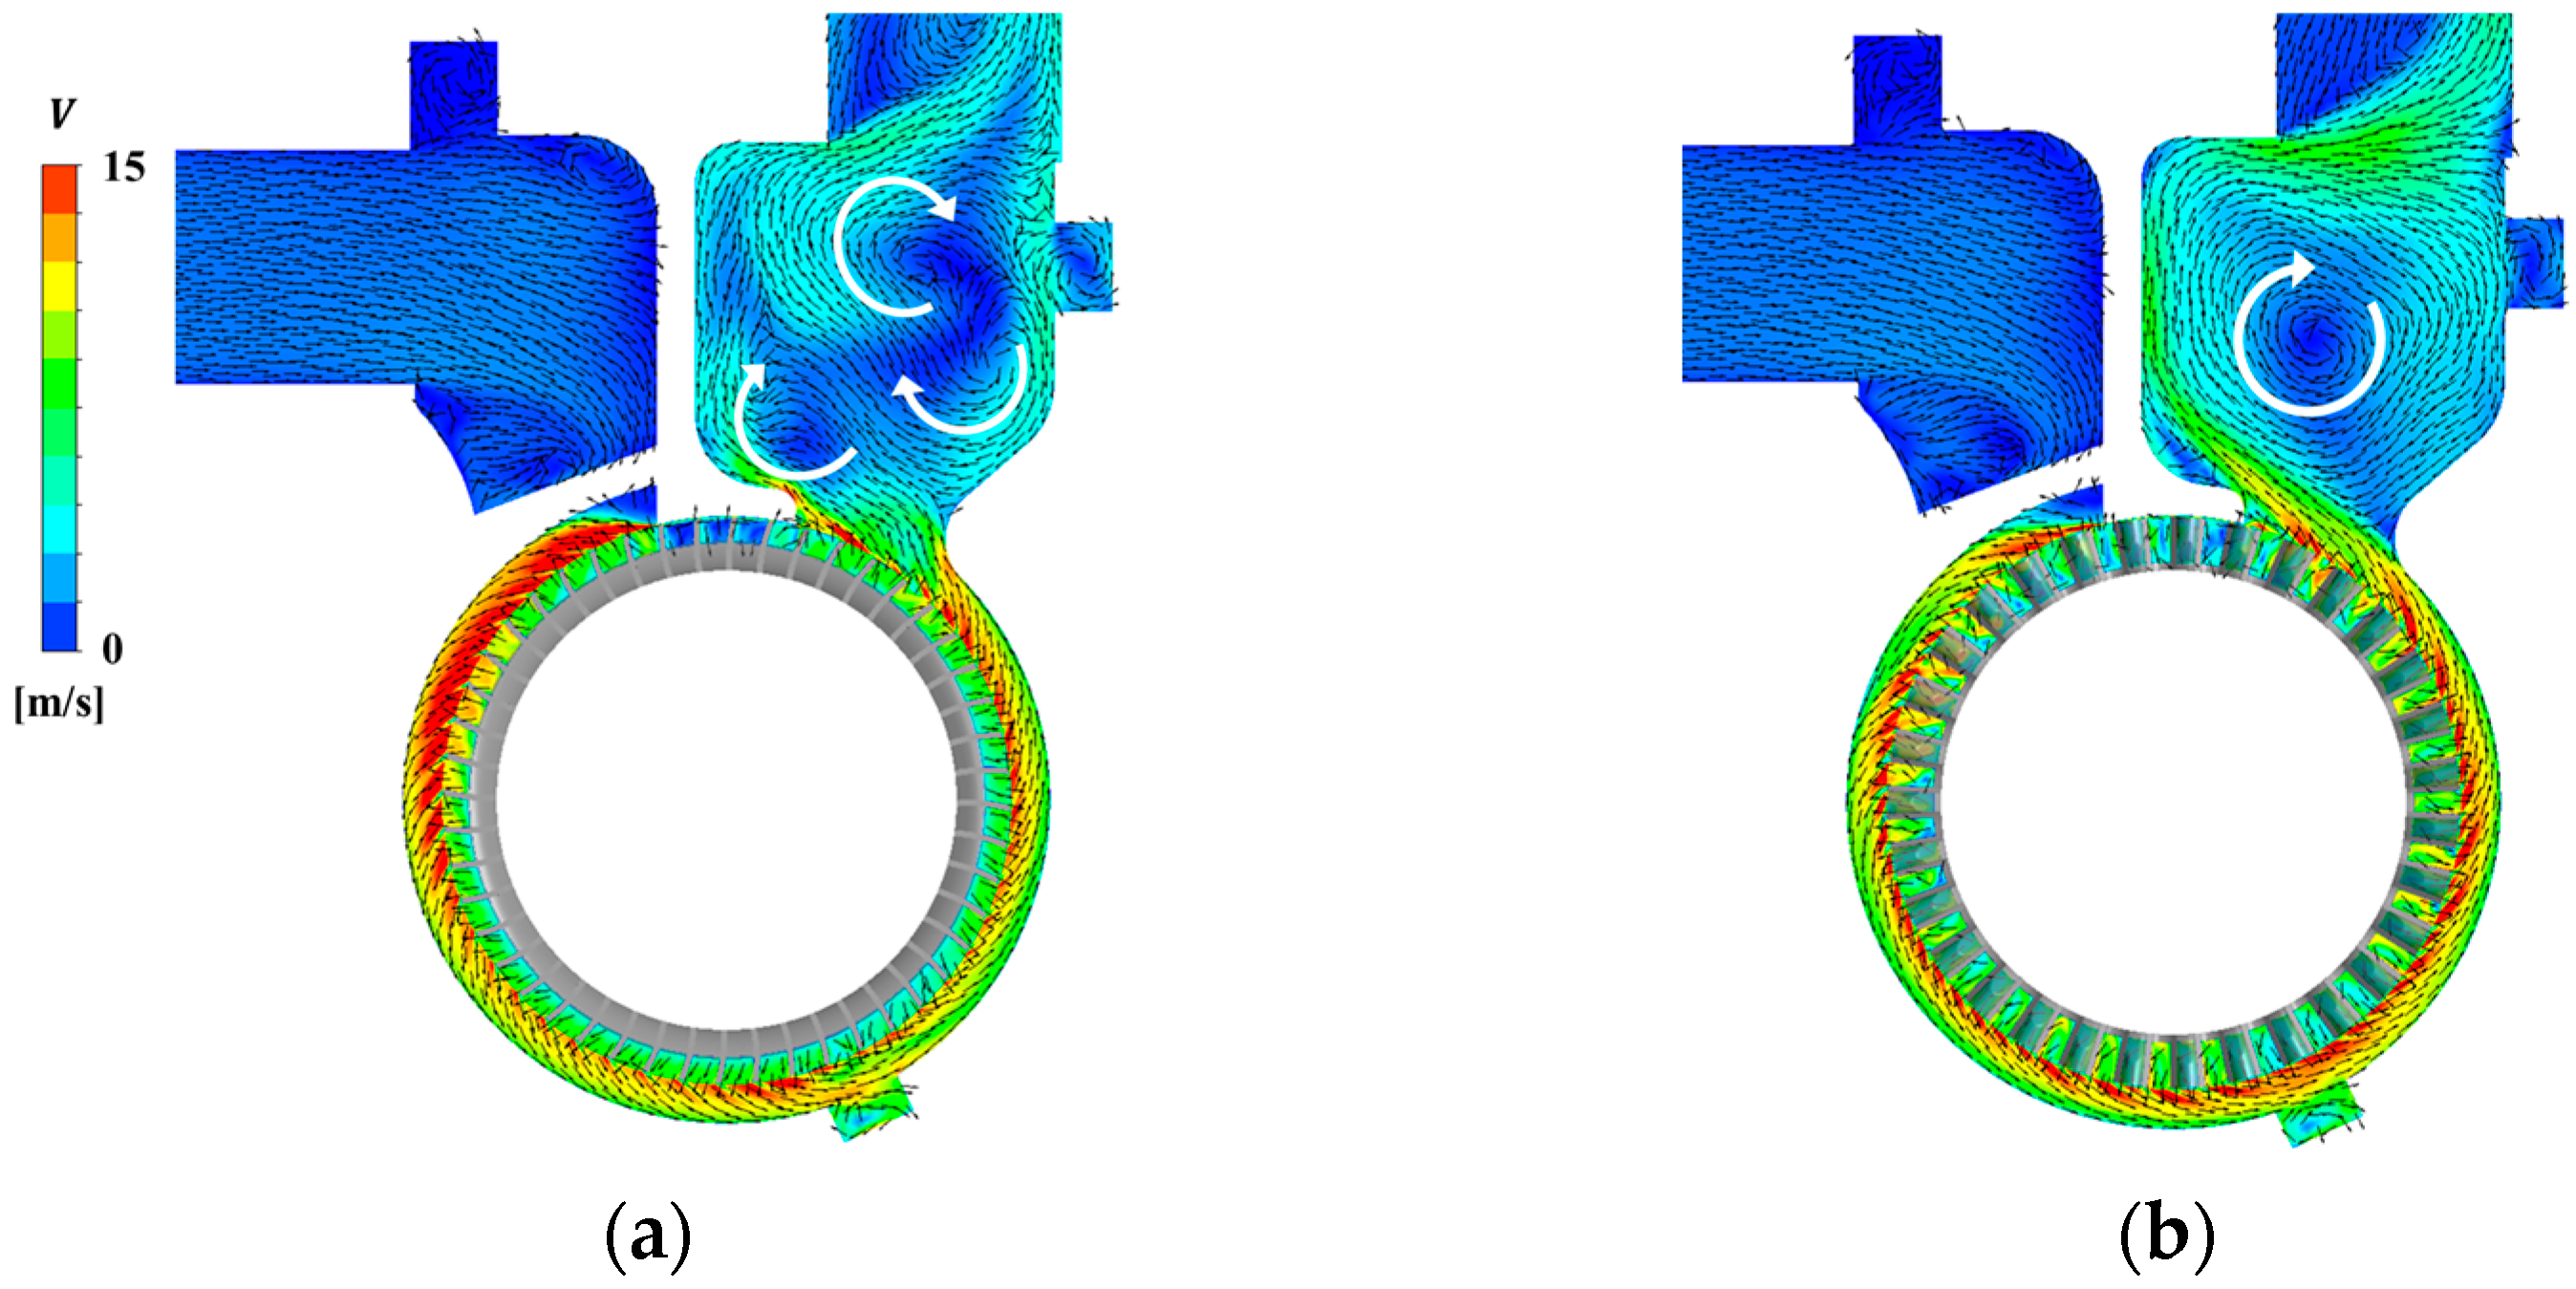
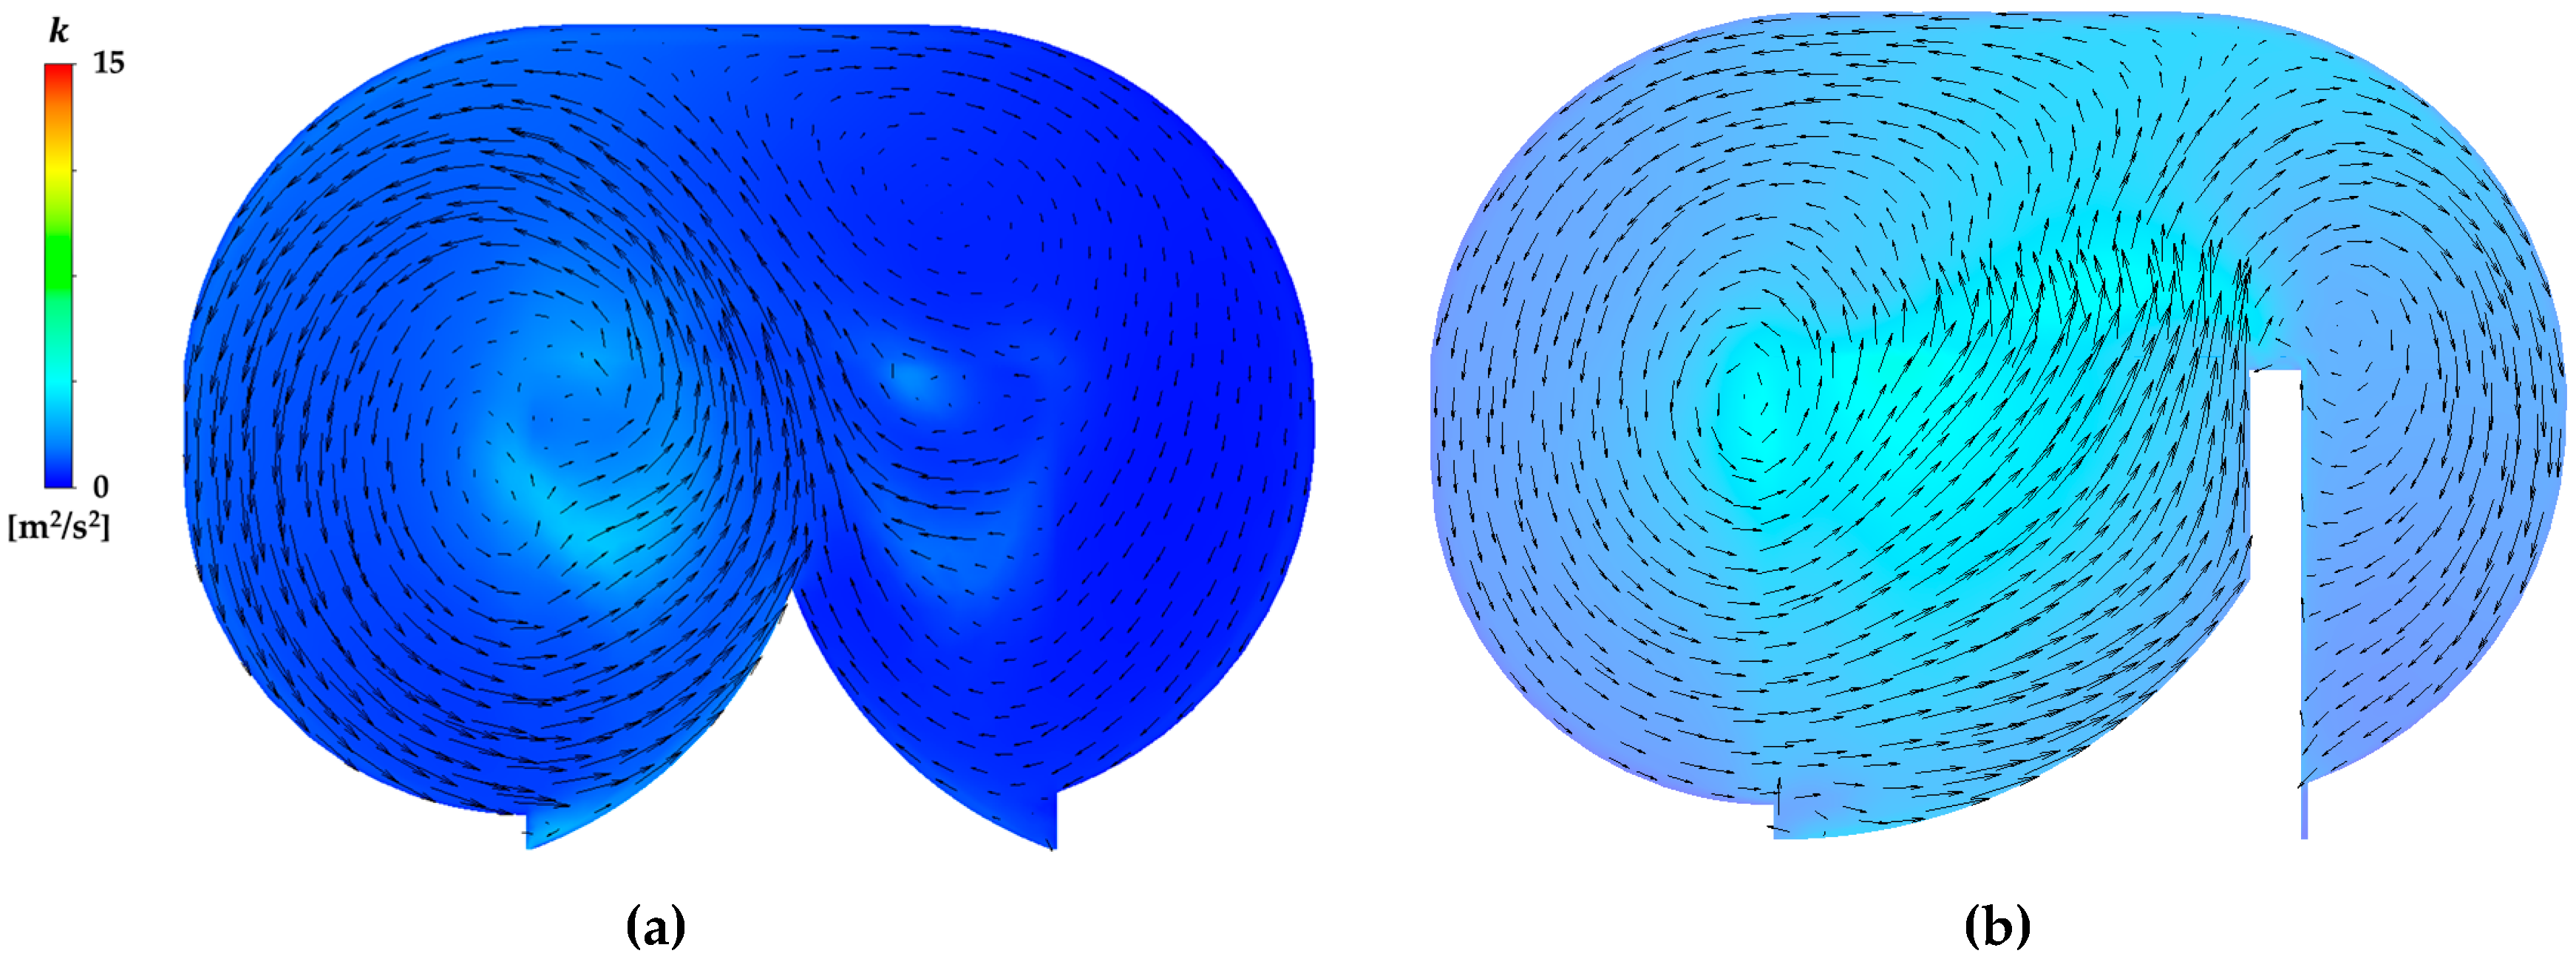
As shown in 
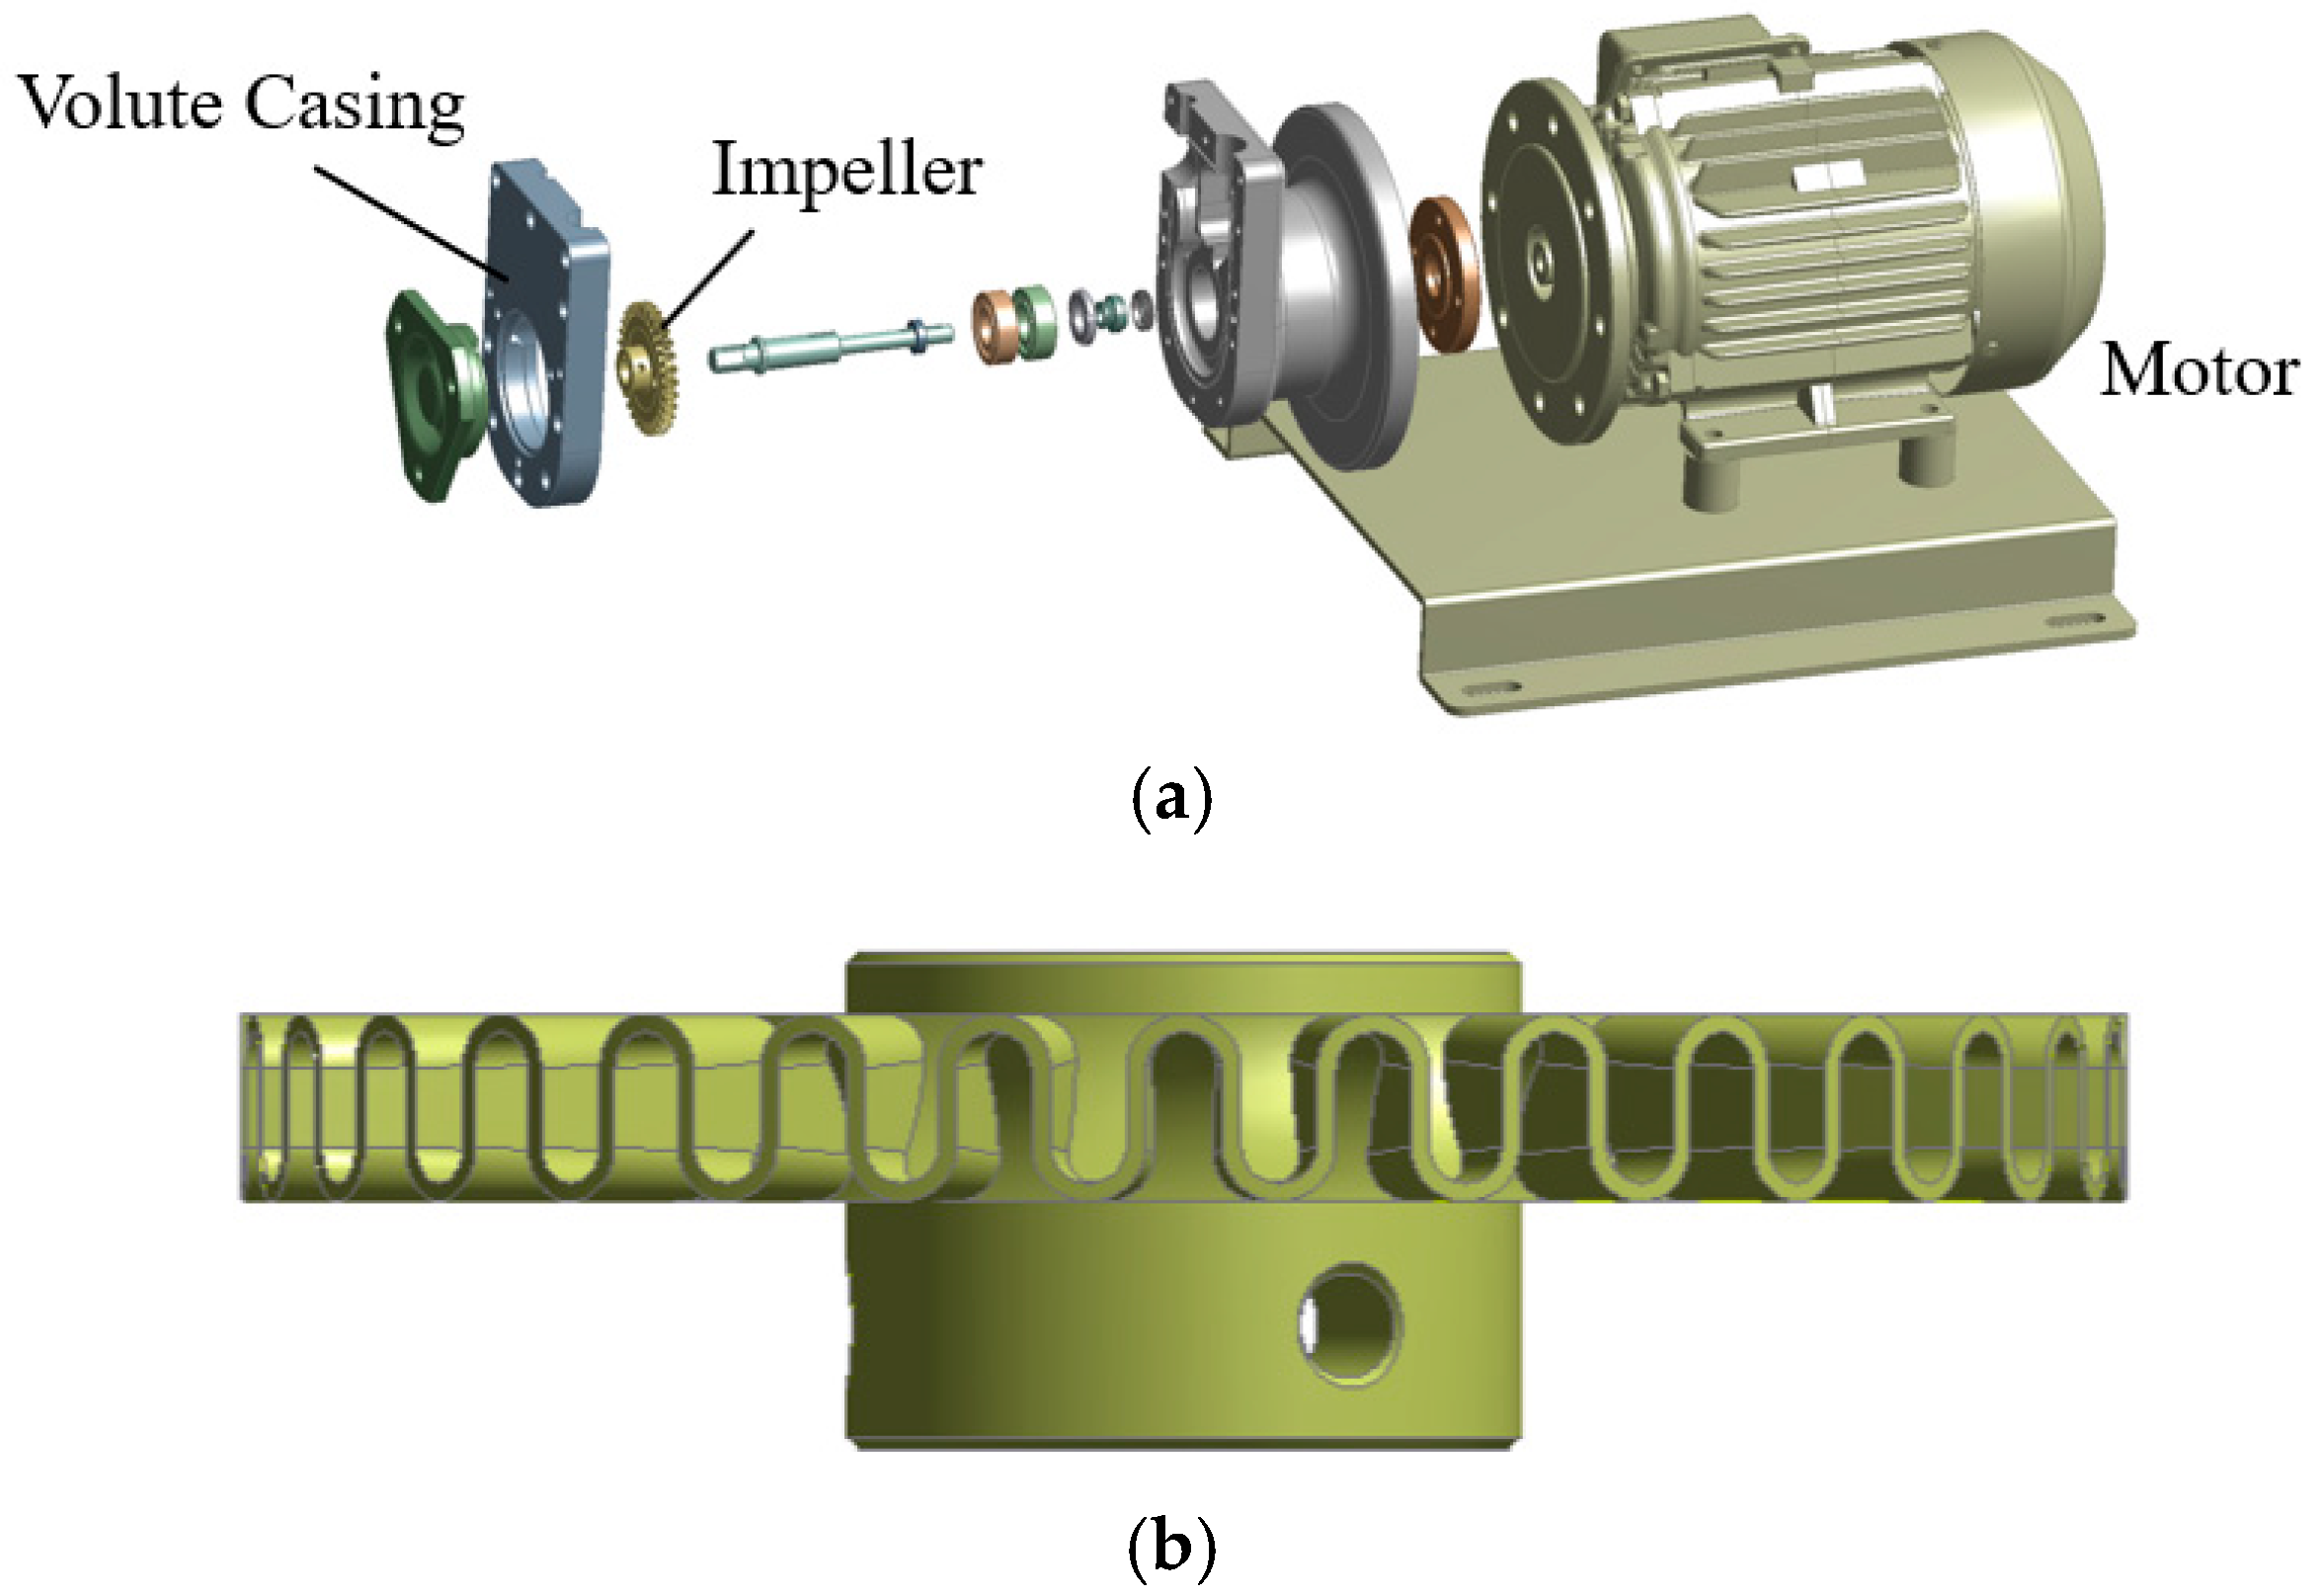
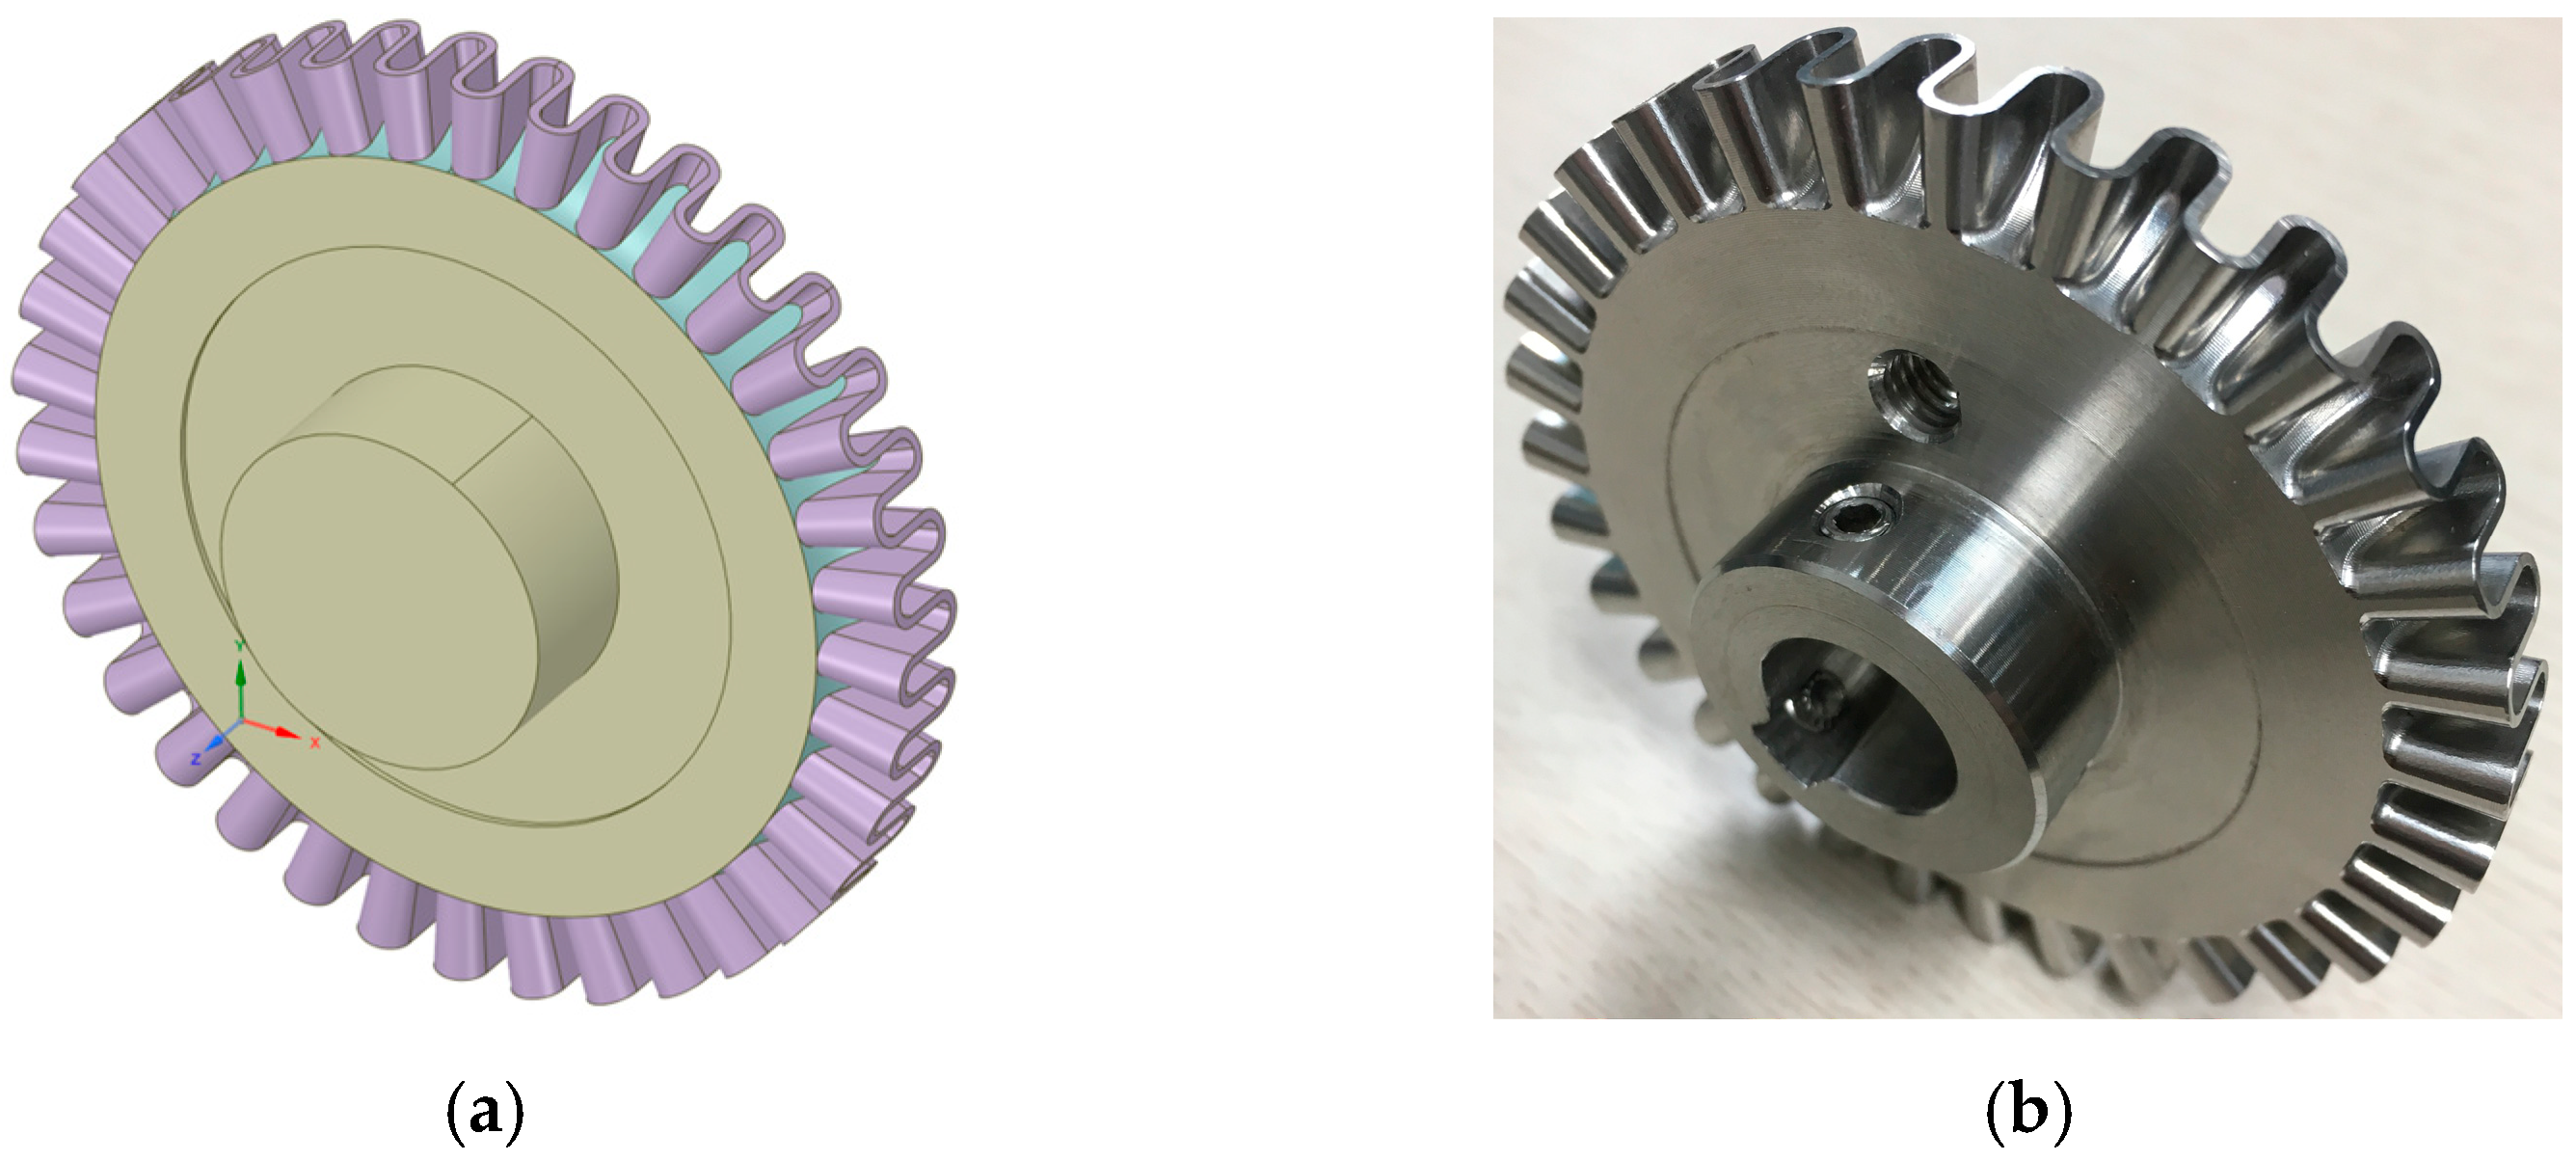
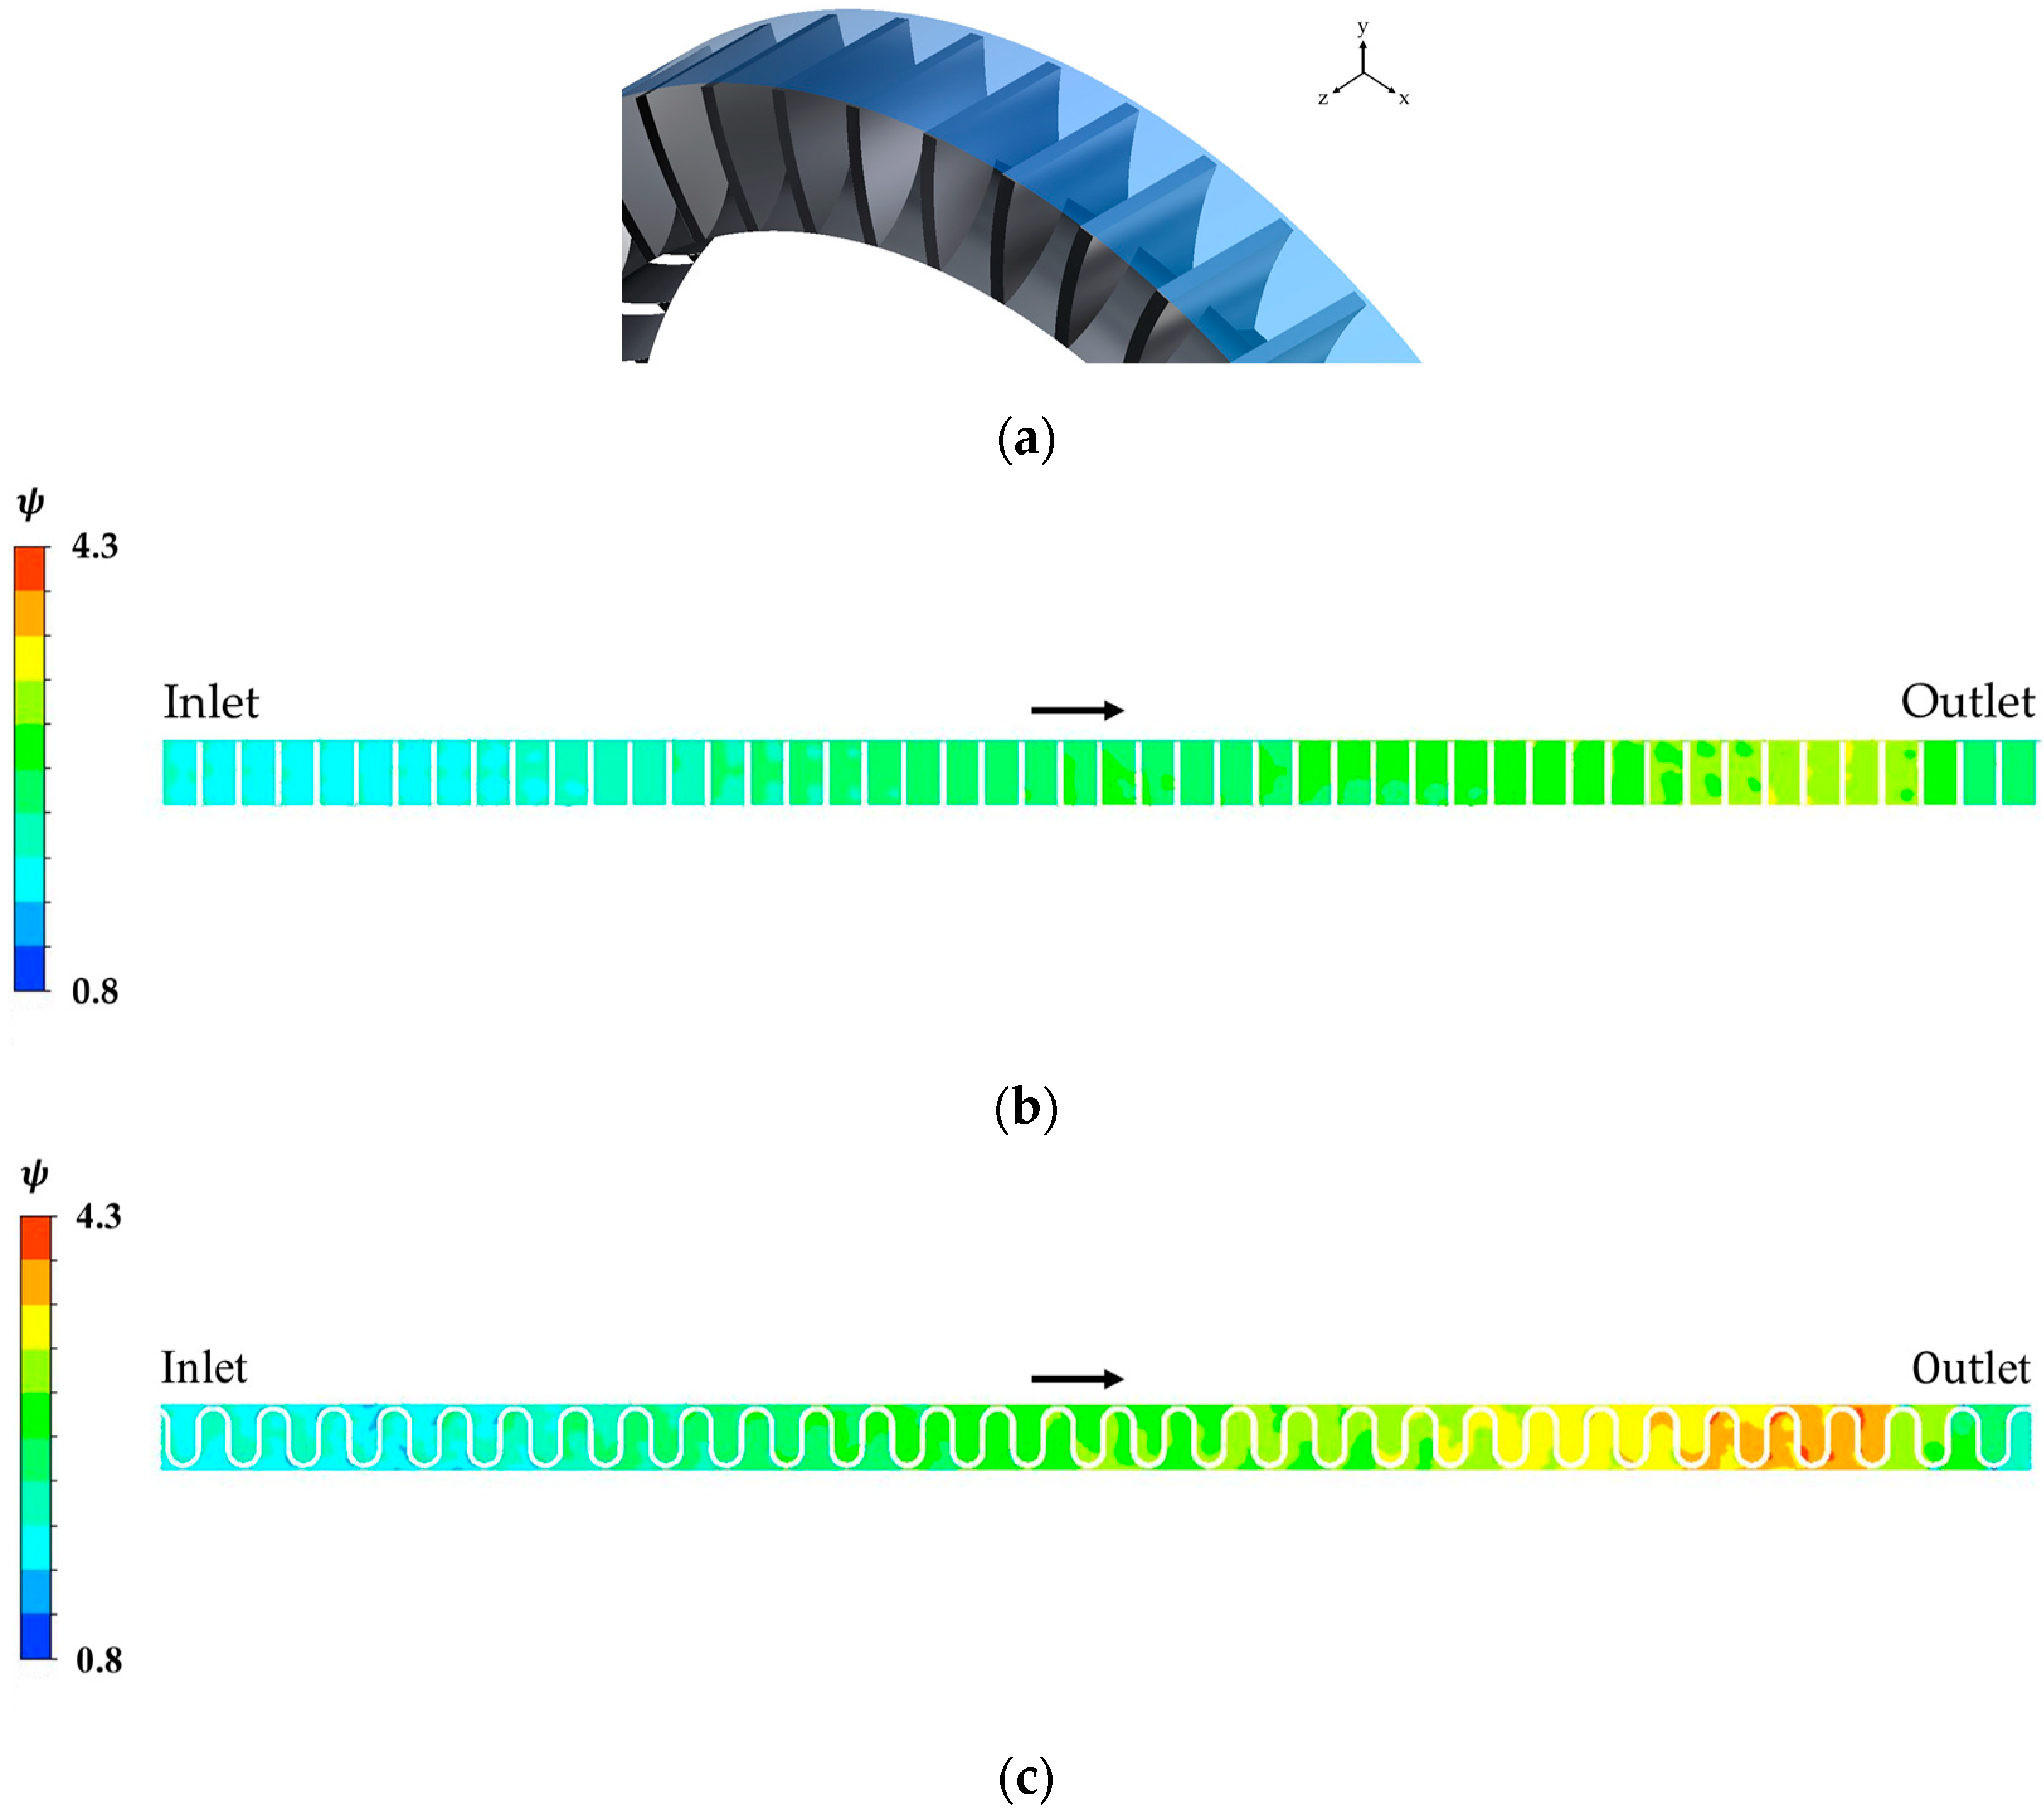
Figure 2, the recirculating flow involves flow mixing inside the impeller for the open typed regenerative pump impeller, which causes internal and tangential pressure losses. A large pressure loss due to mixing on the interference plane between two recirculation flows between impeller blades is generated as well as the rotational flow on the channel side. To enhance pump efficiency, it is desirable to design the impeller having a separate internal space between the blades to increase the pressure head due to the large rotational momentum while reducing pressure losses generated between two circulating flows. In the present study, the authors proposed a novel ‘S-shape’ pump impeller having a separate space between the impellers to improve pump performance as shown in Figure 3. Unlike conventional open type regenerative impellers, the new pump impellers are connected to each other on three sides, and thus can improve not only pump efficiency, but also the structural stability.

3. Optimal Design Method and Numerical Simulation

3.1. Objective Function and Design Variables

Since the purpose of this study is to improve the performance of the microbubble pump, the pump efficiency is selected as the objective function for the optimal design proposals and is calculated with Equation (4).
η = Q Δ p t ω
where t and ω are the torque and rotational speed acting on the impeller, respectively.
For the optimal design of the impeller, the number of blades (NOB), the blade thickness (T) and the radius of the hub rib (R) are selected as design variables, while the axial width of impeller blades and the blade height in the radial direction are kept constant, as shown in Figure 4. The range of each design variable is determined by preliminary calculations, as summarized in Table 2.

3.2. Optimal Design Method

In the present study, the design of experiment (DOE) has been introduced with a numerical simulation to enhance the efficiency of the microbubble pump. The optimization procedure of the pump impeller is shown in Figure 5.
The optimal design of the pump impeller is performed by DOE, which uses the method of controlling a limited range of input variables to obtain the maximum information on relationships with a minimum sample size and to generate information on the effect of various factors on the response variables [16]. Generally, the n-k factorial design, with k factors and n levels of each factor, which is a factorial fractional design as a method for verifying the effect of a certain variable on the objective function of the design object, is used as a technique for finding key elements among various variables [17,18]. On the other hand, a full factorial design has the advantage of being able to evaluate the main effects and the interactional effects of all factors [19,20]. The partial factorial design, n-k factorial design, is introduced in the present study to reduce the number of experimental times using the design variables.
In the present study, however, the optimal design of the impeller is performed by selecting three variables, and the experimental cases are determined by the RSM. The RSM is the representative method of DOE, and is mainly used to perform the statistical analysis of response surface formed by reaction changes under an objective function, which is affected by the multiple actions of variables [21,22,23]. The response model is assumed as a second-order polynomial. The response surface used in the present study is generated by the central composition method. In the central composition method, the range of the response surface is defined using the following Equation [24].
S R S = S V × n V
where S R S , S V and n V represent the generation range of the response surface, the range and number of the variables, respectively.
Fifteen numerical analysis sets are selected using a commercial statistical analysis program, JMP. The detailed values of each experiment set are shown in Table 3. It is noted that the NOB and blade thickness of the newly designed pump impeller corresponds to the reference pump in Case 7.

3.3. Numerical Simulation

Pump performance is determined by the numerical analysis code of ANSYS CFX 18.2, a commercial software suite. It solves Reynolds-averaged Navier-Stokes equations (RANS) and a continuity equation for incompressible fluid. Governing equations are discretized by finite volume methods, and a modified upwind differential scheme and a central difference method are adopted for the convective and diffuse terms of the equations, respectively. The SST (shear stress transport) model is applied to simulate turbulent flow. The SST model combines the advantage of the k- and k-models with a blending function. The k-model is activated in near-wall region and the rest region uses the k-model. The first grid points adjacent to the impeller walls are placed at y+ less than 5.0.
Figure 6 shows the computational domain of the microbubble pump. For the simplification of the numerical calculation, only water is considered as the working fluid, and the numerical analysis is performed under the condition that there is no air inflow. Considering wake flow formed downstream of the impeller, the distance between the pump and outlet plane of the duct is put the 10 times further downstream than the duct diameter.
Figure 7 shows the grid system of the pump. Unstructured grids are used to represent a composite grid system including the pump impeller and the volute casing. The blade region operating in rotating frame of reference and casing region in stationary frame of reference are introduced separately. The tetrahedral element is mainly imposed in the volute casing and impeller, while the prism element with three layers is introduced near the wall. The hexahedral element is also imposed in the inlet, outlet and connecting ducts to reduce the grid nodes. A grid dependency test was carried out to determine the optimum number of meshes for the geometry which are given in Figure 8. It shows that about 6.5 million grids were selected as the optimum grid number for the calculation of the entire domain.
As boundary conditions, atmospheric pressure is specified at the inlet, and mass flow rate is specified at the exit. No-slip and adiabatic wall conditions are used on blade, casing and hub surfaces. Boundary plane between the impeller and volute casing regions is imposed frozen rotor interference.

4. Results and Discussion

4.1. Validation of Numerical Simulation

To validate the numerical solutions, pressure and efficiency of the reference pump impeller are compared to the experimental results according to the flow rates as shown in Figure 9. The measured data of the reference microbubble pump is obtained using an open-looped test facility, and a detailed explanation of the test apparatus and the testing method is described in the authors’ published paper [25]. The figure shows that the local pressure and efficiency obtained by numerical simulations match well with the experimental results. The computed pump efficiency in the blade optimization has a maximum error of 4 percent compared to the experimental data. It is noted that the pump efficiency obtained by numerical simulation has 2 percent error compared to the experimental value obtained at the design flow condition. Since the optimum design is performed under the design flow condition, the pump efficiency is simulated correctly by the present calculation.

4.2. Optimum Results of the ‘S-Shape’ Impeller

Table 4 shows the pump efficiency obtained by RSM using numerical simulation. Among the 15 experimental cases, the highest efficiency of 35.3 percent was obtained in Case 8. In that case, the number of blades (NOB) has an upper bound of 68, while blade thickness (T) and the radius of the hub rib (R) have middle values.
The effects of these three design variables on the objective function, pump efficiency, are shown in Figure 10. As shown in the figure, the NOB is more impactful on the object function of the pump efficiency as compared to that of the blade thickness and the radius of the hub rib. The radius of the hub rib has no effect on pump efficiency. It is noted that the shape optimization using the NOB is more effective to increase pump efficiency in the novel ‘S-shape’ pump impeller.
Figure 11 shows the contour plot of predicted responses surface on the pump efficiency for the ‘S-shape’ pump impeller. The plot is drawn by the utilization of two design variables, the NOB and the blade thickness, which are the most sensitive among the three design variables. In the figure, the black circular point represents the optimal position, having the maximum value of the pump efficiency. As shown in Figure 11, the optimum value of the pump efficiency is located inside of the design space. For the optimum value for the efficiency in the present confined condition of the NOB, the blade thickness and the radius of the hub rib are 62 ea, 0.74 mm and 3.76 mm, respectively. The predicted efficiency at the optimal position is 35.8 percent. The resulting of the shape optimization of the ‘S-shape’ pump impeller at the design flow rate is shown in Table 5. The microbubble pump efficiency is enhanced by 3.7 percent through the shape optimization at the design flow coefficient of 0.39.

4.3. Numerical Analysis of the ‘S-Shape’ Impeller

Figure 12 shows the ‘S-shape’ impeller obtained by shape optimization. Performance comparisons using the reference regenerative pump and the pump having the ‘S-shape’ impeller were performed using numerical simulation as shown in Figure 13. As shown in the figure, the pump efficiency of the optimized ‘S-shape’ impeller is greater when compared to that of the reference pump with respect to flow conditions. Under design flow conditions, the pump efficiency has a maximum value that increases by up to 3.7 percent as compared to the reference one.
Figure 14 shows the pressure comparisons between the optimized and the reference pumps along the volute casing of the pump. The measuring position is indicated by a solid black line, as shown in Figure 14a. In general, the pressure along the casing wall of the regenerative pump is composed of an ‘acceleration–linear (constant)–deceleration’ pattern along the pump channel. As shown in the figure, in the acceleration region, the pressure of the reference pump is relatively higher than of the optimized pump. On the other hand, it is shown that the gradient of the rate of pressure increase of the optimized pump is larger than that of the reference pump in the linear region. In other words, the rate of pressure increase of the optimized pump in the acceleration region is faster than that of the reference pump.
Figure 15 shows the pressure distribution at Plane 1 under design flow condition of the reference and optimized pumps. Plane 1 corresponds to 25 percent of the width of the impeller in Figure 15a. As shown in the figure, the pressure inside the impeller blades of the optimized pump increases rapidly from pump inlet to outlet when compared to the reference one, which corresponds to the pressure increase shown in the volute casing in Figure 14.
Figure 16 shows the velocity contour and vectors at Plane 2 for the two pumps. Plane 2 corresponds to 50 percent of the width of the impeller in Figure 15a. As shown in the figure, a locally high-velocity region is observed at the pump inlet for the reference pump, while a relatively constant flow velocity is formed along the channel for the optimized pump. Non-uniform flow induces flow instability inside impeller blades and channel, thus deteriorating the pump performance due to the increased flow separation on the blade surfaces and an irregular recirculation flow. At the outlet chamber, separated recirculation flow is observed in the reference pump, which increases the pressure loss inside the pump impeller and decreases the pump performance.
Figure 17, Figure 18 and Figure 19 show velocity vectors and turbulence kinetic energy on the three perpendicular planes to the rotational direction. As shown in Figure 14a, the three measuring positions correspond to pump inlet (θ = 0°), middle (θ = 120°) and outlet (θ = 240°). As shown in the figure, the optimized pump has a relatively large flow region between the impeller blades and shows a larger recirculation flow compared to the reference pump, which increases momentum exchange due to the larger recirculating flow and tangential velocity as mentioned in Equation (3). Local turbulent kinetic energy retains a relatively constant value for the optimized pump from the pump inlet to the outlet, although a relatively higher amount of turbulent kinetic energy is observed at the pump inlet. This means that the momentum energy comes from the circulating flow between impeller blades and remains constant to the pump outlet for the optimized pump.
Figure 20 shows the pressure contour at the outer plane of the impeller along the rotational direction of the impeller. The measuring position of the outer plane is indicated in Figure 20a. As shown in the figure, a continuous pressure increase along the impeller is observed for both pumps. A larger pressure increase is observed with the optimized pump from the middle position of the rotational direction, which corresponds to the distribution of turbulent kinetic energy in Figure 17, Figure 18 and Figure 19. From the internal flow analysis using the results of the numerical simulation, it is clear that the optimized pump with an ‘S-shape’ impeller has better pump performance compared to that of the reference pump.

5. Conclusions

In the present study, a novel ‘S-shape’ blade of a microbubble pump has been introduced to enhance pump performance. The optimal design method based on the response surface method is applied to determine the optimal shape of the newly proposed impeller, and implemented with numerical simulation and experimental measurements. The results are summarized as follows:
(1)
Three design variables used to define the blade shape—the number of blades, the blade thickness and the radius of the hub rib—were introduced to assess the increase in the efficiency of the pump. Among the design variables, the number of blades is the most effective for increasing pump efficiency in the novel ‘S-shape’ pump impeller.
(2)
Throughout the blade shape optimization, the optimum value of the pump efficiency is located inside of the design space. The efficiency of the optimized pump at the design flow coefficient is 35.8 percent, which is an enhancement of 3.7 percent when compared to the reference one.
(3)
The pump efficiency obtained by numerical simulation has 2 percent error compared to the experimental value obtained under the design flow condition. Since the optimum design was implemented under the design flow condition, the pump efficiency, the objective function, was simulated correctly by the present calculations.
(4)
The largest pressure increases of the optimized pump along with the volute casing wall was observed from the middle position of the rotational direction, which is due to the increase of momentum energy due to larger circulating flow inside each blade passage as compared to the reference one. It is noted that the optimized ‘S-shape’ pump impeller has continuously connected blades that increase structural stability, as well as the pump efficiency.

Author Contributions

C.-M.J. designed and advised the research project; J.-Y.Y. advised throughout the research; S.-Y.J. performed the experiments, analyzed the data, and wrote the paper.

Funding

This work is supported by a grant (No. 2018K000280) from the Commercialization Promotion Agency for R&D Outcomes (COMPA) funded by the Korean Ministry of Science and ICT.

Conflicts of Interest

The authors declare no conflicts of interest.

Nomenclature

h head, m
n number
p pressure, Pa
t torque, Nm
A cross-sectional area, m2
H height, m
Q volumetric flowrate, m3/s
R radius, m
S range
T thickness, m
U average rotational velocity, m/s
V average tangential velocity, m/s
W width, m
Greek Letters
η mechanical efficiency of regenerative pump, %
θ angle
μ viscosity of water, kg/ms
ρ density of water, kg/m3
ϕ flow coefficient
ψ pressure coefficient
ω angular velocity of regenerative pump impeller, rad/s

References

  1. Karlsen-Davies, N.D.; Aggidis, G.A. Regenerative liquid ring pumps review and advances on design and performance. Appl. Energy 2016, 164, 815–825. [Google Scholar] [CrossRef] [Green Version]
  2. Wilson, W.A.; Santalo, M.A.; Oelrich, J.A. A theory of the fluid dynamic mechanism of regenerative pump. Trans. ASME 1955, 77, 1306–1316. [Google Scholar]
  3. Senoo, Y. A comparison of regenerative pump theories supported by new performance data. Trans. ASME 1956, 78, 1091–1102. [Google Scholar]
  4. Badami, M.; Mura, M. Theoretical model with experimental validation of a regenerative blower for hydrogen recirculation in a PEM fuel cell system. Energy Convers. Manag. 2010, 51, 553–560. [Google Scholar] [CrossRef]
  5. Shimosaka, M.; Yamazaki, S. Research on the characteristics of regenerative pump. Bull. Jpn. Soc. Mech. Eng. 1960, 3, 185–190. [Google Scholar] [CrossRef]
  6. Kanase, R.; Kasturi, M.; Pise, A.T.; Garje, P.V. Experimental and CFD analysis of regenerative pump. In Proceedings of the 24th National and 2nd International ISHMT-ASTFE Heat and Mass Transfer Conference (IHMTC-2017), Hyderabad, India, 27–30 December 2017. [Google Scholar]
  7. Nejadrajabal, J.; Riasi, A.; Nourbakhsh, S.A. Flow pattern analysis and performance improvement of regenerative flow pump using blade geometry modification. Int. J. Rotating Mach. 2016, 2016, 8628467. [Google Scholar] [CrossRef]
  8. Pei, J.; Zhang, F.; Appiah, D.; Hu, B.; Yuan, S.; Chen, K.; Asomani, S.N. Performance prediction based on effects of wrapping angle of a side channel pump. Energies 2019, 12, 139. [Google Scholar] [CrossRef]
  9. Choi, W.C.; Yoo, I.S.; Park, M.R.; Chung, M.K. Experimental study on the effect of blade angle on regenerative pump performance. Proc. Inst. Mech. Eng. Part A J. Power Energy 2013, 227, 585–592. [Google Scholar] [CrossRef]
  10. Wang, C.H.; Choi, C.H. Optimized design of regenerative blowers for enhanced efficiency. In Proceedings of the ASME 2010 International Mechanical Engineering Congress and Exposition, Vancouver, BC, Canada, 12–18 November 2010. [Google Scholar]
  11. Jang, C.M.; Lee, J.S. Shape optimization of a regenerative blower used for building fuel cell system. J. Fluid Dyn. 2012, 2, 208–214. [Google Scholar] [CrossRef]
  12. Heo, M.W.; Seo, T.W.; Shim, H.S.; Kim, K.Y. Optimization of a regenerative blower to enhance aerodynamic and aeroacoustic performance. J. Mech. Sci. Technol. 2016, 30, 1197–1208. [Google Scholar] [CrossRef]
  13. Jeon, S.Y.; Kim, C.K.; Lee, S.M.; Yoon, J.Y.; Jang, C.M. Performance enhancement of a pump impeller using optimal design method. J. Therm. Sci. 2017, 26, 119–124. [Google Scholar] [CrossRef]
  14. Choi, W.C. Study on the Effect of Blade Angle on Regenerative Pump Performance. Ph.D. Thesis, Korea Advanced Institute of Science and Technology, Daejeon, Korea, 2013. [Google Scholar]
  15. Jang, C.M.; Han, G.Y. Enhancement of Performance by Blade Optimization in Two-Stage Ring Blower. J. Therm. Sci. 2010, 19, 383–389. [Google Scholar] [CrossRef]
  16. Mahadevan, S.; Haldar, A. Probability, Reliability and Statistical Method in Engineering Design; John Wiley & Sons: New York, NY, USA, 2000. [Google Scholar]
  17. Box, G.E.P.; Hunter, W.G.; Hunter, J.S. Statistics for Experimenters; John Wiley & Sons: New York, NY, USA, 1978. [Google Scholar]
  18. Bose, R.C. Mathematical theory of the symmetrical factorial design. Sankhyā Indian J. Stat. 1947, 8, 107–166. [Google Scholar]
  19. Özturk, N.; Kavak, D. Boron removal from aqueous solutions by batch adsorption onto cerium oxide using full factorial design. Desalination 2008, 223, 106–122. [Google Scholar] [CrossRef]
  20. Shah, M.; Pathak, K. Development and statistical optimization of solid lipid nanoparticles of simvastatin by using 23 full-factorial design. AAPS Pharm. Sci. Tech. 2010, 11, 489–496. [Google Scholar] [CrossRef] [PubMed]
  21. Khuri, A.I.; Mukhopadhyay, S. Response surface methodology. Wiley Interdiscip. Rev. Comput. Stat. 2010, 2, 128–149. [Google Scholar] [CrossRef] [Green Version]
  22. Kim, S.H.; Na, S.W. Response surface method using vector projected sampling points. Struct. Saf. 1997, 19, 3–19. [Google Scholar] [CrossRef]
  23. Wong, F.S. Slope reliability and response surface method. J. Geotech. Eng. 1985, 111, 32–53. [Google Scholar] [CrossRef]
  24. Kim, S.; Lee, K.Y.; Kim, J.H.; Choi, Y.S. A numerical study on the improvement of suction performance and hydraulic efficiency for a mixed-flow pump impeller. Math. Probl. Eng. 2014, 2014, 269483. [Google Scholar] [CrossRef]
  25. Jeon, S.Y.; Yoon, J.Y.; Jang, C.M. Bubble size and bubble concentration of a microbubble pump with respect to operating conditions. Energies 2018, 11, 1864. [Google Scholar] [CrossRef]
Figure 1. Configuration of the reference microbubble pump: (a) front view; (b) conventional regenerative impeller.
Energies 12 01793 g001
Figure 2. Recirculating flow inside the regenerative impeller: (a) velocity vectors [15], (b) velocity components.
Energies 12 01793 g002
Figure 3. Basic configuration of a novel ‘S-shape’ pump impeller: (a) perspective view of a pump system, (b) newly designed impeller.
Energies 12 01793 g003
Figure 4. Definition of design variables.
Energies 12 01793 g004
Figure 5. Optimization procedure for the pump impeller.
Energies 12 01793 g005
Figure 6. Computational domain of the microbubble pump.
Energies 12 01793 g006
Figure 7. Grid system: (a) overall view; (b) impeller part.
Energies 12 01793 g007
Figure 8. Performance curve for grid dependence.
Energies 12 01793 g008
Figure 9. Comparisons of the reference pump performance.
Energies 12 01793 g009
Figure 10. Effects of the design variables on pump efficiency.
Energies 12 01793 g010
Figure 11. Response surface of pump efficiency.
Energies 12 01793 g011
Figure 12. Optimal design of ‘S-shape’ impeller: (a) solid modeling; (b) manufactured impeller.
Energies 12 01793 g012
Figure 13. Performance comparisons of the reference pump and the optimized pump with an ‘S-shape’ impeller from numerical simulations.
Energies 12 01793 g013
Figure 14. Pressure comparisons along the pump casing: (a) measuring position; (b) pressure.
Energies 12 01793 g014
Figure 15. Pressure contours on Plane 1: (a) measuring position; (b) reference pump; (c) optimized pump.
Energies 12 01793 g015
Figure 16. Velocity contours and vectors on Plane 2: (a) reference pump; (b) optimized pump.
Energies 12 01793 g016
Figure 17. Velocity vectors and turbulence kinetic energy on the perpendicular plane to the rotational direction at θ = 0°: (a) reference pump; (b) optimized pump.
Energies 12 01793 g017
Figure 18. Velocity vectors and turbulence kinetic energy on the perpendicular plane to the rotational direction at θ = 120°: (a) reference pump; (b) optimized pump.
Energies 12 01793 g018
Figure 19. Velocity vectors and turbulence kinetic energy on the perpendicular plane to the rotational direction at θ = 240°: (a) reference pump; (b) optimized pump.
Energies 12 01793 g019
Figure 20. Pressure contours at the outer plane of the impeller: (a) measuring position; (b) reference pump; (c) optimized pump.
Energies 12 01793 g020
Table 1. Specifications of the reference microbubble pump.
ParametersValue
Flow coefficient0.39
Pressure coefficient2.04
Rotational speed of an impeller, rpm3550
Number of impeller blades, ea48
Diameter of an impeller, mm72.6
Table 2. Range of design variables.
RangeNOB (ea)T (mm)R (mm)
Upper Bound680.886.8
Middle Bound480.803.8
Lower Bound280.720.8
Table 3. Numerical analysis sets by RSM.
Case No.NOB (ea)T (mm)R (mm)
1280.720.8
2280.886.8
3680.726.8
4280.726.8
5280.803.8
6680.886.8
7480.803.8
8680.803.8
9480.723.8
10680.720.8
11480.800.8
12680.880.8
13480.806.8
14480.883.8
15280.880.8
Table 4. Pump efficiency obtained by RSM.
Case No.NOB (ea)T (mm)R (mm)Efficiency
1280.720.822.8
2280.886.823.5
3680.726.834.2
4280.726.824.4
5280.803.822.9
6680.886.834.2
7480.803.832.7
8680.803.835.3
9480.723.832.9
10680.720.834.1
11480.800.833.2
12680.880.834.7
13480.806.832.4
14480.883.831.9
15280.880.822.1
Table 5. Result of shape optimization for pump efficiency.
Reference Pump‘S-shape’ PumpEfficiency Increment
32.1%35.8%3.7%

