Investigation of Thermal Comfort Responses with Fuzzy Logic

1
Department of Mechanical Engineering, Faculty of Debrecen, Ótemető street 2-4, 4028 Debrecen, Hungary
2
Department of Building Services and Building Engineering; Faculty of Debrecen, Ótemető street 2-4, 4028 Debrecen, Hungary
*
Author to whom correspondence should be addressed.
Energies 2019, 12(9), 1792; https://doi.org/10.3390/en12091792
Submission received: 20 April 2019
/
Revised: 2 May 2019
/
Accepted: 8 May 2019
/
Published: 11 May 2019
(This article belongs to the Special Issue Energy and Technical Building Systems - Scientific and Technological Advances)
Abstract
:In order to reduce the energy consumption of buildings a series of new heating, ventilation and air conditioning strategies, methods, and equipment are developed. The architectural trends show that office and educational buildings have large glazed areas, so the thermal comfort is influenced both by internal and external factors and discomfort parameters may affect the overall thermal sensation of occupants. Different studies have shown that the predictive mean vote (PMV)—predictive percentage of dissatisfied (PPD) model poorly evaluates the thermal comfort in real buildings. At the University of Debrecen a new personalized ventilation system (ALTAIR) was developed. A series of measurements were carried out in order to test ALTAIR involving 40 subjects, out of which 20 female (10 young and 10 elderly) and 20 male (10 young and 10 elderly) persons. Based on the responses of subjects related to indoor environment quality, a new comfort index was determined using fuzzy logic. Taking into consideration the responses related to thermal comfort sensation and perception of odor intensity a new the fuzzy comfort index was 5.85 on a scale from 1–10.
1. Introduction
1.1. Energy Use of Buildings
Nowadays, reduction of energy use in buildings is one of the main goals in European countries. According to the Energy Performance Directive, Member States shall ensure that, by 31 December 2020, all new buildings are nearly zero-energy buildings [1]. Vorsatz et al. in their paper described the trends of thermal energy use of buildings on a global and regional basis [2]. They found that in the residential building sector the final energy use was almost constant for the last 30 years. Even though the energy sources were diversified, the efficiency of technologies and services were significantly enhanced in the analyzed regions. In the modelling of the future energy use and trends, climate change has to be taken into account. Isaac and van Vurren assess the potential development of energy use for future residential heating and air conditioning in the context of climate change [3]. Based on their study they stated that the energy use for air conditioning in buildings will increase rapidly over the 21st century, mostly driven by income growth. Levesque et al. show that, without further climate policies, global final energy demand of buildings could be tripled by 2100 [4]. Improving the thermal performances of the building envelope important energy saving can be obtained. The effectiveness and the time dependence of the thermal properties of built-in insulation materials have to be known in order to optimize the insulation of the buildings’ envelope. Water content and humidity has a negative influence on the thermal conductivity of the commonly used insulation materials [5]. Position in the building element and structure of the insulation material are to be taken into account when building energy simulations are carried out [6]. Improving the structure of traditional insulation material (polystyrene) the insulation effectiveness is increased and further energy savings may be obtained [7]. However, the increment of effectiveness is fragile and the construction process should be of high standard in order to obtain the presumed energy saving. Vacuum technologies may further improve the efficiency of insulation materials. However, the stability of insulation properties of these materials should be analyzed appropriately before to be used on a large scale [8]. In order to identify the optimal shape and structure of the building envelopes complex energy and cost simulation should be conducted. Baglivo et al. presented in their study the interrelation between operative temperature and configuration of the buildings’ envelope in warm climates [9]. Utilization of renewable energy sources may further contribute to the reduction of fossil fuel use in the building sector. However, to integrate efficiently the renewable energy sources in the buildings energy system, complex energy-economic analysis has to be done. Molinari et al. analyzed in their study the performance of ground source heat pumps depending on the building thermal insulation, boreholes number and spacing [10]. Their methodology allows quantifying the impact of different design configurations on the need for end-use energy. Brown et al. developed a method for assessing renovation packages drawn up with the goal of increasing energy efficiency in buildings [11]. The method includes calculation of bought energy demand, life-cycle cost (LCC) analysis, and assessment of the building according to the Swedish environmental rating tool.
1.2. Indoor Environment Quality
In addition to energy saving endeavors designers have to emphasize proper thermal comfort and appropriate indoor air quality assurance in buildings. Al horr et al. in their review presented a series of findings enlighten the effects of the indoor environment quality on occupant well-being and comfort [12]. Björnsson et al. discussed in their study the sick building syndrome and its relation with bronchial hyperresponsiveness [13]. They found that sick building symptoms are common in the general population and among women, while atopy and anxiety increase the risk of reporting such symptoms. Wargocki and Wyon draw attention to the relation between quality of indoor environment and productivity [14]. They revealed that labor costs in buildings exceed energy costs by two orders of magnitude. Moreover, they claim that thermal and air quality conditions that the majority of building occupants currently even accept can be shown to reduce performance by 5–10% for adults and by 15–30% for children. Kang et al. conducted a study analyzing the impact of indoor environmental quality on work productivity in university open-plan research offices [15]. Their results proved that different age groups can have different sensitivities to artificial lighting, natural lighting and office noise. Furthermore, different genders can have different sensitivities to ventilation and temperature. Schaudienst and Vogdt demonstrated that elderly people and women prefer a higher ambient temperature [16]. Cheung et al. analyzed the accuracy on PMV–PPD model using the ASHRAE Global Thermal Comfort Database II [17]. According to their study, the PMV model accuracy in predicting the observed thermal comfort was only 34%, meaning that the thermal sensation is incorrectly predicted two out of three times. Their findings emphasized the need of development of new thermal comfort models. Geng et al. investigated through experiments with objective environmental measurements, subjective surveys, and productivity tests, the impact of thermal environment on occupant IEQ perception and productivity [18]. They found that when thermal environment was unsatisfactory, it weakened the “comfort expectation” of other IEQ factors, which accordingly resulted in the less dissatisfaction with other IEQ factors. Furthermore, the optimal productivity was obtained when people felt “neutral” or “slightly cool”, and the increase of thermal satisfaction had a positive effect on productivity.
1.3. Comfort Indices
The evaluation of the thermal comfort in closed spaces is based on the heat exchange of the human body with surrounding environment. Based on the heat balance of the human body Fanger developed the predictive mean vote (PMV) and predictive percentage of dissatisfied (PPD) [19]. The model works well in well-controlled environments. However, there are plenty of non-air conditioned buildings. For free-running buildings Nicol and Humphreys proposed to use sustainable comfort standards based on an adaptive algorithm [20], which stand for variable indoor temperatures during the year. Analyzing a large database Brager and de Dear introduced the adaptive thermal comfort model in naturally ventilated buildings [21]. They proposed the indoor operative temperature as a function of prevailing outdoor air temperature. Fanger and Toftum provided in their study the extended PMV model, which can be used in non-air conditioned buildings [22]. They concluded that in warm climates the PMV model overestimates the warmth sensation of occupants in free-running buildings. Yao et al. developed a theoretical adaptive PMV(aPMV) model for thermal comfort [23]. The aPMV index proposed in their study takes into account the both physiological and behavioral adaptation of occupants. The wet bulb globe temperature (WBGT) is used both in closed and open spaces and takes into account the dry bulb air temperature, the wet bulb temperature, and the globe temperature [24]. The WBGT is used widely mainly to evaluate heat stress. Sakoi et al. tried to expand the WBGT index into a rational thermal comfort index of the human body [25]. Local thermal discomfort sensation caused by asymmetric radiation, draught, vertical temperature difference, and floor temperature are taken into account in the ISO 7730 standard [26]. The air diffusion performance index (ADPI) takes into account the mean and local temperatures and air velocities. ADPI is useful to determine the critical points of a closed space from draught sensation point of view. Ng et al. used computational fluid dynamics and response surface methodology in order to predict ADPI in the case of a displacement ventilated office [27].
As a response to energy saving and indoor environment quality endeavors, at the University of Debrecen advanced personalized ventilation (PV) equipment was developed (ALTAIR). The main idea of this PV equipment was the changing of air jet direction around the chest and head of the occupants. A series of measurements were carried out in order to analyze the thermal comfort sensation of young and elderly female and male subjects [28]. The results show significant differences between young women and men and young and elderly women, respectively. Analyzing the obtained responses related to indoor environment quality, using fuzzy logic, a new comfort index was developed. The method and results are presented in this paper.
2. The Basics of Fuzzy Logic
In the context of traditional logical sense, there are only two values; 0 (false) and 1 (true) [29,30,31]. It has been discovered several times in engineering that this statement is not always true and subjective opinions and statements are often used for some purpose. For perspective, it may occur during reading different measuring instruments that values are read incorrectly, generating inaccuracy [32]. It may be declared that the problem ‘gets fuzzied’. Inaccuracy is illustrated with a membership function. The process in fuzzy systems is: fuzzification, interpretation, summary, and defuzzification [33,34]. The first step is fuzzification, which means the input of crisp values into the system. To perform fuzzification, categories used in modelling and the related membership functions are necessary to be specified. Thus, the core determining factors need to be considered. The number of categories is a crucial factor. By increasing the number of categories, we obtain a more accurate picture of the system under consideration, but increasing the number of categories complicates the study [33].
A membership function is necessary to be defined for each of the categories. Several ways exist to define them. The membership function of μ (x;a) specifies the extent to which property ‘x’ belongs to set ‘a’. Crisp scale determination is an important step, which needs to be selected from the scales of 0–10, 1–10, 0–100, and 1–100. The aim is to compare things to be studied as simply as possible. Rules have to be set in the interpretation phase based on categories, that is to say, a rule base for the fuzzy model is established. Results other than zero, obtained in the interpretation phase, are integrated with the properties of the controlled process (fuzzy process). As a result, the fuzzy set is established. It is a primary or preliminary conclusion; therefore, results are then interpreted in defuzzification. Defuzzification is the last step in the process. Afterwards, specific values need to be chosen based on fuzzy conclusions that best describe the particular fuzzy set depending on the application and model [33,34].
Depending on thy type of application, the meaning of fuzzy set may be varied, therefore, different defuzzification methods are available to achieve results, such as [33]:
- Center of gravity (COG);
- Center of area (COA); and
- Weighted average method.
3. Artificial Intelligence in HVAC Systems
Artificial intelligence is gaining a wider ground these days. According to studies, artificial intelligence will have existence in several new fields by 2030, of which safety and security systems are among the most significant [35]. Not only should future developments be taken into account, as artificial intelligence is found in our daily equipment; personal assistants may be the most popular, including Siri or Cortana [36,37].
Artificial neural networks (A.N.N.) and fuzzy logic applications have more significant role in building management systems, where their main responsibilities include energy saving. Heating, ventilation, and air-conditioning (HVAC) systems are among the key sources of energy consumption of buildings [38]. Significant progress has been achieved in AI developed for HVAC in recent years [39]. The systems are able to perform control, management, optimization, fault detection, and diagnosis. These applications are the basis of the modern smart home business. According to studies, 41% of homes in the USA had programmable thermostats in 2017 [38,39].
The first electric thermostat was developed by W.S. Johnson in 1883. The 130 years since then have been full of innovations with respect to thermostats. During these years, thermostats underwent significant changes, and integrated modern IT solutions, such as sensors, actuators, hardware, software, and cloud solutions [39]. More than 18 AI solutions are available for HVAC systems developed during the last 20 years, but only three of them have become especially popular: weather forecasting, optimization, and predictive controls [40]. Most of the technical building systems today do not work as efficiently as those with artificial intelligence. This is due to the fact that existing sensors are not able to meet the requirements of AI [39,40]
Reducing energy consumption is only one task in today’s environmentally conscious development. Systems with AI are expected to give feedback on the state of the internal environment, as well. These indices may help optimize HVAC systems, such as the Harris Index, but this does not characterize the internal environment from a comfort theory point of view [40,41,42]
4. Experiments with an Advanced Personalized Ventilation System
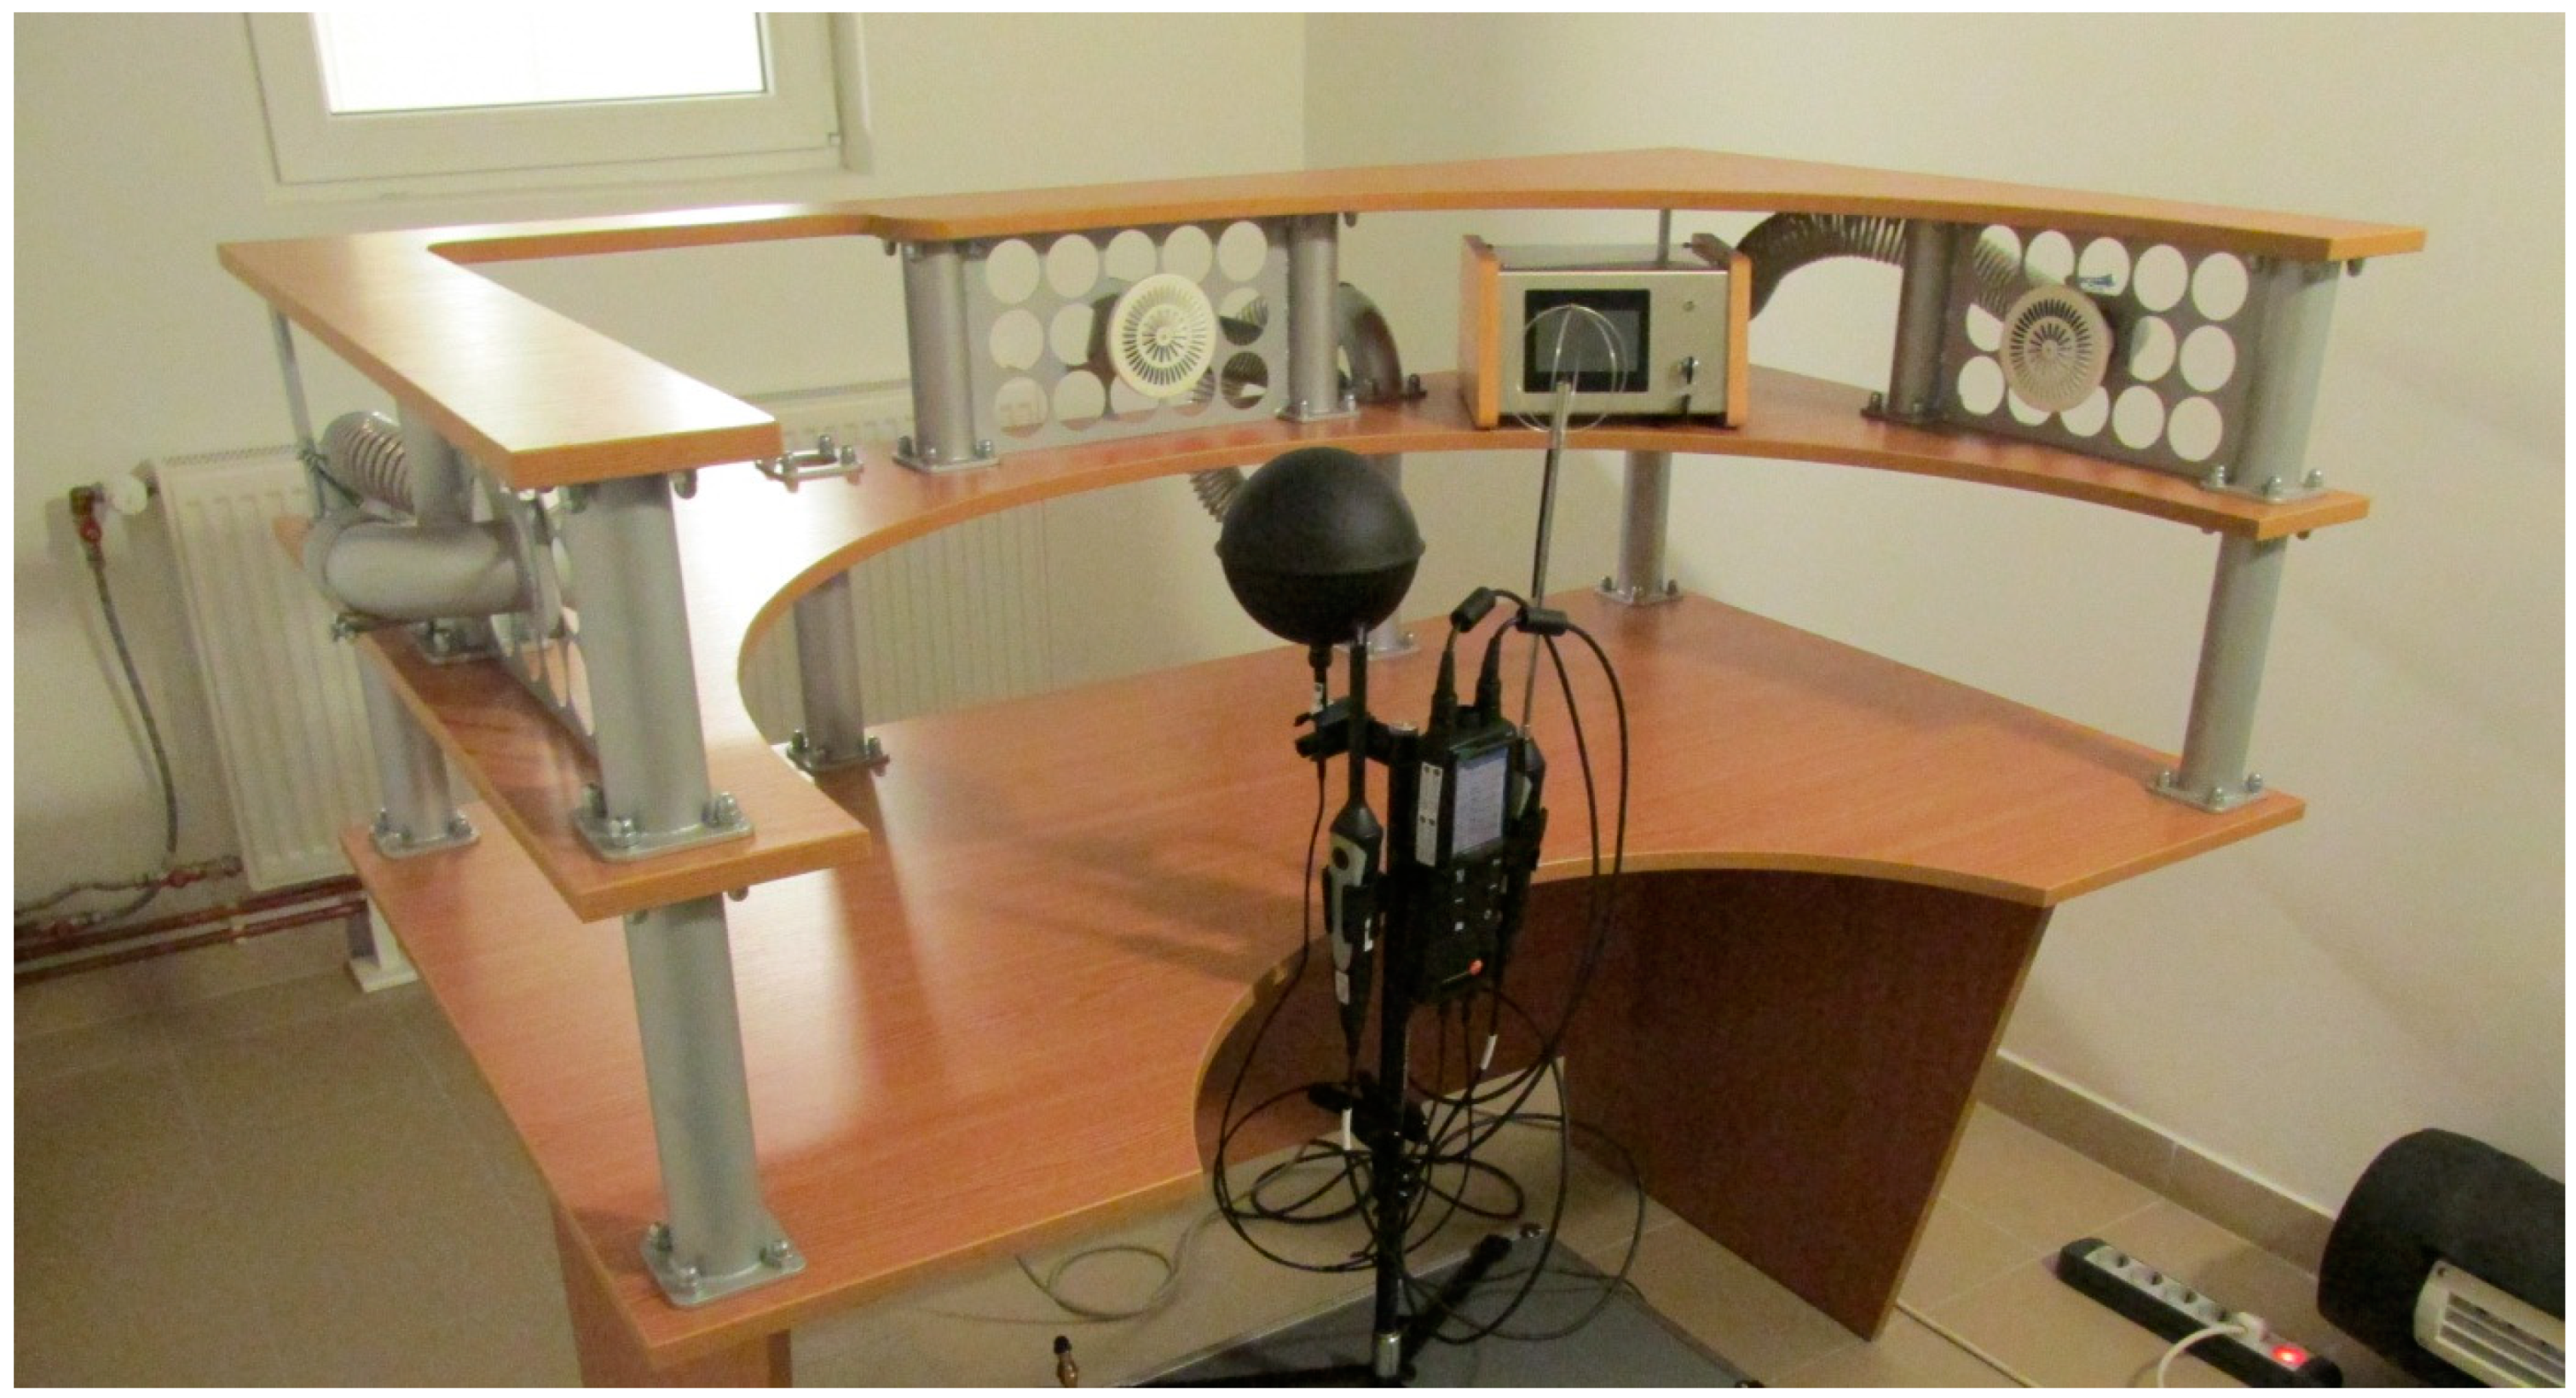
At the Department of Building Services and Building Engineering, University of Debrecen, a new PV system was developed [43,44,45,46]. The main novelty of the system (ALTAIR), is that the air jet is blown on the head and chest of the occupant sitting at a desk alternatively from three different directions (Figure 1).
Using the ALTAIR PV equipment a series of measurements were carried out in order to investigate to thermal comfort sensation and indoor environment quality (IEQ) perception of 10 young and 10 elderly, 10 male and 10 female subjects. The experiments were performed in controlled environment setting the mean radiant and air temperature to 30 °C. The subjects were not informed about the values of the indoor air parameters, neither about the schedule of the experiments. Fresh air was assured continuously during the measurement (50 m3 h−1), by displacement air distribution mode at a temperature of 30 °C. The speed of the built-in fan of the advanced ALTAIR PV equipment can be chosen and set by the user through a touchscreen. At higher fan speed values the air flow blown on the occupants head and chest and the air velocity are higher. Taking into account the elevated air- and mean radiant temperatures in the test room the air flow circulated by ALTAIR was set to 20 m3⋅h−1. Assuming the head of the occupant in the center of a circle, the air terminal devices are placed on the circle with 0.6 m radius. With these boundary parameters, the air velocity was 0.48 m⋅s−1 around the head and chest of subjects. During the experiments the background ventilation provides the required fresh air for one person sitting in the test room, so the ALTAIR PV was not connected to the ventilation system, it circulates the air in the room only. The measurement was two hours long, which was split into four different periods of 30 min each.
During the first 30 min subjects were sitting at the desk, but the ALTAIR’s built in fan was not in operation. Practically, these 30 min were considered as an accommodation period to the elevated temperatures. After the first 30 min, the ALTAIR’s own fan was switched on. The air flow circulated by the ALTAIR was constant during the next periods of the experiments. In the second period of 30 min, the air jet direction blown on the subjects was changed every 30 min. Having a 30 °C air temperature and a 0.48 m⋅s−1 air velocity, the turbulence intensity measured with a TESTO 480 instrument was 18.8%. During the third period of the experiments, the time step of changing the air jet direction was set to 20 s. The measured air turbulence was 19.1%. In the last period of the measurements the time step of changing the direction of the air jet was reduced to 10 s. The turbulence intensity in this period increased to 20.6%. First and foremost, measurements were performed without subjects and all indoor air parameters were registered with a TESTO 480 instrument. According to this measurement, the PMV shown by the instrument was 1.44 in the first period (ALTAIR switched off) and 0.84 in the 2nd, 3rd, and 4th periods of the experiment (ALTAIR in switched on). The time step of air jet direction changing had no effect on the measured PMV. During the experiments, subjects sitting at the desk could learn or read a book. Eating or changing the position or clothes was prohibited. Taking into account the elevated temperatures drinking water was allowed. Every 10 min, subjects were asked to fill in a questionnaire [28]. First, they had to evaluate on the seven-point scale about the thermal environment. On this scale 0 means neutral (the optimal thermal comfort sensation). The other values are −3 (cold), −2 (cool), −1 (slightly cool), +1 (slightly warm), +2 (warm), and +3 (hot). Then, subjects had to evaluate the odor in the indoor air (no special odor was used during the experiments) on a six point scale. On this scale 0 means that no odor is perceived. Other values are: 1 (slight odor), 2 (moderate odor), 3 (strong odor), 4 (very strong odor) and 5 (overpowering odor). The acceptability of the indoor environments was evaluated by subjects on a three-point scale: +1 (clearly acceptable), 0 (just acceptable), and −1 (clearly unacceptable). Other question was related to the velocity of the indoor air. Subjects were asked if they can accept, or not, the air velocity. In the case of a negative response, they had to clarify whether they want to increase or decrease the air velocity. Draft may lead to thermal discomfort, even in properly designed environments, so subjects were asked about draft perception. In the case of positive responses, they had to identify the body segment, where they perceived the draft (head, neck, arms, back, legs, and ankles). Air freshness is other important question, related to the indoor environment quality. Subjects were asked whether they were content or not with the air freshness. The last question was related to the surface temperatures. Subjects were asked whether they were content or not with the surface temperatures. In the case of negative responses, subjects were asked to identify the building element which had an unacceptable surface temperature for them, and they had to clarify what to do with the surface temperature (increase or decrease).
Based on the results of this investigation presented in [28], using fuzzy logic, a fuzzy comfort index was developed.
5. Fuzzy Decision System
Approaching comfort theory with fuzzy logic is based on the ‘tipping’ fuzzy example. In the course of the research, the authors of the article distinguished nine parameters that could describe the inner environment of a building. Of the nine attributes, only two were selected to set up the mathematical model for simpler proofing. Two properties were chosen to characterize the quality of the internal environment. Odor intensity was evaluated on a scale of 0–5, while thermal sensation was evaluated on a −3 to 3 scale. The internal environment is ranked by these values and then it is calculated using these numbers by fuzzy inferences which index number is used to characterize the internal environment. The fuzzy rule system consists of:
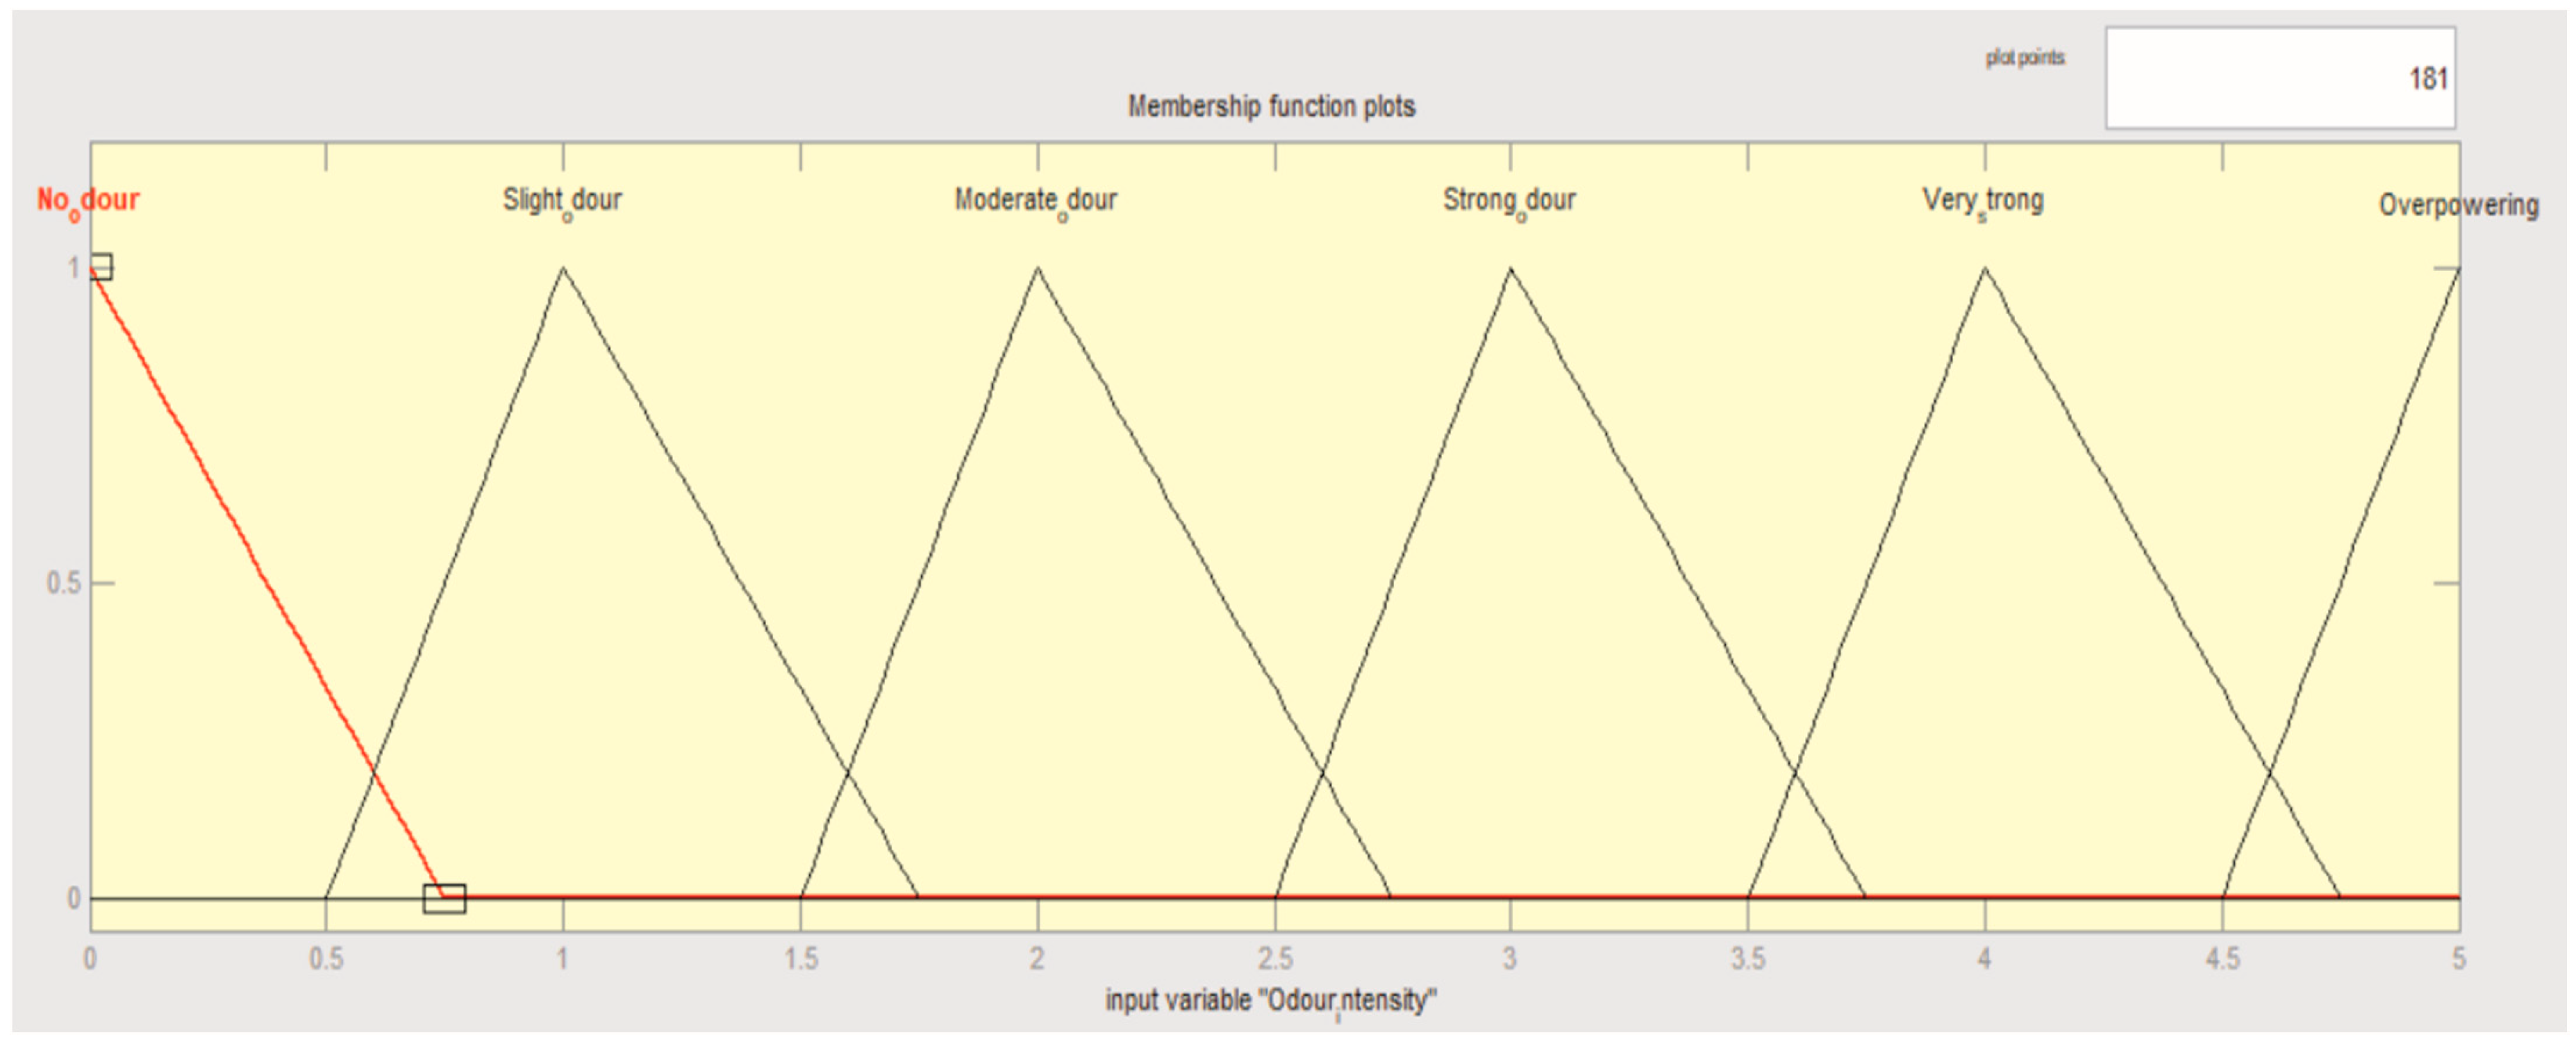
1. Odor Intensity is categorized with six fuzzy membership functions. According to the classification the food may be no odor, slight odor, moderate odor, strong odor, very strong, overpowering (Figure 2).
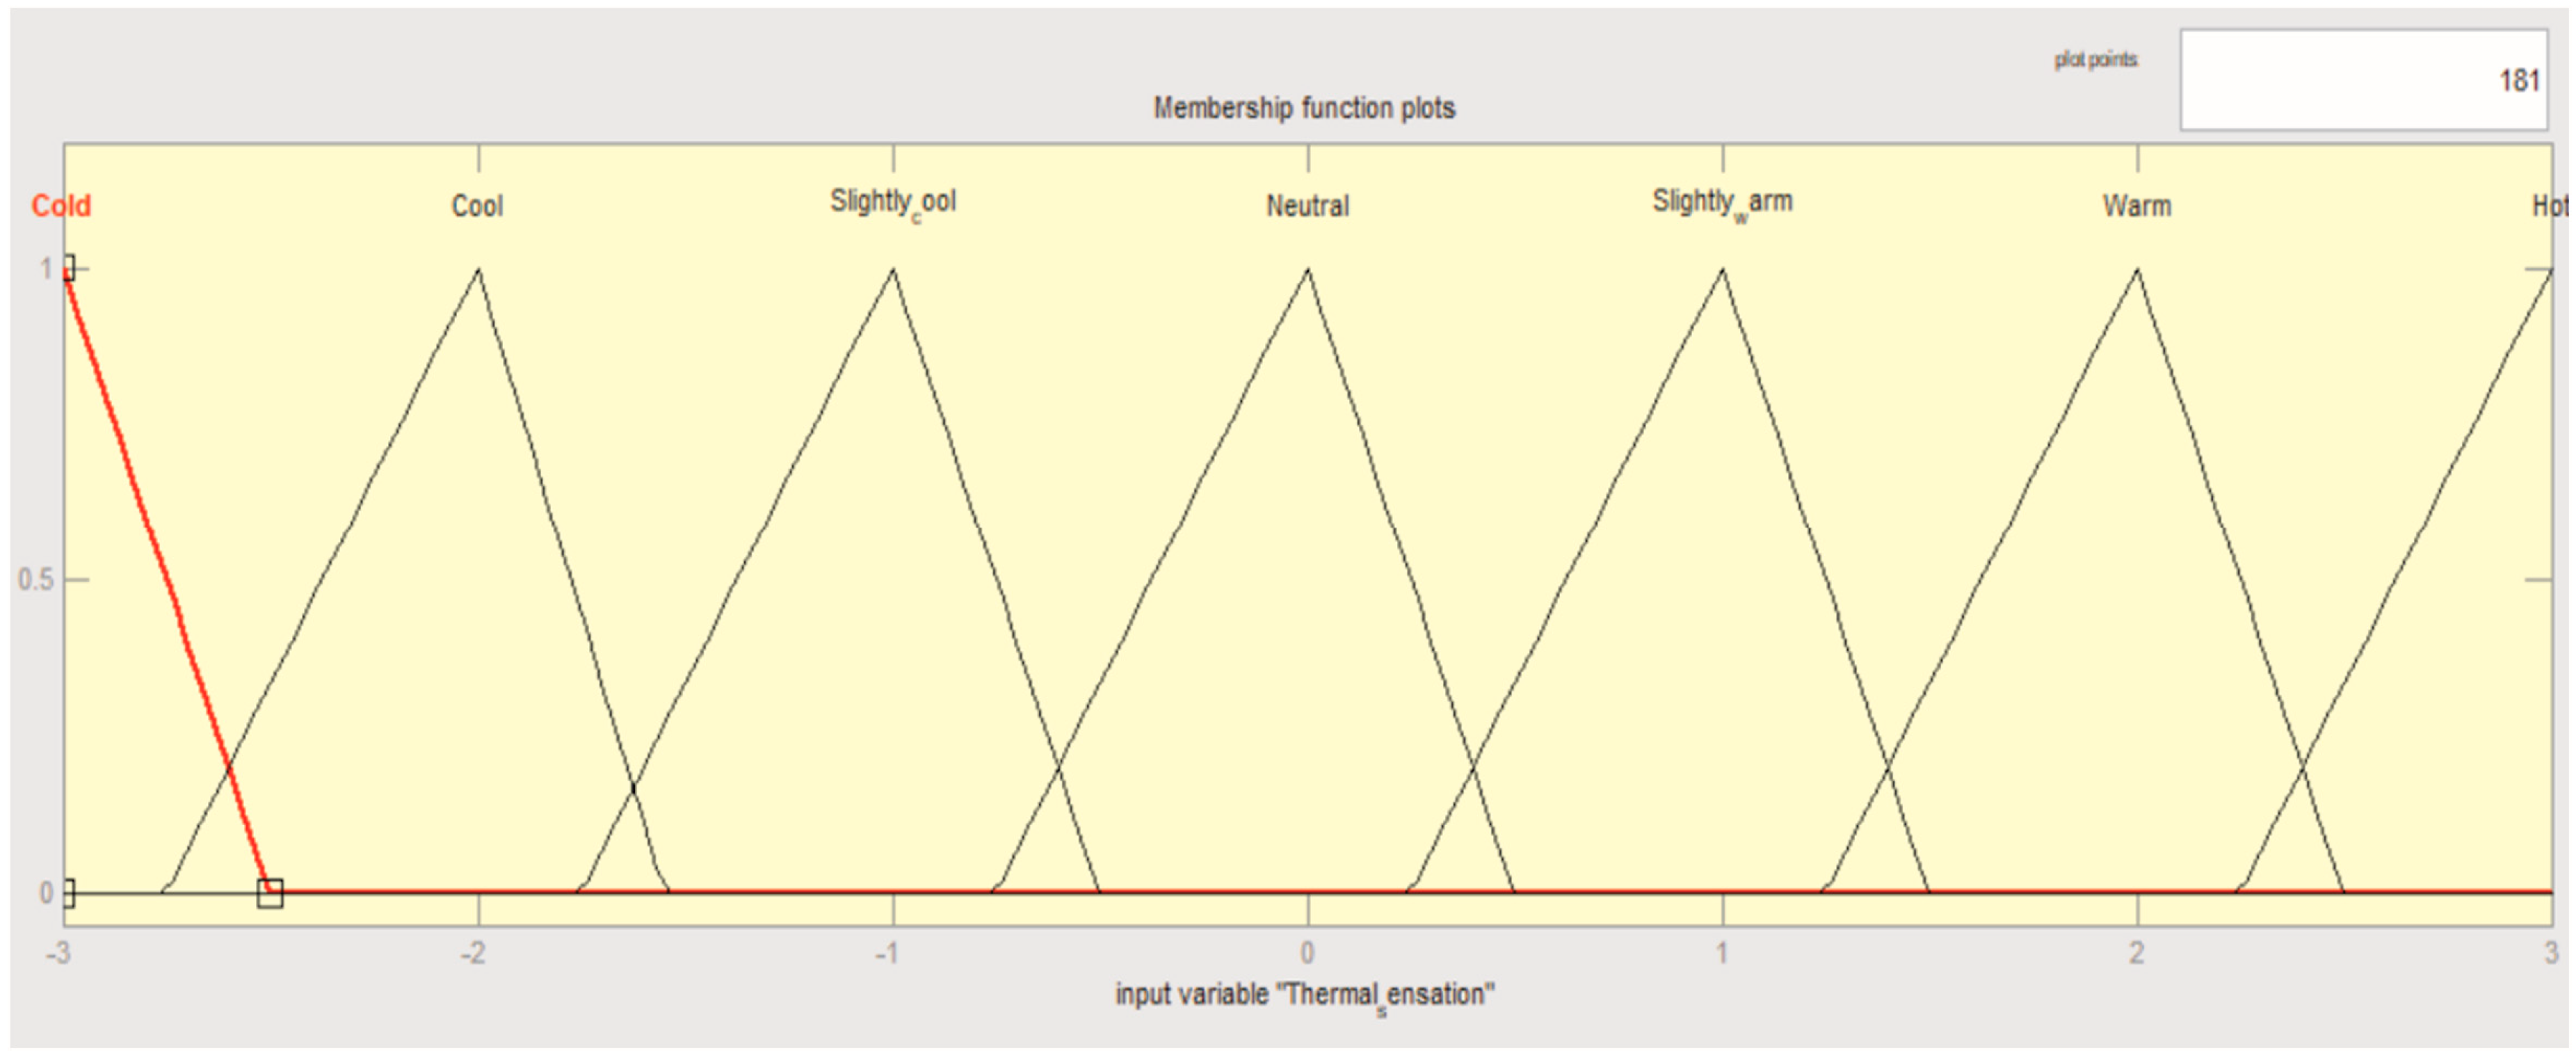
2. Thermal sensation is divided into seven fuzzy sets: cold, cool, slightly cool, neutral, slightly warm, warm, hot (Figure 3).
The formulas above describe the logical connections between each opinion. The “odor intensity” contains three sets: unpleasant, acceptable, and excellent. These scales are not developed by a real questionnaire, and it is an important part of follow-up research. Figure 2 shows the graphical view of the functions, where the scale is between 0 and 10. It is very easy to see the common parts of the sets.
Thermal sensation is the second part of the research. The formulas work on the similar way like in the previous case. It is containing three parts: unpleasant, acceptable and excellent. The scale is, again, between 0 and 10.
Figure 3 shows the functions. When you identify internal comfort, you consider odor intensity and the thermal sensation between rate 0 and 10. We can use this to identify the internal comfort.
Inputs
Odor intensity
- Universe (i.e., crisp value range): To what extent the smell was deemed good?
Thermal sensation
- How the temperature was deemed?
Outputs
Internal comfort
- Fuzzy set: malaise, acceptable well-being, excellent well-being
6. Possibilities of Fuzzy Comfort Index
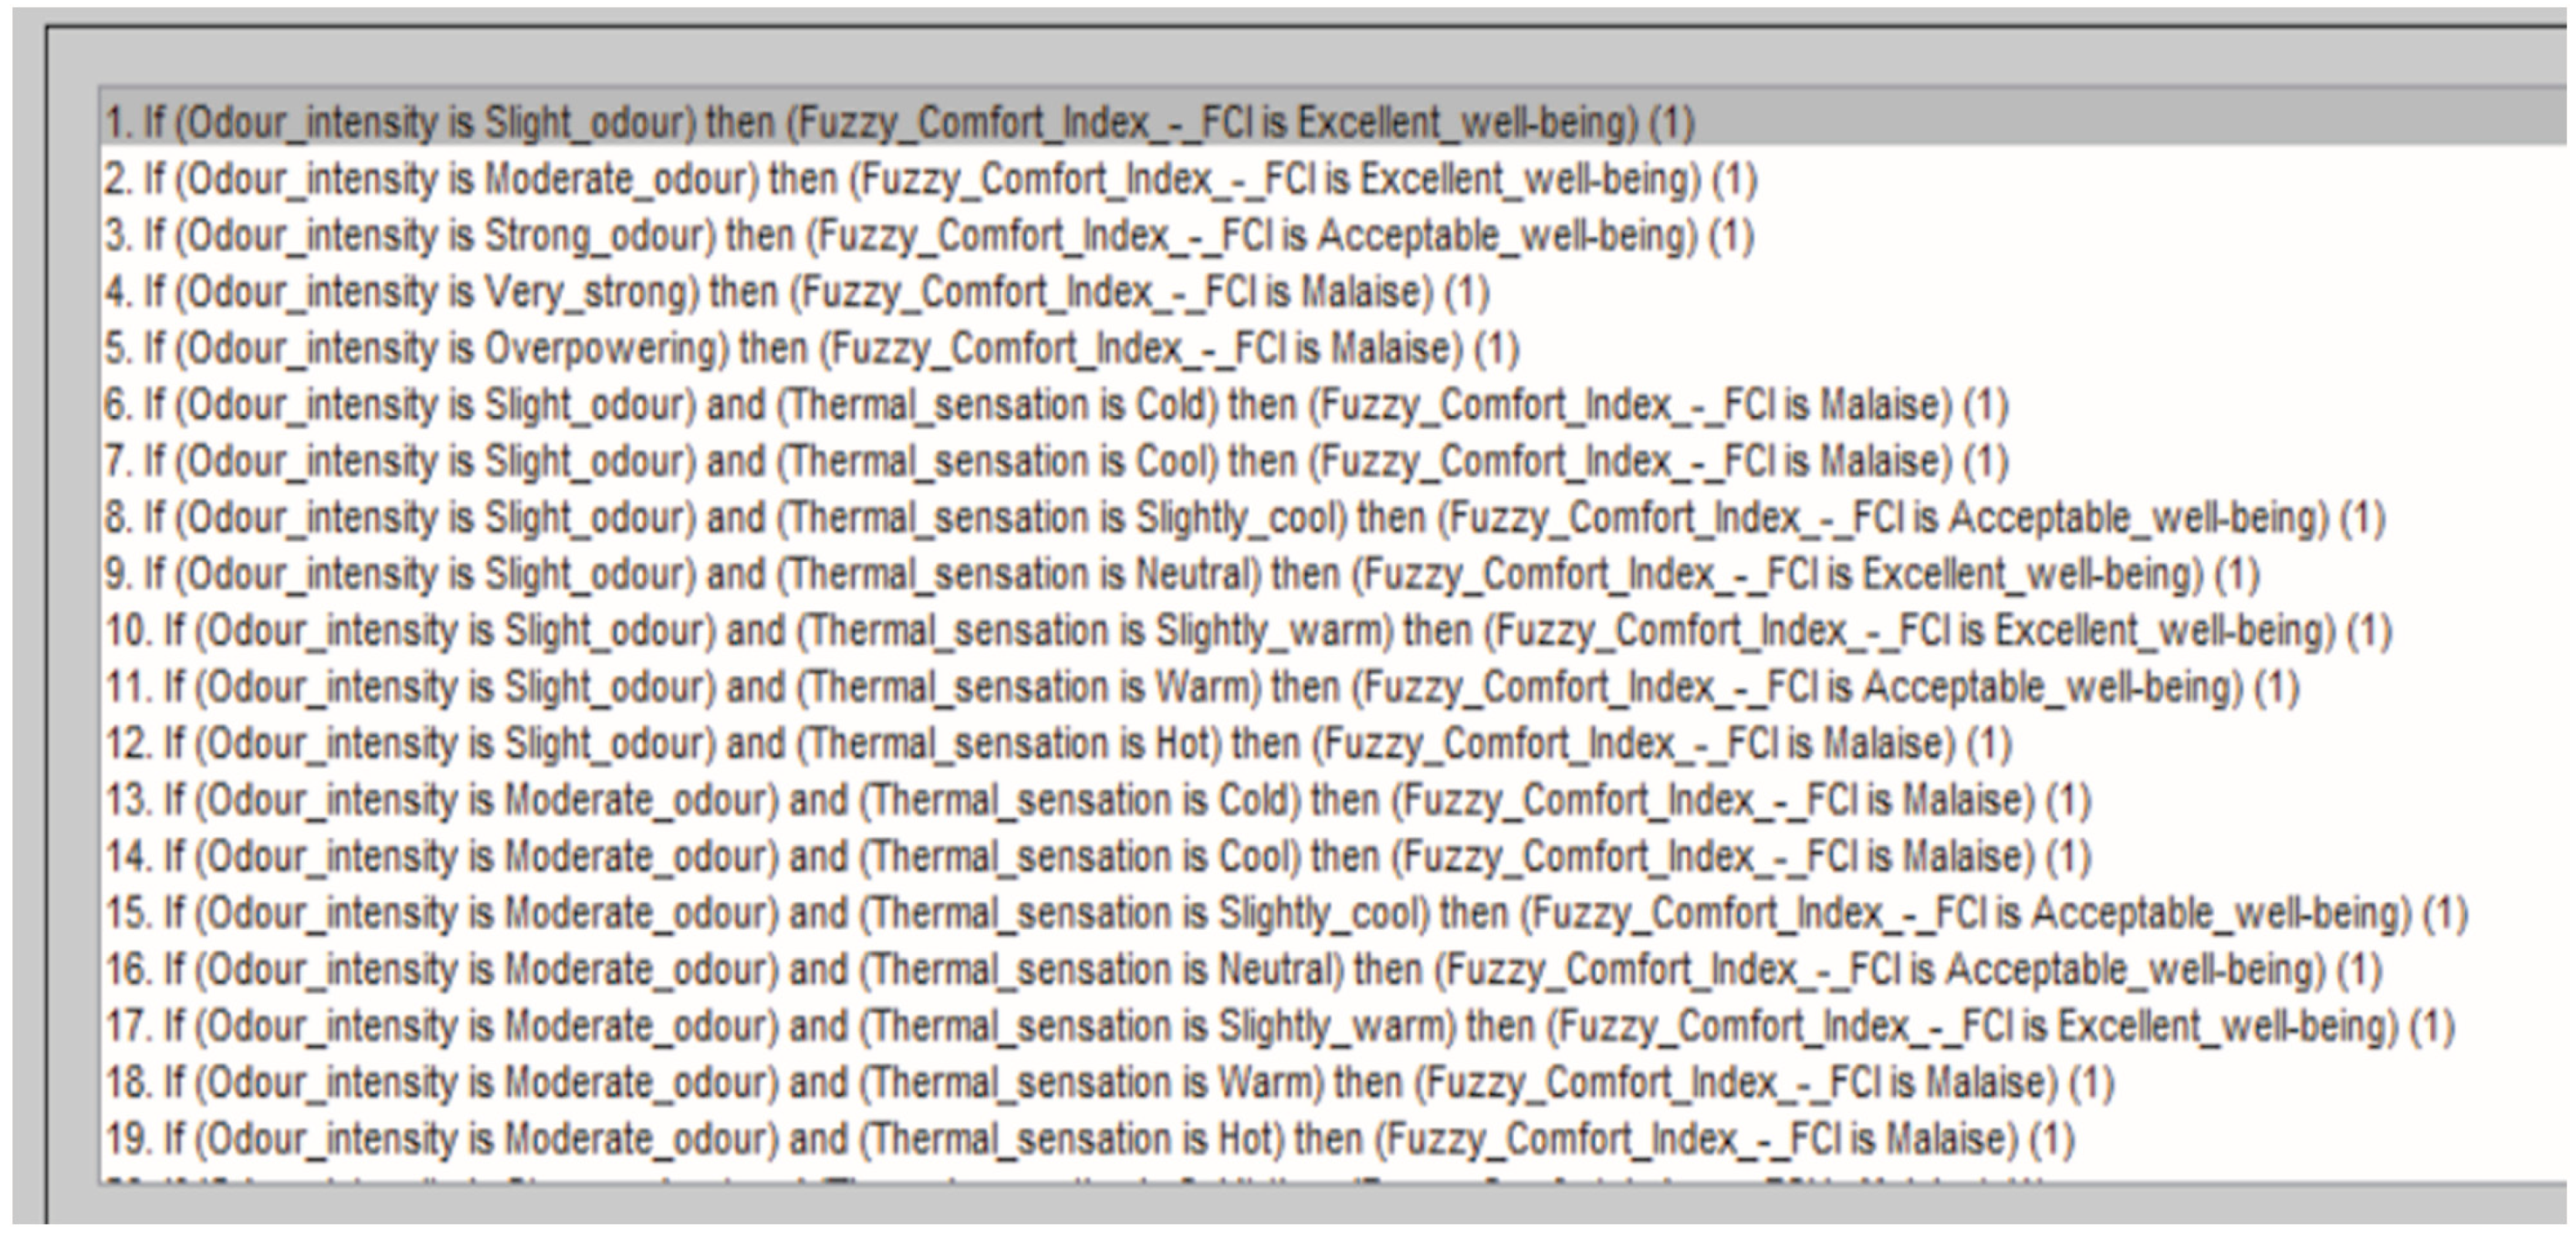
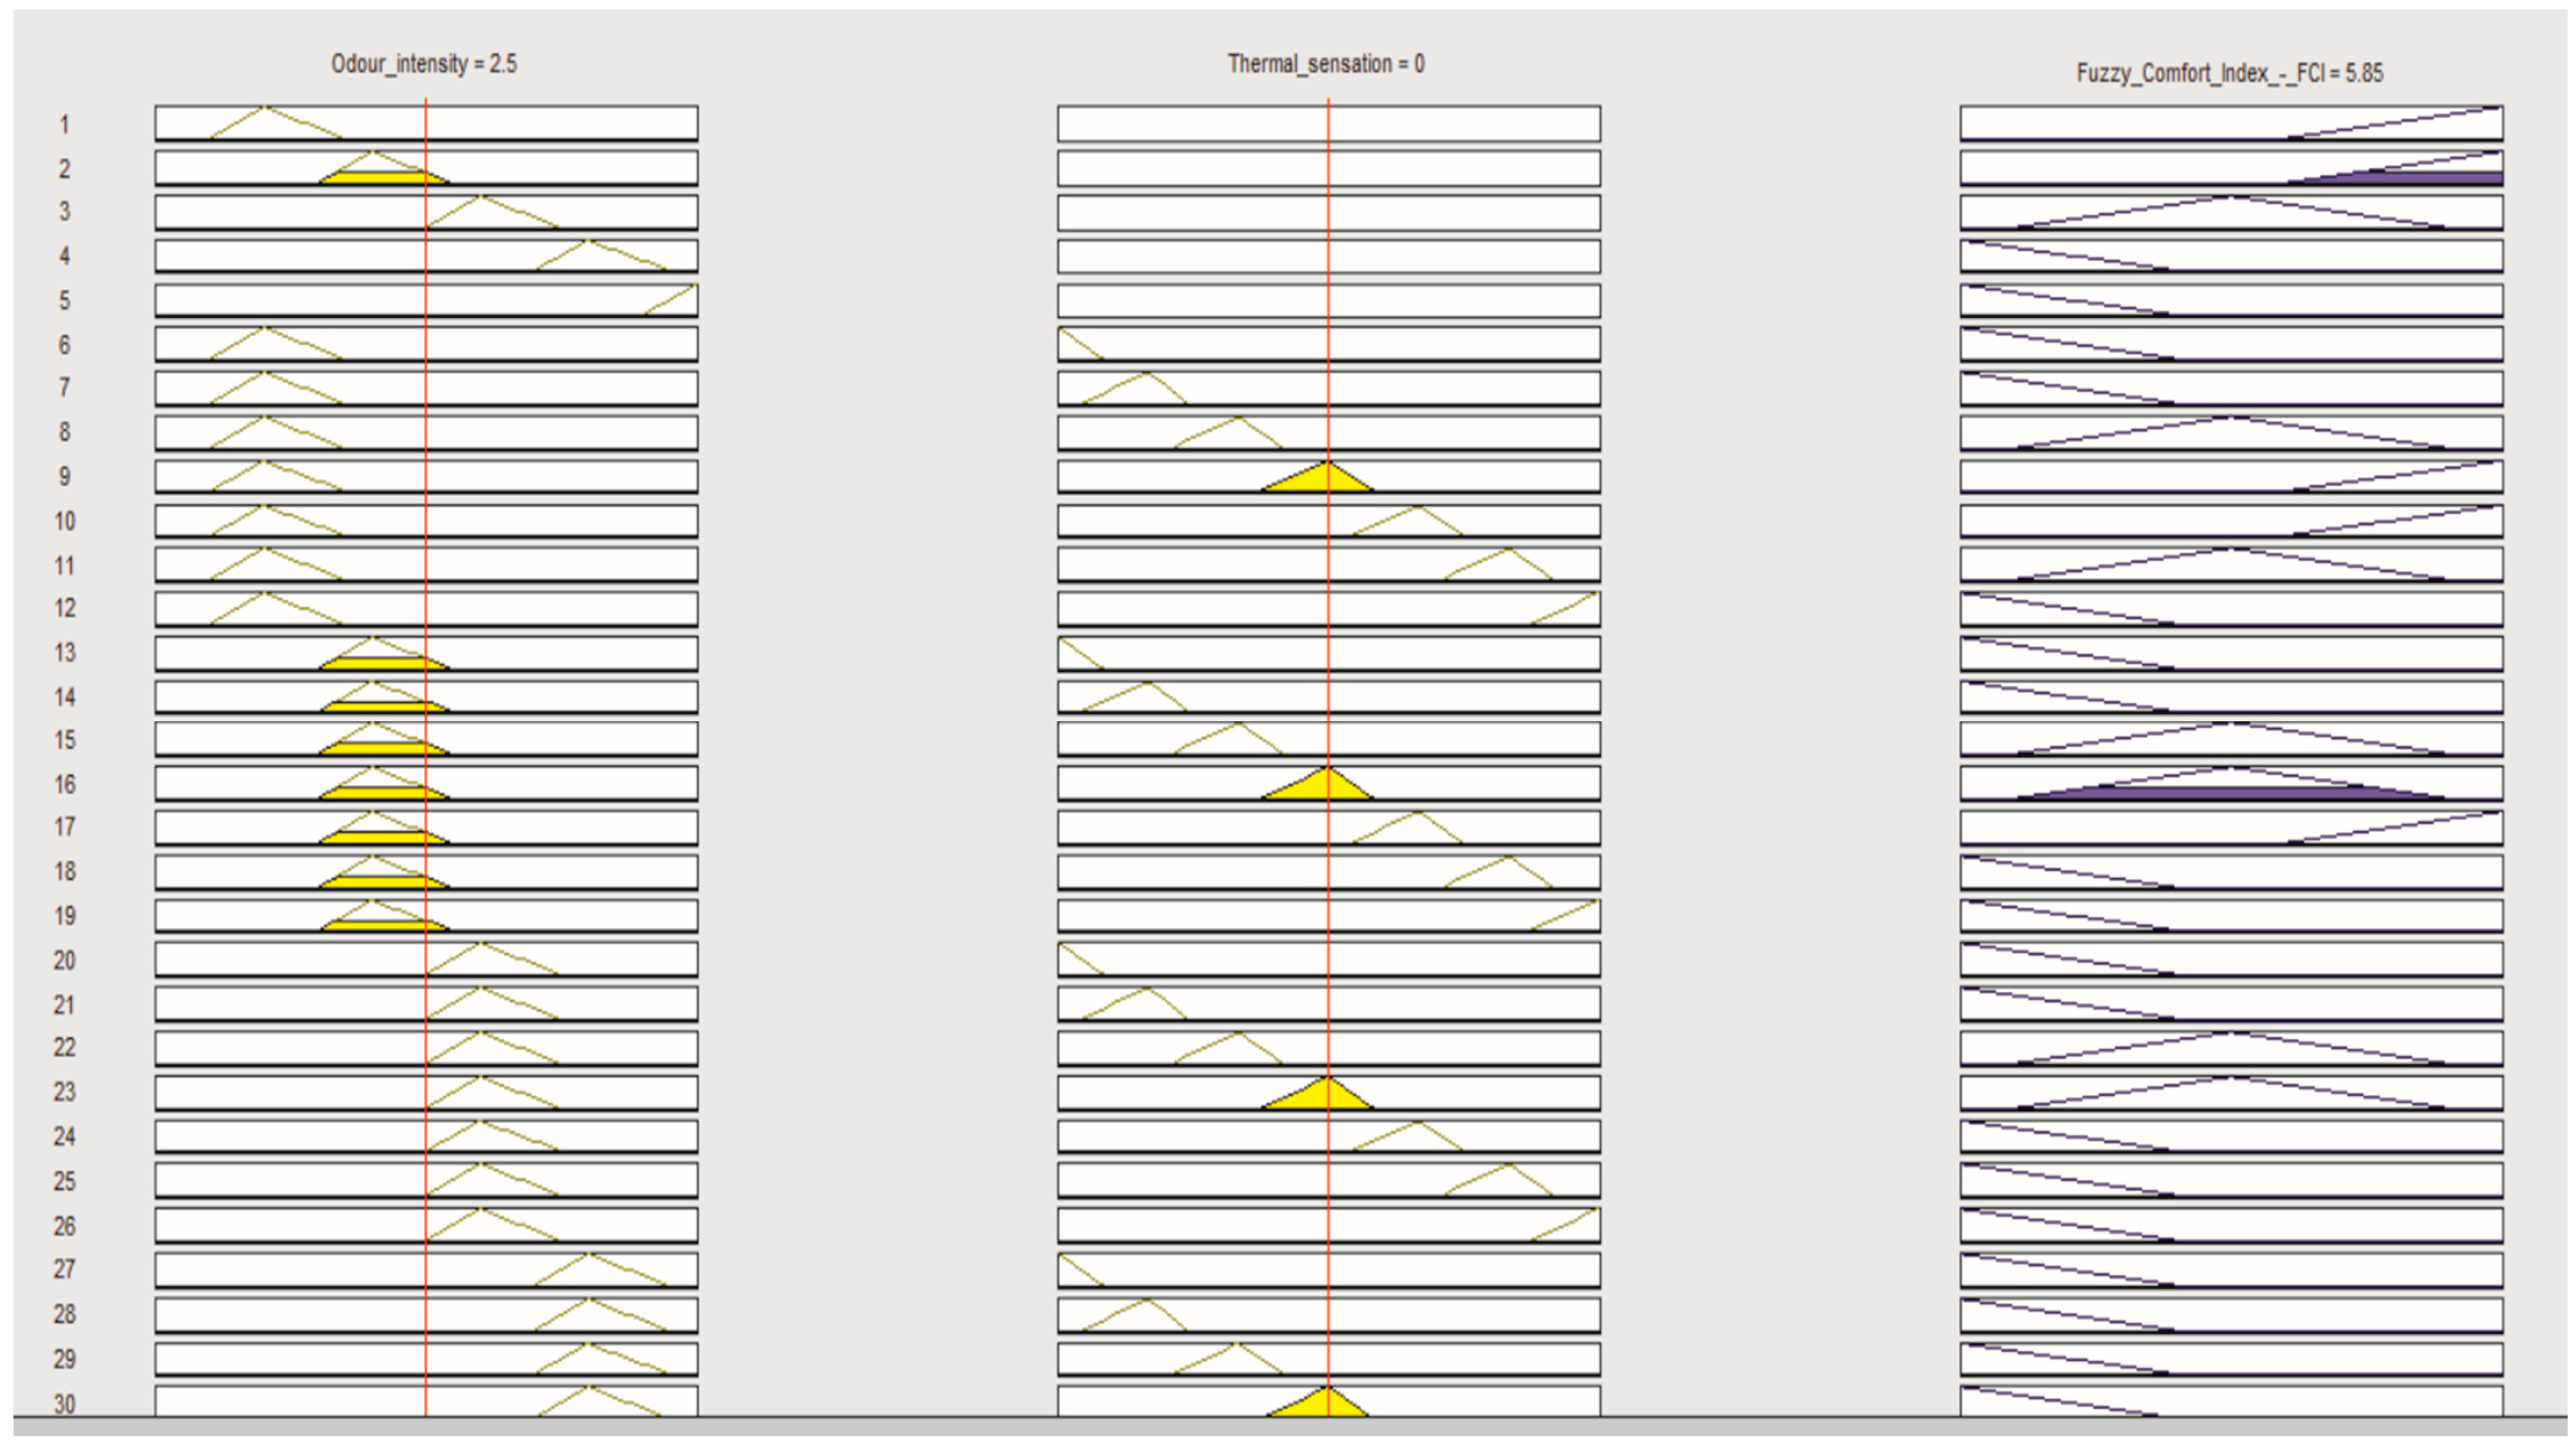
Correlation between fuzzy membership functions of input data (Odor Intensity and Thermal Sensation) and output data (Fuzzy Comfort Index) is developed by fuzzy rules. This particular task included 30 fuzzy rules (Figure 4).
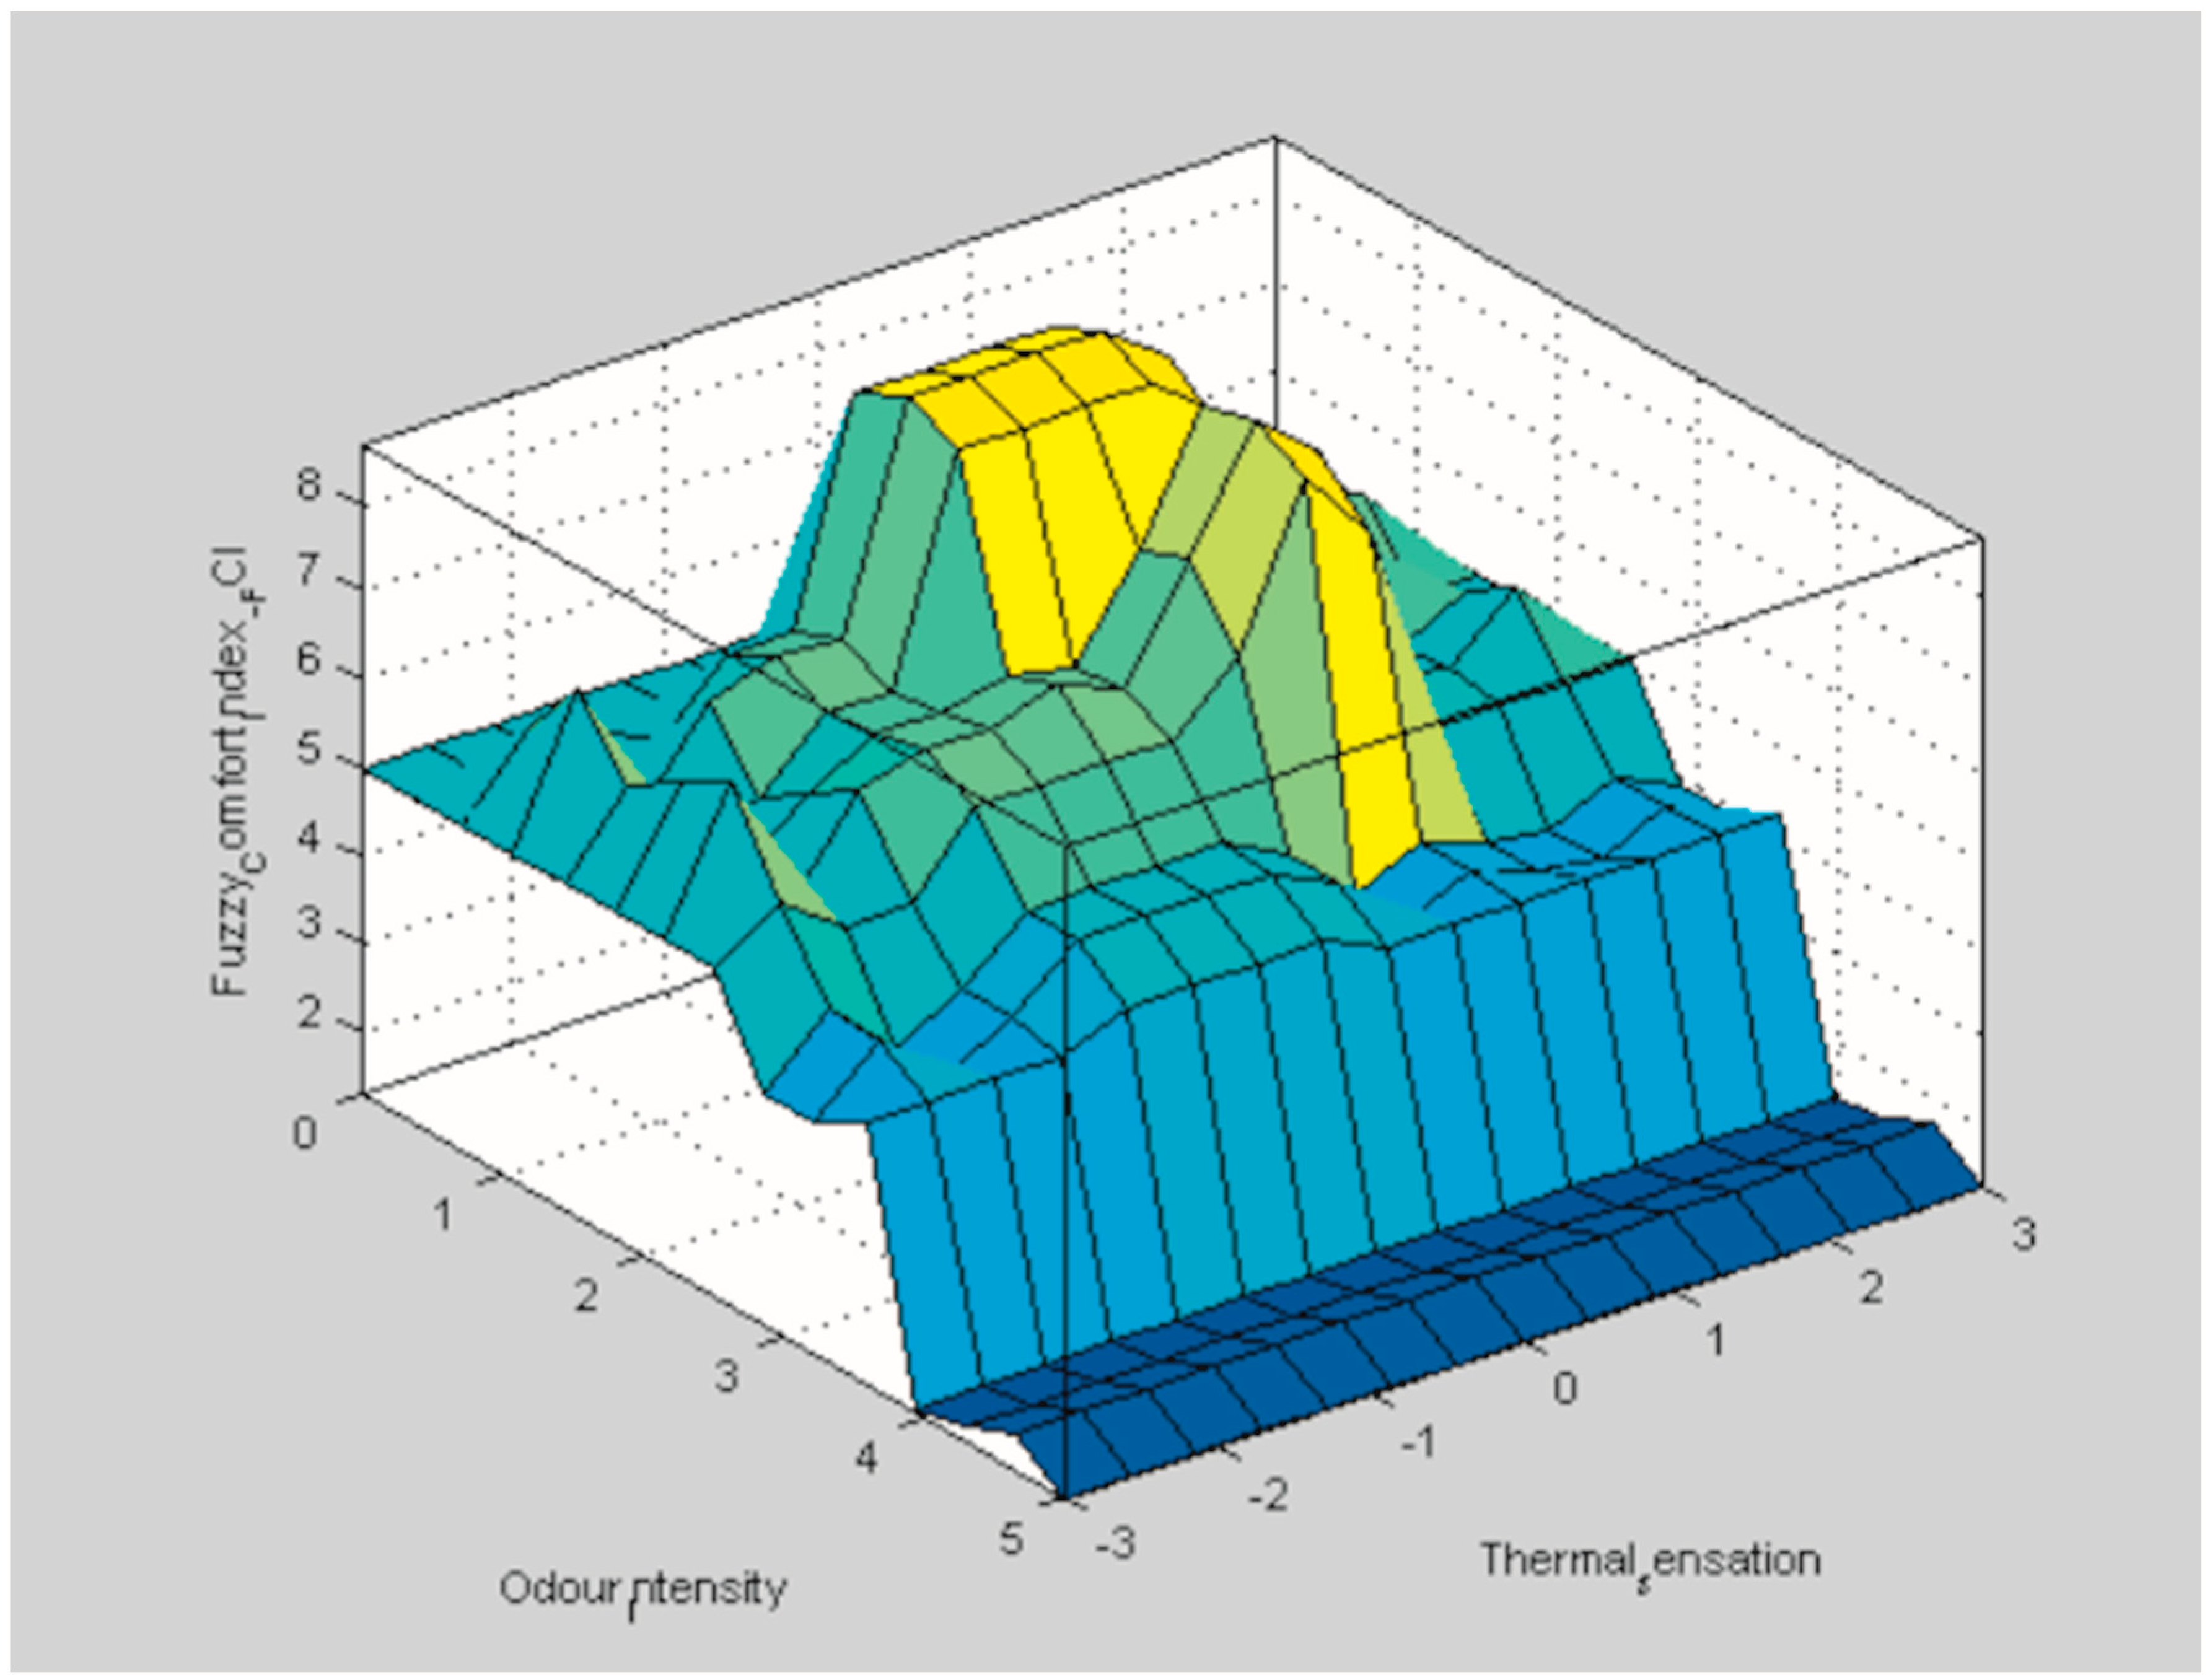
Membership functions and rules are shown in the following (Figure 5) graph surface.
The surface shown in Figure 5 clearly defines parameter intervals which determine the quality of the internal environment. According to the dark blue surfaces, comfort is not satisfactory, while in the case of the citrus yellow surface, the comfort of the participants tested is particularly satisfactory.
The rule system can show the result for us (Figure 6).
On the right side of Figure 8 we can see the Fuzzy Comfort Index (FCI). The index result is 5.85 (Figure 7).
This index may be a specific number for the internal space. The nine sets and a special rule system can support or give a special fuzzy scale which can absolutely describe the room regarding comfort. The authors need to study how the problem can be solved with nine properties.
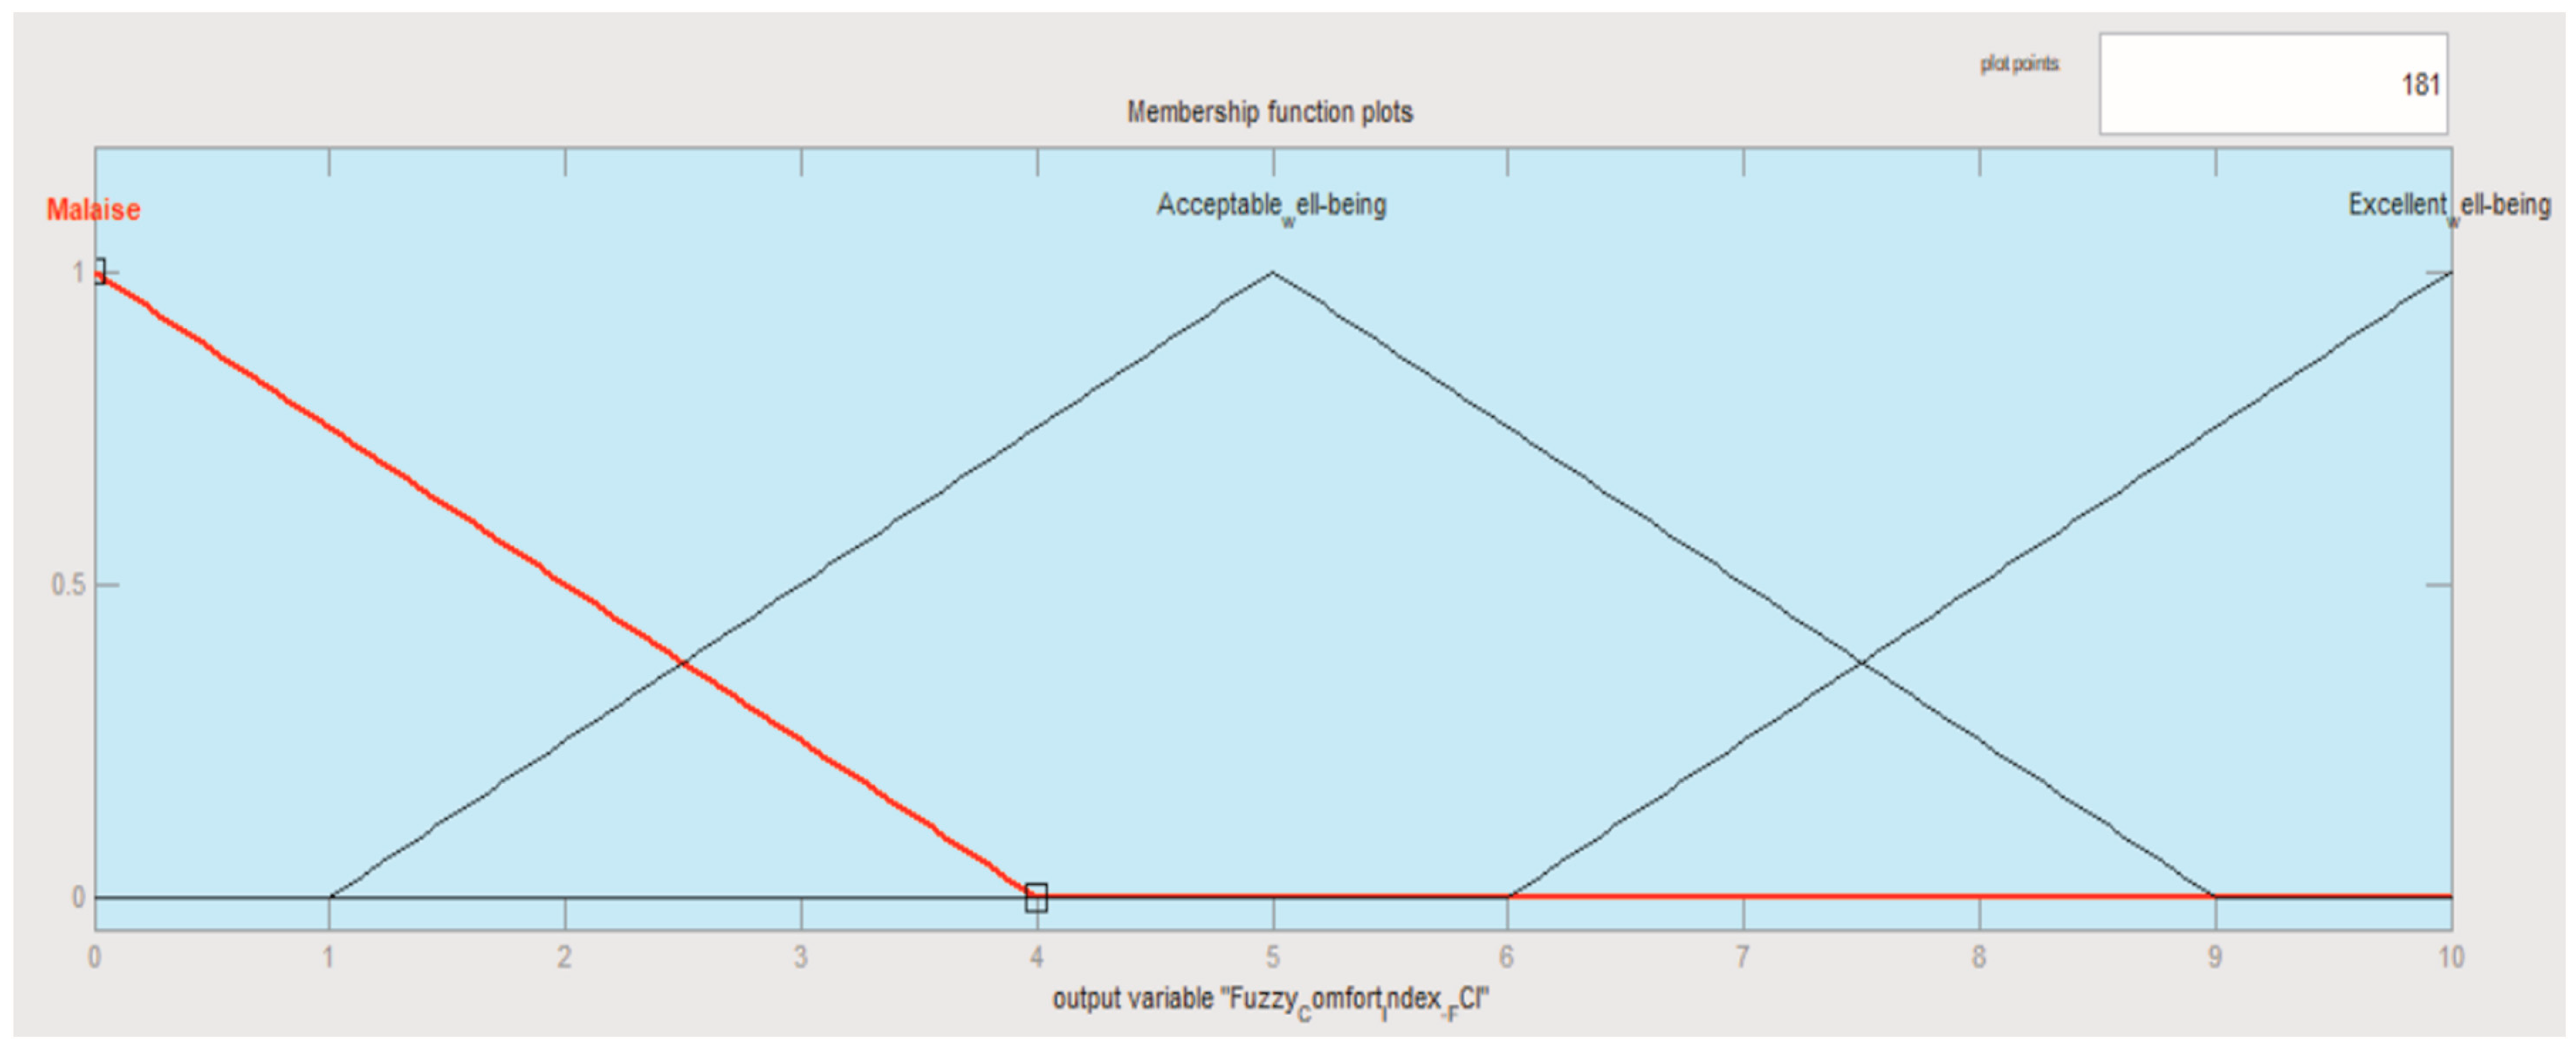
This paper suggests that the Fuzzy Logic can describe the comfort property of a room, but the future work needs more experiments and calculations. Three types of fuzzy classes characterize the internal environment: (Fuzzy Comfort Index, FCI) (Figure 8), which may be subdivided into malaise, acceptable well-being, and excellent well-being.
Figure 8 represents the FCI index sets. The results can be between 0 and 10 on this line. The results above (5.85) are in the middle range of this system. These sets are made by the authors, which depend on the investigated person’s subjective opinion and experience.
7. Conclusions
The study presents a possible comfort theory indicator with fuzzy logic and MATLAB. Graphs allow determining an index number that describes a closed space, a room/indoor environment. Out of the possible nine parameters, the article examines only two; the future goal is the extension of the mathematical model to the nine possible properties and the processing of real time data, which takes the dynamic changes in the examined room into account. The entire process described above, getting to the fuzzy output from the numerical inputs by input fuzzy membership functions and the fuzzy rules, is defuzzificated with the center-of-gravity method, it is the so-called Mamdani’s inference. The fuzzy system may have much more than two inputs. If we assign 3–4 or more fuzzy membership functions to each input, thousands of fuzzy rule units are required in the simulations, and this may make it very difficult to calculate both the fuzzy output and the full defuzzification process. Another, commonly used solution to avoid the complicated defuzzification and fuzzy output calculation is to teach the behavior of a complete fuzzy system to an artificial neural network (ANN). The neural network requires learning data system to learn. These are created by determining the output of the complicated fuzzy system for several different inputs. These outputs will be the expected values during the teaching of the neural network when the same inputs are received by the neural network as the fuzzy system. When the neural network is able to provide the same output as the fuzzy system for learning data, it will be able to model further fuzzy system operation on additional test data. The output will only be approximately the same as the fuzzy system, but this output may be calculated much faster, which means a higher efficiency. Such neural network modelled fuzzy systems are called neuro-fuzzy systems. Researchers intend to implement these points in their future research on the quality of the internal environment [47].
The created index allows to describe an internal room or to characterize an existing internal environmental quality, which may even be recorded by legislation.
8. Limitations
Measurements were performed in the laboratories of the Faculty of Engineering, University of Debrecen. The size of the test room, the building materials and surfaces of building elements of the test room, and the type and location of air terminal devices of mixing and displacement ventilation were considered as given boundary conditions. In the development of the new fuzzy comfort index only two parameters were taken into consideration.
Author Contributions
Conceptualization: F.K. and J.M.; methodology: J.M.; investigation: J.M. and F.K.; resources: F.K.; data curation: J.M.; writing—original draft preparation: F.K. (CH. 1, 4, 7) and J.M. (ch. 2, 3, 5,6); writing—review and editing: F.K.; visualization: J.M. and F.K.; supervision: F.K.; project administration: F.K
Funding
The research was financed by the Higher Education Institutional Excellence Programme of the Ministry of Human Capacities in Hungary, within the framework of the Energetics Thematic progTramme of the University of Debrecen.
Conflicts of Interest
The authors declare no conflict of interest.
References
- Directive 2010/31/EU of the European Parliament and of The Council of 19 May 2010 on the energy performance of buildings. Available online: https://eur-lex.europa.eu/legal-content/EN/TXT/?uri=CELEX%3A32010L0031. (accessed on 10 March 2019).
- Ürge-Vorsatz, D.; Cabeza, L.F.; Serrano, S.; Barreneche, C.; Petrichenko, K. Heating and cooling energy trends and drivers in buildings. Renew. Sustain. Energy Rev. 2015, 41, 85–98. [Google Scholar] [CrossRef] [Green Version]
- Isaac, M.; van Vuuren, D.P. Modeling global residential sector energy demand for heating and air conditioning in the context of climate change. Energy Policy 2009, 37, 507–521. [Google Scholar] [CrossRef]
- Levesque, A.; Pietzcker, R.C.; Baumstark, L.; de Stercke, S.; Grübler, A.; Luderer, G. How much energy will buildings consume in 2100? A global perspective within a scenario framework. Energy 2018, 148, 514–527. [Google Scholar] [CrossRef]
- Szodrai, F.; Lakatos, Á. Effect of wetting time in the sorption and in the thermal conductivity of the most commonly used structural materials. Build. Serv. Eng. Res. Technol. 2017, 38, 475–489. [Google Scholar] [CrossRef]
- Szodrai, F.; Lakatos, Á. Effect of the air motion on the heat transport behaviour of wall structures. Int. Rev. Appl. Sci. Eng. 2017, 8, 67–73. [Google Scholar] [CrossRef] [Green Version]
- Ákos, L.; István, D.; Umberto, B. Thermal characterization of different graphite polystyrene. Int. Rev. Appl. Sci. Eng. 2018, 9, 163–168. [Google Scholar]
- Lakatos, Á. Stability investigations of the thermal insulating performance of aerogel blanket. Energy Build. 2019, 185, 103–111. [Google Scholar] [CrossRef]
- Baglivo, C.; Congedo, P.M.; Di Cataldo, M.; Colucci, L.D.; D’Agostino, D. Envelope Design Optimization by Thermal Modelling of a Building in a Warm Climate. Energies 2017, 10, 1808. [Google Scholar] [CrossRef]
- Molinari, M.; Lazzarotto, A.F.B. The application of the parametric analysis for improved energy design of a ground source heat pump for residential buildings. Energy Build. 2013, 63, 119–128. [Google Scholar] [CrossRef]
- Brown, N.W.O.; Malmqvist, T.; Bai, W.; Molinari, M. Sustainability assessment of renovation packages for increased energy efficiency for multi-family buildings in Sweden. Build. Environ. 2013, 61, 140–148. [Google Scholar] [CrossRef]
- Al horr, Y.; Arif, M.; Katafygiotou, M.; Mazroei, A.; Kaushik, A.; Elsarrag, E. Impact of indoor environmental quality on occupant well-being and comfort: A review of the literature. Int. J. Sustain. Built Environ. 2016, 5, 1–11. [Google Scholar] [CrossRef] [Green Version]
- Björnsson, E.; Janson, C.D.; Norbäck, G.B. Symptoms related to the Sick Building Syndrome in a general population sample: associations with atopy, bronchial hyper-responsiveness and anxiety. Int. J. Tuberc. Lung. Dis. 1998, 2, 1023–1028. [Google Scholar]
- Wargocki, P.; Wyon, D.P. Ten questions concerning thermal and indoor air quality effects on the performance of office work and schoolwork, Ten questions concerning thermal and indoor air quality effects on the performance of office work and schoolwork. Build. Environ. 2017, 112, 359–366. [Google Scholar] [CrossRef]
- Kang, S.; Ou, D.; Mak, C.M. The impact of indoor environmental quality on work productivity in university open-plan research offices. Build. Environ. 2017, 124, 78–89. [Google Scholar] [CrossRef]
- Schaudienst, F.; Vogdt, F.U. Fanger’s model of thermal comfort: A model suitable just for men? Energy Procedia 2017, 132, 129–134. [Google Scholar] [CrossRef]
- Cheung, T.; Schiavon, S.; Parkinson, T.; Lib, P.; Brager, G. Analysis of the accuracy on PMV–PPD model using the ASHRAE Global Thermal Comfort Database II. Build. Environ. 2019, 153, 205–217. [Google Scholar] [CrossRef]
- Geng, Y.; Ji, W.; Lin, B.; Zhu, Y. The impact of thermal environment on occupant IEQ perception and productivity. Build. Environ. 2017, 121, 158–167. [Google Scholar] [CrossRef]
- Fanger, P.O.; Comfort, T. Analysis and Applications in Environmental Engineering; Danish technical Press: Copenghagen, Denmark, 1970; pp. 114–131. [Google Scholar]
- Nicol, J.F.; Humphreys, M.A. Adaptive thermal comfort and sustainable thermal standards for buildings. Energy Build. 2002, 34, 563–572. [Google Scholar] [CrossRef]
- de Dear, R.; Brager, G.S. The adaptive model of thermal comfort and energy conservation in the built environment. Int. J. Biometeorol. 2001, 45, 100–108. [Google Scholar] [CrossRef] [Green Version]
- Fanger, P.O.; Toftum, J. Extension of the PMV model to non air conditioned buildings in warm climates. Energy Build. 2002, 34, 533–536. [Google Scholar] [CrossRef]
- Budd, G.M. Wet-bulb globe temperature (WBGT)—Its history and its limitations. J. Sci. Med. Sport 2008, 11, 20–32. [Google Scholar] [CrossRef] [PubMed]
- Yao, R.; Li, B.; Liu, J. A theoretical adaptive model of thermal comfort—Adaptive Predicted Mean Vote (aPMV). Build. Environ. 2009, 44, 2089–2096. [Google Scholar] [CrossRef]
- Sakoi, T.; Mochida, T.; Kurazumi, Y.; Kuwabara, K.; Horiba, Y.; Sawada, S. Heat balance model for a human body in the form of wet bulb globe temperature indices. J. Therm. Biol. 2018, 71, 1–9. [Google Scholar] [CrossRef]
- ISO 7730. ISO 7730:2005, Ergonomics of the thermal environment-Analytical determination and interpretation of thermal comfort using calculation of the PMV and PPD indices and local thermal comfort criteria; International Organization for Standardization: Geneva, Switzerland, 2005. [Google Scholar]
- Ng, K.C.; Kadirgama, K.; Ng, E.Y.K. Response surface models for CFD predictions of air diffusion performance index in a displacement ventilated office. Energy Build. 2008, 40, 774–781. [Google Scholar] [CrossRef]
- Kalmár, F. An indoor environment evaluation by gender and age using an advanced personalized ventilation system. Build. Serv. Eng. Res. Technol. 2017, 38, 505–521. [Google Scholar] [CrossRef] [Green Version]
- Kocsis, I. Sets, University of Debrecen, Faculty of Engineering. Available online: http://users.atw.hu/dejegyzet/download.php?fname=./szem1/DiszkretMatek/halmaz.pdf (accessed on 14 January 2019). (In Hungarian).
- Obádovics, J.G. Mathematics, 19th ed.; Scolar Kiadó: Budapest, Hungary, 2012; ISBN 978-963-244-330-0. (In Hungarian) [Google Scholar]
- Benesóczky, Z. Boole Logic, Basic Logics; Budapest University of Technology and Economics: Budapest, Hungary, 2004. (In Hungarian) [Google Scholar]
- Subways.net, Sendai Subway. Available online: http://www.subways.net/japan/sendai.htm (accessed on 3 December 2016).
- Menyhárt, J.; Pokorádi, L. Batteries Fuzzy Based Estimation. Hadmérnök-Katonai Műszaki Tudományok Online, IX 2014, 2, 48–55. (In Hungarian) [Google Scholar]
- László, T.K. Tikk Domonkos: Fuzzy Systems. Available online: http://www.typotex.hu/download/Fuzzy/output.xml (accessed on 23 September 2016).
- Artificial Intelligence and Life in 2030: One Hundred Years Study on Artificial Intelligence, Report of the 2015 Study Panel. September 2016. Available online: https://ai100.stanford.edu/sites/g/files/sbiybj9861/f/ai_100_report_0906fnlc_single.pdf (accessed on 10 March 2019).
- Apple: Siri. Available online: https://www.apple.com/siri/ (accessed on 10 March 2019).
- Microsoft: Cortana. Available online: https://www.microsoft.com/en-us/cortana (accessed on 3 October 2019).
- Dutta, N.N. DAT T. Artificial intelligence techniques for energy efficient H.V.A.C. system design. In Proceedings of the International Conference on Emerging Technologies for Sustainable and Intelligent HVAC&R Systems, Kolkata, India, 27–28 July 2018. [Google Scholar]
- IoT for All: The Future of HVAC Lies in AI and IoT. Available online: https://www.iotforall.com/future-hvac-ai-iot/ (accessed on 3 October 2019).
- Cheng, C.-C.; Lee, D. Artificial Intelligence-Assisted Heating Ventilation and Air Conditioning Control and the Unmet Demand for Sensors: Part 1. Problem Formulation and the Hypothesis. Sensors 2019, 19, 1131. [Google Scholar] [CrossRef]
- Shukla, A.; Sharma, A. Sustainability through Energy-Efficient Buildings; CRC Press: Boca Raton, FL, USA, 2018; ISBN 9781138066755. [Google Scholar]
- Yang, L.; Yan, H.; Lam, J.C. Thermal comfort and building energy consumption implications—A review. Appl. Energy 2014, 115, 164–173. [Google Scholar] [CrossRef]
- Kalmár, F. Innovative method and equipment for personalized ventilation. Indoor Air 2015, 25, 297–306. [Google Scholar] [CrossRef]
- Kalmár, F.; Kalmár, T. Alternative personalized ventilation. Energy Build. 2013, 65, 37–44. [Google Scholar] [CrossRef]
- Kalmár, F. Impact of elevated air velocity on subjective thermal comfort sensation under asymmetric radiation and variable airflow direction. J. Build. Phys. 2017, 42, 173–193. [Google Scholar] [CrossRef] [Green Version]
- Kalmár, F.; Kalmár, T. Study of human response in conditions of surface heating, asymmetric radiation and variable air jet direction. Energy Build. 2018, 179, 133–143. [Google Scholar] [CrossRef]
- Benyó, B.; Benyó, Z.; Paláncz, B.; Szilágyi, L.; Ferenci, T. Theory of technical and biology systems. Available online: https://www.tankonyvtar.hu/hu/tartalom/tamop412A/2011_0079_benyo_muszaki_es_biologiai_rendszerek/ch09s03.html (accessed on 26 April 2019). (In Hungarian).
Figure 1.
ALTAIR PV equipment.

Figure 2.
Membership functions of odor intensity.

Figure 3.
Membership functions of thermal sensation.

Figure 4.
Fuzzy rules.

Figure 5.
3D surface.

Figure 6.
Fuzzy rules.

Figure 7.
Fuzzy Comfort Index.

Figure 8.
Fuzzy Comfort Index sets.

© 2019 by the authors. Licensee MDPI, Basel, Switzerland. This article is an open access article distributed under the terms and conditions of the Creative Commons Attribution (CC BY) license (http://creativecommons.org/licenses/by/4.0/).
Share and Cite
MDPI and ACS Style
Menyhárt, J.; Kalmár, F. Investigation of Thermal Comfort Responses with Fuzzy Logic. Energies 2019, 12, 1792. https://doi.org/10.3390/en12091792
AMA Style
Menyhárt J, Kalmár F. Investigation of Thermal Comfort Responses with Fuzzy Logic. Energies. 2019; 12(9):1792. https://doi.org/10.3390/en12091792
Chicago/Turabian StyleMenyhárt, József, and Ferenc Kalmár. 2019. "Investigation of Thermal Comfort Responses with Fuzzy Logic" Energies 12, no. 9: 1792. https://doi.org/10.3390/en12091792
Note that from the first issue of 2016, this journal uses article numbers instead of page numbers. See further details here.