Article

Design and Analysis of District Heating Systems Utilizing Excess Heat in Japan

Department of Management Science and Technology, Graduate School of Engineering, Tohoku University, 6-6-11-815 Aoba-Yama, Sendai 980-8579, Japan
*
Author to whom correspondence should be addressed.
Energies 2019, 12(7), 1202; https://doi.org/10.3390/en12071202
Submission received: 15 January 2019 / Revised: 22 March 2019 / Accepted: 22 March 2019 / Published: 28 March 2019

Abstract

:
District heating systems (DHSs) which utilize excess heat play an important role in energy infrastructure in many European countries. In contrast to Europe, the DHS is not common and excess heat is not reused effectively in Japan. Almost all the DHSs in Japan were designed as first-generation district heating (1GDH) systems or 2GDH systems. No 4GDH systems have been introduced in Japan. The present study designs a 4GDH system utilizing excess heat from a wide area of Northern Japan and evaluates its feasibility. First, available heat amounts from two excess heat resources were calculated: waste incineration plants and thermal power plants. Second, heat demand from both residential and commercial sectors was estimated using a 1 km mesh, and a heat load curve was created for each mesh based on load curve data. Third, the DHS was designed with excess heat plants as a supply-side heat resource, and spatial information of the demand side made use of the geographical information system (GIS). Further analysis was conducted on selected DHSs in three cities in order to evaluate those systems’ feasibility based on energy efficiency, CO2 emissions, and economic aspects. The result shows that 70.5 PJ of heat can be supplied by DHS in Northern Japan, replacing imported fossil fuels such as petroleum and LPG with regional excess heat. The designed DHS could supply heat with equivalent costs compared to European countries.

1. Introduction

The present study analyzes the potential of installing DHSs that supply regional excess heat in a wide area of North Japan. In addition, three case studies were carried out to evaluate the system’s feasibility from the viewpoint of energy efficiency, environmental, and economic aspects.
In Japan, 136 DHSs supplied 21 PJ of energy overall in 2015. Seventy-one systems were installed in Tokyo [1], and these systems mainly met the huge heat demand from the accumulated business district. Because the climate in Tokyo is relatively wet and hot in the summer, the share of the district cooling system by DHSs keeps a higher proportion, just following the Middle Eastern countries [2]. Figure 1a shows the demand user composition of DHSs based on the supplied energy in the world [1,3]. This shows that the share of heat supply to the commercial sector is extremely high in Japan compared to other countries, i.e., more than 95%. On the other hand, European countries show common characteristics in the demand sector in that the main user is the residential sector. From these facts, Japan has installed DHSs in different ways to suit mainly office buildings in business districts. In contrast to the situation in Tokyo where there are many DHSs, there are only a few DHSs in Northern Japan, where heat demand for both the residential and commercial sector is relatively high because of the cold climate. Therefore, the potential and effect of installing a DHS in that area is worth analyzing. The concept of the DHS in this paper is based on a “regional district heating system” which involves heat distribution to several cities or municipalities from regional heat sources [4].
Japanese DHSs also have notable characteristics from a heat resource point of view as well. Figure 1b shows the resource composition by fuels for DHSs. It categorizes heat resources into three types. Excess heat includes surplus heat from electricity production like CHP, waste-to-energy cogeneration plants, and industrial processes. Renewable heat means heat from biomass, geothermal energy, and solar thermal. From Figure 1, it is obvious that Japanese DHSs mainly consume fossil fuel to generate heat (i.e., 81.5% of all heat), although European countries mainly utilize excess heat (i.e., 64.6% of all heat). For example, excess heat from waste incineration plants in Japan is not well used. Some plants supply heat for a swimming pool in the yard, and some plants generate high temperature steam for power generation. This results in very low energy efficiency, such as 10% at most. Considering this inefficient use of excess heat, designing DHSs introducing excess heat in Japan can be a feasible and effective solution for shifting to a sustainable society.
Several preceding studies which analyze the potential of DHSs in a city or community scale in North Japan exist. Ivar et al. [5] demonstrated a DHS design for 232 buildings in Hirosaki city in Aomori Prefecture in Northern Japan. The fundamental concept for the system design was based on the 4GDH system [6], which makes use of low temperature water, and the study reveals the effects of installing the system. Sumitomo et al. [7] designed DHS utilizing biomass resources targeting 177 buildings in Mogami town in the Yamagata Prefecture, a rural area in Northern Japan. It analyzes the feasibility of the DHS from energy efficiency and economic aspects. In addition to pioneering both designing and analyzing DHSs for residential areas, this research pursues the possibility of supplying domestic heat resources, such as excess and renewable heat, for DHSs as a main resource.
There are previous studies which investigate the nationwide potential of DHSs in utilizing excess heat in Japan. Yoshida et al. [8] analyzes the effect of energy saving by introducing a DHS which supplies excess heat from thermal power plants and investigates annual heat demand, annual excess heat potential, and their direct distances. Sadohara et al. [9] reveals the potential of a DHS which consumes the excess heat from waste incineration plants and factories, considering both annual heat demand and excess heat potentials. In contrast with these rough estimations, hourly heat demand data and existing road networks can improve the methodology of estimating feasibility. Therefore, this study focuses on the design for a DHS supplying excess heat in ten prefectures in northern Japan, including hourly heat demand and the existing road network, to analyze the DHS potential and systems’ performance with higher accuracy.

2. Methods

This study analyzes ten prefectures in Northern Japan. The total population in the area is 20,456,000, which is 16.1% of the population in Japan. The heating degree days (HDD) of each prefecture was greater than 2500 °C days, which is the typical amount in Central and North Europe.

2.1. Calculate Excess Heat Potential

Excess heat from both waste incineration plants and thermal power plants were investigated in this study. In the target prefectures, there were 159 waste incineration plants and 20 thermal power plants. The annual available excess heat from the waste incineration plants were calculated using Equation (1) by assuming that 65% of the total excess heat is available to the DHS [10], where QWIP (TJ/year) is the amount of excess heat from waste incineration plants, qWIP (MJ/kg) is the lower heating value of waste, mWIP (t/year) is a disposal amount, ηWIP is the excess heat availability rate (65%), and i is the waste incineration plant.
E X WIP , i = L H V WIP , i × m WIP , i × η WIP 1000
In this study, we assumed that 50% of the installed capacity of thermal power plants was applied for heat generation and defined this as the excess heat potential. The Japanese government declared that they will cut more than 80% of CO2 emissions by 2050 compared to the emissions in 2013, and it is presumable that electricity from renewable energy will account for the highest proportion of this by that time. Because of this projection, conventional thermal power plants burning fossil fuel will be over capacity, and it is possible to shift their role from producing electricity to generating both electricity and heat as CHP. Based on this assumption, annual available excess heat from thermal power plants is calculated using Equation (2).
E X TPG , j = C a p TPG , j × η TPG × 8760 × 3.6 1000

2.2. Calculating Heat Demand

The residential and commercial sectors were the targets of analysis in the study. One example of a method to estimate their heat demand is to consider each building data, such as floor area, use type in the area, and heat demand unit of each sector. The building-based approach allows for energy demand estimation with higher accuracy. However, the data requires huge number of parameters for different geographical places. As this analysis focuses on an area as large as ten prefectures, heat demand was estimated using a 1 km mesh resolution. Figure 2 represents the process of calculating heat demand for both the residential and commercial sector. According to official statistics published several ministries [11,12,13,14,15,16,17], we made several indices to estimate the floor area for each type of commercial sector. The heat demand was calculated using the floor area and unit heat demand [18], as shown in Equation (3).
Q com , m e s h = t y p e q com , t y p e , m e s h × A r e a t y p e , m e s h
Heat demand from the residential sector was calculated using the number of households with each type of family configuration, unit heat demand of households based on family configuration, and an area for each mesh. This calculation is shown in Equation (4).
Q res , m e s h = n q res , n , m e s h × H o u s e h o l d s n , m e s h
Moreover, we received hourly heat demand data, heat load curves based on monthly heat load data calculated from reference [19], and seasonal hourly heat load data [20] for all meshes in ten prefectures.

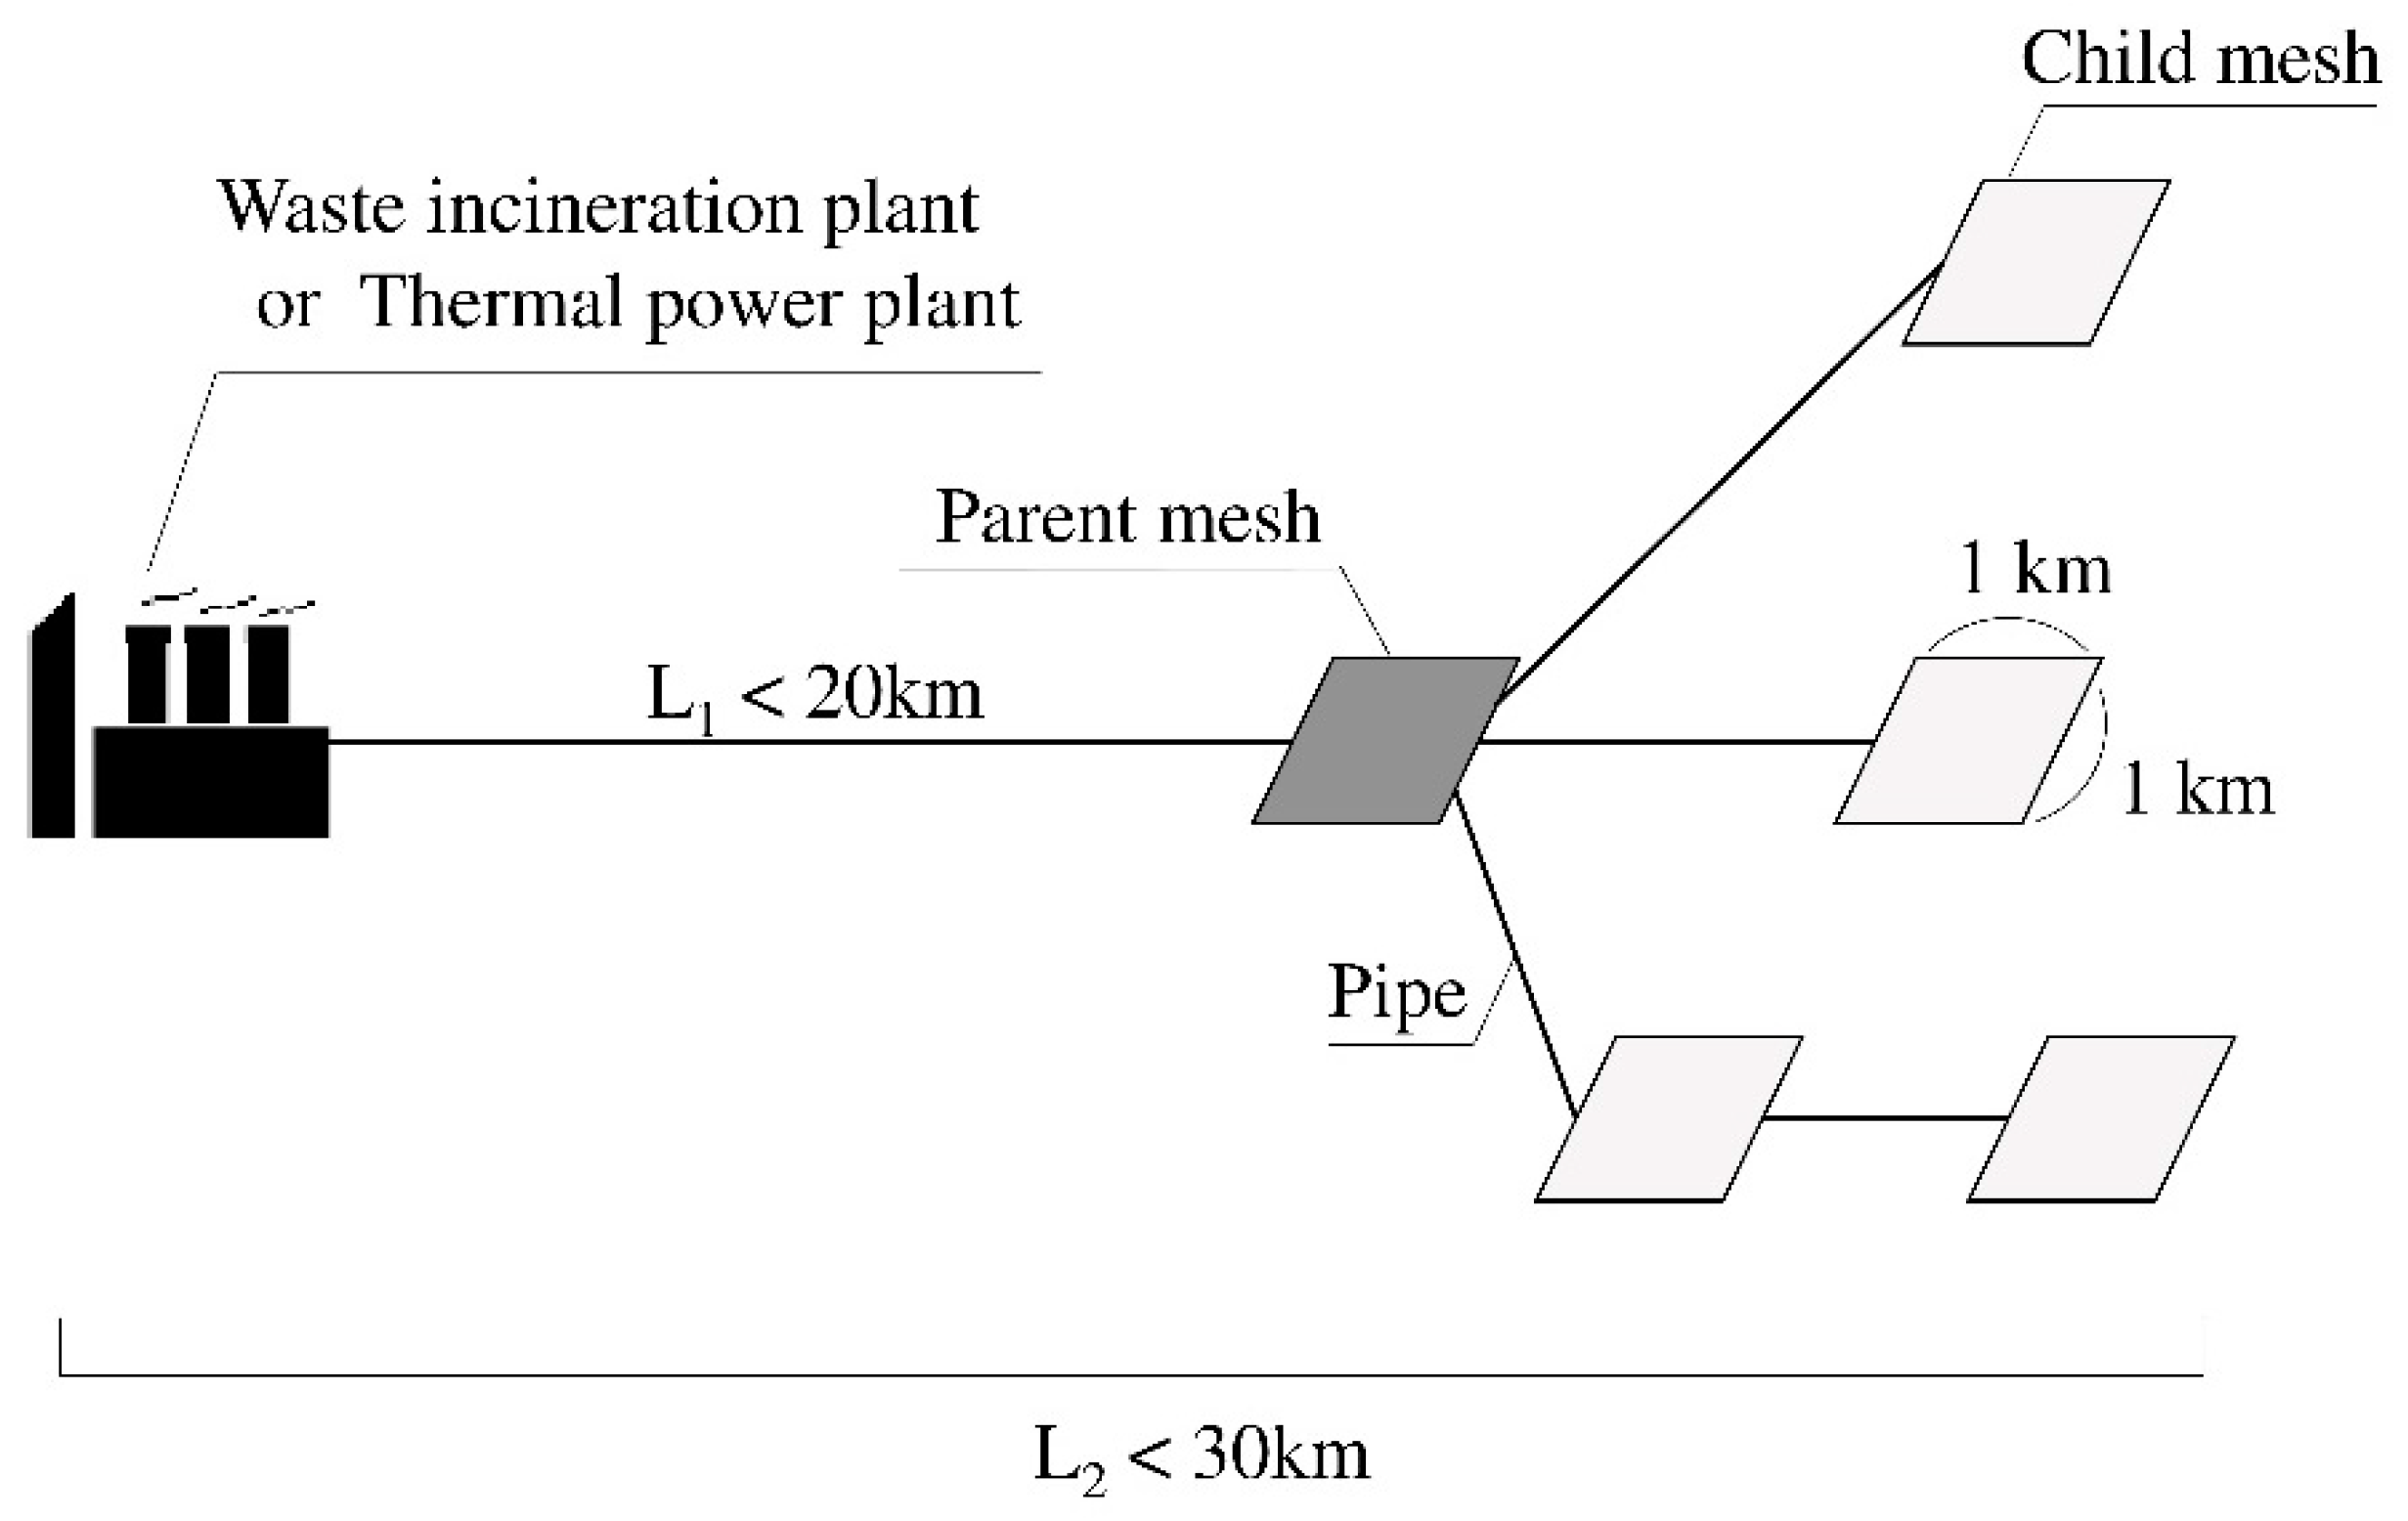
2.3. Constitution of DHS System Components

In this study, a DHS using an excess heat plant was designed. Figure 3 shows the model for designing the DHS. In the model, we first determined the meshes to be used to connect with DHS and designed the system’s pipeline network. We assumed that all the buildings that existed in the mesh were connected to DHS if the mesh was selected for a DHS connection. Figure 4 shows the allocation of DHS components in the study. Each DHS first sets the parent mesh, which has the highest heat demand within 20 km, by the road along the excess heat plant. They supply their heat to the parent mesh directly. The parent mesh distributes the heat to connected demand meshes, defined as child meshes. The maximum length of the pipeline from the excess heat plant to the terminal child mesh is 30 km [21,22]. We expanded the network by choosing new child meshes under the condition that linear heat density (LHD) between already connected meshes and the child mesh reached the maximum value among candidate meshes. In this process, the minimum LHD was set as 1.0 MW/m [23].
Second, hourly heat generation by the heat plants was calculated after the pipeline network was fixed.
In order to operate the designed DHS effectively, heat supply plants were expected to dispatch heat according to changes in the demand side. The designed model categorizes the heat load into three types: base-load, middle-load, and peak-load. This is shown in Figure 5. Following a conventional designing process, four corresponding heat plants were installed based on their flexibility and durability. Waste incineration plants supplied base-load heat, and thermal power plants met both the base-load and middle-load of all the meshes in the system. For the systems with excess heat from waste incineration plants, a wood chip boiler was installed as a middle-load plant in the parent mesh. Moreover, all meshes in the system included a gas boiler to meet the peak-load demand.
Heat losses transferred from the pipeline to the surrounding ground were estimated using Equation (5) [4,24], where K (0.6 W/m2K) is the overall heat transfer coefficient and G (394,200 °Ch) is the degree time number of average distribution temperature differences. The heat loss was compensated using heat supplies for middle-load demand. The average pipe diameter (da) was calculated using Equation (6) [25].
L o s s pipe = K 2 π d a l G
d a = 0.0486 × ln ( Q s l ) + 0.0007
We calculated the pipeline length in two ways. The first method focused on pipelines, which connect meshes in the system and are analyzed using an OD cost matrix, an add-in tool of ArcGIS. It calculates the length of the road along the distance of two pairs of meshes for all the meshes in the system. The second method focused on the pipelines inside the meshes. As the purpose of the study is to design a regional district heating system, we just estimated the length of the pipeline in a mesh without considering the layout of the pipeline. This follows the method used in [26,27], as outlined by Equation (7). We assumed that the electricity consumption for pumping to circulate hot water was 2% of the supplied heat in the system [28,29,30].
l inside , m e s h = 1207.36 × n m e s h 0.4106

2.4. Evaluating the System Feasibility

The feasibility of DHSs designed for three cities, i.e., Sendai, Kakuda, and Iwaki, were analyzed. In Sendai City in the Miyagi Prefecture, which represents a metropolitan area, excess heat plants (including both waste incineration and power plants) were introduced within 20 km of each other. Kakuda City is a small city in the Miyagi Prefecture that has a waste incineration plant. Iwaki City is a medium-sized city located in the east coast and in the Fukushima Prefecture which has two thermal power plants. The technology parameters used in the model are summarized in Table 1.
The energy efficiency of a DHS was analyzed using Equation (8). The equation accounts for the heat supply from heat plants, heat demand in connected meshes, and heat losses from the pipeline to the surrounding ground.
η DH = Q Q supply
Q = m e s h Q m e s h Q supply = Q base + Q middle + Q peak + L o s s pipe
CO2 emissions from the DHS were calculated using Equation (9). Both the electricity used for water circulation pumps and the natural gas consumed in peak-load boilers emit CO2.
CO 2 , DH = Q peak × CO 2 , gas + E pump × CO 2 , el m e s h Q m e s h
The heat supply unit cost was calculated using Equation (10). Capital costs include the expenses for a wood chip boiler, gas boiler, and pipeline cost, as shown in Equation (11). Fuel costs includes expenses for wood chips, natural gas, and electricity costs. The interest rates were 2.0%. Additionally, we assumed that the cost for updating conventional plants to dispatch excess heat accounted for 10% of the capital cost.
C o s t DH = C o s t capital + C o s t fuel + C o s t O & M m e s h Q m e s h
C o s t capital = ( C o s t middle + C o s t peak + C o s t pipe ) × C R F

3. Results and Discussion

3.1. Excess Heat Potential Distribution at the Supply Side

Figure 6 shows the analytical results of excess heat potential distribution from (a) waste incineration plants and (b) thermal power plants. The excess heat delivery from 159 waste incineration plants in the analyzed area was calculated to be 26.4 PJ per year. The heat potential from each plant was smaller than that of thermal power plants. The distribution of waste heat shows similar characteristics to the heat demand distribution shown in Figure 7. This is because waste incineration plants are located around city, and waste disposal increases corresponding to the population size.
The excess heat from thermal power plants was calculated as 367 PJ per year. Seven prefectures of the ten had a total of 20 thermal power plants. They are located near the seashore at depopulated areas for easy access to cooling water. Therefore, there is no relationship between the distribution of excess heat from thermal power plants and heat demand in cities.

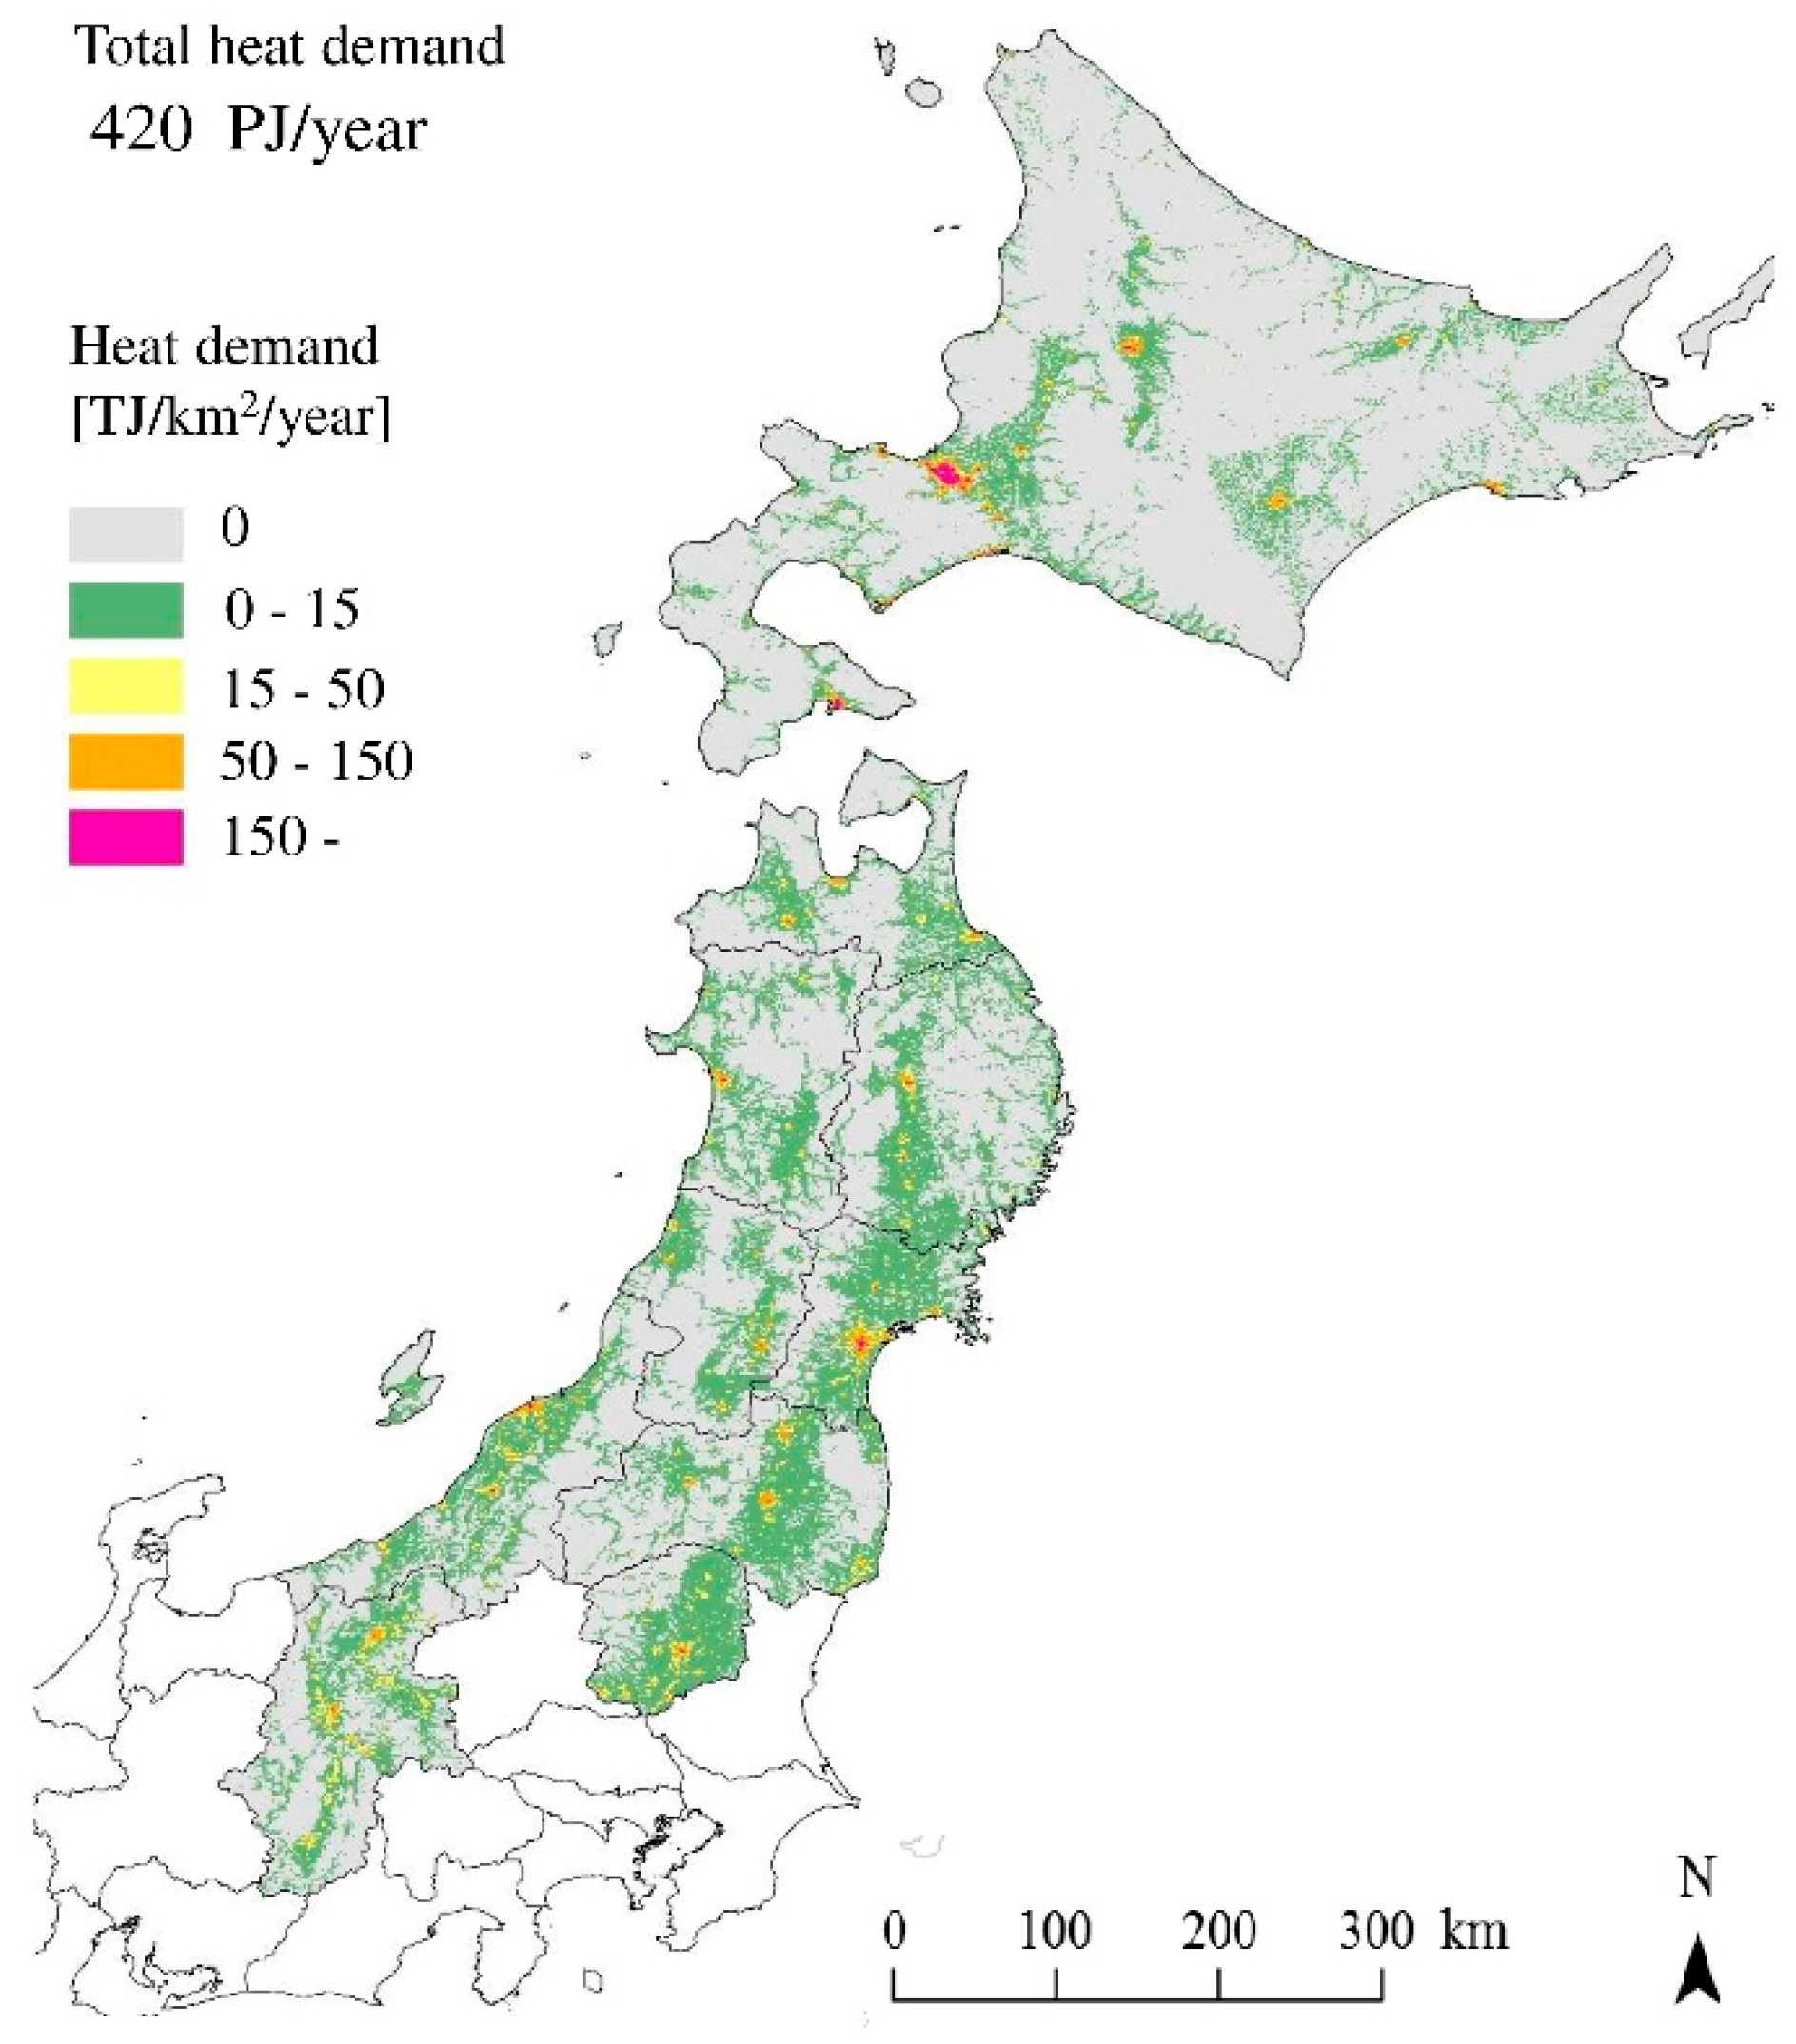
3.2. Heat Demand Distribution

The heat demand distribution is illustrated in Figure 7. It was found that there was a heat demand of 420 PJ/year in the residential and commercial sectors of ten prefectures. The proportion of heat demand in the ten prefectures accounted for 23.8% of the the annual Japanese heat demand for residential and commercial sectors (1764 PJ). This was higher than 16.1% of their population’s share. The 1 km mesh with the highest heat demand was the one in Sapporo City in Hokkaido with the amount of 1110 TJ/km2/year. Table 2 shows the classification by heat demand density in ten prefectures. It shows that almost 50% of heat demand occurs in meshes with a heat demand of 50 TJ/km2/year or more, and the demand meshes fill merely 1% of the total area. Accordingly, it is likely that Japanese heat demand distribution has strong characteristics of being concentrated in cities.

3.3. DHS Design Configuration in Ten Prefectures

Table 3 shows analytical results of the DHS design in ten prefectures. It shows the total heat supply as TPES, the average energy efficiency from the heat resource to demand users. This is calculated, as in Equation (8), using the excess heat delivery to users, total pipeline trench length, and heated area by the DHS.
A hundred and forty-nine DHSs were designed using the analysis. Hokkaido had the largest number of DHSs, with 26 systems, and Yamagata Prefecture had the lowest number of DHSs, with six systems. The potential of installing DHS in 10 prefectures reaches 70.5 PJ in total. Miyagi Prefecture holds the largest supply potential (18.1 PJ), and Iwate Prefecture has lowest supply potential (2.4 PJ). The supply quantity of excess heat was 35–78% of the TPES of heat. This difference came from the excess heat resources in the prefecture. The excess heat from the thermal power plants accounted for up to 60% of maximum hourly heat load. However, the waste incineration plants supplied up to 20% of this. Therefore, prefectures with thermal power plants tend to have a high proportion of excess heat.

3.4. Detailed DHS Design and Analysis for Three Different Cities

The system allocation of DHS designed in three selected cities is shown in Figure 8. The DHS in Sendai City consists of three waste incineration plants and two thermal power plants. Corresponding to the large excess heat potential, the system scale becomes large. A hundred and twenty-nine meshes in the city are connected to the DHS, and the total heat supply comes up to 18,085 TJ. The system in Kakuda City is the smallest DHS in terms of heat supply and the number of connected meshes. It has a waste incineration plant, six connected meshes, and a total heat supply of 251 TJ. The DHS in Iwaki City consists of two thermal power plants and 47 connected meshes. The total heat supply reaches 1970 TJ. In order to analyze the accumulated heat supply by the demand meshes, the relationship between the distance from the excess heat plants and the total accumulated heat supply was analyzed, and the results are shown in Figure 9. The line gradient expresses the degree of accumulation in heat demand. The DHS in Sendai City has the steepest gradient, starting from a 20 km distance.
Table 4 summarizes the DHS characteristics for the three cities. The energy efficiency of DHS was 95.4% in Sendai City, 79.9% in Kakuda City, and 87.4% in Iwaki City. As shown in Equation (6), heat losses from pipeline become large when there is a larger heat supply. However, energy efficiency is affected by the LHD, configuration of heat suppliers, and demand side density for thermal energy.
The CO2 emissions from the designed DHS were 7.9 g-CO2/MJ in both Sendai and Kakuda City and 6.8 g-CO2/MJ in Iwaki City. As total carbon emissions per primary energy consumption was 63.8 g-CO2/MJ in Japan in 2015, the carbon dioxide emissions from the DHSs were relatively very low. Heat losses from pipeline were 8.34–9.64% of the total heat supply for the three cities.
The detailed results of the cost breakdown are shown in Figure 10, with comparisons to other countries [3]. The heat supply unit cost was 1.2 JPY/MJ in Sendai City, 2.9 JPY/MJ in Kakuda City, and 1.9 JPY/MJ in Iwaki City. The fuel cost occupied a large share in Kakuda because its DHS has to combust wood chips without a neighbor thermal power plant to meet the middle heat load on the demand side. The cost of the DHS in Sendai is the lowest because it has a higher LHD, with easy access to excess heat from both thermal power and waste incineration plants.

4. Conclusions

This research presents a way to design a fourth-generation district heating system in Japan. As the supply side of thermal energy, excess heat from both waste incineration and thermal power plants was introduced to the design. As for the demand side of heat, a heat density map was first applied to 10 prefectures with a high resolution of 1 km of mesh in Northern Japan. The map focused on residential and commercial sectors. A hundred and forty-nine DHSs could potentially be installed, and three cities were used as case studies to show the detailed configuration of the layouts. In analyzing the feasibility of installing DHSs in terms of energy efficiency, carbon emissions, and cost dimensions, it was found that the DHS prioritizes the reduction of dependency on imported fossil fuels as a heat resource, as well as a drastic reduction in carbon emissions. As shown in Sustainable Development Goal No. 11, DHS is a promising option to shift conventional cities into becoming resilient and sustainable ones. Although Japan does not have any DHSs or a heat density map, this analysis provides beneficial ideas and methodologies for national energy planning, local municipalities, and business planners of the future. Moreover, as the building energy efficiency in Japan is the worst of the developed countries [31], improvement in thermal insulation performance is important to enhancing the quality of life in Japan.

Author Contributions

For research articles with several authors, a short paragraph specifying their individual contributions must be provided. The following statements should be used “conceptualization, T.N.; methodology, T.F.; software, T.F. and S.F.; validation, S.F.; formal analysis, S.F.; investigation, S.F.; resources, S.F.; data curation, S.F.; writing—original draft preparation, S.F.; writing—review and editing, T.N.; visualization, S.F.; supervision, T.N.; project administration, T.N.; funding acquisition, T.N.”

Acknowledgments

Authors appreciate useful comments and suggestions by the anonymous reviewers.

Conflicts of Interest

The authors declare no conflict of interest.

Nomenclature

Abbreviations
4GDHFourth generation district heating system
DHSDistrict heating system
HDDHeating degree days
LHDLinear heat density
TPESTotal primary energy supply of heat
Parameters
Areafloor area (m2)
CapCapacity (MW)
CostCost (mJPY)
CO2CO2 emission (g-CO2/MJ)
CRFCapital recovery factor
daAverage pipe diameter (m)
EElectricity consumption (TJ)
EXExcess heat (TJ)
HouseholdsHousehold number (-)
iTarget waste incineration plant (-)
jTarget thermal power plant (-)
lLength of pipeline (m)
LHVLower heating value (GJ/t)
LossHeat loss from pipeline (TJ)
mWeight (t)
meshMesh (-)
nNumber of buildings (-)
qHeat demand (TJ)
QHeat demand (TJ)
typeCommercial type
ηEfficiency (-)
Subscripts and superscripts
baseBase-load
capitalCapital cost
comCommercial sector
DHDistrict heating
elElectricity
fuelFuel
gasNatural gas
insideInside of mesh
middleMiddle-load
O&MOperation and maintenance
peakPeak-load
pipepipeline
pumpCirculation pump
resResidential sector
TPGThermal power plant
WIPWaste incineration plant

References

  1. General incorporated association of district heating in Japan. In District Heating Project Handbook in 2016; WIP: Munich, Germany, 2017.
  2. Eveloy, V.; Ayou, D.S. Sustainable district cooling systems: Status, challenges, and future opportunities, with emphasis on cooling-dominated regions. Energies 2019, 12, 235. [Google Scholar] [CrossRef]
  3. Euroheat & Power. Country by Country 2013—Statistics Overview; Euroheat & Power: Nantes, France, 2015. [Google Scholar]
  4. Frederiksen, S.; Wener, S. District Heating and Cooling; Studentlitteratur: Lund, Sweden, 2013. [Google Scholar]
  5. Baldvinsson, I.; Nakata, T. A feasibility and performance assessment of a low temperature district heating system—A North Japanese case study. Energy 2016, 95, 155–174. [Google Scholar] [CrossRef]
  6. Lund, H.; Werner, S.; Wiltshire, R.; Svendsen, S.; Thorsen, J.E.; Hvelplund, F.; Mathiesen, B.V. 4th Generation District Heating (4GDH). Integrating smart thermal grids into future sustainable energy systems. Energy 2014, 68, 1–11. [Google Scholar] [CrossRef]
  7. Sumitomo, Y.; Furubayashi, T.; Nakata, T. Design of district heaitng in rural area considering biomass resource and energy demand distribution. J. Jpn. Soc. Energy Resour. 2015, 36, 1–11. [Google Scholar]
  8. Yoshida, S.; Sadohara, S. Energy evaluation of the wide area heat supply system with combimed heat and power plant in Japan. J. Archit. Plan. 2000, 529, 85–92. [Google Scholar] [CrossRef]
  9. Sadohara, S.; Nagano, K.; Miura, M.; Murakami, K.; Moriyama, M.; Shimoda, Y.; Katayama, T.; Yoda, H.; Kitayama, H. Study on diffusion of district heating and cooling in Japan and its effects on grobal environment preservation. J. Archit. Plan. 1996, 510, 61–67. [Google Scholar]
  10. Persson, U.; Werner, S. District heating in sequential energy supply. Appl. Energy 2012, 95, 123–131. [Google Scholar] [CrossRef]
  11. Ministry of Land, Information, Transport and Tourism of Japan. Geographic and Quantitative Data of School. 2013. Available online: http://nlftp.mlit.go.jp/ksj/gml/datalist/KsjTmplt-P29.html (accessed on 9 March 2018).
  12. Ministry of Land, Information, Transport and Tourism of Japan. Geographic and Quantitative Data of Hospital. 2014. Available online: http://nlftp.mlit.go.jp/ksj/gml/datalist/KsjTmplt-P04-v2_1.html (accessed on 5 October 2017).
  13. Ministry of Land, Information, Transport and Tourism of Japan. Geographic and Quantitative Data of Amusement Facility. 2014. Available online: http://nlftp.mlit.go.jp/ksj/gml/datalist/KsjTmplt-P33.html (accessed on 5 October 2017).
  14. Ministry of Land, Information, Transport and Tourism of Japan. Geographic and Quantitative Data of Welfare Facility. 2011. Available online: http://nlftp.mlit.go.jp/ksj/gml/datalist/KsjTmplt-P14.html (accessed on 5 October 2017).
  15. Ministry of Land, Information, Transport and Tourism of Japan. Geographic and Quantitative Data of Hotel. 2010. Available online: http://nlftp.mlit.go.jp/ksj/gml/datalist/KsjTmplt-P09.html (accessed on 9 March 2018).
  16. Ministry of Internal Affairs and Communications of Japan. Economic Census for Business Activity in 2012. 2012. Available online: https://www.e-stat.go.jp/gis/statmap-search?page=1&type=1&toukeiCode=00200553&toukeiYear=2012&aggregateUnit=S&serveyId=S002005112012&statsId=T000650 (accessed on 9 March 2018).
  17. Ministry of Economy, Trade and Industry. Commercial Statistics by Mesh in 2014. 2016. Available online: http://www.meti.go.jp/statistics/tyo/syougyo/mesh/download.html#1km (accessed on 29 September 2017).
  18. Japan District Hearting & Cooling Association. Project 2010, Investigation of Potential of Installing District Heating and Cooling; Japan District Hearting & Cooling Association: Tokyo, Japan, 1994. [Google Scholar]
  19. The Japan Institute of Energy. Gas Cgeneration Planing and Design Manual 2008; The Japan Institute of Energy: Tokyo, Japan, 2008.
  20. Japan District Hearting & Cooling Association. Handbook of District Heating and Cooling Technologies; Japan District Hearting & Cooling Association: Tokyo, Japan, 2013. [Google Scholar]
  21. Ma, Q.; Luo, L.; Wang, R.Z.; Sauce, G. A review on transportation of heat energy over long distance: Exploratory development. Renew. Sustain. Energy Rev. 2009, 13, 1532–1540. [Google Scholar] [CrossRef]
  22. Svensson, I.L.; Jönsson, J.; Berntsson, T.; Moshfegh, B. Excess heat from kraft pulp mills: Trade-offs between internal and external use in the case of Sweden—Part 1: Methodology. Energy Policy 2008, 36, 4178–4185. [Google Scholar] [CrossRef]
  23. Robin Wiltshire. Advanced District Heating and Cooling (DHC)s Systems; Woodhead Publishing: Cambridge, UK, 2015. [Google Scholar]
  24. Masatin, V.; Latõšev, E.; Volkova, A. Evaluation Factor for District Heating Network Heat Loss with Respect to Network Geometry. Energy Procedia 2016, 95, 279–285. [Google Scholar] [CrossRef] [Green Version]
  25. Persson, U.; Werner, S. Heat distribution and the future competitiveness of district heating. Appl. Energy 2011, 88, 568–576. [Google Scholar] [CrossRef]
  26. Gils, H. A GIS-Based Assessment of the District Heating Potential in Europe; No. 2; Deutsches Zentrum für Luft- und Raumfahrt: Graz, Austria, 2012; pp. 1–13. [Google Scholar]
  27. Eikmeier, B.; Gabriel, J.; Schulz, W.; Krewitt, W.; Nast, M. Project Report to the German Ministry for Economics and Tecnology; Wikipedia: Bremen/Stuttgart, Germany, 2005. [Google Scholar]
  28. IEA. IEA ETSAP—Technology Brief. E05 Biomass for Heat and Power; IEA: Paris, France, 2010. [Google Scholar]
  29. Ruesch, F.; Rommel, M.; Scherer, J. Pumping power prediction in low temperature district heating networks. In Proceedings of the International Conference CISBAT 2015, Lausanne, Switzerland, 9–11 September 2015; pp. 753–758. [Google Scholar]
  30. Bejan, A.; Tsatsaronis, G.; Moran, M. Thermal Design & Optimizaion; John Wiley & Sons: New York, NY, USA, 1996. [Google Scholar]
  31. Ministry of Land, Information, Transport and Tourism of Japan. Overview of the Act on the Improvement of Energy Consumption Performance of Buildings (Building Energy Efficiency Act). 2016. Available online: http://www.mlit.go.jp/common/001134876.pdf (accessed on 28 February 2019).
Figure 1. Demand sector and resource characteristics of DHS by country. (a) Demand sector. (b) Resource composition.
Energies 12 01202 g001
Figure 2. Flowchart of heat demand calculation using a 1 km mesh resolution.
Energies 12 01202 g002
Figure 3. The model for designing the DHS.
Energies 12 01202 g003
Figure 4. Allocation of the DHS components.
Energies 12 01202 g004
Figure 5. Heat load curve definition of the three categories.
Energies 12 01202 g005
Figure 6. Excess heat potential distribution map. (a) Waste incineration plants. (b) Thermal power plants.
Energies 12 01202 g006
Figure 7. Heat demand map in 1 km mesh resolution.
Energies 12 01202 g007
Figure 8. The result of DHS design in three cities. (a) Sendai. (b) Kakuda. (c) Iwaki.
Energies 12 01202 g008
Figure 9. The relationship between the distance from the excess heat plant and total heat supply of a DHS.
Energies 12 01202 g009
Figure 10. Cost breakdown of DHSs for three cities.
Energies 12 01202 g010
Table 1. Parameters for district heating system infrastructures.
TechnologiesUnitInvestment Cost
(mmJPY per Unit)
O&M
(% of inv. Cost)
Life Time
[Year]
Scale
[-]
Efficiency
[-]
Ref.
[-]
Pipem0.039–0.2051.030--[28]
Wood chip boilerMW914.1150.730.80[28,30]
Gas boilerMW130.3150.730.90[28,30]
Table 2. Classification of heat demand density in ten prefectures.
Heat Demand Density
[TJ/km2/year]
Total Heat Demand
[PJ]
Share
[%]
Area
[km2]
Share
[%]
000.0137,50770.3
0–1510525.052,08626.6
15–5010725.538932.0
50–15014334.017560.9
150-6515.52240.1
Total420-195,466-
Table 3. Analytical result of DHS designs by prefecture.
Prefecture
UnitHokkaidoAomori IwateMiyagiAkitaYamagataFukushimaTochigiNigataNagano
Number of HD-269111413617152216
Energy property
Total heat supply (A)PJ8.82.91.216.25.92.35.62.17.22.0
TPES for systems (B)PJ9.73.21.417.06.32.56.32.47.92.2
Average efficiency (A/B)-0.900.900.870.950.940.900.890.880.910.89
Systems’ network
Total pipeline lengthkm2639115980746901717996315311693125901
District heated areakm2126473416668461224511633
Table 4. DHS characteristics for three cities.
CityEnergy Efficiency
[%]
CO2 Emission
[g-CO2/MJ]
Unit Cost
[JPY/MJ]
Total Heat Supply
[TJ/year]
Average LHD
[GJ/m]
Heat Loss from Pipeline
[TJ/year] (% in TPES)
Sendai95.47.91.218,0854.41599 (8.84)
Kakuda79.97.92.92513.024.2 (9.64)
Iwaki87.46.81.919701.7164 (8.34)

