Article

Evaluating the Effectiveness of New and Old Kinetic Energy Conversion from an Electric Power Economics Perspective: Evidence on the Shandong Province of China

1
Economic & Research Institute, State Grid Shandong Electric Power Company, Jinan 250002, China
2
School of Economics and Management, North China Electric Power University, Beijing 102206, China
*
Author to whom correspondence should be addressed.
Energies 2019, 12(6), 1174; https://doi.org/10.3390/en12061174
Submission received: 7 March 2019 / Revised: 19 March 2019 / Accepted: 24 March 2019 / Published: 26 March 2019

Abstract

:
This paper proposes a hybrid model for evaluating the effectiveness of new and old kinetic energy conversion (NOKEC), China’s major strategic move aiming to transform the mode of economic growth and improvie the quality of economic development. Considering the goals of NOKEC and the supporting roles of power industry to NOKEC, this paper constructs an index system for NOKEC effectiveness evaluation from an electric power economics perspective, involving three dimensions and 17 secondary indicators. Furthermore, a hybrid evaluation model based on DEMATEL-ANP and DQ-GRA techniques is developed to accomplish the evaluation of Shandong’s NOKEC effectiveness. The results show that Shandong’s NOKEC effectiveness increased from 2015–2017, indicating that Shandong’s NOKEC policies have achieved remarkable results. According to the evaluation results, this paper puts forward the indicators that should be paid close attention to and the following work priorities in Shandong’s future NOKEC process, which has certain practical value for the promotion of Shandong’s NOKEC. In addition, the evaluation model proposed in this paper considers the interrelationships between indicators and overcomes the shortcomings of traditional GRA, showing good applicability to similar effectiveness evaluation issues. Finally, the limitations and universality of the model are discussed and the improvement direction is put forward.

1. Introduction

China’s economy has experienced long-term high-speed development, and the resulting resources and environmental problems have become increasingly prominent, making the transformation of the economic development model an inevitable choice for sustained and healthy development of the Chinese economy. As China’s economic development enters the “new normal”, China has proposed an initiative called the new and old kinetic energy conversion (NOKEC), which is a major strategic move to achieve innovation-driven development and promote the economic transformation from high-speed growth to high-quality development [1]. The NOKEC refers to cultivating new kinetic energy and transforming old kinetic energy. Specifically, the new kinetic energy means the new impetus, new technologies, new industries, new formats and new models for economic and social development formed in the new round of scientific and technological revolution and industrial transformation; the old kinetic energy indicates traditional kinetic energy, which not only involves high-energy-consumption and high-pollution manufacturing, but also covers the first, second and third industries that operate under the traditional business model [2]. Overall, the NOKEC is a new embodiment of economic restructuring in the new era combined with China’s actual national conditions. Its purpose is to solve the problem of overcapacity, improve the efficiency of resource allocation and achieve orderly industrial continuity, so as to maintain stable and sustainable economic development.
From a global perspective, the NOKEC is not only an objective law of the evolution of the world economy, but also an inevitable requirement for the sustainable development of the new technological revolution. From the perspective of domestic development, the NOKEC is the fundamental way for China to move into the high-end of the global value chain and enter a new era of economic development [3,4].
Shandong’s economic structure is highly similar to that of China, with strong typical demonstrations. Therefore, on January 3, 2018, the China State Council approved the Overall Plan for the Construction of a New and Old Kinetic Energy Conversion Pilot Area in Shandong Province, marking the official establishment of the Shandong New and Old Kinetic Energy Conversion Comprehensive Experimental Zone (Shandong NOKEC-CEZ) [5]. In this context, Shandong Province becomes an important demonstration province for China to implement the NOKEC policy, and accelerating the construction of Shandong NOKEC-CEZ is conducive to providing experience for the NOKEC in China.
Generally, the process of NOKEC is not only a process of cultivating new energy and power, but also a process of accelerating the release of various risks and contradictions [6]. Therefore, the government should attach great importance to various kinds of contradictions arising from the transition between the old and new kinetic energy and formulate measures to solve these contradictions and risks in time, so as to prevent large-scale or regional economic risks [7]. Related scholars have investigated the characteristics and significance of NOKEC, for instance, Bai et al. (2018) pointed out that in recent years, the most significant characteristic of China’s economic development is the NOKEC, forming a clear differentiation among industries and speeding up the economic structure adjustment process [8]. Although China’s economic development is still facing tremendous pressure, the risks in some economic regions will be accelerated and the difficulties in economic operation will increase; the advantages of China’s long-term economic development have not changed fundamentally. Zeng (2017) analyzed the significance of the NOKEC from five levels namely the instrumental, technical, industrial, institutional, and conceptual level [9].
Meanwhile, some scholars explored the development path of NOKEC. By examining the connotation and mode of NOKEC, Yang and Jiao (2018) analyzed the dynamic evolution of NOKEC from the two-dimensional perspective of technical efficiency and technological progress, finding that NOKEC has different development paths ranging from government-led to government-guided, from key demonstrations to comprehensive advancement, from factor-driven to innovation-driven, and from incremental innovation to subversive innovation [10]. Zhang and Li (2018) investigated the development paths of NOKEC for financial industry, that is, creating a new model of financial services relying on innovative thinking, so as to achieve deep integration of finance and multi-industry, multi-format or multi-mode [11]. Zhang et al. (2018) pointed out that there are certain regional differences in traditional kinetic energy, growth kinetic energy and potential kinetic energy in Shandong Province, and the transformation of government functions, the marketization process and rational industrial structure are of great significance for the cultivation of new regional kinetic energy and the breakthrough of NOKEC [12]. In addition, in order to accelerate the NOKEC, some other scholars have also proposed different path choices, such as Huang (2017) [13], Zhang and Zhang (2017) [14], and Zhang (2017) [15].
The existing researches mainly focus on the concepts and implementation paths of NOKEC, analyzing the relationships between NOKEC, macroeconomics and industrial structure [16,17], and pay less attention to the role of the power industry in the NOKEC. In fact, many scholars employed a large amount of electricity consumption data to analyze the trend of economic growth, finding that there is very close correlation between electricity and economy [18,19,20]. Meanwhile, the electricity consumption data is usually more accurate, resulting that the characteristics and trends of the economy reflected by power data may be more objective and credible [21,22]. From this perspective, electric power can be called the “barometer” and “thermometer” of national economic development [23], revealing that electric power can provide endogenous support to meet the NOKEC. Therefore, when evaluating the effectiveness of NOKEC, it is necessary to take electricity utilization factors into account, so as to assess if it indeed does help to meet the targets. Moreover, although some scholar investigated the effectiveness of NOKEC [24,25,26], there is no unified method to evaluate the effectiveness of the NOKEC, so that the development paths of NOKEC proposed by many scholars are theoretically feasible, but it is difficult to make a scientific and reasonable test of the actual effects.
In the context of NOKEC characterized by macroeconomic transformation and industrial restructuring, this paper examines the roles of power industry in NOKEC and constructs an index system involving three evaluation dimensions, that is, economic development, electricity utilization and energy efficiency, which can fully reflect the implementation effects of NOKEC. Further, a hybrid evaluation model based on DEMATEL-ANP and difference-quotient grey relational analysis (DQ-GRA) techniques is applied to evaluate the effectiveness of NOKEC of Shandong Province in China, based on the construction achievements of Shandong NOKEC-CEZ. On the whole, the contributions of this paper include:
(1) Standing in an electric power economics perspective, this paper constructs a scientific and adequate index system for evaluating the NOKEC effectiveness considering the goals of NOKEC and the roles of power industry in NOKEC and proposes a hybrid evaluation model to evaluate the effectiveness of NOKEC in Shandong Province. The research results can enrich the existing researches on the NOKEC and have certain practical value for the promotion of the NOKEC in Shandong Province.
(2) The proposed hybrid evaluation model based on DEMATEL-ANP and DQ-GRA considers the interaction between evaluation indicators and overcomes the limitations of conventional GRA that considers only the geometric similarity between data sequences, while it ignores the degree of numerical proximity. The proposed model can make full use of the information of the objects to be evaluated and has good applicability and promotion value for similar comprehensive evaluation issues.
The rest of this paper is organized as follows: Section 2 explains the goals of NOKEC in Shandong Province and the support of power industry to NOKEC; Section 3 introduces the constructed NOKEC effectiveness evaluation index system and the proposed hybrid evaluation model; Section 4 represents the evaluation results of the NOKEC effectiveness in Shandong Province; finally, Section 5 summarizes the research contents and findings of this paper.

2. The Goals of NOKEC and Power Industry’s Roles

2.1. The Goals of NOKEC

According to the Overall Plan for the Construction of a New and Old Kinetic Energy Conversion Pilot Area in Shandong Province, the development goal of the NOKEC in Shandong Province is that by 2020, the pilot area will initially have formed a scientific and effective development mode in resolving excess capacity and eliminating backward production capacity; cultivating and expanding new technologies, new industries and new business models; and transforming and upgrading traditional industries. At that time, a batch of NOKEC experience that can be replicated and promoted is obtained.
Further, by 2022, a new pattern of new kinetic energy leading economic development will be formed; the economic quality advantage will be significantly enhanced, and the construction of a modern economic system will make positive progress [27,28]. Specifically, (1) emerging industries will gradually grow into new growth engines and become the main kinetic energy to lead economic development; (2) the existing traditional industries will basically complete the transformation and upgrade and become an important kinetic energy for promoting economic development; (3) the vitality of innovation and entrepreneurship will be significantly enhanced, and the innovative economy will initially achieve core competitiveness; (4) the mechanism for the NOKEC will be further improved and the system for NOKEC will be basically established; (5) the new advantages of the open economy are increasingly apparent, and the potential for NOKEC will be released quickly.
What is more, through the construction of the pilot area, the labor productivity of the whole province will be increased from 100,000 yuan per capita in 2016 to 140,000 yuan in 2022; the added value of strategic emerging industries will increase by more than 1 percentage point per year during 2016–2022, and the proportion of research and experimental expenditures to regional GDP increased from 2.3% in 2016 to around 2.7% in 2022 [5].

2.2. Support of Power Industry to the NOKEC

The NOKEC is a new thing that emerged when China’s economy developed to the stage called “three-phase superposition”, and it can be understood as: Due to technological advance, a new industrial form or mode has become a new driving force for economic and social development [29]. In May 2018, the State Grid Shandong Electric Power Company formulated the Top Ten Measures for Shandong Electric Power Company to Comprehensively Service for the New and Old Kinetic Energy Conversion, focusing on the power supply and demand sides, which actively assists the NOKEC of Shandong Province [30].
In terms of power supply, it is necessary to accelerate the planning and development of power grids, promoting the large-scale development and utilization of new energy sources such as wind power and solar power. On one hand, it is necessary to speed up the construction of the transmission grid. Specifically speaking, it is necessary to promote the planning and construction of power grids with high standards, focusing on the grid planning of Jinan, Qingdao, Yantai and 182 key parks, and realize the integration of power grid planning and urban planning. Meanwhile, it is important to promote the coordinated development between power grids and multi-energy production and consumption, between UHV and all levels of power grids, and between the access and consumption of high proportion of clean energy. By 2035, the power grid structure under saturated load will be basically built, which will provide a strong power guarantee for the high-quality development of economy and society. On the other hand, to promote the construction of a first-class modern distribution grid. Specifically speaking, by 2020, strive to fully build the world-class city distribution grid in Qingdao, make the whole distribution grid of Shandong Province be the first-class distribution grid and the reliability rate of power supply for urban grid and rural power grid reach 99.99% and 99.92% respectively [31].
Meanwhile, Shandong has also continuously accelerated the construction of power grid peaking capacity. By 2018, Shandong’s installed capacity of new energy power generation including wind power and photovoltaic reached 26.04 million kilowatts, accounting for 20.7% of the total power installed capacity [32]. According to the overall requirements of NOKEC, Shandong power industry has put forward the development goals of “two 30%”, that is, the proportion of electricity from other provinces and the proportion of renewable power generation are up to 30% [33], which can further promote the optimization of the power supply structure in Shandong Province. Moreover, Shandong will strive to start the construction of a 1000 kV UHV ring network project from Hebei to Shandong, which can accelerate the promotion of power from other provinces into Shandong, and it is planned that at the end of the “Thirteenth Five-Year Plan”, Shandong’s ability to accept extra-provincial power will have increased to more than 30 million kilowatts per year [34].
In terms of the demand side, Shandong Province has continuously promoted the process of re-electrification and actively implemented the electric energy substitution, aiming to increase the proportion of electric energy in the terminal energy consumption. In 2016, Shandong Provincial Development and Reform Commission (DRC), Shandong Provincial Economic and Information Committee (EIC) and eight other units jointly issued the Implementation Opinions on Further Accelerating the Electric Energy Substitution, which clarified the mission objectives and work requirements of electric energy substitution [35]. State Grid Shandong Electric Power Company, Shandong Provincial Academy of Sciences and other units jointly initiated the establishment of China’s first electric energy substitution promotion conference [36], which actively promotes the technology of using electricity to replace coal or oil in various fields such as heating, refrigeration, industry, agriculture, transportation, and home appliances. In 2017, Shandong implemented a total of more than 5000 electric energy substitution projects, accounting for 10.62 billion kWh of electricity, equivalent to replacing 5.14 million tons of coal consumption [37], which effectively promotes the prevention and control of atmospheric pollution and clean-up substitution in the field of energy consumption. In 2018, based on NOKEC, Shandong further increased the clean-up substitution of electric energy in the field of energy consumption. The focuses are on the coal-to-electricity conversion in clean heating and coal-fired boilers, electric vehicles, and the electricity consumption along the Bohai Sea, the Yellow Sea and the Beijing-Hangzhou Grand Canal, aiming to develop a number of typical demonstration projects with Shandong characteristics which can be copied and promoted in large quantities, so as to accelerate the clean-up substitution and NOKEC in the field of energy consumption.
In addition, in terms of electricity prices, in May 2018, Shandong Provincial Price Bureau issued the Implementation Opinions on Fully Play Roles to Serve the Promotion of the New and Old Kinetic Energy Conversion [38], proposing that by 2020, the price policy system for promoting NOKEC is basically perfect, and the mechanism for determining the price by the market is basically established, which provides strong support for the formation of a new pattern where new kinetic energy dominates economic development in 2022.

3. NOKEC Effectiveness Evaluation Model

3.1. Constructing the Evaluation Index System

In October 2015, Premier Li Keqiang made a preliminary judgment for the Chinese economy, that is, China’s economy is in the difficult process of NOKEC. Subsequently, the concept of new and old kinetic energy began to appear officially in the speech of Chinese government officials. The process of economic development is inevitably accompanied by the NOKEC and structural optimization and upgrading, and the rapid development of Shandong’s economy also benefits from NOKEC to a certain degree. This paper aims to examine the effectiveness of NOKEC. Specifically, according to the analysis of the NOKEC targets and the supporting roles of the power industry and some related researches [24,25,39,40], this paper constructs a NOKEC effectiveness evaluation index system including three dimensions named economic development, electricity utilization and energy efficiency from the perspective of power economics, as shown in Table 1.
All the secondary indicators in Table 1 are quantitative indicators, which reflect the goals and requirements of the NOKEC from the three dimensions. Besides, the electricity utilization indicators in the index system can reflect the support of the power industry for the NOKEC. Therefore, from the perspective of power economics, the constructed index system can be used to evaluate the effectiveness of NOKEC. In the index system, the benefit-typed indicators reveal that the larger the indicator value, the better the effectiveness of the NOKEC, such as GDP per capita and full labor productivity. The cost-typed indicators reveal that the smaller the indicator value, the better the effectiveness of the NOKEC, such as Engel coefficient and energy intensity. Interval-typed indicators reveal that the indicator value is closer to a certain interval and the effectiveness of NOKEC is better, such as electrification level and electric power intensity.

3.2. Indicator Weight Determination Method Based on DEMATEL-ANP

It is worth noting that the economic development indicators, electricity utilization indicators and energy efficiency indicators in the constructed index system are related to each other, not independent of each other. Thus, the analytic network process (ANP) [41,42,43] technique which considers the relationships among indicators is available for determining the weight vector of the constructed index system. However, the traditional ANP method is subjective in the process of determining the network structure, so this paper applies the DEMATEL method [44,45] to improve ANP. Specifically, the DEMATEL method is used to determine the relationship between the indicators, the ANP network structure is constructed accordingly, and the weight is solved by the ANP method. Overall, the proposed DEMATEL-ANP technique can guarantee the scientific construction of the ANP network structure, and thus improve the reliability of ANP weight results. The specific steps are:
(1) Determine the relationships between the primary indicators. For the primary indicator set U = ( U 1 , U 2 , , U n ) , if the primary indicator U i has a direct impact on U j , the numbers 0–4 can be used to represent that U i has no influence, weak influence, medium influence, strong influence, and very strong influence on U j . Then, the direct relationship matrix X = [ x i j ] n × n that reflects the mutual influence of the primary indicators can be constructed, where x i j represents the influence degree of the primary indicator U i on U j . Specifically, the Delphi method was used to determine the relationship between the primary indicators. Twenty experts were invited to judge whether there is a direct influence relationship between each primary indicator and then calculate the direct influence matrix by:
x i j = { 0 , No   experts   believe   that   U i   has   an   impact   on   U j 1 ,   1 % ~ 25 %   of   experts   believe   that   U i   has   an   impact   on   U j 2 ,   26 % ~ 50 %   of   experts   believe   that   U i   has   an   impact   on   U j 3 ,   51 % ~ 75 %   of   experts   believe   that   U i   has   an   impact   on   U j 4 ,   76 % ~ 100 %   of   experts   believe   that   U i   has   an   impact   on   U j
(2) Calculate the comprehensive impact matrix. Based on the direct influence matrix, the normalized direct impact matrix A = [ a i j ] n × n can be obtained, where:
a i j = x i j max 0 i n j = 1 n x i j
For the normalized direct impact matrix, it can be proved that lim k + A k = O . Therefore, the comprehensive impact matrix can be obtained by:
T = [ t i j ] n × n = lim k + ( A + A 2 + A 3 + + A k ) = A ( I A ) 1
where O is a zero matrix and I is a unit matrix.
(3) Calculate the influencing degree and the influenced degree. According to the comprehensive impact matrix T , the influencing degree D and the influenced degree R of each primary indicator can be calculated as follows:
D = j = 1 n t i j ,   R = i = 1 n t i j
The influencing degree D of the indicator reveals the comprehensive impact degree of the indicator on all other indicators, and the influenced degree R presents the comprehensive impact degree of all other indicators on this indicator. On this basis, D + R is called the center degree of the indicator, indicating the degree of importance of the indicator in the whole index system. Meanwhile, D + R is defined as the cause degree of the indicator, revealing the role of the indicator in the system. D R is called the cause center, revealing that D R > 0 means the indicator affects other indicators more than it is affected by other indicators, so it is called the cause factor. On the contrary, it is considered that the indicator is greatly affected by other indicators, so it is called the result factor.
(4) Construct a network hierarchy of the index system. According to the center degree and cause degree of the primary indicators determined by DEMATEL, the influencing and influenced relationship between the control layer indicators and the network layer indicators in the ANP network hierarchy can be determined. Then the network hierarchy of the index system can be constructed.
(5) Construct the supermatrix of ANP. Assume that the elements of the ANP control layer are S 1 , S 2 , , S m ; The elements of the network layer are U 1 , U 2 , , U n , and there are elements u j i ( i = 1 , 2 , , n j ) in U j . Taking the control layer element S s ( s = 1 , 2 , , m ) as criteria and the element u j k in U j as the sub-criteria, the elements in the element group U i are compared according to their influence degree on u j k , that is, the judgment matrix is constructed under the criterion S s , and the weight vector w i 1 ( j k ) , w i 2 ( j k ) , , w i n i ( j k ) is obtained by the eigenvalue method. Repeat the steps above for k = 1 , 2 , , n j to get the matrix:
W i j = [ w i 1 ( j 1 ) w i 1 ( j n j ) w i n i ( j 1 ) w i n i ( j n j ) ]
where the column vector of W i j represents the ordering vector of the influence degree of all elements in U i on the element u j k in U j . If u j k is not affected by the element u i p in U i , w i p ( j k ) = 0 . For each U i and U j , repeat the above steps to obtain the supermatrix under the S s criterion. According to the number of control layer elements, there are a total of m supermatrices, and the general form is:
W ( s ) = [ W 11 ( s ) W 1 n ( s ) W n 1 ( s ) W n n ( s ) ]
(6) Construct a weighted supermatrix of ANP. Each element of the supermatrix W ( s ) is a matrix whose submatrix W i j ( s ) is column normalized, but W ( s ) is not column normalized. By performing column normalization on W ( s ) , a weighted supermatrix can be obtained. The specific steps are: Taking S s as the criterion and the element group U j as the sub-criteria, compare the relative importance of all element groups, and obtain the weight vector B j ( s ) = ( b j 1 ( s ) , b j 2 ( s ) , , b j n ( s ) ) T according to the eigenvalue method. Repeat the above steps for all j = 1 , 2 , , n to get the weighted matrix:
B ( s ) = ( B 1 ( s ) , B 2 ( s ) , , B n ( s ) ) T = [ b 11 ( s ) b 1 n ( s ) b n 1 ( s ) b n n ( s ) ]
In this way, the sub-matrices in the supermatrix W are weighted, that is, the column normalized weighted supermatrix under the S s criterion is obtained by formula (7). Similarly, there should be m weighted supermatrices.
W ( B s ) = ( W i j ( B s ) ) n × n ,   W i j ( B s ) = b i j ( s ) × W i j ( s )
(7) Stabilization processing of supermatrix. In order to accurately reflect the interdependence between elements, it is necessary to stabilize the supermatrix. Firstly, calculate the limit relative ordering vector (LROV) for each supermatrix by lim k + W ( s ) k . Then, if the LROV is convergent and the convergence value is unique, the value of the corresponding row in the weighted supermatrix is the stable weight of each indicator.
The key of the ANP method is to solve the supermatrix, which needs to be completed by the software called SuperDecision [46].

3.3. Comprehensive Evaluation Method Based on DQ-GRA

The effectiveness of the NOKEC is the degree to which the NOKEC implementation effects have achieved the set goals. The NOKEC effectiveness evaluation needs to be combined with the goals of NOKEC. Since the indicators in the evaluation index system constructed in this paper are all quantitative indicators, the effectiveness of NOKEC can be obtained by calculating the closeness between the actual values and target values of the NOKEC effectiveness evaluation indicators (EEIs). Considering that the NOKEC effectiveness evaluation index system has high dimensional characteristics, this paper employs the grey relational analysis (GRA) method [47] to calculate the closeness between the actual values and target values of the NOKEC EEIs.
The basic idea of GRA is to judge the relation degree of sequences based on the similarity degree of the data sequences [48,49,50,51], which is a method proposed by the gray system theory to analyze the correlation degree of various factors in the system. The traditional GRA only considers the degree of geometric similarity between data sequences, but ignores the degree of numerical proximity [52]. Hence, this paper applies an improved GRA method that combines the difference method and the division method to define a comprehensive grey relation degree from geometric similarity and numerical proximity, called the difference-quotient GRA (DQ-GRA) approach [52,53]. The basic idea of the DA-GRA is that if the difference between the data points in the two sequences is closer to 0 or the quotient is closer to 1, the two sequences are considered to be closer, that is, the grey relation value is closer to 1 [52]. The steps to evaluate the effectiveness of the NOKEC using the DQ-GRA approach are as follows:
(1) Determine the optimal sequence X 0 . In this paper, the optimal sequence is the target value of each evaluation indicator determined according to the government’s plan for NOKEC.
(2) Data normalization. The purpose of data normalization is to obtain a dimensionless and consistent sequence. For optimal sequence, the normalized sequence is:
X 0 = ( 1 , 1 , , 1 ) T
For the sequence to be evaluated X i = [ x i j ] n × 1 , the normalized sequence X i = [ x i j ] n × 1 is obtained according to the indicator attributes. For the performance typed indicator, the normalized value is:
x i j = { x i j / x 0 j , x i j < x 0 j 1 ,   x i j x 0 j
For the cost typed indicator, the normalized value is:
x i j = { 1 ,   x i j < x 0 j x 0 j / x i j ,   x i j x 0 j
For the interval type indicator, the normalized value is:
x i j = { 1 ,   x M i n j x i j x M a x j x i j / x M i n j ,   x i j < x M i n j x M a x j / x i j ,   x i j > x M i n j
(3) Calculate the relation degree between the normalized sequence to be evaluated and the optimal sequence. Supposing that the sequence to be evaluated is X i = ( x i 1 , x i 2 , , x i n ) , calculate the difference and quotient of each indicator in the sequence to be evaluated and the optimal sequence by:
x i j = | x 0 j x i j | ,   x i j = x i j / x 0 j
Then, according to x i j , calculate the grey relation degree of geometric similarity:
γ 1 j ( x 0 j , x i j ) = 1 / e x i j
Next, according to x i j , calculate the grey relation degree of numerical proximity:
γ 2 j ( x 0 j , x i j ) = 1 / e | 1 x i j |
Finally, the grey relation degree of geometric similarity and numerical proximity is integrated, and the index weight is considered to obtain the comprehensive grey relation degree:
γ 0 i = j = 1 n w j γ 1 j ( x 0 j , x i j ) × γ 2 j ( x 0 j , x i j )
In this paper, the above method is used to calculate the closeness between the sequence to be evaluated and the optimal sequence, which is considered as the effectiveness of the NOKEC.

4. Evaluating the NOKEC Effectiveness of Shandong Province

4.1. Data and Preprocessing

Based on the construction achievements of Shandong NOKEC-CEZ, this paper adopts the proposed model based on DEMATEL-ANP and DQ-GRA techniques to evaluate the effectiveness of NOKEC in Shandong Province. Firstly, collect the value of the evaluation indicator of the NOKEC effectiveness in Shandong Province from 2015 to 2017 from Shandong Statistical Yearbook 2016–2018 or by authors’ calculation using the basic data. Then, determine the target value of the NOKEC EEIs according to Shandong’s plan for NOKEC [5], as shown in Table 2.
According to formulas (10)–(12), the normalized values of the EEIs are shown in Table 3.

4.2. Indicator Weight Calculation Results

Firstly, the DEMATEL method is used to analyze the relationship between the primary indicators. There are three primary l indicators in this paper. According to expert judgment and formula (1), the direct influence matrix X is:
X = [ 0 4 2 3 0 2 2 3 0 ]
Then, according to formula (2) and (3), the comprehensive impact matrix T can be obtained as follows:
T = [ 0.942 1.535 0.994 1.129 1.032 0.903 1.039 1.310 0.671 ]
The center degree D + R and the cause center D R of each primary indicator are shown in Table 4:
As can be seen from Table 4, the cause degree values of the economic development factor and energy efficiency factor are greater than 0, indicating that the two kinds of factors are the cause factors, that is, these two kinds factors affect other factors more than they are affected by other factors. The cause degree value of the electricity utilization factor is less than 0, revealing that this kind of factor is the result factor, that is, this factor is greatly affected by other factors. In addition, according to the D + R results, in the NOKEC effectiveness evaluation index system, the importance of electricity utilization indicators is greater than that of economic development indicators and energy efficiency indicators. Finally, according to the diagonal value of the comprehensive impact matrix, it can be found that each primary indicator has an internal influence, meaning that the secondary indicators are related to each other, which verifies the scientificity of using the ANP method to determine indicator weights. In summary, the interaction between the three primary indicators can be represented by Figure 1.
On the basis of the mutual influence relationship of the primary indicators and the meaning of the secondary indicators, the network hierarchy of the NOKEC effectiveness evaluation index system can be obtained, as shown in Figure 2. According to the ANP network hierarchy of the index system, using SuperDecision software, the weight coefficients of all secondary indicators are calculated, as listed in Table 5.
It can be seen from Table 5 that among the 17 secondary indicators, the electrification level has the highest weight value, followed by the proportion of industrial electricity consumption to the total electric power consumption. It is worth noting that the total weight value of five electricity utilization indicators is 0.4182, while the total weight value of economic development indicators and that of energy efficiency indicators are 0.3158 and 0.2660 respectively. This result shows that the power industry plays a key role in the NOKEC in Shandong Province, and thus more attention should be paid to these indicators. Besides, the weights of energy intensity ( S 31 ), the value added of emerging industries as a share of GDP ( S 17 ), R&D expenditure as a percentage of GDP ( S 12 ), and full labor productivity ( S 35 ) are also greater, indicating that the NOKEC in Shandong Province is concerned about these indicators. However, the weights of the urban–rural income ratio ( S 15 ) and Engel coefficient ( S 16 ) account for a relatively low proportion, revealing that the emphasis of Shandong’s NOKEC on the balance of development needs to be strengthened.

4.3. NOKEC Effectiveness Evaluation Results

Based on the normalized values listed in Table 3, the proposed NOKEC effectiveness evaluation model based on DQ-GRA technique is adopted in this section to evaluate Shandong’s NOKEC effectiveness during 2015–2017, and the evaluation results are presented in Table 6.
As can be seen from Table 6, the evaluation values of the NOKEC effectiveness in Shandong Province have increased year by year, indicating that Shandong’s NOKEC effectiveness is becoming more and more significant, that is, the NOKEC measures in Shandong Province have achieved positive results. In order to analyze the main factors affecting the NOKEC effectiveness in Shandong Province, this section further compares the evaluation indicator values of the NOKEC effectiveness of Shandong Province in 2015–2017 with the target values, as shown in Figure 3.
According to Figure 3, the value of NOKEC EEIs in Shandong Province in 2017 is greater than 2016 and 2015, which shows that the NOKEC in Shandong Province has achieved remarkable results in all aspects. Moreover, the weights of per capita GDP ( S 11 ), R&D expenditure as a percentage of GDP ( S 12 ), the value added of emerging industries as a share of GDP ( S 17 ), the proportion of industrial electricity consumption to the total electric power consumption ( S 22 ), electrification level ( S 24 ), electric power intensity ( S 25 ), energy intensity ( S 31 ), and full labor productivity ( S 35 ) are greater than the average indicator weight, revealing that the NOKEC should focus on the above eight key indicators.
Based on the results of indicator weights and indicator performance values, there are significant gaps between the actual and target values of three key indicators, namely, the value added of emerging industries as a share of GDP ( S 17 ), electric power intensity ( S 25 ), and full labor productivity ( S 35 ). Therefore, the coming focuses of the NOKEC in Shandong Province should be: (1) Further promote the development of strategic emerging industries and strive to increase the proportion of strategic emerging industries’ added value in total GDP. (2) Improve the quality of economic development and transform the economic development mode of depending energy and resources, so as to significantly reduce the electric power intensity. (3) Improve production efficiency and further improve the full labor productivity through technological advancement and scientific management.

5. Conclusions and Discussions

5.1. Conclusions

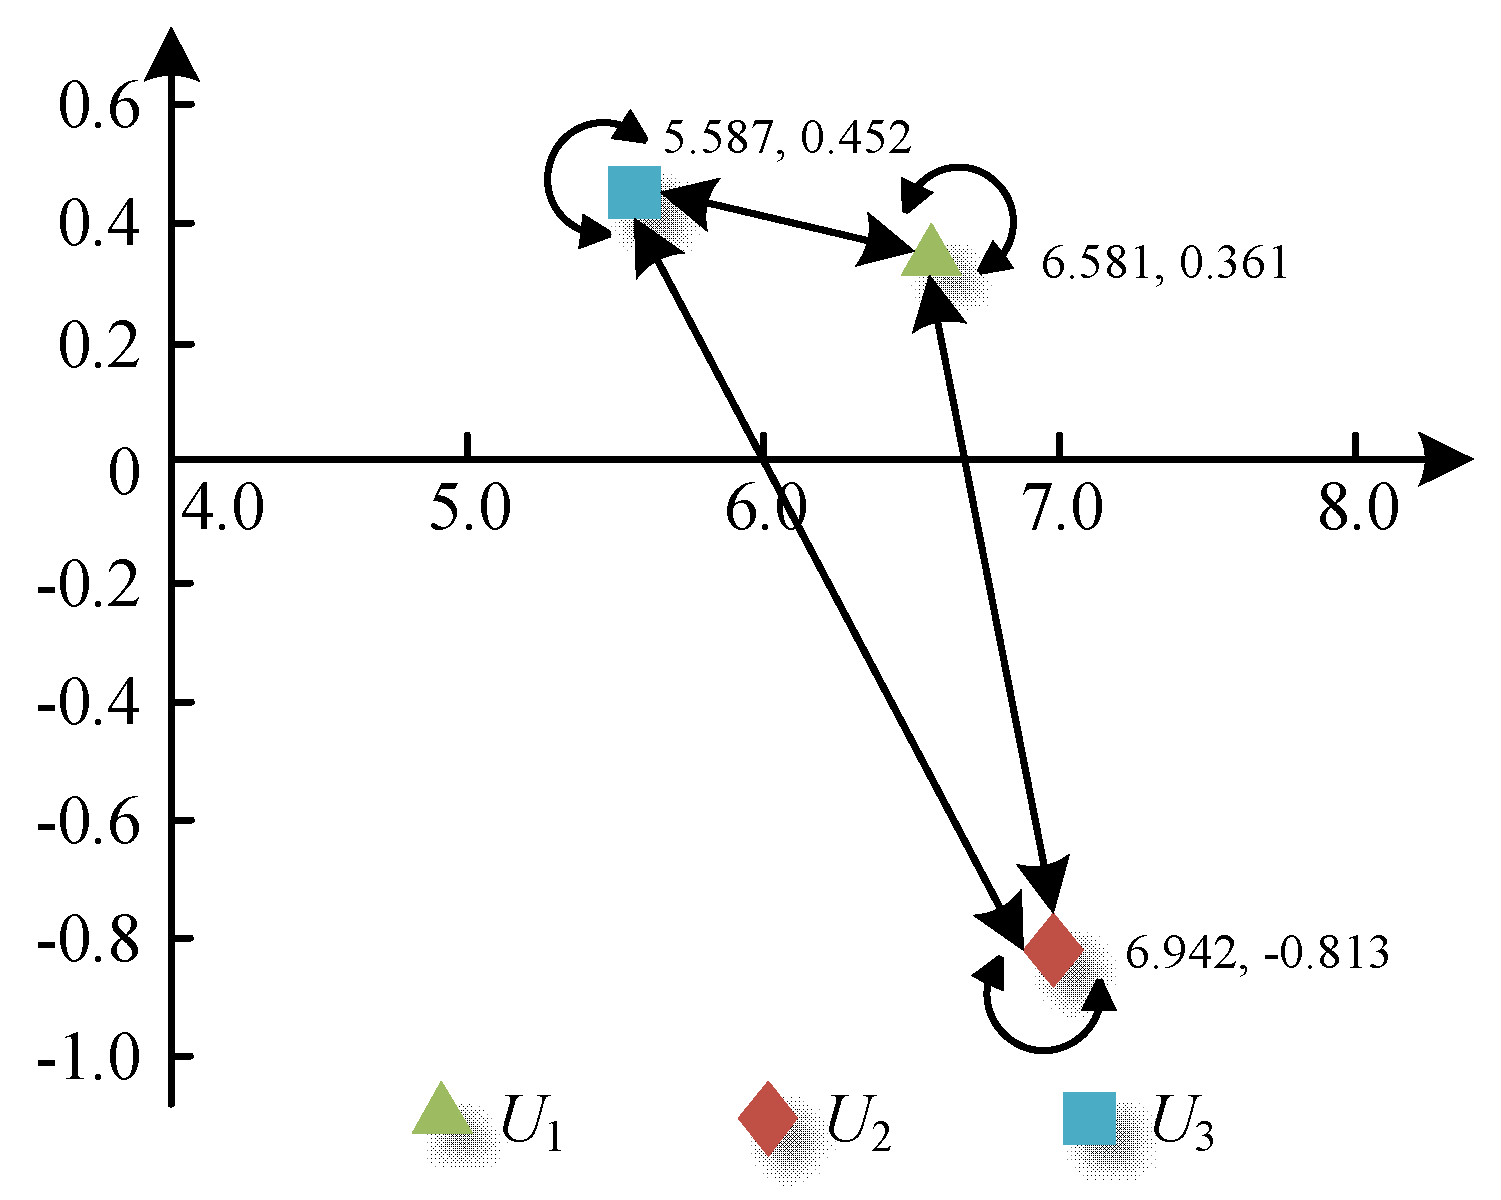
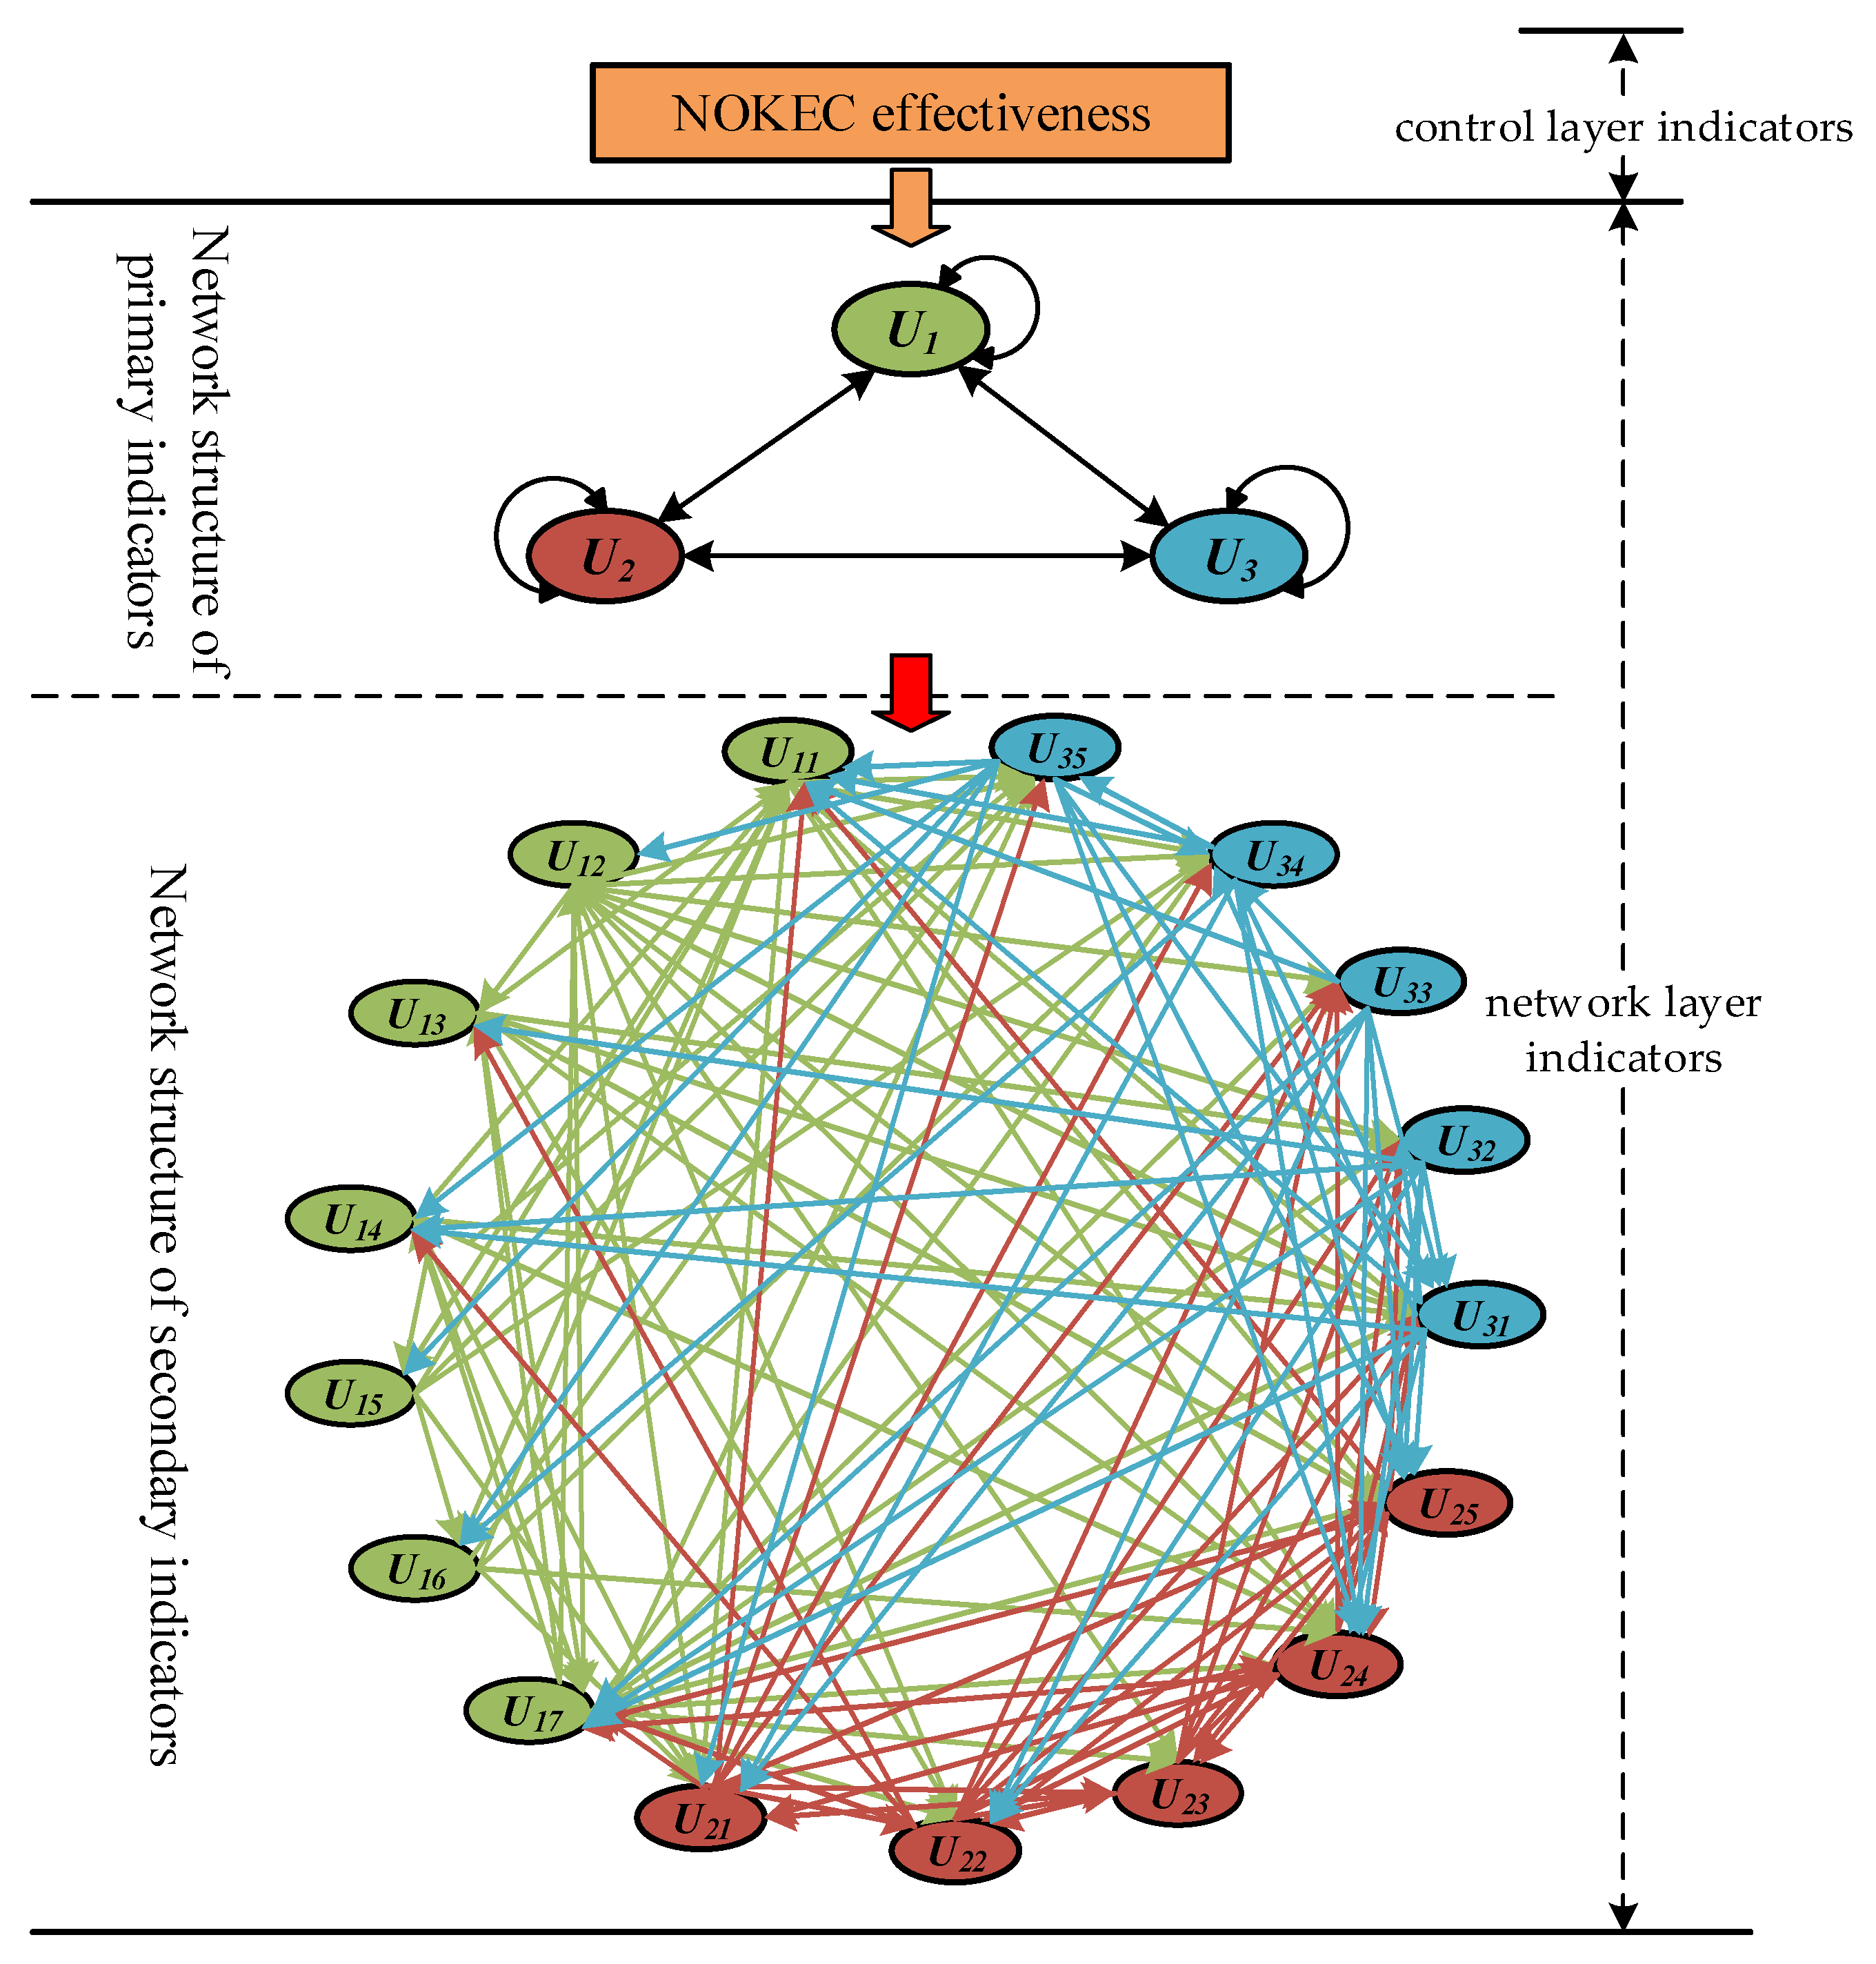
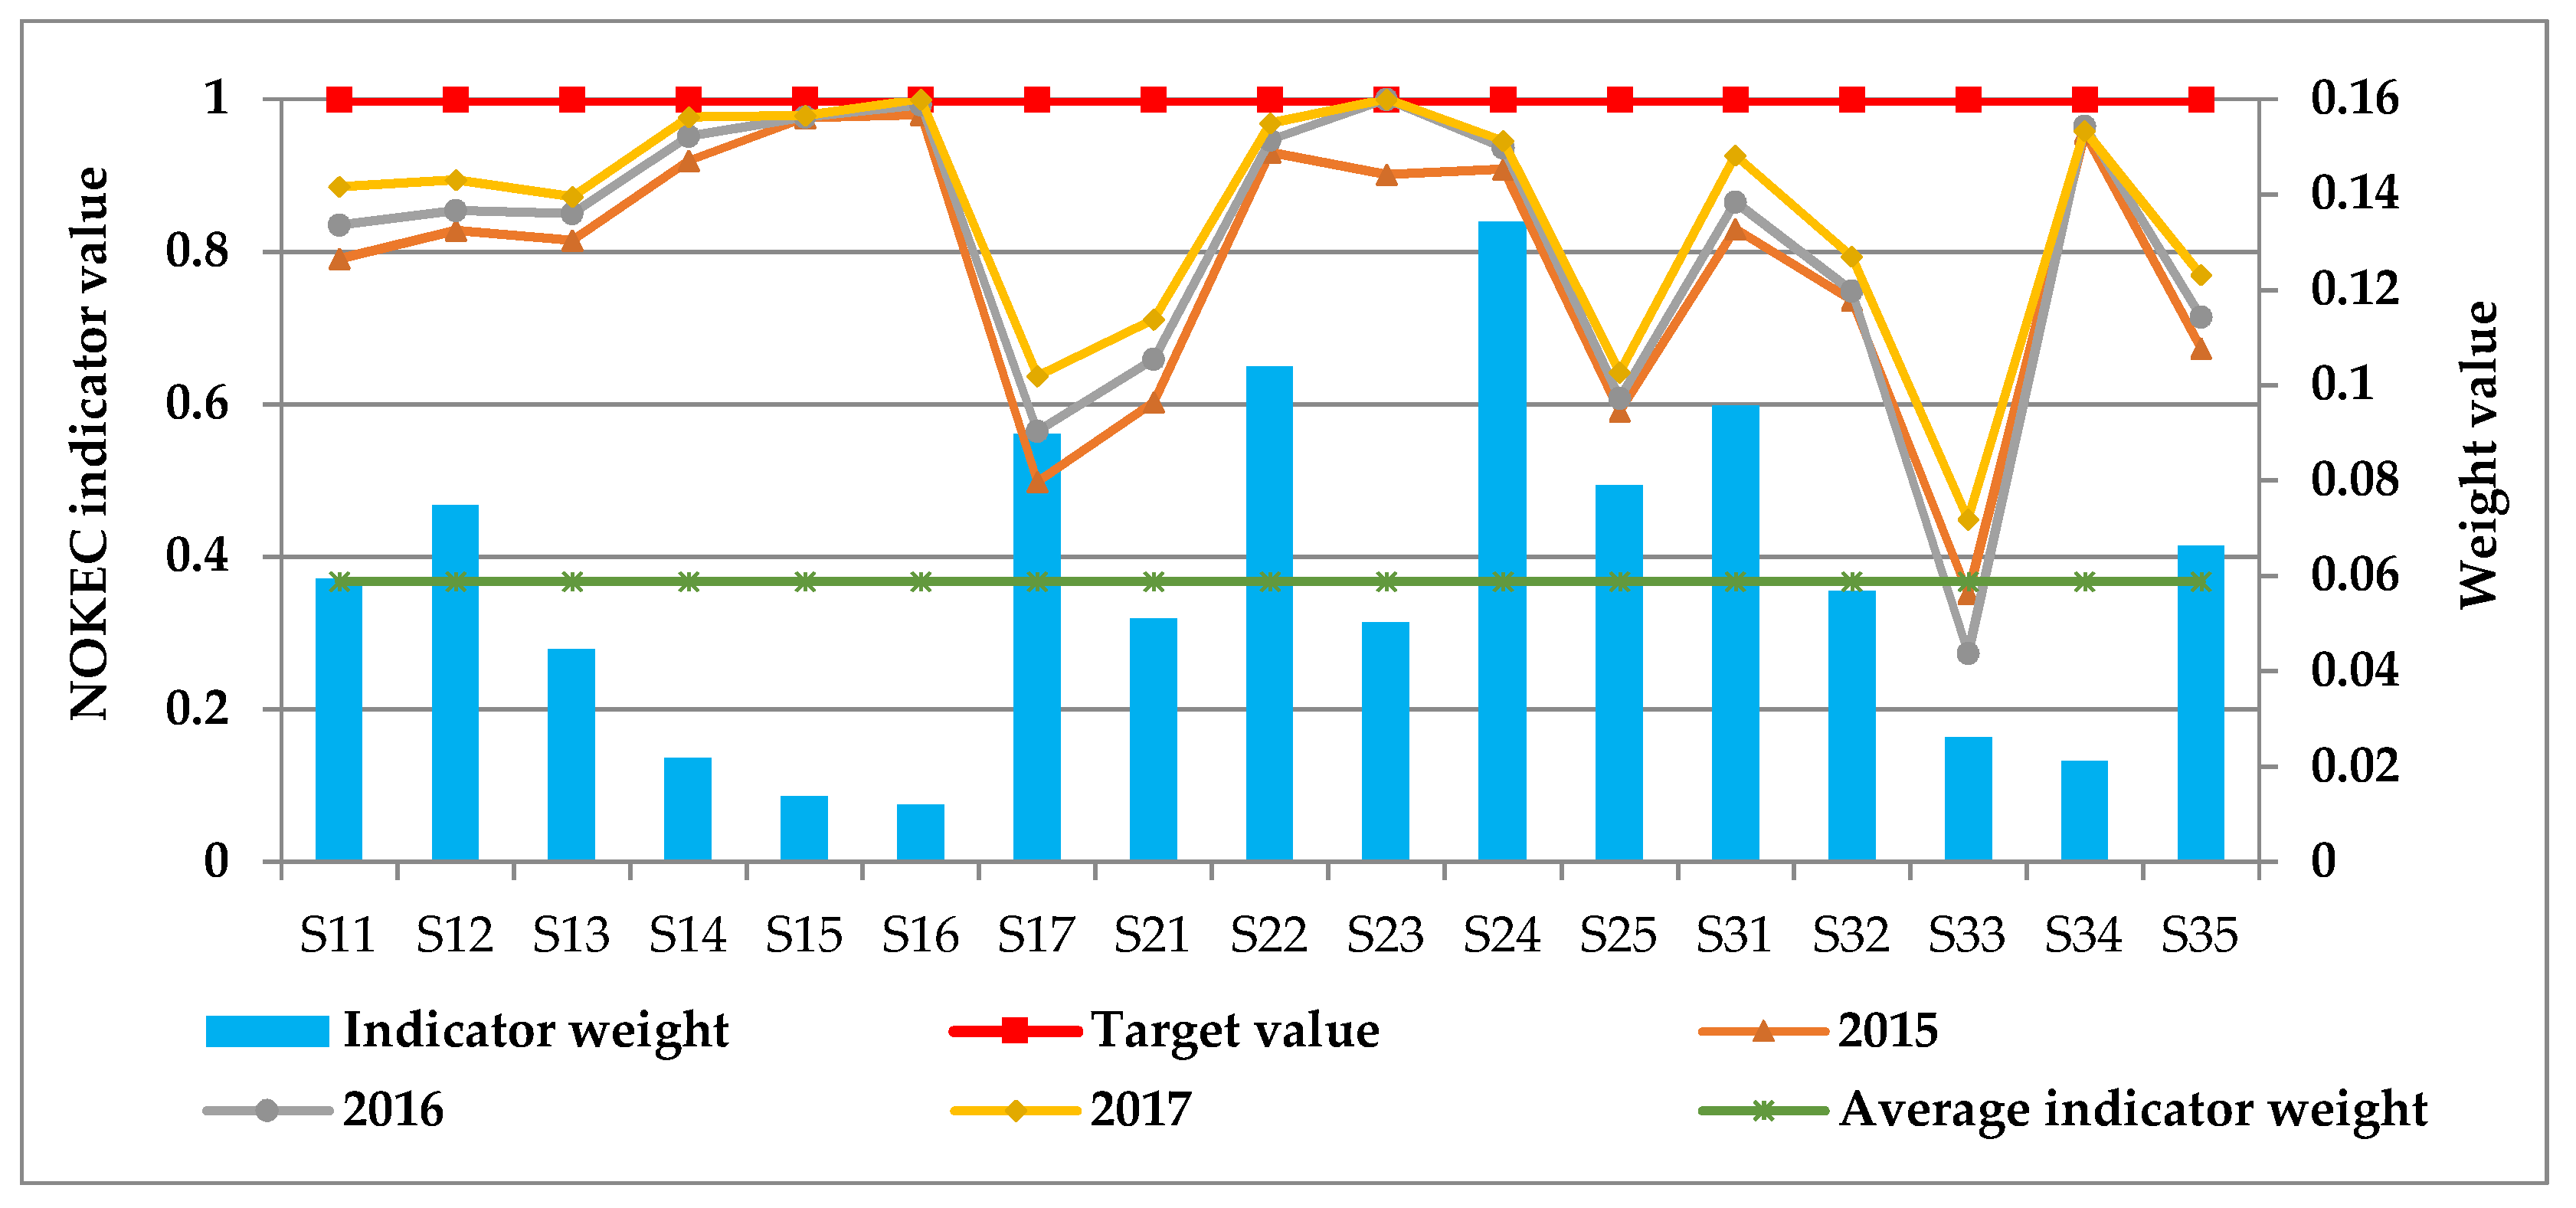
Based on the construction achievements of Shandong NOKEC-CEZ, this paper analyzed the goals of the NOKEC in Shandong Province and the supporting roles of power industry to Shandong’s NOKEC. On this basis, a NOKEC effectiveness evaluation index system involving three dimensions and 17 secondary indicators was constructed from an electric power economics perspective. Taking into account the indicator attribute and the characteristics of evaluating the NOKEC effectiveness, the DEMATEL-ANP technique was applied to determine the indicator weight, and an improved GRA method called DQ-GRA was employed to calculate the closeness between the actual evaluation indicator value sequence and the target value sequence of the indicators and whose result can be considered as the NOKEC effectiveness. To verify the scientificity and applicability of the proposed model, this paper collected related data in Shandong Province from 2015–2017 and evaluated the effectiveness of Shandong’s NOKEC.
The results showed that the evaluation value of the NOKEC effectiveness in Shandong Province has increased year by year from 2015–2017, indicating that a series of measures to promote Shandong’s NOKEC have achieved a positive effect. In addition, according to the results of index weights and indicator performance values, this paper puts forward the indicators that should be paid close attention to in Shandong’s future NOKEC process, which provides an empirical reference for the further development of NOKEC in Shandong Province.
Meanwhile, the proposed hybrid evaluation model based on DEMATEL-ANP and DQ-GRA techniques has good adaptability in evaluating the NOKEC effectiveness. Specifically speaking, the weight determination method based on DEMATEL-ANP considers the interrelationships between the secondary indicators, and the evaluation method based on DQ-GRA overcomes the shortcomings of traditional GRA that considers only the geometric similarity between data sequences, but ignores the numerical proximity. Overall, the proposed hybrid evaluation model has a good promotion and application value for similar effectiveness evaluation issues.

5.2. Discussions

Although the NOKEC effectiveness evaluation model based on DEMATEL-ANP and DQ-GRA techniques proposed in this paper can be well applied to evaluate the effectiveness of NOKEC in Shandong Province, there is still room for improvement in this paper.
(1) The proposed model still has some improvements. For instance, 1) more indicators that reflect innovation can be added to the indicator system. The indicator R&D expenditure as a percentage of GDP is involved in the index system in this paper to reflect the degree of innovation, and then it can be considered to include the number of researchers and the number of patents in the evaluation index system to reflect innovation. The reason for not joining these indicators in this paper is that Shandong Province did not explicitly request these indicators in the NOKEC plan, resulting that their target values could not be obtained. 2) In this paper, the DEMATEL method is adopted to improve ANP, and the key is to determine the relationship between the primary indicators, but the establishment of the ANP structure of the secondary indicators is still subjective. Following this paper, an in-depth study can be carried out, that is, DEMATEL can be applied to the construction of the entire ANP structure so as to reduce the subjectivity.
(2) The adaptability of the proposed model in other countries remains to be discussed. NOKEC is an initiative proposed by the Chinese government to promote economic restructuring, and Shandong Province is a model province for China’s NOKEC policy. Thus, when evaluating the effectiveness of NOKEC, this paper mainly considers the actual situation of Shandong Province of China, and the index system constructed mainly reflects the goals of NOKEC in Shandong Province. However, other countries in the world, like EU countries, the United States, and Paris agreement countries, are also experiencing economic restructuring similar to China’s NOKEC. To evaluate the effectiveness of similar policies in these countries, adaptive improvement of the evaluation index system is needed. Moreover, the setting of the target value of each indicator should also be adjusted according to the actual situation of different evaluation objects.
In summary, the NOKEC effectiveness evaluation model proposed in this paper improves the framework for evaluating the effectiveness of similar economic structural transformation policies. On the basis of this paper, relevant scholars can adapt the evaluation index system and evaluation methods according to the specific characteristics of the object to be evaluated, so as to be able to evaluate the implementation effect of the policy scientifically and objectively.

Author Contributions

W.X., H.Z. and B.L. conceived and designed the research method used in this paper; Y.Y. and N.X. collected the data, related policy documents and reference used for the analysis; B.L. performed the empirical analysis and wrote the paper.

Acknowledgments

Thanks are due to the Economic & Research Institute of State Grid Shandong Electric Power Company for providing the needed data and related policy documents for our research and to the North China Electric Power University Library for providing detailed reference.

Conflicts of Interest

The authors declare no conflict of interest.

References

  1. Wu, W.; Song, Y. Clear strategic direction and promote new and old kinetic energy conversion. China Price 2018, 1, 25–27. [Google Scholar]
  2. Ai, D. Correctly grasp the relationship between breaking old kinetic energy and cultivating new kinetic energy. Hubei Daily, 15 May 2018. [Google Scholar]
  3. Rosenberg, N.; Birdzell, L.E., Jr. How the West Grew Rich: The Economic Transformation of the Industrial World; Basic Books: New York, NY, USA, 2008. [Google Scholar]
  4. Bräutigam, D.; Tang, X. Going global in groups: Structural transformation and China’s special economic zones overseas. World Dev. 2014, 63, 78–91. [Google Scholar] [CrossRef]
  5. China State Council. Reply on the overall plan for the construction of a new and old kinetic energy conversion pilot area in Shandong Province. Available online: http://www.gov.cn/zhengce/content/2018-01/10/content_5255214.htm (accessed on 3 January 2018).
  6. Long, G. The meaning, opportunity and path of the new and old kinetic energy conversion. China Dev. Obs. 2017, 21, 28–31. [Google Scholar]
  7. Wang, X. New and old kinetic energy conversion: Challenges and responses. People’s Trib. 2015, 35, 16–18. [Google Scholar]
  8. Bai, J.; Zhang, X.; Liang, Q.; Yu, C.; Zhang, H.; Sun, J.; Shi, W.; Xu, W. Fiscal and financial risks with the conversion of new kinetic energy: Reflections on the fiscal and economic investigation in northeast China. Fisc. Sci. 2018, 1, 14–27. [Google Scholar]
  9. Zeng, Z. Research on new and old kinetic energy conversion and economic development. China Econ. 2017, 12, 54–56. [Google Scholar]
  10. Yang, H.; Jiao, Y. New and old kinetic energy conversion: Theoretical exploration and practical research. Res. Econ. Manag. 2018, 39, 16–28. [Google Scholar]
  11. Zhang, Z.; Li, W. The logic and path of new financial energy to boost new and old kinetic energy conversion. Rev. Econ. Manag. 2018, 34, 18–26. [Google Scholar]
  12. Zhang, L.; Wang, F.; Wang, Y. Breakthrough point and path of new and old kinetic energy conversion in Shandong: An empirical analysis based on municipal-level panel data from 2002 to 2016. Rev. Econ. Manag. 2018, 34, 27–41. [Google Scholar]
  13. Huang, S. New and old kinetic energy conversion and Shandong economic development. Shandong Soc. Sci. 2017, 9, 101–108. [Google Scholar]
  14. Zhang, W.; Zhang, N. The path choice of the new and old kinetic energy conversion in China under the guidance of supply side structural reform. Dongyue Trib. 2017, 38, 93–101. [Google Scholar]
  15. Zhang, D. The realization path of new and old kinetic energy conversion in Shandong. J. Dev. Reform 2017, 11, 55–57. [Google Scholar]
  16. Wang, X.; Li, Y. Analysis on the development path of coal industry in Shandong Province under the background of new and old kinetic energy conversion. Coal Econ. Res. 2018, 38, 13–17. [Google Scholar]
  17. Huang, H. The effect, problems and countermeasures of promoting the transformation from the old growth drivers of the industry to new ones. Econ. Rev. J. 2018, 08, 32–40. [Google Scholar]
  18. Apergis, N.; Payne, J.E. A dynamic panel study of economic development and the electricity consumption-growth nexus. Energy Econ. 2011, 33, 770–781. [Google Scholar] [CrossRef]
  19. Salahuddin, M.; Gow, J.; Ozturk, I. Is the long-run relationship between economic growth, electricity consumption, carbon dioxide emissions and financial development in Gulf Cooperation Council Countries robust? Renew. Sustain. Energy Rev. 2015, 51, 317–326. [Google Scholar] [CrossRef] [Green Version]
  20. Kahouli, B. The causality link between energy electricity consumption, CO2 emissions, R&D stocks and economic growth in Mediterranean countries (MCs). Energy 2018, 145, 388–399. [Google Scholar]
  21. Ye, Z.; Zhang, X. Some expansion of microeconomics in power economics. Econ. Perspect. 2008, 04, 89–94. [Google Scholar]
  22. Hu, Z. Electricity Economics; Tsinghua University Press: Beijing, China, 2013. [Google Scholar]
  23. Xiao, H. Speeding up the old and new kinetic energy conversion through power operation data. China Dev. Obs. 2018, 6, 28–30. [Google Scholar]
  24. Zhang, Z.; Ma, Y.; Hu, X. Research on the coupling effect of financial supply side reform and new and old kinetic energy conversion taking Shandong Province as an example. Dongyue Trib. 2018, 39, 43–53. [Google Scholar]
  25. Sun, X.; Hou, S. A study of the performance evaluation of new and old kinetic energy conversion on the basis of analytic hierarchy process and fuzzy comprehensive evaluation. J. Shandong Univ. Technol. 2019, 01, 9–14. [Google Scholar]
  26. Liu, Q.; Wang, L. Research on the measurement of new and old kinetic energy conversion index. China Natl. Cond. Strength 2018, 09, 52–54. [Google Scholar]
  27. Shouhu News. Shandong Deploys Priorities of New and Old Kinetic Energy Conversion. Available online: http://www.sohu.com/a/224859446_351293 (accessed on 5 March 2018).
  28. Shandong Provincial People’s Government. Notice on Printing and Distributing the Implementation Plan for Major Projects of New and Old Kinetic Energy Conversion in Shandong Province. Available online: http://www.shandong.gov.cn/art/2018/3/16/art_ 2522_11096.html (accessed on 13 February 2018).
  29. Li, Z. New and old kinetic energy conversion is the decisive move. China Small Medium Enterp. 2018, 1, 16. [Google Scholar]
  30. Polaris Power Net. Interpretation of the Top Ten Measures for Shandong Electric Power Company to Comprehensively Service for the New and Old Kinetic Energy Conversion. Available online: http://shoudian.bjx.com.cn/news/20180529/901183.shtml?security_verify_data=3337352c363637 (accessed on 29 May 2018).
  31. Shun Net. Shandong Will Reach the First-Class Distribution Grid Standard and Comprehensively Build a Modern Rural Grid in 2020. Available online: http://news.e23.cn /jnyc/2018-04-26/2018042600423.html (accessed on 26 April 2018).
  32. Xinhua Net. Shandong New Energy Power Generation Installed Capacity Accounted for More Than 20%. Available online: http://baijiahao.baidu.com/s?id=15988962761959 15541&wfr=spider&for=pc (accessed on 27 April 2018).
  33. Dong, Z. Shandong: Buying Hydropower from Sichuan and Offshore Wind Power to Connect to the Grid. China Energy News, 30 April 2018. [Google Scholar]
  34. Ma, H. Shandong’s energy transformation speeds up. China Economic Times, 16 May 2018. [Google Scholar]
  35. Shandong Provincial DRC, Shandong Provincial EIC, Shandong Provincial Department of Finance, Shandong Provincial Department of Housing and Urban-Rural Development, Shandong Provincial Department of Transportation, Shandong Provincial Department of Agriculture, Shandong Provincial Department of Environmental Protection, Shandong Provincial Price Bureau, Shandong Provincial Bureau of Quality and Technical Supervision, China Civil Aviation Shandong Provincial Safety Supervision Administration. Implementation Opinions on Further Accelerating the Electric Energy Substitution. Available online: http://jxw.weihai.gov.cn/ attach/0/1611211443331799198.pdf (accessed on 28 October 2016).
  36. People Net. Shandong Electric Energy Substitution Promotion Association Was Unveiled. Available online: http://sd.people.com.cn/n2/2017/0616/c172832-30339753.html (accessed on 16 June 2017).
  37. Polaris Power Net. 5100 Projects in Shandong Province Substituted 10.62 Billion kWh of Electricity. Available online: http://shoudian.bjx.com.cn/news/20180509/896428.shtml (accessed on 9 May 2018).
  38. Shandong Provincial Price Bureau. Implementation Opinions on Fully PLAY roles to Serve the Promotion of the New and Old Kinetic Energy Conversion. Available online: http://www.sdwj.gov.cn/ggfw/jggl/gsglsf/04/207443.shtml (accessed on 30 April 2018).
  39. Wu, J. Evaluation on development of old and new kinetic energy in Yunnan industry based on entropy weight method. J. North China Univ. Water Resour. Electr. 2018, 34, 23–27. [Google Scholar]
  40. Zheng, J.; Song, J.; Zhang, Y.; Zheng, Y.; Jiang, Q. The evaluation of conversion of new and old driving force of China’s economic growth. China Ind. Econ. 2018, 06, 24–42. [Google Scholar]
  41. Saaty, T.L. Fundamentals of the analytic network process. In Proceedings of the 5th International Symposium on the Analytic Hierarchy Process, Kobe, Japan, 12–14 August 1999; pp. 12–14. [Google Scholar]
  42. Ergu, D.; Kou, G.; Shi, Y.; Shi, Y. Analytic network process in risk assessment and decision analysis. Comput. Oper. Res. 2014, 42, 58–74. [Google Scholar] [CrossRef]
  43. Zhang, X.; Deng, Y.; Chan, F.T.; Adamatzky, A.; Mahadevan, S. Supplier selection based on evidence theory and analytic network process. Proc. Inst. Mech. Eng. Part B J. Eng. Manuf. 2016, 230, 562–573. [Google Scholar] [CrossRef]
  44. Shieh, J.I.; Wu, H.H.; Huang, K.K. A DEMATEL method in identifying key success factors of hospital service quality. Knowl. -Based Syst. 2010, 23, 277–282. [Google Scholar] [CrossRef]
  45. Su, C.M.; Horng, D.J.; Tseng, M.L.; Chiu, A.S.; Wu, K.J.; Chen, H.P. Improving sustainable supply chain management using a novel hierarchical grey-DEMATEL approach. J. Clean. Prod. 2016, 134, 469–481. [Google Scholar] [CrossRef]
  46. Hu, Z.; Tan, S.; Peng, Y. Computation of intelligent ratings based on ANP in super decision and its application. Comput. Eng. Des. 2006, 27, 2575–2577. [Google Scholar]
  47. Wei, G.W. Gray relational analysis method for intuitionistic fuzzy multiple attribute decision making. Expert Syst. Appl. 2011, 38, 11671–11677. [Google Scholar] [CrossRef]
  48. Chen, F.L.; Ou, T.Y. Gray relation analysis and multilayer functional link network sales forecasting model for perishable food in convenience store. Expert Syst. Appl. 2009, 36, 7054–7063. [Google Scholar] [CrossRef]
  49. Sahu, K.K.; Ballav, R. Optimization of machining parameters of aluminium based hybrid composites using gray relation analysis. Mater. Today Proc. 2017, 4, 9977–9981. [Google Scholar] [CrossRef]
  50. Li, A. Grey relational analysis of industrial structure and economic growth in Shandong Province. J. Commer. Econ. 2018, 03, 187–189. [Google Scholar] [CrossRef]
  51. Li, S.; Zhao, R.; Chen, L. Evaluation of innovation performance of logistics enterprises based on grey relational analysis and TOPSIS. J. Ind. Technol. Econ. 2018, 37, 12–21. [Google Scholar]
  52. Wu, Y.; Lei, J.; Bao, L.; Li, C. Short-term load forecasting based on improved grey relational analysis and neural network optimized by bat algorithm. Autom. Electr. Power Syst. 2018, 42, 67–74. [Google Scholar]
  53. Ning, X.; Wu, Y.; Chen, Z. Study on validation of simulation models based on improved gray relational analysis. Comput. Simul. 2015, 32, 259–263. [Google Scholar]
Figure 1. Interaction between primary indicators.
Energies 12 01174 g001
Figure 2. Network hierarchy of the index system.
Energies 12 01174 g002
Figure 3. Comparison of the actual and target values of NOKEC EEIs.
Energies 12 01174 g003
Table 1. NOKEC effectiveness evaluation index system.
Target LayerPrimary IndicatorSecondary IndicatorsIndicator OrderIndicator Attributes
The effectiveness of NOKECEconomic developmentPer capita GDP (Yuan) S 11 Benefit type
R&D expenditure as a percentage of GDP (%) 1 S 12 Benefit type
The added value of the tertiary industry as a share of GDP (%) S 13 Benefit type
Urbanization rate (%) S 14 Benefit type
Urban-rural income ratio (%) 2 S 15 Benefit type
Engel coefficient (%) 3 S 16 Cost type
The value added of emerging industries as a share of GDP (%) 4 S 17 Benefit type
Electricity utilizationElectricity consumption per capita (kWh/Year) S 21 Benefit type
The proportion of industrial electricity consumption to the total electric power consumption (%) S 22 Interval type
The proportion of the amount of electric power substitution to the total electric power consumption (%) S 23 Interval type
Electrification level (%) 5 S 24 Interval type
Electric power intensity (kWh/Yuan) S 25 Interval type
Energy efficiencyEnergy intensity (tons of standard coal/104×Yuan) S 31 Cost type
Energy consumption per unit of industrial added value (tons of standard coal/104×Yuan) S 32 Cost type
The proportion of non-fossil energy consumption to the total energy consumption (%) S 33 Benefit type
Per capita energy consumption (tons of standard coal) S 34 Cost type
Full labor productivity (104×Yuan) S 35 Benefit type
Notes: 1 R&D means research and development; 2 Urban–rural income ratio is calculated by dividing per capita income of rural residents by per capita income of urban residents; 3 Engel coefficient is the proportion of total food expenditure to total personal consumption expenditure; 4 Emerging industries refer to targeted industries in which regional industries are upgraded; 5 Electrification level is calculated by dividing the power consumption by the total energy consumption.
Table 2. The target and actual values of the NOKEC EEIs in Shandong.
IndicatorTarget Value201520162017Data source
S 11 82212650406863372807Shandong Statistical Yearbook
S 12 2.72.232.312.41Shandong Statistical Yearbook
S 13 5544.8246.7447.99Shandong Statistical Yearbook
S 14 6257.0159.0260.58Shandong Statistical Yearbook, Authors’ calculations
S 15 4240.9941.0341.09Shandong Statistical Yearbook, Authors’ calculations
S 16 2828.5828.1927.29Shandong Statistical Yearbook, Authors’ calculations
S 17 167.989.0410.20Shandong Statistical Yearbook, Authors’ calculations
S 21 850512.6560.2604.4Shandong Statistical Yearbook, Authors’ calculations
S 22 (70, 74)79.5078.9777.26Shandong Statistical Yearbook, Authors’ calculations
S 23 (1.8, 2.2)1.621.831.96Shandong Statistical Yearbook, Authors’ calculations
S 24 (60, 70)54.4856.1756.71Shandong Statistical Yearbook, Authors’ calculations
S 25 (0.021, 0.048)0.08120.07890.0748Shandong Statistical Yearbook, Authors’ calculations
S 31 0.04930.05940.05700.0533Shandong Statistical Yearbook
S 32 0.100.13580.13500.1274Shandong Statistical Yearbook, Authors’ calculations
S 33 186.334.928.08Shandong Statistical Yearbook
S 34 40343.85343.89313.8661Shandong Statistical Yearbook, Authors’ calculations
S 35 149.425610.000010.7782Shandong Statistical Yearbook, Authors’ calculations
Table 3. The normalized values of the NOKEC EEIs in Shandong.
Indicator NumberTarget Value201520162017
S 11 10.79110.83480.8856
S 12 10.82770.85390.8939
S 13 10.81490.84990.8726
S 14 10.91950.95190.9771
S 15 10.97600.97680.9784
S 16 10.97980.99331
S 17 10.49880.56500.6375
S 21 10.60310.65910.7111
S 22 10.93080.94660.9684
S 23 10.901811
S 24 10.90800.93620.9452
S 25 10.59110.60840.6417
S 31 10.83000.86510.9260
S 32 10.73630.74840.7939
S 33 10.35170.27330.4489
S 34 10.95520.96510.9584
S 35 10.67330.71430.7699
Table 4. The centrality and cause of the primary indicator.
Indicator Number D + R D R Importance
U 1 6.5810.3610.344
U 2 6.942–0.8130.363
U 3 5.5870.4520.292
Table 5. ANP weight results of the secondary indicator.
Indicator S 11 S 12 S 13 S 14 S 15 S 16
Weights0.05940.07480.04460.02170.01370.0119
Indicator S 17 S 21 S 22 S 23 S 24 S 25
Weights0.08970.0510.10380.05020.13430.0789
Indicator S 31 S 32 S 33 S 34 S 35
Weights0.09570.05680.02610.02110.0663
Table 6. Effect of NOKEC in Shandong Province from 2016 to 2018.
Years201520162017
NOKEC effectiveness value0.80520.83210.8628

