Article

Experimental and Numerical Analysis of the Effect of Vortex Generator Installation Angle on Flow Separation Control

1
China Huadian Engineering Co., Ltd. (CHEC), Beijing 100160, China
2
College of Energy, Power and Mechanical Engineering, North China Electric Power University, Beijing 102206, China
*
Author to whom correspondence should be addressed.
Energies 2019, 12(23), 4583; https://doi.org/10.3390/en12234583
Submission received: 5 November 2019 / Revised: 24 November 2019 / Accepted: 27 November 2019 / Published: 2 December 2019

Abstract

:
In order to explore the effect of the installation angle of vortex generator (VG) on boundary-layer flow control, the vortex characteristics of plate VG and their effect on the aerodynamic characteristics of an airfoil was studied numerically and using wind tunnel experiments. The effects of five VG installation angles (β) of 10°, 15°, 20°, 25°, and 30° on the characteristics of vortices were studied. The results show that the strength of vortices on the leeward side of VG increases with an increased installation angle until, eventually, the vortex core breaks down. During the downstream development of the VG leading-edge separation vortices, these vortices deviate in the radial direction. The larger the installation angle, the larger this deviation distance in the radial direction becomes. The effects of installation angle on the aerodynamic performance of airfoils were studied in a wind tunnel using the same five VG installation angles. The results show that VG can delay flow separation on the airfoil suction surface, thereby increasing lift and reducing drag. The stall angle of the airfoil with VG was increased by 10°. When the installation angle of the VG was 20°, the maximum lift coefficient of airfoil increased by 48.77%. For an airfoil angle of attack (AoA) of 18°, the drag of the airfoil decreased by 88%, and the lift-drag ratio increased by 1146.04%. Considering the best overall distribution of lift-drag ratio, the positive effect of the VG was found to be when β = 20° and the worst VG effectiveness was observed at β = 30°.

1. Introduction

Wind power has become an indispensable form of renewable energy and has become the third-largest power source in the world [1]. In order to ensure a sound structural design of wind turbine blades, the aerodynamic performance of the blade root is sacrificed in the design process. Specifically, flow separation on the airfoil suction surface close to the blade root occurs during the operation of the wind turbine, reducing the capture power of the wind turbine [2]. To address this, researchers have proposed many methods to suppress flow separation for airfoil blades including microflaps [3], blowing and suction [4], microtabs [5], flexible walls [6], synthetic jets [7,8], plasma actuators [9,10], and VG [11,12]. Barlas [13] and Johnson [14] compared and analyzed the flow control effects of each of these different methods. According to Manolesos [15] and Wang [16], the VG is one of the most effective devices to improve the aerodynamic performance of blades.
Taylor first introduced VG for airfoil flow control in the 1940s and successfully suppressed the flow separation by installing VG arranged on an airfoil in a regular pattern [17]. The basic principle of VG is that when the fluid flows over a VG, a concentration of vorticity is generated. Under the action of the concentrated vortices, high-energy fluid outside the boundary layer is entrained towards the wall and injected into the low-energy fluid inside the boundary layer. This effect delays the separation of the boundary layer [18,19,20]. It has been extensively shown in the literature that VG can effectively delay separation [14,15,16,17,18,19,20,21,22,23,24,25,26,27,28], increase maximum lift [15,27,28,29,30,31,32], and decrease drag [15,28,30,32,33]. To maximize this effect, many researches have performed parametric optimization studies both numerically [16,21,22,23,24,25,26,27,28,29,30] and experimentally [31,32,33,34,35,36,37,38,39,40]. Based on the research of numerically, Wang et al. [16] studied the aerodynamic performance of the S809 airfoil with and without VG. The results showed that VG can effectively improve the aerodynamic performance of the S809 airfoil, reduce the thickness of the boundary layer, and delay stall. The arrangement of twin VG showed good performance in controlling flow separation, further improving the airfoil aerodynamic performance. These conclusions have demonstrated the potential for the application of VG in wind turbine blades. Gao et al. [21] studied the influence of VG on the aerodynamic performance of a blunt trailing edge DU97-W-300 airfoil. The results showed that increasing the height of the VG has a more significant impact on drag than the lift of an airfoil. It was also shown that increasing the length of VG has a negative impact on both lift and drag, and increasing the distance between two adjacent VG has a positive impact on the suppression of flow separation. In most cases, the geometric height of the VG is equivalent to the thickness of the boundary layer. However, these so-called conventional VG may cause excessive drag in practical use. Therefore, Filgueira et al. [22] used numerical simulations to examine the trajectory and size of the vortices generated by low profile VG in a flat plate boundary layer and then studied the feasibility of low profile VG for boundary layer flow control. Zhen et al. [23] studied the influence of VG on the aerodynamic characteristics of the airfoil. A parametric study showed that the airfoil with VG had a high maximum lift coefficient. In addition, a shorter spacing between the VG also improved the maximum lift coefficient, and the performance of rectangular and curved edge VG is better than that of triangular VG. Kundu et al. [24] studied the effect of VG on the performance of an S1210 hydrofoil. The results showed that the lift coefficient of the airfoil was increased by 17%, and the stall angle was delayed from 10° to 12°. A combination of VG near the trailing edge and a circular trailing edge significantly improved the aerodynamic performance of the airfoil. Gageik et al. [25] studied the application of Micro-VG to suppress pressure waves in transonic airfoil flow. Using a numerical visualization method, unstable waves were identified in the separated boundary layer above the separation bubble. It was found that it is possible to suppress pressure waves and produce a steady flow field using Micro-VG. Mereu et al. [26] used numerical method to simulate the stall behavior of a DU97-W-300 airfoil at high Reynolds number. The influence of VG on the aerodynamic performance of the airfoil was also studied. In addition, a detailed sensitivity analysis was carried out to evaluate the effects of time integration duration, mesh resolution, and region width on simulation accuracy. At present, the challenges involved in calculating flow around VG have not been satisfactorily addressed. Manolesos et al. [27] proposed a VG model based on the Reynolds Averaged Navier-Stokes equations (RANS), including the Bendel Anderson Jagger model. A wind turbine was taken as an example to verify the reliability of the model. Brüderlin et al. [28] also simulated the aerodynamic characteristics of VG using the RANS method. The effectiveness of flow separation suppression using VG was demonstrated. Through a parametric study of different VG sizes, the effectiveness of the VG under various flow conditions and deflection angles was studied. Yang et al. [29] studied a blunt trailing edge airfoil with and without VG and analyzed the performance of the airfoil. A new airfoil with a 6% trailing edge bluntness was calculated, and its lift and drag characteristics were obtained. The interaction of wake or separation vortices of VG was examined, and the mechanisms of suppressing boundary layer separation were shown. Sørensen et al. [30] examined the FFA-W3-301 and FA-W3-360 airfoils and studied the effect of VG on airfoil flow separation. The calculated results were compared with wind tunnel measurements, and the variation of the airfoil lift and drag with respect to the angle of attack (AoA) were obtained. The influence of the chordal location and spacing of the VG on the aerodynamic performance of the airfoil was also studied.
In an experimental study, Fouatih et al. [31] optimized the parameters of VG. The results show that the triangular VG are the most suitable for controlling boundary layer separation. When the distance between the VG was 3 mm, and the VG are arranged at a 50% chord length of the airfoil, the effectiveness of the VG is maximized. Micro-VG have lower shape drag. The maximum lift coefficient of the airfoil with VG increased by 21%. Zhang et al. [32] studied the effects of VG on the aerodynamic performance of some large thickness airfoils experimentally. The influence of the height, chord position, and spacing of the VG were studied. The results show that the maximum lift coefficient of the airfoil increased when VG were installed on the leading edge of the airfoil. The spacing of adjacent VG has little effect on the lift coefficient of DU-W2-350 but has a significant influence on the lift coefficient before the stall of the DU-W2-400 airfoil. Manolesos et al. [15] used VG as a simple and effective method to delay or suppress the separation of blade flow and carried out an experimental study on the optimized blade. The pressure and flow field of triangular counter-current VG were discussed. The experimental results show that the maximum lift of the airfoil increased by 44%, while the drag increased by 0.2% at the airfoil stall angle. Lishu et al. [33] designed two types of VG and carried out wind tunnel tests. A comparative study was made on the different VG layouts. The results show that the aerodynamic performance of the airfoil can be significantly improved using a reasonable combination of Green flaps and VG, which is an ideal combination control form. Reuss et al. [34] conducted two-dimensional steady-state tests on a NACA 4415 airfoil at the Aerospace Research Laboratory of Ohio State University. The section lift and bending moment characteristics of the airfoil under different inflow conditions were studied. VG were then used to improve the aerodynamic characteristics of the airfoil. Velte et al. [35] used three-dimensional particle image velocimetry (PIV) to investigate the effect of VG on the stalled flow of airfoils. The flow structure induced by the VG on the airfoil and the separation control behavior of the VG on the airfoil were studied. Delnero et al. [36] studied the effect of triangular VG on the flow separation on an airfoil surface subject to low Reynolds number turbulence. The turbulence was characterized using a hot wire anemometer, and the local turbulence intensity and spatial-temporal turbulence scale were calculated. The VG were located at 10% and 20% chord length from the leading edge of the airfoil. Lishu et al. [37] studied the effect of three VG layouts on suppressing airfoil flow separation. The design criteria of VG for wind turbine blade flow control are uncertain. For this reason, Baldacchino et al. [38] studied the DU97-W-300 airfoil using wind tunnel experiments and oil flow visualization to confirm the effect of VG on flow separation. Compared with the uncontrolled case, the existence of VG increased the load fluctuation under stall conditions. Lin et al. [39] experimentally tested an airfoil with VG. The measurements included the airfoil lift and drag, surface pressure, wake velocity profile, and surface heat flux fluctuations. The results showed that the VG effectively reduced the separation of the boundary layer of the airfoil. Li et al. [40] study the effect of VG height on the development of vortices in the boundary layer flow of a flat plate. It was found that when the height of VG was equal to the thickness of the boundary layer or the height of the VG was 0.5 times the thickness of the boundary layer, the flow control effect of the VG was the best.
Although many scholars have studied the flow control mechanism of VG, there are still many problems related to the application of VG for the flow control of wind turbine blades. For example, the optimum VG installation angle to generate the best flow control effect has not been determined. On the one hand, the installation angle of VG affects the strength of the vortices; on the other hand, it affects the trajectory of the vortices. Both of these effects impact the flow control. The installation angle of VG also affects the shape resistance of the VG themselves, thus affecting the flow control effect. For wind turbine blade flow control, there are no relevant research papers answer the question of optimal VG installation angle. In this study, numerical simulations were used to study the influence of the installation angle on the VG vortex characteristics on a flat plate. The influence of the VG installation angle on the aerodynamic characteristics of a wind turbine airfoil was investigated in a wind tunnel.

2. Methods

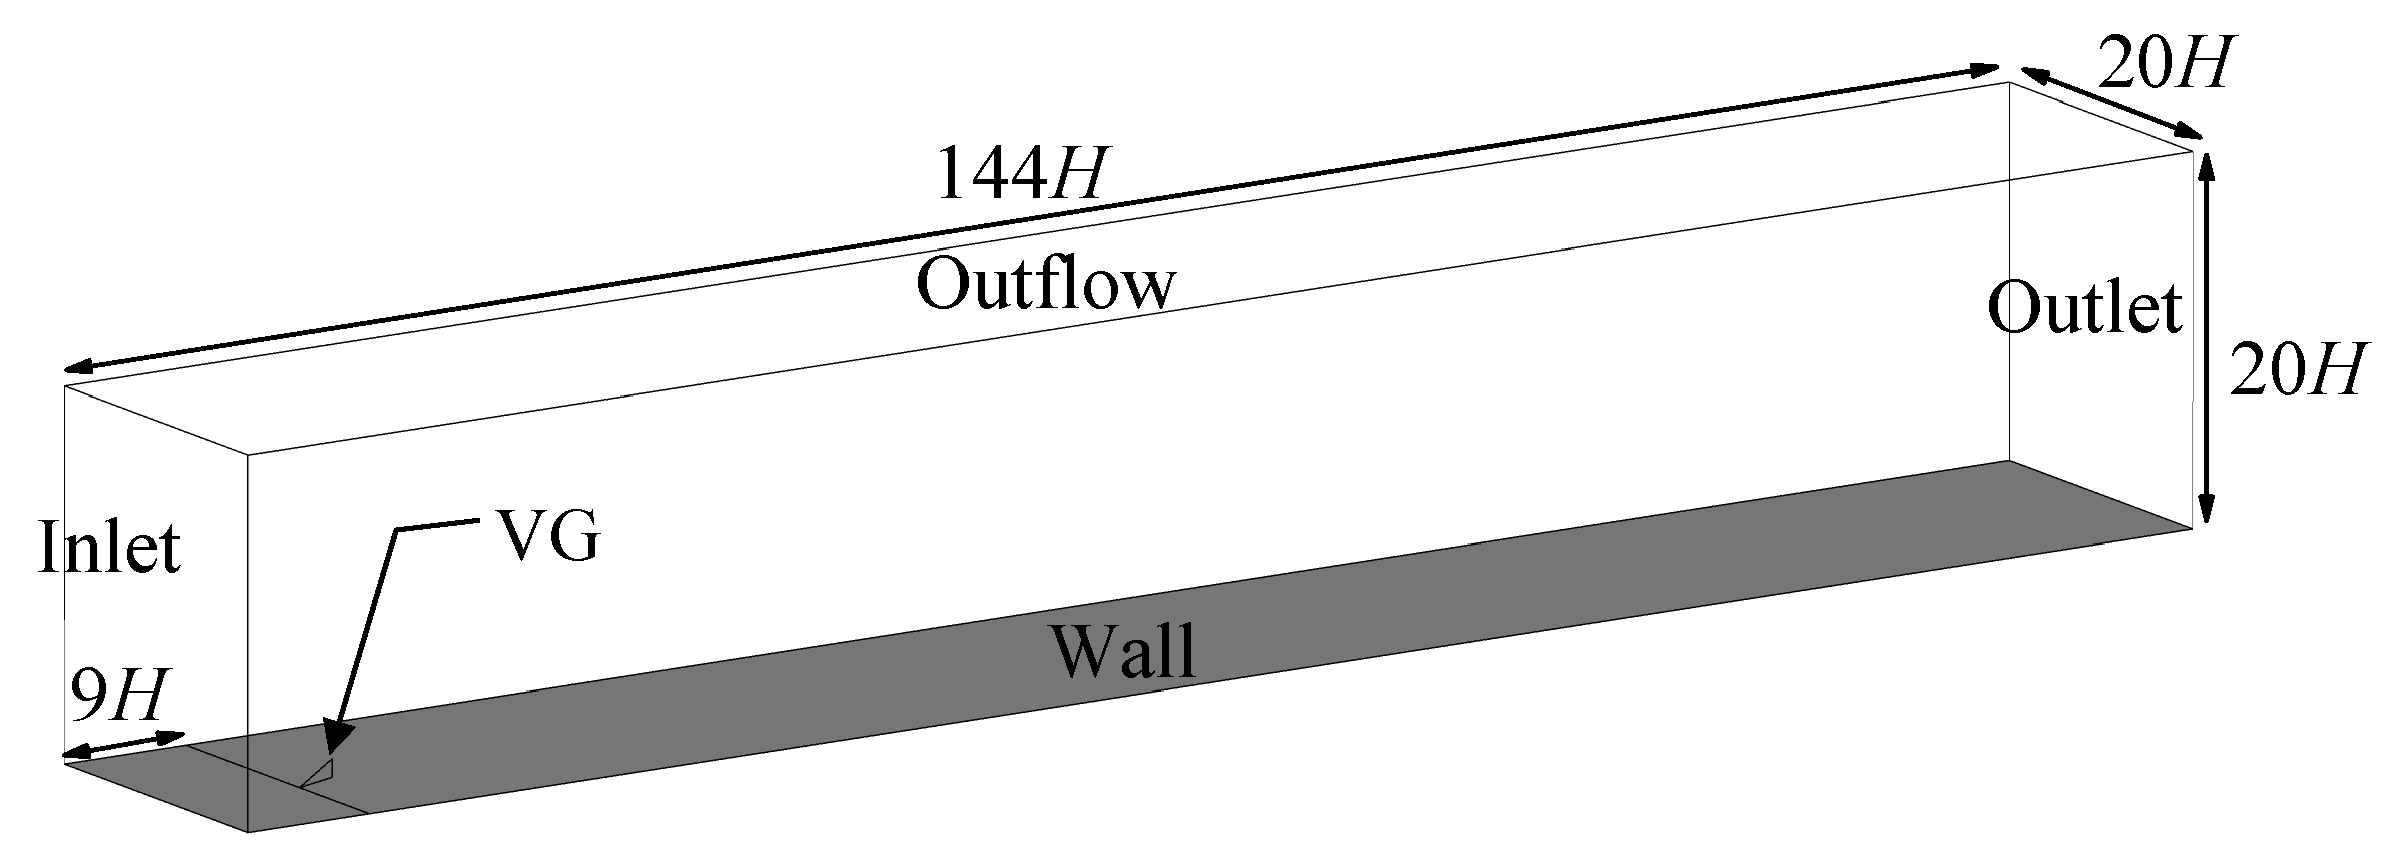
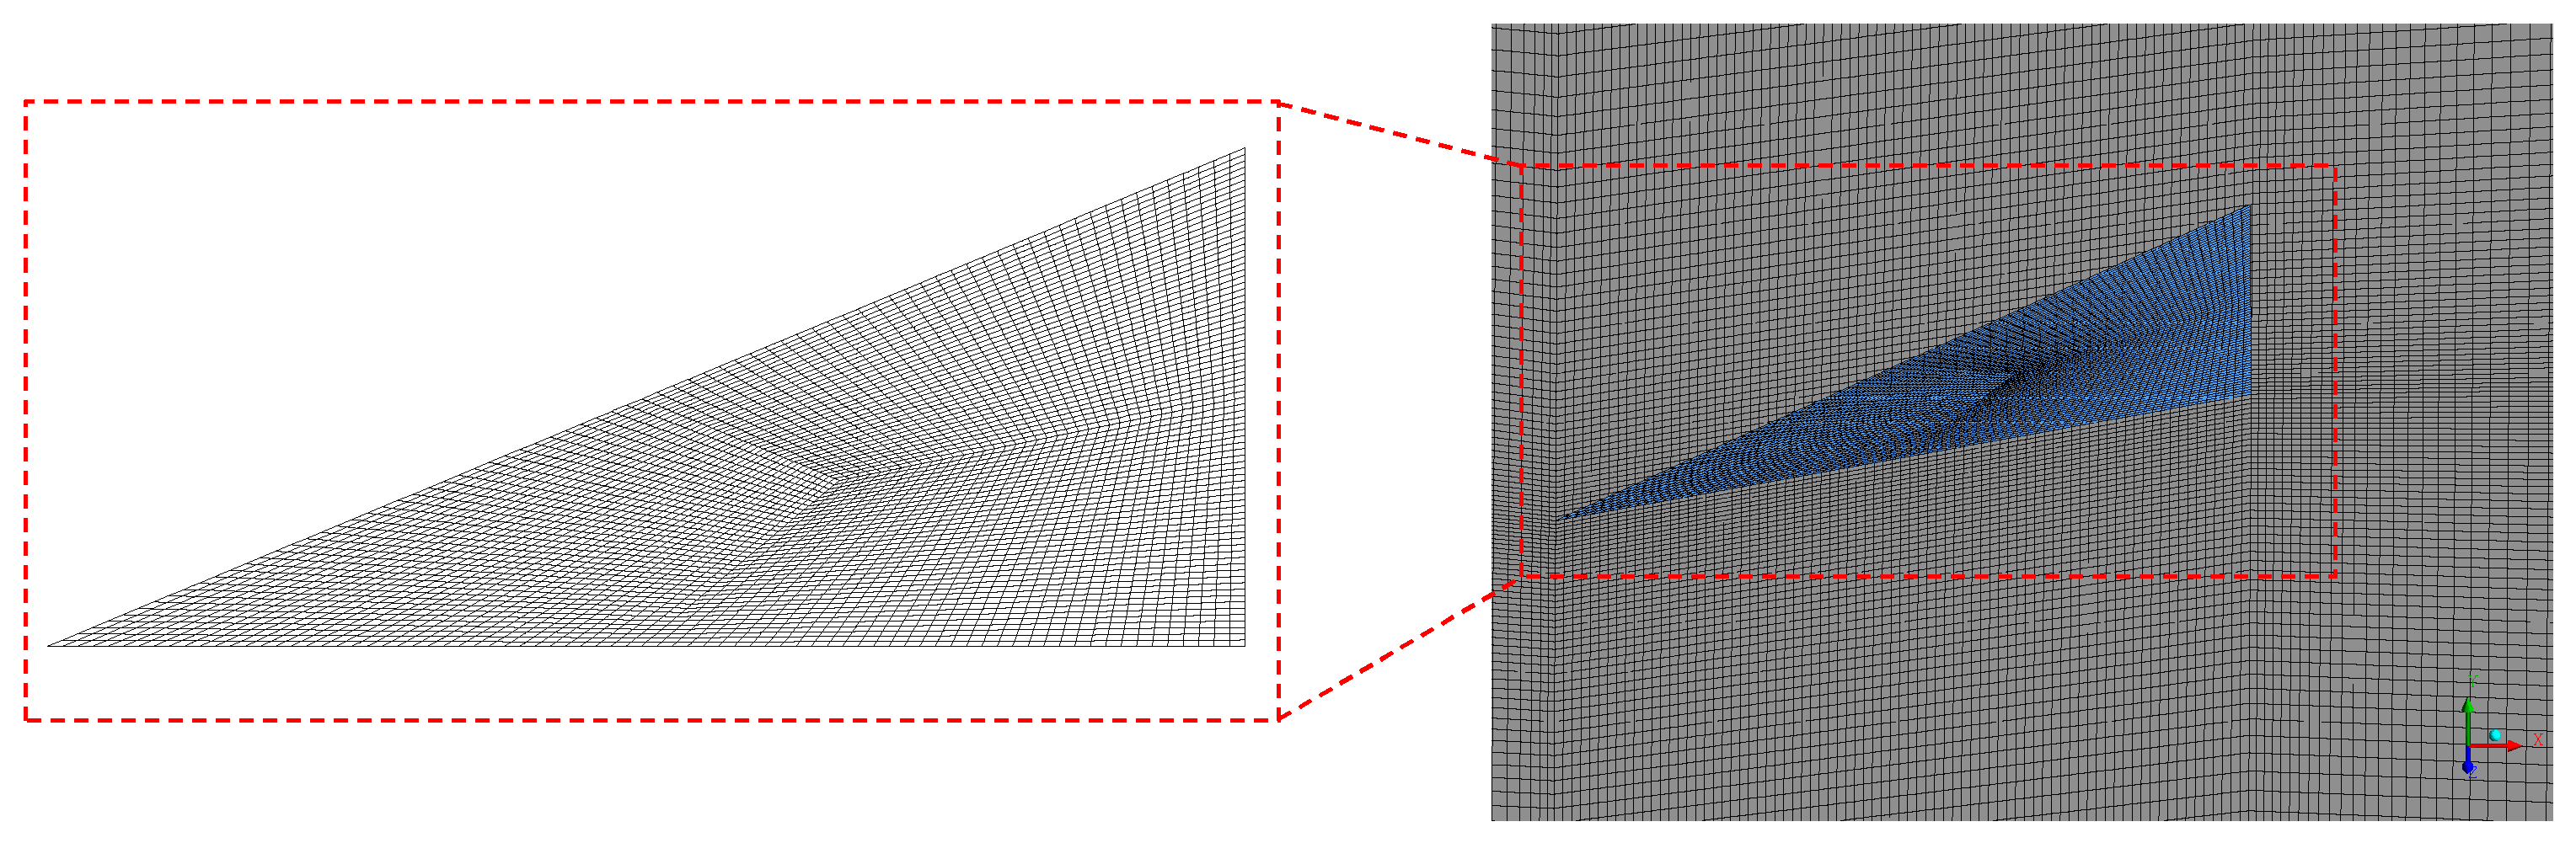
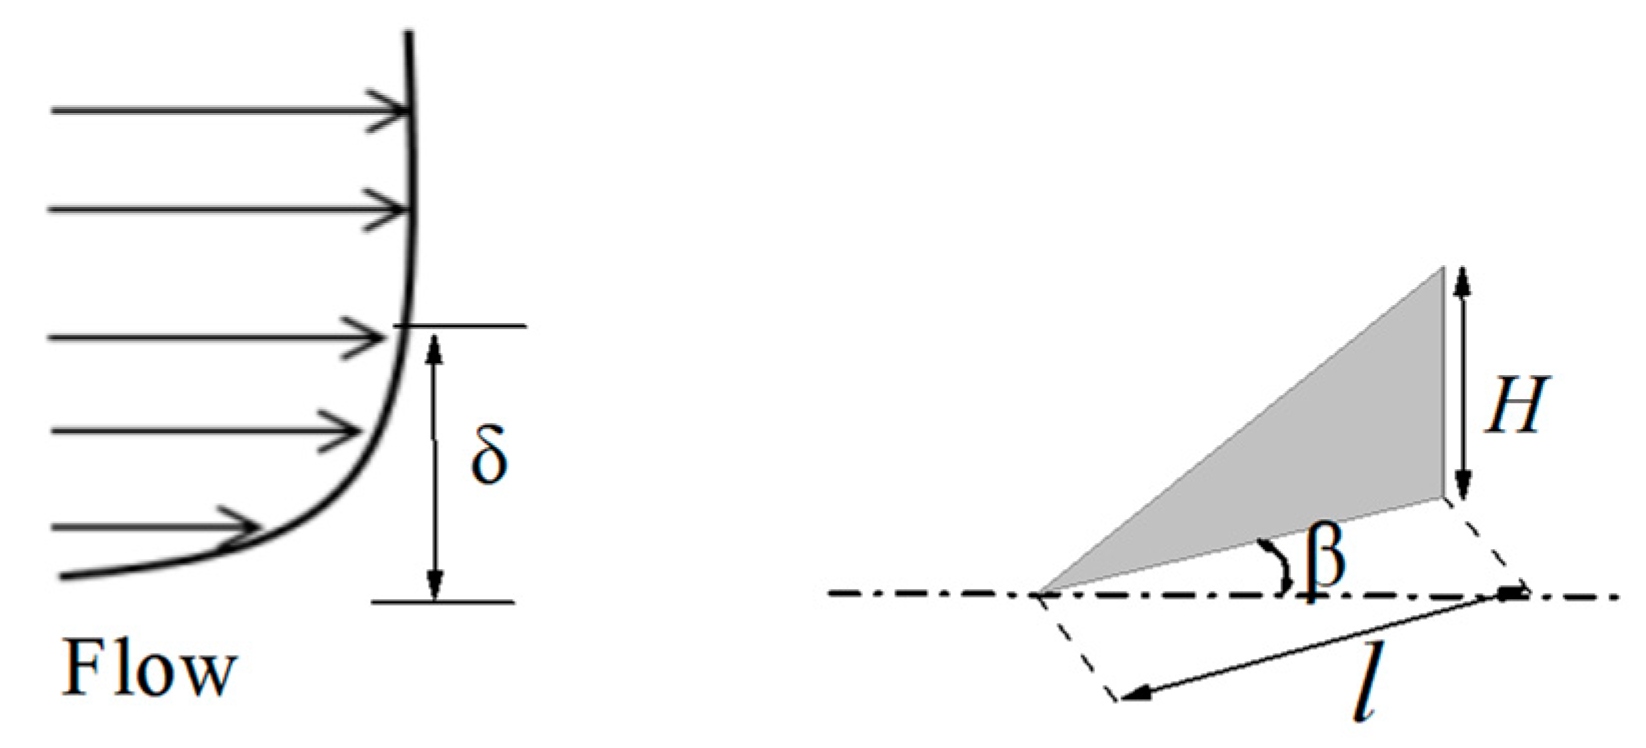
2.1. Numerical Conditions

In this study, the influence of the VG installation angle on the development of vortices in the boundary layer flow of a flat plate is studied numerically. The software, Fluent, was used to perform a steady-state numerical calculation. The Spalart-Allmaras (S-A) turbulence model was selected. The finite volume method was used for the discretization of the RANS equations with a second-order accuracy central difference scheme for spatial discretization, and the SIMPLE pressure-velocity coupling algorithm was adopted.
A rectangular computational domain was designed to study the motion of vortices downstream of the VG in the boundary layer flow of a flat plate. The streamwise length of the computational domain was 144H (where H is the height of the VG), the width was 20H, the height was 20H, and the VG were arranged at a distance of 9H away from the inlet. The two sides of the computational domain were set as symmetrical boundaries, the inlet is set as a velocity inlet, the outlet is set as a pressure outlet, the upper boundary was set as a free outflow boundary, and the bottom of the computational domain was set as a no-slip wall. The computational domain and boundary conditions were set, as shown in Figure 1.
The computational mesh was created using the software, ICEM, and a structured mesh was used in the whole computational domain. 80 mesh nodes were used in the height direction of VG, 80 mesh nodes were used along the chord of the VG, and 200 mesh nodes were used in the downstream direction of the VG. The total number of cells in the whole computational domain was approximately 5,000,000. The height of the first mesh layer on the VG surface was 1.2 × 10⁻⁵ mm, and the height of the first grid layer at the bottom of the computational domain was 1.0 × 10⁻⁵ mm. These heights correspond to a maximum local y+ less than 1, which meets the computational requirements of the selected turbulence model. The mesh distribution along the surface and bottom of the VG is shown in Figure 2.
Figure 3 shows a schematic diagram of the VG geometric parameters. The inflow velocity type is given by Equation (1). The installation angle of the VG is defined as the angle between the VG and the main velocity. The calculated geometric parameters are shown in Table 1. The main flow velocity was set to 82 m/s.
u = { U ( y δ ) U 1 / 7 y < δ y δ
where U is the freestream velocity, u is the local velocity, δ is the thickness of the boundary layer, and y is the normal distance from the wall.
Equations (2) and (3) were used to define the lift and drag coefficients of the VG, respectively:
C l = F l 1 2 ρ V 2 l
C d = F d 1 2 ρ V 2 l
where F l and F d are the total lift and drag forces of the VG; ρ = 1.225 kg/m3 (air density); V = 82 m/s (freestream velocity); and l is the chord length of the VG, l = 17 mm. In order to demonstrate mesh grid convergence, three sets of computational meshes with different densities were set up: 2,560,000 cells (coarse), 3,645,000 cells (medium), and 5,000,000 cells (fine). The three sets of computational results were obtained numerically, and the Richardson extrapolation method [41] was used to demonstrate convergence. Table 2 shows the results of the calculations and Richardson extrapolation. In this test case, the installation angle of the VG was set to 20°. RE is Richardson extrapolated value, p is the order of accuracy, R is the ratio of errors where 0 < R < 1 belongs to monotonic convergence, R > 1 corresponds to divergence, R < 0 corresponds to oscillatory convergence. It can be seen from the calculation results that for each parameter, R is less than 1. Therefore, the meshes exhibit monotonic convergence. In this paper, the fine mesh was used for the presented computations.

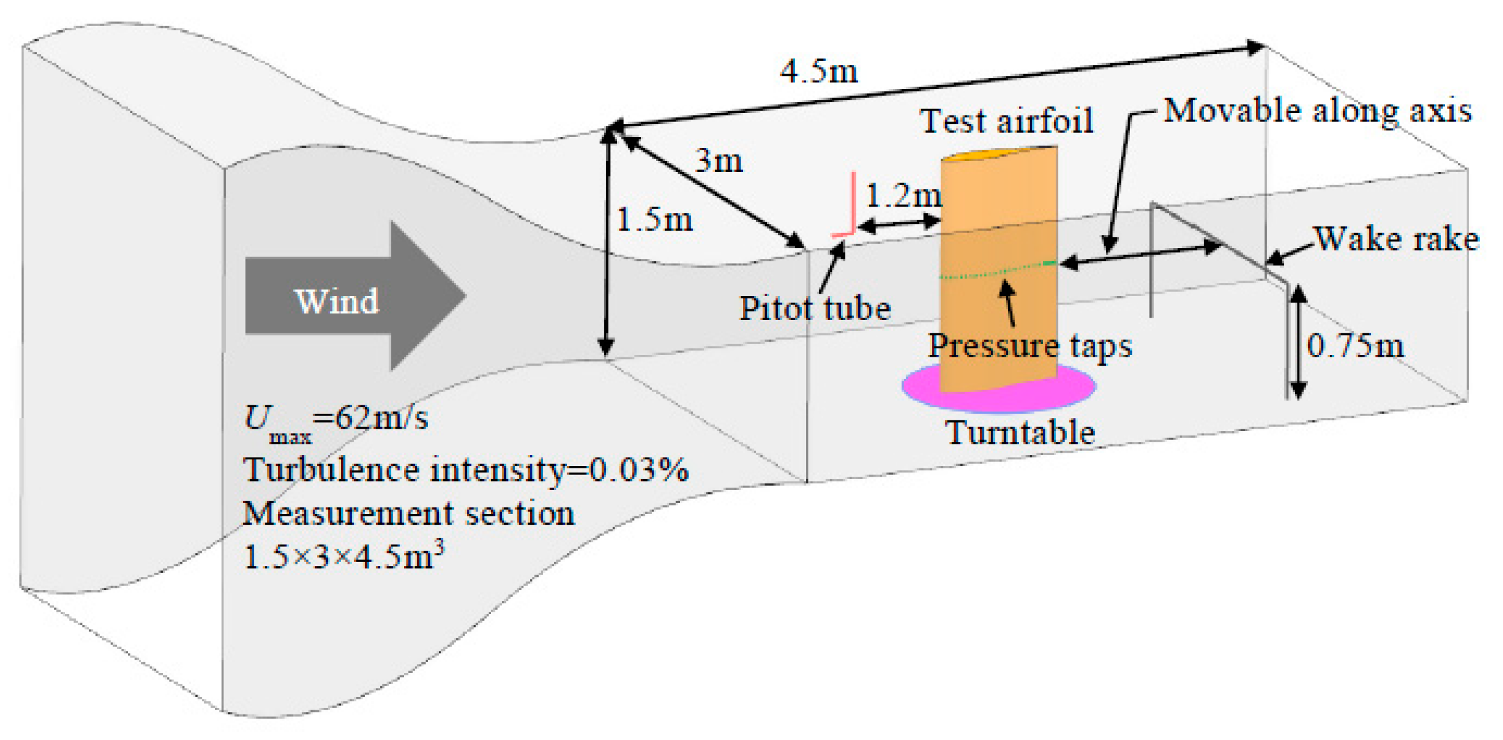
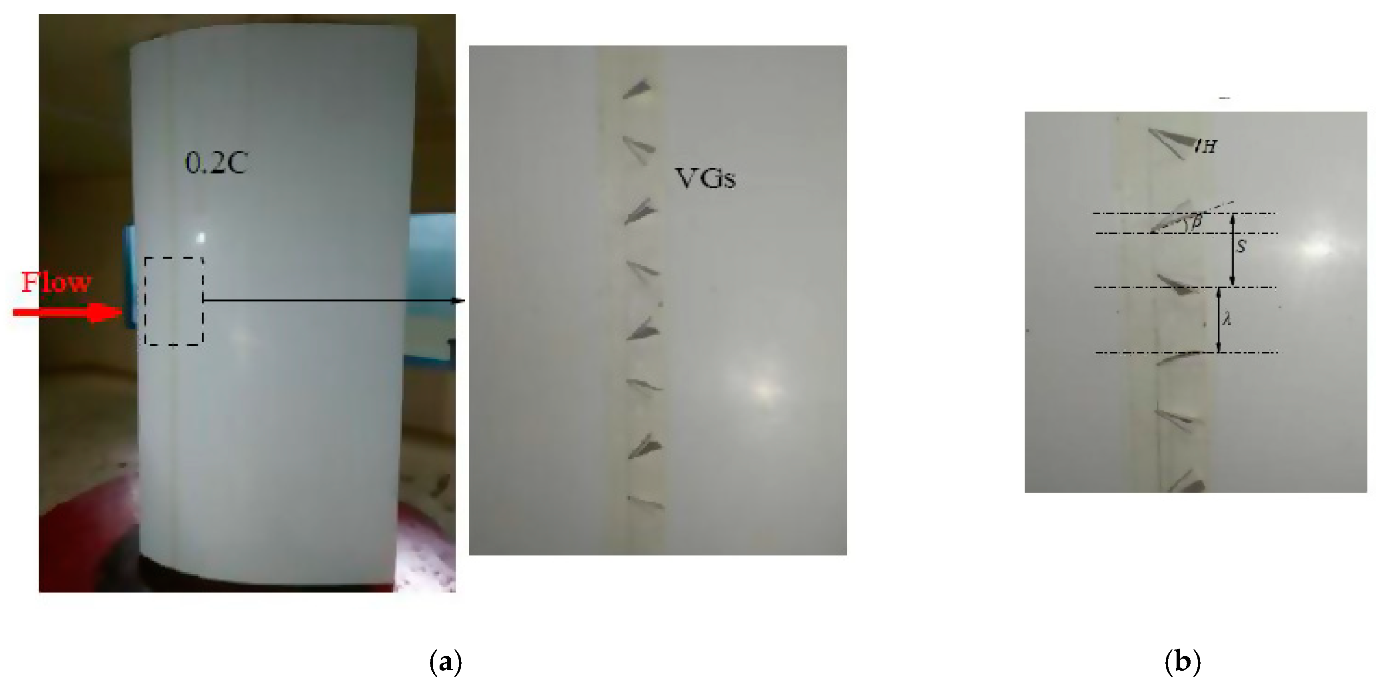
2.2. Experimental Setup

An experiment of an airfoil with VG was carried out in the wind tunnel of North China Electric Power University (NCEPU), which contains a 2-D airfoil measurement section. The size of the test section is 1.5 × 3 × 4.5 m3, and the maximum wind speed of the wind tunnel is 62 m/s. The measurement section is equipped with 256 and 64 channel electronic scanning valves and a PXI data acquisition system. A pitot tube was installed on the wall of the upstream wind tunnel of the airfoil and provides a measurement of the total pressure of the inflow. The sidewall of the pitot tube is provided with air holes, which are used to measure the static pressure of the incoming flow. There are 96 pressure taps in the middle section of the airfoil to measure the static pressure distribution on the surface of the airfoil. The measuring accuracy of these pressure taps is 0.0005. The static pressure coefficient (Cp) is the time-averaged result found with a sampling time interval of 0.1 s. The experimental sampling time was 10 s for each working condition. There are 111 total pressure piezometric holes and 5 static pressure piezometric holes (called the wake rake) downstream of the airfoil, which were used to calculate the drag coefficient of the airfoil. The geometric dimensions of the wind tunnel and test airfoils are shown in Figure 4.
The test airfoil used in the experiment is a special wind turbine airfoil: the DU93-W-210 airfoil. The airfoil was developed and designed by Delft University. The DU93-W-210 airfoil is very representative of the aerodynamic characteristics of wind turbine airfoils in general. The thickness of the airfoil is 21%, the chord length of the tested airfoil is 0.8 m, and the span of the airfoil is 1.5 m. The VG were arranged at 0.2 times the chord length from the leading edge of the airfoil.
Figure 5 shows the test airfoil with VG installed. The geometric dimensions of the VG are shown in Table 3. The tunnel wind speed was set to 18.2 m/s, and the Reynolds number based on the chord of the airfoil was 1 × 10⁶. The AoA of the airfoil ranged from −10° to 25°.
Figure 6 shows the wind tunnel test results of the DU93-W-210 airfoil without VG. NCEPU represents the test results in this paper. NPU is the wind tunnel test results of Northwest Polytechnic University, and Delft is the wind tunnel test results of Delft University. By comparing the results of the three wind tunnels, it can be seen that the wind tunnel test results in this paper are close to those obtained by NPU and Delft before stall AoA (8°) for the airfoil lift coefficient. After the stall AoA, the lift coefficient measured in the wind tunnel is slightly higher than that measured in the other two wind tunnels. For the drag coefficient, before the stall AoA, the drag coefficient matches the results of the other wind tunnels. However, after the stall AoA, the wind tunnel test results in this paper are closer to the Delft University wind tunnel test results. Since the aerodynamic characteristics of airfoils fluctuate after stall, the lift and drag coefficients must be revised, and the mechanism of each correction method is different. However, the present study is focused on the aerodynamic characteristics of the airfoil before the stall.

3. Results and Discussion

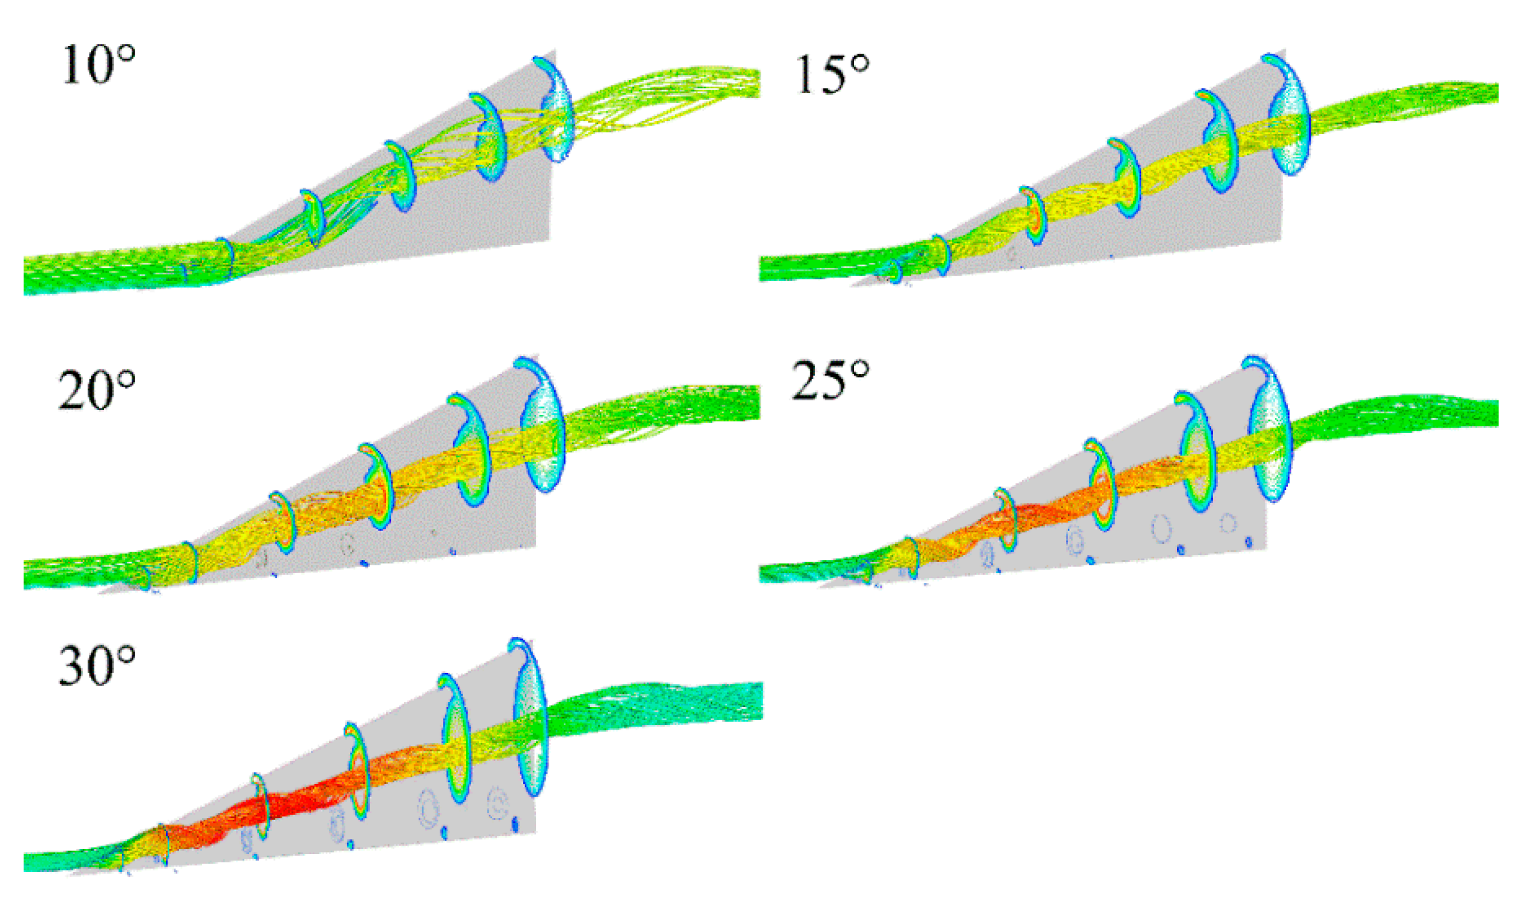
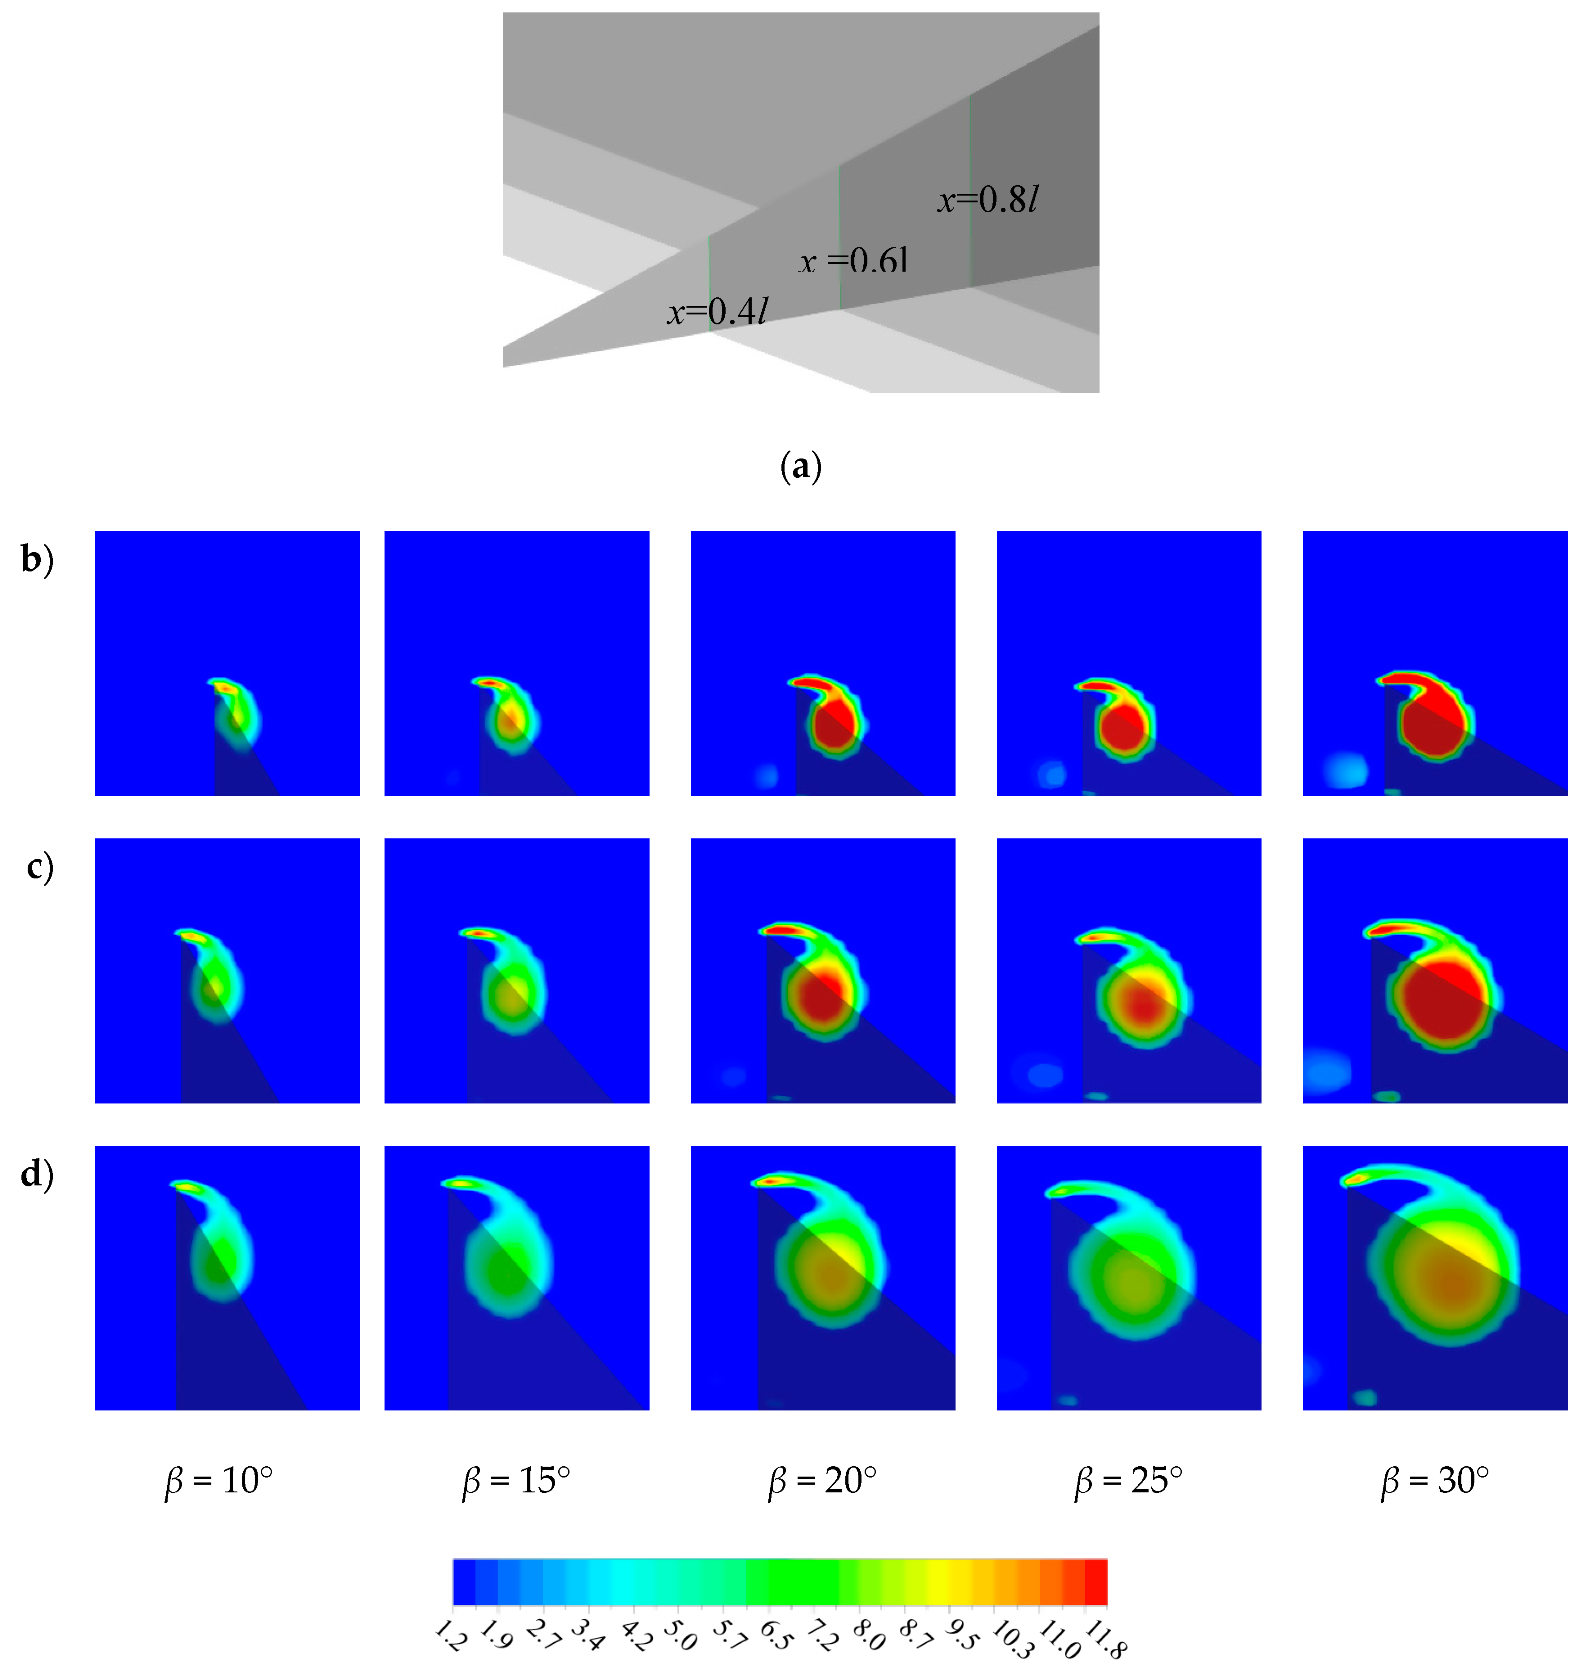
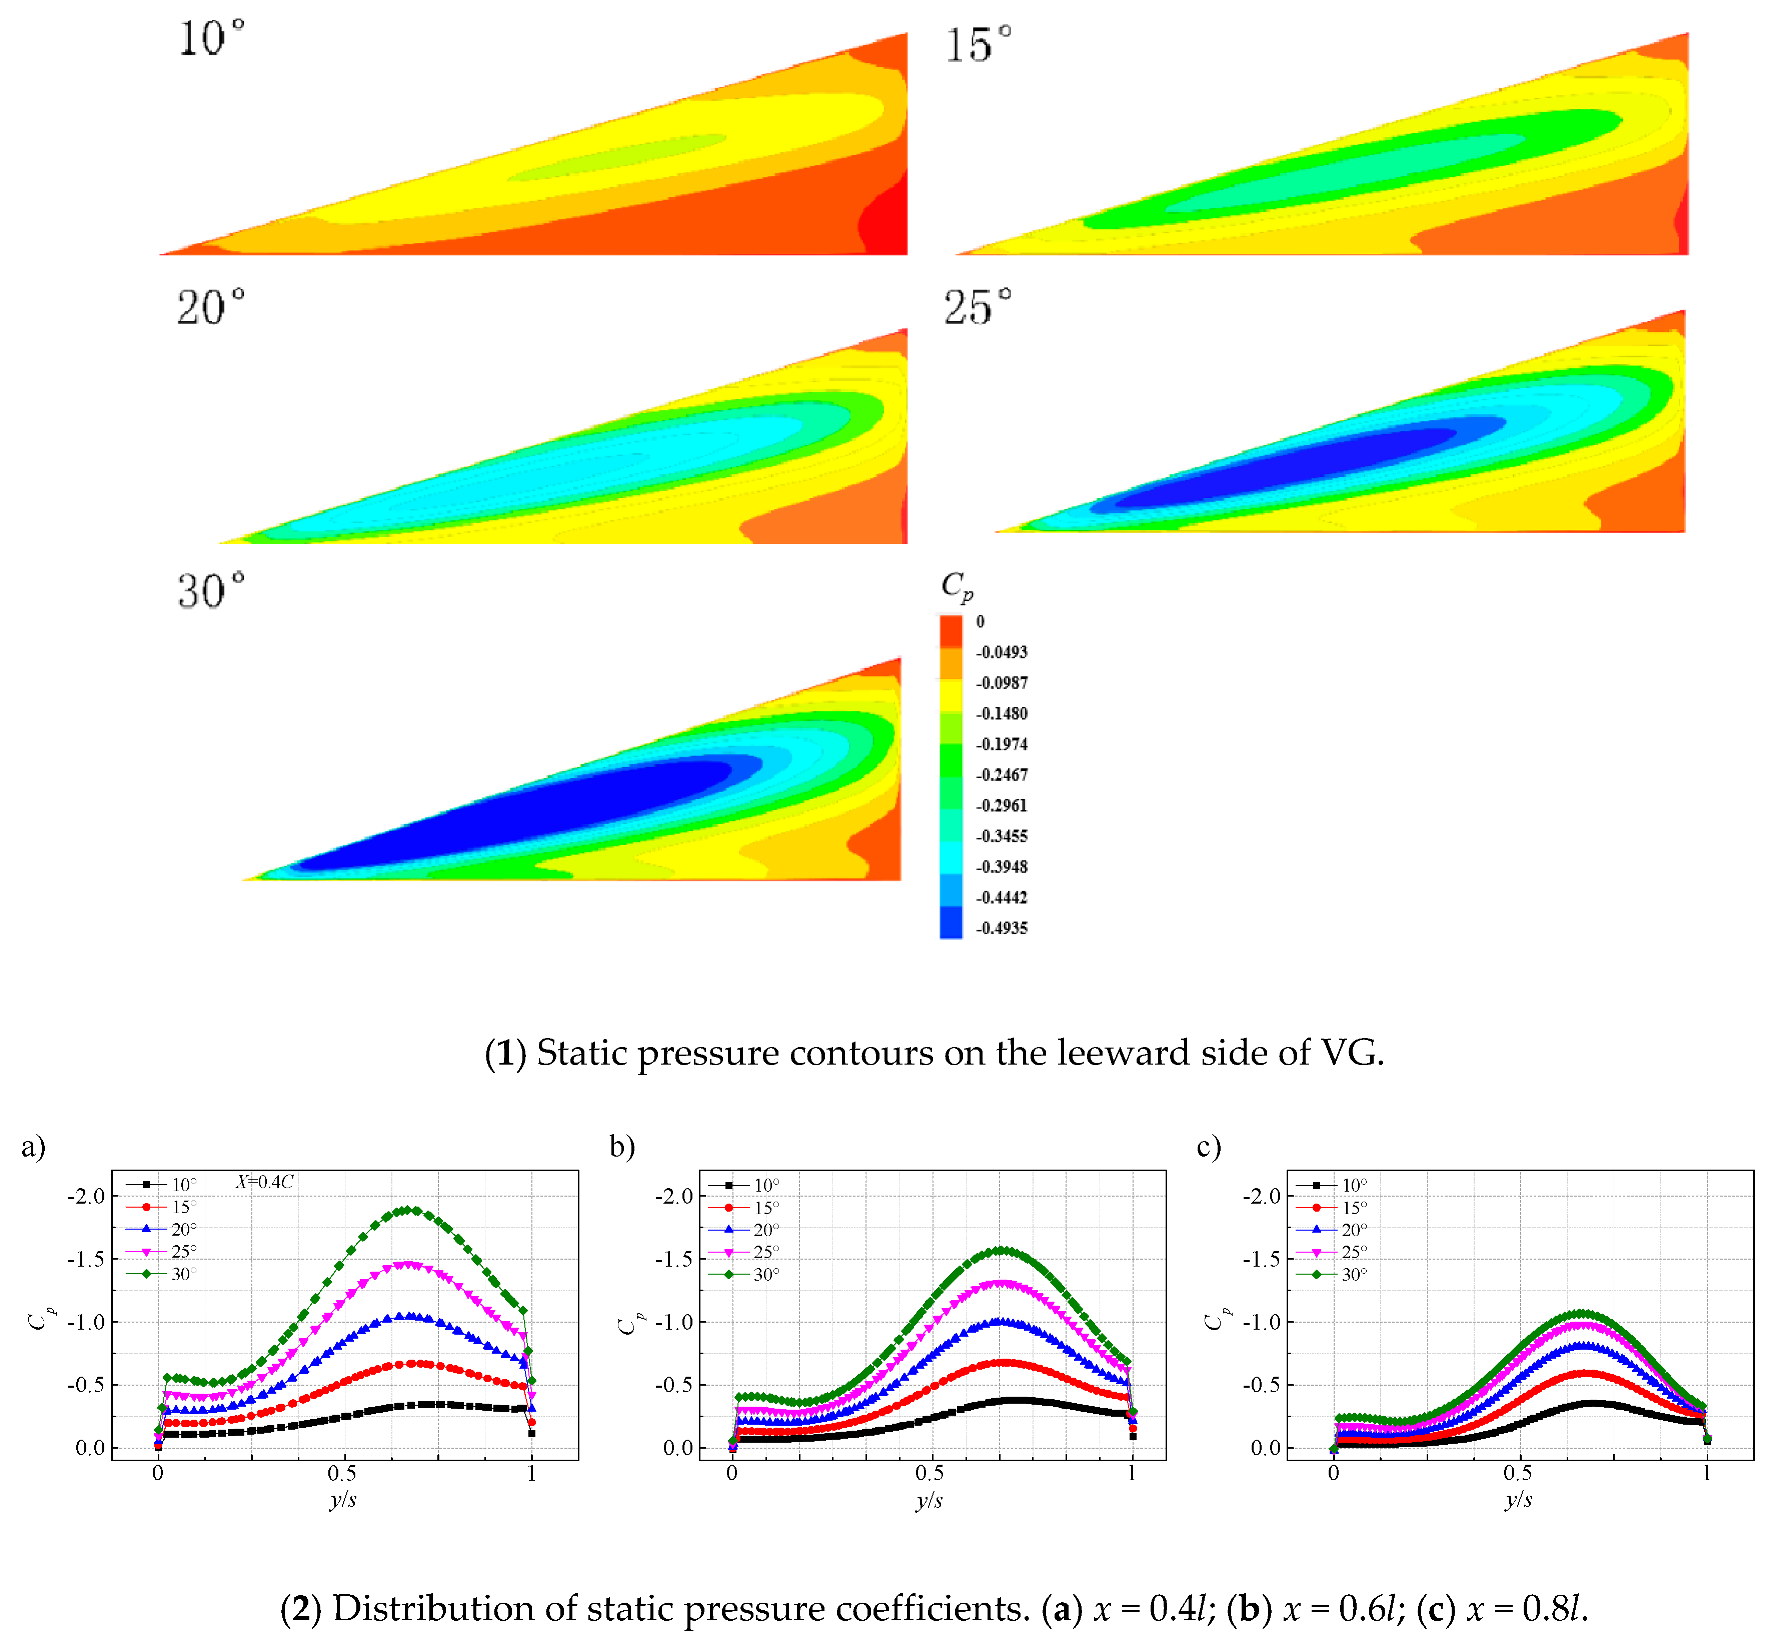
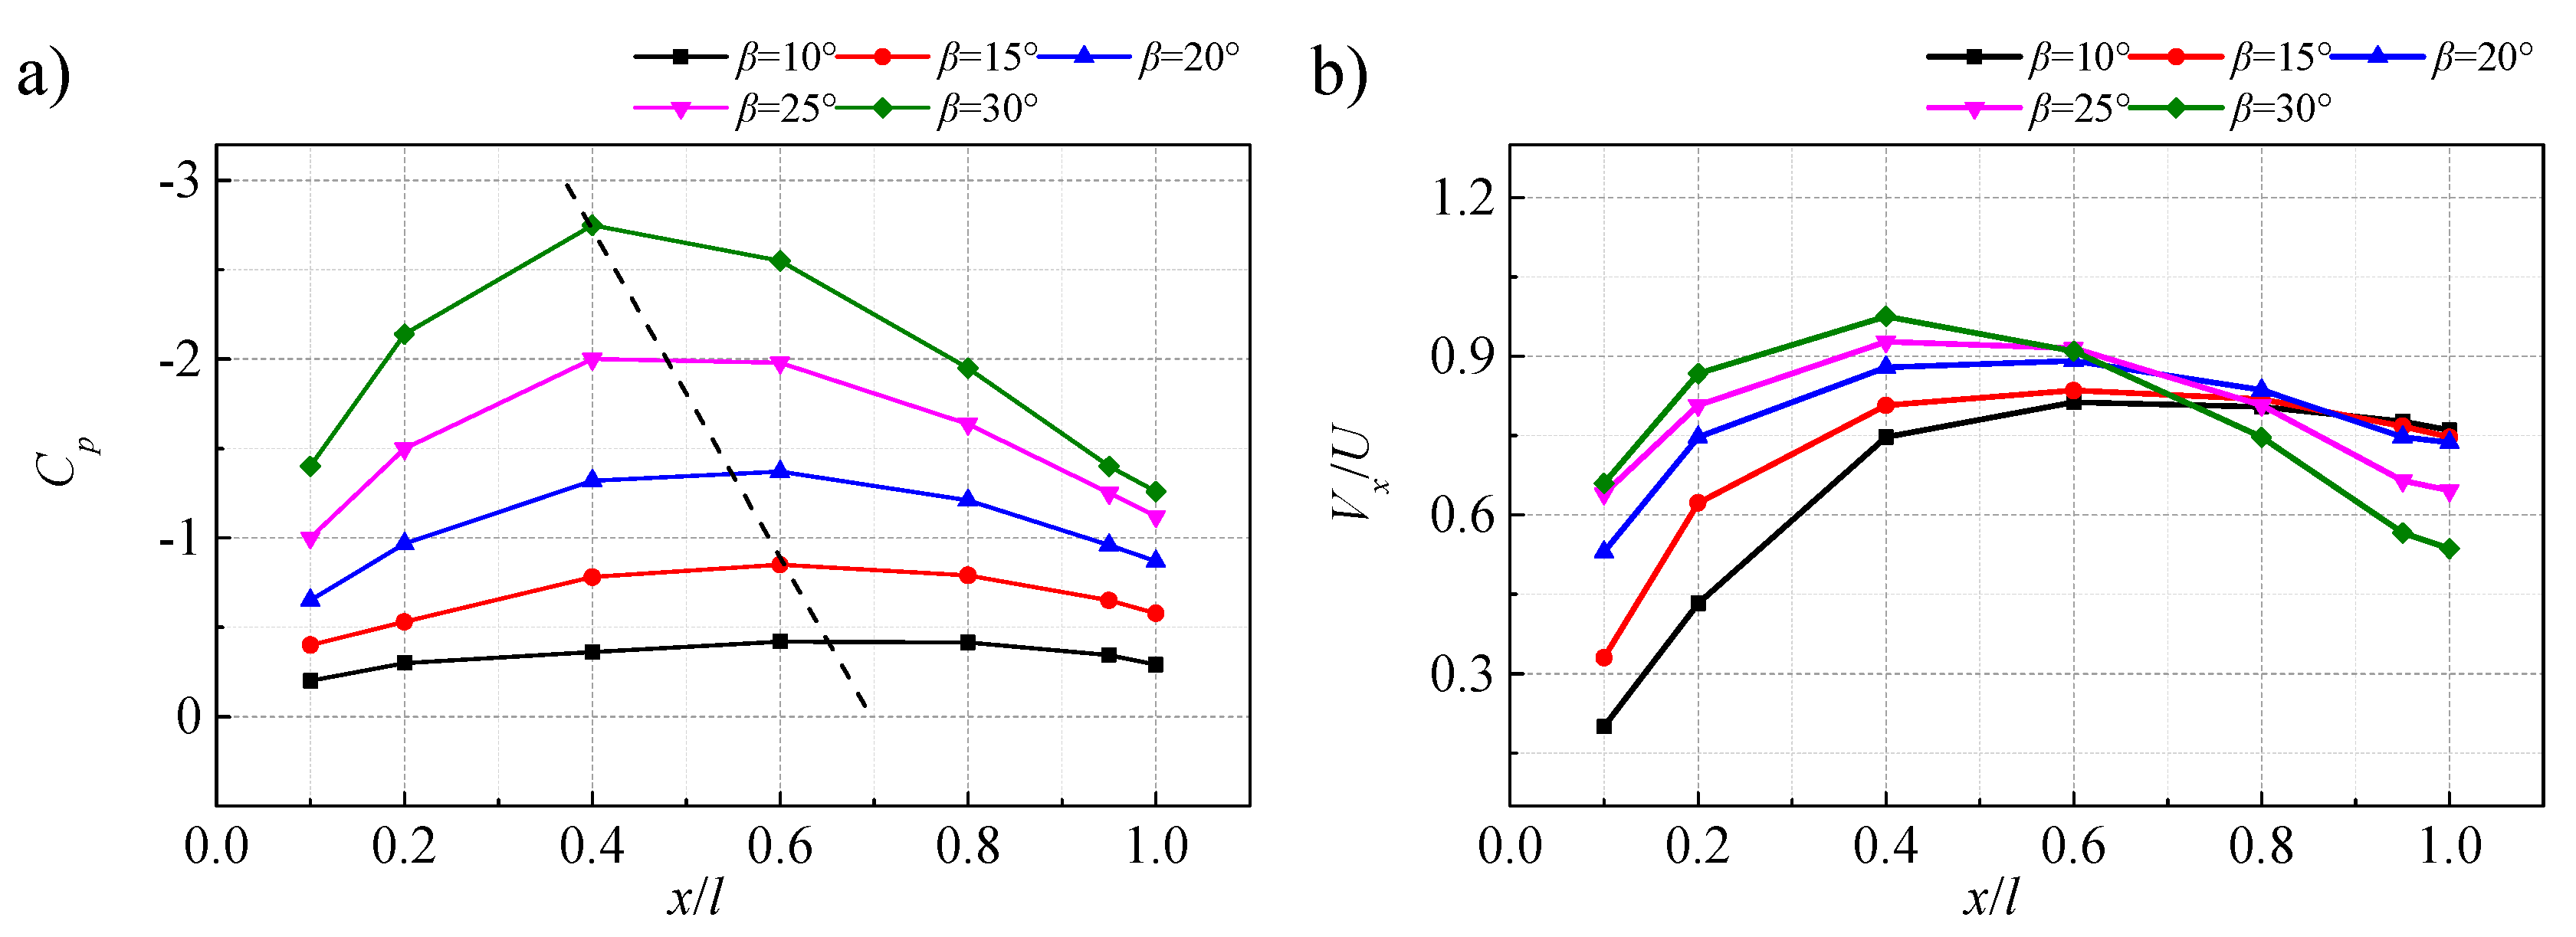
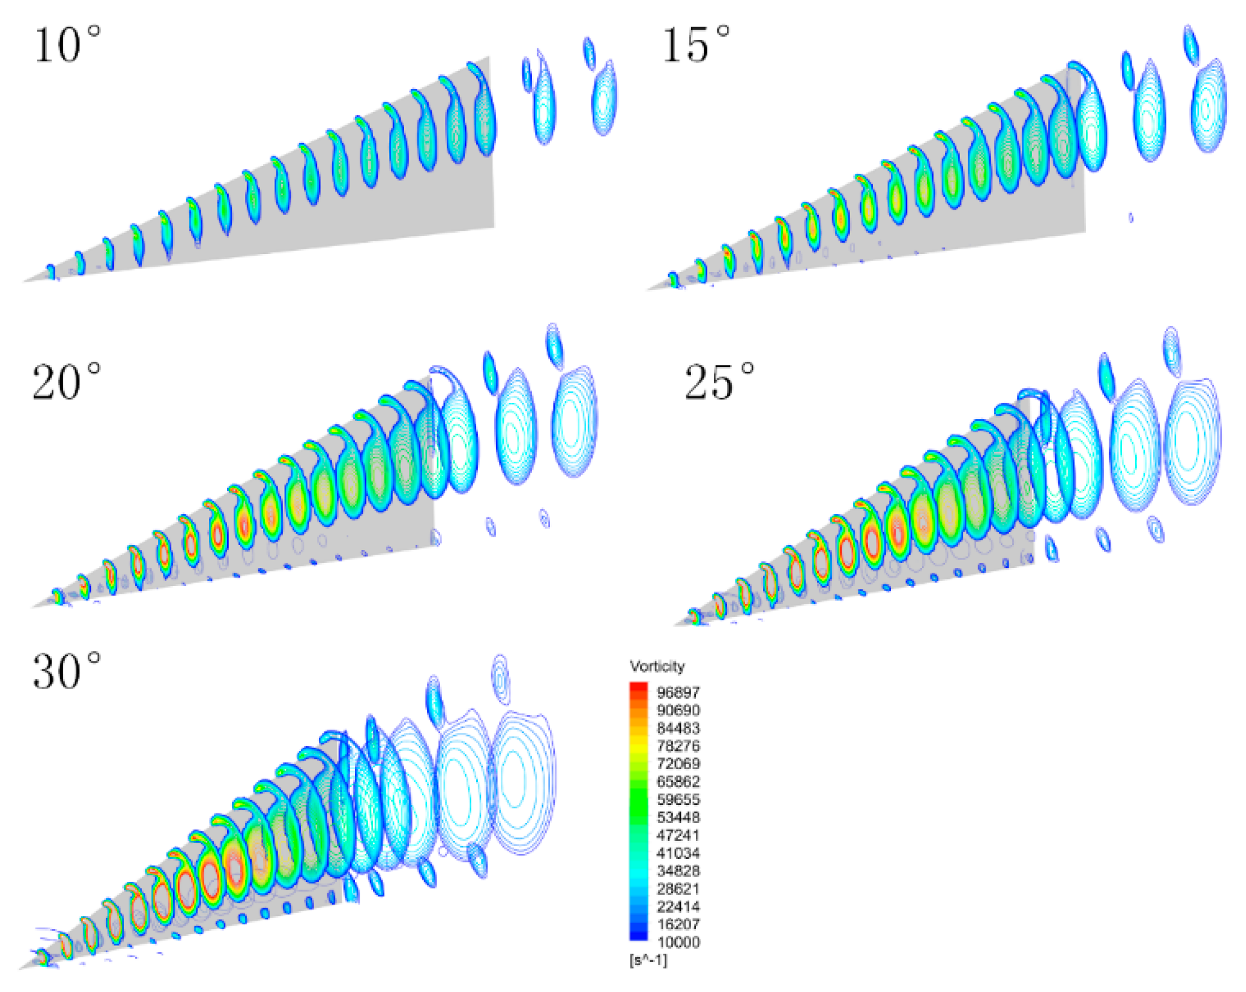
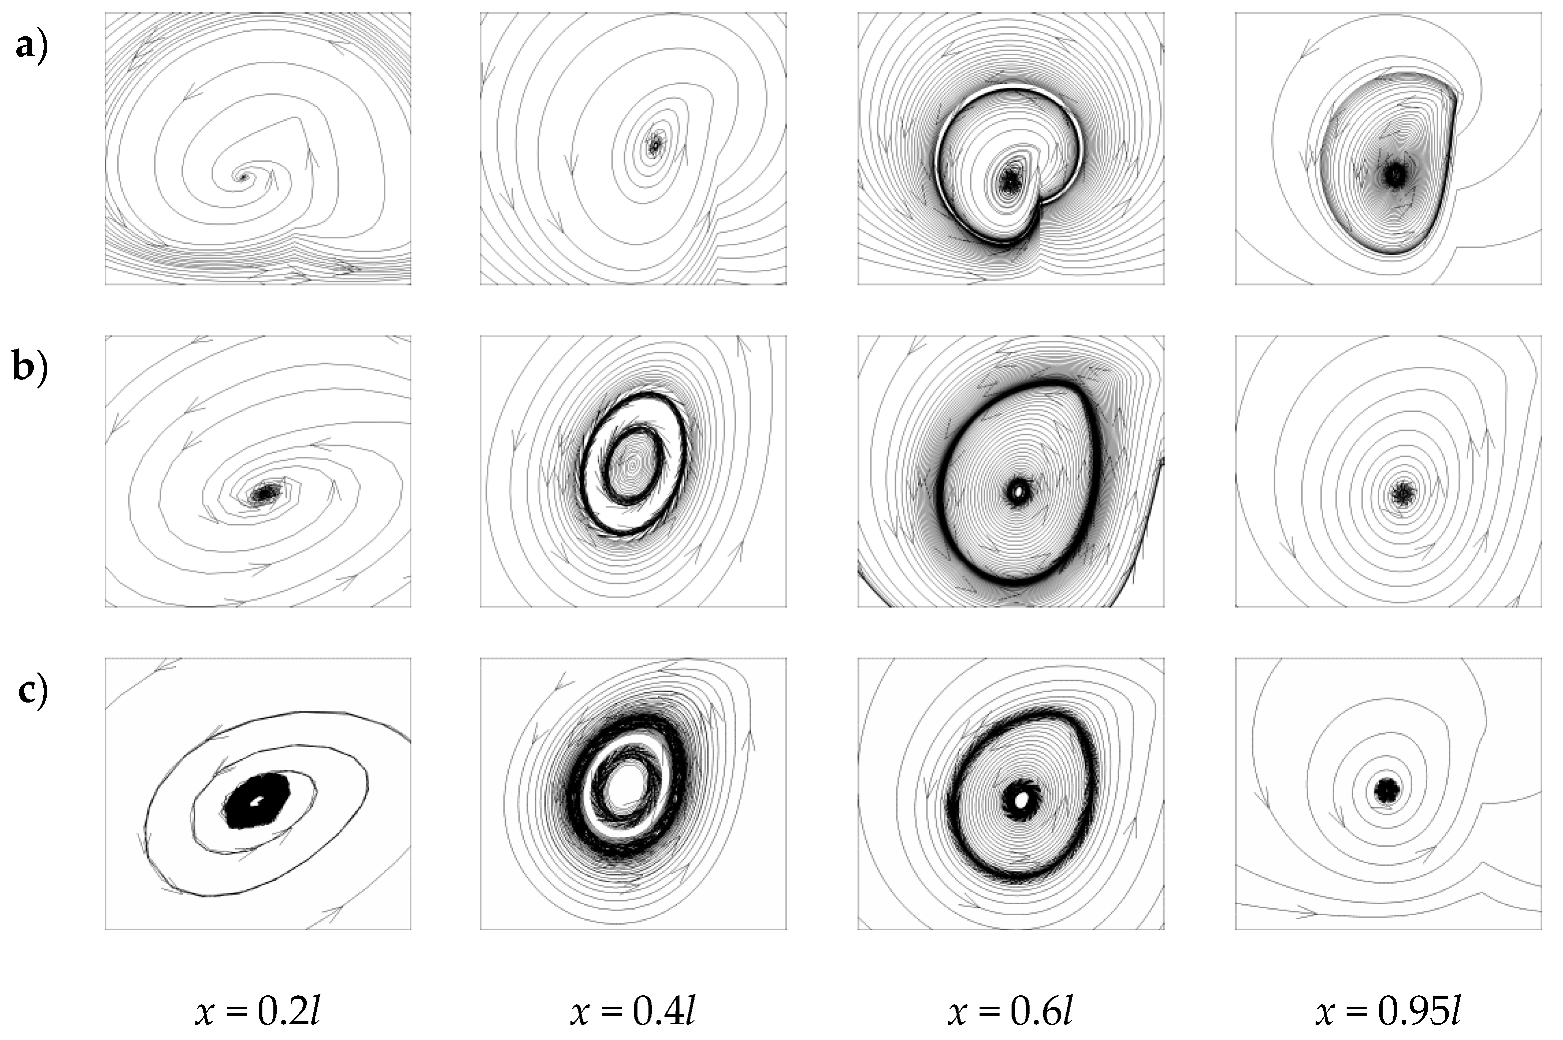
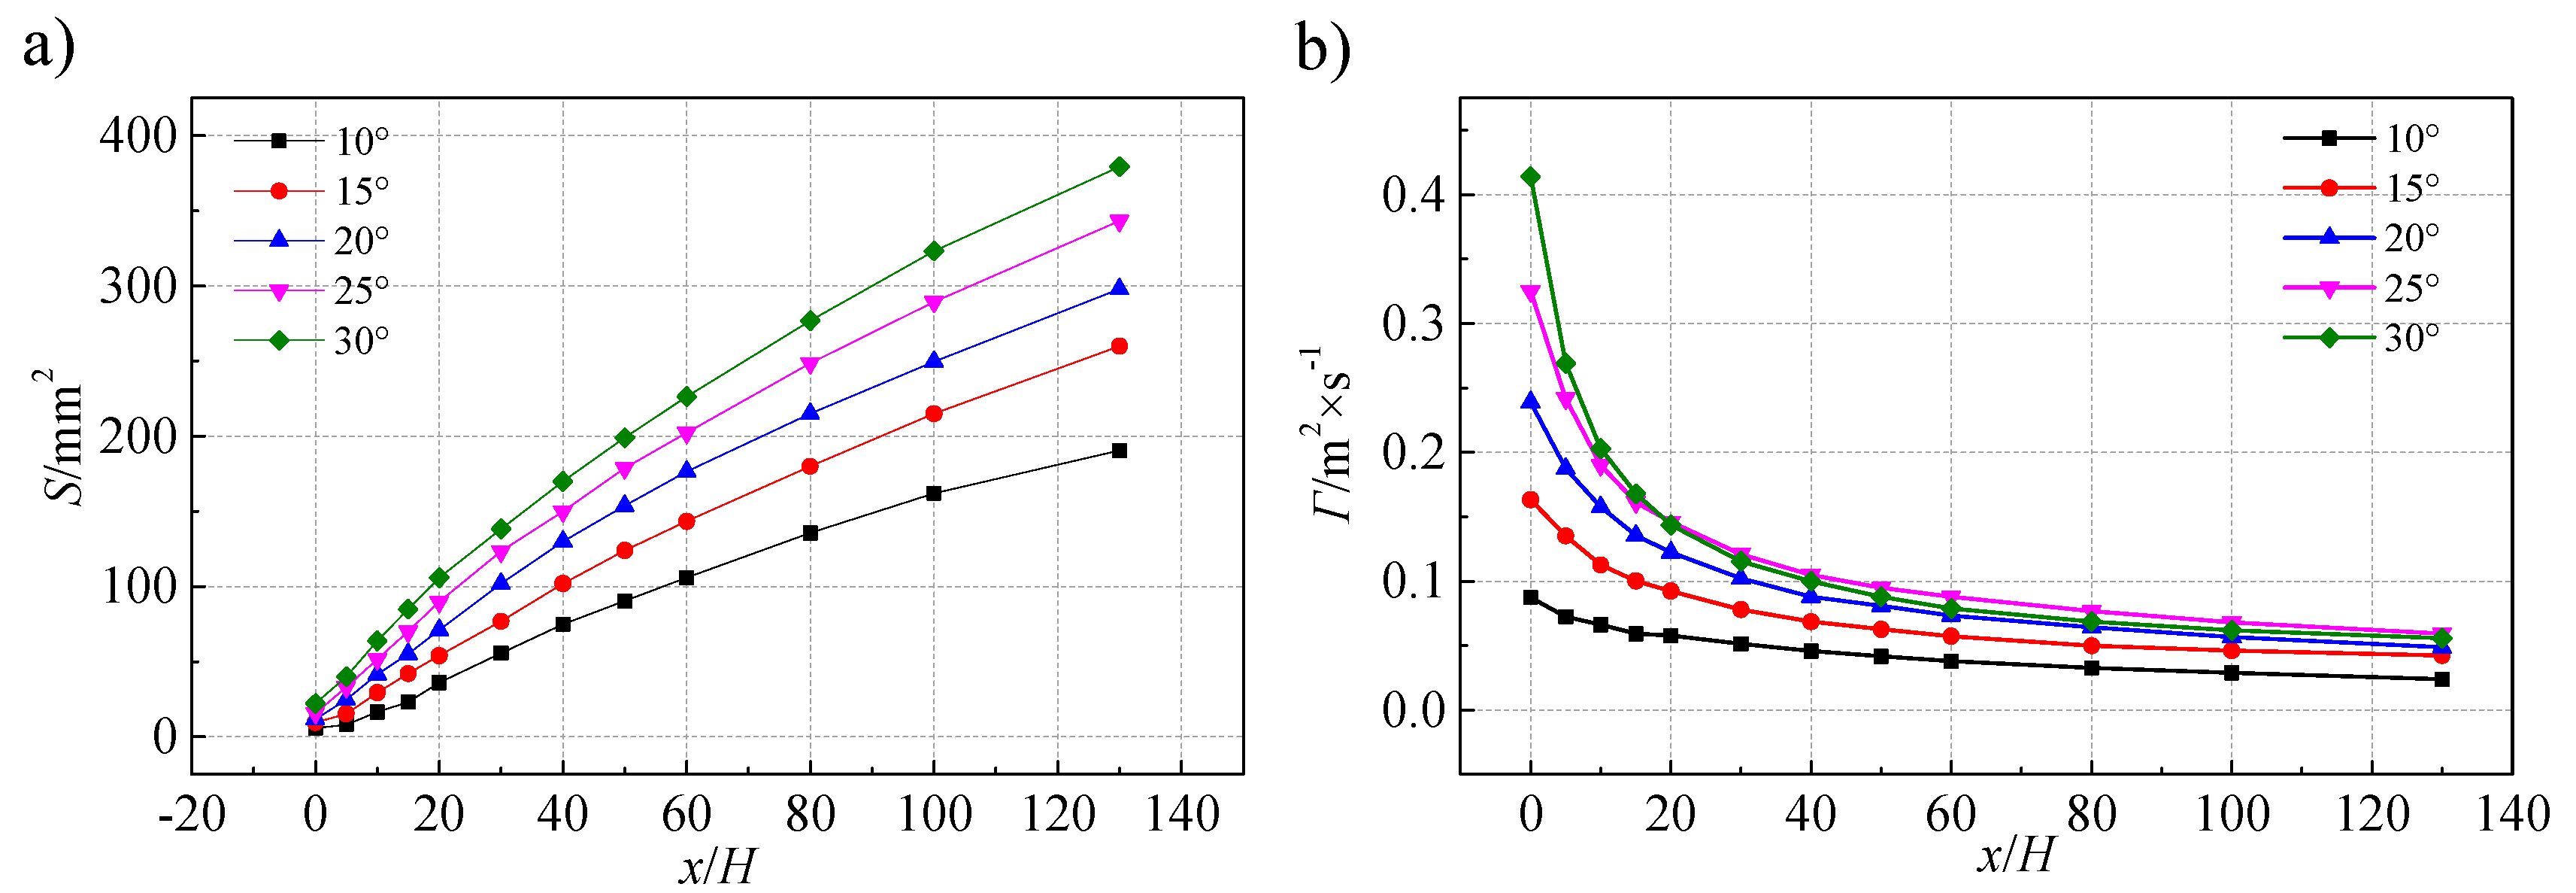
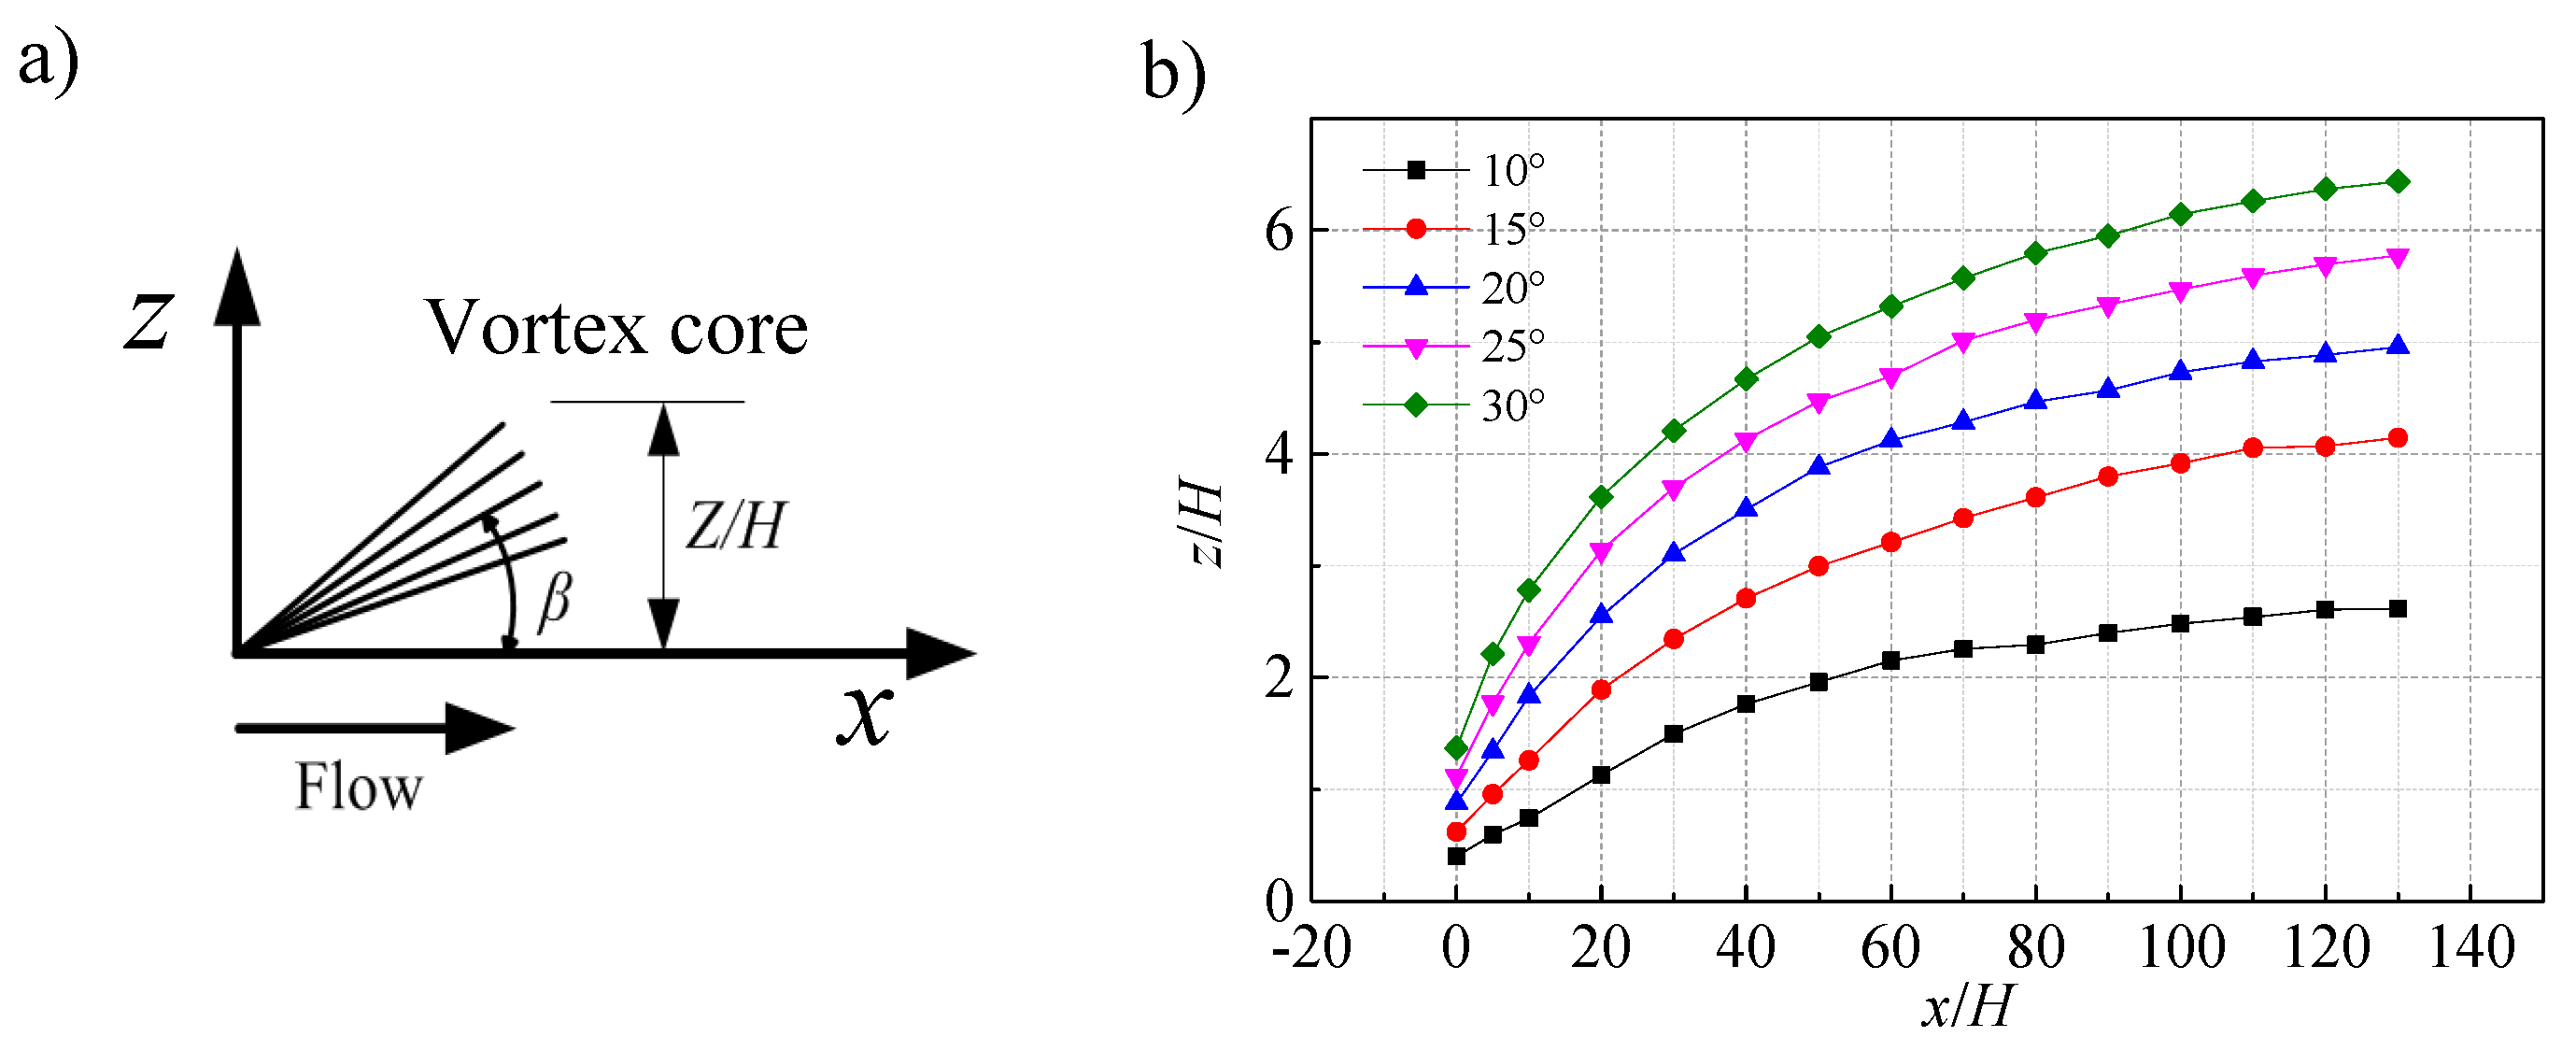
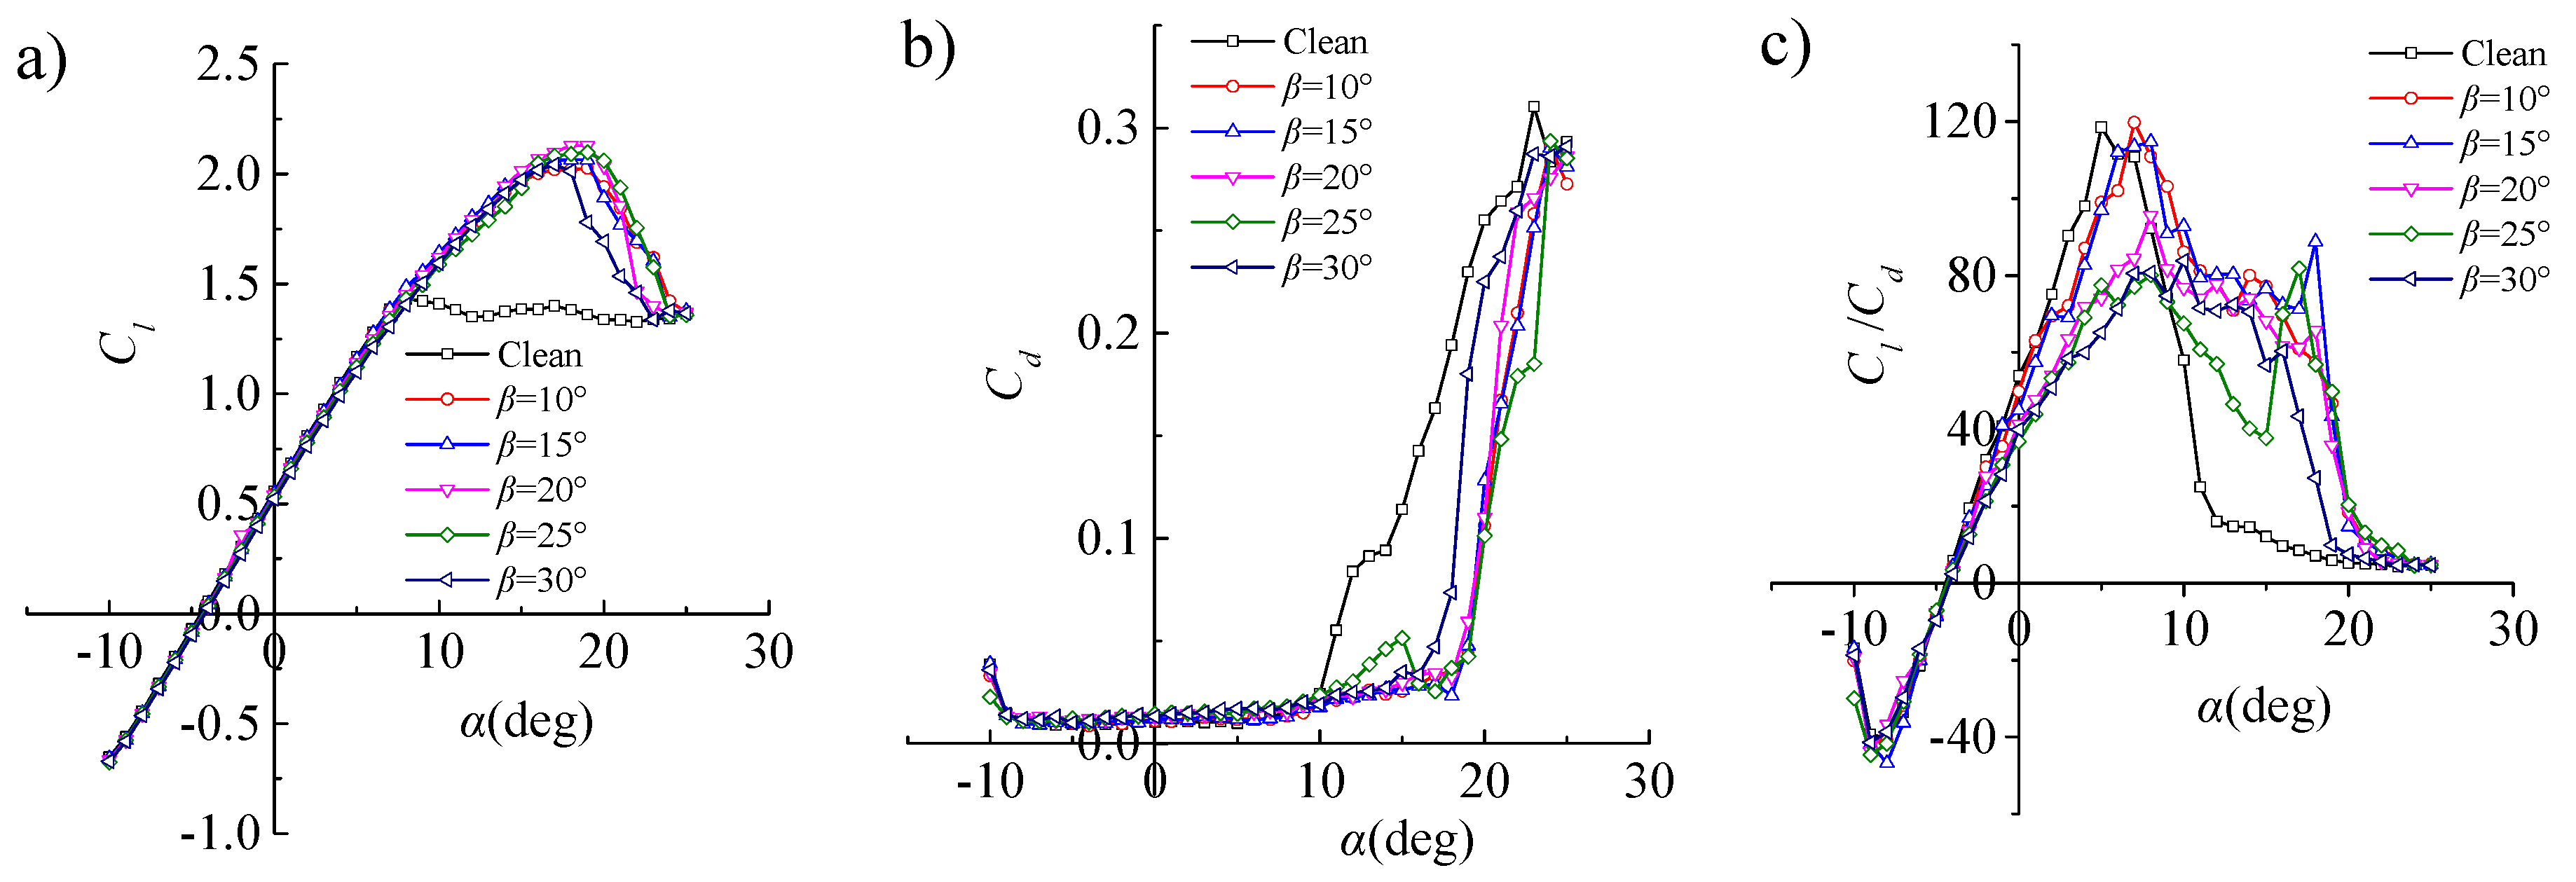
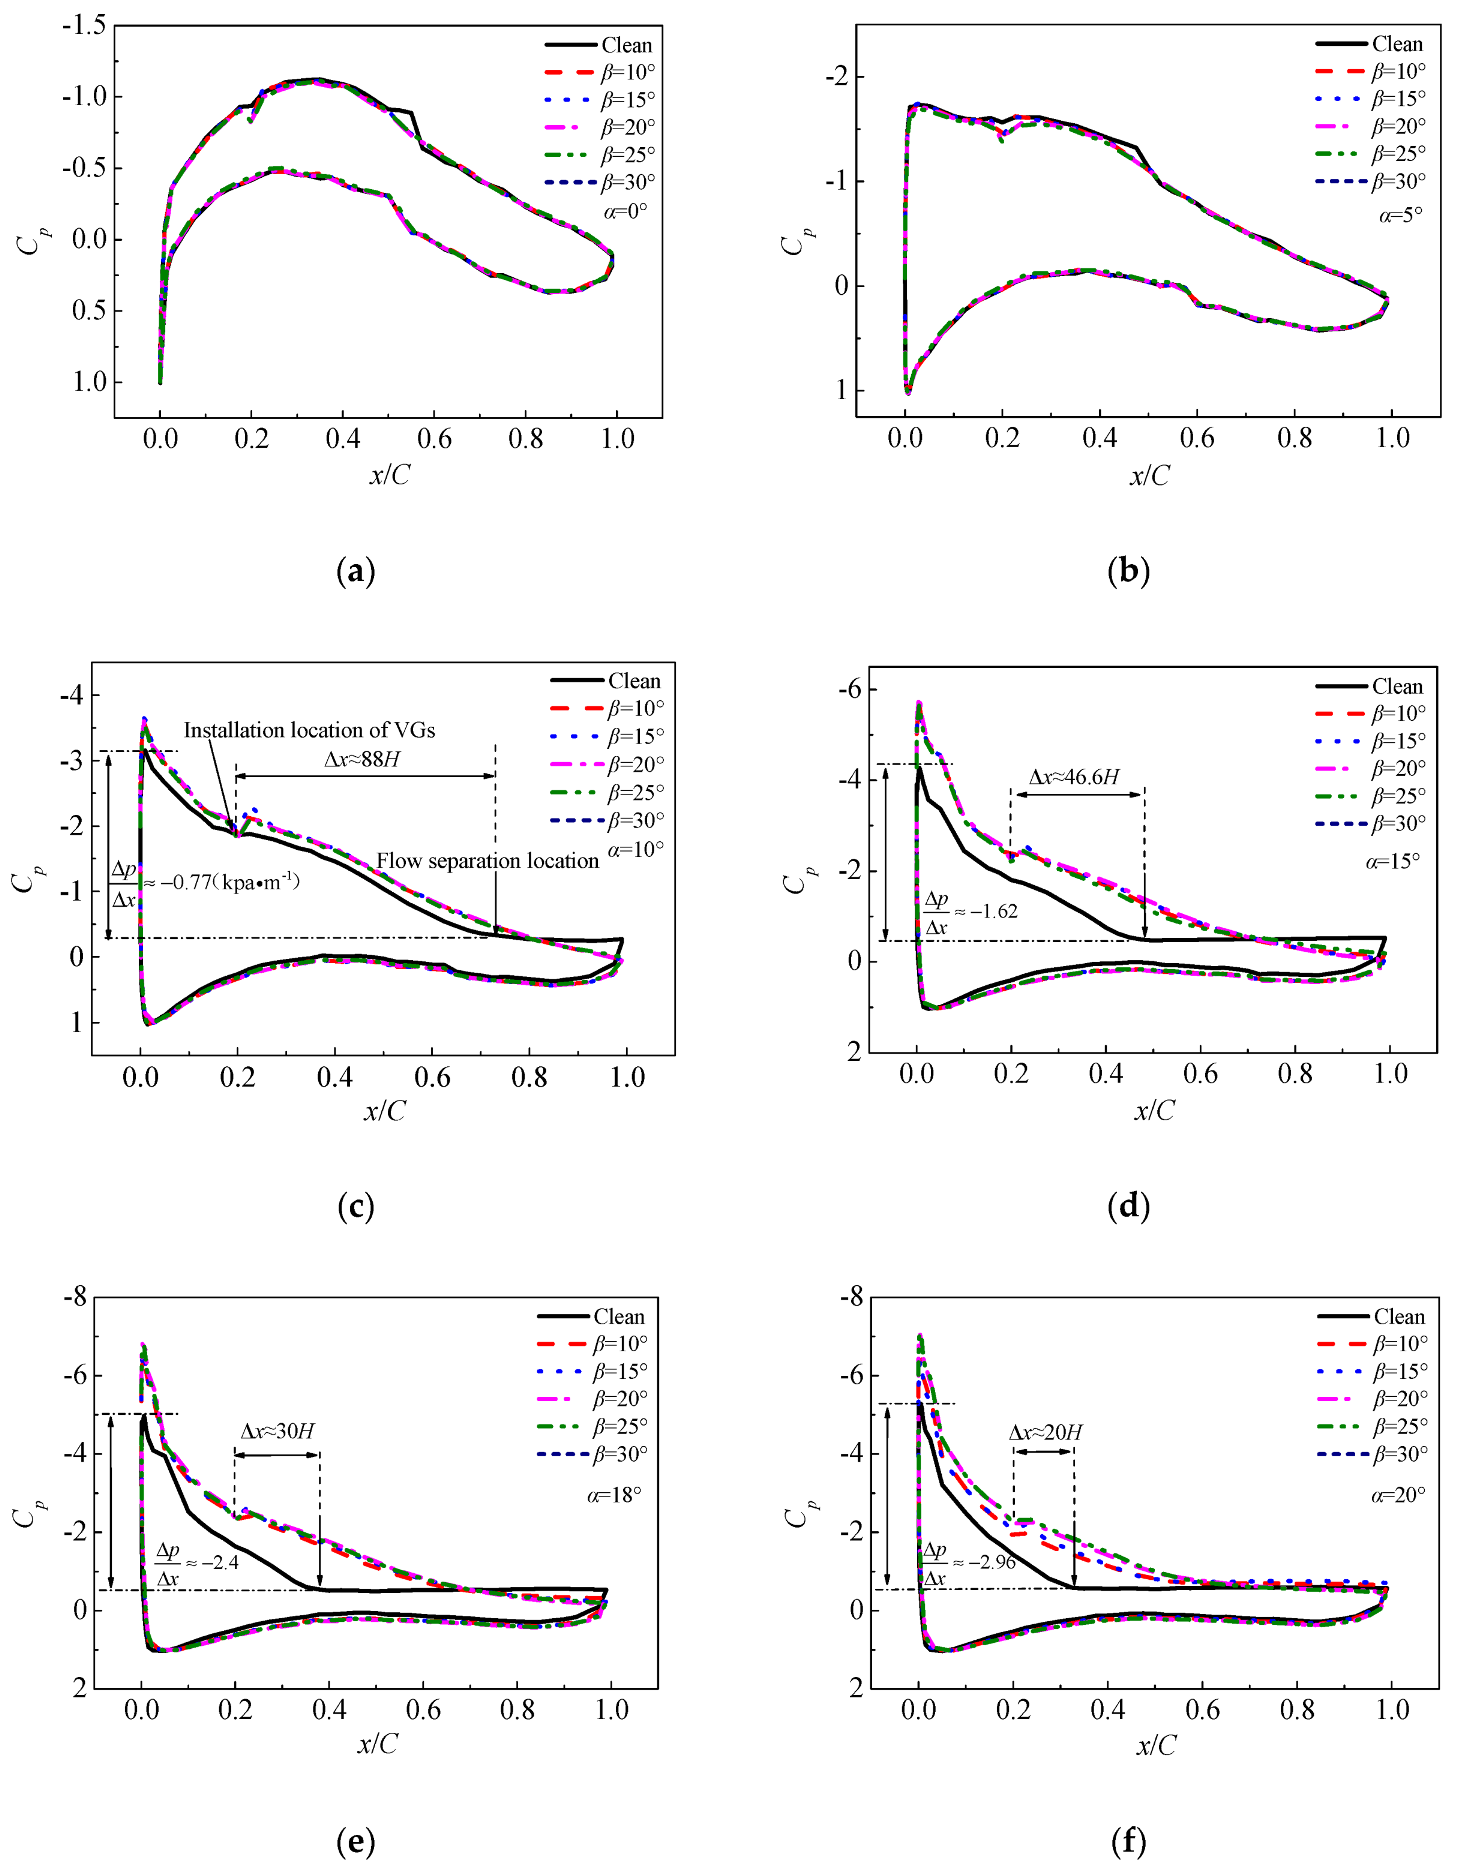
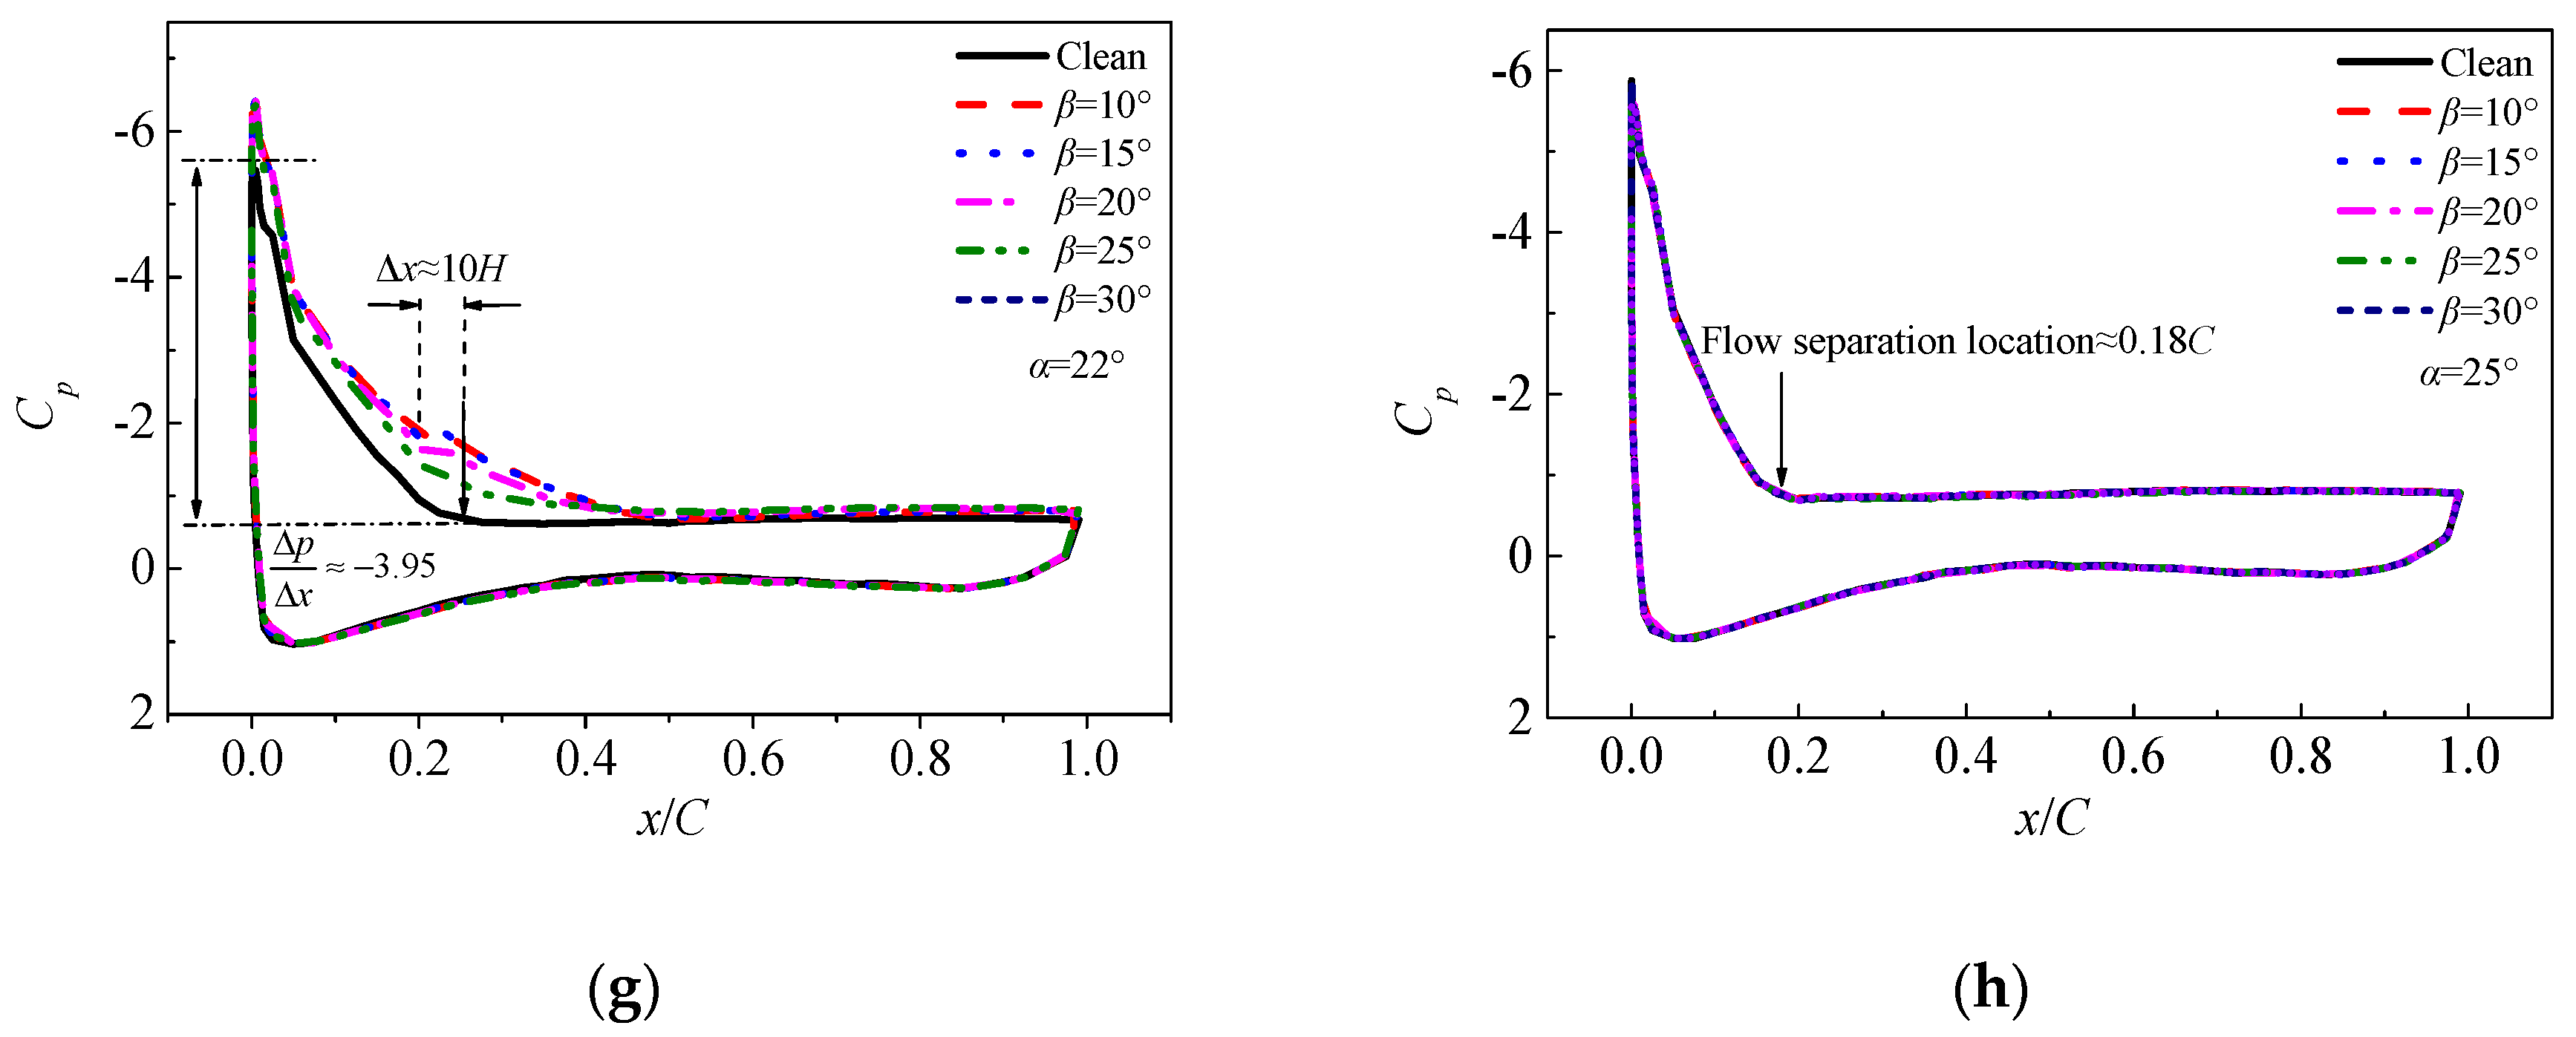
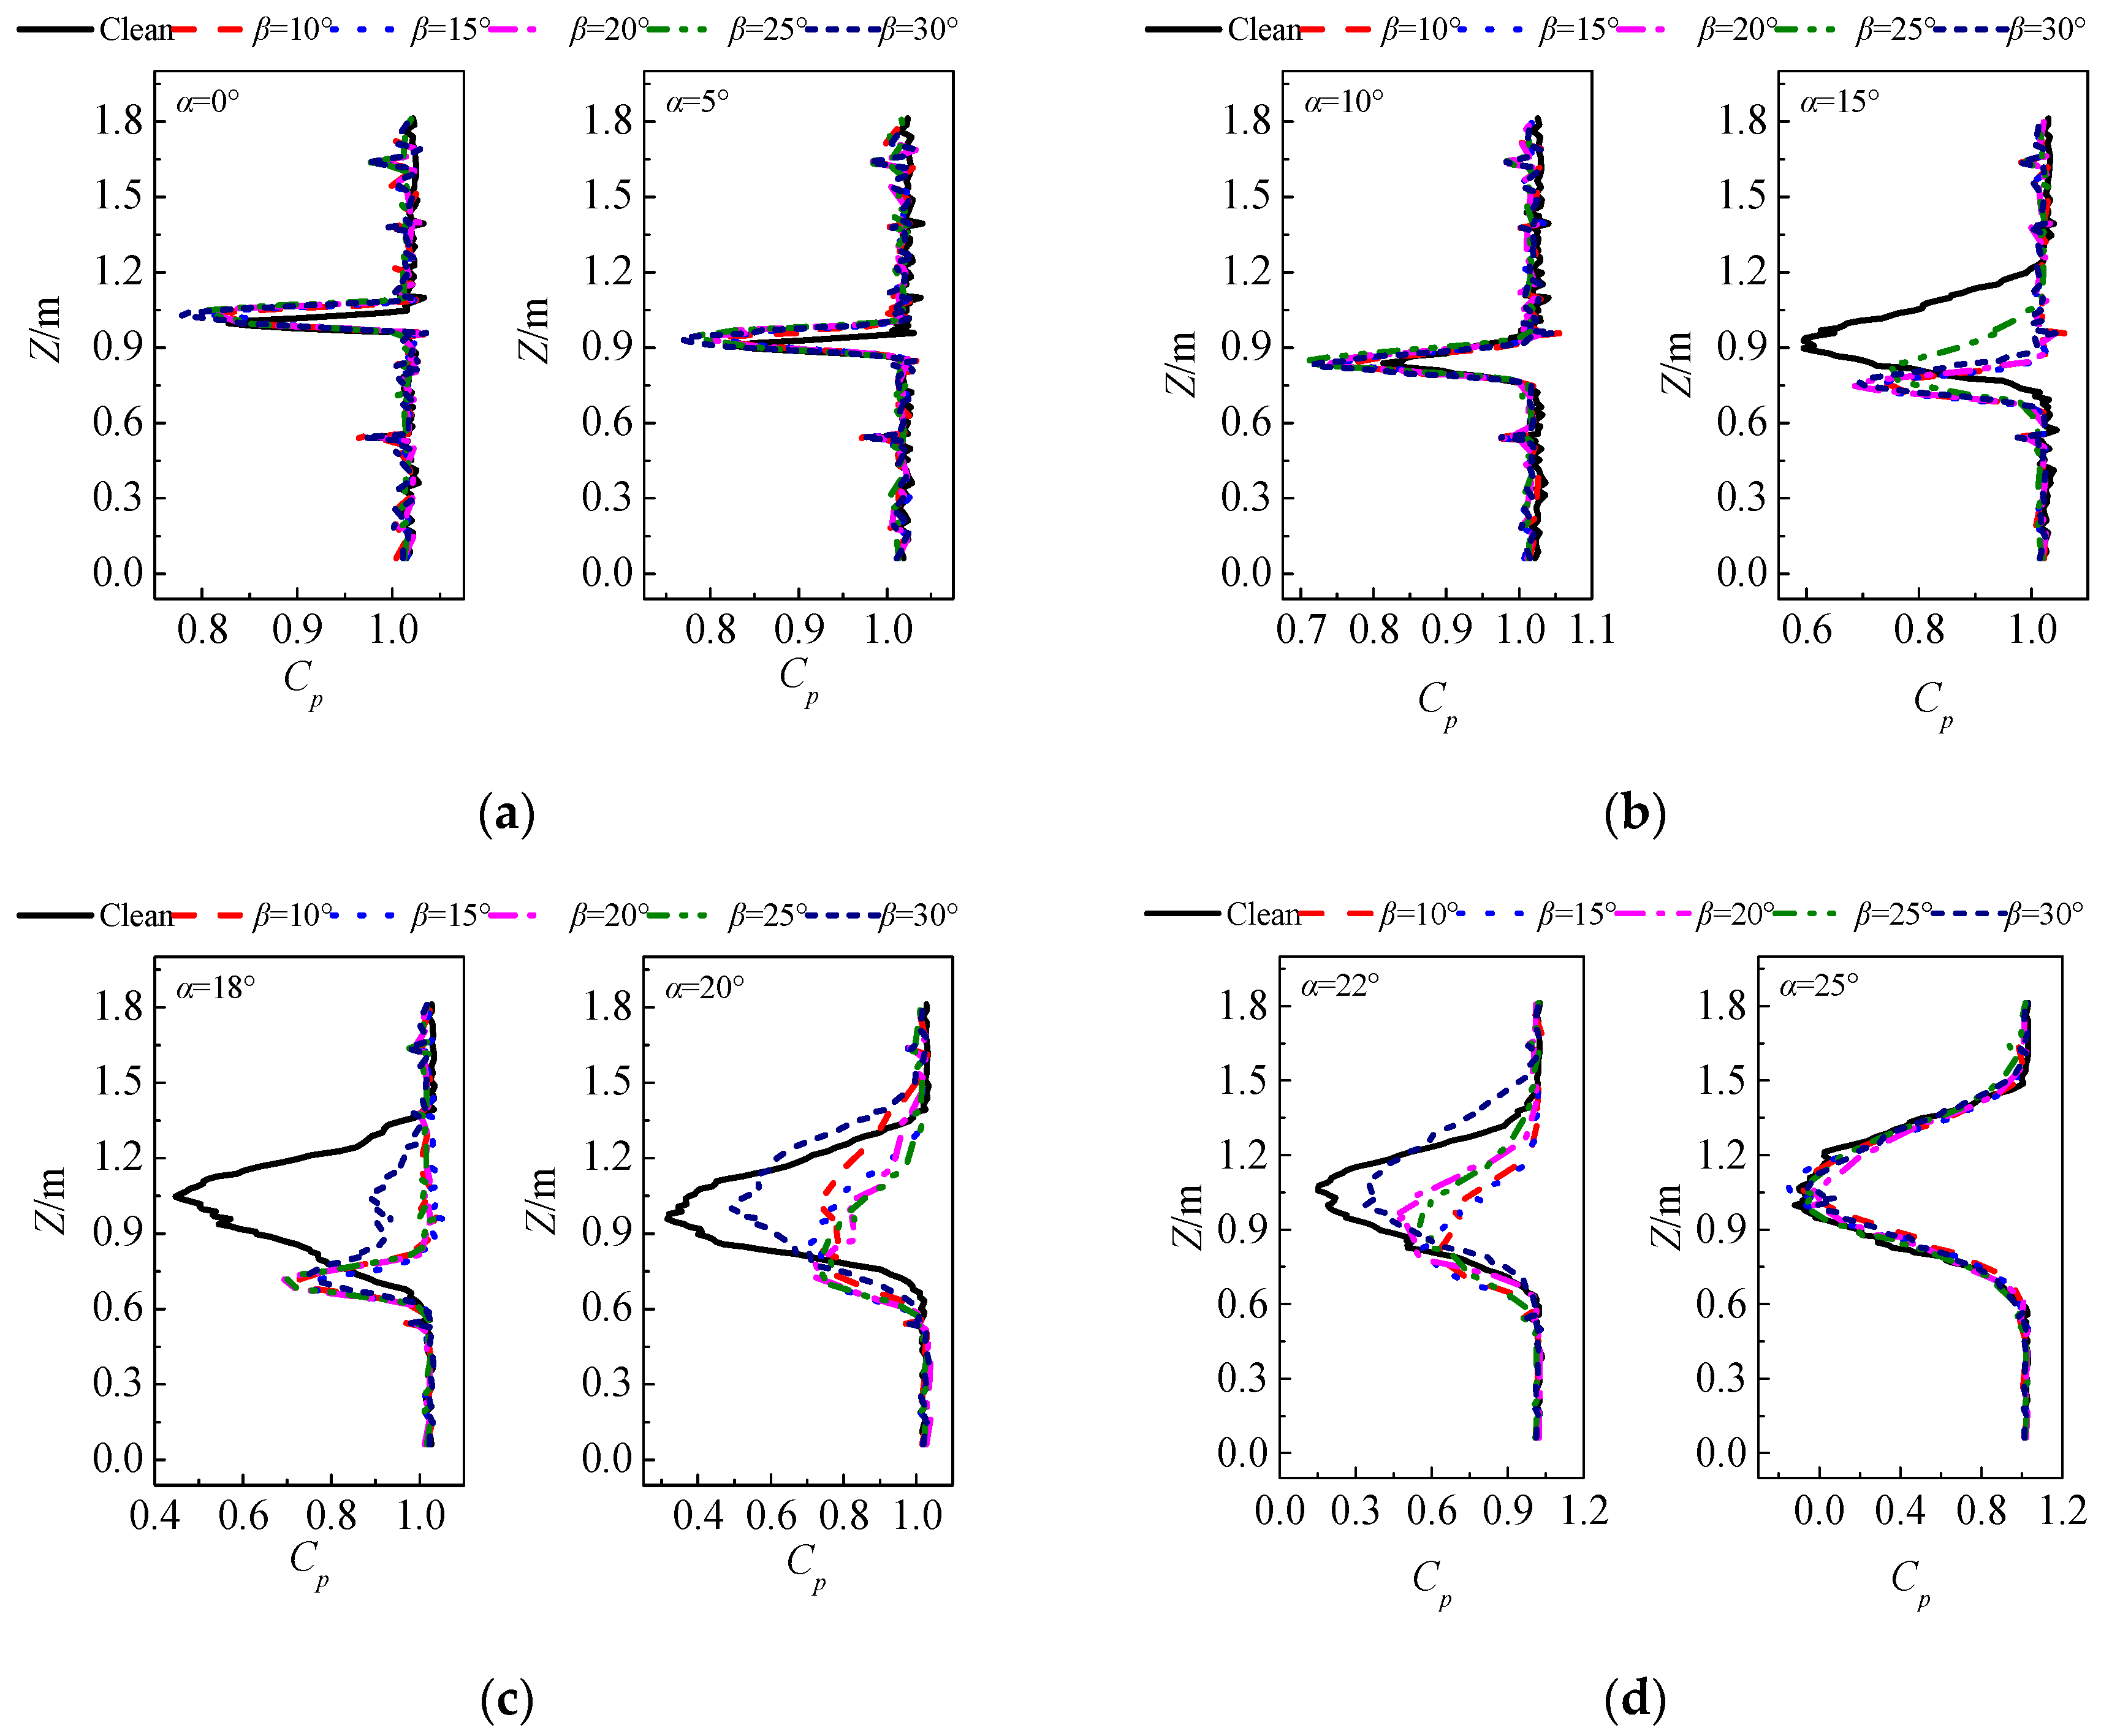
3.1. Analysis of Numerical Results

Figure 7 shows the streamlines and vorticity contours on the leeward side of the VG. It can be seen that the VG placed on the surface of the wall produce a three-dimensional separation of free vortices on the leeward side of the sharp leading edge. The concentrated vortices drive the surrounding fluid to make a regular spiral motion around the vortex axis. The larger the installation angle of the VG, the tighter the streamline winding and the smaller the pitch. By examining the streamlines, it can be seen that the vortex core has not broken on the VG surface.
Figure 8 shows the vorticity contours at three-chord lengths (x = 0.4l, 0.6l, 0.8l) on the leeward side of the VG, the scale in the figure is non-dimensionalized as omega × length/velocity, where the omega is vorticity, length is the radius of vortex core, velocity is the main flow velocity.
First, it can be seen that the vorticity value at the center of the vortex core increases gradually with the increase of the installation angle. Secondly, the area of the vortex core increases with an increased installation angle. When the vortex core does not break down on the VG surface, the strength of the concentrated vortices increases with the increase of installation angle.
Figure 9 shows the static pressure contours on the leeward side of the VG and the distribution of static pressure coefficients at three-chord positions. First, from Figure 9(1), the low-pressure region on the leeward side of VG does not start from the sharp leading edge of VG, but from the downstream position of the leading edge. With an increase of the VG installation angle, the static pressure value on the leeward of VG decreases, and the size of the low-pressure zone is gradually enlarged. From Figure 9(2), and the magnitude of the static pressure coefficient is proportional to the installation angle. By comparing the static pressure coefficients at the three different chord positions, it can be seen that the static pressure coefficients at 0.4l were the largest, and with the increasing downstream distance, the static pressure coefficients decrease. At 0.8l, the difference in static pressure coefficients between different installation angles is small.
Figure 10 shows the variation of static pressure coefficients and axial velocities along the chordal direction at the center of the vortex core. From Figure 10a, when the VG installation angle is increased, the magnitude of the static pressure coefficient at the center of the vortex core also increases. However, the variation of the static pressure in the streamwise direction is different. The peak value of the static pressure coefficient appears at approximately 0.4l when the installation angle is 30°. When the installation angle is increased, the peak value of the static pressure coefficient gradually approaches the trailing edge, as shown by the dotted line in the figure. This is related to the dissipation of the vortices. The center of the vortex core is a low-pressure region. The stronger the intensity of the vortices, the lower the static pressure in the center of the vortices. When the installation angle is increased, the intensity of the vortices becomes stronger, but the greater the adverse pressure gradient on the leeward side of the VG. Under the effect of the reverse pressure gradient, the vortices gradually dissipate. When the reverse pressure gradient reaches a certain limit, the core will break up, and the static pressure coefficient increases rapidly. From Figure 10b, the change of the axial velocity at the center of the vortex core is essentially synchronous with the change of the static pressure coefficient. When the installation angle is 30°, the axial velocity increases gradually with the decrease of the static pressure value, the static pressure value increases, and the axial velocity begins to decrease. Near the leading edge of the VG, the axial velocity increases when the installation angle is increased. Conversely, at the trailing edge, the axial velocity is the smallest when the installation angle is 30°, followed by β = 25°. The other three installation angles result in the same axial velocity.
Figure 11 shows the vorticity contours along the leeward side of VG for each installation angle. First, from the vortex core area, when the installation angle is small, the area of the vortex core is also small. From the vorticity value at the center of the vortex core, the smaller the installation angle, the lower the maximum vorticity value. The vorticity intensity is the integral of the vorticity on the area of the vortex core. Therefore, it can be indirectly inferred that the smaller the installation angle, the lower the intensity of the concentrated vorticity.
Figure 12 shows the streamlines on various sections at installation angles of 10°, 20°, and 30°. It can be seen that the axial velocity changes significantly along the direction of the vortex axis. As well, the topology of the streamline changes greatly. According to the stability theory of differential equations, the stability of nodes depends on their divergence. Assuming that the flow is a steady incompressible flow, the variation of the divergence and the axial velocity of the vortices can be obtained from the continuity equation:
D = V y y + V z z = V x x
When the divergence D > 0, it is an unstable node, and the streamline is directed outward. When D = 0, it is a central node, and the streamline forms a closed loop. When D < 0, it is a stable node, and the streamline is directed inward.
The cross-sectional streamline topology at an installation angle of 10° is observed here. The four sections shown correspond to the regions where the axial velocity increases and decreases. In the x = 0.2l and 0.4l cross-sections, the axial velocity increases, and therefore, the streamline direction is inward. According to Equation (4), when the axial velocity increases, D < 0 is a stable node. Conversely, x = 0.6l corresponds to a decrease of axial velocity. Here, there exists a “limit cycle” in the streamline map and the streamlines outside the limit cycle point outward and inward. The x = 0.95l cross-section corresponds to a decrease in axial velocity. Here, the divergence D > 0 corresponds to an unstable node. The situation is slightly different for installation angles of 20 and 30° compared to 10°. In the region where the axial velocity increases, the streamline is in the direction of a stable node. In the region where the axial velocity decreases in the range of x = 0.4l and 0.6l, there is also a “limit cycle” in the streamline map. The flow outside the limit cycle points inward and outward. At x = 0.95l, the cross-sectional streamlines all point outward, and the nodes are unstable.
The vorticity characteristics of the separation vortices on the VG surface were studied above. This is important for suppressing flow separation and the motion of vortices downstream of the VG. Figure 13 shows the variation of the radius of the vortex core with streamwise distance at different cross-sectional locations downstream of the VG. Additionally, the variation of vorticity circulation downstream of the VG with flow direction and distance is shown. The radius of the vortex core increases with streamwise distance. As well, the radius of the vortex core changes linearly with the installation angle. That is, the larger the installation angle, the larger the radius of the vortex core. At the initial position downstream of the VG, the radius of the vortex core is very similar for different installation angles. However, with an increase of the flow distance, larger installation angles correspond to a larger slope of the variation of the radius of the vortex core with the flow distance. This result indicates that the larger the installation angle, the faster the increase of the radius of the vortex core. The variation of the radius of the vortex core affects the energy distribution of the vortex in the radial direction, which needs to be analyzed in conjunction with the radial trajectory of the vortex core.
At the initial position downstream of the VG, the intensity of the vortices increases with an increased installation angle. At x/H = 0, the intensity of the vortices is 1.27, 1.73, 2.53, and 4.73 times for the installation angles of β = 25°, 20°, 15°, and 10°, respectively. At x/H = 20, the intensity of the vortices with an installation angle of β = 30° is 0.98 times that of β = 25°. At x/H = 60, the intensity of the vortices with installation angle β = 30° is 0.97 times that of the β = 20°. When the vortices move to x/H=80, the intensity of the vortices at the installation angle β = 25° is 0.94 times that of the β = 20°. Further downstream, the intensity of the vortices at an installation angle of β = 20° is the highest. When the flow direction distance x/H is less than 20, the intensity of the vortices at β = 30° is the greatest. Between x/H = 20 and 80, the intensity of the vortices at β = 25° is the greatest. When x/H > 80, the intensity of the vortices at β = 20° is the greatest. Therefore, when VG are used to suppress flow separation, if the separation point is located at x/H < 20 from the VG trailing edge, an installation angle of β = 30° is the most appropriate. If the separation point is located between the x/H = 20~80, the installation angle of the VG is β = 25° more appropriate. If the separation point is located at x/H > 80, it is more suitable to choose an installation angle of β = 20°.
Figure 14 shows the radial trajectory of the vortex core center downstream of the VG. When the incoming flow flows across the VG, the vortices are deflected in the radial direction towards the angle between the VG and the incoming flow. When VG are used for flow control, they are arranged regularly. The vortices generated by two VG interact with each other. Therefore, it is necessary to study the radial trajectory of vortices without any interference.
From Figure 14b, the larger the installation angle, the larger the deviation distance of the vortex in the radial direction. However, further downstream, the slope of the deviation of the vortex decreases. For flow control, if it is assumed that the selected installation angle of the VG is 20° and the separation point is located at x/H = 20 downstream of the VG, the theoretical distance between the two VG should be the radial position of the vortex core center plus the radius of the vortex core in this case.

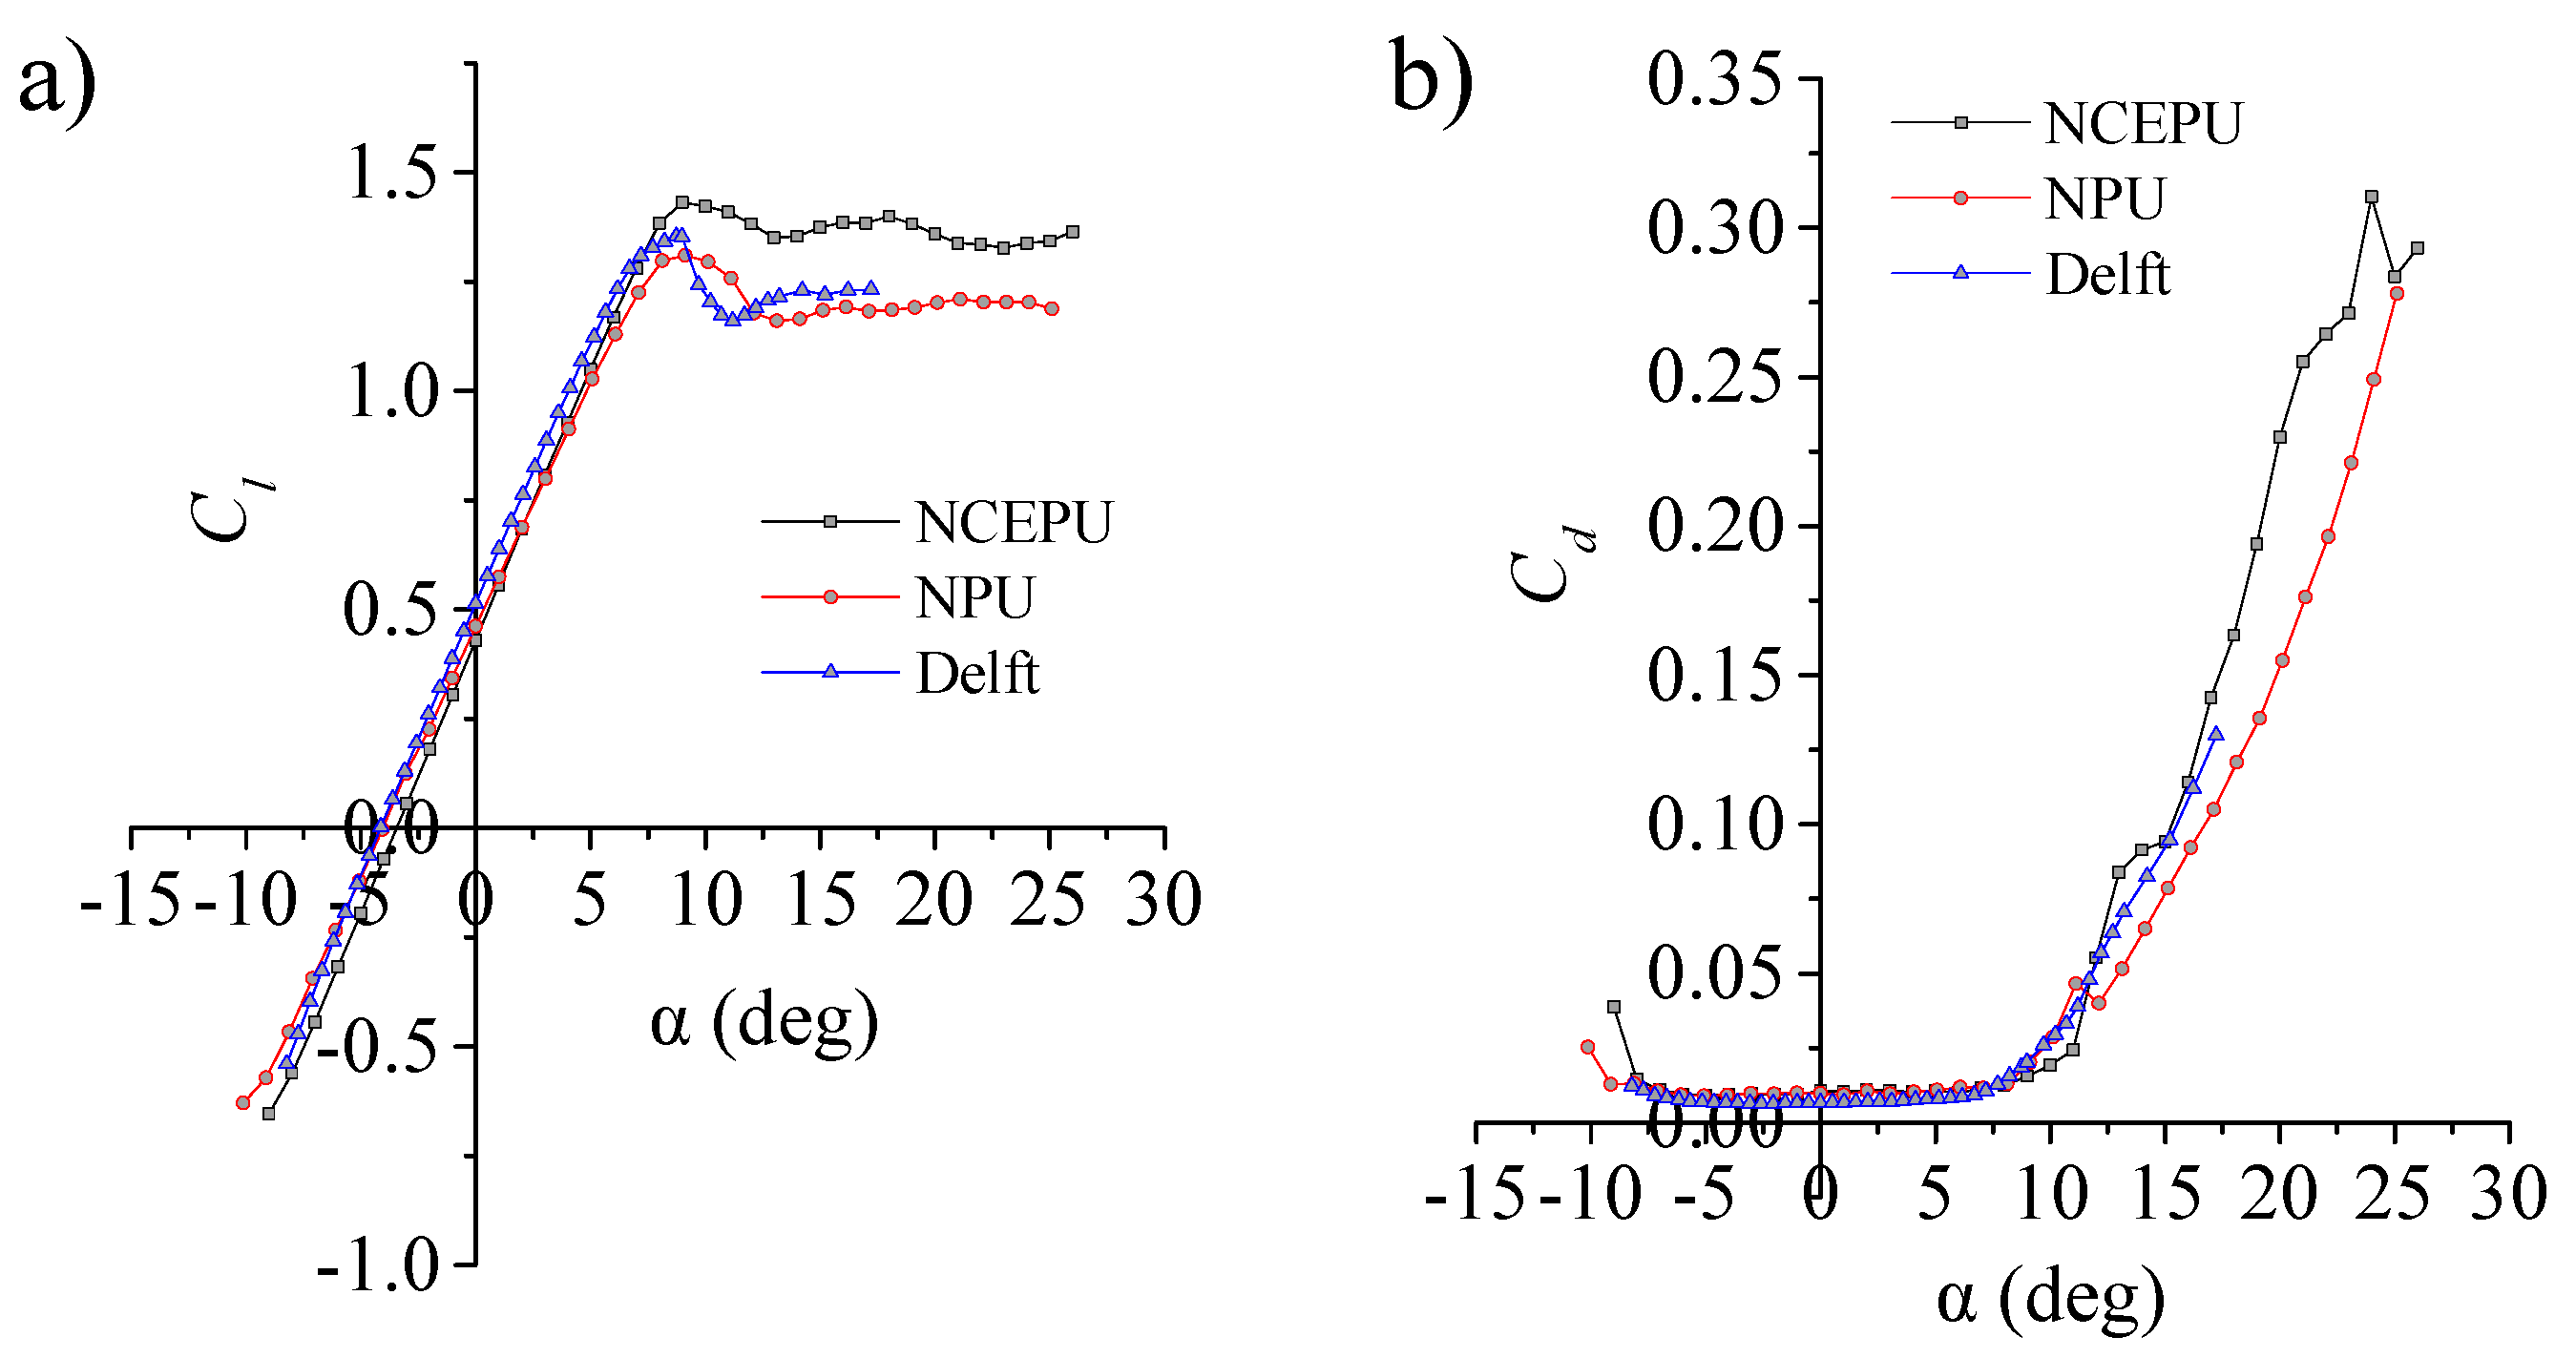
3.2. Analysis of Experimental Results.

Figure 15 shows the lift and drag coefficients and the lift-drag ratio of the airfoil with and without VG. From Figure 15a, the lift coefficient does not change significantly when the AoA is less than the stall angle. Beyond the stall angle, the lift coefficient of the airfoil without VG stops increasing while that of the airfoil with VG continues to increase. With VG, the lift coefficient begins to decrease after an 18° AoA. Before the maximum lift AoA, the difference between different VG installation angles is not significant. The lift coefficient was slightly lower when the installation angle is β = 25°. After the stall AoA (α = 18°), the lift coefficient was the lowest when the installation angle is β = 30°. Here, the lift coefficient of β = 25° was slightly higher. The maximum lift coefficient of the airfoil was obtained for an installation angle of β = 20°. The stall AoA of the airfoil without VG is 8°, and the maximum lift coefficient is 1.43. The measured stall AoA of the airfoil with VG was 18°, delaying stall by 10°. When the installation angle of the VG was β = 20°, the maximum lift coefficient was 2.12, indicating an increased maximum lift coefficient of approximately 48.77% (See Table 4).
From Figure 15b, for the drag coefficient of the airfoil, the difference between airfoil with and without VG was not significant for angles of attack less than 10°. After the AoA of 10°, the drag coefficient of the airfoil with VG was significantly lower than that of airfoil without VG. When the installation angle of VG was β = 25°, the drag coefficient of airfoil increased between angles of attack of 10° and 15°. This corresponds to the decrease of lift coefficient of the airfoil in this range of attack angles. In the range of attack angles of 18°–23°, the drag coefficient of the airfoil was the largest when the VG installation angle was β = 30°. When the AoA of the airfoil was 18°, the drag coefficient of the airfoil was the lowest when the installation angle was β = 15°. This is 88% lower than that of the airfoil without VG.
From Figure 15c, the lift-drag ratio of the clean airfoil was higher than that of the airfoil with VG before the AoA of 8°. When the installation angle of the VG was β = 10°, the maximum lift-drag ratio decrease was the smallest (1.03%). When β = 30°, the maximum lift-drag ratio of the airfoil decreased by 31.89%. However, at angles of attack larger than 8°, the lift-drag ratio of the clean airfoil is smaller than that of the airfoil with VG. When the AoA of the airfoil was 18°, the lift-drag ratio increased by 1146.04% for an installation angle of 15°. For an installation angle of 20°, the lift-drag ratio increased by 821.86%.
Figure 16 shows the distribution of static pressure coefficients on the airfoil surface. The Cp curves of the airfoils with and without VG coincide closely at angles of attack of α = 0°, 5°. Similarly, there is little difference between the different VG installation angles. When the AoA is α = 10°, the separation position of the clean airfoil is located at 0.73C, and the adverse pressure gradient was Δpx ≈ −0.77 (kPa/m). The results show that the flow separation can be completely suppressed by the VG. When the AoA was α = 15°, the distance between the separation position and VG was Δx ≈ 46.6H, and the reverse pressure gradient was Δpx ≈ −1.62 (kPa/m), and the flow separation was completely inhibited. At the AoA of α = 18°, Δx ≈ 30H, Δpx ≈ −2.4 (kPa/m), and the VG also inhibited the flow separation. When the AoA was α = 20°, Δx ≈ 20H, and Δpx ≈ −2.96 (kPa/m). Here, the VG are closer to the separation position and cannot completely inhibit separation because of the increased adverse pressure gradient. For an installation angle of 30°, the pressure platforms first appear at the trailing edge of the airfoil. For an AoA of 22°, Δx ≈ 10H and Δpx ≈ −3.95 (kPa/m). When the installation angle of VG was β = 30°, the flow separation cannot be restrained, and the separation position is similar to that of the clean airfoil. The separation position of β = 25° is slightly closer to the leading edge than that of other airfoils. At this high AoA, the distribution of Cp showed little difference when β = 10°, 15°, and 20°. For the AoA of α = 25°, the separation position of the airfoil is upstream of VG. At this point, the VG cannot suppress the separation. Therefore, the distribution of Cp of the airfoil without VG is basically consistent with that of the airfoil with VG.
Figure 17 shows the distribution of the total pressure coefficient at the tail rake. It can be seen that the installation angle of VG has little effect on the total pressure loss of tail rake at angles of attack of α = 0°, 5°, 10°. The energy loss at an AoA of α = 15° is larger, with a VG installation angle of β = 25°. This corresponds to the larger drag coefficient at that AoA. At the other installation angles, the coefficient of drag was basically the same. At angles of attack of α = 18°, 20°, 22°, the total pressure loss of tail rake with installation angle of β = 30° was the largest, and the drag coefficient of airfoil was also large at this time. This indicates that the ability of the VG to suppress flow separation was weakened. When the AoA was α = 25°, the total pressure loss of tail rake is basically the same regardless of the VG installation angle.

4. Conclusions

In this paper, the effects of VG installation angle on the characteristics of VG vortices and aerodynamic performance of airfoils were studied by numerical simulation and wind tunnel experiments. The results show that the strength of vortices on the leeward side of the VG increases with the increase of the VG installation angle before the vortex core breaks down. Downstream of the VG, when the streamwise distance was x/H < 20, the intensity of the vortex at β = 30° was the largest. Between x/H = 20~80, the intensity of the vortex with β = 25° was the greatest. When x/H > 80, the intensity of the vortex with β = 20° was the greatest. Correspondingly, the results show that when the separation point is located x/H < 20 from the VG trailing edge, the installation angle of the VG should be β = 30°. If the separation point is between x/H = 20~80, the installation angle of the VG should be β = 25°. If the separation point is more than x/H > 80, the installation angle of the VG should be β = 20°. During the downstream development of the leading edge separation vortices of the VG, the vortices deviate in the radial direction. The larger the installation angle, the larger the deviation of the vortices in the radial direction. For flow control, multiple VG need to be arranged in the radial direction. From the downstream distance of separation point and the radius and radial distance of the VG vortex core, the optimal spacing of the VG can be roughly estimated.
The present results show that VG can effectively delay the flow separation on the airfoil suction surface, increase lift, and reduce the drag of airfoil. The stall AoA of the airfoil without VG is 8°, and the maximum lift coefficient is 1.43. The measured stall AoA of the airfoil with VG was 18°, delaying stall by 10°. When the installation angle of the VG was β = 20°, the maximum lift coefficient was 2.12, indicating an increased maximum lift coefficient of approximately 48.77%. From the overall distribution of lift-drag coefficient, the effect of the installation angle of the VG was the worst when β = 30° and the effect was the best when β = 20°. When the flow separation position is upstream of the VG, the VG cannot inhibit flow separation. From the distribution of the total pressure coefficient of tail rake, when the AoA of the airfoil was less than 15°, the influence of the different VG installation angles on total pressure loss was not significant. When α = 18°, 20°, 22°, the total pressure at the installation angle of β = 30° was the largest, and the difference between the other installation angles was insignificant.

Author Contributions

X.-K.L., W.L., T.-J.Z., P.-M.W. conceived the research idea. X.-K.L., X.-D.W. performed numerical simulation. P.-M.W., T.-J.Z. analyzed data and numerical results. All authors have contributed to the writing, editing, and revising of this manuscript.

Funding

This work was jointly supported by the National Natural Science Foundation of China (51806221), Development Plan of Key Scientific and Technological Projects of China Huadian Engineering Co., Ltd. (CHEC) (No. CHECKJ 19-02-03).

Conflicts of Interest

The authors declare no conflicts of interest.

References

  1. Wang, X.; Ye, Z.; Kang, S.; Hu, H. Investigations on the Unsteady Aerodynamic Characteristics of a Horizontal-Axis Wind Turbine during Dynamic Yaw Processes. Energies 2019, 12, 3124. [Google Scholar] [CrossRef]
  2. Wang, X.; Liu, Y.; Wang, L.; Ding, L.; Hu, H. Numerical Study of Nacelle Wind Speed Characteristics of a Horizontal Axis Wind Turbine under Time-Varying Flow. Energies 2019, 12, 3993. [Google Scholar] [CrossRef]
  3. Macquart, T.; Maheri, A.; Busawon, K. Microtab dynamic modelling for wind turbine blade load rejection. Renew. Energy 2014, 64, 144–152. [Google Scholar] [CrossRef]
  4. Kametani, Y.; Fukagata, K.; Orlu, R.; Schlatter, P. Effect of uniform blowing/suction in a turbulent boundary layer at moderate Reynolds number. Int. J. Heat Fluid Flow 2015, 55, 132–142. [Google Scholar] [CrossRef]
  5. Ebrahimi, A.; Movahhedi, M. Wind turbine power improvement utilizing passive flow control with microtab. Energy 2018, 150, 575–582. [Google Scholar] [CrossRef]
  6. Yang, H.; Jiang, L.-Y.; Hu, K.-X.; Peng, J. Numerical study of the surfactant-covered falling film flowing down a flexible wall. Eur. J. Mech. Fluids 2018, 72, 422–431. [Google Scholar] [CrossRef]
  7. Ziadé, P.; Feero, M.A.; Sullivan, P.E. A numerical study on the influence of cavity shape on synthetic jet performance. Int. J. Heat Fluid Flow 2018, 74, 187–197. [Google Scholar] [CrossRef]
  8. Matteo, C.; Andrea, P.; Luigi de, L. Design approach to predict synthetic jet formation and resonance amplifications. Exp. Ther. Fluid Sci. 2019, 107, 79–87. [Google Scholar]
  9. Ma, L.; Wang, X.; Zhu, J.; Kang, S. Dynamic Stall of a Vertical-Axis Wind Turbine and Its Control Using Plasma Actuation. Energies 2019, 12, 3738. [Google Scholar] [CrossRef]
  10. Zong, H.; Chiatto, M.; Kotsonis, M.; De Luca, L. Plasma Synthetic Jet Actuators for Active Flow Control. Actuators 2018, 7, 77. [Google Scholar] [CrossRef]
  11. Lin, J.C. Review of research on low-profile vortex generators to control boundary-layer separation. Prog. Aerosp. Sci. 2002, 38, 389–420. [Google Scholar] [CrossRef]
  12. Hansen, M.O.L.; Velte, C.M.; Øye, S. Aerodynamically shaped vortex generator. Wind Energy 2015, 19, 563–567. [Google Scholar] [CrossRef]
  13. Barlas, T.K.; van Kuik, G.A.M. Review of state of the art in smart rotor control research for wind turbines. Prog. Aerosp. Sci. 2010, 46, 1–27. [Google Scholar] [CrossRef]
  14. Johnson, S.J.; Baker, J.P.; Dam, C.P.V. An overview of active load control techniques for wind turbines with an emphasis on microtabs. Wind Energy 2010, 13, 239–253. [Google Scholar] [CrossRef]
  15. Manolesos, M.; Voutsinas, S.G. Experimental investigation of the flow past passive vortex generators on an airfoil experiencing three-dimensional separation. J. Wind Eng. Ind. Aerodyn. 2015, 142, 130–148. [Google Scholar] [CrossRef]
  16. Wang, H.; Zhang, B.; Qiu, Q.; Xu, X. Flow control on the NREL S809 wind turbine airfoil using vortex generators. Energy 2017, 118, 1210–1221. [Google Scholar] [CrossRef]
  17. Taylor, H.D. The Elimination of Diffuser Separation by Vortex Generators; United Aircraft Corporation Report No. R-4012-3; United Aircraft Corporation: Moscow, Russia, June 1947. [Google Scholar]
  18. Godard, G.; Stanislas, M. Control of a decelerating boundary layer. Part 1: Optimization of passive vortex generators. Aerosp. Technol. 2006, 10, 181–191. [Google Scholar] [CrossRef]
  19. Godard, G.; Stanislas, M. Control of a decelerating boundary layer. Part 2: Optimization of slotted jets vortex generators. Aerosp. Sci. Technol. 2006, 10, 394–400. [Google Scholar] [CrossRef]
  20. Godard, G.; Stanislas, M. Control of a decelerating boundary layer. Part 3: Optimization of round jets vortex generators. Aerosp. Sci. Technol. 2006, 10, 455–464. [Google Scholar] [CrossRef]
  21. Gao, L.; Zhang, H.; Liu, Y.; Han, S. Effects of vortex generators on a blunt trailing-edge airfoil for wind turbines. Renew. Energy 2015, 76, 303–311. [Google Scholar] [CrossRef]
  22. Martínez-Filgueira, P.; Fernandez-Gamiz, U.; Zulueta, E.; Errasti, I.; Fernandez-Gauna, B. Parametric study of low-profile vortex generators. Int. J. Hydrog. Energy 2017, 42, 17700–17712. [Google Scholar] [CrossRef]
  23. Zhen, T.K.; Zubair, M.; Ahmad, K.A. Experimental and Numerical Investigation of the Effects of Passive Vortex Generators on Aludra UAV Performance. Chin. J. Aeronaut. 2011, 24, 577–583. [Google Scholar] [CrossRef]
  24. Kundu, P.; Sarkar, A.; Nagarajan, V. Improvement of performance of S1210 hydrofoil with vortex generators and modified trailing edge. Renew. Energy 2019, 142, 643–657. [Google Scholar] [CrossRef]
  25. Gageik, M.; Nies, J.; Klioutchnikov, I.; Olivier, H. Pressure wave damping in transonic airfoil flow by means of micro vortex generators. Aerosp. Sci. Technol. 2018, 81, 65–77. [Google Scholar] [CrossRef]
  26. Mereu, R.; Passoni, S.; Inzoli, F. Scale-resolving CFD modeling of a thick wind turbine airfoil with application of vortex generators: Validation and sensitivity analyses. Energy 2019, 187, 115969. [Google Scholar] [CrossRef]
  27. Manolesos, M.; Papadakis, G.; Voutsinas, S.G. Revisiting the assumptions and implementation details of the BAY model for vortex generator flows. Renew. Energy 2020, 146, 1249–1261. [Google Scholar] [CrossRef]
  28. Brüderlin, M.; Zimmer, M.; Hosters, N.; Behr, M. Numerical simulation of vortex generators on a winglet control surface. Aerosp. Sci. Technol. 2017, 71, 651–660. [Google Scholar] [CrossRef]
  29. Yang, K.; Zhang, L.; Xu, J.Z. Simulation of aerodynamic performance affected by vortex generators on blunt trailing-edge airfoils. Sci. China Ser. E Technol. Sci. 2010, 53, 1–7. [Google Scholar] [CrossRef]
  30. Sørensen, N.N.; Zahle, F.; Bak, C.; Vronsky, T. Prediction of the Effect of Vortex Generators on Airfoil Performance. J. Phys. Conf. Ser. 2014, 524, 12019. [Google Scholar] [CrossRef]
  31. Fouatih, O.M.; Medale, M.; Imine, O.; Imine, B. Design optimization of the aerodynamic passive flow control on NACA 4415 airfoil using vortex generators. Eur. J. Mech. B Fluids 2016, 56, 82–96. [Google Scholar] [CrossRef]
  32. Zhang, L.; Li, X.; Yang, K.; Xue, D. Effects of vortex generators on aerodynamic performance of thick wind turbine airfoils. J. Wind Eng. Ind. Aerodyn. 2016, 156, 84–92. [Google Scholar] [CrossRef]
  33. Lishu, H.; Zhide, Q. Experimental Research on Control Flow over Airfoil Based on Vortex Generator and Gurney Flap. Acta Aeronaut. Astronaut. Sin. 2011, 32, 1429–1434. [Google Scholar]
  34. Reuss, R.L.; Hoffman, M.J.; Gregorek, G.M. Effects of Surface Roughness and Vortex Generators on the NACA 4415 Airfoil; Vortex Augmented Turbines; The Ohio State University: Columbus, OH, USA, 1995; p. 12. [Google Scholar]
  35. Velte, C.M.; Hansen, M.O.L. Investigation of flow behind vortex generators by stereo particle image velocimetry on a thick airfoil near stall. Wind Energy 2013, 16, 775–785. [Google Scholar] [CrossRef]
  36. Delnero, J.S.; Di Leo, J.M.; Camocardi, M.E.; Martínez, M.A.; Lerner, J.L.C.; Delnero, J.S.; Di Leo, J.M. Experimental study of vortex generators effects on low Reynolds number airfoils in turbulent flow. Int. J. Aerodyn. 2012, 2, 50. [Google Scholar] [CrossRef]
  37. Lishu, H.; Zhide, Q.; Wenping, S. Experimentally Studying Effects of Different Layouts of Vortex Generator on Controlling Stall Flow over Airfoil. J. Northwestern Polytech. Univ. 2011, 29, 524–528. [Google Scholar]
  38. Baldacchino, D.; Ferreira, C.; Tavernier, D.D.; Timmer, W.A.; van Bussel, G.J.W. Experimental parameter study for passive vortex generators on a 30% thick airfoil. Wind Energy 2018, 21, 745–765. [Google Scholar] [CrossRef]
  39. Lin, J.C.; Robinson, S.K.; McGhee, R.J.; Valarezo, W.O. Separation control on high-lift airfoils via micro-vortex generators. J. Aircr. 2015, 31, 1317–1323. [Google Scholar] [CrossRef]
  40. Li, X.; Yang, K.; Wang, X. Experimental and Numerical Analysis of the Effect of Vortex Generator Height on Vortex Characteristics and Airfoil Aerodynamic Performance. Energies 2019, 12, 959. [Google Scholar] [CrossRef] [Green Version]
  41. Li, X.; Yang, K.; Hu, H.; Wang, X.; Kang, S. Effect of Tailing-Edge Thickness on Aerodynamic Noise for Wind Turbine Airfoil. Energies 2019, 12, 270. [Google Scholar] [CrossRef] [Green Version]
Figure 1. Computational domain and boundary conditions.
Energies 12 04583 g001
Figure 2. Computational mesh.
Energies 12 04583 g002
Figure 3. Diagram of VG height (H) and boundary layer thickness (δ).
Energies 12 04583 g003
Figure 4. Wind tunnel measurement section size and test airfoil.
Energies 12 04583 g004
Figure 5. (a) Test airfoil with VG; (b) Structure parameters of VG.
Energies 12 04583 g005
Figure 6. Comparison of experiments. (a) Lift coefficient; (b) Drag coefficient.
Energies 12 04583 g006
Figure 7. Streamlines and vorticity contour on the leeward side of VG.
Energies 12 04583 g007
Figure 8. (a) Three sections in VG chord direction; and vorticity contours at the leeward side of the VG, (b) x = 0.4l; (c) x = 0.6l; (d) x = 0.8l.
Energies 12 04583 g008
Figure 9. Static pressure contours and static pressure distribution on the leeward side of VG.
Energies 12 04583 g009
Figure 10. (a) Distributions of static pressure coefficient; (b) Axial velocity at the vortex axis.
Energies 12 04583 g010
Figure 11. Vorticity contour on the leeward side of VG.
Energies 12 04583 g011
Figure 12. Streamlines in longitudinal sections. (a) β = 10°; (b) β = 20°; (c) β = 30°.
Energies 12 04583 g012
Figure 13. Variation of (a) vortex core area and (b) vortex intensity downstream of the VG.
Energies 12 04583 g013
Figure 14. Radial motion trajectory of vortex core at downstream of VG. (a) Schematic of vortex core development; (b) Radial trajectory of the vortex core.
Energies 12 04583 g014
Figure 15. Curves of (a) lift coefficien, (b) drag coefficient, and (c) lift-drag ratio with or without VG.
Energies 12 04583 g015
Figure 16. Distribution of Cp on the airfoil surface, (a) α = 0°; (b) α = 5°; (c) α = 10°; (d) α = 15°; (e) α = 18°; (f) α = 20°; (g) α = 22°; (h) α = 25°.
Energies 12 04583 g016aEnergies 12 04583 g016b
Figure 17. Distribution of total pressure coefficient of tail rake. (a) α = 0°, 5°; (b) α = 10°, 15°; (c) α = 18°, 20°; (d) α = 22°, 25°.
Energies 12 04583 g017
Table 1. VG geometric parameters.
Installation Angle β (°)Height H (mm)Height Ratio (H/δ)Chord Length l
10, 15, 20, 25, 3051.02.5
Table 2. Results of the grid independence study.
VariablesMeshRichardson Extrapolation
CoarseMediumFineREpR
Cl0.58930.59180.59210.59223.050.12
Cd0.22370.2250.22510.22513.700.07
Cl/Cd2.62112.62192.62212.62222.00.25
Table 3. VG geometric parameters and arrangement.
Installation Angle β (°)Length l (mm)Height H (mm)Spacing S/HPitch Distance λ/H
10, 15, 20, 25, 3017555
Table 4. Relative variation of Cl, Cd, and lift-drag ratio.
CaseStall Attack AngleIncrement of Maximum ClVariations of Cd at 18°Variations of Maximum Lift-Drag RatioIncrement of Lift-Drag Ratio at 18°
Clean0%0%0%0%
β = 10°18°41.58%−81.93%−1.03%708.83%
β = 15°18°44.297%−88.00%−3.20%1146.04%
β = 20°18°48.77%−83.28%−19.35%821.86%
β = 25°18°46.69%−81.01%−32.47%696.77%
β = 30°18°42.69%−62.13%−31.89%284.56%

