1. Introduction
Hydraulic turbines are widely used for flexible electricity generation, including frequency control, because the amount of produced electricity from intermittent renewable energy sources has considerably increased. Consequently, these turbines operate under a larger range of discharge values and undergo more transient operations than what they were initially designed for. Transient operations consist of load variation, start, stop, speed-no-load, runaway and emergency shutdown, where the last two operations represent non-normal operation. Severe hydrodynamic conditions may provoke high-pressure fluctuations in the turbine, particularly on the runner blades [
1]. This outcome directly affects the unit operational lifetime and imposes more regular refurbishment requirements [
2,
3].
During the start-up cycle, the runner accelerates from zero to synchronous speed, which is called speed-no-load operation. After the runner speed is stabilized, the generator is magnetized, and the guide vane opening increases to the set value. The unsteady flow leaving the runner has a large swirl during the start-up operation [
4]. Low-frequency transient loads that occur on the runner blades induce slow cycle fatigue [
5]. In addition, high amplitude vibrations can occur due to the resonance between the low frequencies developed during the start-up operation and the natural frequencies of the runner. The runner blades experience random and periodic stress that is induced by stochastic and periodic flow during the start-up cycle [
5,
6,
7]. The damage to the runner blade caused by one start-up cycle to a runner blade was observed to be equivalent to thirty years of turbine operation under a partial load operating condition, approximately 60% of the best efficiency point where the pressure pulsations in the draft tube are maximum [
8]. In addition, no clear correlation between pressure pulsations in the draft tube and strain values on the runner blade was observed.
Guide vane opening limit and opening rate are two parameters that can influence pressure fluctuations in the turbine during the start-up operation. A start-up operation creates a complex flow and stochastic pressure loads in the turbine due to the change in the runner speed and transient pressure variation. The startup and shutdown scheme are defined during the turbine commissioning and can be changed during the refurbishment in power plants. An optimized start-up and shutdown scheme can reduce the damage and increase the life expectancy [
9]. Nevertheless, this operation should be performed on a case-by-case basis because each turbine exhibits a unique behavior during a start-up cycle, and general methods have not yet been proposed [
10]. An optimized start-up sequence was obtained by performing strain measurements on the runner blade of a prototype propeller turbine during the turbine commissioning [
10]. Different start-up strategies were investigated. The optimization was based on maximizing the fatigue reliability during the lifetime of the runner. Although the maximum strain in the runner blade did not decrease during the optimized start-up, the strain transient fluctuation decreased at the beginning of the cycle. Another study showed that the reduction in the guide vane opening rate could reduce the crack propagation rate on the runner blades of a prototype Francis turbine [
11]. In addition to fatigue issues, different natural frequencies can be excited during the start-up process by the initial hit of the water on the runner blades and later by the rotor-stator interaction [
12]. High amplitude pressure fluctuations were observed in the draft tube of two prototype Francis turbines during the guide vane opening from a closed position to the generator synchronization [
13]. Moreover, the pressure amplitudes increased during the synchronization process. Axial and torsion strain measurements were performed on the shaft of a prototype Kaplan turbine during a start-up operation [
14]. A wide-band frequency (high intensity of approximately 0–5 Hz for a short period of time) was observed before reaching the synchronous speed.
A series of measurements were performed on a Francis turbine model installed at the Water Power Laboratory (WPL), Norwegian University of Science and Technology, Norway. Unsteady pressure measurements on the runner blades, in the vaneless space, and in the draft tube of a high head Francis turbine model were carried out during start-up and shut down cycles in an open-loop test rig [
15]. Three start-up and three shut down guide vane opening schemes were examined. The pressure fluctuations in the runner during the rapid start-up scheme were observed to be approximately 1.5 times their corresponding values during the slow opening scheme. Another study on the same facility was performed to investigate the speed-no-load condition [
16]. High-pressure fluctuations were obtained compared to the normal operating point, i.e., the best efficiency point. Goyal et al. [
4] performed synchronized flow measurements using particle image velocimetry and pressure measurements during the start-up operation. An asymmetric flow concentrating towards the right wall of the draft tube was observed during the initial phase of the start-up. Amiri et al. [
17] showed that the asymmetry in the flow after the runner is associated with the Dean vortices that appear after the draft tube elbow. The strength of these vortices can be altered by the swirl leaving the runner. Recently, Coulaud et al. [
18] investigated the start-up sequence of a bulb turbine model by considering three different guide vane opening speeds in a closed-loop circuit at the Hydraulic Machine Laboratory, Laval University, Canada. One of the main challenges in a closed-loop model test is to maintain the turbine head using air injection in the upstream reservoir [
19]. Unsteady pressure measurements on the runner blade were performed, and the pressure field was estimated using an interpolation technique. It was observed that the guide vane opening rate was an important parameter that affected the pressure distribution on the runner blade.
It is difficult to simulate the start-up or shutdown of a prototype turbine due to the computational cost attributed to the wide range of time scales that arise from the turbine operational time, which can be as high as 30–40 s, and as low as 0.01 s for the rotor-stator interaction. Moreover, boundary conditions (e.g., transient inlet and outlet of the turbine, guide vane movement, variable rotational speed and variable runner blade) have to be carefully treated in numerical simulations. Nicolle et al. [
20] performed numerical flow simulations of a low head Francis turbine during the start-up. Two start-up scenarios were studied. The obtained pressure value on the blade leading edge showed that although the maximum pressure was captured, the pressure fluctuation was damped compared to the experimental data. Later, structural analysis was performed on the same test case [
21]. An overall trend of the mean strain was correctly predicted but the strain fluctuations were not obtained. Recently, one-way fluid-structure coupled simulations were performed on a medium head Francis turbine to investigate the stochastic strain on the runner blade [
22]. The synchronous speed was overpredicted by approximately 10%. The stochastic loads were only partially captured on the leading edge. It was mentioned that two-way coupling was needed to obtain the correct blade loading at the trailing edge. In addition, cavitation was not included in the analysis. A prototype pump-turbine was numerically investigated during the start-up operation [
23]. At the beginning of the start-up, the flow after the guide vanes formed a ring-shaped structure that became very strong at speed-no-load. The results showed that the pressure fluctuations close to the stay vanes and in the draft tube during the speed-no-load could reach 3.8–8 times that at full load. In addition, the fluctuation of radial and tangential forces on the runner increased by reaching the synchronous speed, which implied the non-uniform flow on the runner blades.
Compared with prototype turbines, the numerical simulations of model turbines, including flow simulations and fluid-structure coupled simulations, are affordable during the start-up operation [
24,
25,
26,
27]. Numerical simulations showed an overestimation of the synchronous speed by 5% for a bulb turbine model during speed-no-load [
26]. One-way fluid-structure coupling was used to predict the strain value on the runner blade. The mean strain value was correctly captured while the strain fluctuations were underestimated by a factor of two. A pump-turbine model was numerically investigated during the start-up [
27]. Pressure fluctuations at the guide vane outlet were in a good agreement with the experimental results. The dynamic strain amplitude obtained from the simulations was consistent with the experimental results.
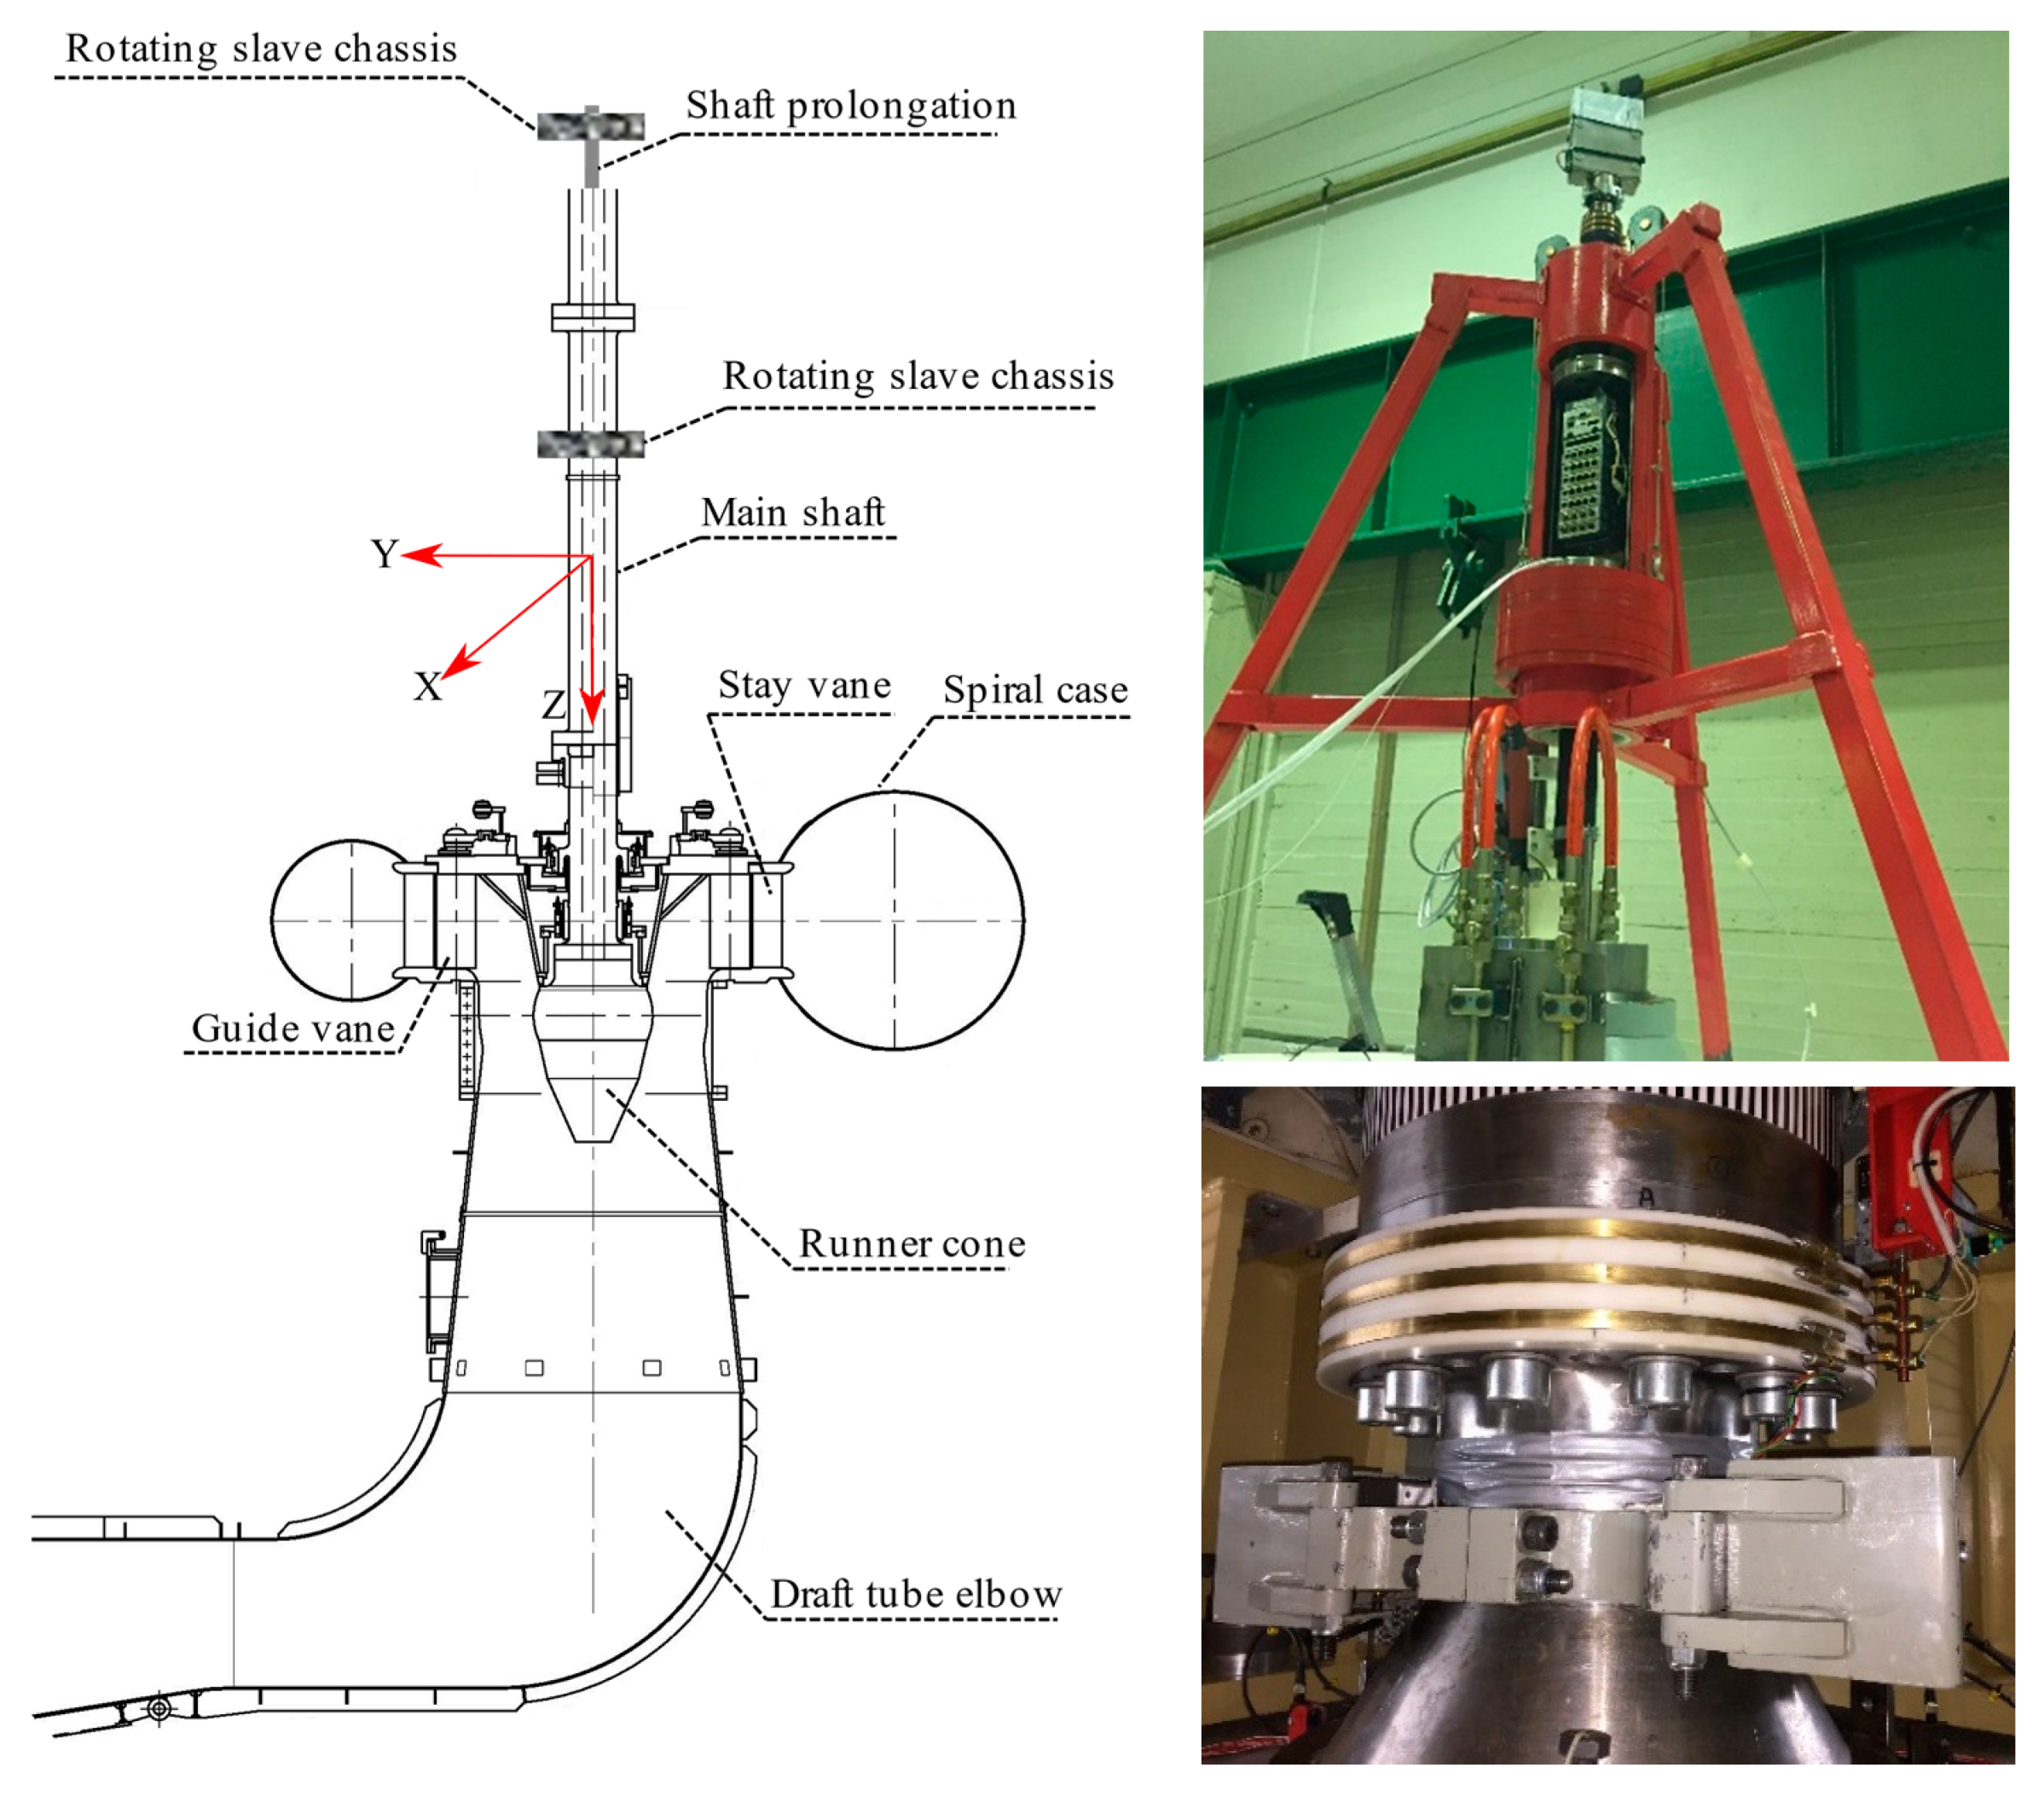
Prototype measurements are costly. Therefore, few results are published in the literature but their detailed results are valuable. The majority of published studies are on strain measurements on the runner blades and on pressure measurements in the draft tube. There are no published investigations on simultaneous pressure and strain measurements on the blades and shaft during the start-up operation of a prototype Kaplan turbine. Such measurements are of interest to correlate the flow acting on the runner blade with its effect on the remaining rotating and stationary domains. This information may help assess the condition in which the runner operates by performing relatively simple measurements on the shaft. Furthermore, the runner blade movement during the start-up operation can be optimized to reduce the pressure fluctuation on the runner blades. In this study, the start-up operation of the prototype Kaplan turbine, Porjus U9, was experimentally investigated. Unsteady pressure and strain measurements were performed on the runner blade, and axial, bending and torsional strain measurements were performed on the shaft. The strain and pressure fluctuations, particularly at low frequency, are discussed during different sequences of the start-up.
4. Results and Discussion
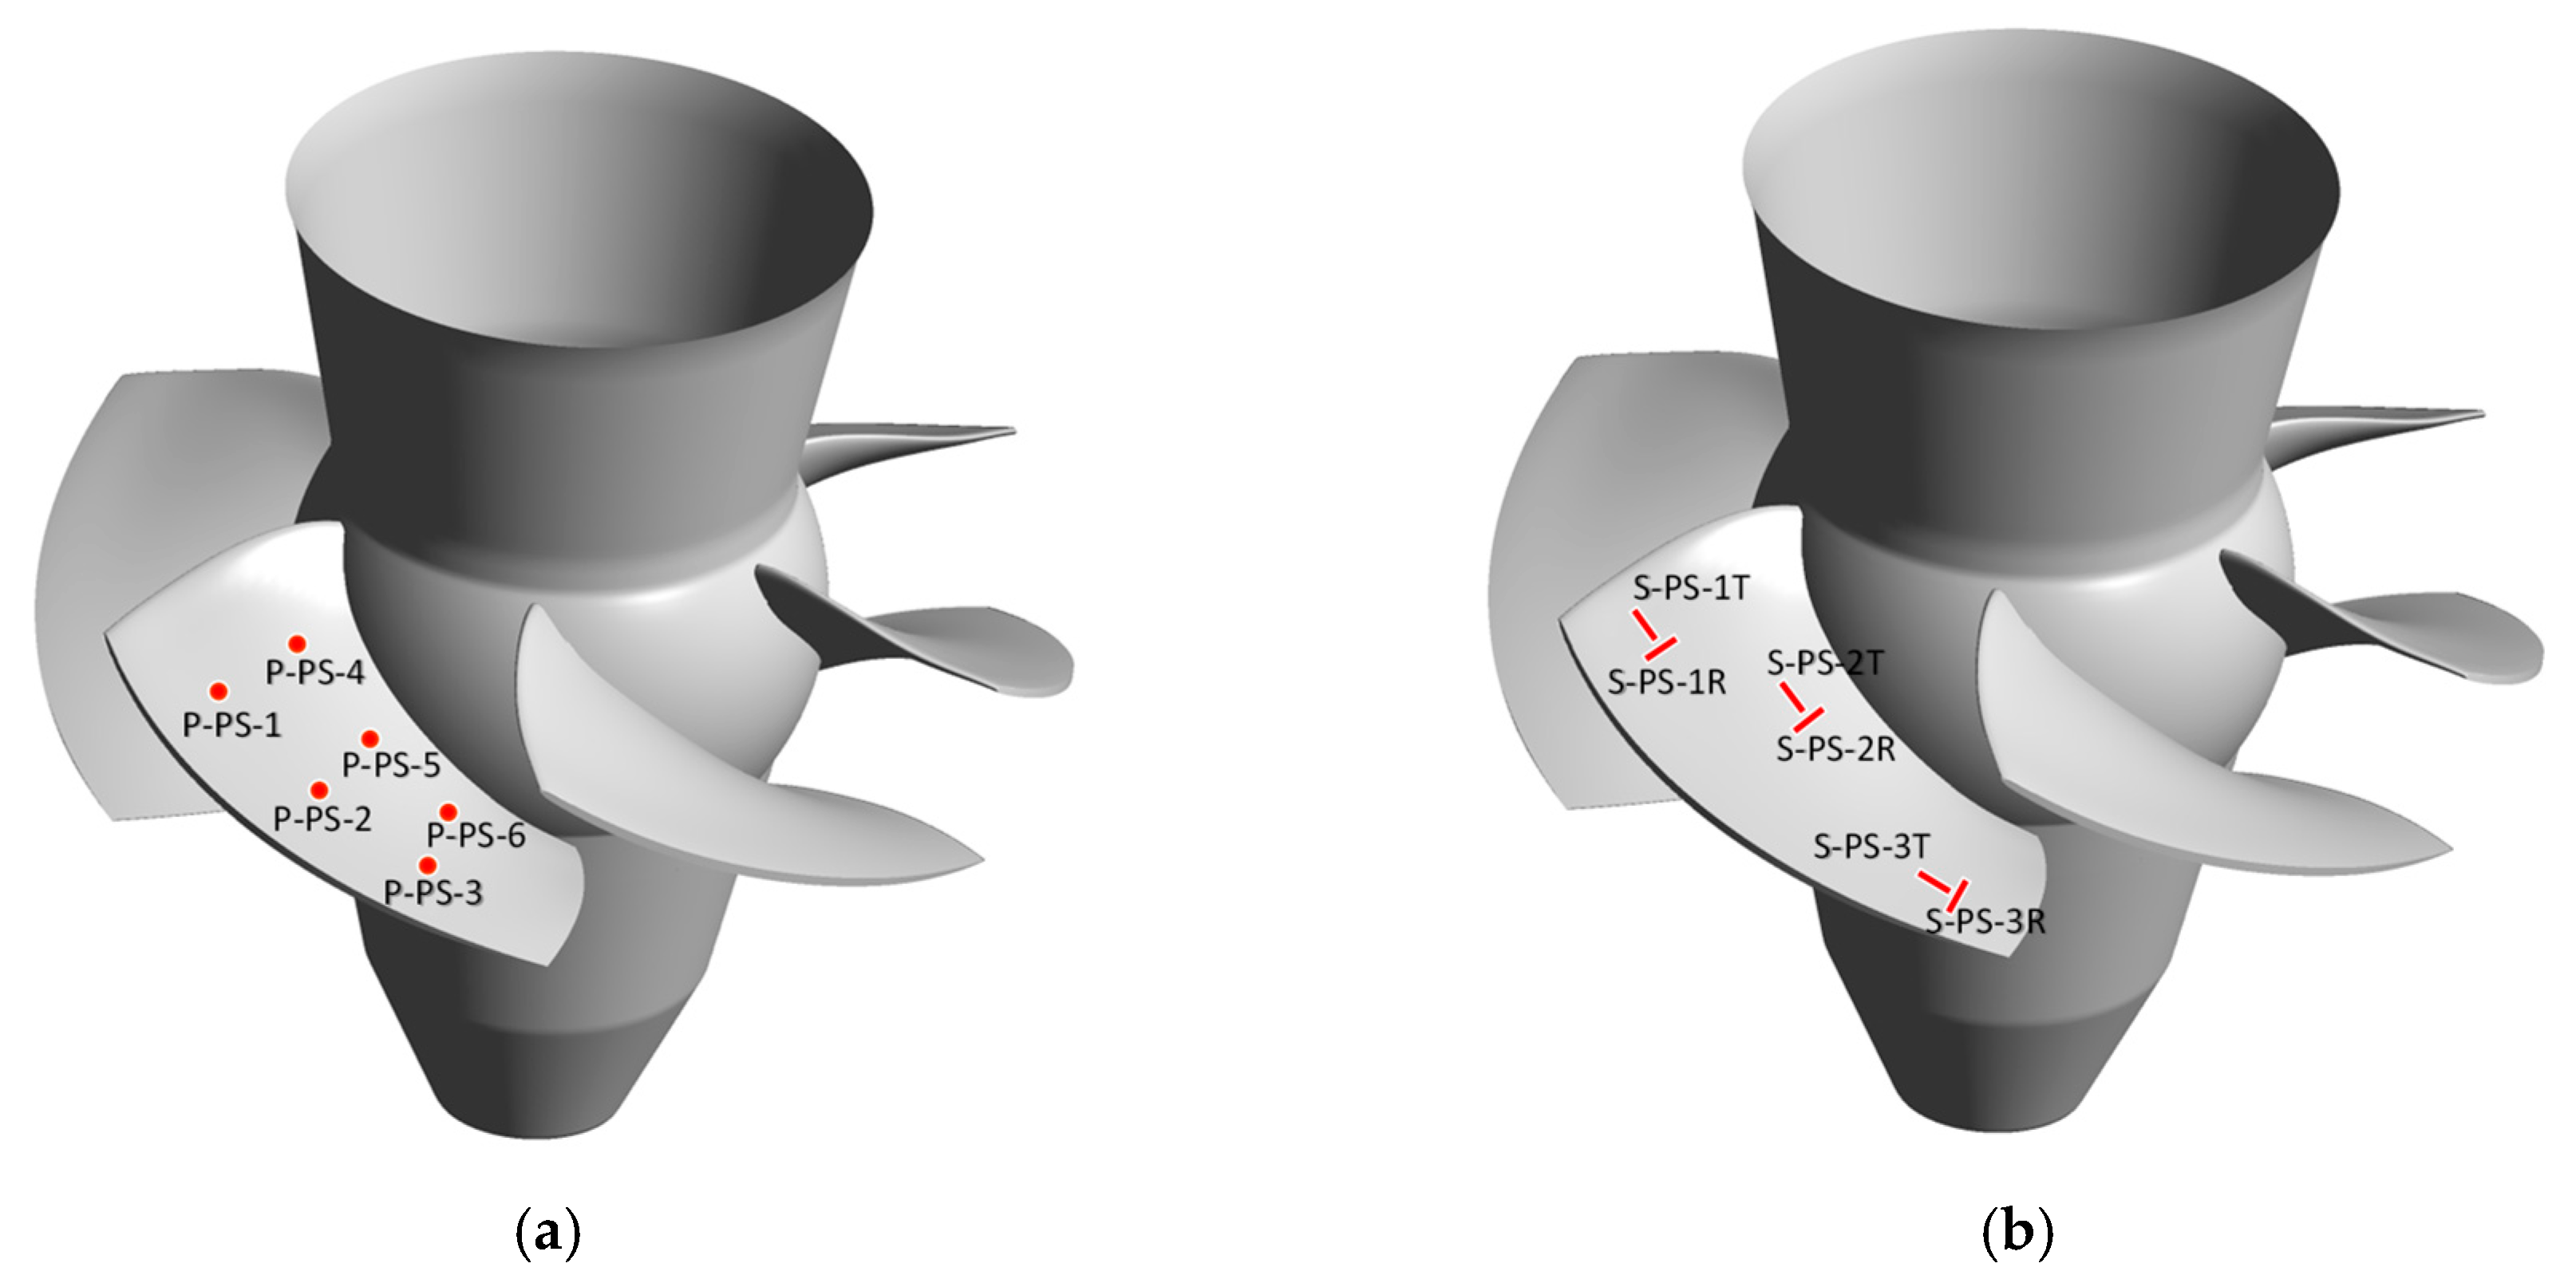
Synchronized pressure and strain measurements were performed on the prototype Kaplan turbine during the start-up operation. Several pressure transducers and strain gauges installed on the runner blade could not deliver reliable data due to malfunctioning. Therefore, only the data of the pressure transducers P-PS-2, P-PS-3, P-PS-4, P-PS-6, P-SS-3 and P-SS-4 and strain gauges S-PS-3R, S-PS-3T, S-SS-4R, S-SS-4T, S-SS-5R, S-SS-5T, S-SS-6R and S-SS-6T will be presented. All strain gauge data from the shaft will be presented. The need to discard some of the sensors indicates the challenging environment in the runner and the need to develop simple and efficient methods to assess the health of the turbine. The variation in the turbine general parameters (e.g., guide vane opening, runner blade angle and rotational speed) is presented. The detailed analysis of the pressure and strain fluctuations was performed, and the frequency spectral analysis was carried out to assess the frequency development, particularly in the low-frequency region. Four nonconsecutive repeated measurements at the start-up were performed to examine the repeatability of the measurement, and similar results were obtained.
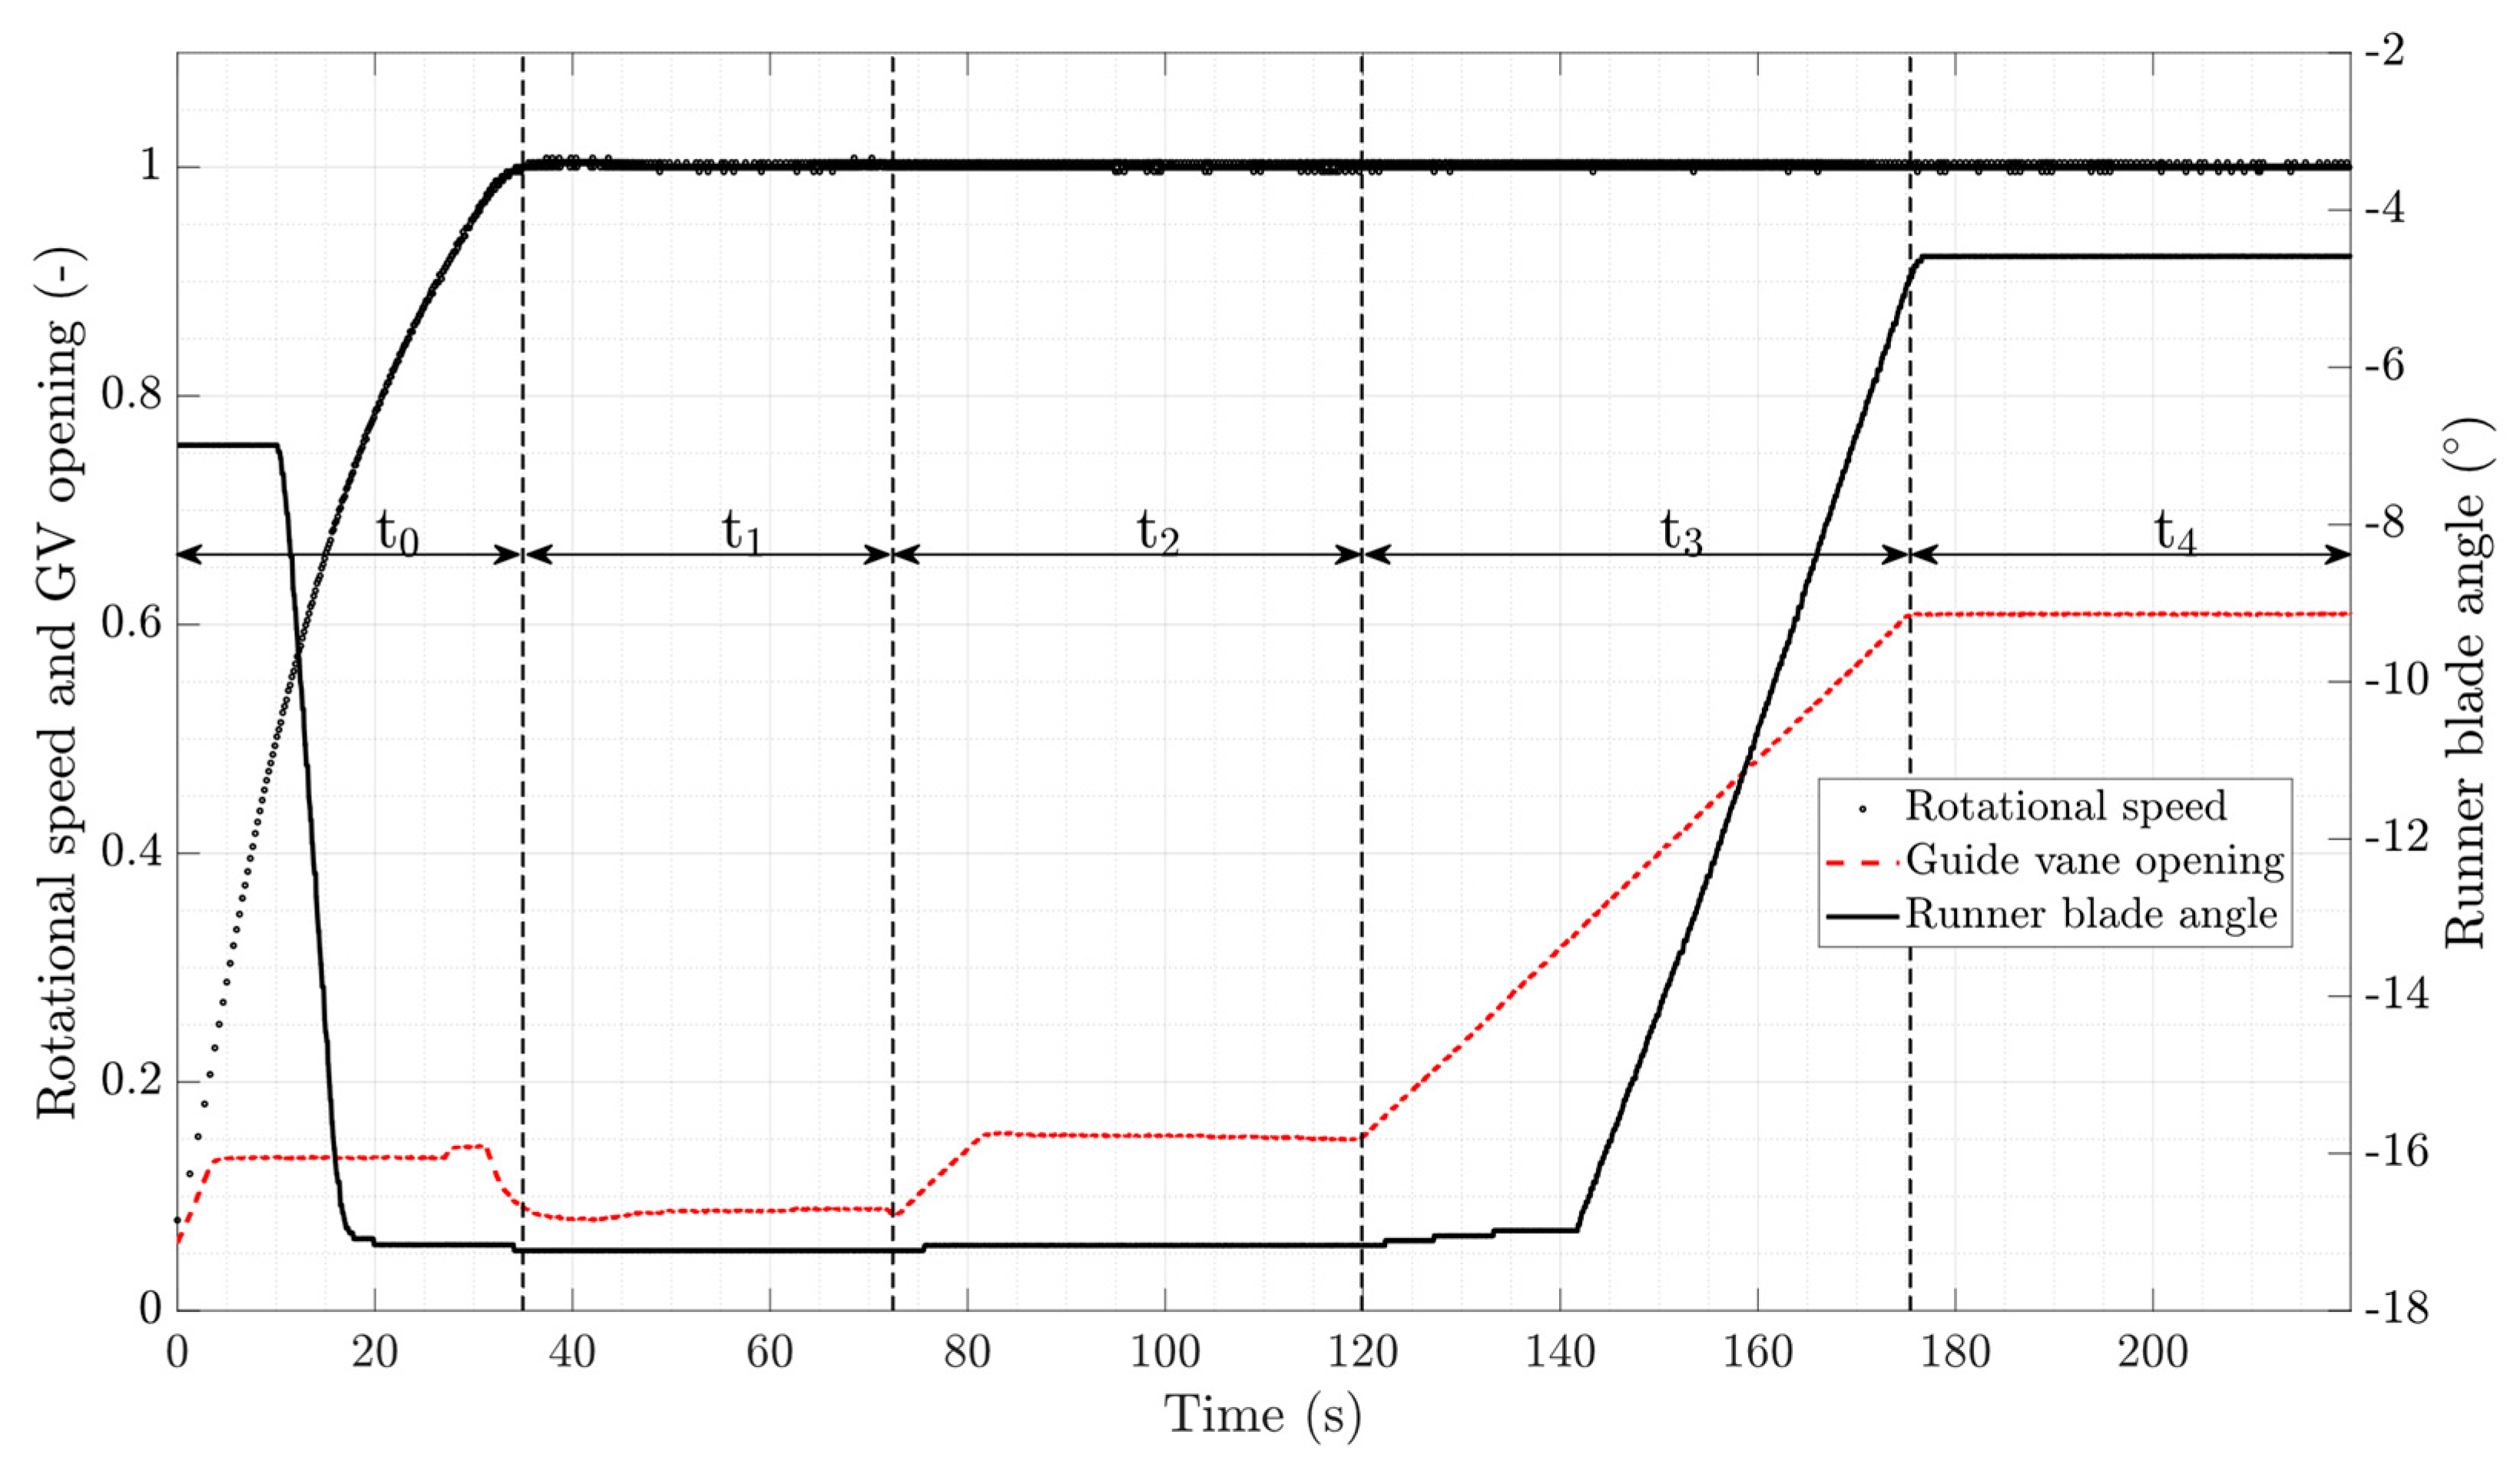
The start-up operation of the Kaplan turbine consists of different stages.
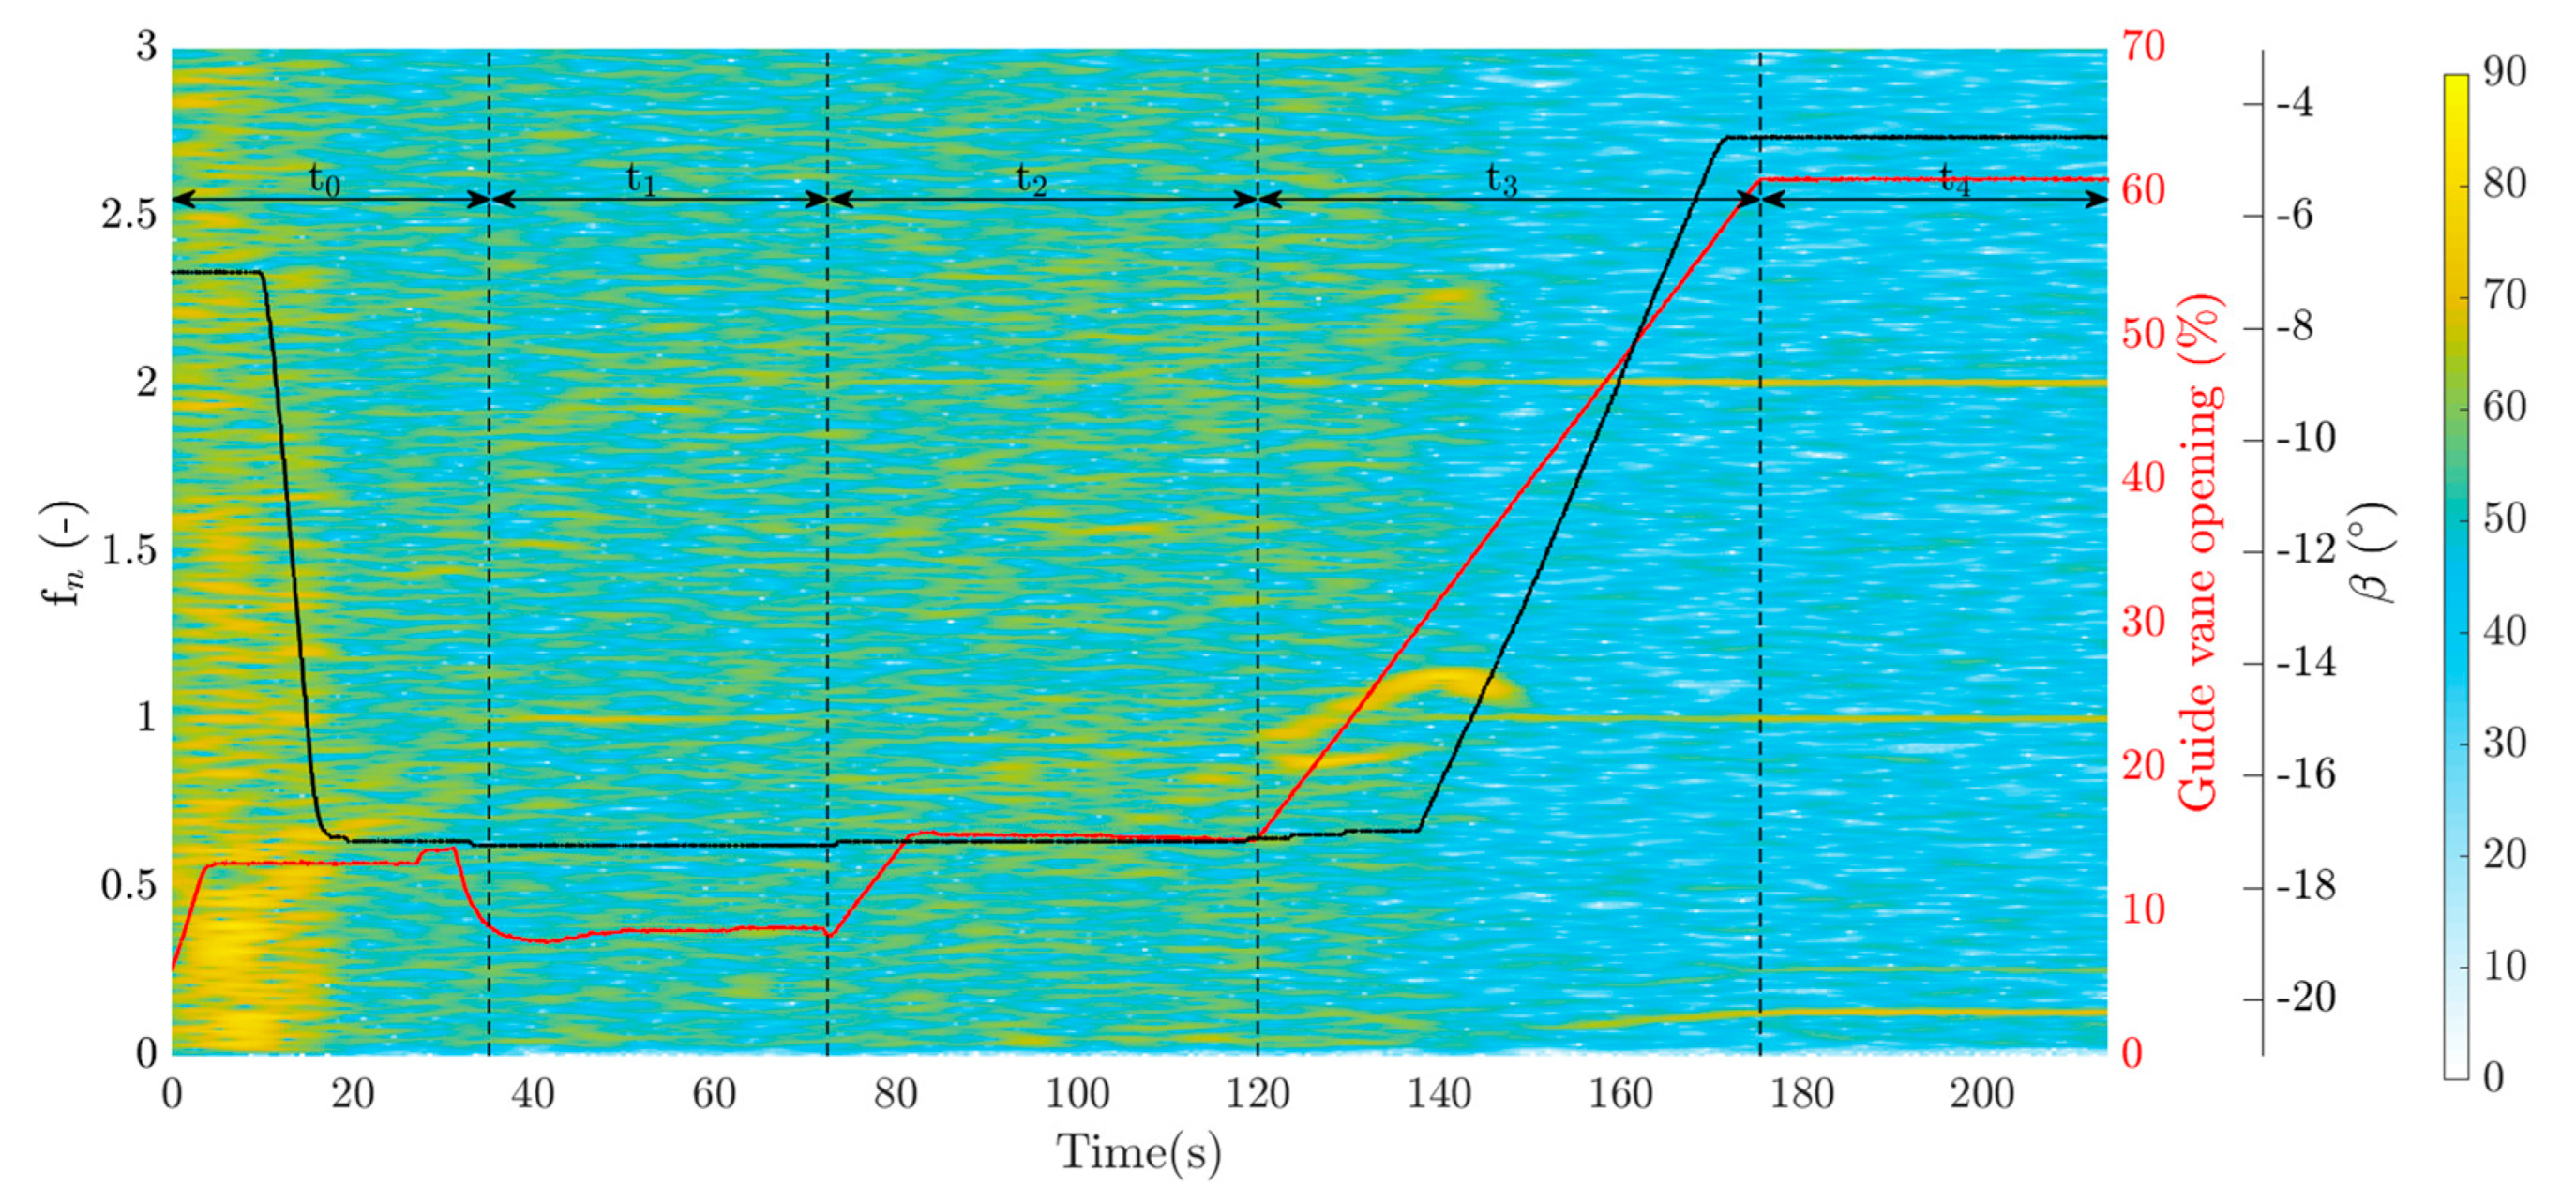
Figure 3 shows the variation in the runner blade angle, normalized rotational speed and guide vane opening. The rotational speed and guide vane opening were normalized by the rated rotational speed and the maximum guide vane opening, respectively. During the first stage,
, which is called the acceleration phase, the guide vanes were opened from the completely closed position with a prescribed opening rate until the opening limit was reached, i.e., approximately 14% opening. The runner rotational speed increased with an increase in the flow rate. The angle of runner blades decreased from −7° to −17° and remained unchanged until the end of the magnetization phase to further increase the runner angular momentum. The runner blade angle and the guide vane angular opening range of this unit was +10° to −17° and 0–35° (0–100% opening), respectively. The guide vanes remain unchanged for approximately 25 s. When the rotational speed reached the fold back speed (approximately 90–95% of the rated speed), after a slight increase in the guide vane opening, it decreased to fold back opening and remains in this position for 37 s. This stage is called speed-no-load and corresponded to the period
in
Figure 3. The synchronous speed was achieved, and there was no significant variation in the runner blade angle and guide vane opening during this phase. During the third stage,
, the generator magnetization was initiated, and the guide vanes were automatically opened in a limited range and remained unchanged until t = 120 s, while the runner blades were still at the minimum angle. Thereafter, during the fourth stage,
, the guide vane opening increased to the value given by the unit operator (in this case, 61% opening), and the runner blades automatically adjusted to −4.4°. The power output increased by further opening the guide vanes.
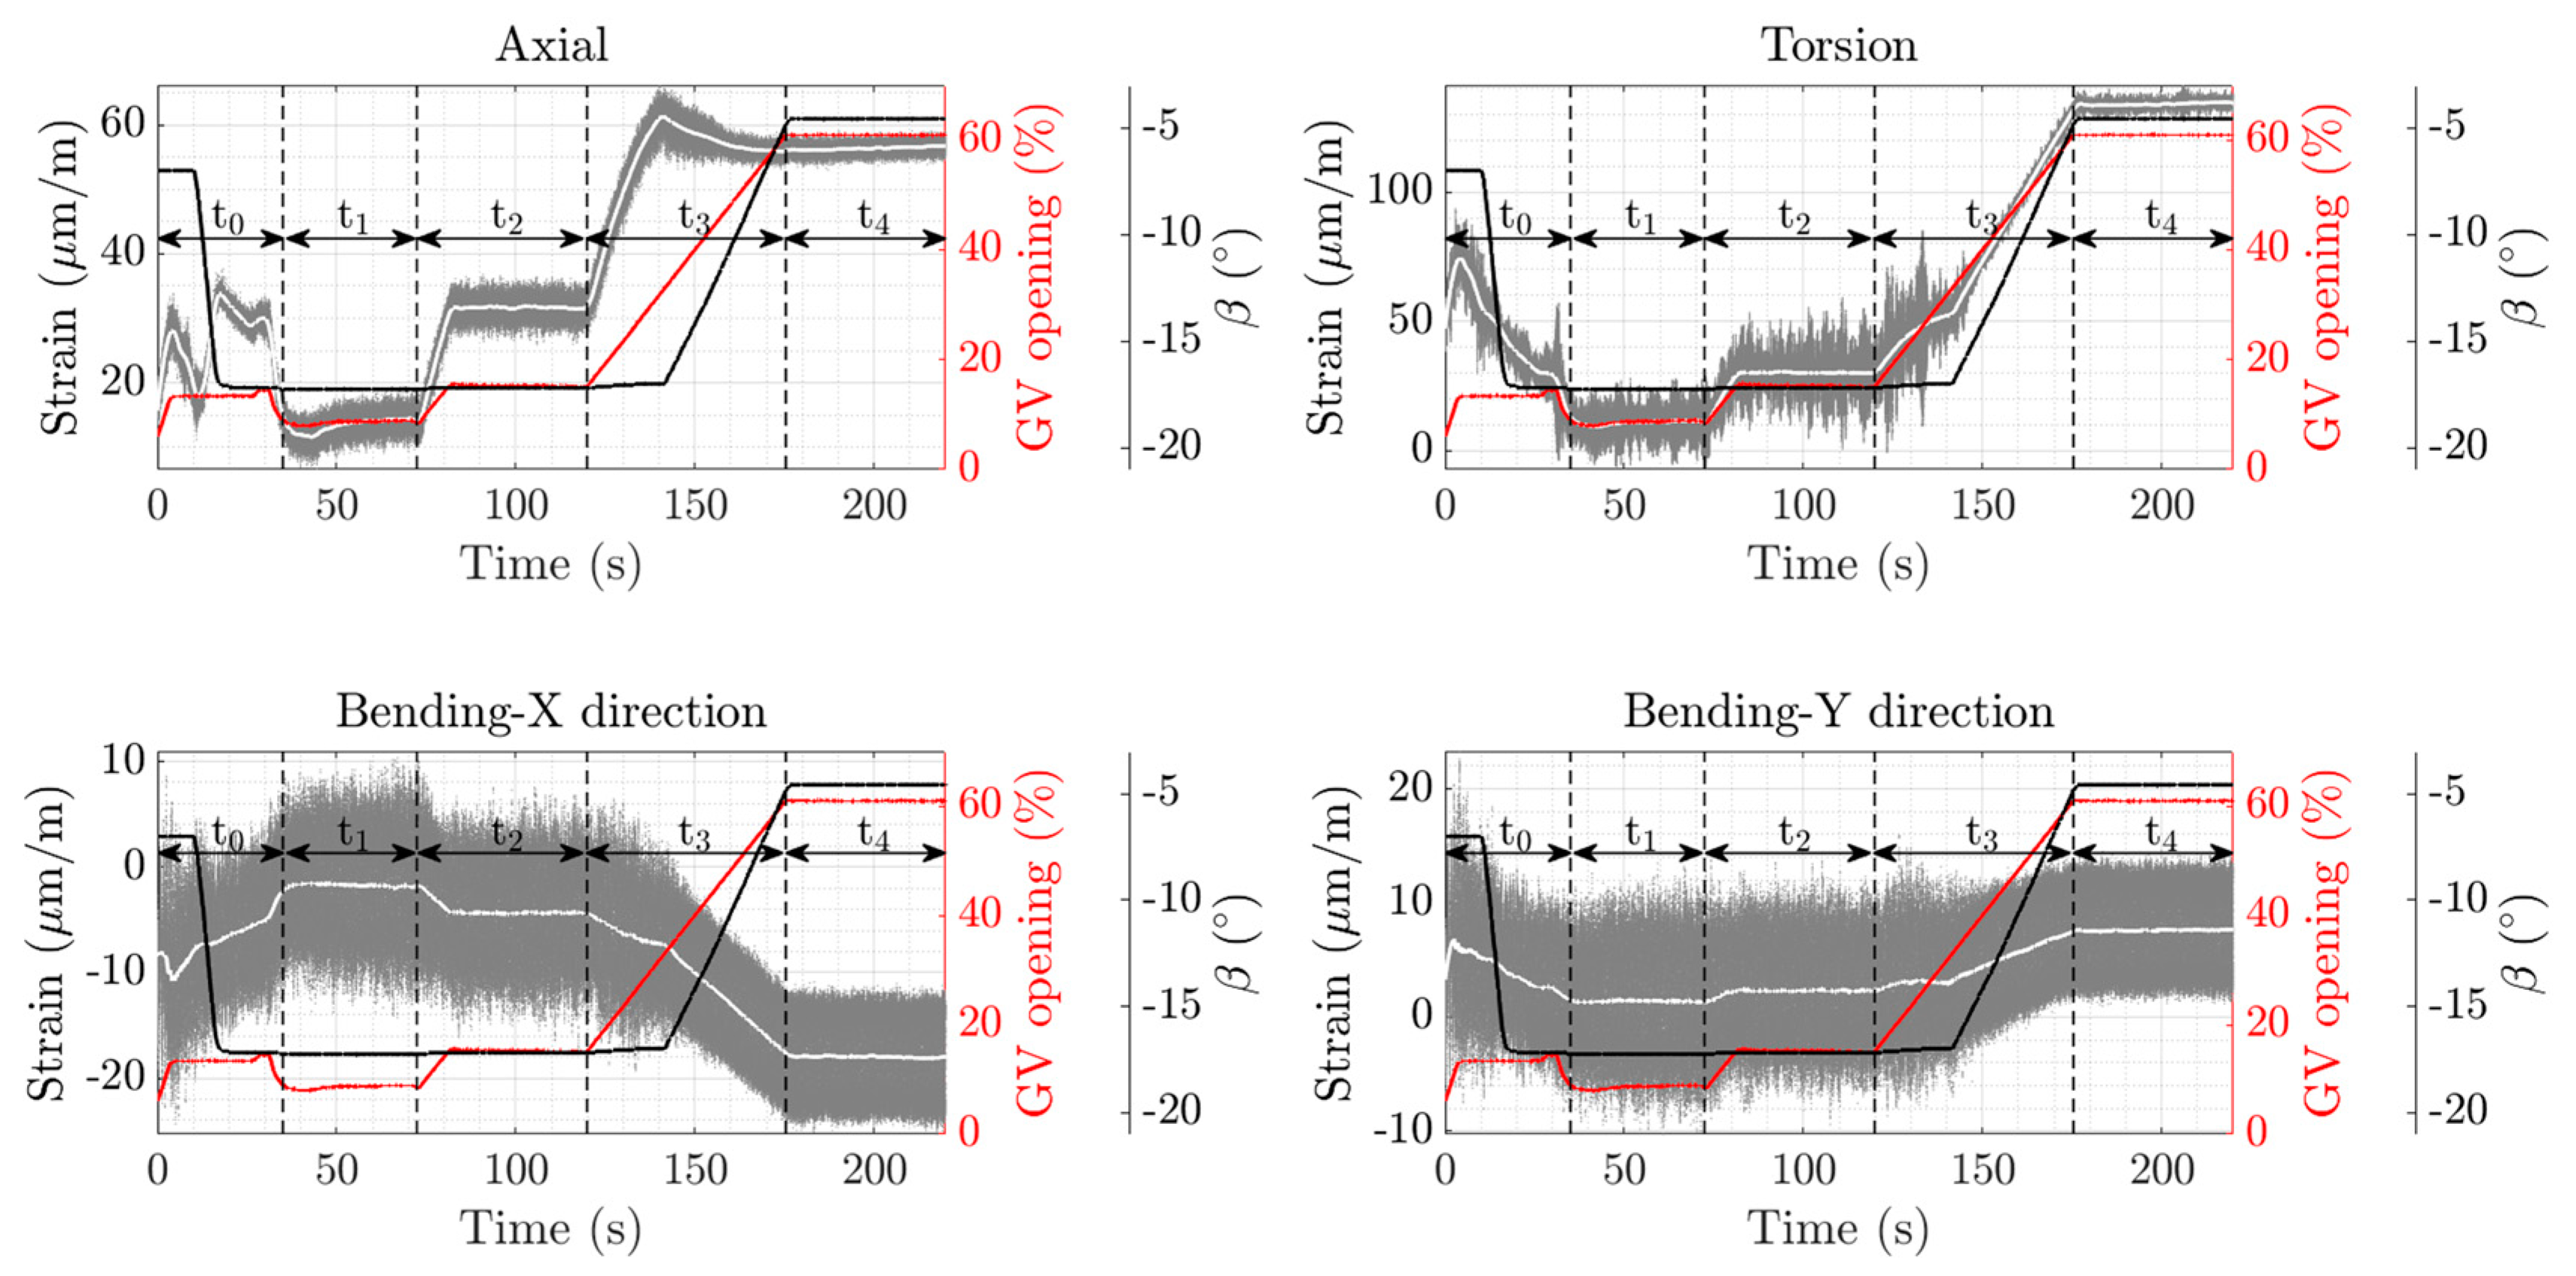
Figure 4 presents the variation in the axial strain, torsion strain and bending strain in the X and Y direction on the shaft. The vertical black dashed lines divide each stage of the start-up operation. In the first stage, three peaks can be observed in the axial strain. The axial strain increases by opening the guide vanes, and the first peak occurs when the guide vane opening reaches the opening limit at t = 3 s. Thereafter, the axial strain decreases because the blade angle and guide vane opening are constant and the pressure difference between the blade pressure and suction side decreases. By decreasing the runner blade angle, the axial strain is increased and the second peak occurs at approximately t = 18 s where the blade angle reaches the minimum value. This outcome occurs because the projected area of the runner increases by closing the runner blades. Then, the runner accelerates, and the strain decreases as the flow stabilizes with the constant guide vane opening and runner blade angle. A small variation in the strain is observed by changing the guide vane opening at the end of the first stage. During the second and third stages (i.e., speed-no-load and generator magnetization, respectively), the axial strain follows the movement of the guide vanes because the runner blade angle is fixed. This continues during the fourth stage until the runner blade angle increases, which decreases the axial load on the runner. This outcome shows that the axial strain on the shaft is directly proportional to the guide vane opening and inversely proportional to the blade angle. The minimum axial strain is obtained under the speed-no-load condition. Similar to the axial strain, the time-averaged torsion strain variation follows the guide vane opening except for the first stage, as the rotational speed of the turbine is not at the rated speed. The torsion strain is increased in the beginning by opening the guide vanes as the shaft startes to rotate from a still position. Then, the torsion strain is decreased by increasing the rotational speed where it reaches the synchronous speed at the end of the first stage. The minimum torsion strain is obtained during the speed-no-load phase at approximately 10
because there is no power extracted from the generator. This value mainly reflects the losses in the turbine bearings and ventilation losses in the generator. The variation of the time-averaged bending strain in the X and Y directions follows the guide vane opening in all stages except for the first stage as the runner blade angle is also changed. The bending strain increases in magnitude by increasing the guide vane opening and decreases by lowering the opening. The bending strain in both directions instantly increases by opening the guide vane from the completely closed position. Then, it is decreased until the end of the first stage. This outcome shows that the lateral forces acting on the runner blade are high at the beginning of the start-up phase compared to those during the speed-no-load condition, which indicates a nonsymmetrical flow.
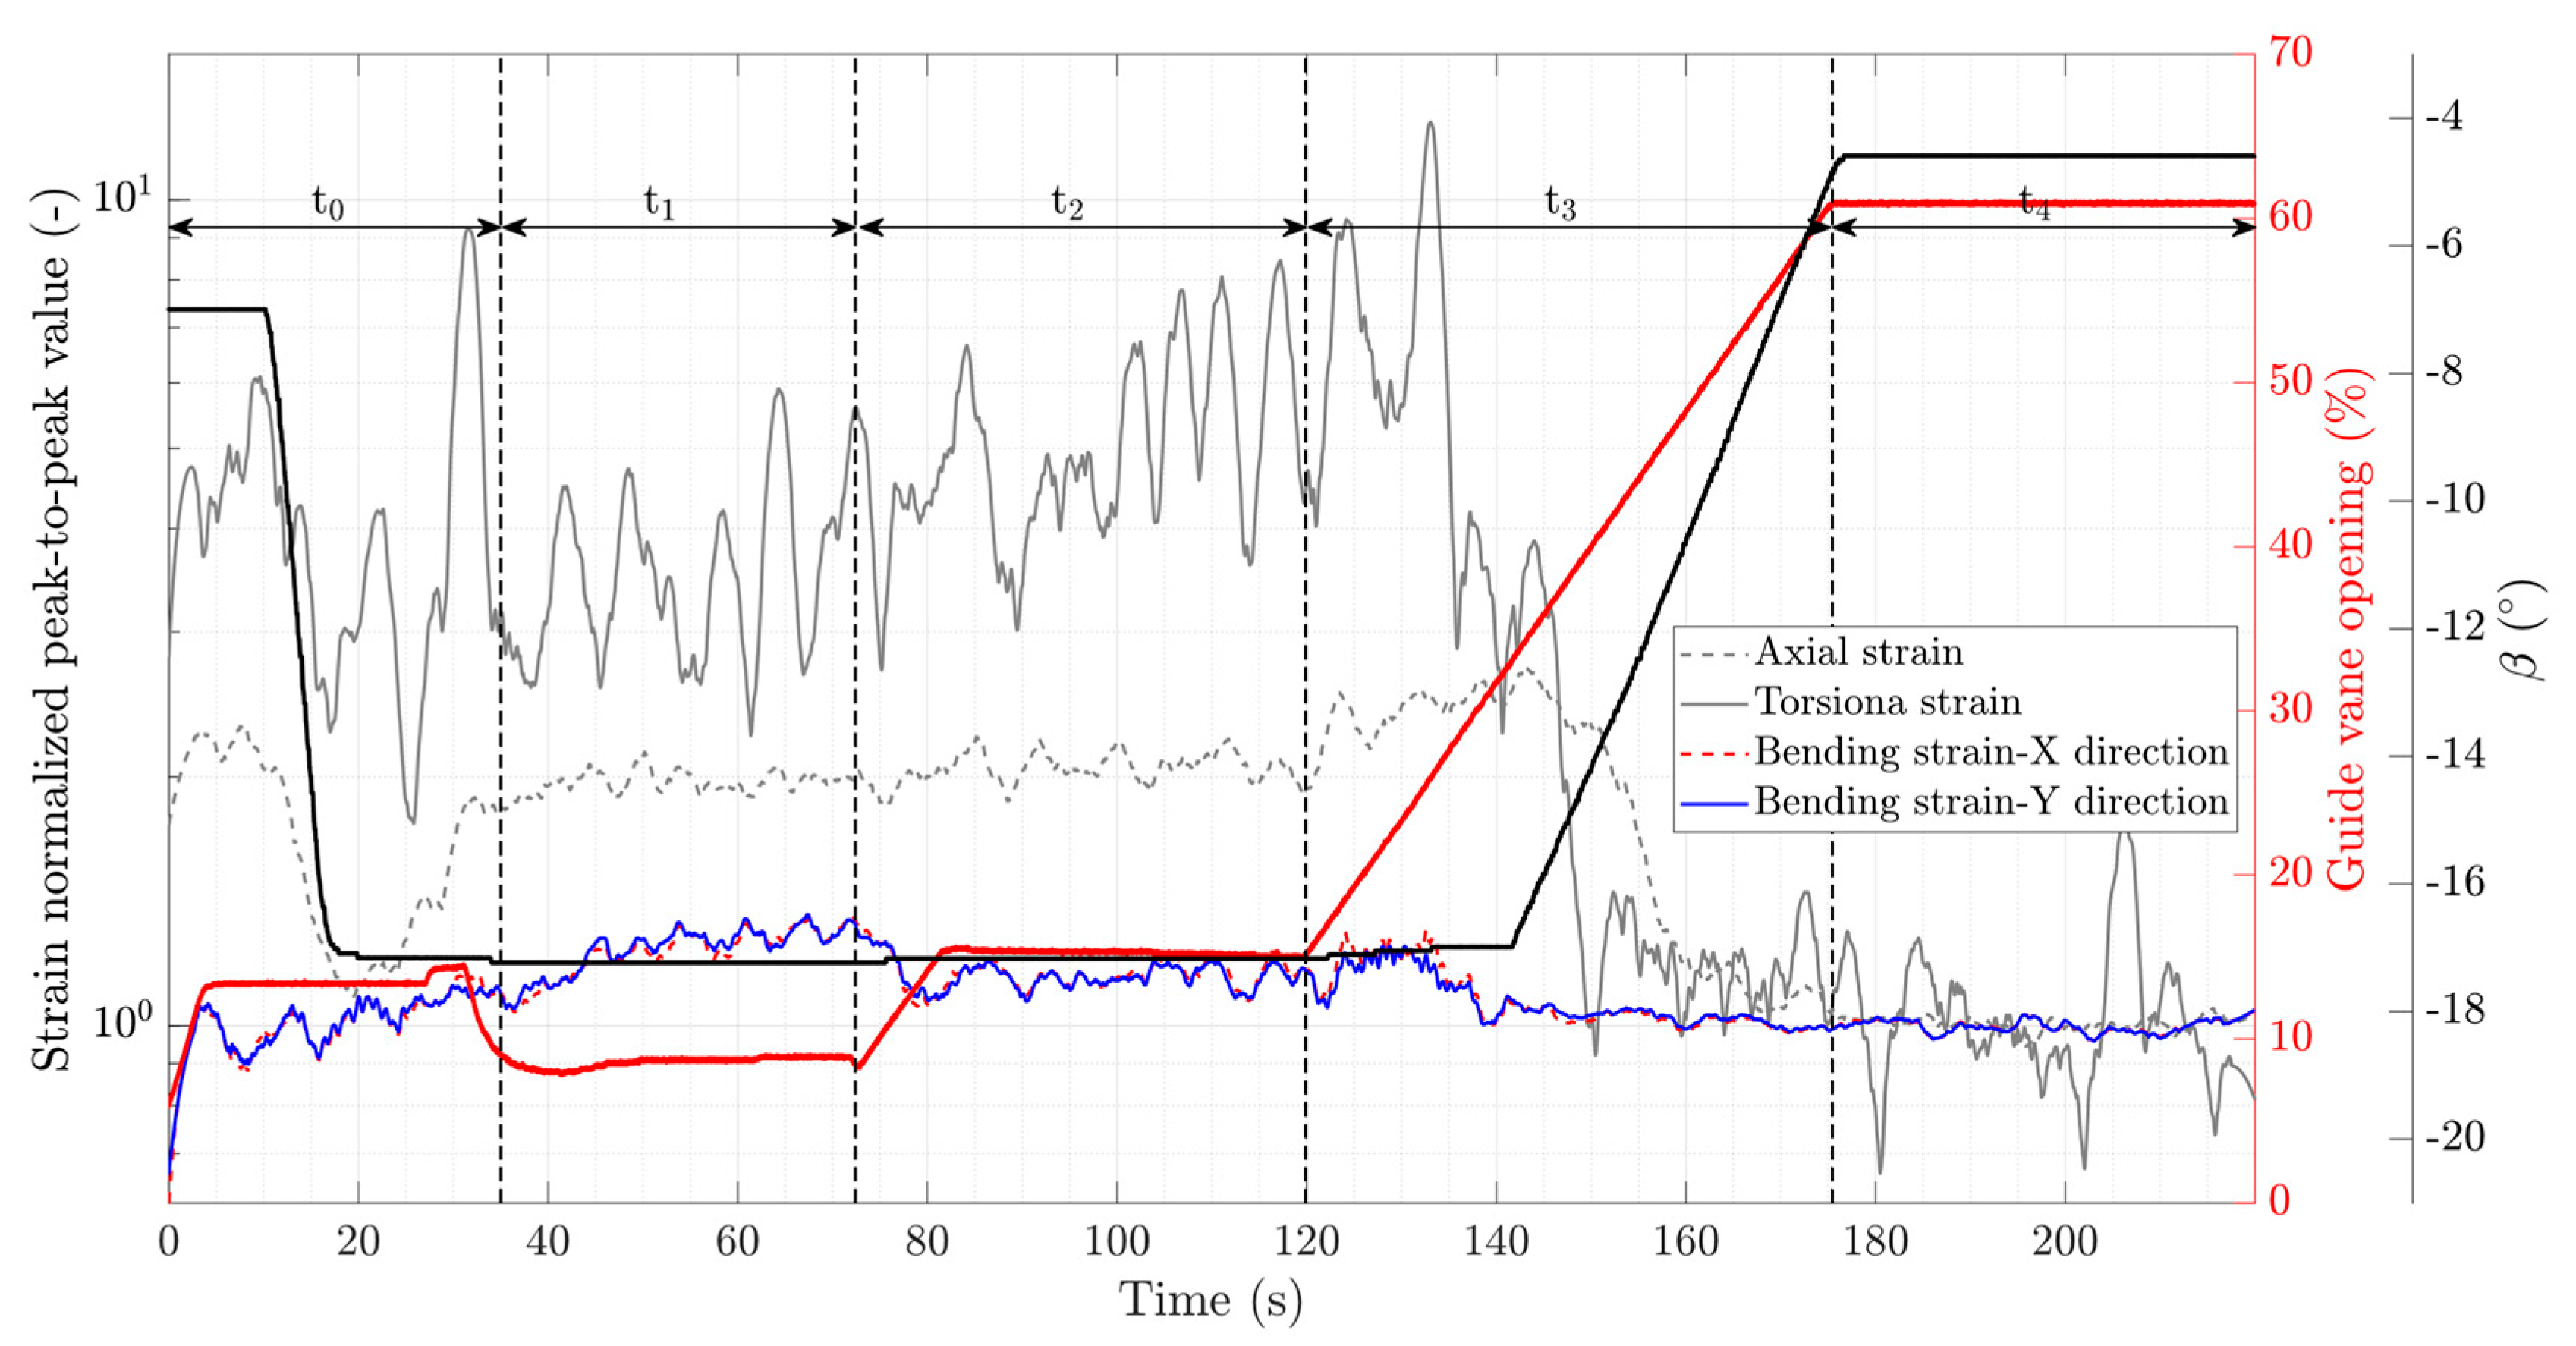
Figure 5 shows the transient variation of the normalized peak-to-peak value of the axial strain, torsion strain and bending strain in the X and Y directions on the shaft. The strain peak-to-peak values were normalized using the average value of each strain data obtained during the steady-state operation reached at the end of the transient. The average peak-to-peak value of axial strain, torsion strain and bending strain in the X and Y directions in the steady-state operation are 1.25, 2.80, 7.40 and 7.06
, respectively. Large variations in the normalized peak-to-peak value are observed in the torsion strain compared to the axial and bending strains. A high peak is observed at the end of the first stage during a small change in the guide vane opening before reaching the speed-no-load phase. The peak-to-peak value gradually increases after magnetization and reaches the maximum value at t = 133 s, which is approximately 12 times that of the steady-state, when the guide vanes opening increases and the runner blades are still at the minimum angle. The level of the strain fluctuation amplitude is considerably lowered after adjusting the runner blade angle at t = 150 s. No significant bending strain fluctuations in the X and Y directions are observed during the start-up compared to the steady-state operation. The axial strain fluctuation level decreases by decreasing the runner blade angle during the first phase of the start-up. A constant level of fluctuation is observed during the speed-no-load and generator magnetization phases. Then, it slightly increases by further opening the guide vanes as the runner blades are at the minimum opening. Thereafter, it reaches the minimum level as the runner blade angle is adjusted.
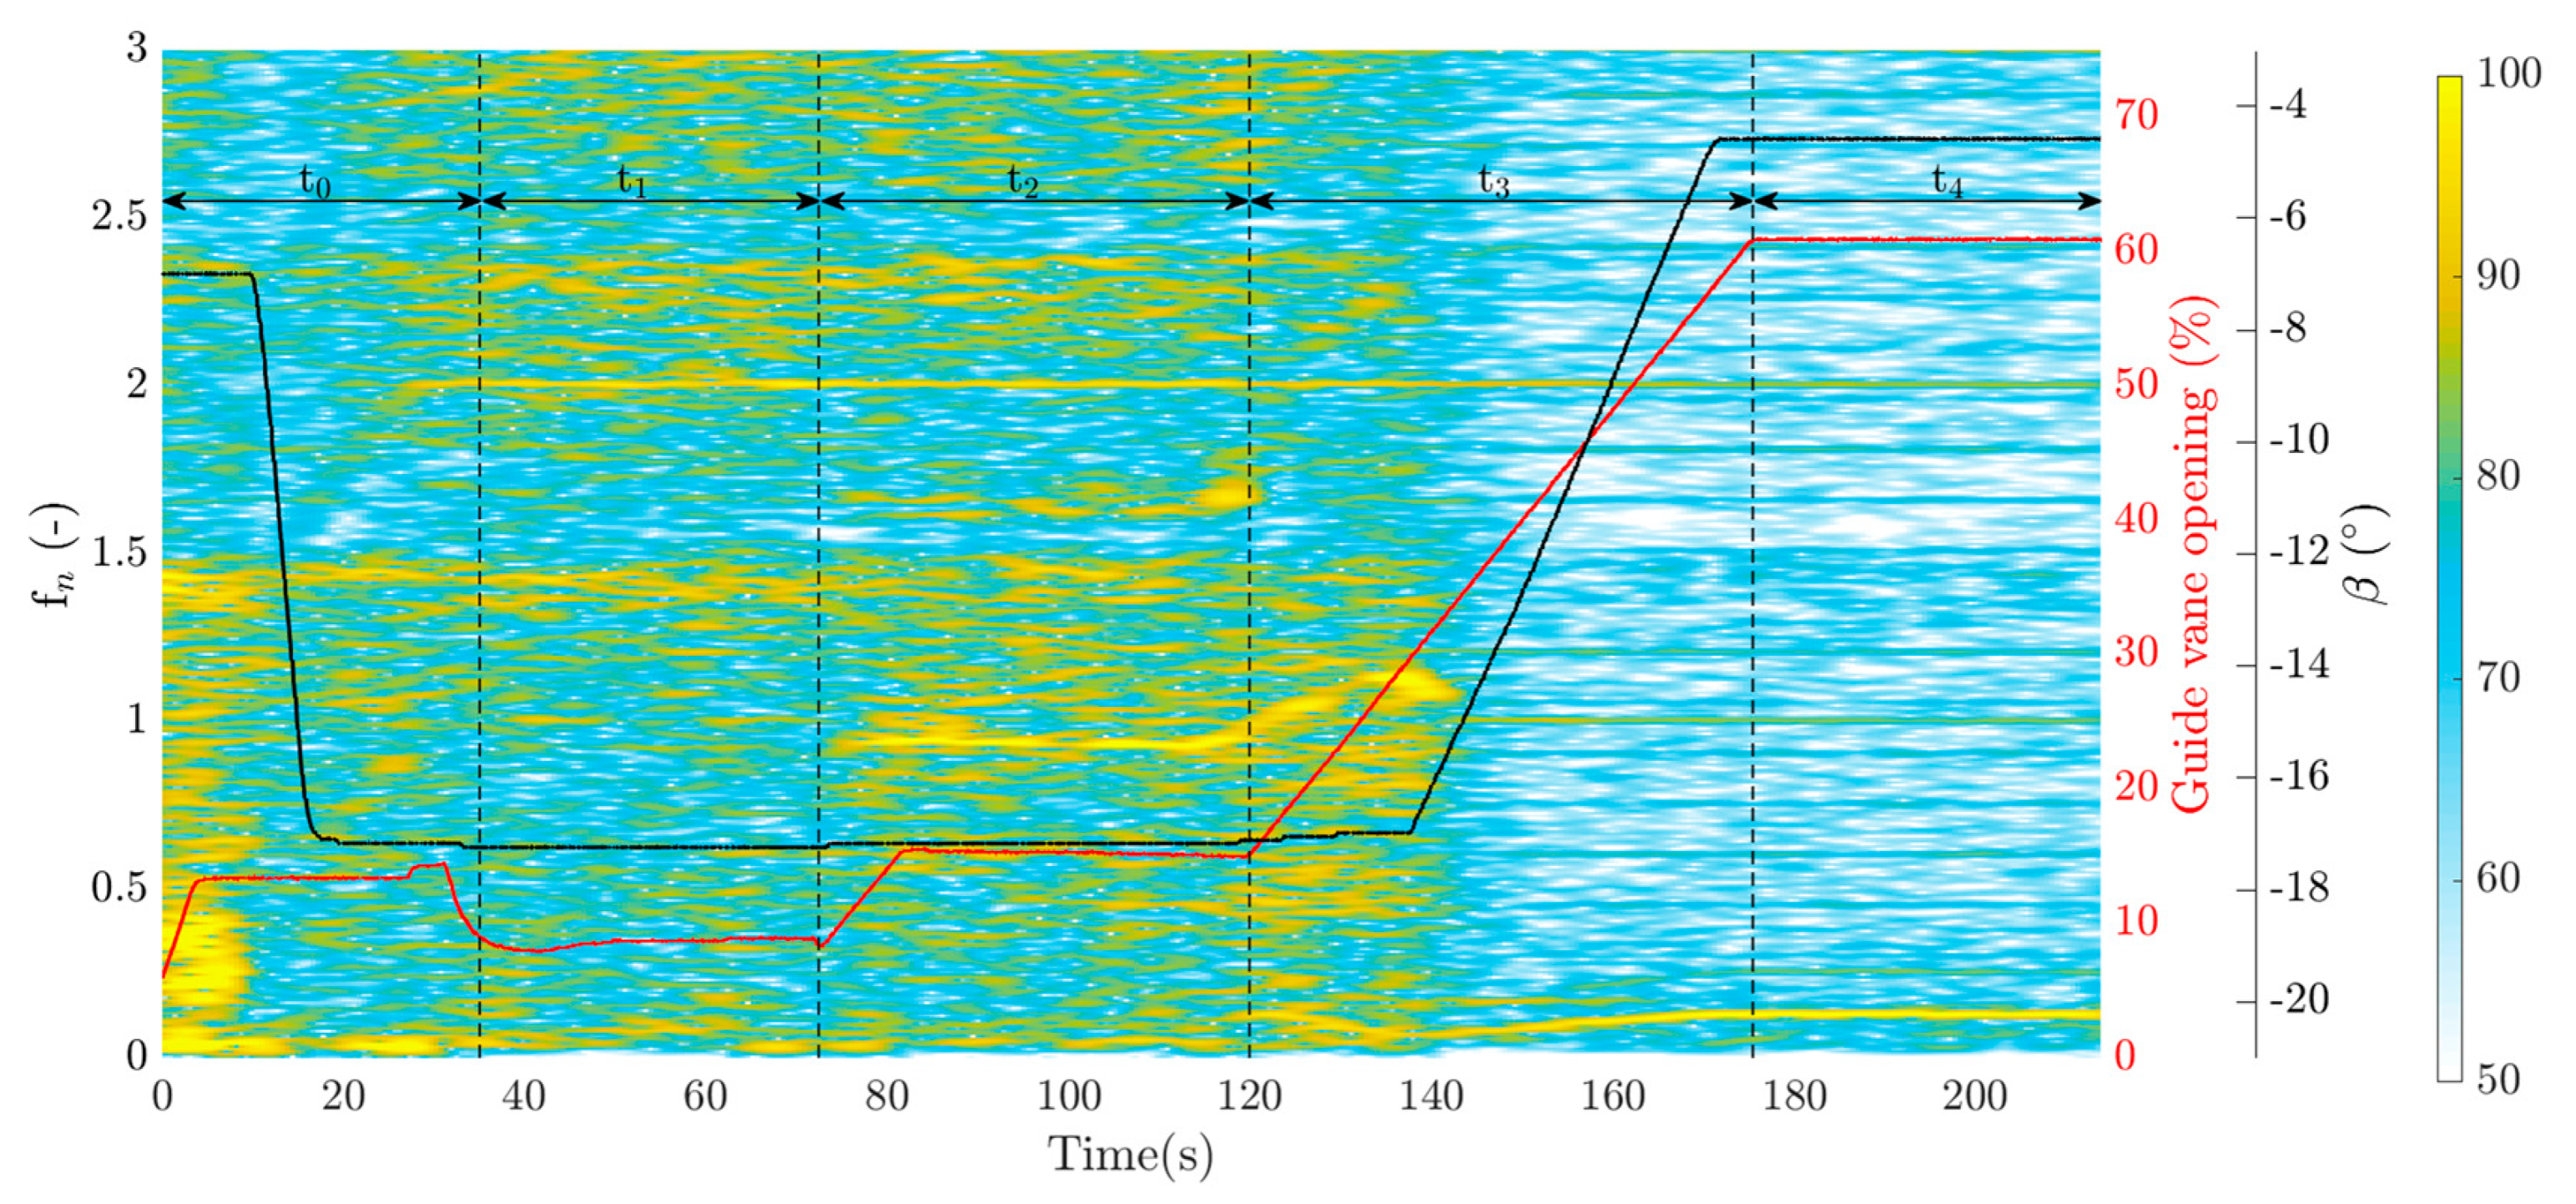
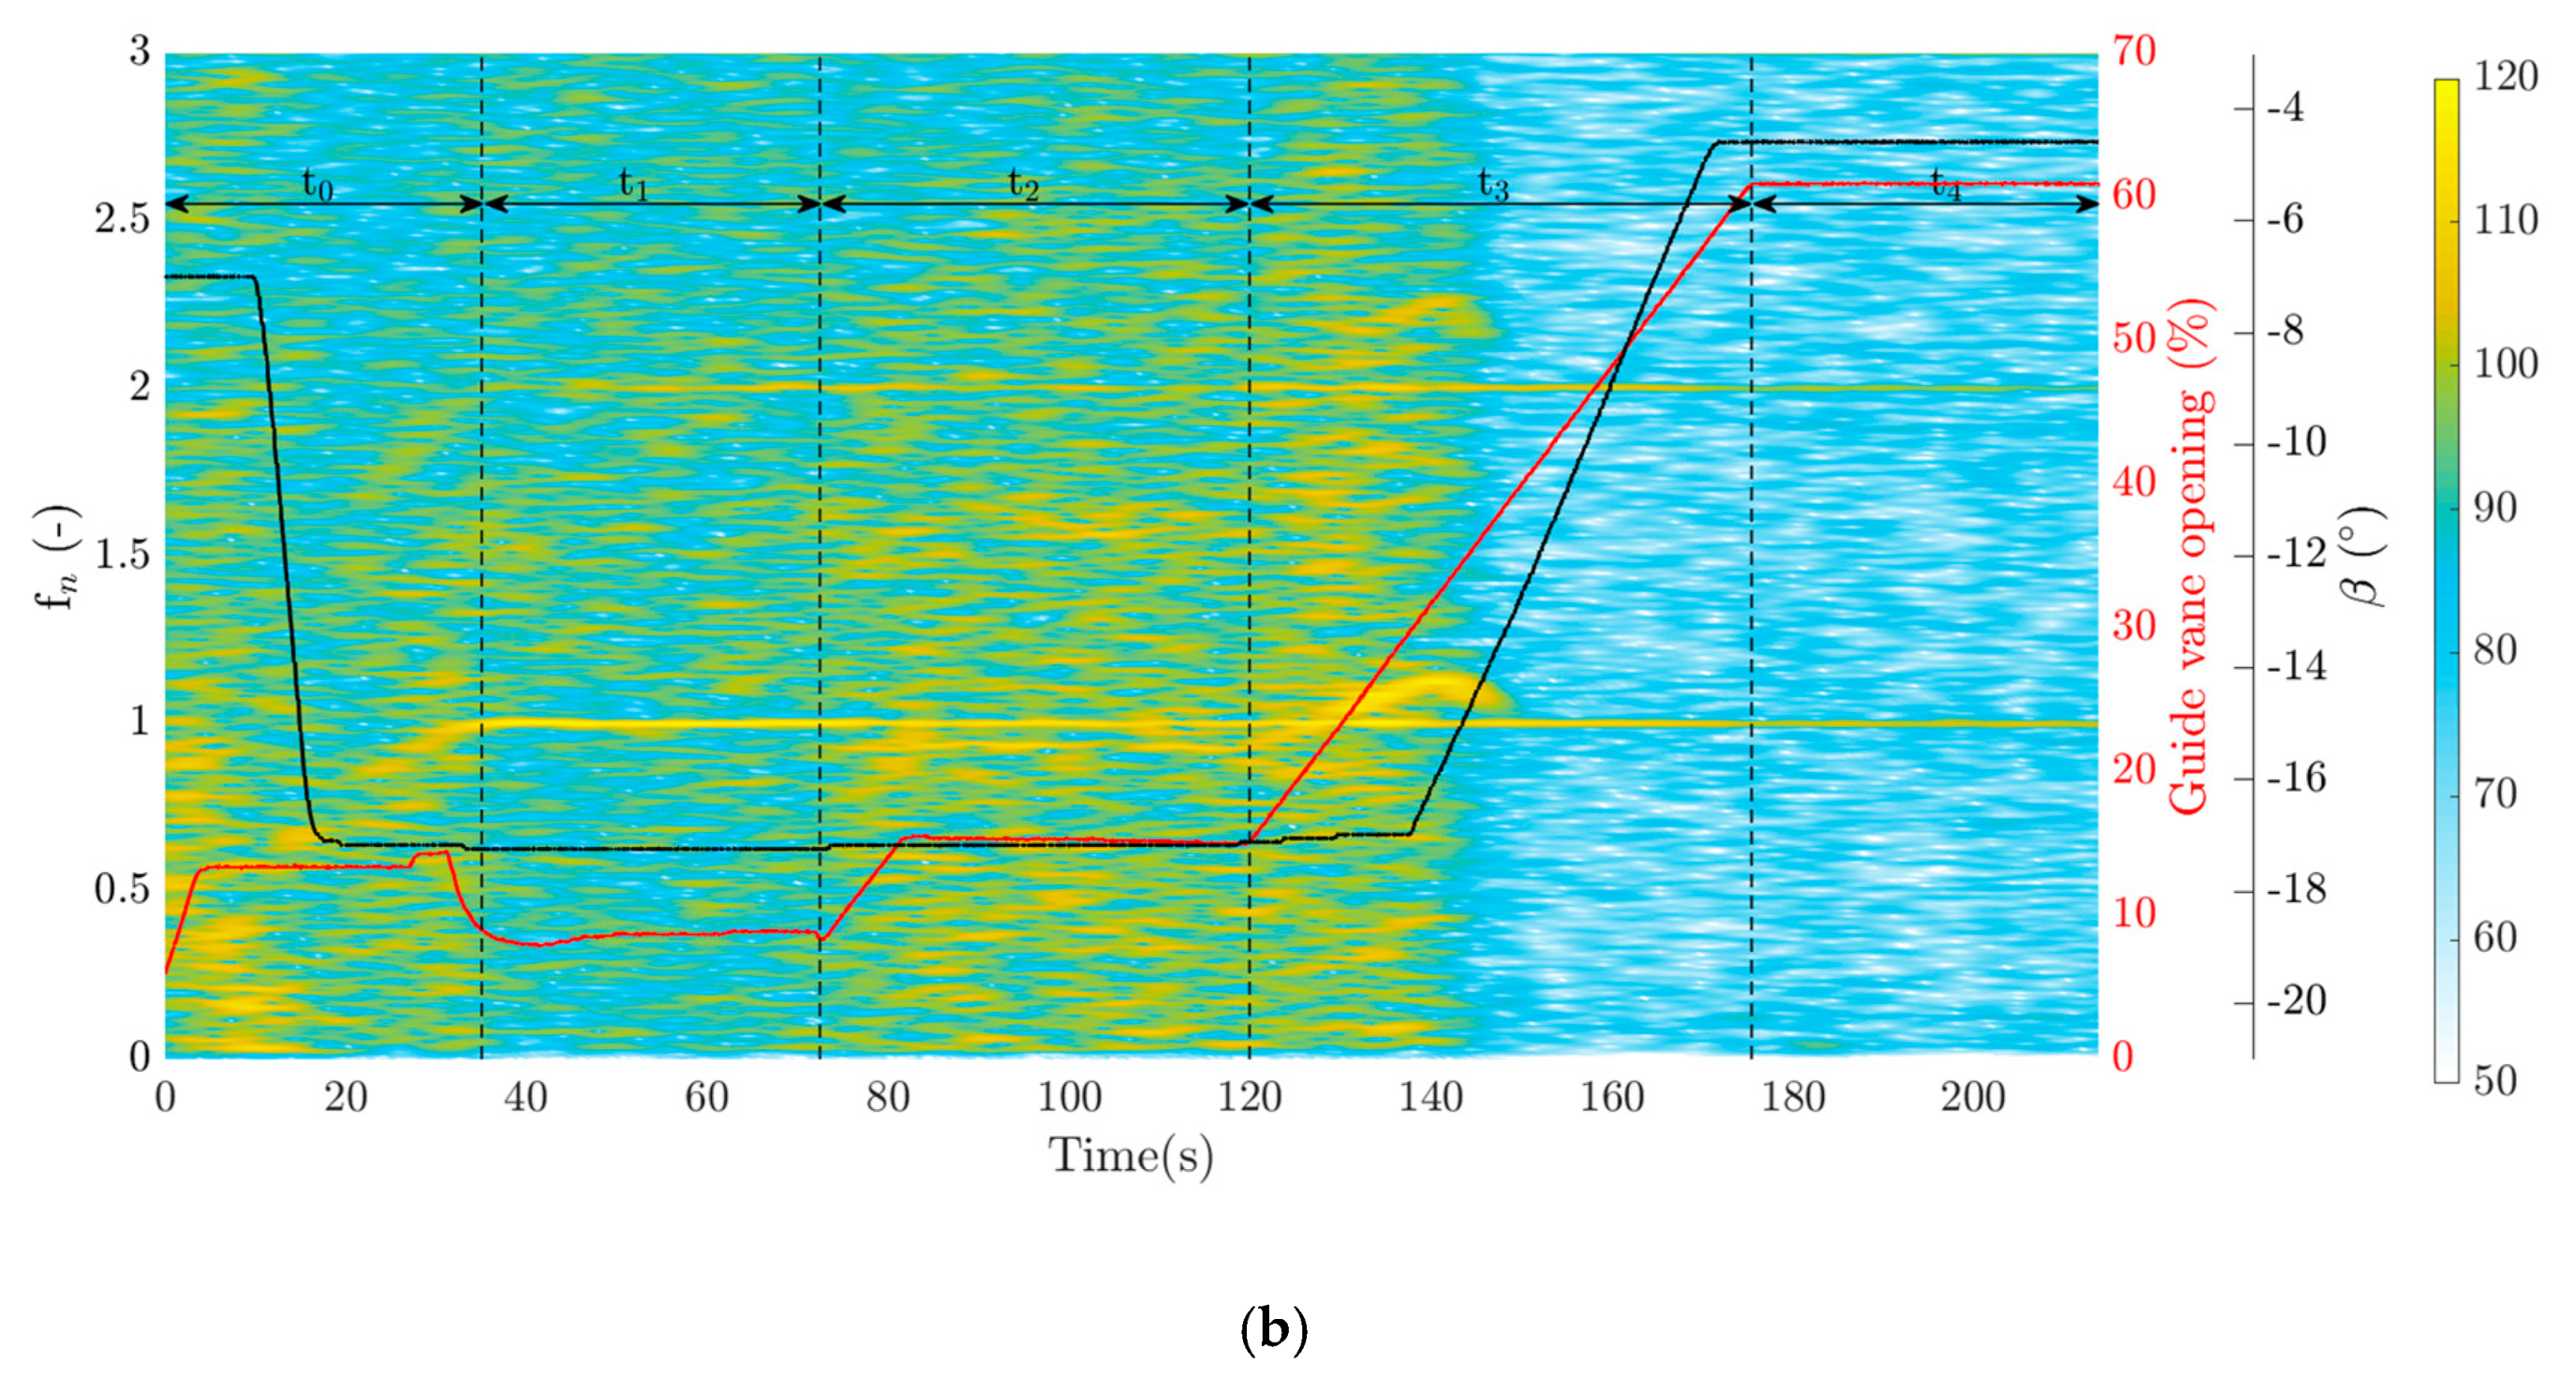
Figure 6 shows the power spectra of the axial strain data obtained from the shaft during the start-up operation. Low-frequency fluctuations are observed in the normalized frequency range of 0–1.5 (0–15 Hz) at the beginning of the start-up, 0–10 s. The runner blade angle is constant, −7°, and guide vanes are opened from the closed position to 14%. The low guide vane angle creates a large swirling flow in the vaneless space with recirculation, which might be the cause of these high random fluctuations. High shear flow and turbulence level occurs during low guide vane opening and runner blade angle. A dominant normalized frequency of 2 is observed in the spectrogram, which appears when the runner rotational speed is close to the synchronous speed, at t = 30 s. This dominant frequency might be attributed to the runner blade configuration consisting of two runner blades; one blade was instrumented with transducers, and the other blade with only an epoxy to balance the runner. Except for this frequency, no significant dominant frequency in the low-frequency region is observed during the speed-no-load operation. A dominant normalized frequency appears after generator loading (
), t = 80–120 s; the frequency varies by changing the guide vane opening and runner blade angle. Later, one can see this dominant frequency in the pressure data on the runner blade pressure side and strain results on the runner blade. Houde et al. [
30] reported a dominant frequency below the runner rotational frequency (
), which results from the rotating stall being linked to vortical flow structures in the vaneless space at speed-no-load. The number of these structures can be altered by the guide vane opening, as described in [
31], which can result in different dominant frequencies. The dominant frequency and energy intensity slightly increase at t = 120–150 s. The variation of this dominant frequency is accompanied by the variation of another low frequency (approximately
) at the same time period but in the opposite direction, which indicates a coupling between them.
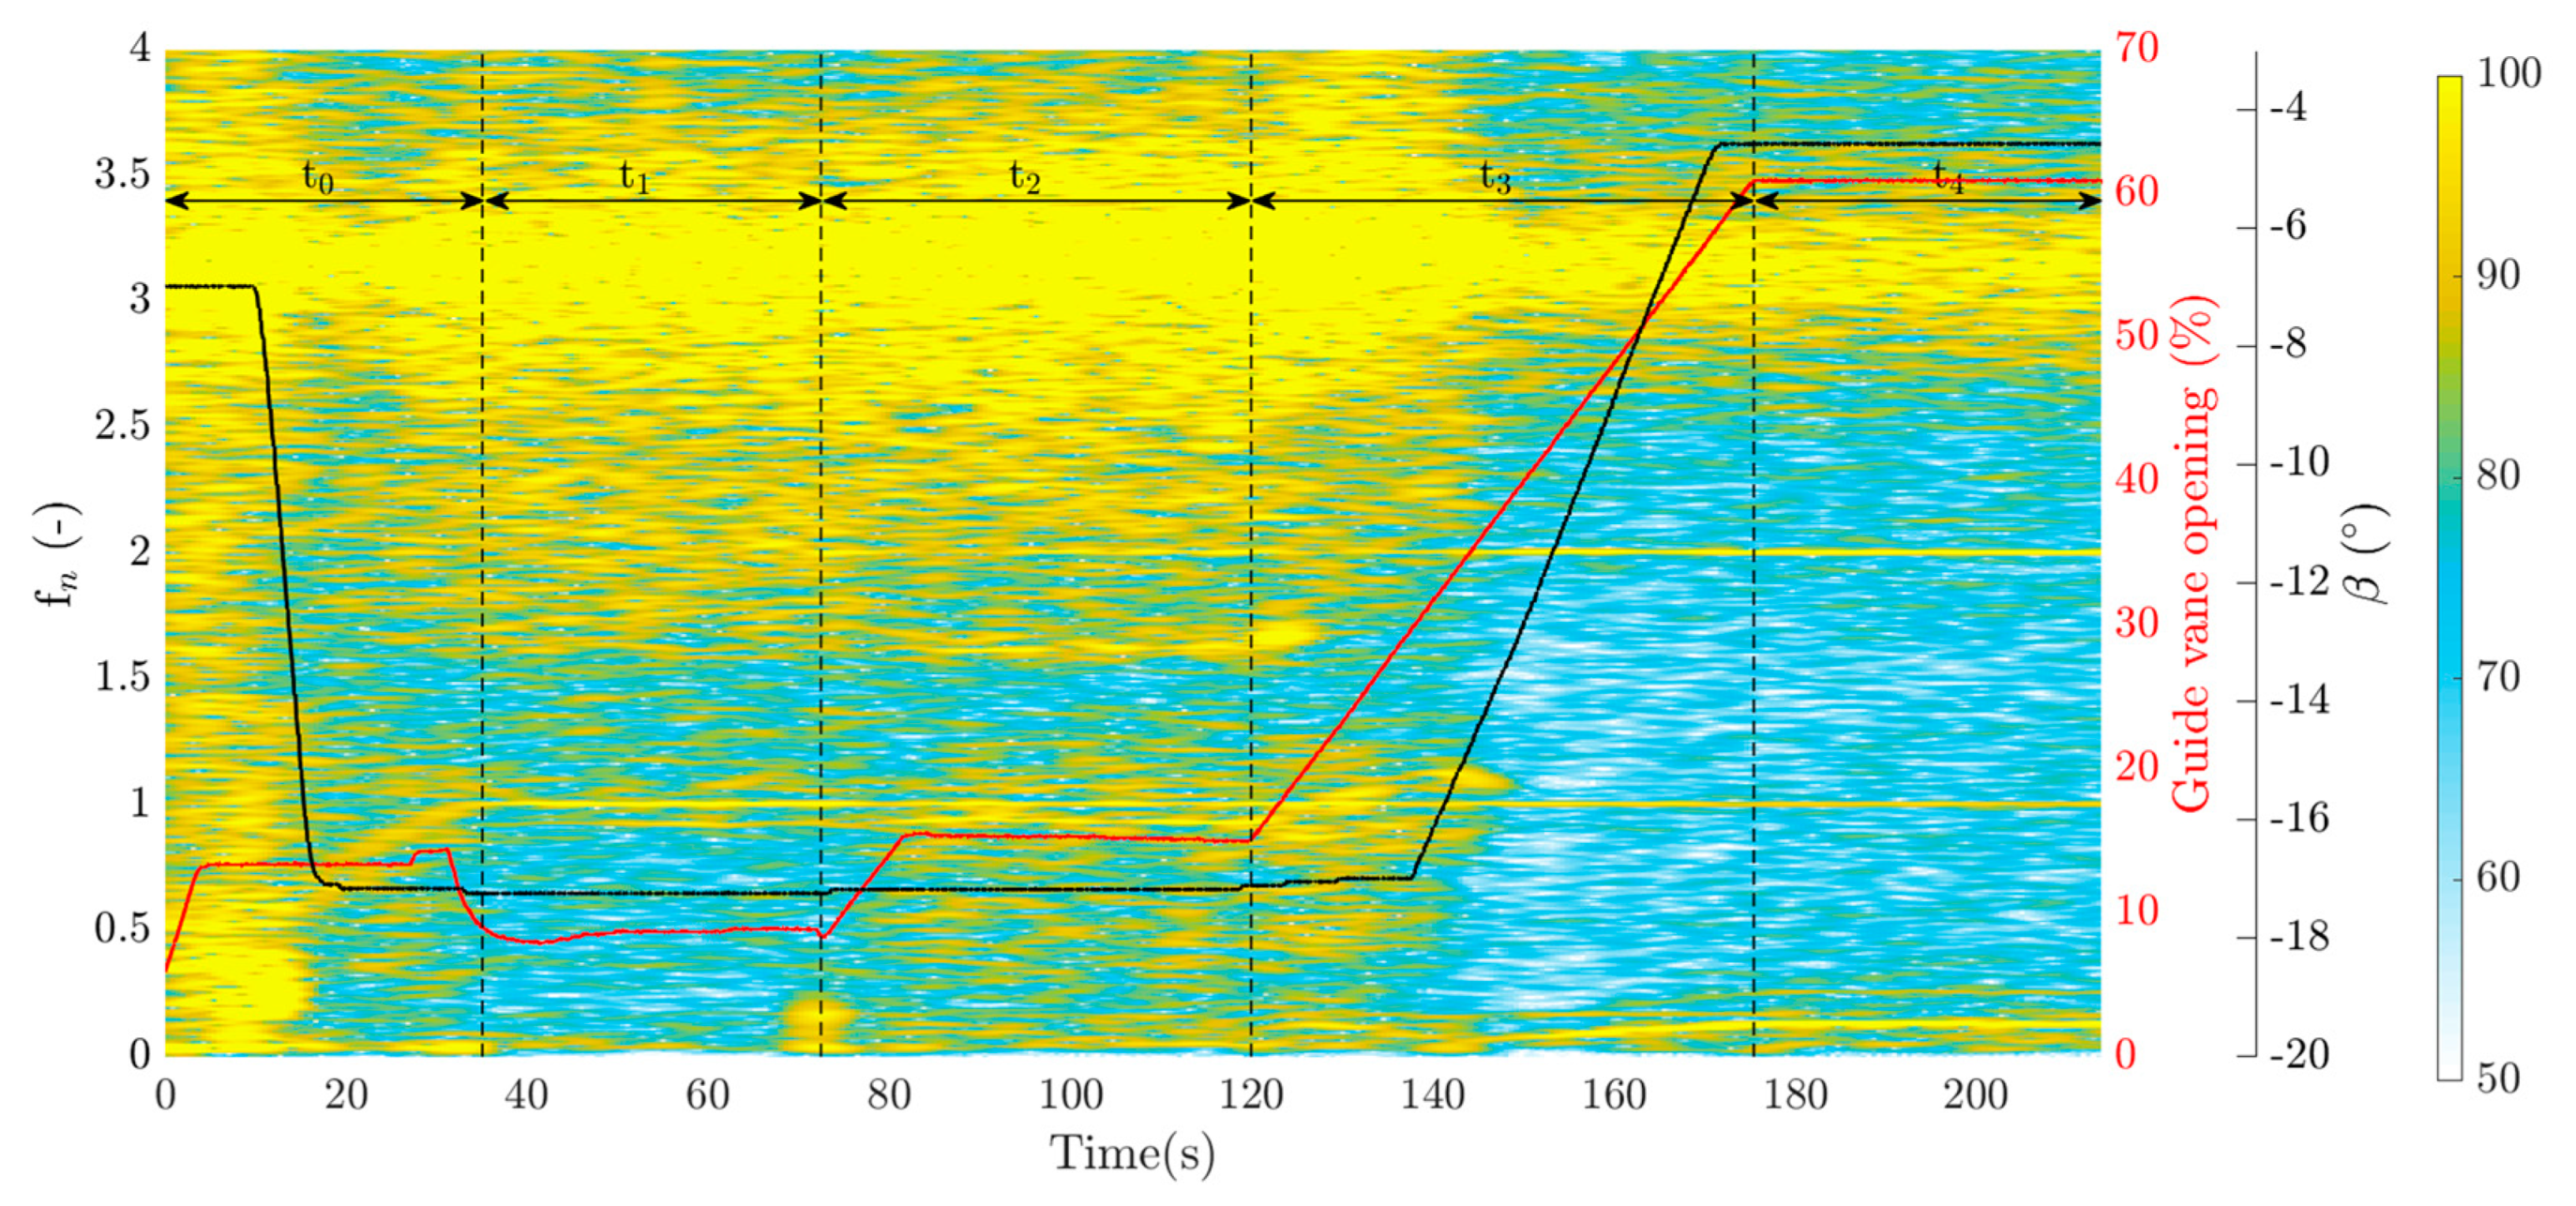
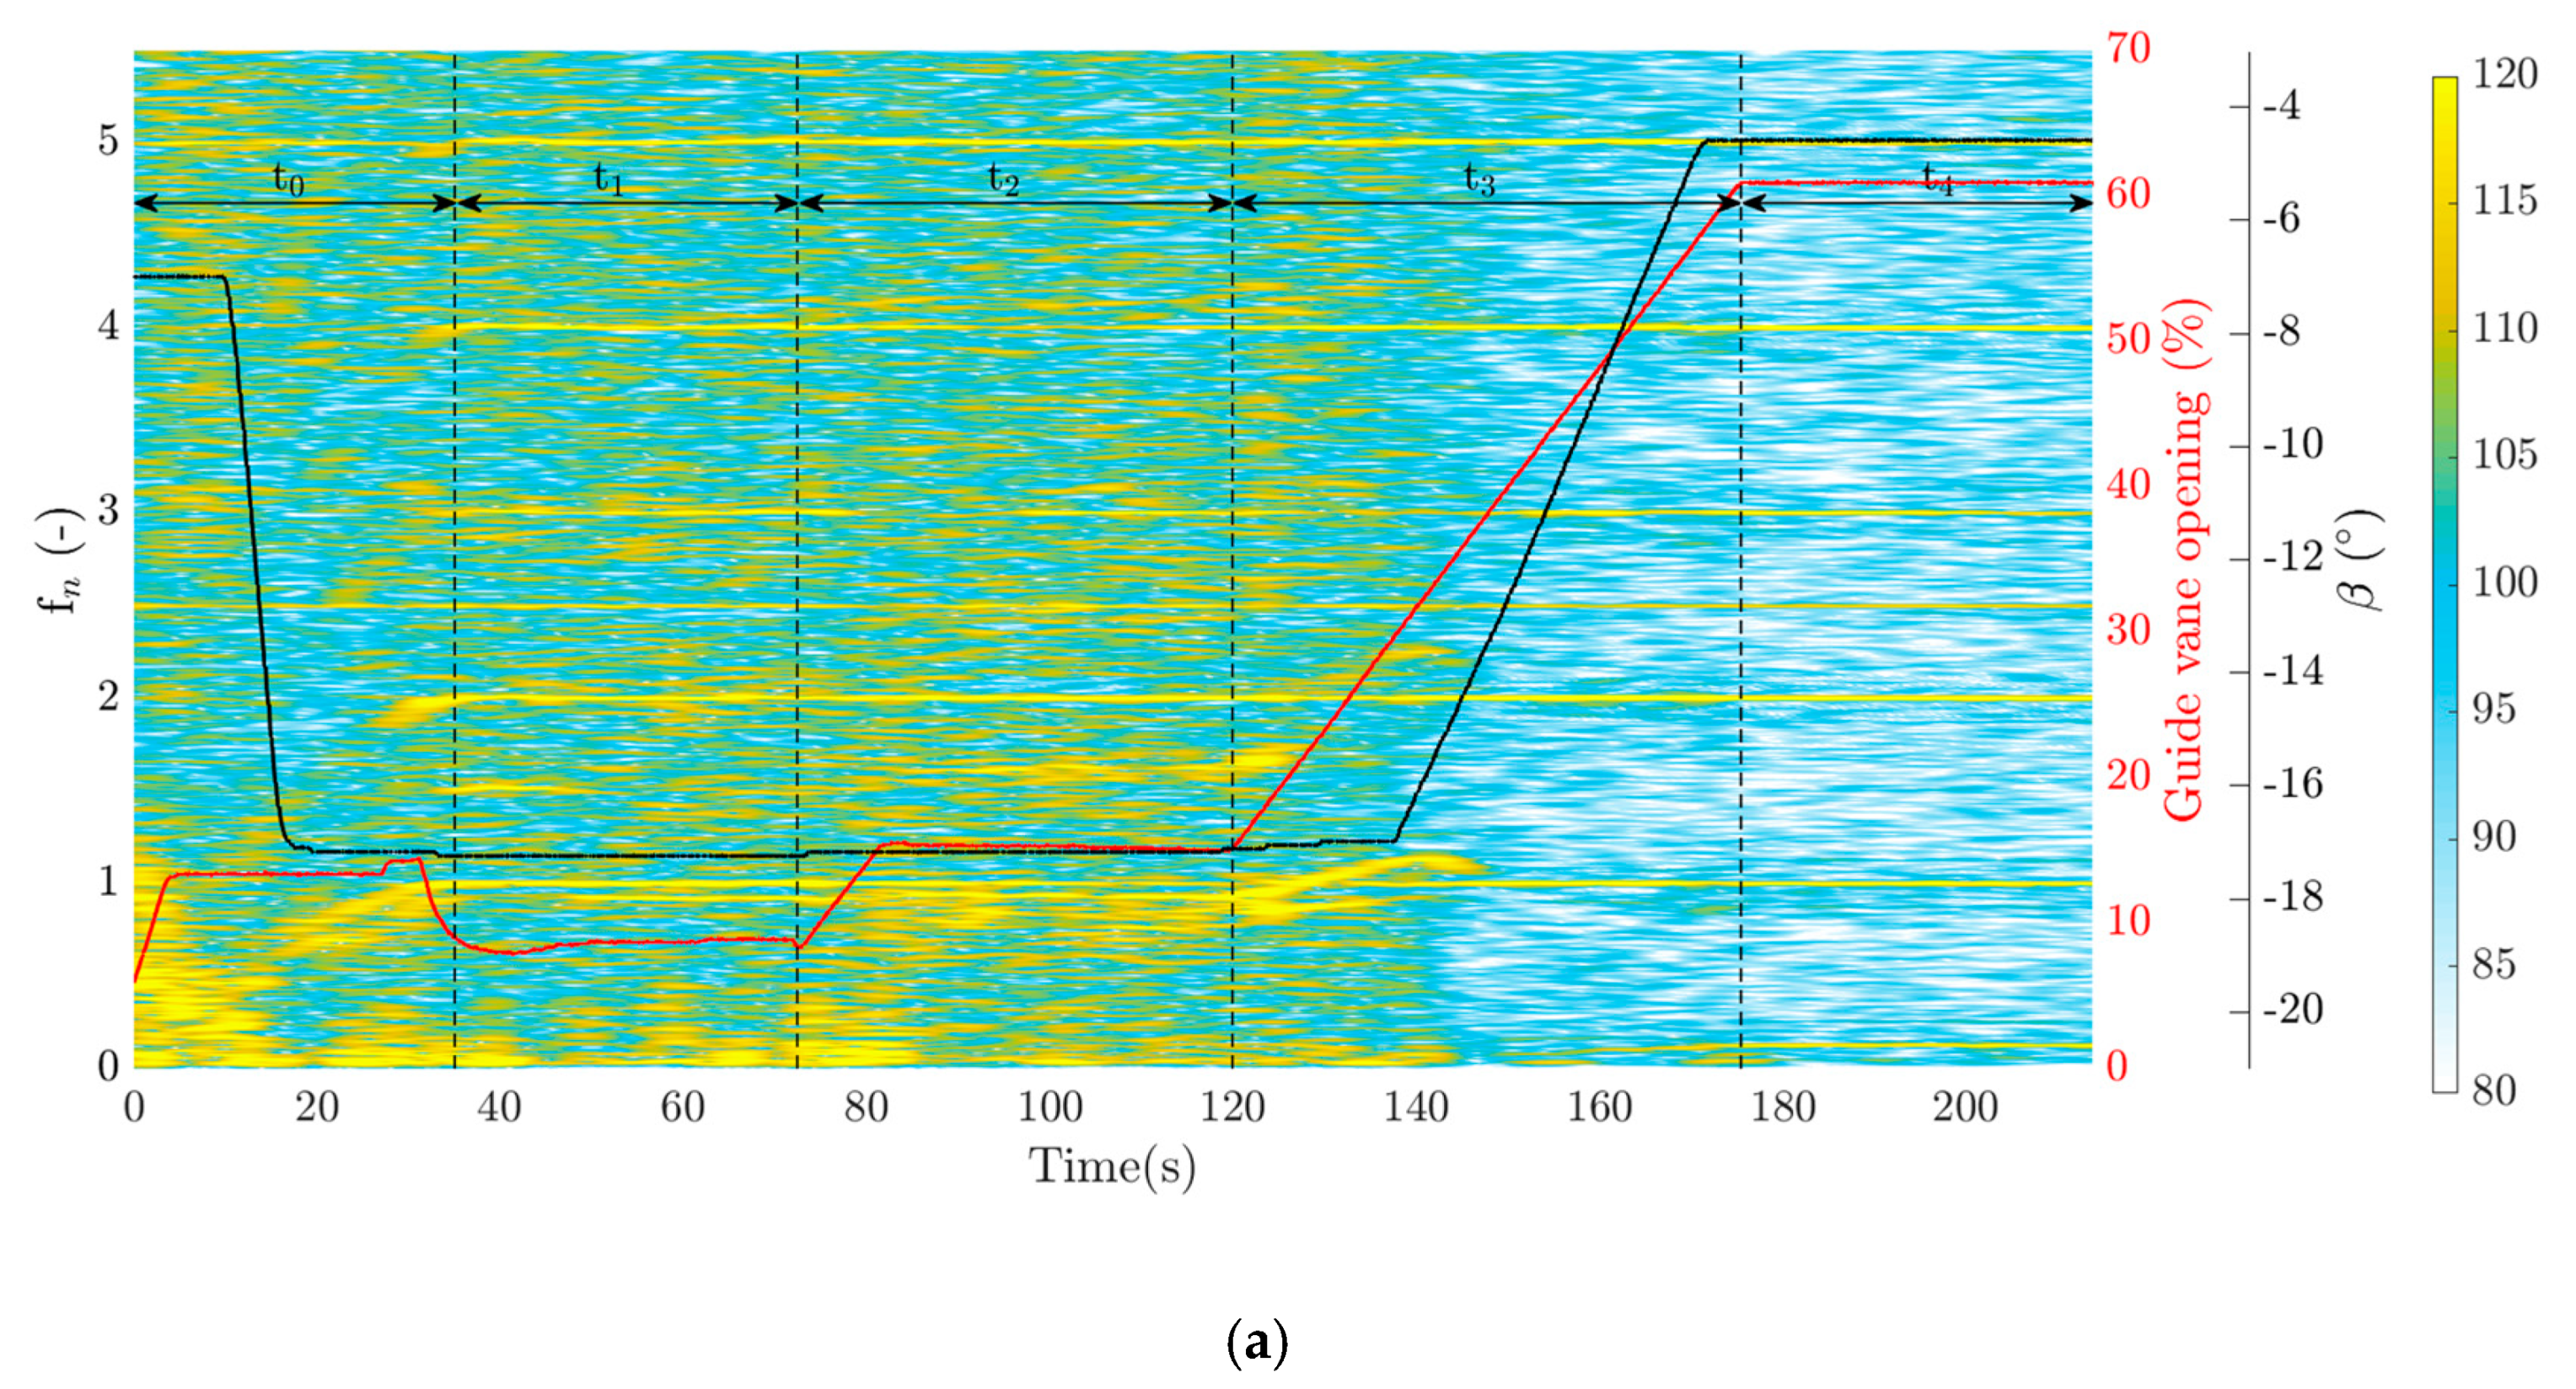
The frequency spectra of the torsion strain data obtained from the shaft are shown in
Figure 7. Most of the energy in the spectrogram is accumulated around the region within
. These fluctuations start from the beginning of the start-up and continues until t = 140 s, where the runner blade angle is adjusted by the governor according to the given guide vane opening. Thereafter, the high-intensity region narrows and appears around
. This frequency corresponds to the first torsional mode of the shaft. Similar to the axial strain spectrogram, the low-frequency fluctuations are observed at the beginning of the start-up until t = 15 s. Similar to the bending strain spectrogram, an evolving dominant frequency could be seen that follows the runner rotational frequency and reaches
at the end of the acceleration phase. Dominant frequencies of
and
are observed in the torsion strain spectrogram starting in the speed-no-load phase and loading the generator, respectively. These frequencies appear in the axial strain at different times;
appears during the generator magnetization phase and
appears at the end of the acceleration phase. Similar to the axial strain results, the dominant frequency of
changes with the guide vane and runner blade movement at t = 120 s. As observed in the axial strain spectrogram in
Figure 6, the variation of this dominant frequency is accompanied by another low frequency, approximately
. In addition,
is observed during
when the generator is loaded. This frequency could be attributed to the magnetic stiffness and the stiffness of the stator considering a rigid body motion.
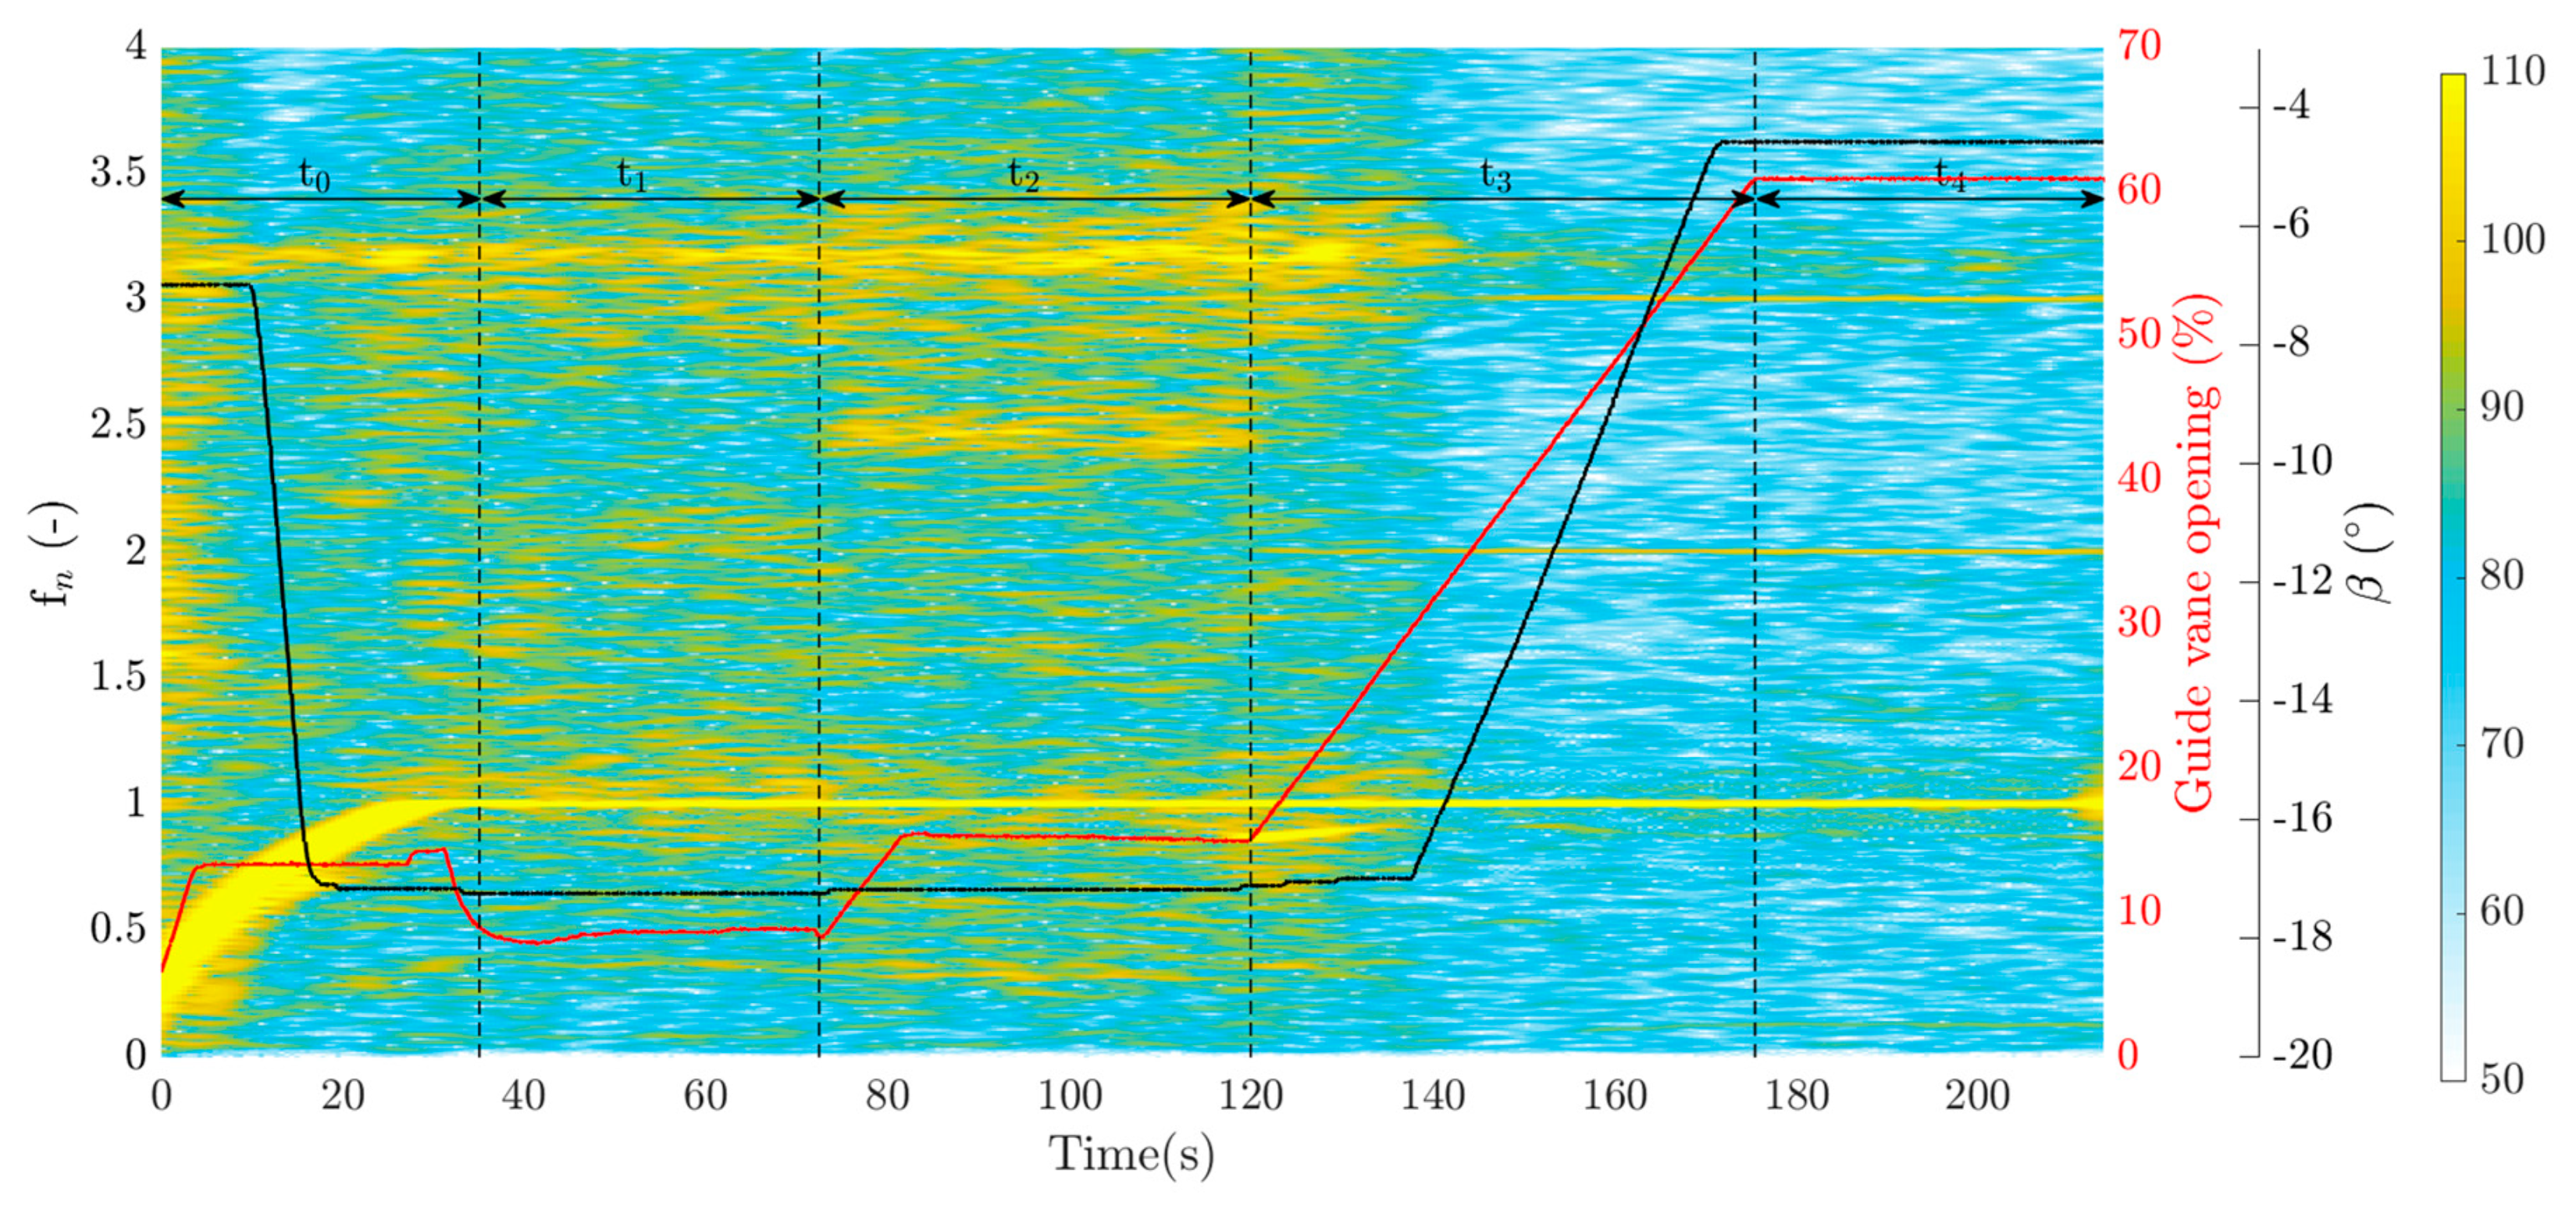
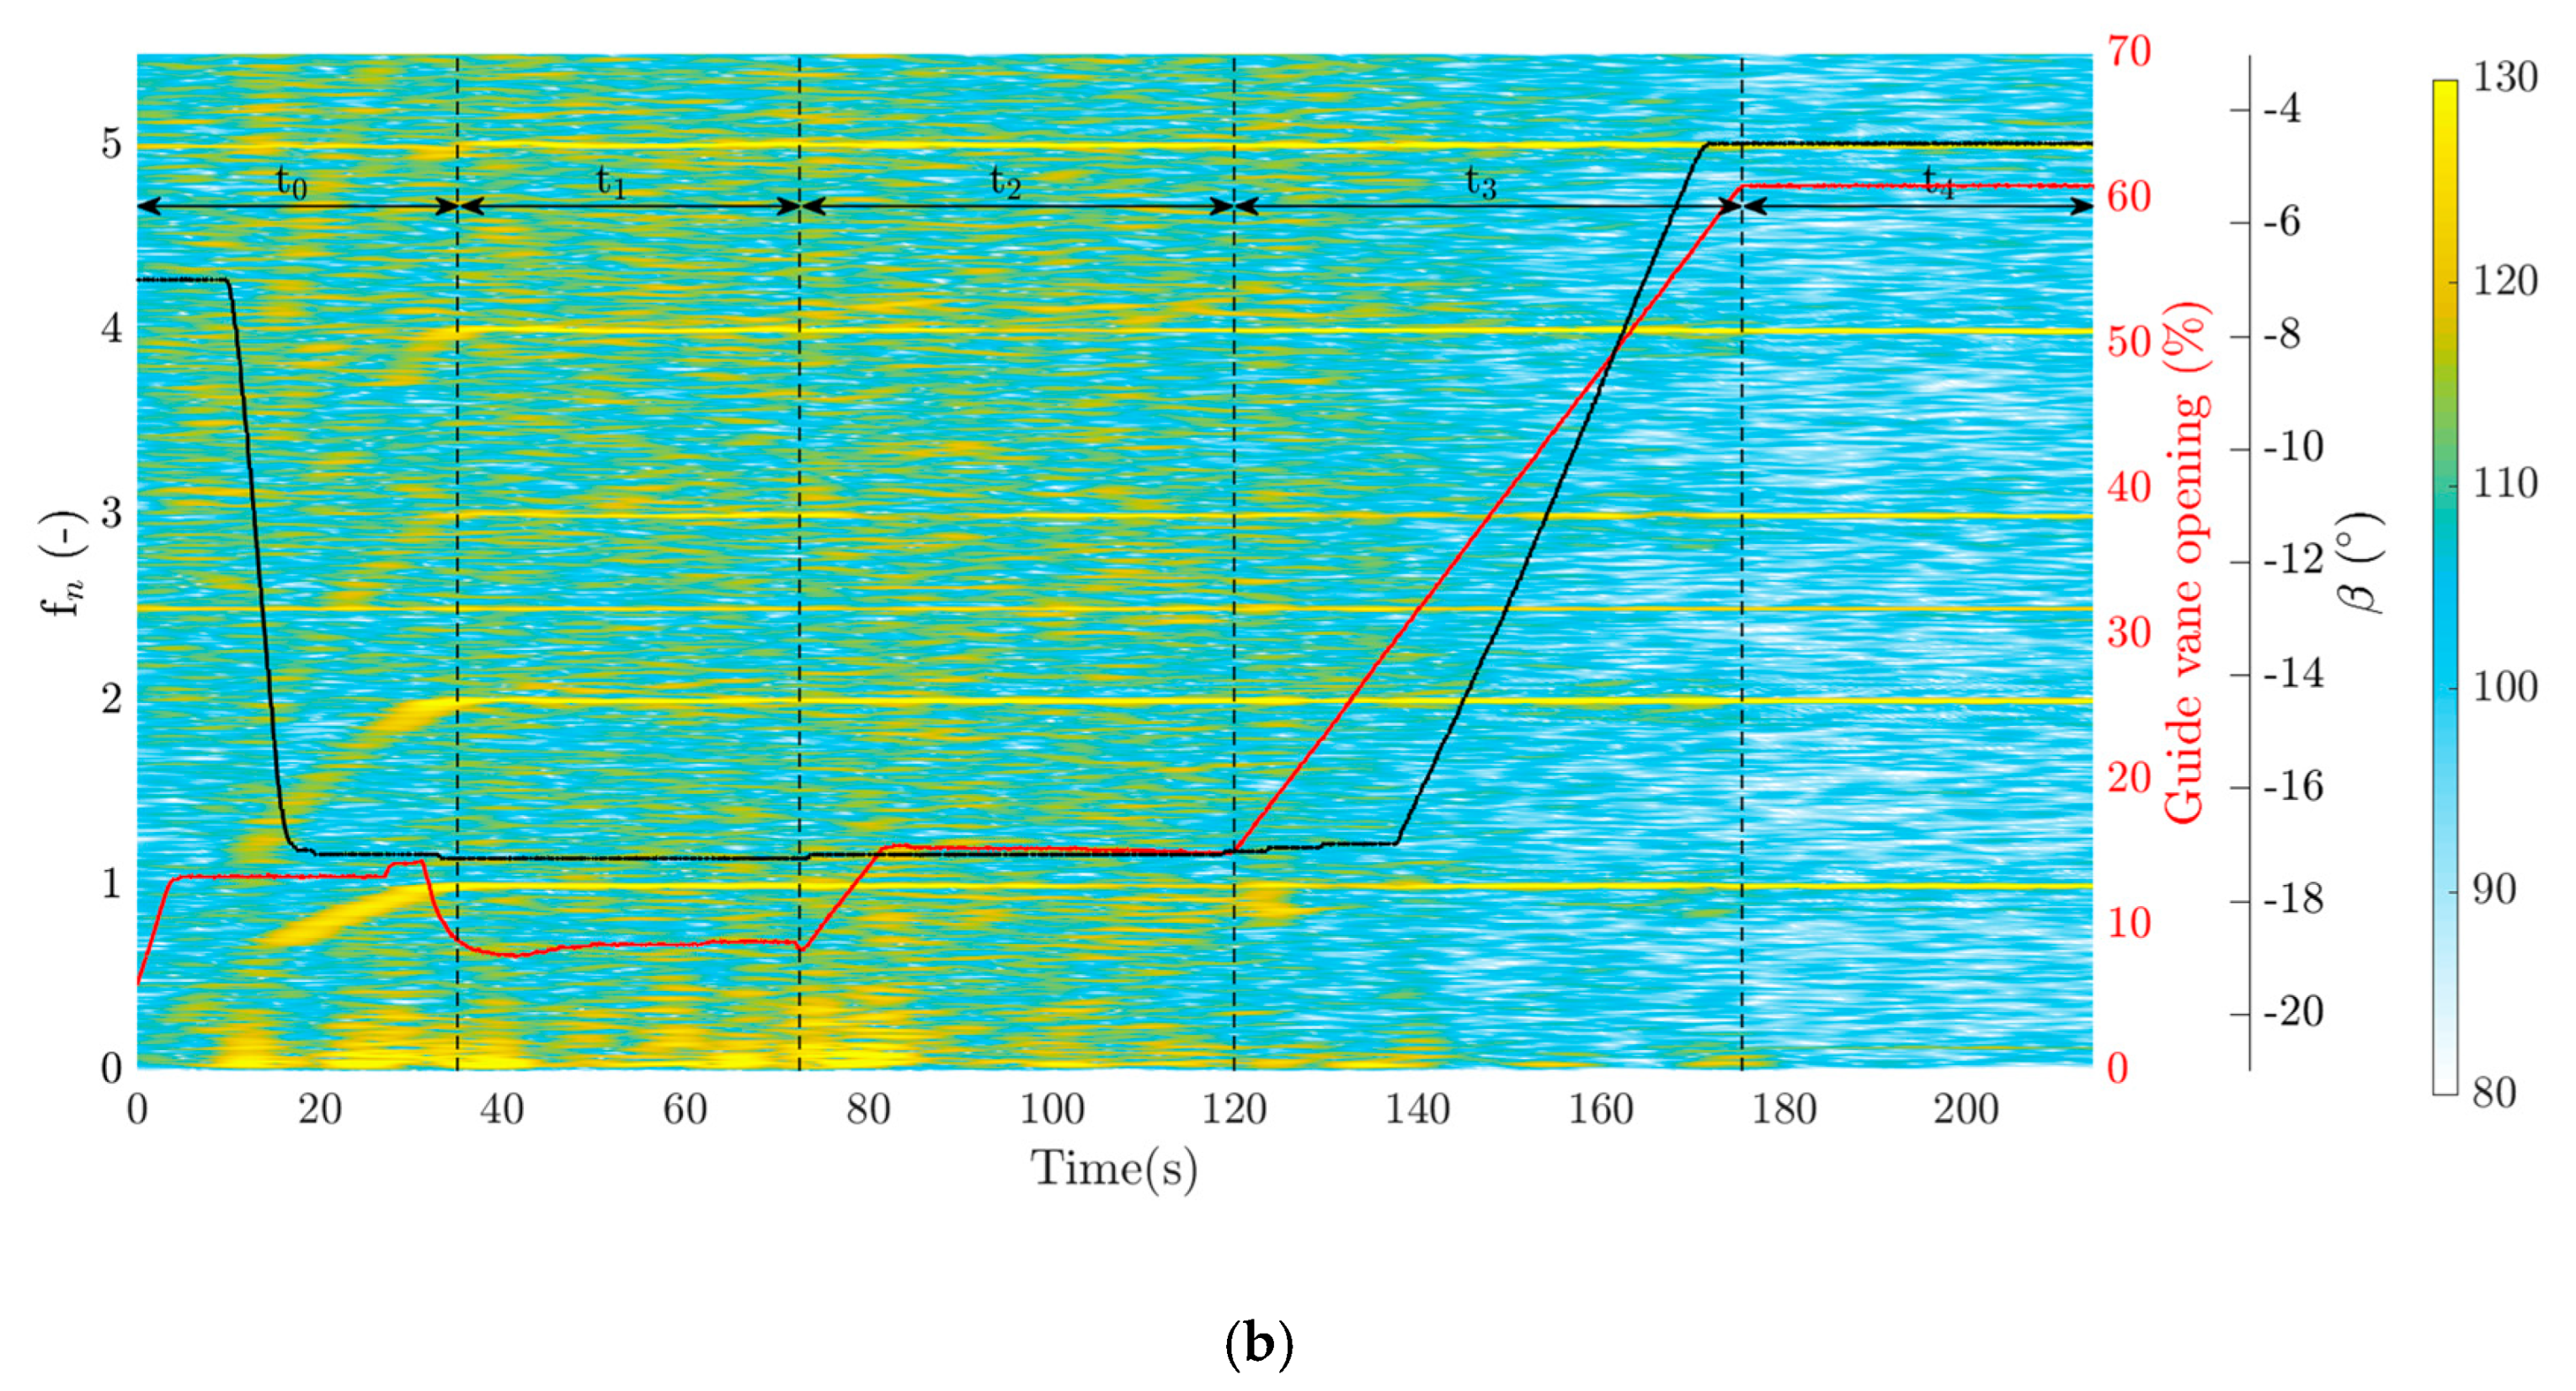
Figure 8 presents the spectrogram of the bending strain on the shaft in the X-direction. In the low-frequency region, the bending strain fluctuations have an evolving dominant normalized frequency increasing from 0.2 to 1 during the acceleration phase. The dominant normalized frequency of
could be seen after reaching the synchronous speed at t = 35 s. A high-intensity region is observed around
from the beginning of the start-up until t = 140 s when the runner blades were opened from the minimum angle. This observation indicates a coupling between the twisting (torsional) and the bending motion of the runner. Another dominant frequency (
) appears for a short period of time, at t = 120–140 s, when the runner blades are slightly opened. Another high-intensity region is observed around
during the generator loading,
. A similar frequency content is observed for the bending strain in the Y direction. Therefore, it is not presented.
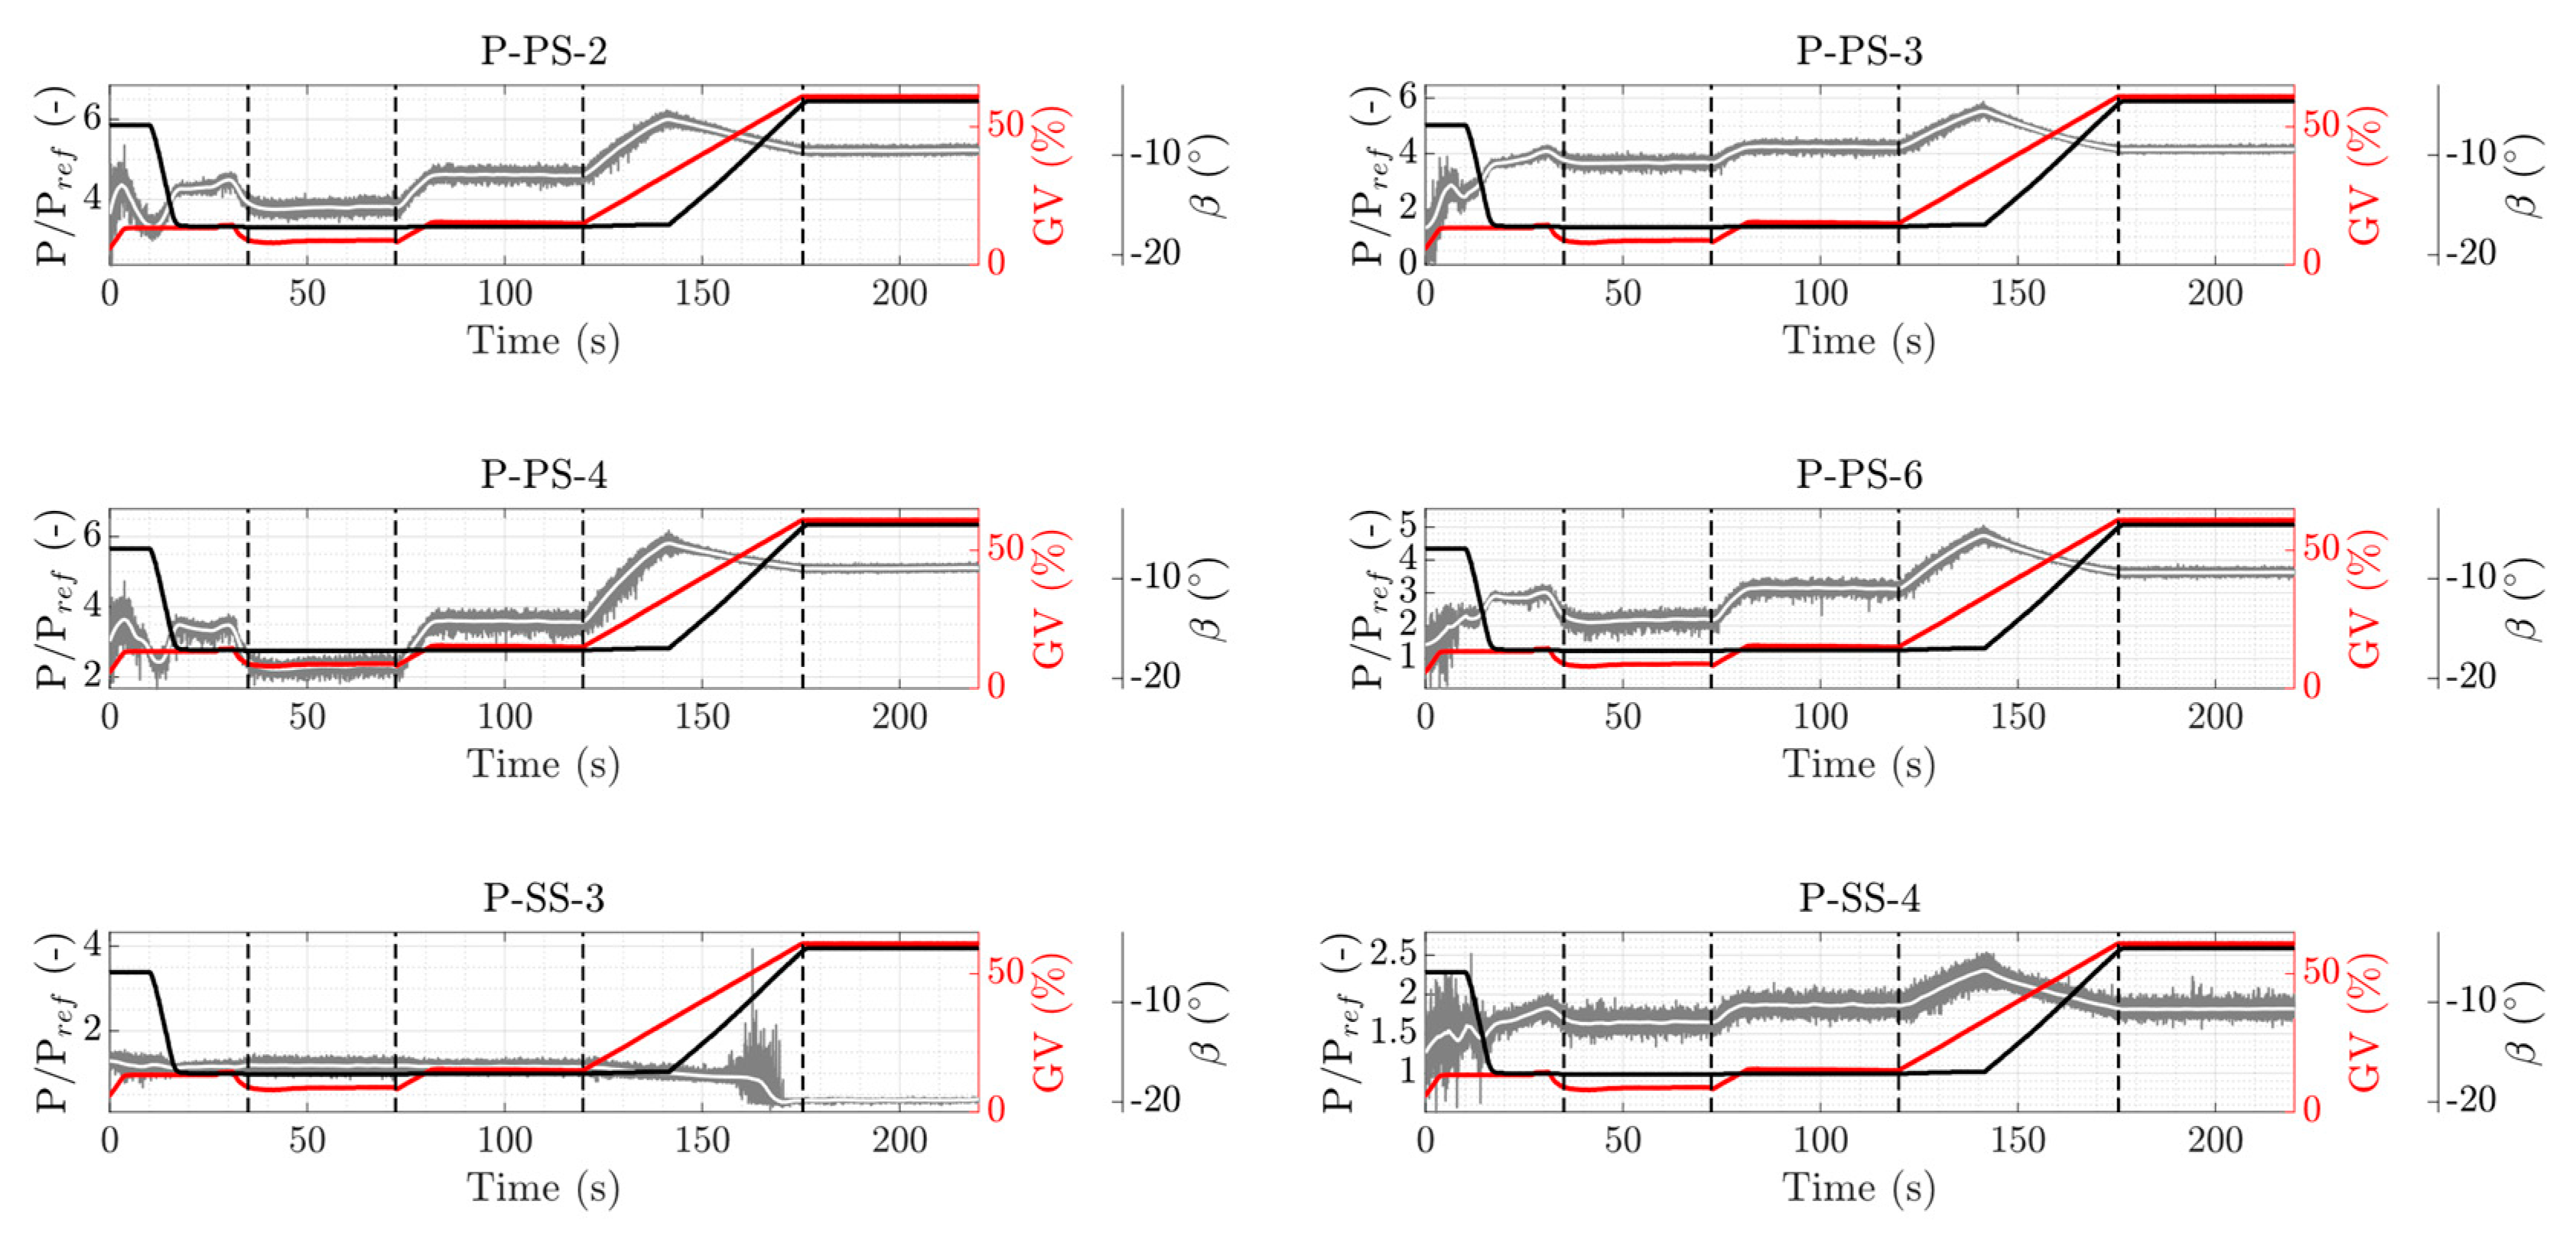
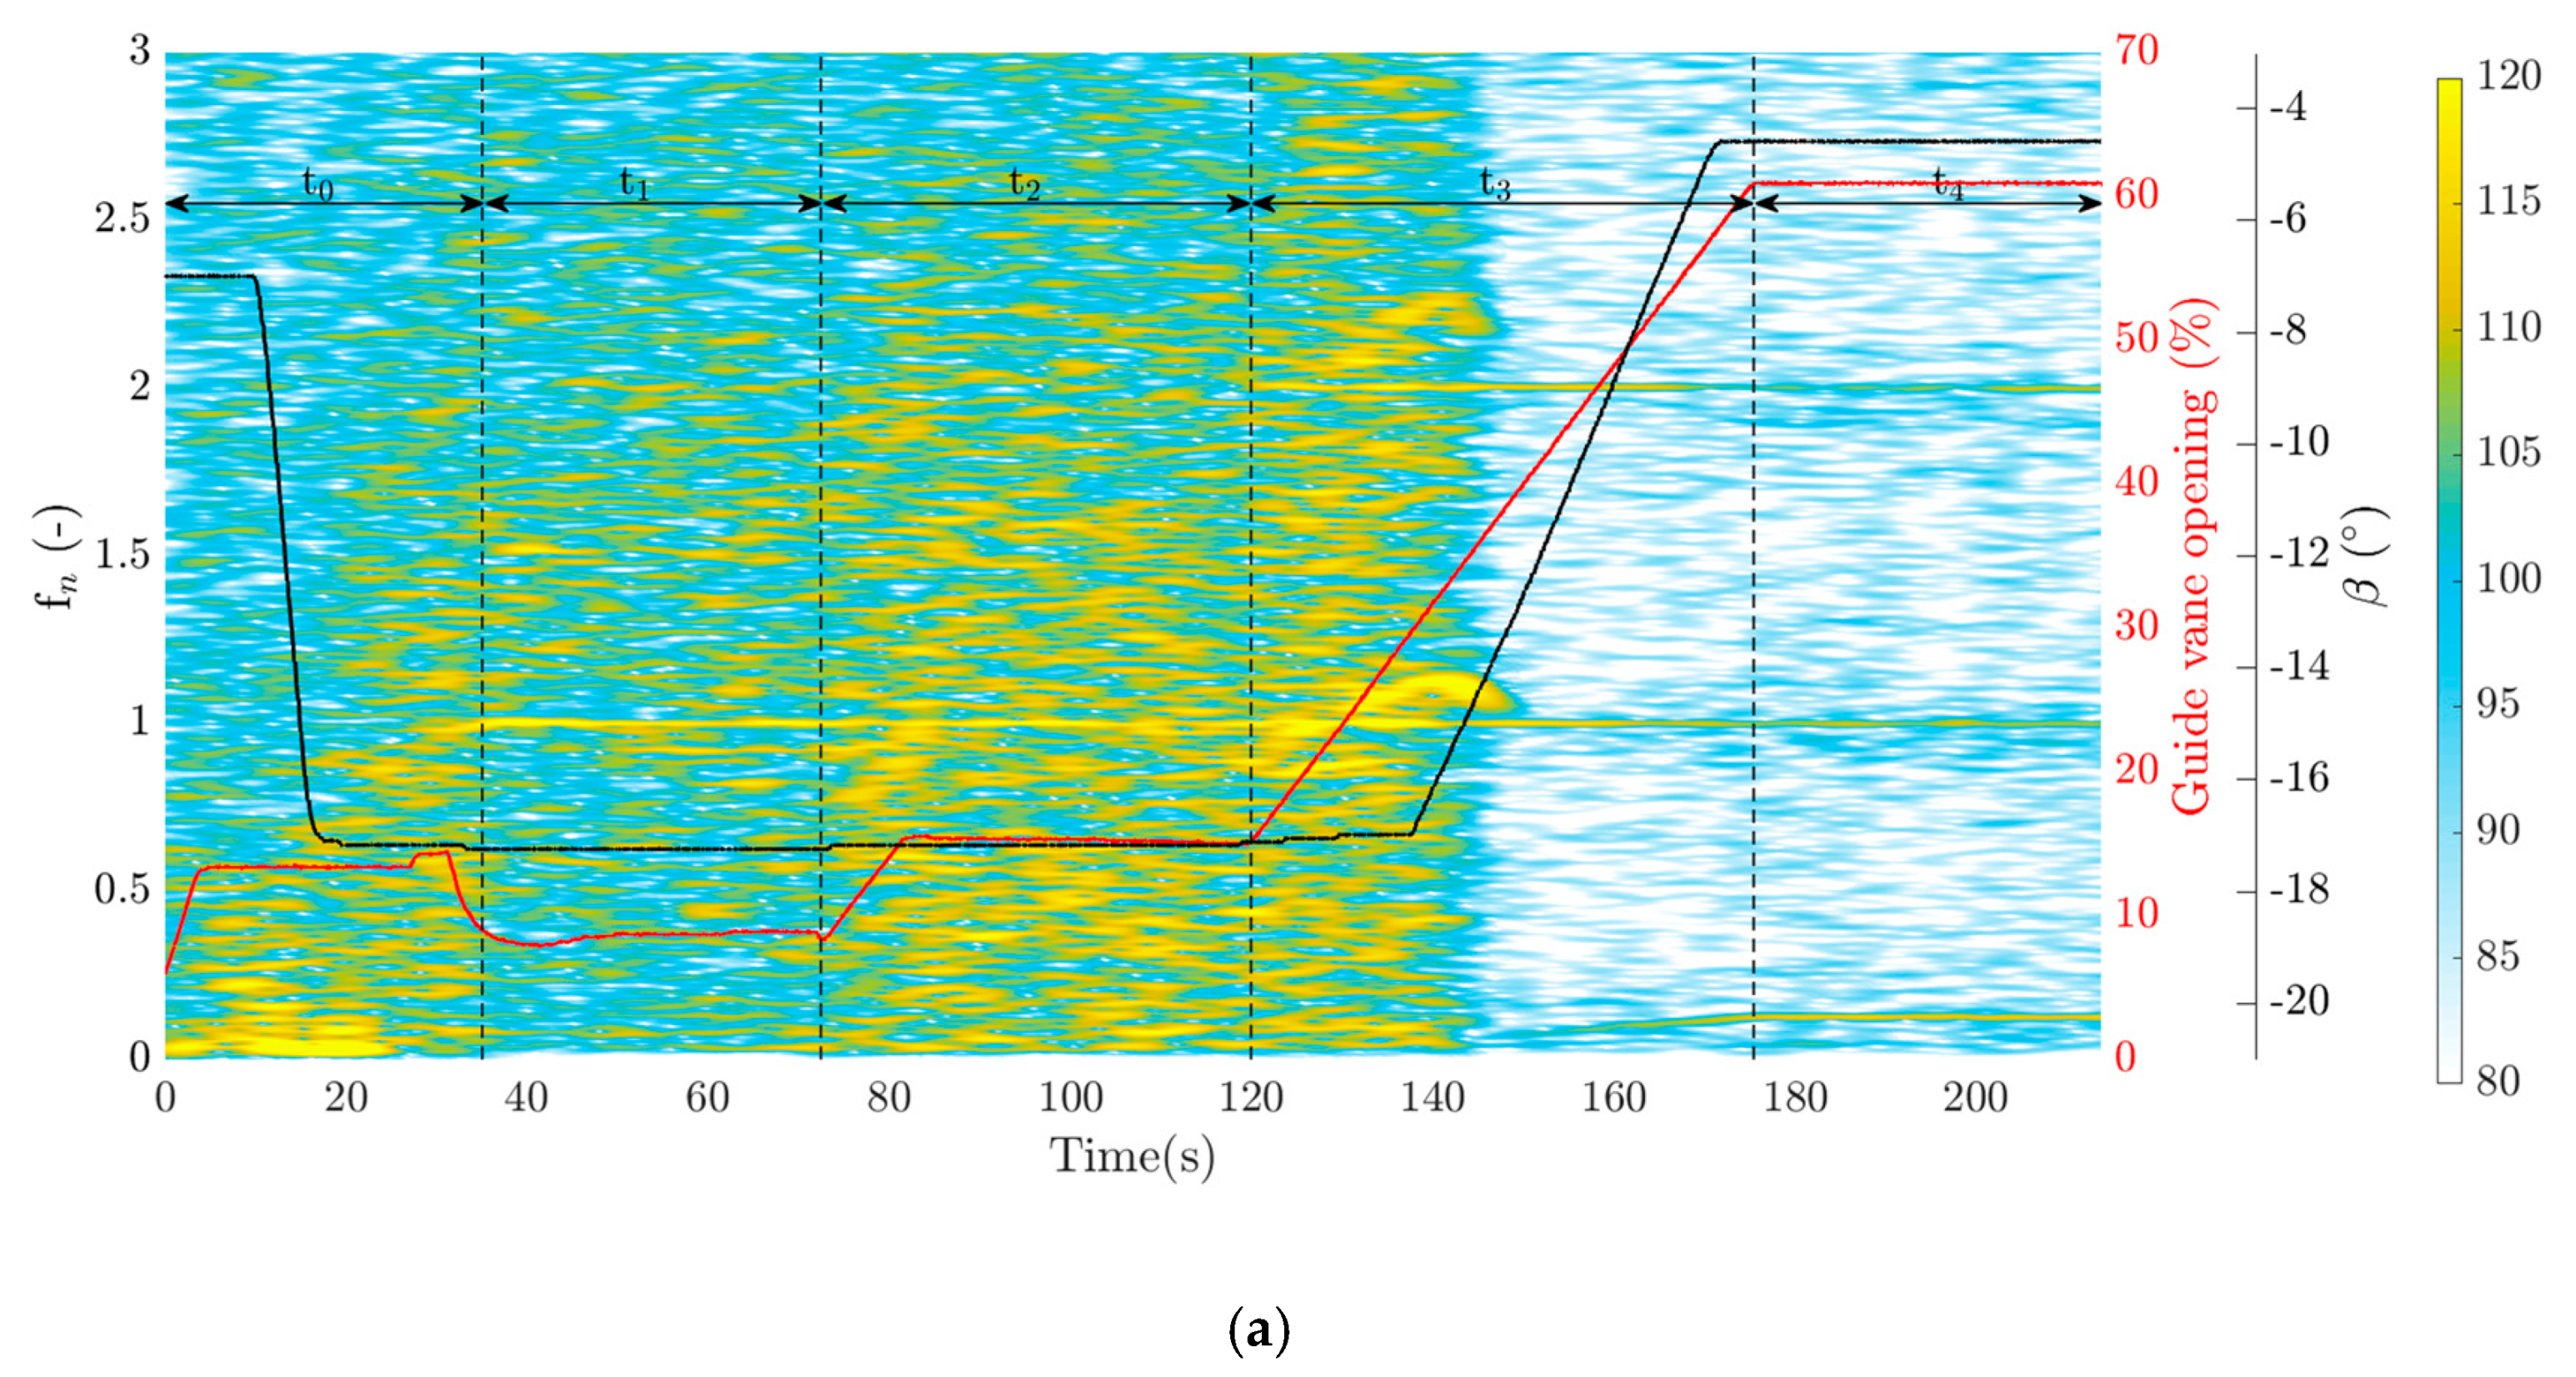
Figure 9 presents the normalized pressure variation on the runner blade for six pressure transducers. Regardless of the normalized pressure values, a similar qualitative behavior is obtained for the transducers on the blade pressure side (P-PS-2, P-PS-3, P-PS-4 and P-PS-6) and S-SS-4 installed on the suction side. However, the pressure variation for the pressure transducer S-SS-3 is different and remains constant up to the end of the third phase (end of the magnetization phase), t = 120 s. Thereafter, the normalized pressure value slightly decreases by increasing the guide vane opening as well as the runner blade angle, and high amplitude fluctuations are captured around t = 160 s.
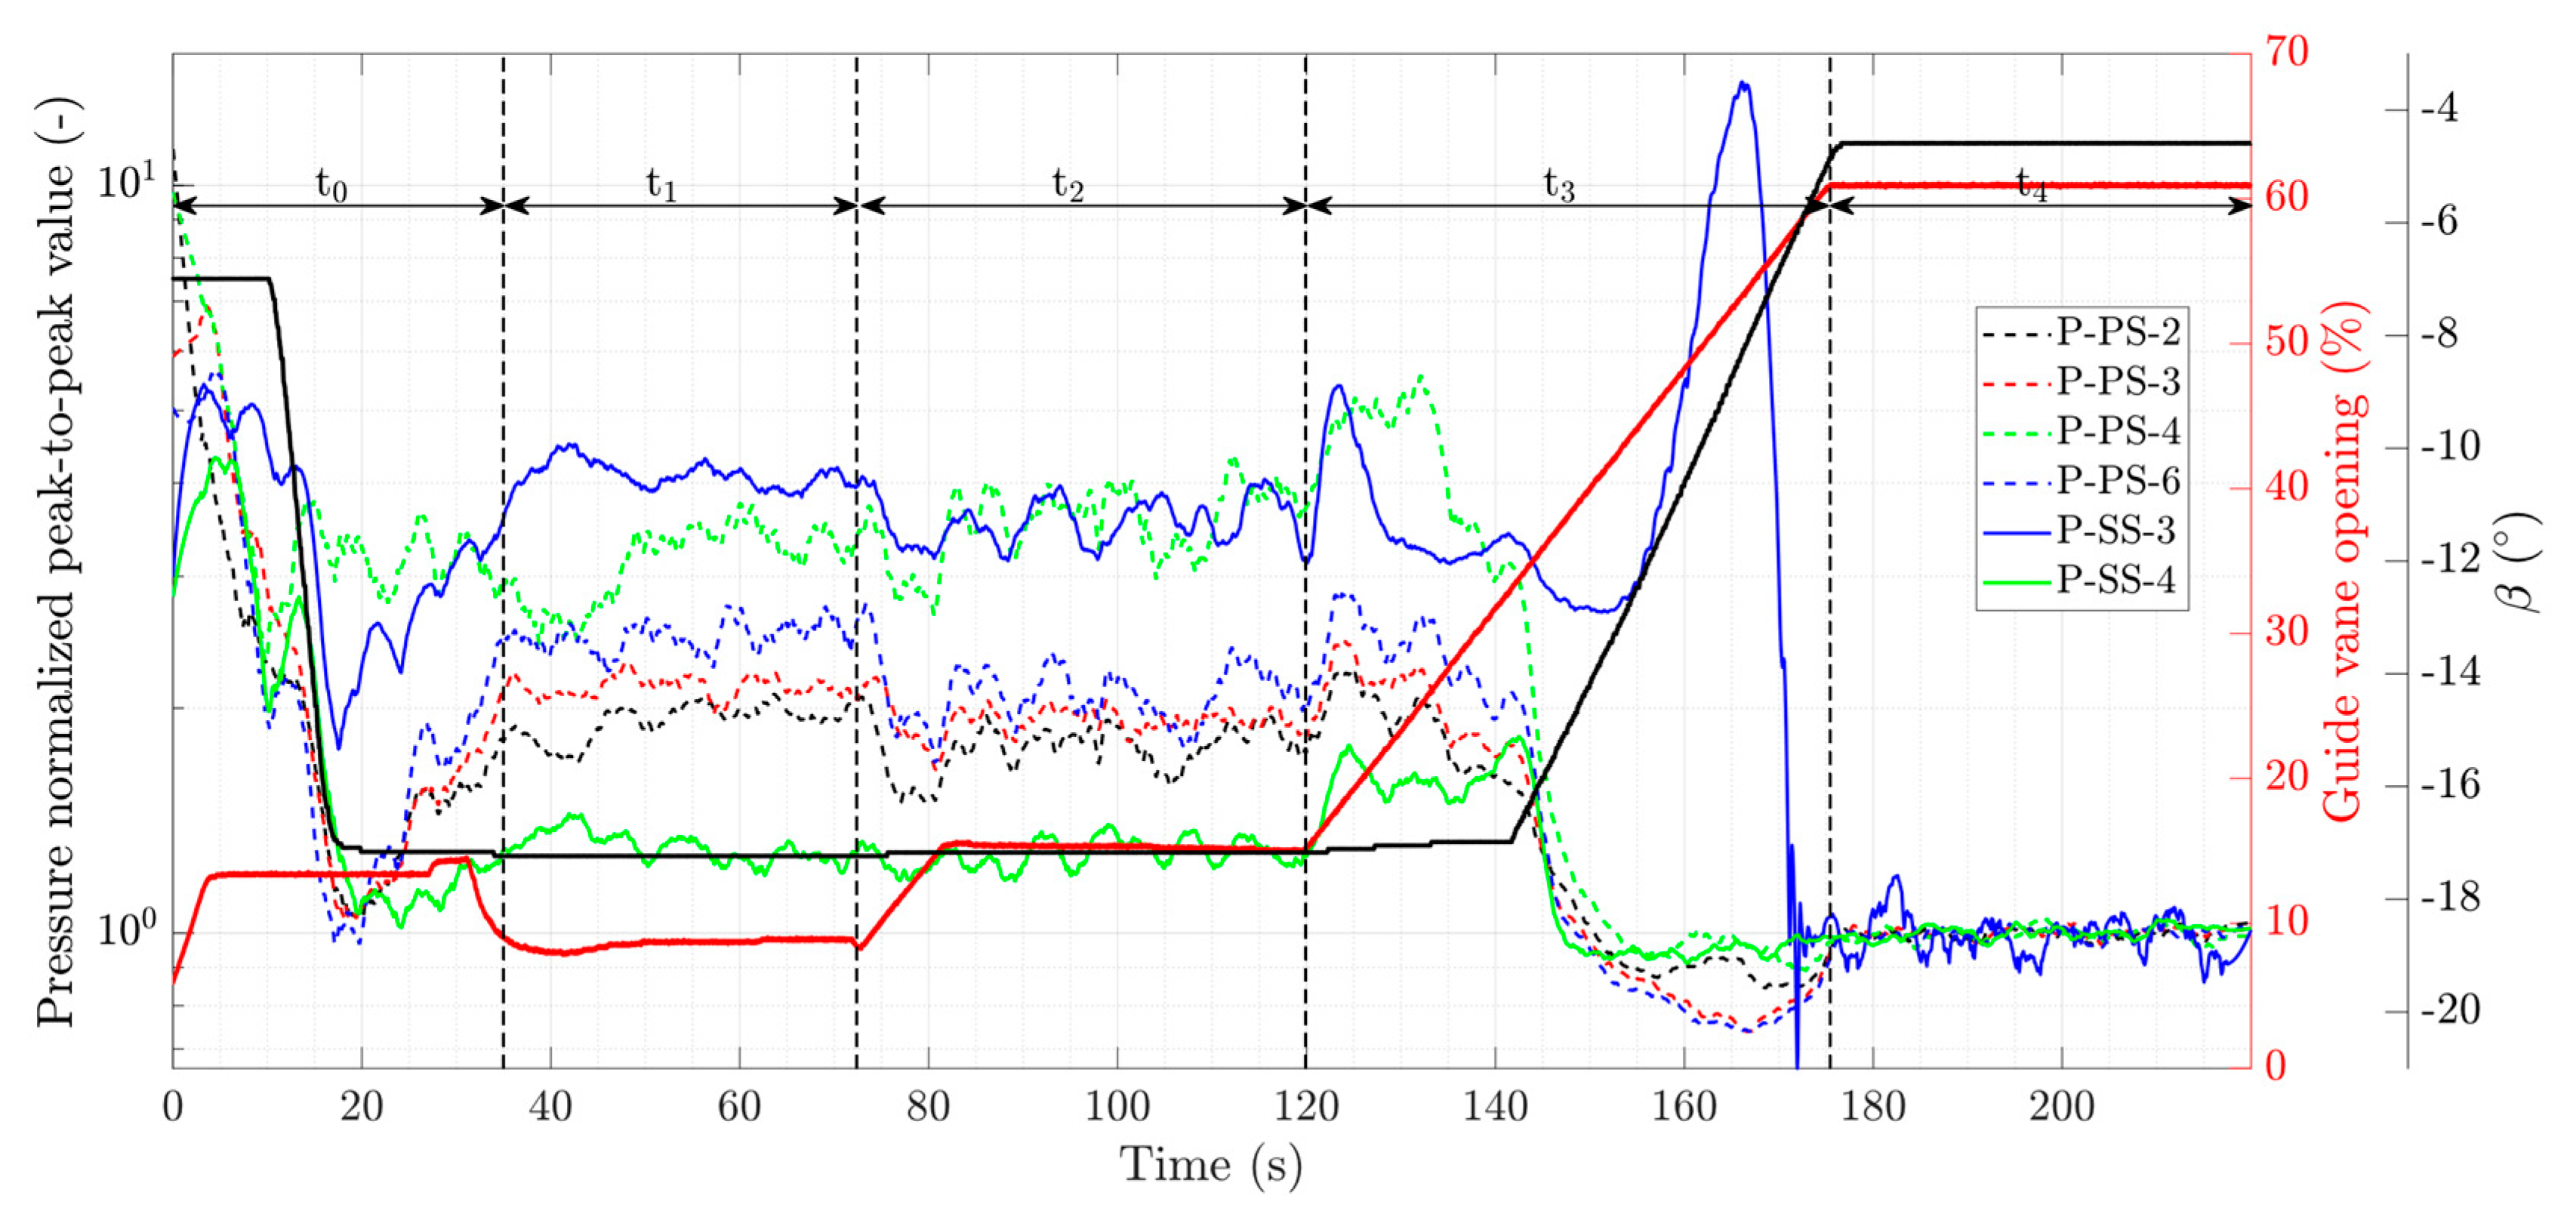
Figure 10 shows the pressure normalized peak-to-peak variation for the pressure transducers on the runner blade. The pressure peak-to-peak values were normalized using the average value of each pressure data during the last phase of the operation (steady-state operation). The average pressure peak-to-peak values of 0.075, 0.081, 0.066, 0.081, 0.030 and 0.080 were obtained during the steady-state operation for P-PS-2, P-PS-3, P-PS-4, P-PS-6, S-SS-3, and S-SS-4, respectively. High amplitude fluctuations are captured for all the pressure transducers at the beginning of the start-up operation by opening the guide vanes while the runner blade angle is approximately −7°. These fluctuations are approximately 3–7 times larger than those during the steady-state operation. Closing the runner blades, while the guide vanes opening is fixed, temporarily decreases pressure fluctuations on the runner blade during the acceleration phase. No significant changes are observed for the pressure fluctuations from the speed-no-load stage to the end of the magnetization stage, t = 120 s. Thereafter, the fluctuation level considerably decreases for all pressure transducers except for S-SS-3 by opening the guide vane and runner blades around t = 145 s. A large peak is observed at t = 165 s for S-SS-3, which is more than 10 times larger than those during the steady-state operation.
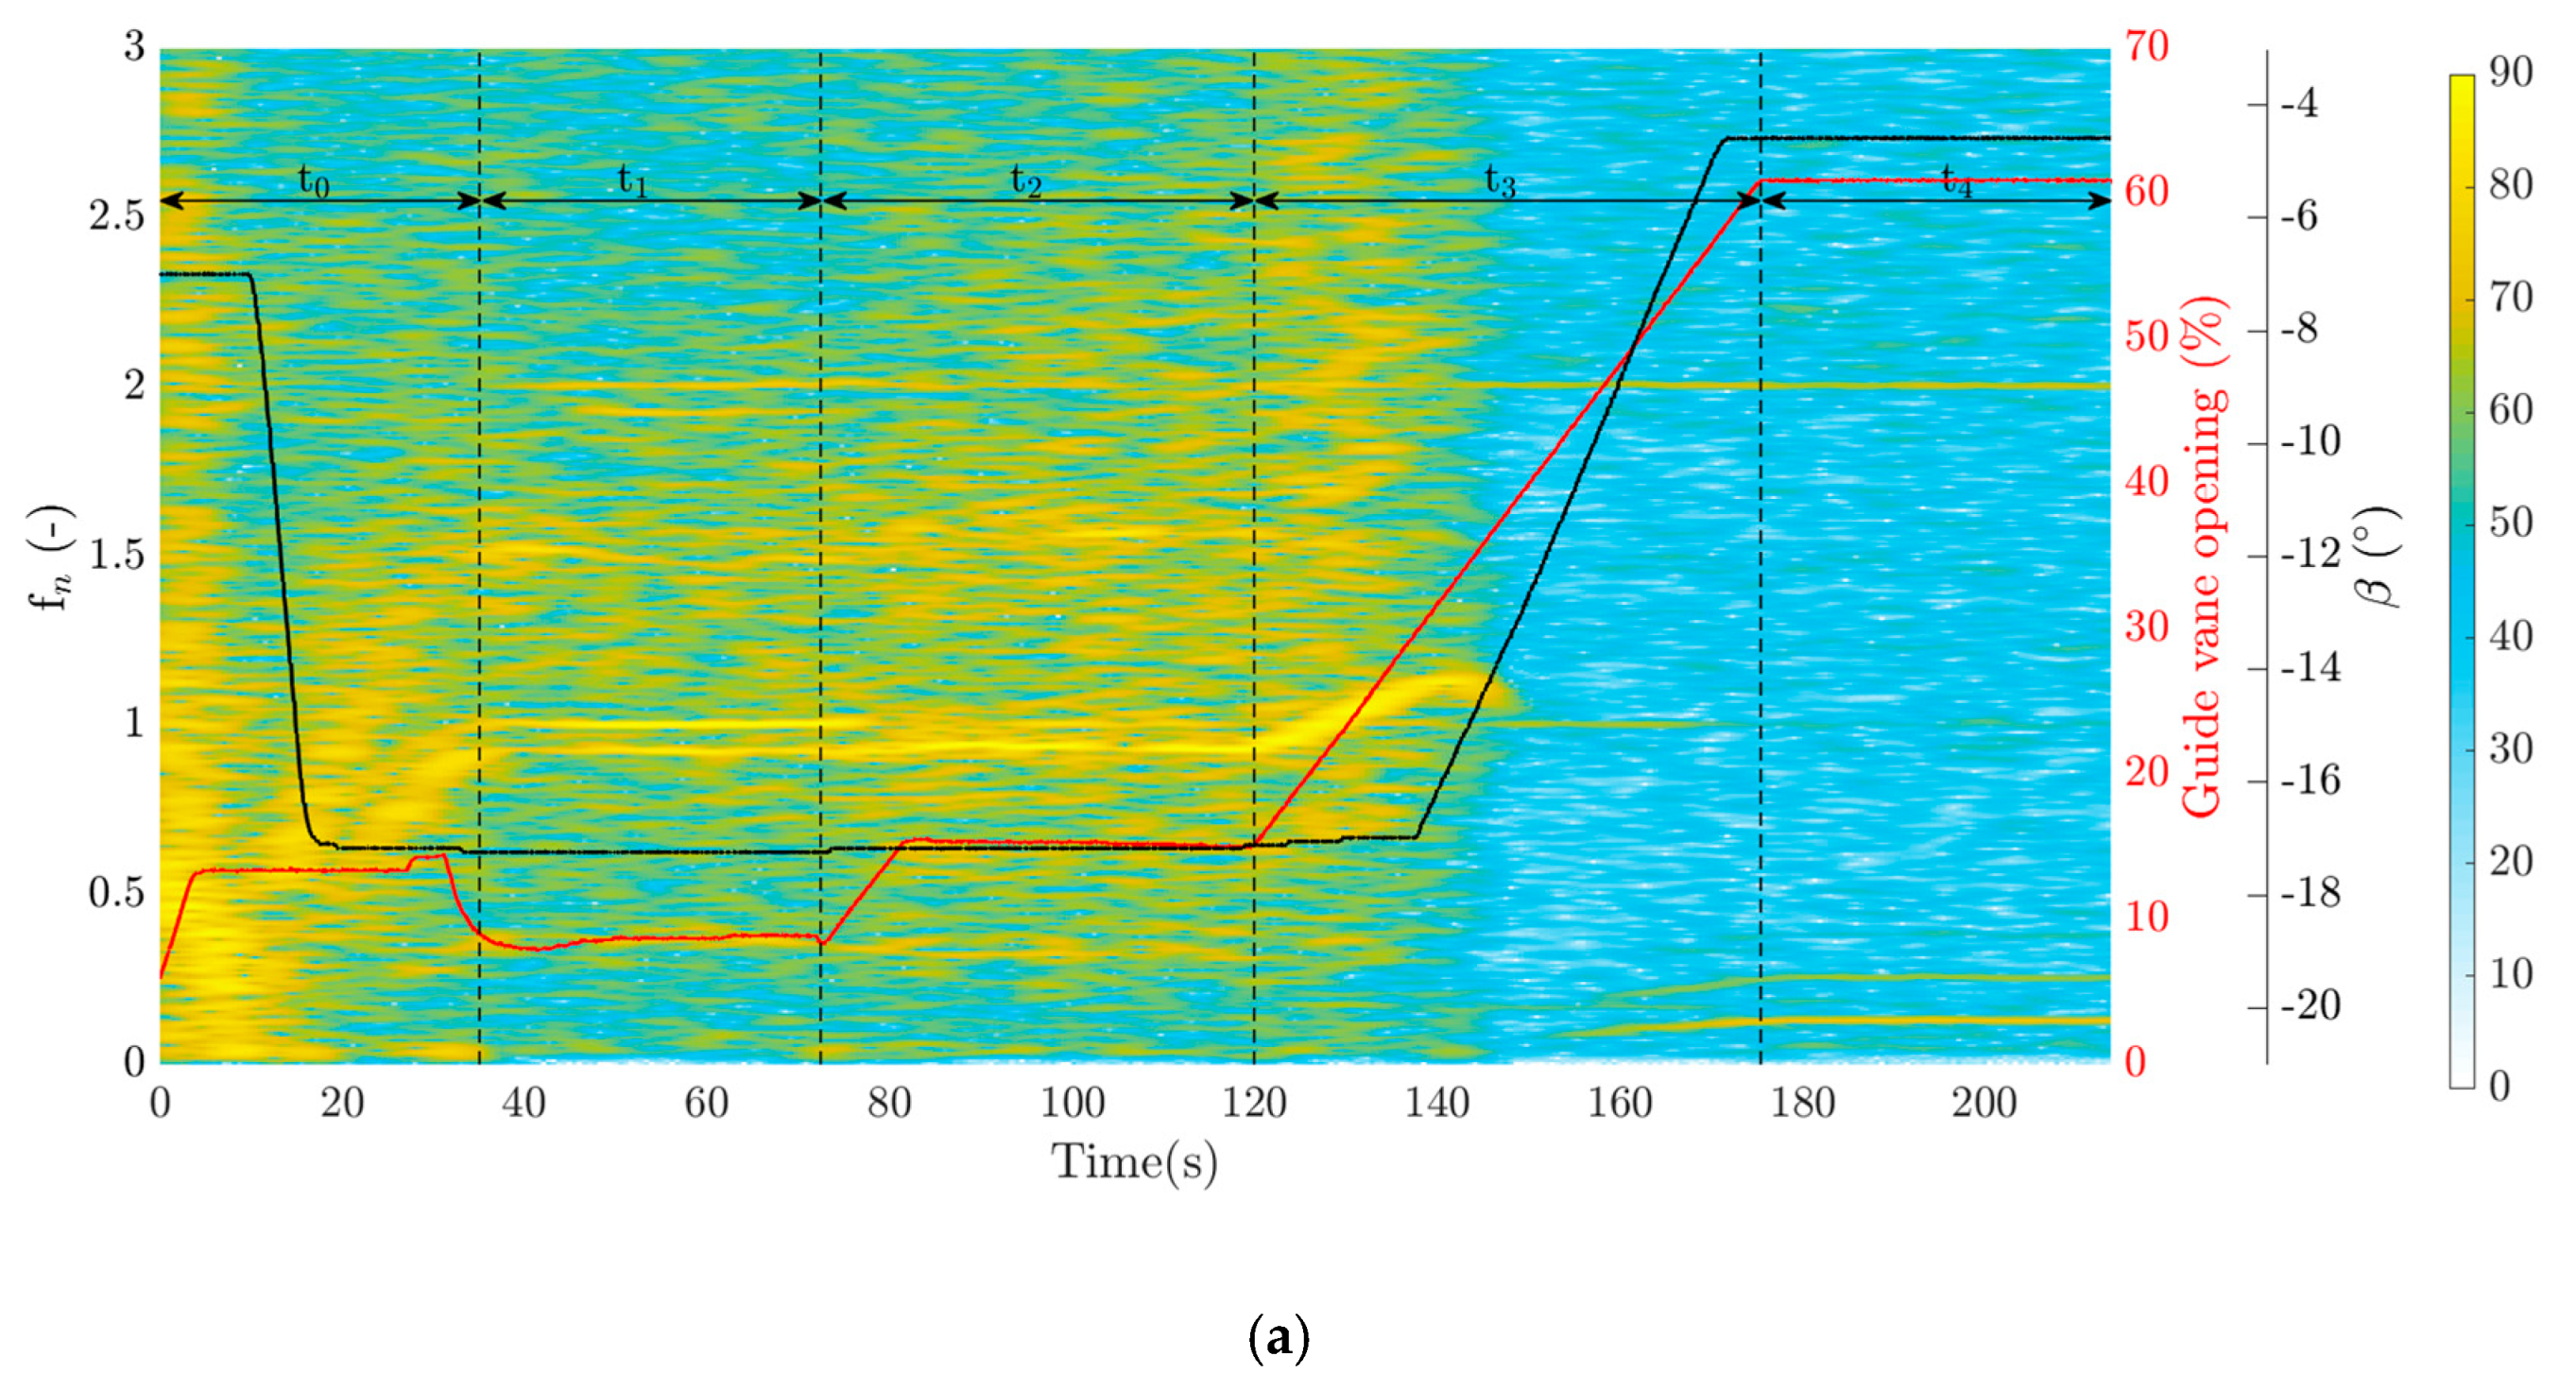
Figure 11 shows the spectrogram of the pressure transducer P-PS-4 during the start-up. The frequency content of other pressure transducers installed on the pressure side is similar; therefore, they are not presented. Two main evolving dominant frequencies are observed in the frequency spectrum reaching the final value at the beginning of the speed-no-load stage; the runner frequency is
and the other frequency is
(
Figure 11a), which was also observed in the axial and torsion strain on the shaft, as shown in
Figure 6 and
Figure 7. By loading the generator and opening the guide vanes, the energy of the runner frequency decreases. However, the intensity of the other frequency (
) increases, and the dominant frequency value increases after t = 120 s by further opening the guide vanes. This outcome was also observed in the strain data obtained from the shaft. Low-frequency fluctuations (
) are captured in all pressure transducers installed on the blade pressure side at the beginning of the start-up, t = 0–10 s, and considerably decrease by reducing the runner blade angle.
Figure 11b shows the frequency content within the expected RSI frequency region, approximately
. No dominant frequency is observed during the start-up operation. The RSI frequency appeares at t = 150 s when the guide vane opening reaches approximately 45%. Clearly, the wakes of the guides are either weak or not developed enough to reach the runner blades.
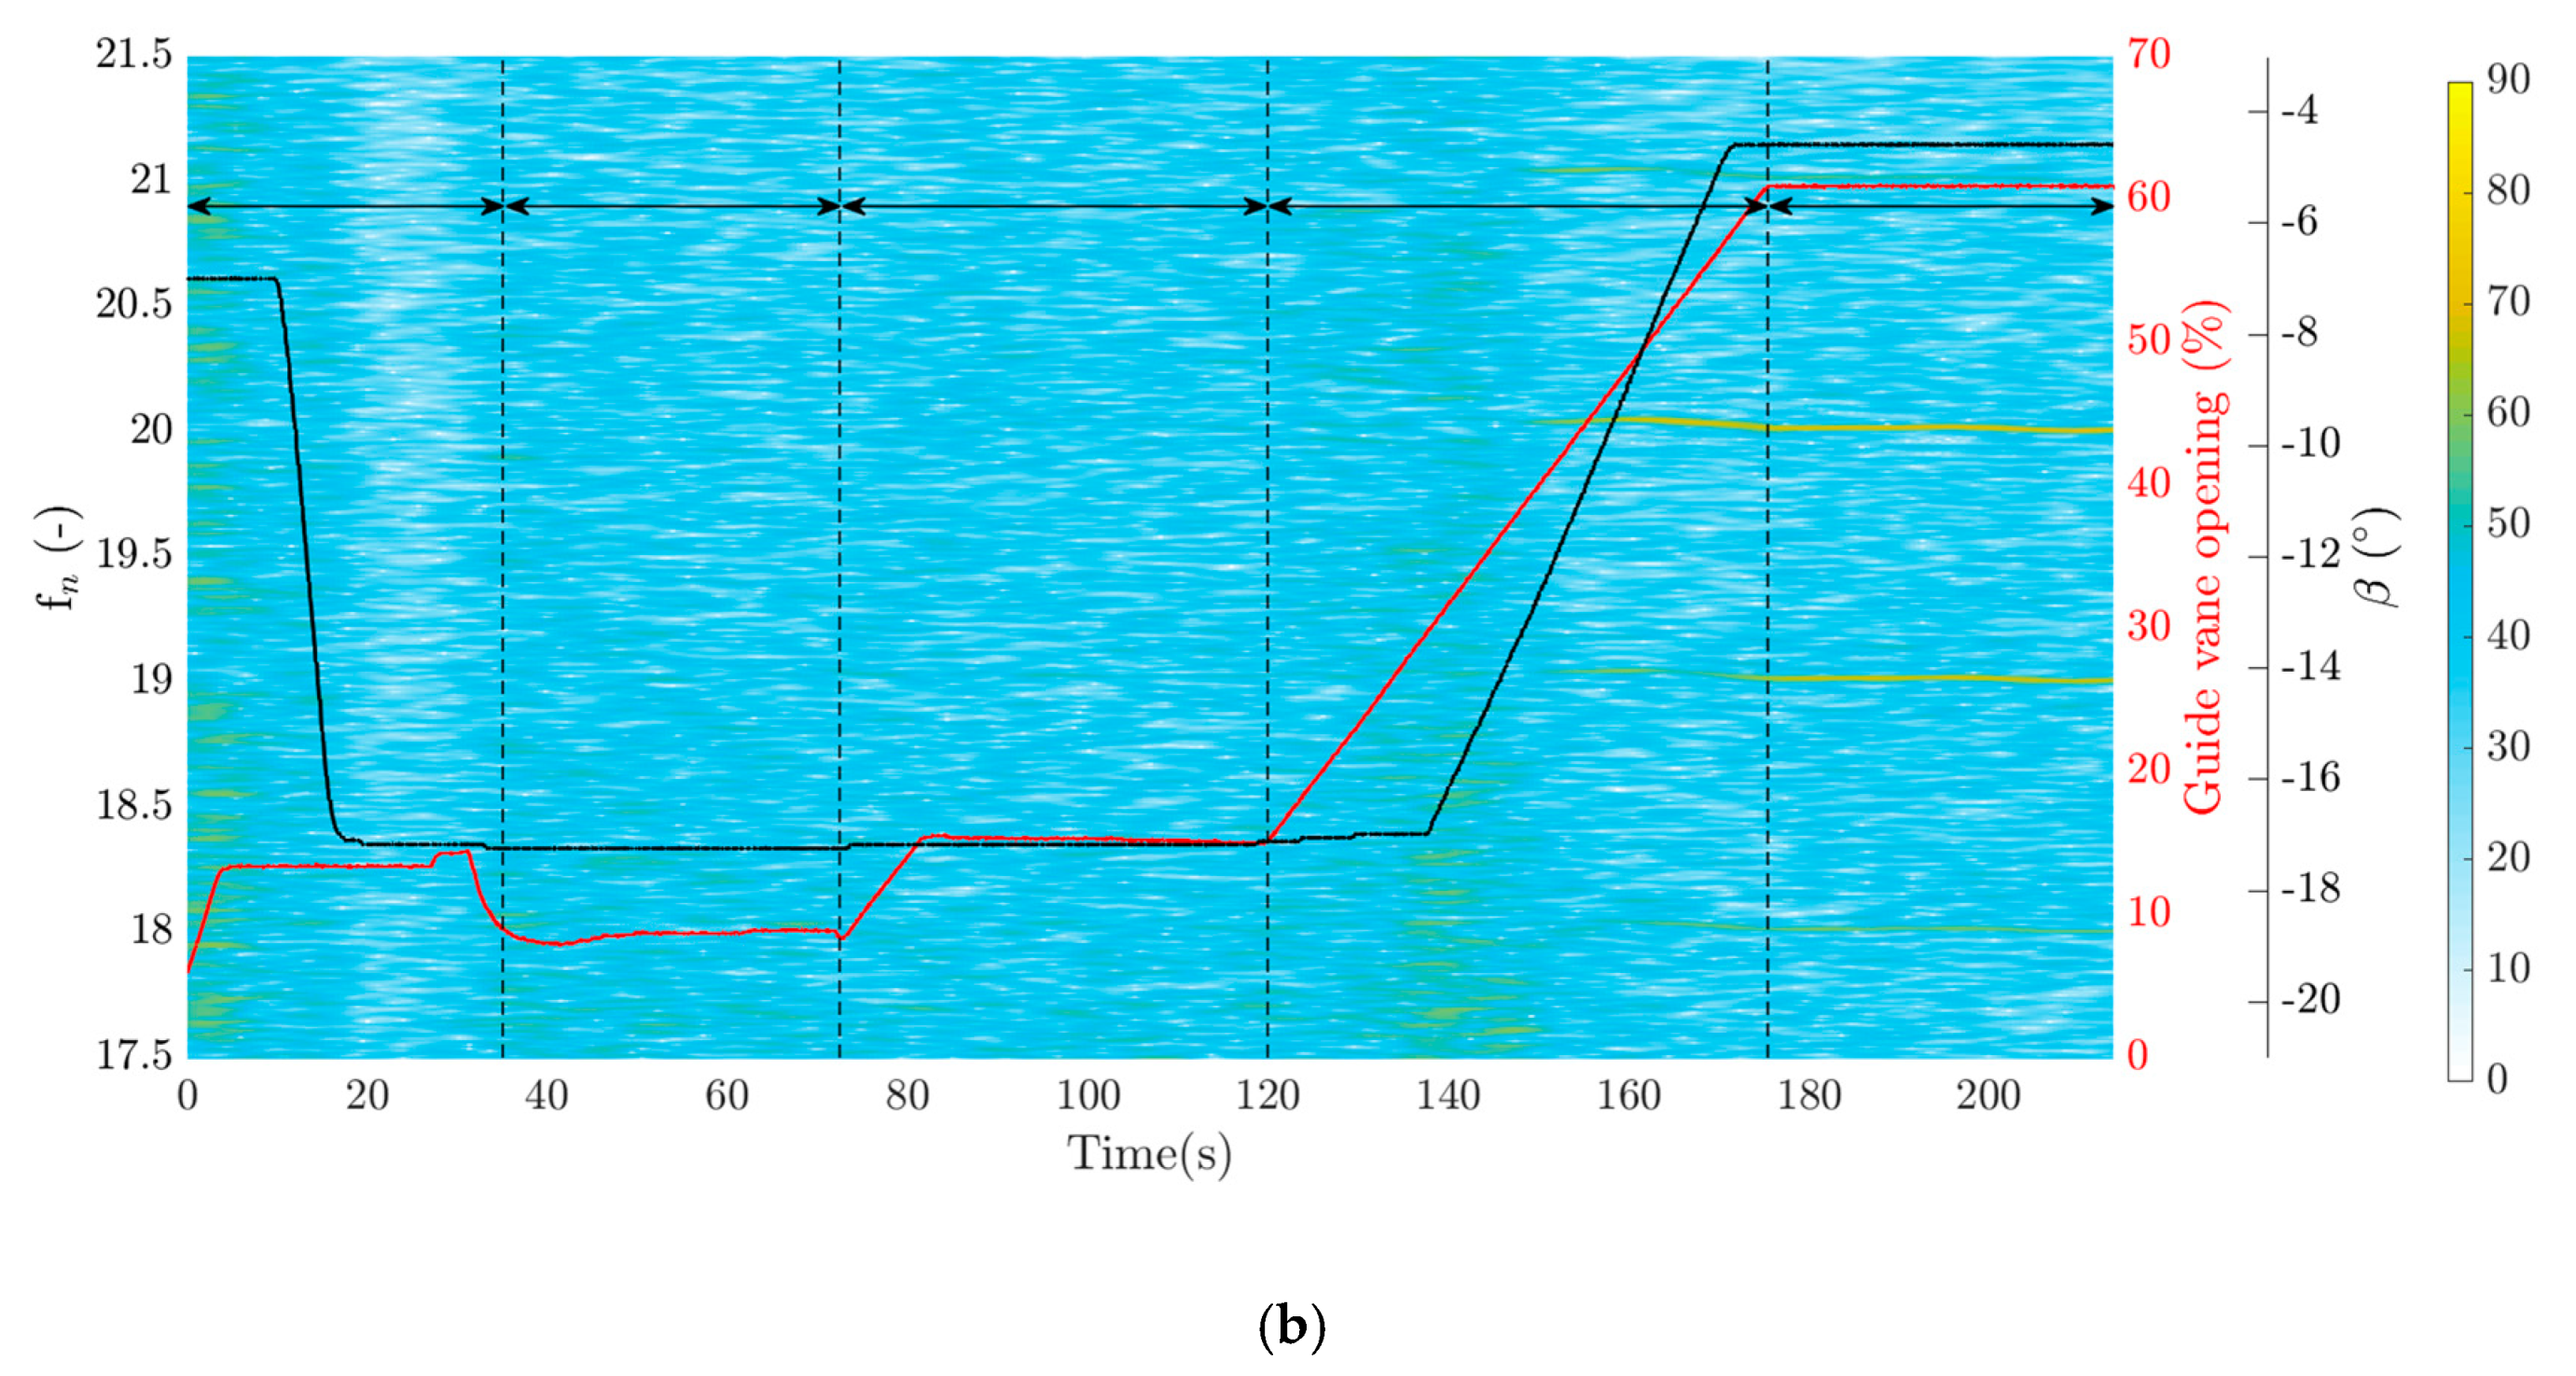
Figure 12 shows the spectrogram of the pressure transducer S-SS-4 during the start-up. The runner frequency is only captured during the speed-no-load stage. Similar to P-PS-4, low-frequency fluctuations (
) are observed at the beginning of the start-up. No dominant frequency is detected during the magnetization of the generator in this range. By further opening the guide vane, the varying dominant frequency appears and is similar to P-PS-4 at t = 120–140 s.
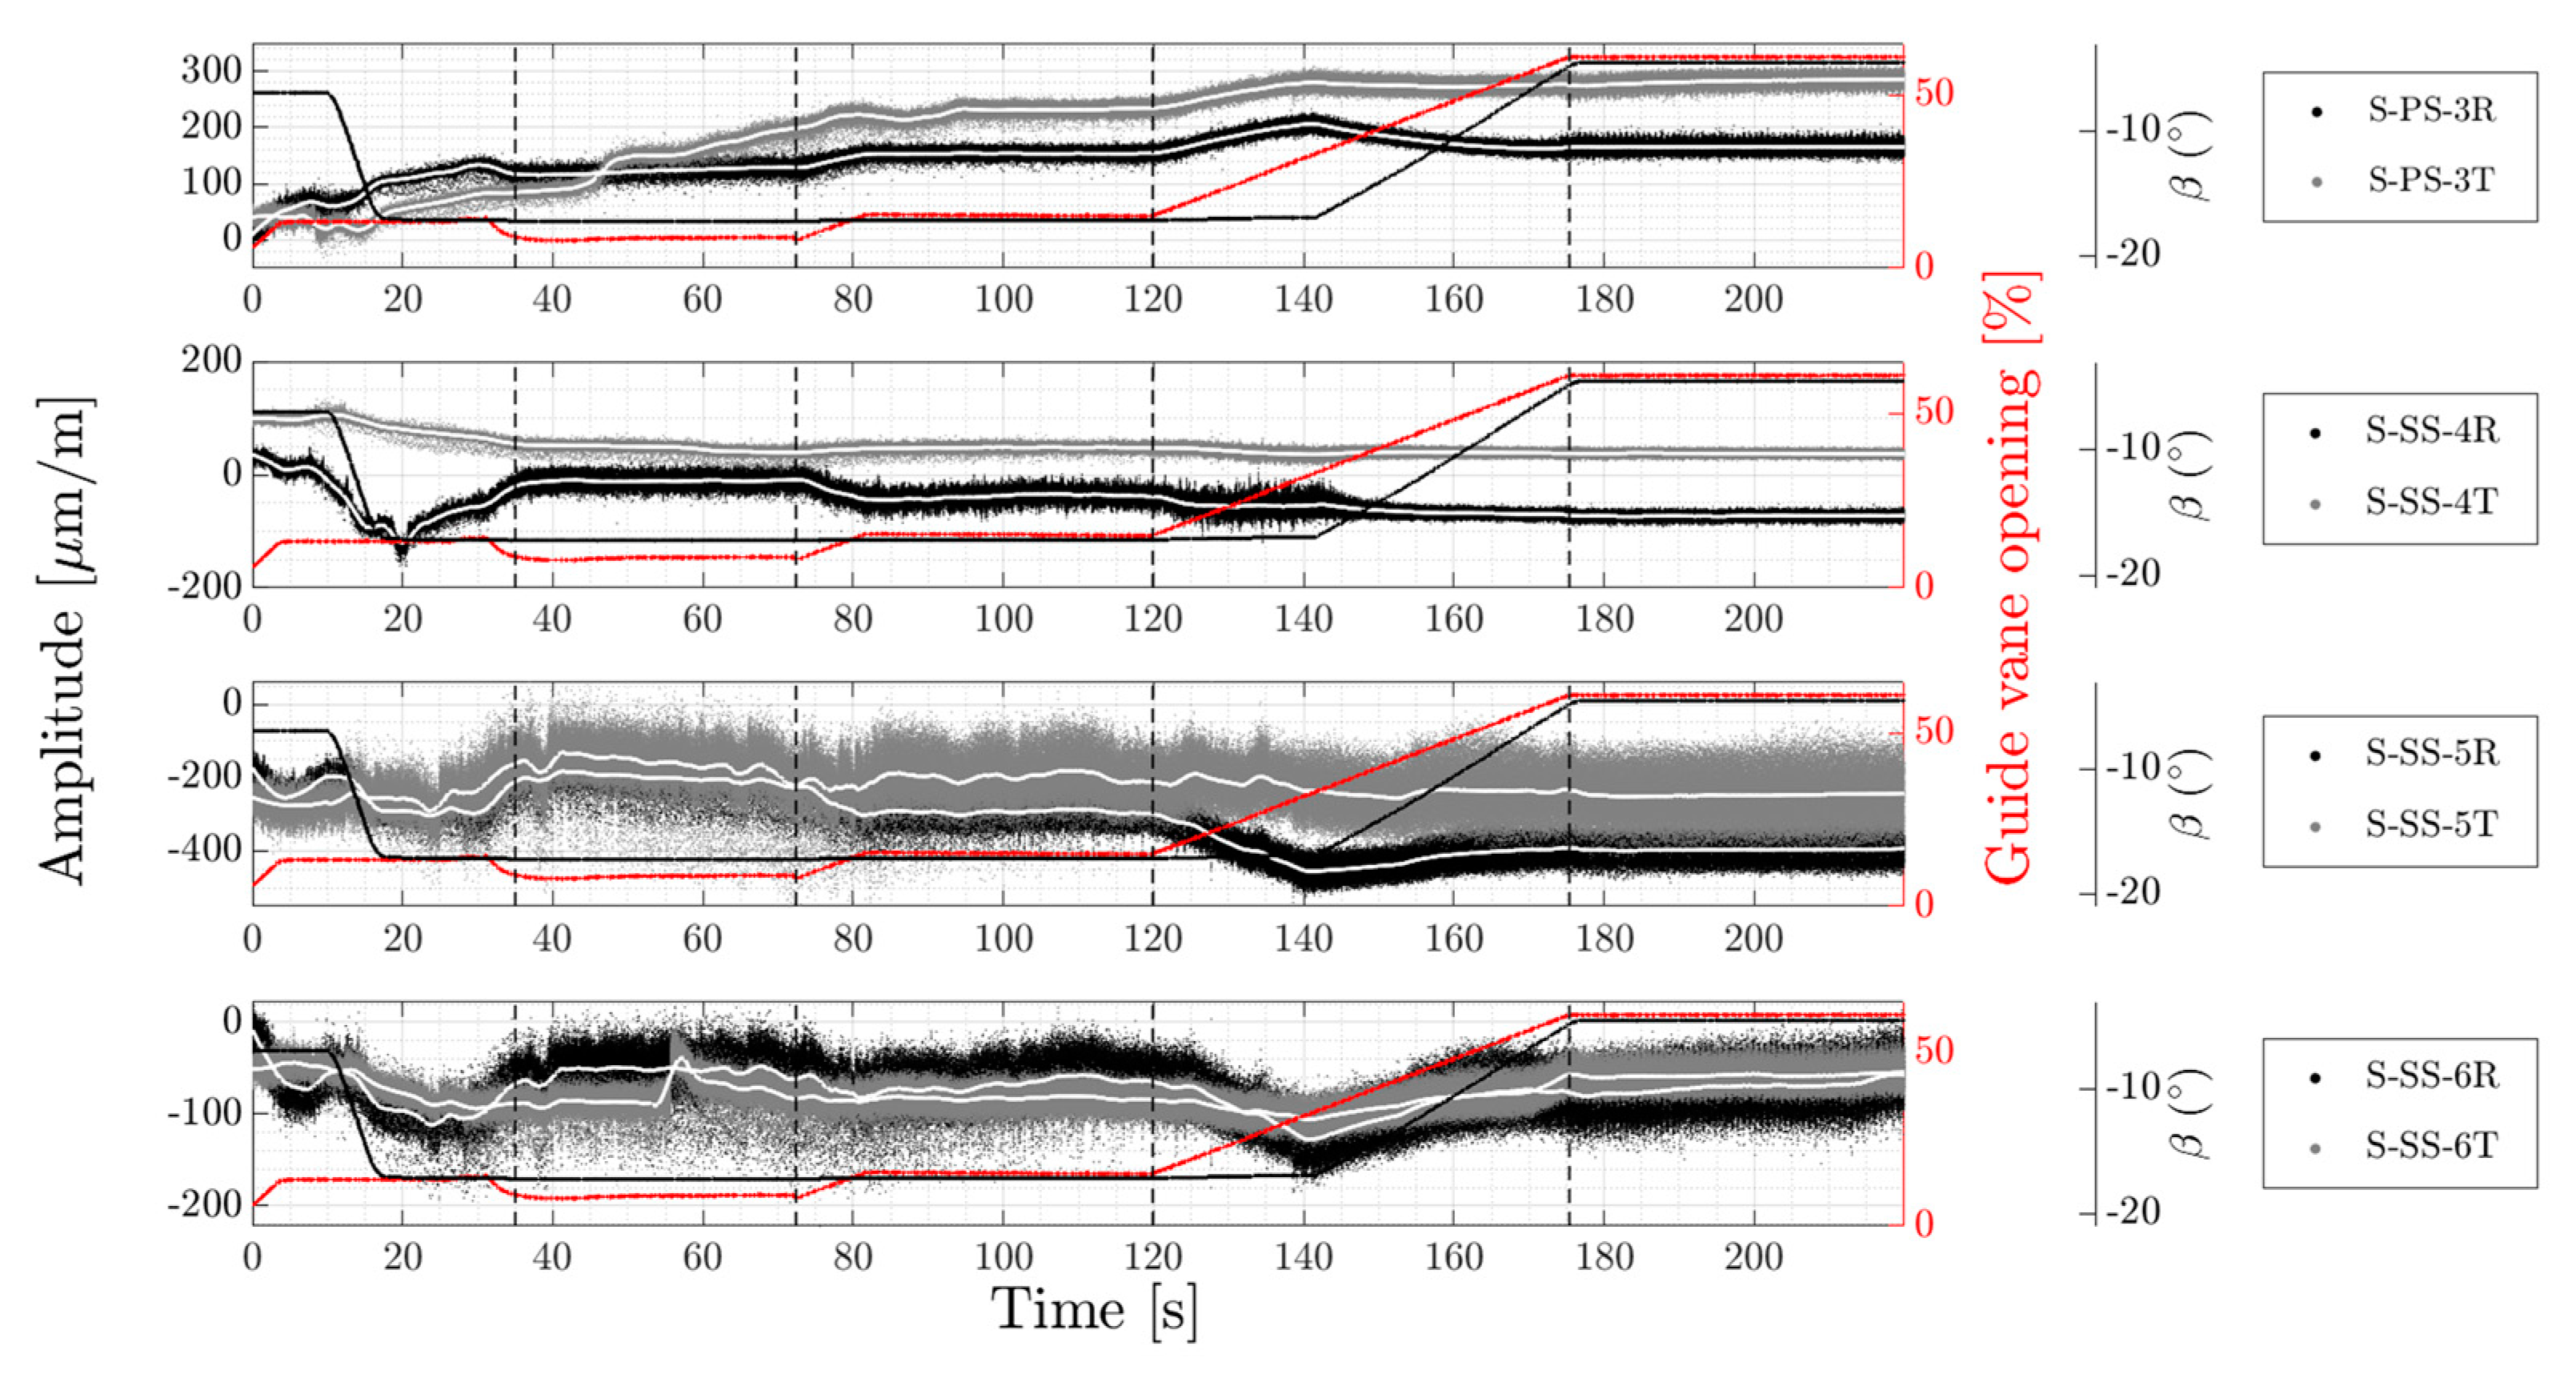
The transient strain data obtained from the runner blade are shown in
Figure 13. The strain gauges installed on the runner blade pressure side close to the trailing edge (S-PS-3R and S-PS-3T) experience an increasing strain during the start-up operation as the guide vanes are opened from the closed position. The strain in the radial direction (S-PS-3R) slightly decreases by opening the runner blades at t = 140 s, whereas the guide vanes are further opened. The strain value close to the blade leading edge in the tangential direction (S-SS-4T) has the maximum value at the beginning of the start-up and then gradually decreases by lowering the runner blade angle during the acceleration phase. The strain value remains rather unchanged after the turbine reaches the synchronous speed. However, the strain value at S-SS-4R is rapidly changed from +50 to −150
by decreasing the runner blade angle during the first stage of the start-up. Then, the strain values follow the guide vane movement regardless of the runner blade movement. As expected, the strain gauges installed close to the hub (S-SS-5R and S-SS-5T) experience higher strain values than those at other locations that reach approximately −500
. The stochastic behavior of the time-averaged strain value could be observed for strain gauges installed close to the blade hub and trailing edge on the suction side at t = 0–120 s.
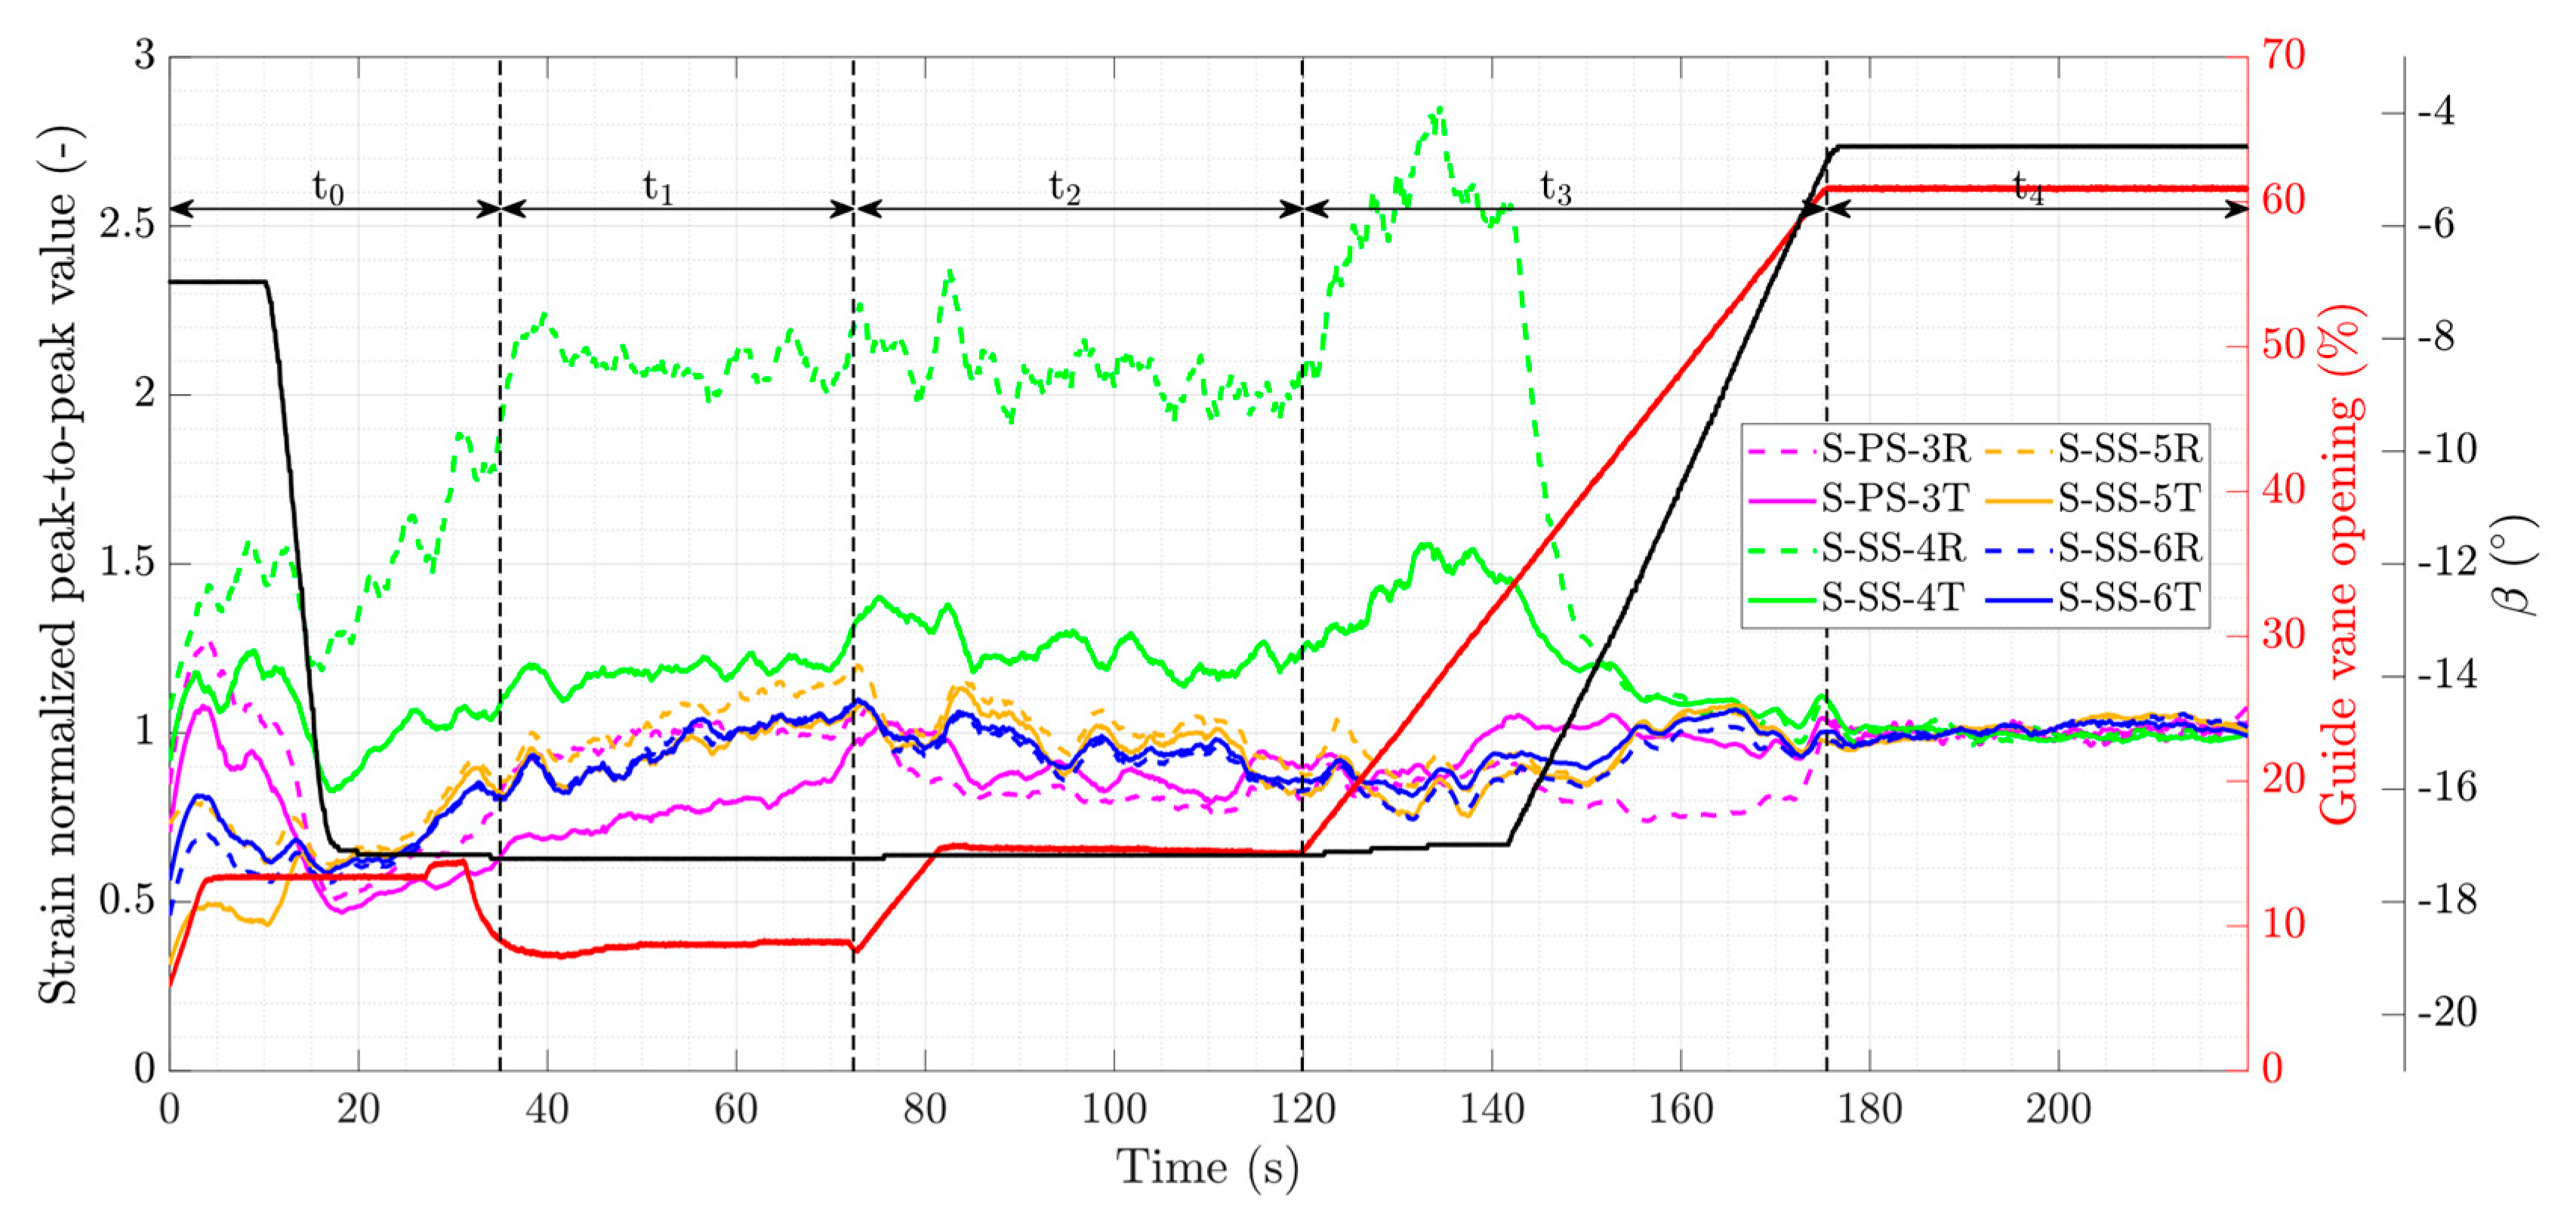
The fluctuating component of the strain on the runner blades is an important parameter to investigate the fatigue life of a turbine. To compare the fluctuation level of the strain signals, the normalized peak-to-peak values are presented in
Figure 14. The strain peak-to-peak values were normalized using the average value of each strain data during the last phase of the operation (steady-state operation). The average strain peak-to-peak values of 13.78, 14.96, 8.53, 7.08, 46.74, 108.05, 37.93 and 20.99
are obtained during the steady-state operation for S-PS-3R, S-PS-3T, S-SS-4R, S-SS-4T, S-SS-5R, S-SS-5T, S-SS-6R and S-SS-6T, respectively. After reaching the synchronous speed, the peak-to-peak values for all strain gauges, except for the ones installed close to the blade leading edge (S-SS-4R and S-SS-4T), have almost the same order of magnitude as those during the steady-state operation. Large peaks are observed for S-SS-4R and S-SS-4T around t = 135 s during the guide vane opening when the runner blades are rather fixed. Similar to the pressure results shown in
Figure 10, the peak-to-peak values first increase by opening the guide vanes and then decrease by opening the runner blades for all strain gauges as the guide vane and runner blade angle matche to achieve a smoother operation.
Four strain gauges were selected on the blade suction side to analyze the frequency content of their signals; two strain gauges were close to the blade leading edge, and the other two were close to the blade hub.
Figure 15 shows the time-frequency plots of strain gauges S-SS-4R and S-SS-4T. The color bar range is slightly different for the subfigures. A dominant normalized frequency (
) is observed for both strain gauges starting at the end of the acceleration phase. The dominant varying frequency is clearly seen for both strain gauges between t = 120 s and t = 140 s, which was previously observed for pressure sensors in
Figure 11a and
Figure 12. The main difference between the frequency spectrograms of the strain gauges in the radial and tangential direction at this location is the appearing time of the dominant normalized frequency of
and
. The dominant frequency of
appears at the beginning of the magnetization phase for the strain gauge S-SS-4T, whereas it only appears for a short time, t = 50–70 s in the speed-no-load for the strain gauge S-SS-4R. The dominant frequency of
could be observed from the beginning of the fourth stage for S-SS-4R, while it appears in the speed-no-load for S-SS-4T.
Figure 16 shows the spectrogram of the strain gauges S-SS-5R and S-SS-5T during the start-up. A varying dominant normalized frequency (reaching
) and its harmonics are observed for both strain gauges reaching their final value at the end of the acceleration phase. The dominant normalized frequency of
could be only seen for S-SS-5R appearing in the speed-no-load, approximately t = 50 s. This outcome indicates a fluid phenomenon that is initially oscillating in the radial direction close to the hub (S-SS-5R), at
, and then in the circumferential direction in the leading edge (S-SS-4T), at
. A dominant frequency of
and its harmonics are also observed for both strain gauges. This frequency could be attributed to the blade’s fundamental mode.


