Comprehensive Evaluation of the New Energy Power Generation Development at the Regional Level: An Empirical Analysis from China


Abstract
:
1. Introduction
2. Literature Review
3. Model Construction and Variables Description
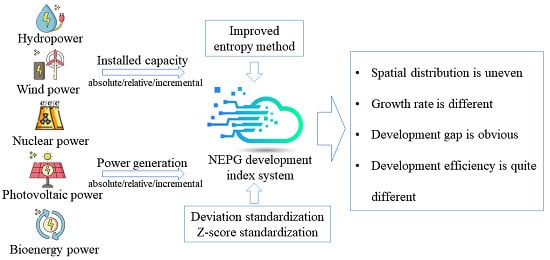
3.1. Regional NEPG Development Index System in China
3.2. Regional NEPG Development Model in China
3.2.1. Indicators Weight of Regional NEPG Development in China
3.2.2. NEPG Development Comprehensive Evaluation Model in China
4. Empirical Analysis
4.1. Basic Data
4.2. Analysis and Discussion
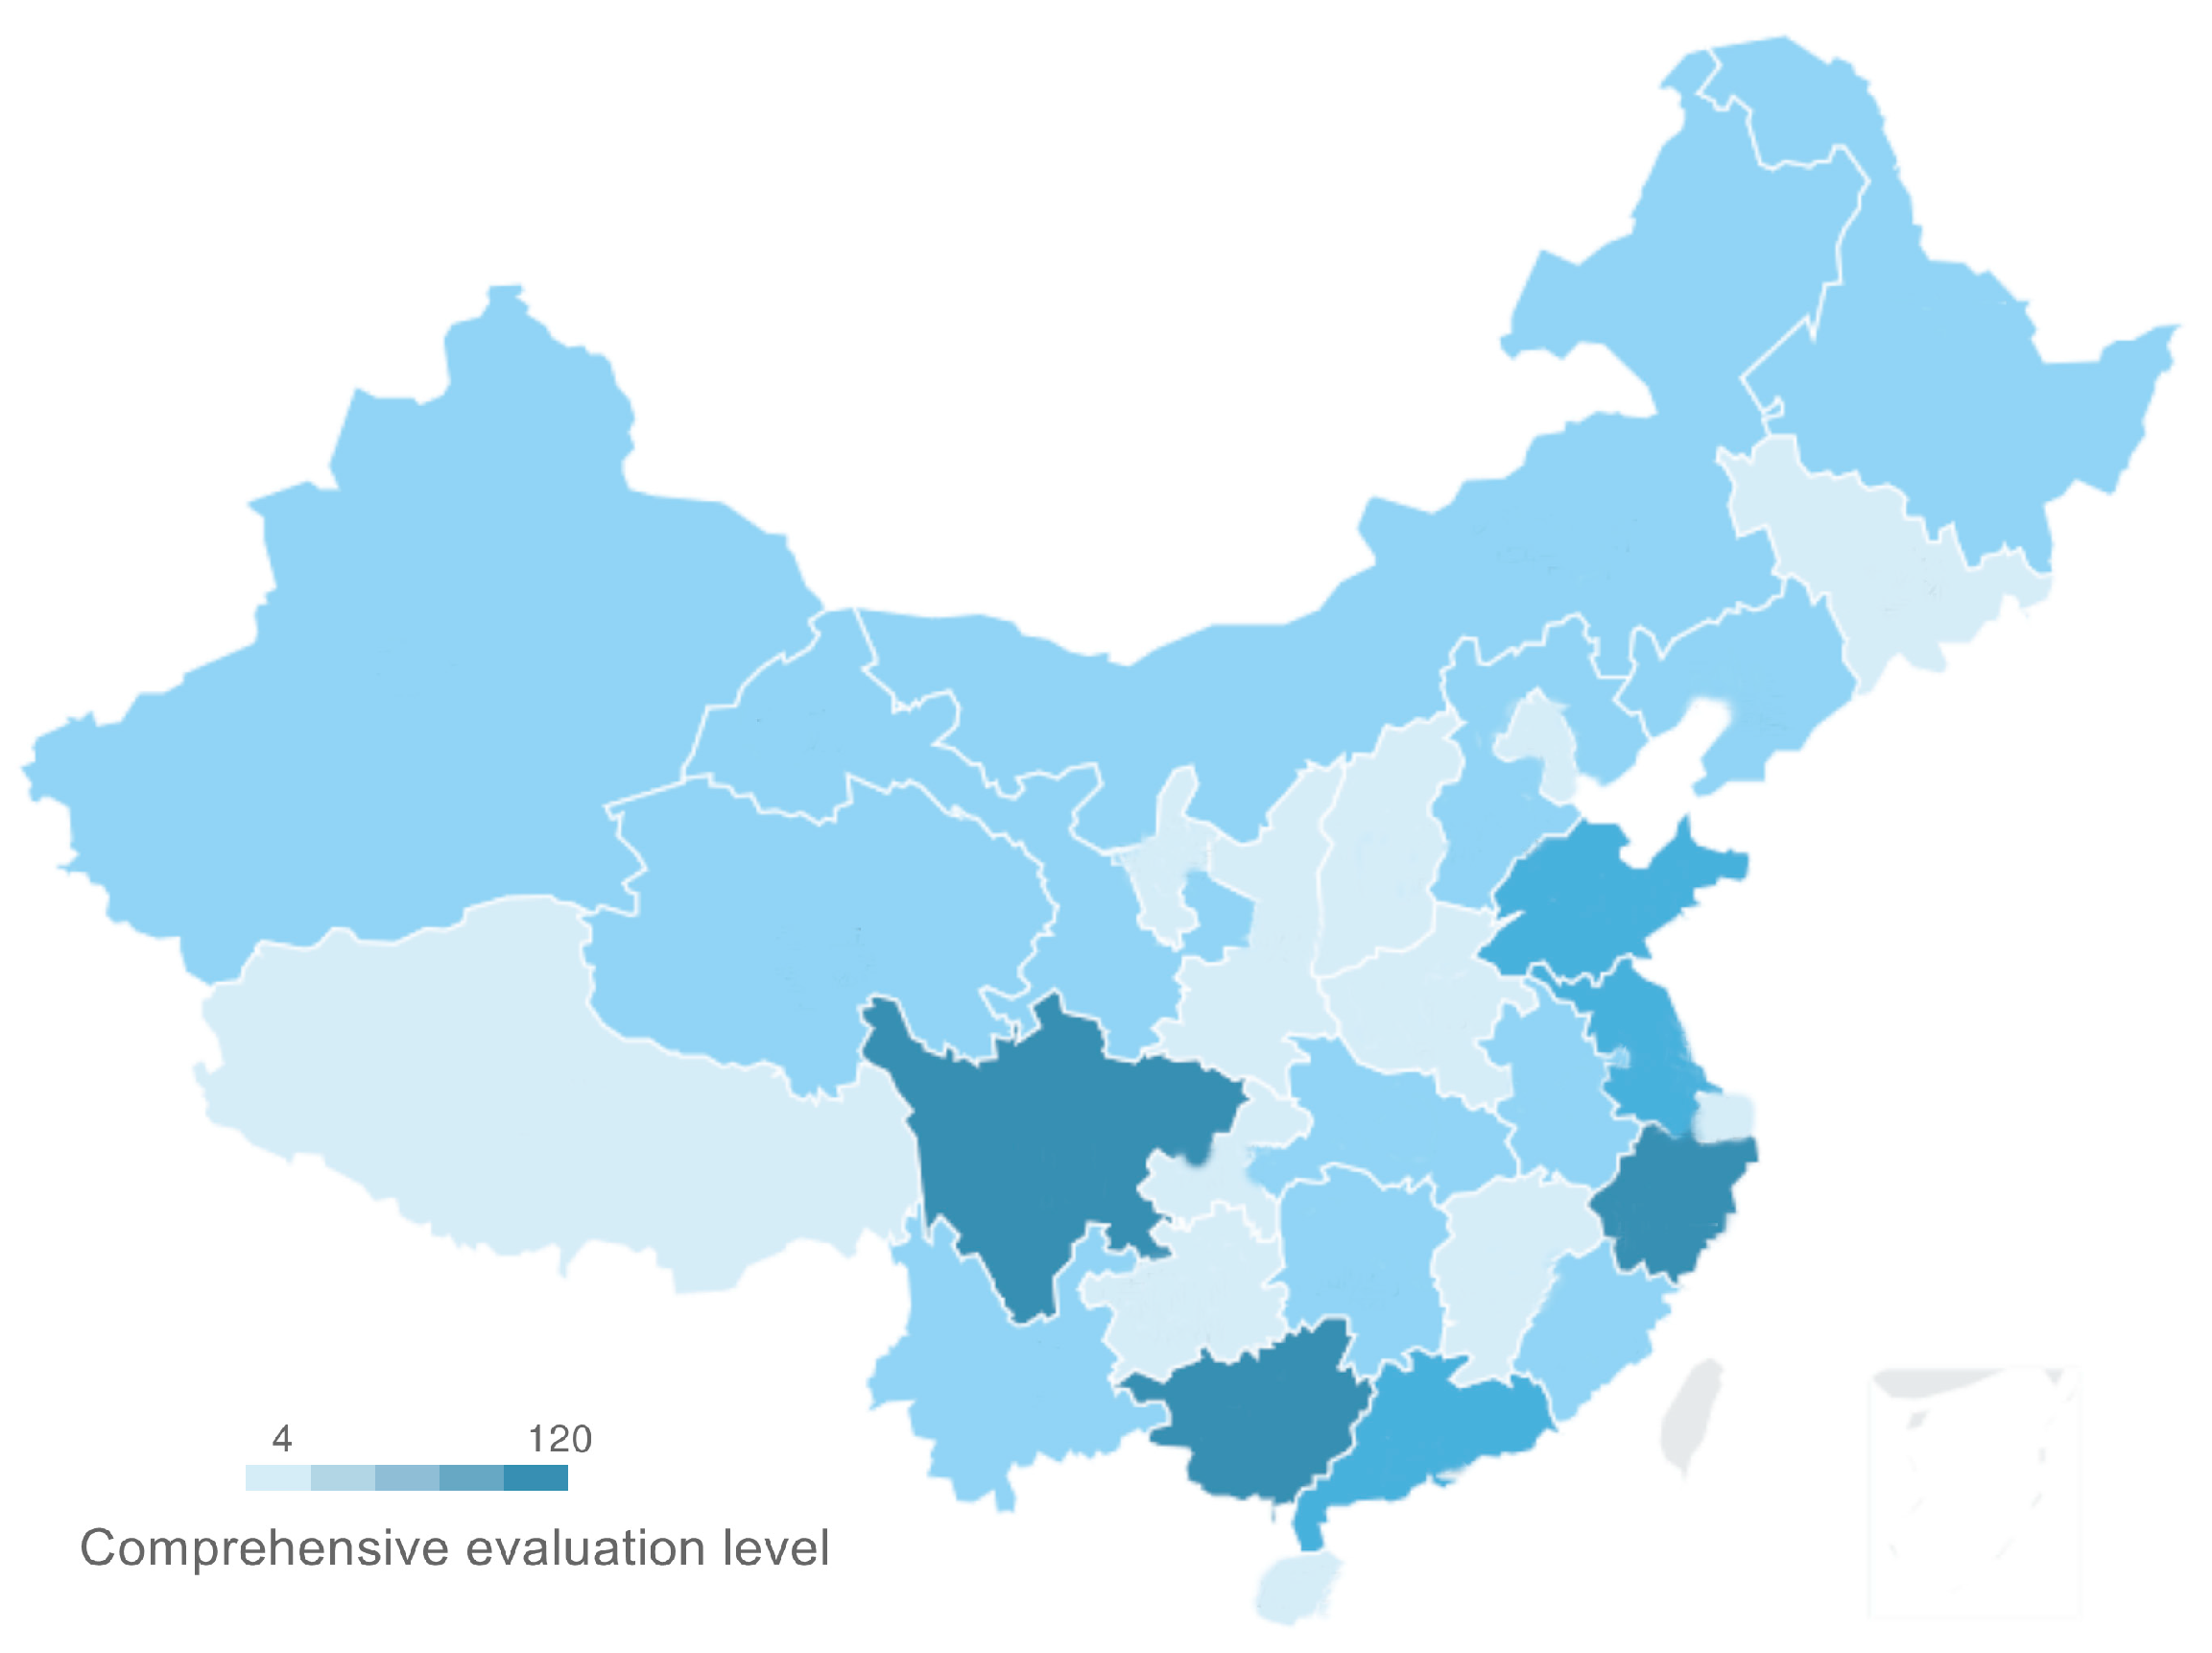
4.2.1. Spatial Distribution of NEPG Development
4.2.2. Analysis of the NEPG Development
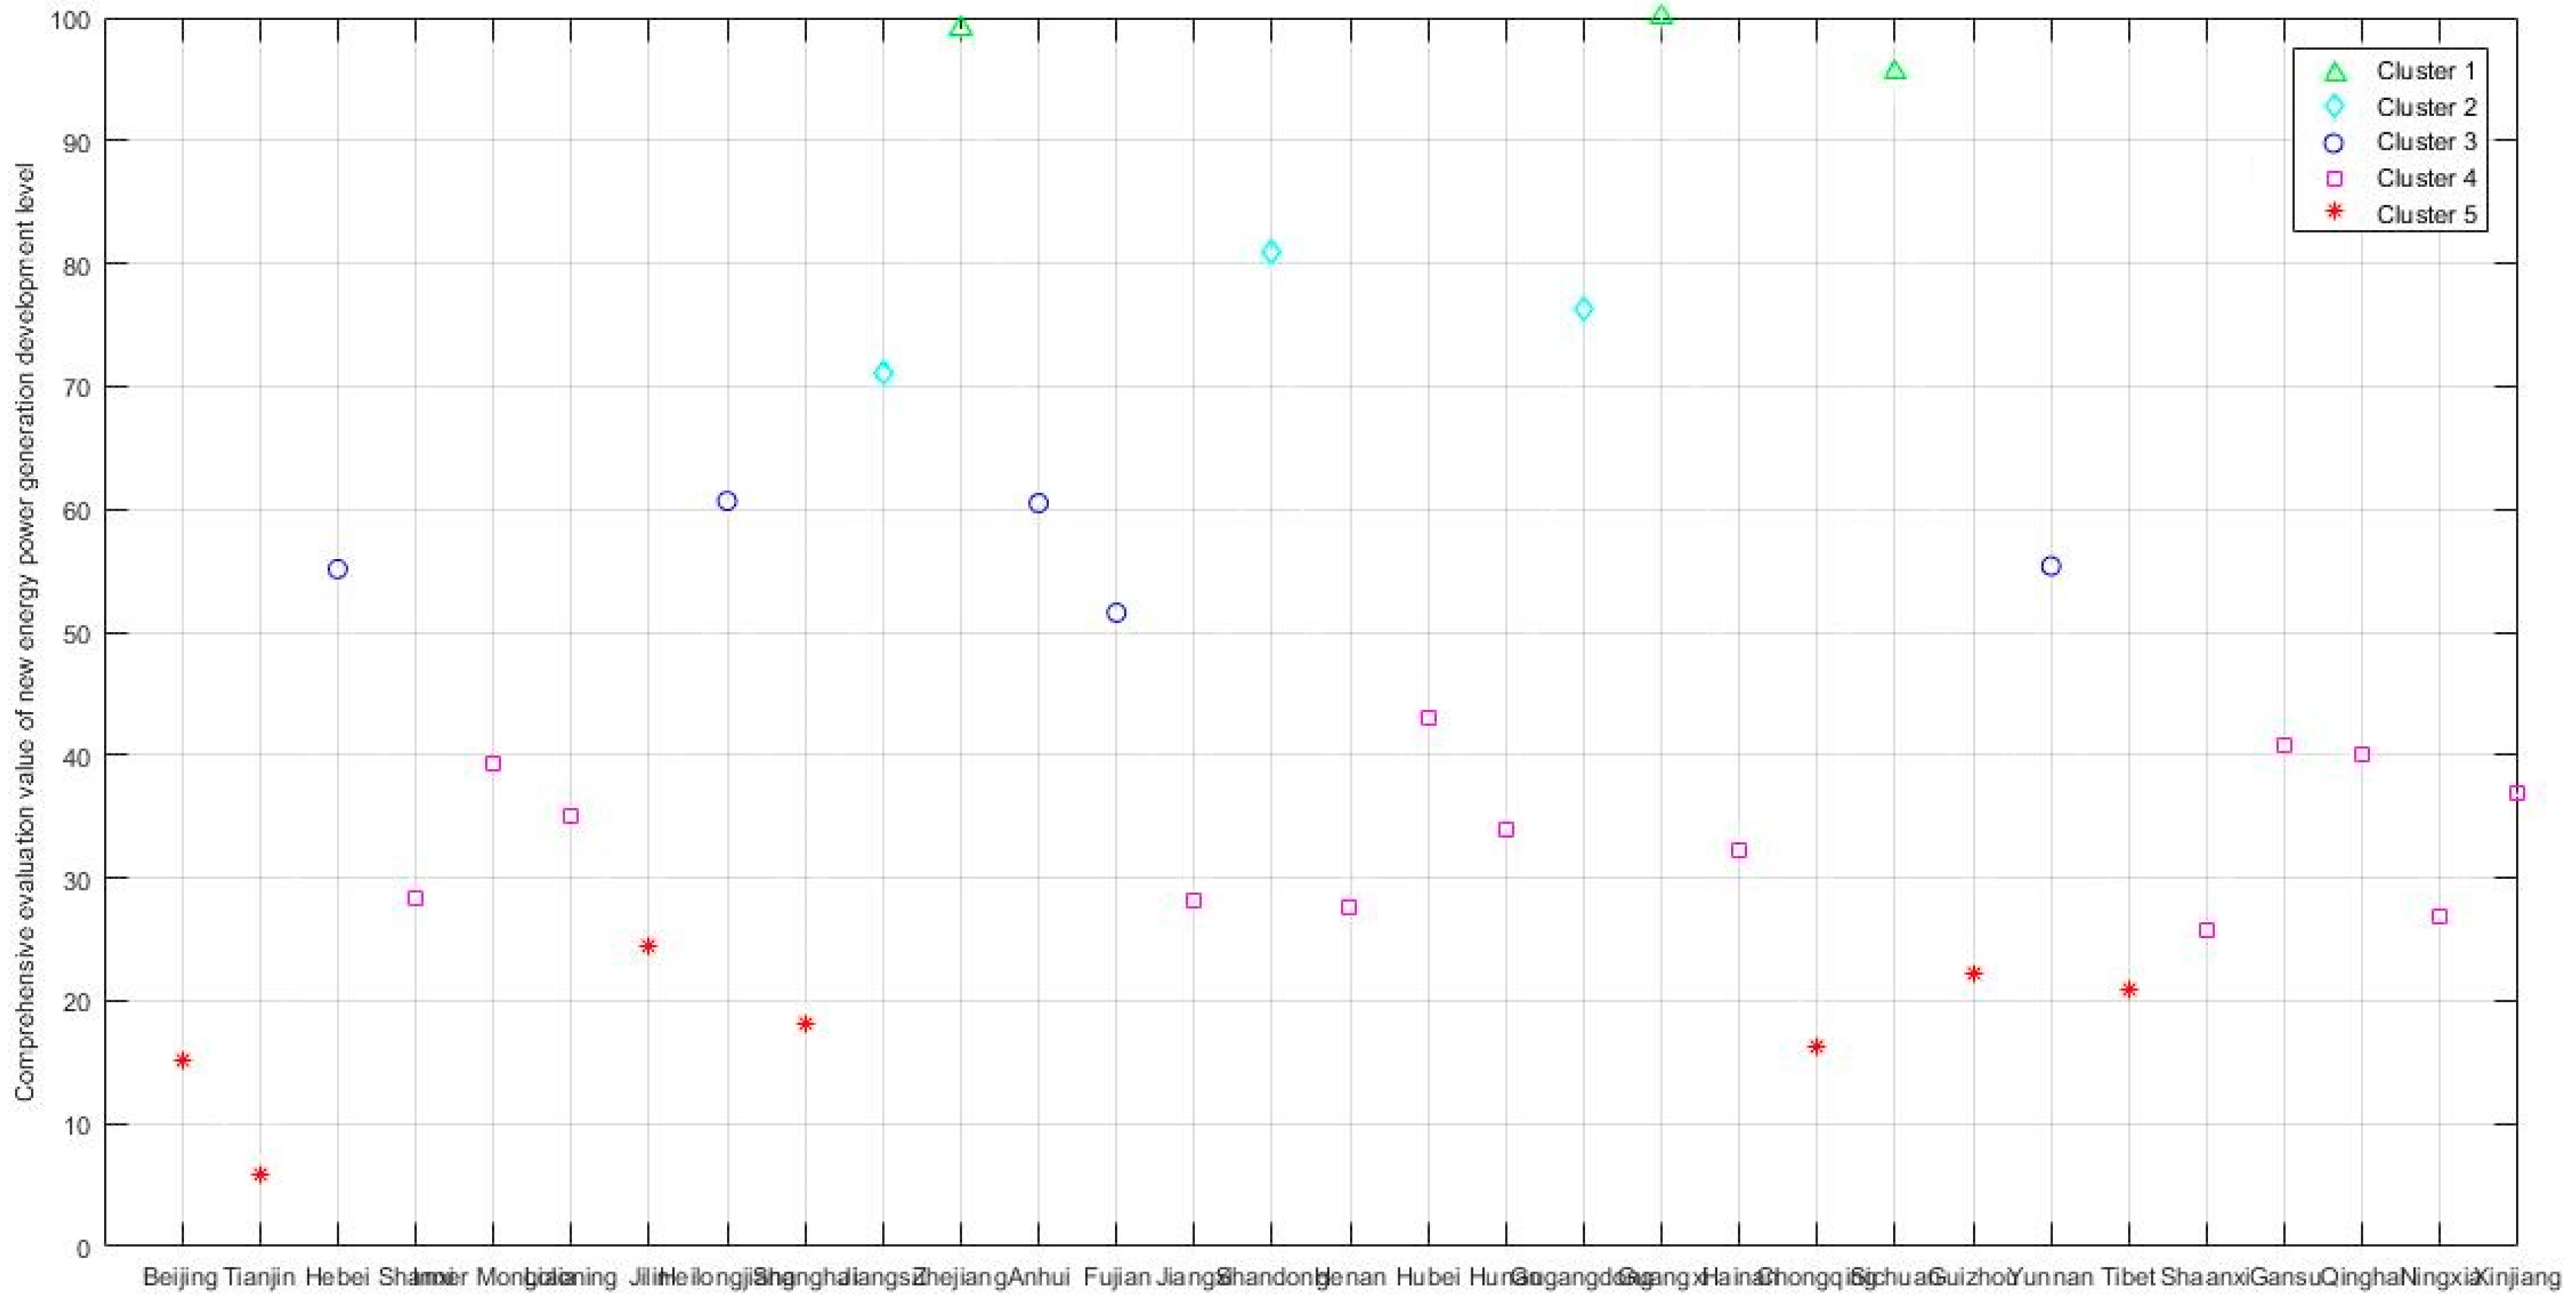
4.2.3. NEPG Development Cluster Analysis
4.2.4. Analysis of Development Efficiency of NEPG
4.3. Robustness Test
5. Conclusions and Implications
5.1. Research Conclusions
- The spatial distribution of NEPG development in China is uneven. The coastal, southwestern, and northeastern provinces with better nature endowment in developing new energy gain a higher level of comprehensive development and utilization of new energy. The empirical analysis demonstrates that the comprehensive development of most central provinces, which lack the natural advantages of developing new energy, is still underdeveloped.
- The growth rate of NEPG in China varies from province to province. Provinces with higher levels of development, such as Guangxi, have slowed down in recent years, paying more attention to the scientific and rational use of new energy sources and moderate development. More and more provinces pay more attention to the development of NEPG.
- The NEPG development at regional level in China is unbalanced. The results of cluster analysis showed that the first two categories with higher comprehensive evaluation had only six provinces, and the comprehensive evaluation results of most provinces were below 65 points, and the gap between the regions was large.
- The province may perform quite different in development efficiency and the comprehensive evaluation results of NEPG in China. The comprehensive evaluation results of coastal developed provinces are relatively high, but the development efficiency is relatively low; the development of NEPG in emerging provinces is developing rapidly and the market development potential is huge there.
5.2. Practical Implications
- At the national level, macro-control of regional NEPG development should be implemented. Regions with poor development of NEPG should encourage vigorous development of new energy by increasing policy and financial support.
- At the provincial level, coordinated energy policy should be introduced across provinces. On the basis of the uneven development of NEPG in all dimensions, the provinces can actively explore and formulate corresponding NEPG development strategies according to their own development conditions and local conditions.
- More exchanges between the provinces and mutual experience. More interactions between different regions should be carried out, to replicate the advanced development concepts and methods of provinces with higher energy development, to help other provinces to reduce environmental damage, reduce waste of resources, and work for sustainable human development.
- The methods and conclusions of this study could be used for reference by other countries, especially for countries vast in territory. When developing NEPG, those countries probably encounter the problems of unbalanced regional development and unequal natural advantages of new energy. This research may provide reference in formulating policies and exploring the emerging market.
Author Contributions
Funding
Conflicts of Interest
Appendix A

| Province | Comprehensive Evaluation Level | Absolute Development | Relative Development | Incremental Development |
|---|---|---|---|---|
| Shandong | 0.372739 | 0.2914 | 0.100251 | 0.51194 |
| Jiangsu | 0.310845 | 0.273211 | 0.106734 | 0.430755 |
| Inner Mongolia | 0.170555 | 0.22079 | 0.114061 | 0.175047 |
| Guangdong | 0.374026 | 0.399573 | 0.21434 | 0.285213 |
| Henan | 0.151462 | 0.122917 | 0.060641 | 0.193957 |
| Shanxi | 0.146435 | 0.134216 | 0.082839 | 0.174601 |
| Zhejiang | 0.467766 | 0.383206 | 0.23135 | 0.50183 |
| Xinjiang | 0.16126 | 0.198411 | 0.127109 | 0.163395 |
| Anhui | 0.291262 | 0.179382 | 0.109416 | 0.414993 |
| Hebei | 0.249446 | 0.198267 | 0.137085 | 0.327145 |
| Liaoning | 0.185255 | 0.156084 | 0.200129 | 0.130668 |
| Guizhou | 0.119804 | 0.09313 | 0.114529 | 0.130941 |
| Shaanxi | 0.123387 | 0.080949 | 0.080402 | 0.199427 |
| Fujian | 0.26084 | 0.221569 | 0.286275 | 0.162503 |
| Hubei | 0.212726 | 0.194563 | 0.178105 | 0.18744 |
| Ningxia | 0.135314 | 0.116551 | 0.151096 | 0.126155 |
| Shanghai | 0.116186 | 0.026104 | 0.056815 | 0.195631 |
| Hunan | 0.171264 | 0.10731 | 0.161569 | 0.193418 |
| Guangxi | 0.436239 | 0.517119 | 0.575757 | 0.134346 |
| Heilongjiang | 0.282787 | 0.095394 | 0.193297 | 0.430787 |
| Gansu | 0.183019 | 0.167117 | 0.21172 | 0.165086 |
| Jiangxi | 0.153381 | 0.086091 | 0.113692 | 0.192766 |
| Jilin | 0.130254 | 0.080936 | 0.176961 | 0.116364 |
| Yunnan | 0.227869 | 0.23606 | 0.224692 | 0.230424 |
| Sichuan | 0.321204 | 0.254522 | 0.209359 | 0.602018 |
| Chongqing | 0.092655 | 0.033641 | 0.105331 | 0.13484 |
| Tianjin | 0.040473 | 0.009381 | 0.03009 | 0.060811 |
| Beijing | 0.102121 | 0.027417 | 0.106781 | 0.130142 |
| Hainan | 0.168618 | 0.049273 | 0.367527 | 0.077558 |
| Qinghai | 0.17805 | 0.131182 | 0.312359 | 0.116354 |
| Tibet | 0.110431 | 0.010877 | 0.266754 | 0.079713 |
References
- Yuan, X.; Mu, R.; Zuo, J.; Wang, Q. Economic Development, Energy Consumption, and Air Pollution, A Critical Assessment in China. Hum. Ecol. Risk Assess. Int. J. 2015, 21, 781–798. [Google Scholar] [CrossRef]
- Zou, C.; Zhao, Q.; Zhang, G.; Xiong, B. Energy revolution, From a fossil energy era to a new energy era. Nat. Gas Ind. B 2016, 3, 1–11. [Google Scholar] [CrossRef]
- Afgan, N.H.; Carvalho, M.G. Multi-criteria assessment of new and renewable energy power plants. Energy 2002, 27, 739–755. [Google Scholar] [CrossRef]
- Wu, C.Y.; Zhao, A.; Lu, X.; Wu, D. Driving Forces of Consumption Pressure and Intensity Decomposition of Non-renewable Energy Resources of China (in Chinese). China Popul. Resour. Environ. 2011, 135, 61–66. [Google Scholar]
- Jeffery, J. Hydrocarbons and Russian Foreign Policy in the Post-Communist Era (1991–2008): A Case Study. Ph.D. Thesis, University of Cape Town, Cape Town, South Africa, 2010. [Google Scholar]
- China Recycling Economy Association Renewable Energy Professional Committee (CREIA). REN21 Global Renewable Energy Status Report 2018. Energy 2018, 116, 93. [Google Scholar]
- Xi Jinping’s Report at the Nineteenth National Congress of the Communist Party of China. Available online: http://jhsjk.people.cn/article/29613660 (accessed on 3 November 2019).
- Jiang, B.; Sun, Z.; Liu, M. China’s energy development strategy under the low-carbon economy. Energy 2010, 35, 4257–4264. [Google Scholar] [CrossRef]
- Yao, L.; Chang, Y. Energy security in China, a quantitative analysis and policy implications. Energy Policy 2014, 67, 595–604. [Google Scholar] [CrossRef]
- Yao, Y. Research on the financing problem of the development of new energy industry in China; Sichuan Academy of Social Sciences: Sichuan, China, 2016; p. 3. (in Chinese) [Google Scholar]
- Kahia, M.; Jebli, M.B.; Belloumi, M. Analysis of the impact of renewable energy consumption and economic growth on carbon dioxide emissions in 12 MENA countries. Clean Technol. Environ. Policy 2019, 21, 871–885. [Google Scholar] [CrossRef]
- Polzin, F.; Migendt, M.; Täube, F.A.; von Flotow, P. Public policy influence on renewable energy investments—A panel data study across OECD countries. Energy Policy 2015, 80, 98–111. [Google Scholar] [CrossRef]
- Alvarez-Herranz, A.; Balsalobre-Lorente, D.; Shahbaz, M.; Cantos, J.M. Energy innovation and renewable energy consumption in the correction of air pollution levels. Energy Policy 2017, 105, 386–397. [Google Scholar] [CrossRef]
- Irandoust, M. The renewable energy-growth nexus with carbon emissions and technological innovation, Evidence from the Nordic countries. Ecol. Indic. 2016, 69, 118–125. [Google Scholar] [CrossRef]
- Tigabu, A.D.; Berkhout, F.; van Beukering, P. The diffusion of a renewable energy technology and innovation system functioning, comparing bio-digestion in Kenya and Rwanda. Technol. Forecast. Soc. Chang. 2015, 90, 331–345. [Google Scholar] [CrossRef]
- Moriarty, P.; Honnery, D. Can renewable energy power the future? Energy Policy 2016, 93, 3–7. [Google Scholar] [CrossRef]
- Lin, B.; Liu, C. Why is electricity consumption inconsistent with economic growth in China? Energy Policy 2016, 88, 310–316. [Google Scholar] [CrossRef]
- Tsai, S.B.; Xue, Y.; Zhang, J.; Chen, Q.; Liu, Y.; Zhou, J.; Dong, W. Models for forecasting growth trends in renewable energy. Renew. Sustain. Energy Rev. 2017, 77, 1169–1178. [Google Scholar] [CrossRef]
- Liu, G.; Yang, Z.; Tang, Y.; Ulgiati, S. Spatial correlation model of economy-energy-pollution interactions, the role of river water as a link between production sites and urban areas. Renew. Sustain. Energy Rev. 2017, 69, 1018–1028. [Google Scholar] [CrossRef]
- Wang, S.; Song, J.; Wang, X.E.; Yang, W. The Spatial and Temporal Research on the Coupling and Coordinated Relationship between Social Economy and Energy Environment in the Belt and Road Initiatives. Sustainability 2019, 11, 407. [Google Scholar] [CrossRef]
- Morris, J.F.; Reilly, J.M.; Chen, Y.H.H. Advanced technologies in energy-economy models for climate change assessment. Energy Econ. 2019, 80, 476–490. [Google Scholar] [CrossRef]
- Zheng, C.W.; Li, C.Y.; Pan, J.; Liu, M.Y.; Xia, L.L. An overview of global ocean wind energy resource evaluations. Renew. Sustain. Energy Rev. 2016, 53, 1240–1251. [Google Scholar] [CrossRef]
- Wang, J.; Hu, J.; Ma, K. Wind speed probability distribution estimation and wind energy assessment. Renew. Sustain. Energy Rev. 2016, 60, 881–899. [Google Scholar] [CrossRef]
- Liang, X.; Si, D.; Xu, J. Quantitative evaluation of the sustainable development capacity of hydropower in China based on information entropy. Sustainability 2018, 10, 529. [Google Scholar] [CrossRef]
- Yamazaki, M.; Takeda, S. A computable general equilibrium assessment of Japan’s nuclear energy policy and implications for renewable energy. Environ. Econ. Policy Stud. 2017, 19, 537–554. [Google Scholar] [CrossRef]
- Zhang, J. Research on power quality problems based on smart grid and new energy generation. In AIP Conference Proceedings, Proceedings of the 4th International Conference on Energy Science and Applied Technology (EAST 2018), Chongqing, China, 29–30, December, 2018; AIP Publishing: Melville, NY, USA, 2019; Volume 2066, p. 020022. [Google Scholar]
- Thangavelu, S.R.; Khambadkone, A.M.; Karimi, I.A. Long-term optimal energy mix planning towards high energy security and low GHG emission. Appl. Energy 2015, 154, 959–969. [Google Scholar] [CrossRef]
- Xu, X.; Niu, D.; Qiu, J.; Wu, M.; Wang, P.; Qian, W.; Jin, X. Comprehensive Evaluation of Coordination Development for Regional Power Grid and Renewable Energy Power Supply Based on Improved Matter Element Extension and TOPSIS Method for Sustainability. Sustainability 2016, 8, 143. [Google Scholar] [CrossRef]
- Yu, S.; Zheng, Y.; Li, L. A comprehensive evaluation of the development and utilization of China’s regional renewable energy. Energy Policy 2019, 127, 73–86. [Google Scholar] [CrossRef]
- Zeng, Y.; Guo, W.; Zhang, F. Comprehensive evaluation of renewable energy technical plans based on data envelopment analysis. Energy Procedia 2019, 158, 3583–3588. [Google Scholar] [CrossRef]
- Tsai, S.B. Using grey models for forecasting China’s growth trends in renewable energy consumption. Clean Technol. Environ. Policy 2016, 18, 563–571. [Google Scholar] [CrossRef]
- Zhou, D.; Al-Durra, A.; Zhang, K.; Ravey, A.; Gao, F. A robust prognostic indicator for renewable energy technologies: A novel error correction grey prediction model. IEEE Trans. Ind. Electron. 2019, 66, 9312–9325. [Google Scholar] [CrossRef]
- Ang, B.W.; Xu, X.Y.; Su, B. Multi-country comparisons of energy performance, the index decomposition analysis approach. Energy Econ. 2015, 47, 68–76. [Google Scholar] [CrossRef]
- Peng, C.; Wu, X.; Fu, Y.; Lai, K.K. Alternative approaches to constructing composite indicators, an application to construct a sustainable energy index for APEC economies. Oper. Res. 2017, 17, 747–759. [Google Scholar] [CrossRef]
- Şengül, Ü.; Eren, M.; Shiraz, S.E.; Gezder, V.; Şengül, A.B. Fuzzy TOPSIS method for ranking renewable energy supply systems in Turkey. Renew. Energy 2015, 75, 617–625. [Google Scholar] [CrossRef]
- Meng, F.; Jin, X. Evaluation of the Development Capability of the New Energy Vehicle Industry: An Empirical Study from China. Sustainability 2019, 11, 2635. [Google Scholar] [CrossRef]
- Arora, P.; Varshney, S. Analysis of k-means and k-medoids algorithm for big data. Procedia Comput. Sci. 2016, 78, 507–512. [Google Scholar] [CrossRef] [Green Version]
- Qiao, J.J. Application of Improved Entropy Method in Henan Sustainable Development Evaluation. Resour. Sci. 2004, 26, 113–118. [Google Scholar]
- Guo, T.; GAO, Y.; Zhou, X.; Li, Y.; Liu, J. Optimal Scheduling of Power System Incorporating the Flexibility of Thermal Units. Energies 2018, 11, 2195. [Google Scholar] [CrossRef] [Green Version]
- Zhang, M.; Zhou, J.; Zhou, R. Evaluating Sustainability of Regional Water Resources Based on Improved Generalized Entropy Method. Entropy 2018, 20, 715. [Google Scholar] [CrossRef] [Green Version]
- Jayalakshmi, T.; Santhakumaran, A. Statistical normalization and back propagation for classification. Int. J. Comput. Theory Eng. 2011, 3, 1793–8201. [Google Scholar]
- China’s New Energy Installed Capacity and New Energy Power Generation Capacity in 2016 and 2017. Available online: http://data.stats.gov.cn/english/ (accessed on 23 November 2019).
- Druică, E.; Ianole-Calin, R. Simply Clustering. Making New Sense in the Five Facets Mindfulness Questionnaire. Rom. Stat. Rev. 2018, 1, 61–81. [Google Scholar]
- Altman, E.I.; Iwanicz-Drozdowska, M.; Laitinen, E.K.; Suvas, A. Financial distress prediction in an international context, A review and empirical analysis of Altman’s Z-score model. J. Int. Financ. Manag. Account. 2017, 28, 131–171. [Google Scholar] [CrossRef]
- Zhou, H.; Deng, Z.; Xia, Y.; Fu, M. A new sampling method in particle filter based on Pearson correlation coefficient. Neurocomputing 2016, 216, 208–215. [Google Scholar] [CrossRef]
- Li, M.; Patiño-Echeverri, D.; Zhang, J.J. Policies to promote energy efficiency and air emissions reductions in China’s electric power generation sector during the 11th and 12th five-year plan periods: Achievements, remaining challenges, and opportunities. Energy Policy 2019, 125, 429–444. [Google Scholar] [CrossRef]


| First-Tier Indicators | Second-Tier Indicators | Third-Tier Indicators | Four-Tier Indicators |
|---|---|---|---|
| Comprehensive evaluation of NEPG development (S) | Absolute development of NEPG (A) | Absolute development of hydropower (A1) | Absolute installed capacity of hydropower (A11) Absolute power generation of hydropower (A12) |
| Absolute development of wind power (A2) | Absolute installed capacity of wind power (A21) Absolute power generation of wind power (A22) | ||
| Absolute development of nuclear power (A3) | Absolute installed capacity of nuclear power (A31) Absolute power generation of nuclear power (A32) | ||
| Absolute development of photovoltaic power (A4) | Absolute installed capacity of photovoltaic power (A41) Absolute power generation of photovoltaic power (A42) | ||
| Absolute development of bioenergy power (A5) | Absolute installed capacity of bioenergy power (A51) Absolute power generation of bioenergy power (A52) | ||
| Relative NEPG development (B) | Relative development of hydropower (B1) | Relative installed capacity of hydropower (B11) Relative power generation of hydropower (B12) | |
| Relative development of wind power (B2) | Relative installed capacity of wind power (B21) Relative power generation of wind power (B22) | ||
| Relative development of nuclear power (B3) | Relative installed capacity of hydropower (B31) Relative power generation of hydropower (B32) | ||
| Relative development of photovoltaic power (B4) | Relative installed capacity of photovoltaic power (B41) Relative power generation of photovoltaic power (B42) | ||
| Relative development of bioenergy power (B5) | Relative installed capacity of bioenergy power (B51) Relative power generation of bioenergy power (B52) | ||
| Incremental NEPG development (C) | Incremental development of hydropower (C1) | Incremental installed capacity of hydropower (C11) Increased generation of hydropower (C12) | |
| Incremental development of wind power (C2) | Incremental installed capacity of wind power (C21) Increased generation of wind power (C22) | ||
| Incremental development of nuclear power (C3) | Incremental installed capacity of nuclear power (C31) Increased generation of nuclear power (C32) | ||
| Incremental development of photovoltaic power (C4) | Incremental installed capacity of photovoltaic power (C41) Increased generation of photovoltaic power (C42) | ||
| Incremental development of bioenergy power (C5) | Incremental installed capacity of bioenergy generation (C51) Increased generation of bioenergy generation (C52) |
| Rank | Comprehensive Evaluation | Absolute Development | Relative Development | Incremental Development |
|---|---|---|---|---|
| 1 | Guangxi | Guangxi | Guangxi | Sichuan |
| 2 | Zhejiang | Guangdong | Hainan | Shandong |
| 3 | Sichuan | Zhejiang | Qinghai | Zhejiang |
| 4 | Shandong | Shandong | Fujian | Heilongjiang |
| 5 | Guangdong | Jiangsu | Tibet | Jiangsu |
| 6 | Jiangsu | Sichuan | Zhejiang | Anhui |
| 7 | Heilongjiang | Yunnan | Yunnan | Hebei |
| 8 | Anhui | Fujian | Guangdong | Guangdong |
| 9 | Yunnan | Inner Mongolia | Gansu | Yunnan |
| 10 | Hebei | Xinjiang | Sichuan | Shaanxi |
| 11 | Fujian | Hebei | Liaoning | Shanghai |
| 12 | Hubei | Hubei | Heilongjiang | Henan |
| 13 | Gansu | Anhui | Hubei | Hunan |
| 14 | Qinghai | Gansu | Jilin | Jiangxi |
| 15 | Inner Mongolia | Liaoning | Hunan | Hubei |
| 16 | Xinjiang | Shanxi | Ningxia | Inner Mongolia |
| 17 | Liaoning | Qinghai | Hebei | Shanxi |
| 18 | Hunan | Henan | Xinjiang | Gansu |
| 19 | Hainan | Ningxia | Guizhou | Xinjiang |
| 20 | Shanxi | Hunan | Inner Mongolia | Fujian |
| 21 | Jiangxi | Heilongjiang | Jiangxi | Chongqing |
| 22 | Henan | Guizhou | Anhui | Guangxi |
| 23 | Ningxia | Jiangxi | Beijing | Guizhou |
| 24 | Shaanxi | Shaanxi | Jiangsu | Liaoning |
| 25 | Jilin | Jilin | Chongqing | Beijing |
| 26 | Guizhou | Hainan | Shandong | Ningxia |
| 27 | Tibet | Chongqing | Shanxi | Jilin |
| 28 | Shanghai | Beijing | Shaanxi | Qinghai |
| 29 | Chongqing | Shanghai | Henan | Tibet |
| 30 | Beijing | Tibet | Shanghai | Hainan |
| 31 | Tianjin | Tianjin | Tianjin | Tianjin |
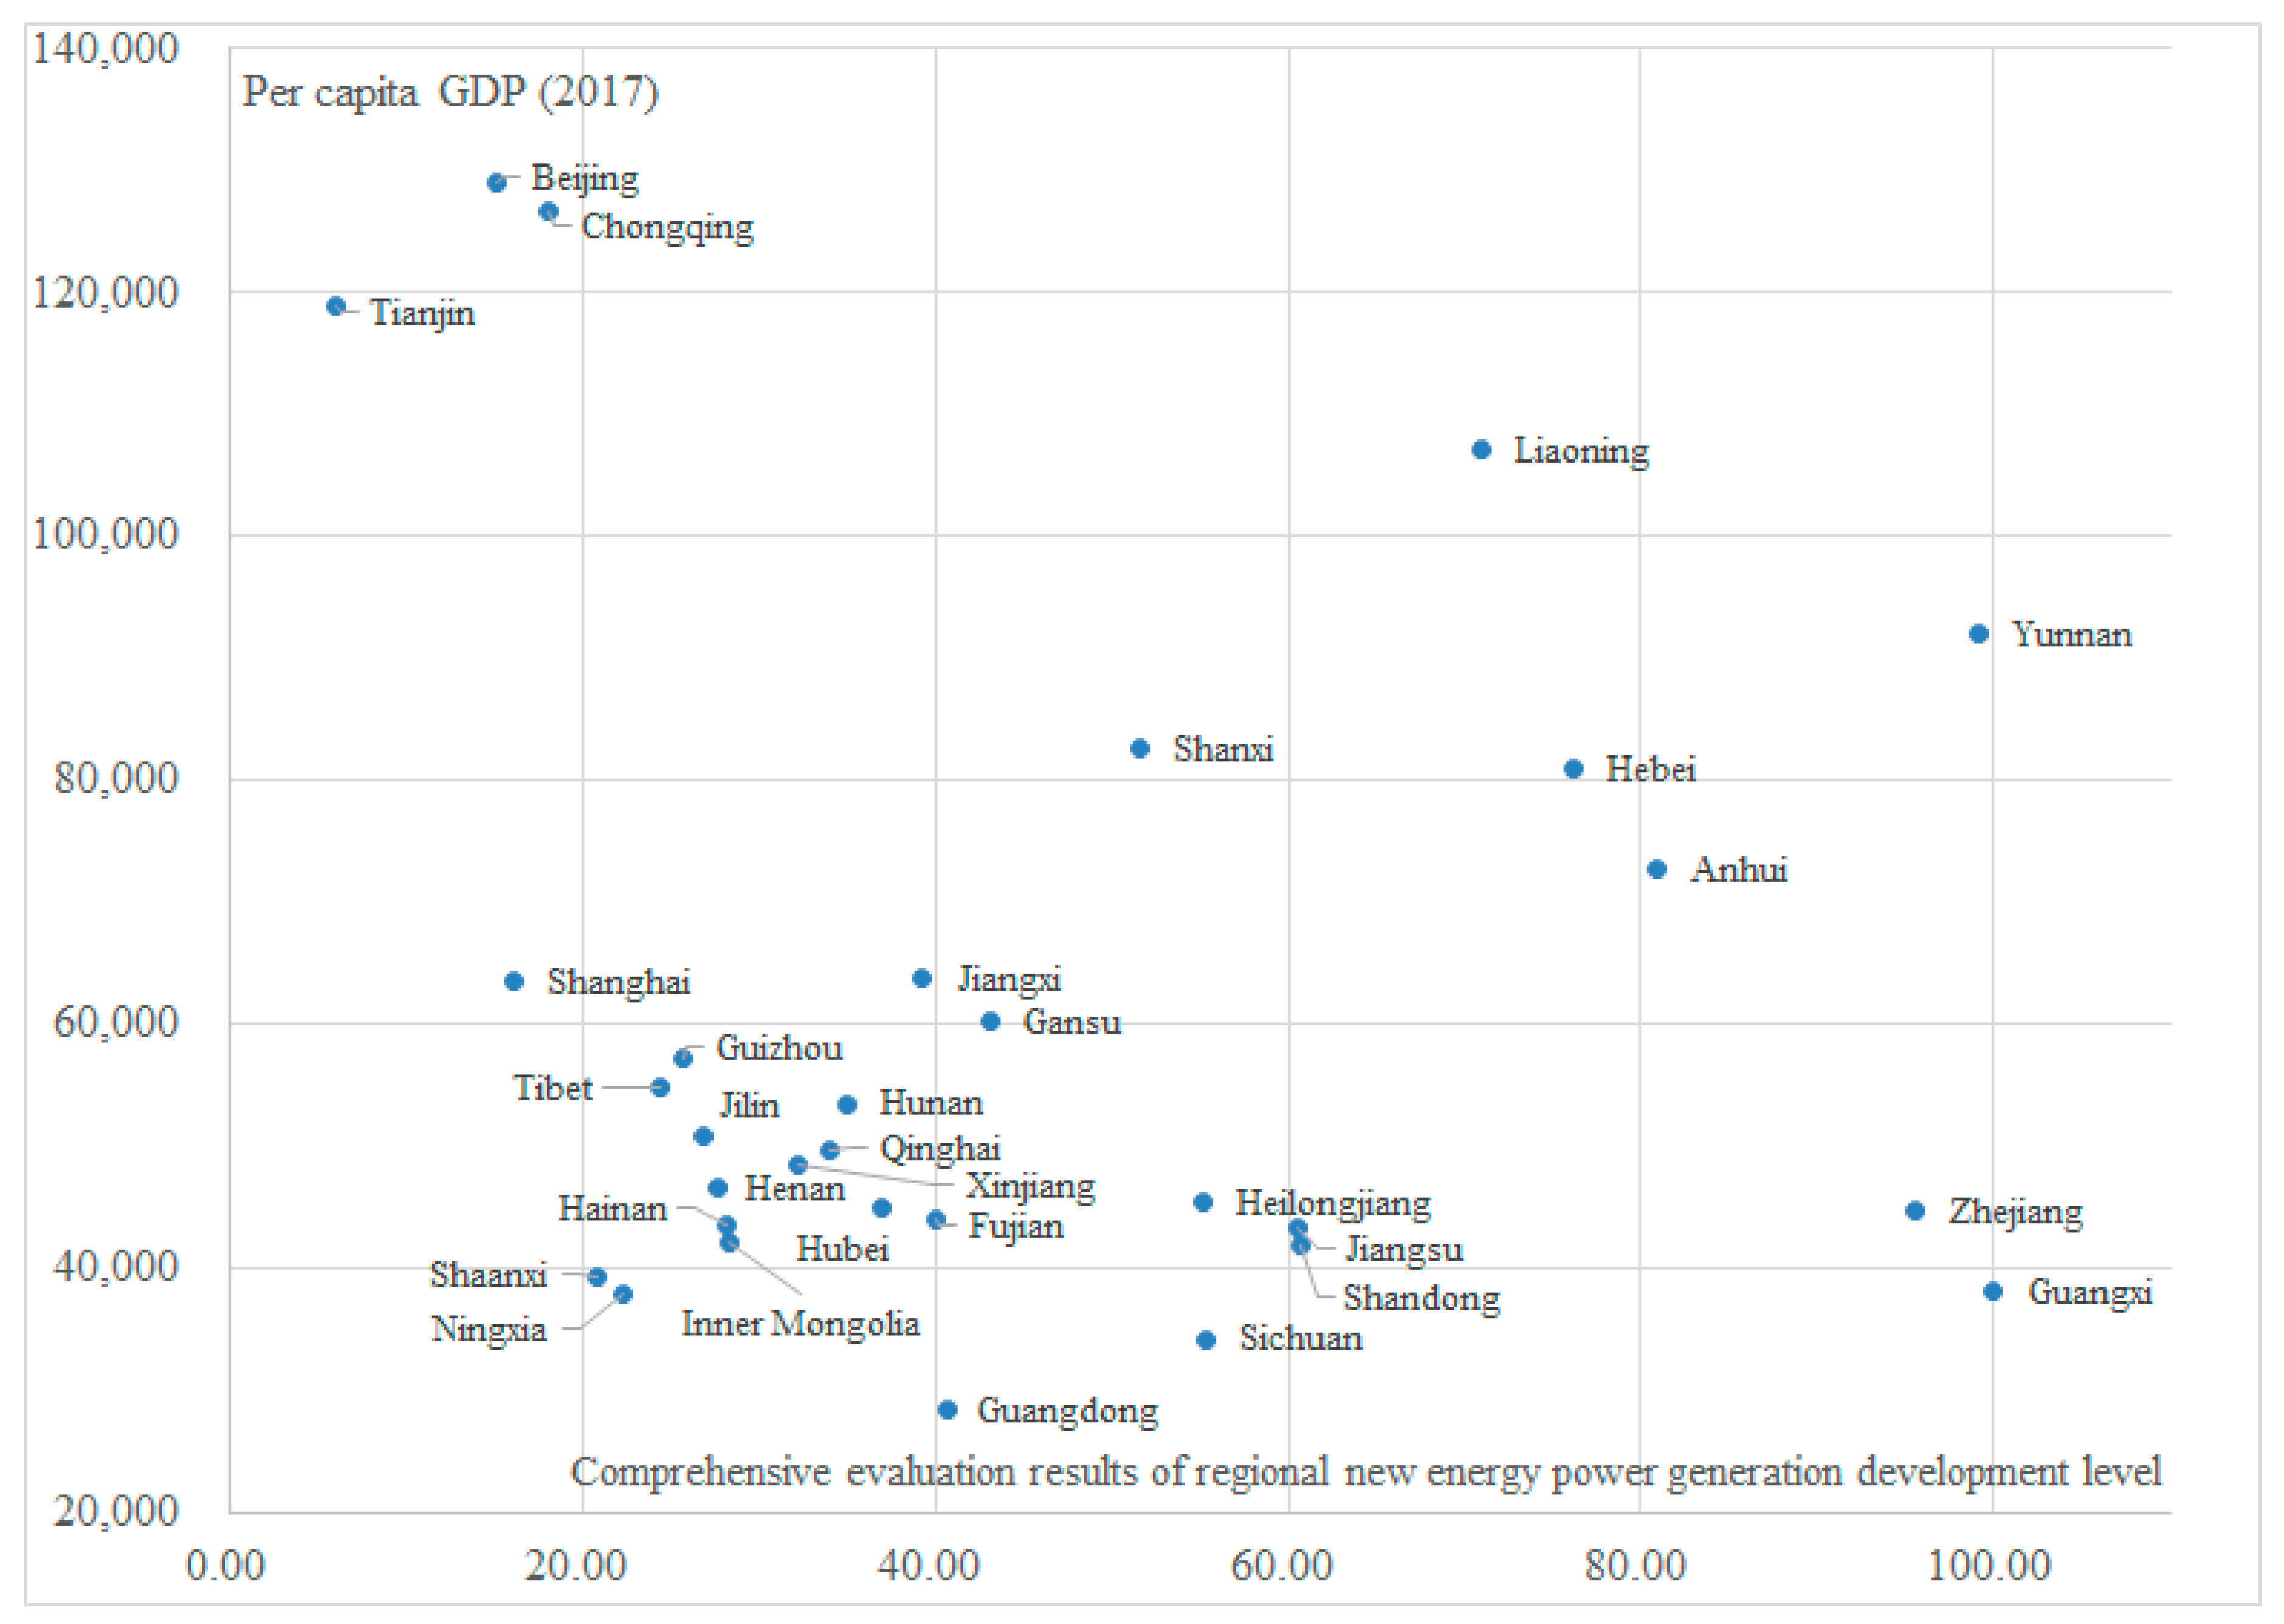
| Province | Comprehensive Evaluation Level | Per Capita GDP | Development Efficiency |
|---|---|---|---|
| Guangxi | 100.00 | 38,102 | 0.002625 |
| Sichuan | 95.60 | 44,651 | 0.002141 |
| Yunnan | 55.37 | 34,221 | 0.001618 |
| Heilongjiang | 60.67 | 41,916 | 0.001447 |
| Gansu | 40.71 | 28,497 | 0.001429 |
| Anhui | 60.49 | 43,401 | 0.001394 |
| Hebei | 55.13 | 45,387 | 0.001215 |
| Shandong | 80.95 | 72,807 | 0.001112 |
| Zhejiang | 99.09 | 92,057 | 0.001076 |
| Guangdong | 76.22 | 80,932 | 0.000942 |
| Qinghai | 39.97 | 44,047 | 0.000907 |
| Xinjiang | 36.88 | 44,941 | 0.000821 |
| Hubei | 43.10 | 60,199 | 0.000716 |
| Hunan | 33.99 | 49,558 | 0.000686 |
| Shanxi | 28.38 | 42,060 | 0.000675 |
| Hainan | 32.26 | 48,430 | 0.000666 |
| Jiangsu | 71.04 | 107,150 | 0.000663 |
| Liaoning | 35.06 | 53,527 | 0.000655 |
| Jiangxi | 28.09 | 43,424 | 0.000647 |
| Fujian | 51.58 | 82,677 | 0.000624 |
| Inner Mongolia | 39.26 | 63,764 | 0.000616 |
| Henan | 27.60 | 46,674 | 0.000591 |
| Guizhou | 22.24 | 37,956 | 0.000586 |
| Tibet | 20.83 | 39,267 | 0.000530 |
| Ningxia | 26.88 | 50,765 | 0.000530 |
| Shaanxi | 25.68 | 57,266 | 0.000448 |
| Jilin | 24.43 | 54,838 | 0.000446 |
| Chongqing | 16.18 | 63,442 | 0.000255 |
| Shanghai | 18.11 | 126,634 | 0.000143 |
| Beijing | 15.19 | 128,994 | 0.000118 |
| Tianjin | 5.95 | 118,944 | 0.000050 |
| Rank | Deviation Standardization Method | Z-Score Standardization Method | ||
|---|---|---|---|---|
| Province | Comprehensive Evaluation Level | Province | Comprehensive Evaluation Level | |
| 1 | Guangxi | 100.00 | Zhejiang | 100.00 |
| 2 | Zhejiang | 99.09 | Guangxi | 92.62 |
| 3 | Sichuan | 95.60 | Guangdong | 78.06 |
| 4 | Shandong | 80.95 | Shandong | 77.76 |
| 5 | Guangdong | 76.22 | Sichuan | 65.70 |
| 6 | Jiangsu | 71.04 | Jiangsu | 63.28 |
| 7 | Heilongjiang | 60.67 | Anhui | 58.69 |
| 8 | Anhui | 60.49 | Heilongjiang | 56.71 |
| 9 | Yunnan | 55.37 | Fujian | 51.57 |
| 10 | Hebei | 55.13 | Hebei | 48.91 |
| 11 | Fujian | 51.58 | Yunnan | 43.86 |
| 12 | Hubei | 43.10 | Hubei | 40.31 |
| 13 | Gansu | 40.71 | Liaoning | 33.88 |
| 14 | Qinghai | 39.97 | Gansu | 33.36 |
| 15 | Inner Mongolia | 39.26 | Qinghai | 32.20 |
| 16 | Xinjiang | 36.88 | Hunan | 30.61 |
| 17 | Liaoning | 35.06 | Inner Mongolia | 30.44 |
| 18 | Hunan | 33.99 | Hainan | 29.99 |
| 19 | Hainan | 32.26 | Xinjiang | 28.27 |
| 20 | Shanxi | 28.38 | Jiangxi | 26.42 |
| 21 | Jiangxi | 28.09 | Henan | 25.97 |
| 22 | Henan | 27.60 | Shanxi | 24.80 |
| 23 | Ningxia | 26.88 | Ningxia | 22.20 |
| 24 | Shaanxi | 25.68 | Jilin | 21.01 |
| 25 | Jilin | 24.43 | Shaanxi | 19.40 |
| 26 | Guizhou | 22.24 | Guizhou | 18.57 |
| 27 | Tibet | 20.83 | Shanghai | 17.72 |
| 28 | Shanghai | 18.11 | Tibet | 16.37 |
| 29 | Chongqing | 16.18 | Beijing | 14.43 |
| 30 | Beijing | 15.19 | Chongqing | 12.21 |
| 31 | Tianjin | 0.00 | Tianjin | 0.00 |
© 2019 by the authors. Licensee MDPI, Basel, Switzerland. This article is an open access article distributed under the terms and conditions of the Creative Commons Attribution (CC BY) license (http://creativecommons.org/licenses/by/4.0/).
Share and Cite
Jin, X.; Li, M.; Meng, F. Comprehensive Evaluation of the New Energy Power Generation Development at the Regional Level: An Empirical Analysis from China. Energies 2019, 12, 4580. https://doi.org/10.3390/en12234580
Jin X, Li M, Meng F. Comprehensive Evaluation of the New Energy Power Generation Development at the Regional Level: An Empirical Analysis from China. Energies. 2019; 12(23):4580. https://doi.org/10.3390/en12234580
Chicago/Turabian StyleJin, Xiaoye, Meiying Li, and Fansheng Meng. 2019. "Comprehensive Evaluation of the New Energy Power Generation Development at the Regional Level: An Empirical Analysis from China" Energies 12, no. 23: 4580. https://doi.org/10.3390/en12234580