Cluster Analysis of Distribution Grids in Baden-Württemberg

Department of Mechanical and Process Engineering, Offenburg University of Applied Sciences, Badstr. 24, 77652 Offenburg, Germany
*
Author to whom correspondence should be addressed.
Energies 2019, 12(20), 4016; https://doi.org/10.3390/en12204016
Submission received: 20 September 2019
/
Revised: 18 October 2019
/
Accepted: 20 October 2019
/
Published: 22 October 2019
(This article belongs to the Section F: Electrical Engineering)
Abstract
:With the growing share of renewable energies in the electricity supply, transmission and distribution grids have to be adapted. A profound understanding of the structural characteristics of distribution grids is essential to define suitable strategies for grid expansion. Many countries have a large number of distribution system operators (DSOs) whose standards vary widely, which contributes to coordination problems during peak load hours. This study contributes to targeted distribution grid development by classifying DSOs according to their remuneration requirement. To examine the amendment potential, structural and grid development data from 109 distribution grids in South-Western Germany, are collected, referring to publications of the respective DSOs. The resulting data base is assessed statistically to identify clusters of DSOs according to the fit of demographic requirements and grid-construction status and thus identify development needs to enable a broader use of regenerative energy resources. Three alternative algorithms are explored to manage this task. The study finds the novel Gauss-Newton algorithm optimal to analyse the fit of grid conditions to regional requirements and successfully identifies grids with remuneration needs. It is superior to the so far used K-Means algorithm. The method developed here is transferable to other areas for grid analysis and targeted, cost-efficient development.
1. Introduction
In many regions of the world there is a shift towards a carbon-free primary energy supply to prevent further climate change and air pollution. Germany is a frontrunner in this regard and according to its federal government, follows the ambitious target of covering 80% of the primary energy supply by renewable resources by 2050 [1], a process called Energiewende. Renn and Marshall [2] examine Germany’s energy policy from January 1950 onwards and find an economic transition towards an energy system mainly based on regenerative resources. With the growth of renewable energy capacities, the demand for energy storage facilities increases. Germany’s Energiewende is based on the Renewable Energy Act (in German: Erneuerbare Energien Gesetz (EEG)) which was put into force on April 1st, 2000. This law guarantees feed-in tariffs for renewable energies. In reaction to this new regulation, installed photovoltaic capacities increased from about 0.1 GW in 2000 to about 40 GW in 2015. The installed wind capacity increased from about 6 GW in 2001 to about 45 GW (combined wind on- and off-shore) in 2015 [3]. This significant growth of regenerative electricity feed in on the grid results in intermittent supply and eminent peak loads. A maximum vertical grid load at peak times of 28.5GW for PV and 36.6GW for wind was reached in 2015 [4].
The impact of the EEG regulation and increasing regenerative energy feed-in on the German energy sector have been examined in several studies. Wüstenhagen’s and Bilharz’ [5] analysis, which assesses the impact of subsidies on allocation and installed capacity, is often cited in this context. The German Energiewende, evokes questions on energy production and distribution, namely the necessary expansion and control of electrical grids.
The issue of effective grid operation and energy management on electric grids however is of worldwide interest in order to integrate regenerative resources into electricity supply effectively and avoid grid overload in high supply periods [6,7]:
The challenges of regenerative resources management on the electric grid largely concentrate on distribution system operators (DSOs), which take a central function in coordinating energy flows to Consumers and from Transmission System Operators (TSOs). DSOs are the central switchboard in the grid system [8]. While TSOs are responsible for the transmission of high capacities over longer distances and the energy balancing and supply DSOs in the extra high and high voltage grid, DSOs operate electricity grids, which they sometimes own, in a certain smaller area, plan and develop grid infrastructure and ensure network security. They mainly manage the medium and low-voltage grid and their major function is to provide a low-cost, reliable and stable grid with high power quality. The change of electricity resource and power storage and distribution requirements due to intermittent supply and peak load challenge DSO, whose grids usually are the bottleneck in the supply chain. Amendments in DSO grids can contribute to organize grid resources more efficiently [9].
The inversion of power flows from distribution to transmission grids due to excess peak inflows is an important technical aspect, which results from poorly developed DSO grids. It has been investigated in detail by Kerber [10]. Due to the increase of fluctuating renewable energy in-flows since the implementation of the EEG operating conditions have changed and power loads not taken into account when designing the grid have repeatedly induced a reversal of power flows from distribution grids to upstream grids.
Several suggestions to adjust grid capacity to the intermittent and peak-prone inflow of electricity from regenerative resources, have been made in previous publications in Energies: Bracale et al. [11] have developed an algorithm for the prediction of active power generated by photovoltaic systems referring to meteorological data. Soares et al. have developed a simulator for the assessment of the storage effect of electric vehicles on the grid [12], systems for which Ehsani et al. [13] see extensive potential for future grid management. Hesse et al [14] suggest using battery storage systems to relieve grid capacity in peak load hours. Rahmann and Castillo [15] examine the effectiveness of the inertia effect of de-loaded PV power plants to buffer peak jumps in electric grids. Ardito et al.’s [8] provide an overview on smart grid technologies and outline the wide potentials of electronic media to control grid in and outflows, meter electricity flows and to support the automated communication between electricity producers and consumers. These technologies of grid remuneration however are expensive.
As a result of the Energiewende, however, DSOs face financial challenges: They are confronted with the requirement to accept regenerative resources in the network and at the same time have to manage strong price fluctuations at energy exchanges. They face the problem of covering their fixed costs of network operation and hence are forced to rationalize their activities. This constraint seems at odds with the requirement to remunerate electric grids to grant supply security in spite of intermittent inflows and huge peak loads from regenerative resources (Council of European Energy Regulators [16]; Nijhuis et al. [17]; Picciariello et al. [18]; Ruester et al. [19]). The effect of peak feed-ins of renewables on price formation in electricity markets is a major concern. The formation of negative prices at the European Energy Exchange (e.g., the sport market price of −130 €/MWh on May 8th, 2016) [20] is a striking phenomenon in this context which Sensfuß et al. explain by the Merit-Order-Effect [21].
DSO networks accordingly must be amended to grant the frictionless management of regenerative resources. The structure of the DSOs differs across European regions. While some European countries dispose of a single DSO only (e.g., Ireland), in others a large number of DSOs cooperates (Austria, Belgium, Germany, Denmark, Sweden, Norway, and Finland). In Germany, there are about 900 DSOs, which means that the challenge of remunerating their networks is particularly high: German DSOs’ operation environments and organizational structures differ widely, e.g., concerning topology, population density and economic structure of the grid environment.
Baden-Württemberg DSOs are organized in the form of 109 major limited companies. These are in majority owned by Baden-Württemberg communities [22]. The process of remuneration must be organized cost-efficiently to avoid excess expenses at the cost of citizens as customers of local energy suppliers and ensure the profitability of the operators. Several attempts to classify DSOs have been made in order to locate remuneration needs and rationalization options: Mutanen et al. classify customers of DSOs by type, tariff and consumption for load profiling [23]. Esteves et al. [24] collect data on European voltage dips and include DSO data to enhance European grid quality. Ferreira et al. [25] assess diversity in European supply markets based on econometric indicators to develop a European regulatory framework for power distribution across Europe. Agrell and Bogetoft [26,27] suggest a statistical approach to benchmark German gas DSO operators. They stress the importance of considering different structural conditions of DSOs in the benchmarking model to define effective incentive systems.
2. Previous Research in Clustering or Classification of Distribution Grids
So far, however, only very few studies focus on the highly fragmented German DSO electricity network and analyze its structure in order to develop strategies to manage the increasing share of renewable energies in the distribution grid. The following paragraphs provide an overview on publications which classify distribution grids using statistical means.
Technical, economic and structural aspects are eligible for grid classification. The following sections conduct a review of previous grid classification models in order to extract relevant determinants. Essentially two types of studies are available:
- (a)
- Studies from a provider perspective classifying grids according to their technical specifications.
- (b)
- Studies assessing requirements of grid development from the perspective of an infrastructural planer.
- (c)
- Studies modeling energy supply based on previous data.
Regarding a) two German grid studies refer to internal technical operator data and come to reach and capacity based classifications: Kerber [10] analyzes 86 distribution grids located in Southern Germany (Bavaria) and assesses their technical specifications, including conductor material, cable length to the end consumer, technical type of grid connection to the end consumer, length of the main circuits, length of the supporting circuits and transformer capacities. Further structural conditions such as the area of the DSO and the number of grid connection points by DSO assessed. Based on these data, grids are assigned to three different categories: countryside grids, suburban grids, and village grids. The grid assignment process is not documented but probably based on expert opinions.
Krauß [28] analyzes the grid of Baden-Württemberg’s (Germany’s) largest DSO referring to the company’s complete structural data which include, among others, the number and specific location of grid connection points, specific cable lengths and technical cable and transformer specifications. Load profiles and further available operational data are assessed. In total, 11 categories of sub grids are defined: sub grids with big transformers, monotonous synchronistic grids, small grids with few PV, old (25 years and more) grids, dynamic synchronistic grids, high PV feed-in, small grids with low PV feed-in (old), small grids with low PV feed in (new), grids with many PV feed-in points and big grids with many PV feed-in points. Finally, the grid is split into 22.000 sub grids which are assigned to the 11 categories. Similarly, Bletterie et al. [29] predict the hosting capacity constraint (voltage or current) of low voltage feeders based on a large network data set applying a machine-learning approach and k-means analysis. The grid data set was provided by a rural Austrian grid operator. The extent and quality of the data set is comparable to Krauß [28]. Yang and Shen [30] review research in load-based grid classification, finding that k-manes algorithms are state of the art. They refine this approach using fuzzy logic.
Concerning b) two further studies on grid infrastructure development have been retrieved, which consider grid development requirements, in the face of changing energy feed-ins: From the perspective of supply side and demand side management, the degree of grid automation is crucial. Considering the U.S. electricity grid, the National Electrical Manufacturers Association [31] proposes to determine the so-called ‘degree of smartness’. For this purpose, the quantitative and qualitative equipment of grids with measurement technology, control technology and communication technology as well as integration and interconnectivity are evaluated.
The Deutsche Energie Agentur (DENA) [32] analyzes Germany’s electricity grids to assess development requirements in order to match network infrastructure with the requirements of growing feed-in from regenerative energy resources until 2030. Intermittent feed-in of photovoltaic power and regionally variable population density are considered. Using a k-means algorithm the study identifies two types of distribution grids: rural distribution grids, characterized by low population density, and urban distribution grids, characterized by a high population density.
Regarding c) further studies develop data management models for individual suppliers or consumers to manage stochastic photovoltaic of wind energy inflow. Although not directly related to the subject of grid management, two studies are considered here. Dellino [33] predicts photovoltaic energy inflows to an Italian power plant located near Bari based on the distribution of previous inputs using an ARIMA model. Bruno et al. [34] assess predictive photovoltaic inflows to smart home grids equally using an ARIMA function. This model type differs to the above (a and b) approaches: ARIMA predicts future effect of a parameter A based on the sample moments of the previous distribution of A. Further explaining factors are not considered. Models of type a) and b) however determine parameter A based on other variables.
Table 1 provides a brief summary of the retrieved studies and compares the data referred to, the sample size (number of DSO), the considered region, the method of statistical analysis and the results.
Summarizing the key results of the review of previous studies on grid classification, the following major point occurs: all four available studies classify grids into categories referring to a) technical specifications or b) infrastructural specifications. Three from four studies neglect one or the other factors and – in result - the interrelationships between both parameter types. Only the DENA study, assesses both parameters, finds an interdependence of surface range, population density and grid type and suggests that interrelationships between technical design options and infrastructural requirements should be measured and considered for grid infrastructure planning.
Unfortunately, the DENA study dates back to 2012, and is not topical concerning the infrastructural data basis anymore. Moreover, the other researched studies [10,28,29] suggest that further parameters, beyond surface and population, e.g., PV and wind feed in and electricity demand could be of relevance to grid design, which are not considered by DENA.
Further research assessing the correlation between infrastructural data and grid design accordingly is essential to plan the targeted remuneration of the German electricity networks and to allocate regenerative electricity resources effectively, in a structured and cost-efficient way.
This study works on these research gaps and develops a classification and assessment system for DSO grid quality. It explores alternative algorithms for grid evaluation. The system can basically be applied in any country. The method is explored for a major German federal state (Baden-Württemberg) to assess the quality of regional grid sectors and identify remuneration requirements to enhance grid stability for the feed-in of photovoltaic and wind energy. This is a comparatively small test area which has got the advantage of low calculation times and low data requirements. The results however are equally applicable to larger datasets.
3. Method
The methodology section details the methods applied for grid analysis and classification. Section 3.1 introduces to cluster analysis and the three alternative methods applied here. Section 3.2, Section 3.3 and Section 3.4 specify sample selection. Section 3.5 differentiates the relevant research parameters. Section 3.5 specifies the input factors for cluster formation.
3.1. Method of Data Clustering
Now, in line with the methodological intention of the study, an adequate clustering strategy, comparing several algorithms, must be developed. As Table 1 shows, different grid classification methods have been applied in previous studies. Basically, there are statistical methods and heuristic approaches. So far only DENA utilizes clustering at all but relies on a single algorithm -k-means - only. To test the comparative reliability of this method, further comparative analyses are required. To accomplish a method test, here three clustering approaches are examined and compared, to find an optimal clustering strategy and validate the reliability of results. The tested methods are:
- (a)
- The k-Means algorithm
- (b)
- The DBSCAN algorithm
- (c)
- The Gauss-Newton algorithm.
3.1.1. To a) K-Means Algorithm
DENA utilizes a k-means algorithm and this method is adopted here, due to its high practicability. The k-means algorithm distributes observations/samples into k clusters. Each cluster has got a center, a so-called centroid. The centroids are determined so that the sum of the squared deviations from center is minimal. The k-means algorithm obligatorily uses the Euclidean distance measure for clustering. It assumes that the clusters are convex. The number of clusters k must be given.
The k-means algorithm is implemented in MATLAB® with the function K-MEANS. A detailed documentation of the implementation of the algorithm can be found in the MATLAB®~documentation [35]. A major disadvantage of the k-means method is, that the number of clusters must be determined before the actual clustering starts. It is thus hard to determine whether the clustering result is based on a natural or an artificial cause. For data sets with great variances of values the k-means algorithm tends to deliver unbalanced groups. Thus, further algorithms could be more effective and are tested here:
3.1.2. To b) DBSCAN Algorithm
The density-based spatial clustering of applications with noise algorithm (DBSCAN) was developed by Kriegel et al. [36] for data-mining and is among the most cited algorithms for clustering [37,38]. An advantage of DBSCAN compared to k-means is, that the number of clusters need not be defined in advance, but is determined by the algorithm depending on the algorithm parameters. The major parameters of DBSCAN are ε and nmin:
- ε describes the distance between the points to be defined as neighbors.
- nmin describes the minimum amount of points to form a cluster.
DBSCAN now determines clusters based on distances of neighbors. A cluster in the sense of DBSCAN is a number of observations/samples within an area of high density. A cluster is surrounded by samples/observations within areas of low density. I.e., DBSCAN aligns data pairs to groups, when they are close to each other and marks data pairs as outliers when situated alone. That is DBSCAN finds the neighbors of every point in distance ε and identifies the core points with more than nmin neighbors. It then finds the connecting components of core points on the neighbor graph, where all non-core points are ignored. Finally, each non-core element is assigned to a cluster if the cluster is an ε neighbor, otherwise it is assigned to noise.
The minimum density, namely the minimum number of samples/observations within a distance must be provided to DBSCAN. The DBSCAN algorithm is not restricted to specific cluster shapes [36], but requires, that all input values are in the same order of magnitude. The individual attributes are therefore each related to the maximum value. Thus, the range of these relative inputs is between 0 and 1.
3.1.3. To c) Gauss-Newton Algorithm
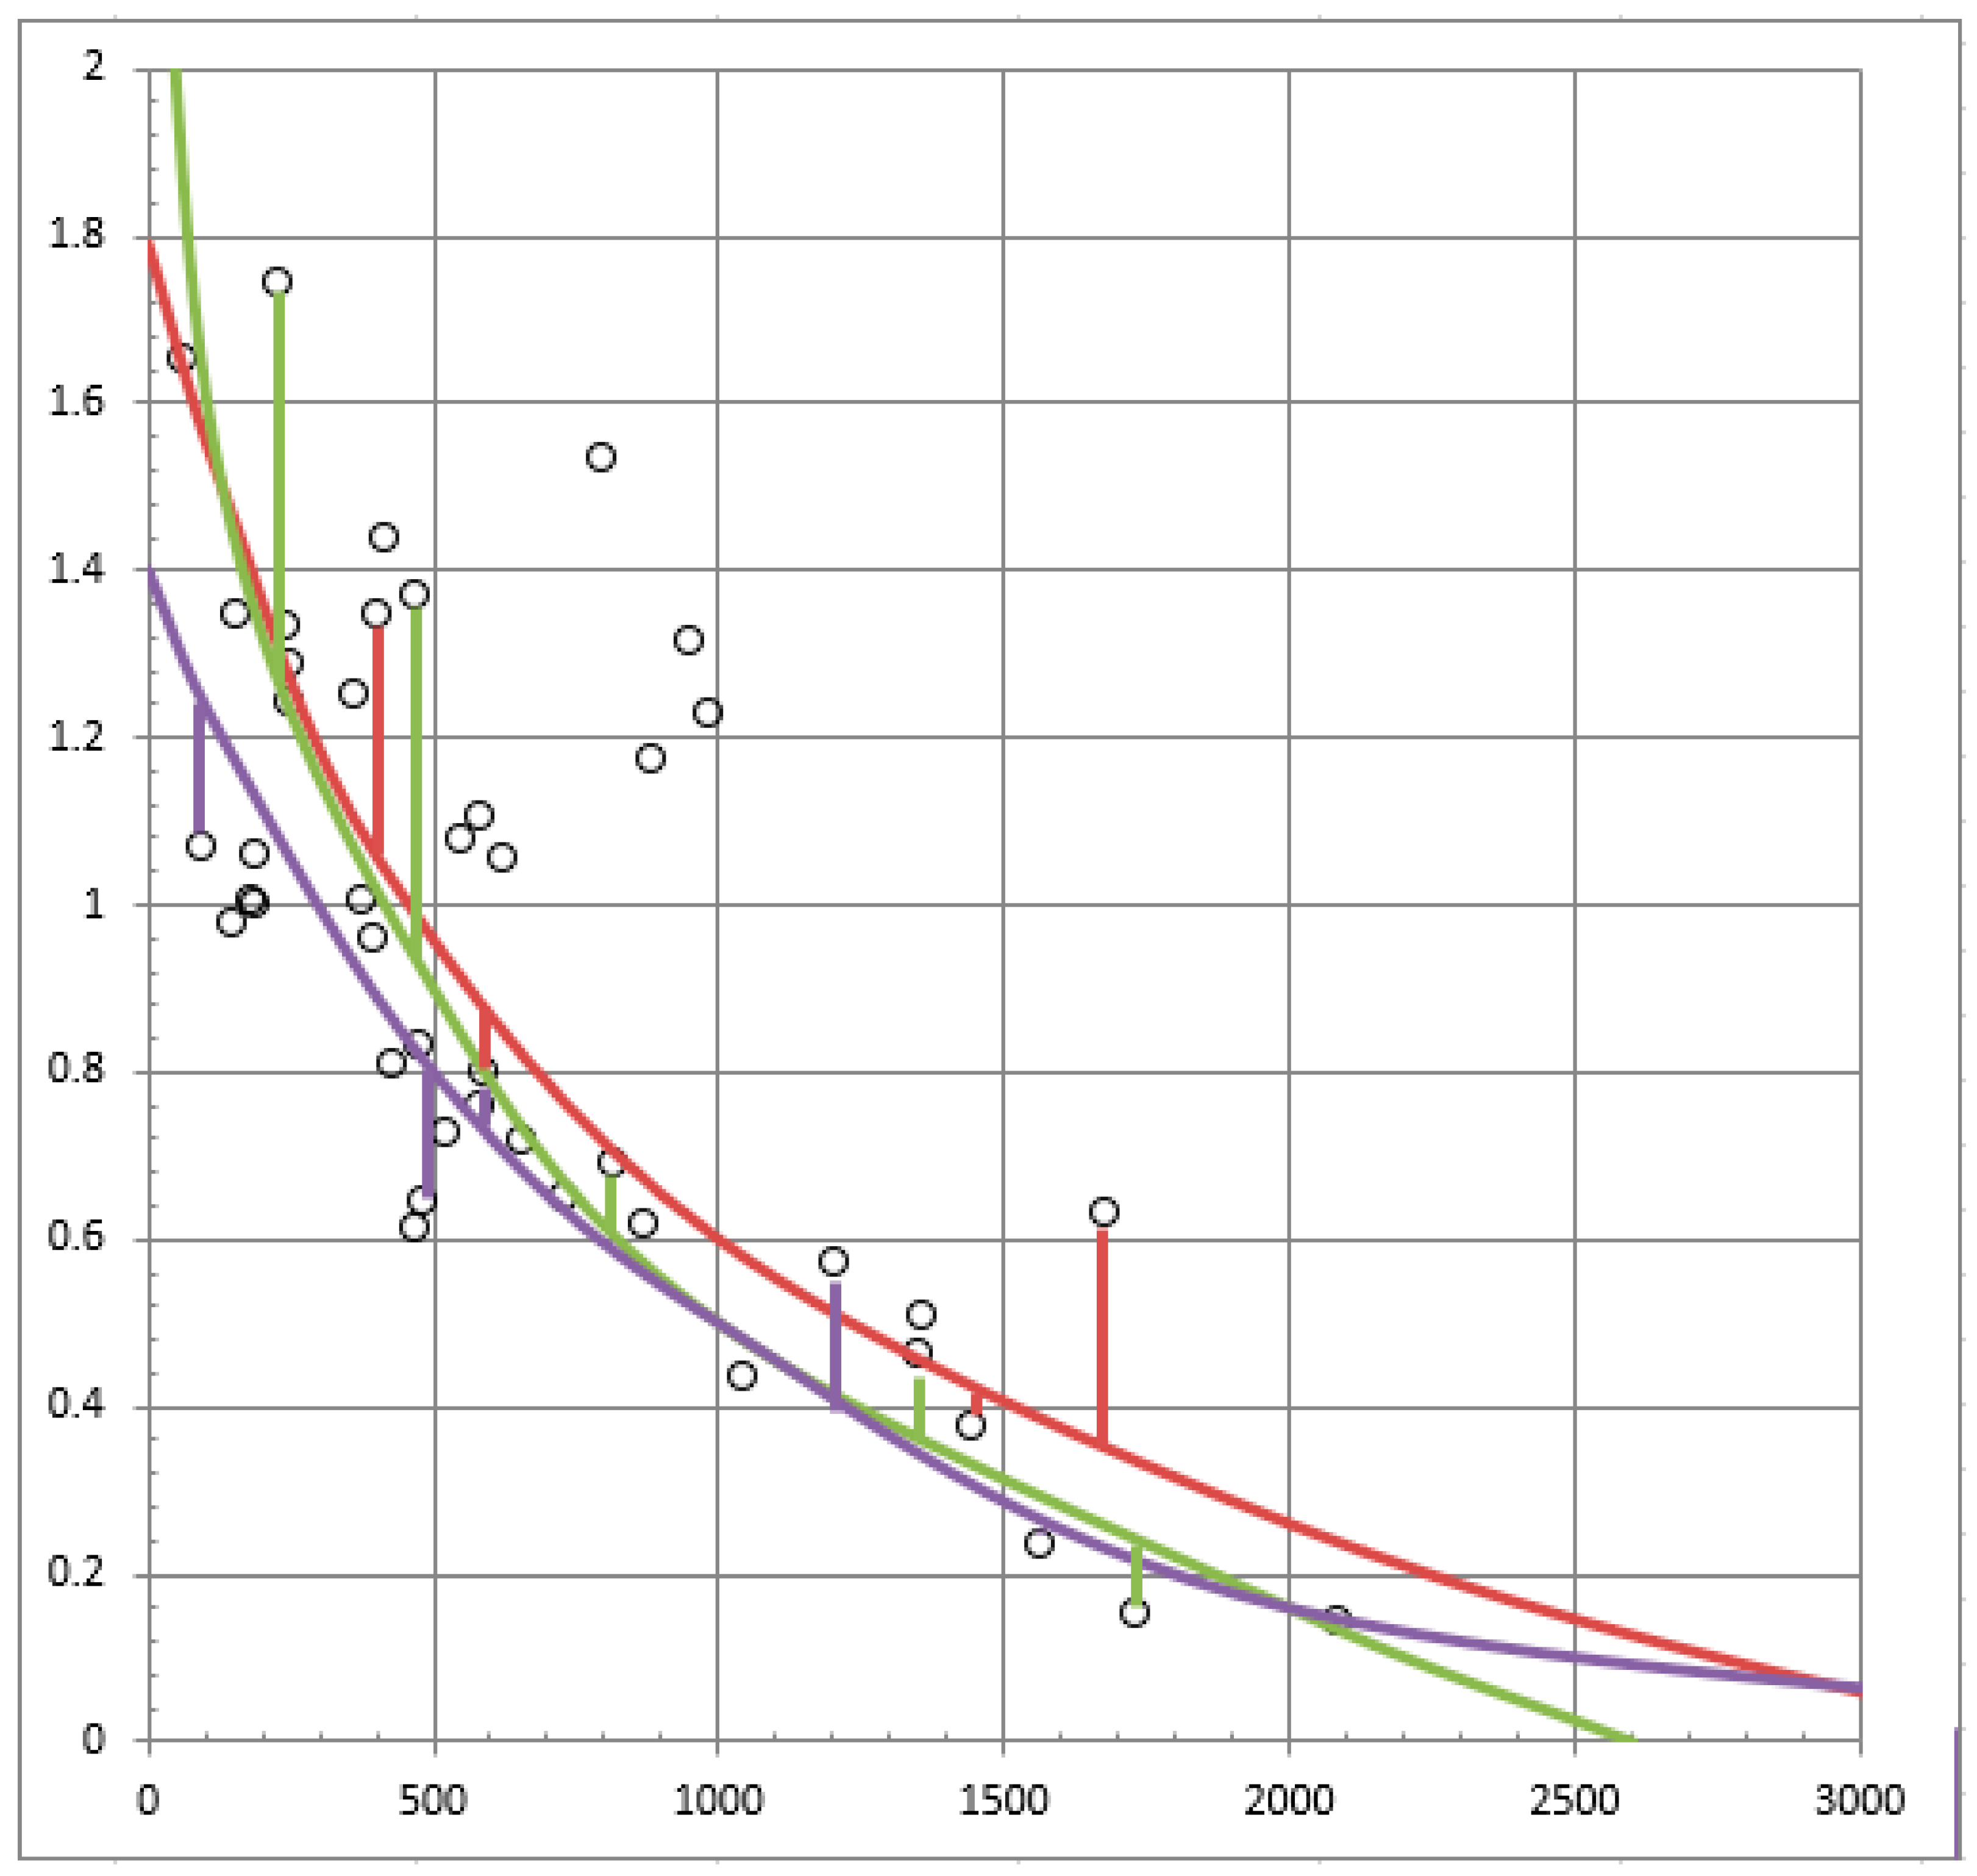
A further alternative approach is tested, which is based on the idea of approximating the distribution of density-based variables with an exponential distribution function, which is estimated using the Gauss-Newton algorithm. This is a numerical method for solving nonlinear optimization problems using an approximation with linear partial least squares [39]. To use the Gauss-Newton algorithm for clustering the results, the exponential function is divided into two branches using a fitting function as follows: The maximum and the minimum gradient of the function in the first quadrant is calculated in order to find the average gradient. The coordinates in which the function has got the average gradient are identified and used as a centroid for the positioning of a horizontal and vertical separation line. The integral of the function in the first and the second quarter of the new centroid now correspond [40]. To obtain identical areas below the two branches to the derivation in Equation (1) is applied:
The division point between the branches of the exponential function is now used as the center for dividing four clusters of parameters by drawing a horizontal and a vertical division line.
Figure 1 shows different fitting functions with exemplary residuals (green, red and lilac) to construct a function from the DSO data. The basic idea is to construct the function in such a way that the sum of the difference between the observed value and its data point is minimized. The algorithm computes all data points to find the best fitting function.
3.2. Selection of Region and DSO Sample
As specified in Section 1, the German federal state of Baden-Württemberg is chosen as reference environment for testing the algorithms. Table 2 contains the relevant statistical data of Baden-Württemberg, i.e., number of Transmission System Operator (TSO), number of distribution system operators (DSO) surface area, population and population density, i.e., inhabitants per km². Table 2 equally shows the rank of Baden-Württemberg among the 16 other German federal states:
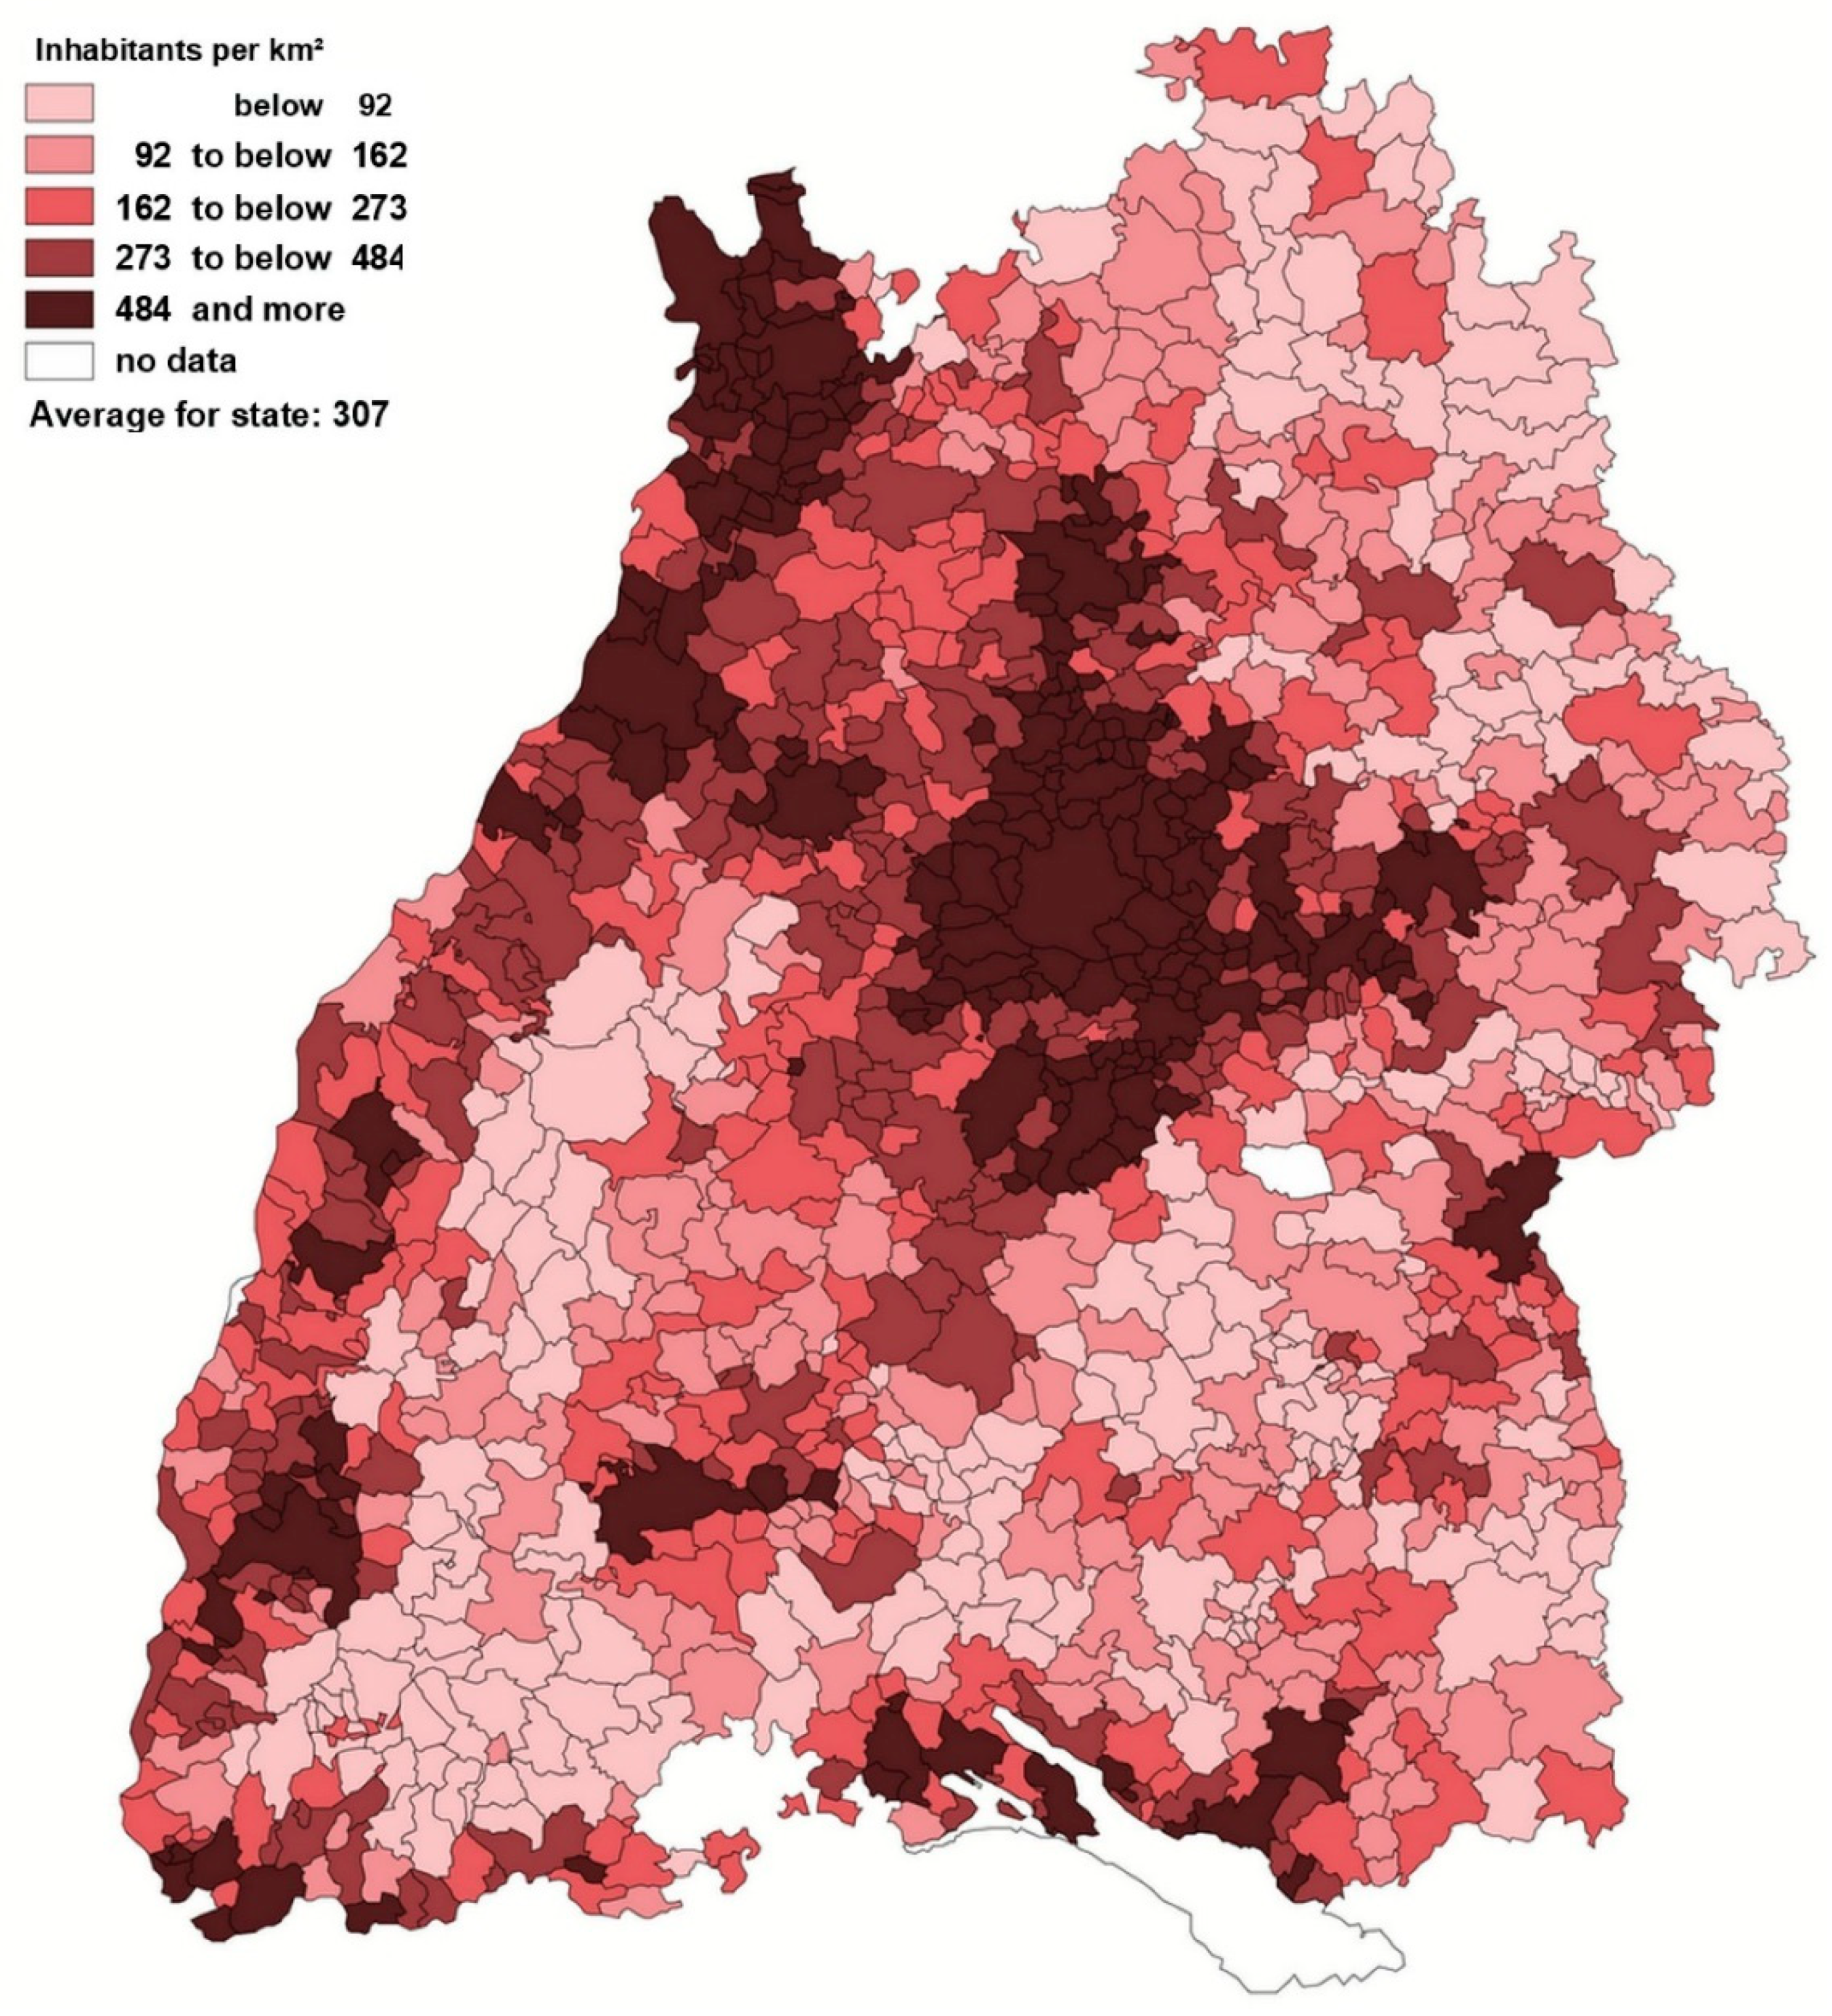
Baden-Württemberg has got 10.8 million inhabitants and is the third largest German federal state by population. In terms of population density, however, the state holds rank 6 only, due to its comparatively large surface of almost 36,000 km², which exactly corresponds to the area of one single Transmission System Operator (TSO), TRANSNET BW. German transparency requirements oblige TRANSNET to provide extensive data sets on the feed-in of renewable energies. The fact that census data of Baden-Württemberg and the data of the TSO are from the same geographical area simplifies data aggregation. Due to this particularity Baden-Württemberg offers itself for a pilot study in DSO grid classification. Figure 1 illustrates the regions of Bade-Württemberg and classifies these by population density:
There are 134 active distribution network operators in Baden-Württemberg which differ in structure and reach as illustrated in Figure 2. As can be seen from the chart, Baden—Württemberg’s regions vary strongly in population density: Populous regions like the “Rhine Rift” (left) and Stuttgart (center) neighbor little populated regions like the “Black Forest” and “Allgäu”. Electricity grid requirements accordingly vary strongly in between the supply regions. This diverse structure of Baden-Württemberg’s regions suggests that a characteristic DSO structure should exist, which is another argument for Baden-Württemberg as a location for the intended pilot study.
3.3. Compilation of the Dataset
The following regional data, infrastructural grid data and energy flow data are collected for each DSO and integrated into a joint dataset to assess the relationship between both data panels. The collected data are summarized in Table 3:
Since usually external variables—e.g., the population figure, living standards, the economic development of the region, the development of energy efficiency—influence the structure of distribution grids and their development, density variables, i.e., relative variables as indicated for the energy flow data are useful for comparison [41].
The following data sources are consulted to compile the data set: Energy flow data have to be published according to German transparency obligations and are available from the TRANSNET BW website [42].
Infrastructural data on the technical design of the distribution grids are partly available from the transmission network operator, too. Master data records of electricity producers [43] in the network area are of further interest. Referring to corporate postcodes the electricity producers are localized and assigned to regions. Since these data are the basis of subsidy assignment for PV-powerplant operation, they are reliable and topical. More specific data such as the cable length in the grid areas were compiled from information provided by DSOs. The vector of attributes accordingly contains the following variables for each DSO: WPO, WPV, alg, nia, ngc, DPO, lc, PPV, Wna = , nlc = .
Complete attribute vectors can be retrieved for 109 from 134 DSOs. Only complete attribute vectors are admitted to the dataset. The reference year for the structural grid data is Dec, 2015. In order to create a consistent data set, changes that occurred after Dec, 2015 were not considered.
3.4. Prestest Using Correlation Analysis
To examine, which relationships are useful to analyze at all, a pretest correlation analysis of the model input factors is done. Correlations according to Bravais-Pearson are determined from the coefficient of determination R2, which according to Bravais-Pearson is calculated as follows:
where xi and yi are the sample points for pairs of data values (indicated in Section 4.2), indexed by i (for each DSO). and are the mean values for all elements in the sample. R² results between −1 and 1 indicating, negative (inverse) or positive correlations. R²-values smaller than R2 = 0.2 represent a very weak correlation, values from R2 = 0.2 to values of R2 = 0.5 represent a weak correlation, values from R2 = 0.5 to R2 = 0.7 represent a medium correlation, values from R2 = 0.7 to R2 = 0.9 represent a strong correlation and values higher R2 = 0.9 represent a very strong correlation. The linear correlations are estimated for all combinations of variables in the data set. Table 4 shows the correlation matrices for Bravais-Pearson correlation coefficients.
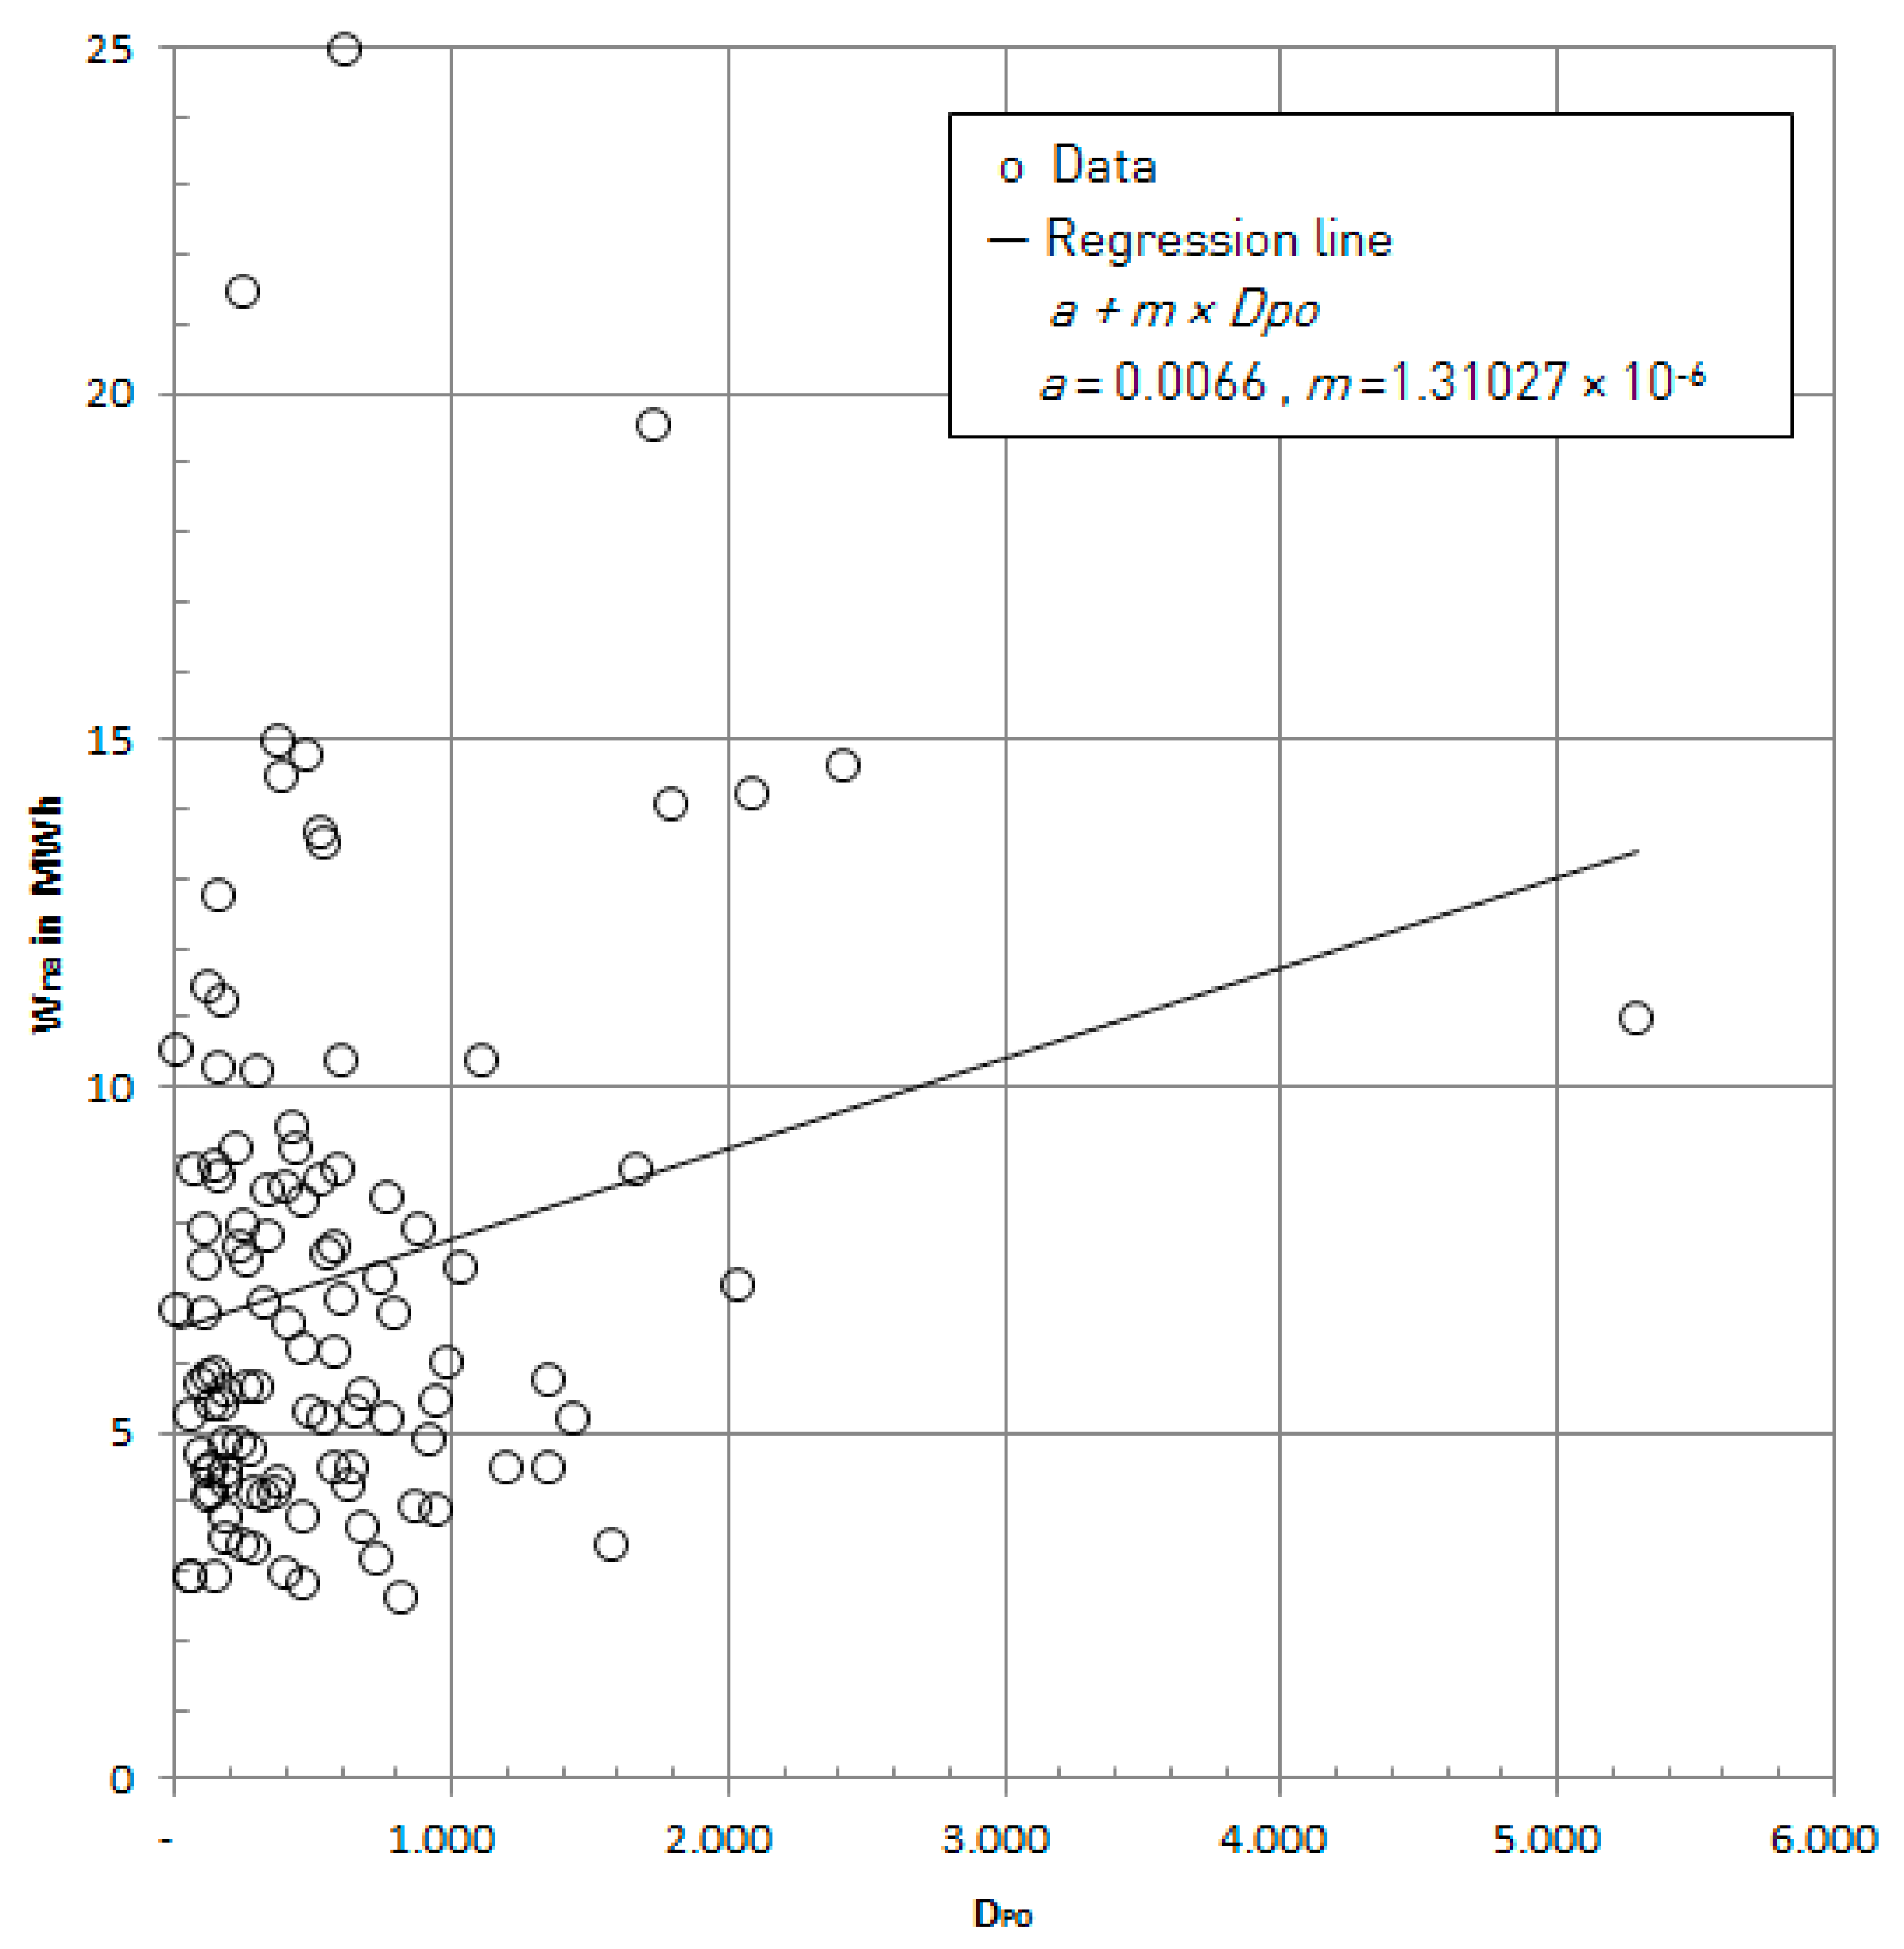
The results indicate that correlations between the grid related parameters WPO, WPV, alg, nia, ngc, lc, PPV (electricity withdrawal, yearly PV-feeding, area surface, number of inhabitants in low voltage level grid area, number of grid connection points, cable length, peak power in PV) are high and rather homogenous. However correlations of these parameters with DPO (population density) are virtually non-existent and correlations of grid related parameters and population density with Wna = (withdrawal of electric per inhabitant), nlc = (number of inhabitants per cable lengths are low. This observation suggests that there are significant imbalances between the requirements of the population and the grid development status, which is illustrated in Figure 3.
Figure 3 contrasts population density DPO to Wna (withdrawal of electricity per inhabitant) and finds a cumulation of DSO in the lower left area of the diagram. These are areas of low population density disposing of low withdrawal of electricity per inhabitant. The fact that inhabitants in little populated areas consume less electricity than in urban areas suggests that these areas could be less developed concerning grid infrastructure.
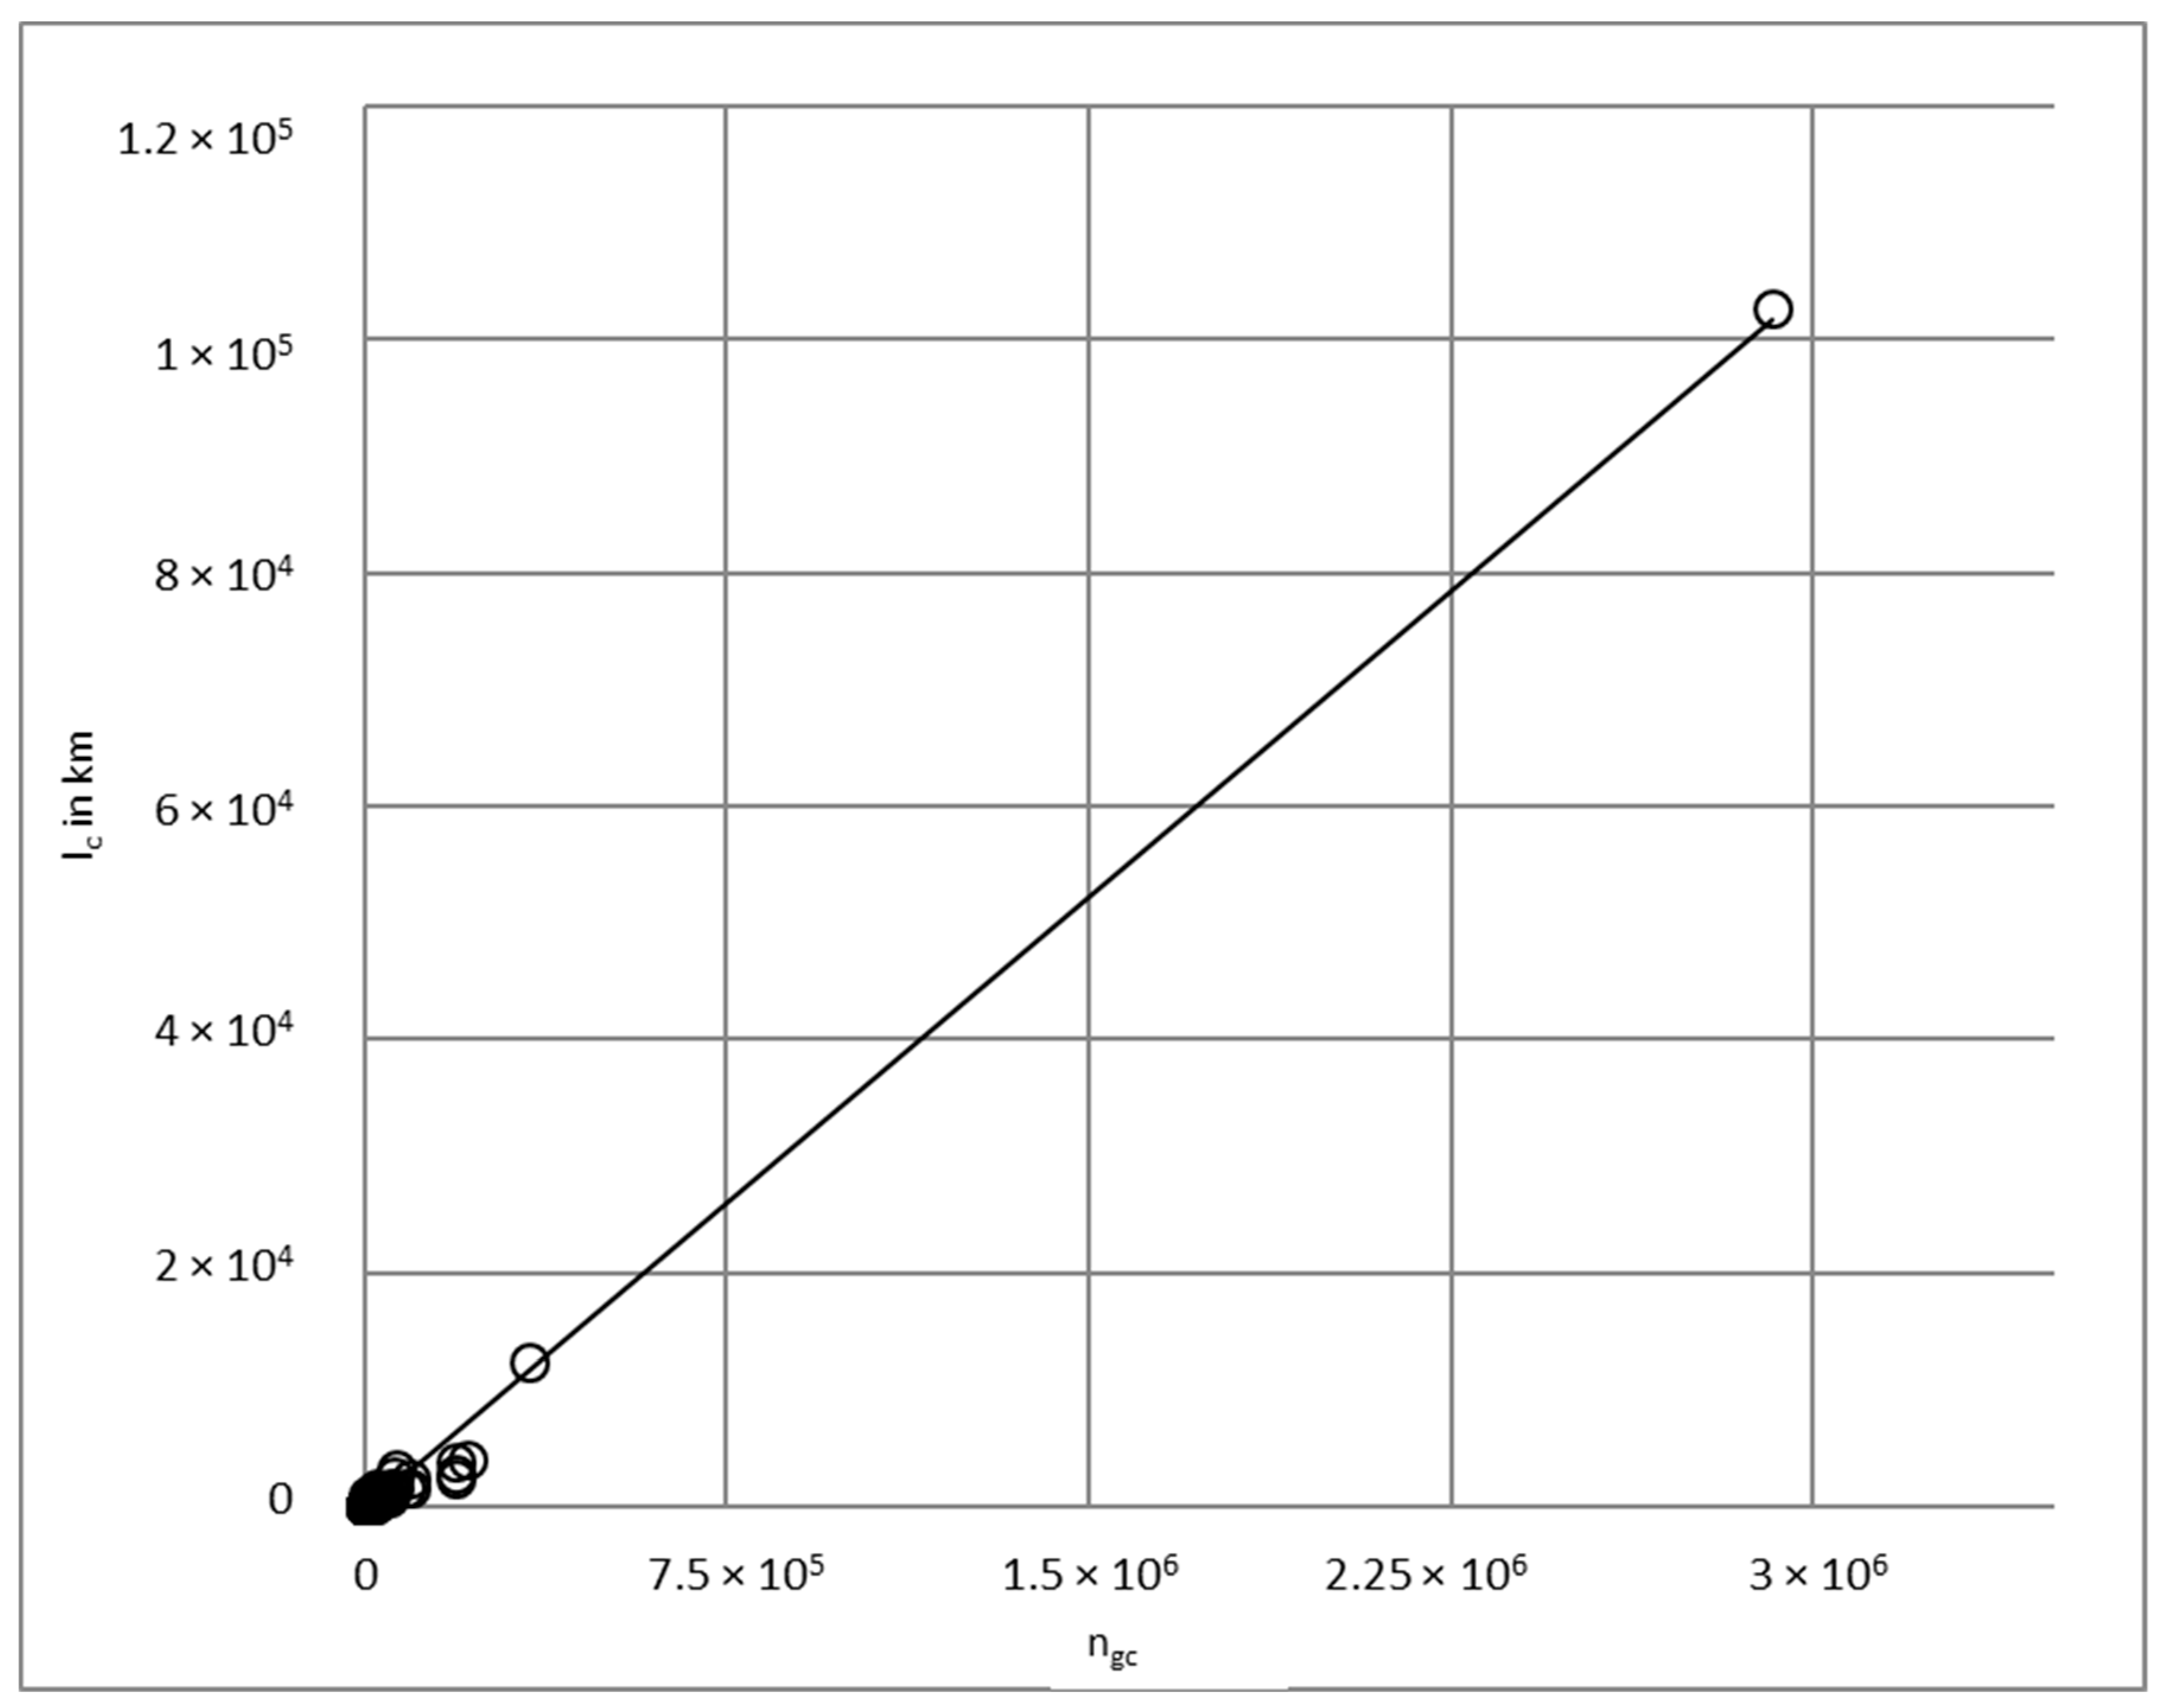
Equally, the relationship between the number of grid connection points ngc and the cable length per DSO lc is extraordinary according to the correlation analysis. Usually grid interconnectors are distributed homogenously across the cable length, which implies that with growing cable length the number of interconnectors should increase. This however is not the case here, as illustrated in Figure 4.
These preliminary observations using correlation analysis suggest that the Baden-Württemberg DSO network disposes of significant disparities between network development status and supply requirements. Cluster analysis of the concerned factors provides deeper insights on this effect.
3.5. Specification of Clustering Input Factors
Referring to the obvious disparities identified in the correlation model, the data in the sample have to be clustered adequately to examine the relationship between population density and peak power photovoltaics in grid connection points and cable lengths and grid connection points by grid- and transformation level in more detail.
To allow a graphical presentation of results, two of the target values are used for clustering at one time, i.e., all data points are assigned to four clusters (k = 4) for each evaluation and all eligible algorithms (cf. Section 4.4) are tested for these combinations. The following combinations of clustering factors are chosen to test the quality of the nets according to the research objective:
The relationship of population density and installed peak power is assessed as follows:
- DPO (population density of grid area)
- i.e., Peak power of installed photovoltaics by number of grid connection points
- Then the relationship of cable length on a grid and the number of grid connection points is analyzed using the input factors:
- ngc (number of grid connection points for each grid- and transformation level) and
- lc (cable length)
Consumption parameters do not have to be considered for network optimization in Germany: According to Germany’s Renewable Energy Act electricity from regenerative resources must be accepted on the grid at any time and there are fixed market prices for regenerative energy. Network operators have to feed-in electricity from regenerative production even at a higher price than electricity from conventional resources if available. Before this regulation, energy grids had been sufficiently equipped to manage demand peaks and flows assuming stable energy supply. Under the new EEG regulation energy supply stability is challenged and grids must be remunerated to cope with varying supply. As compared to usual consumption fluctuations which have been considered in network planning, the push of excess regenerative electricity is exponentially higher and at peak production hours partly exceeds network capacity.
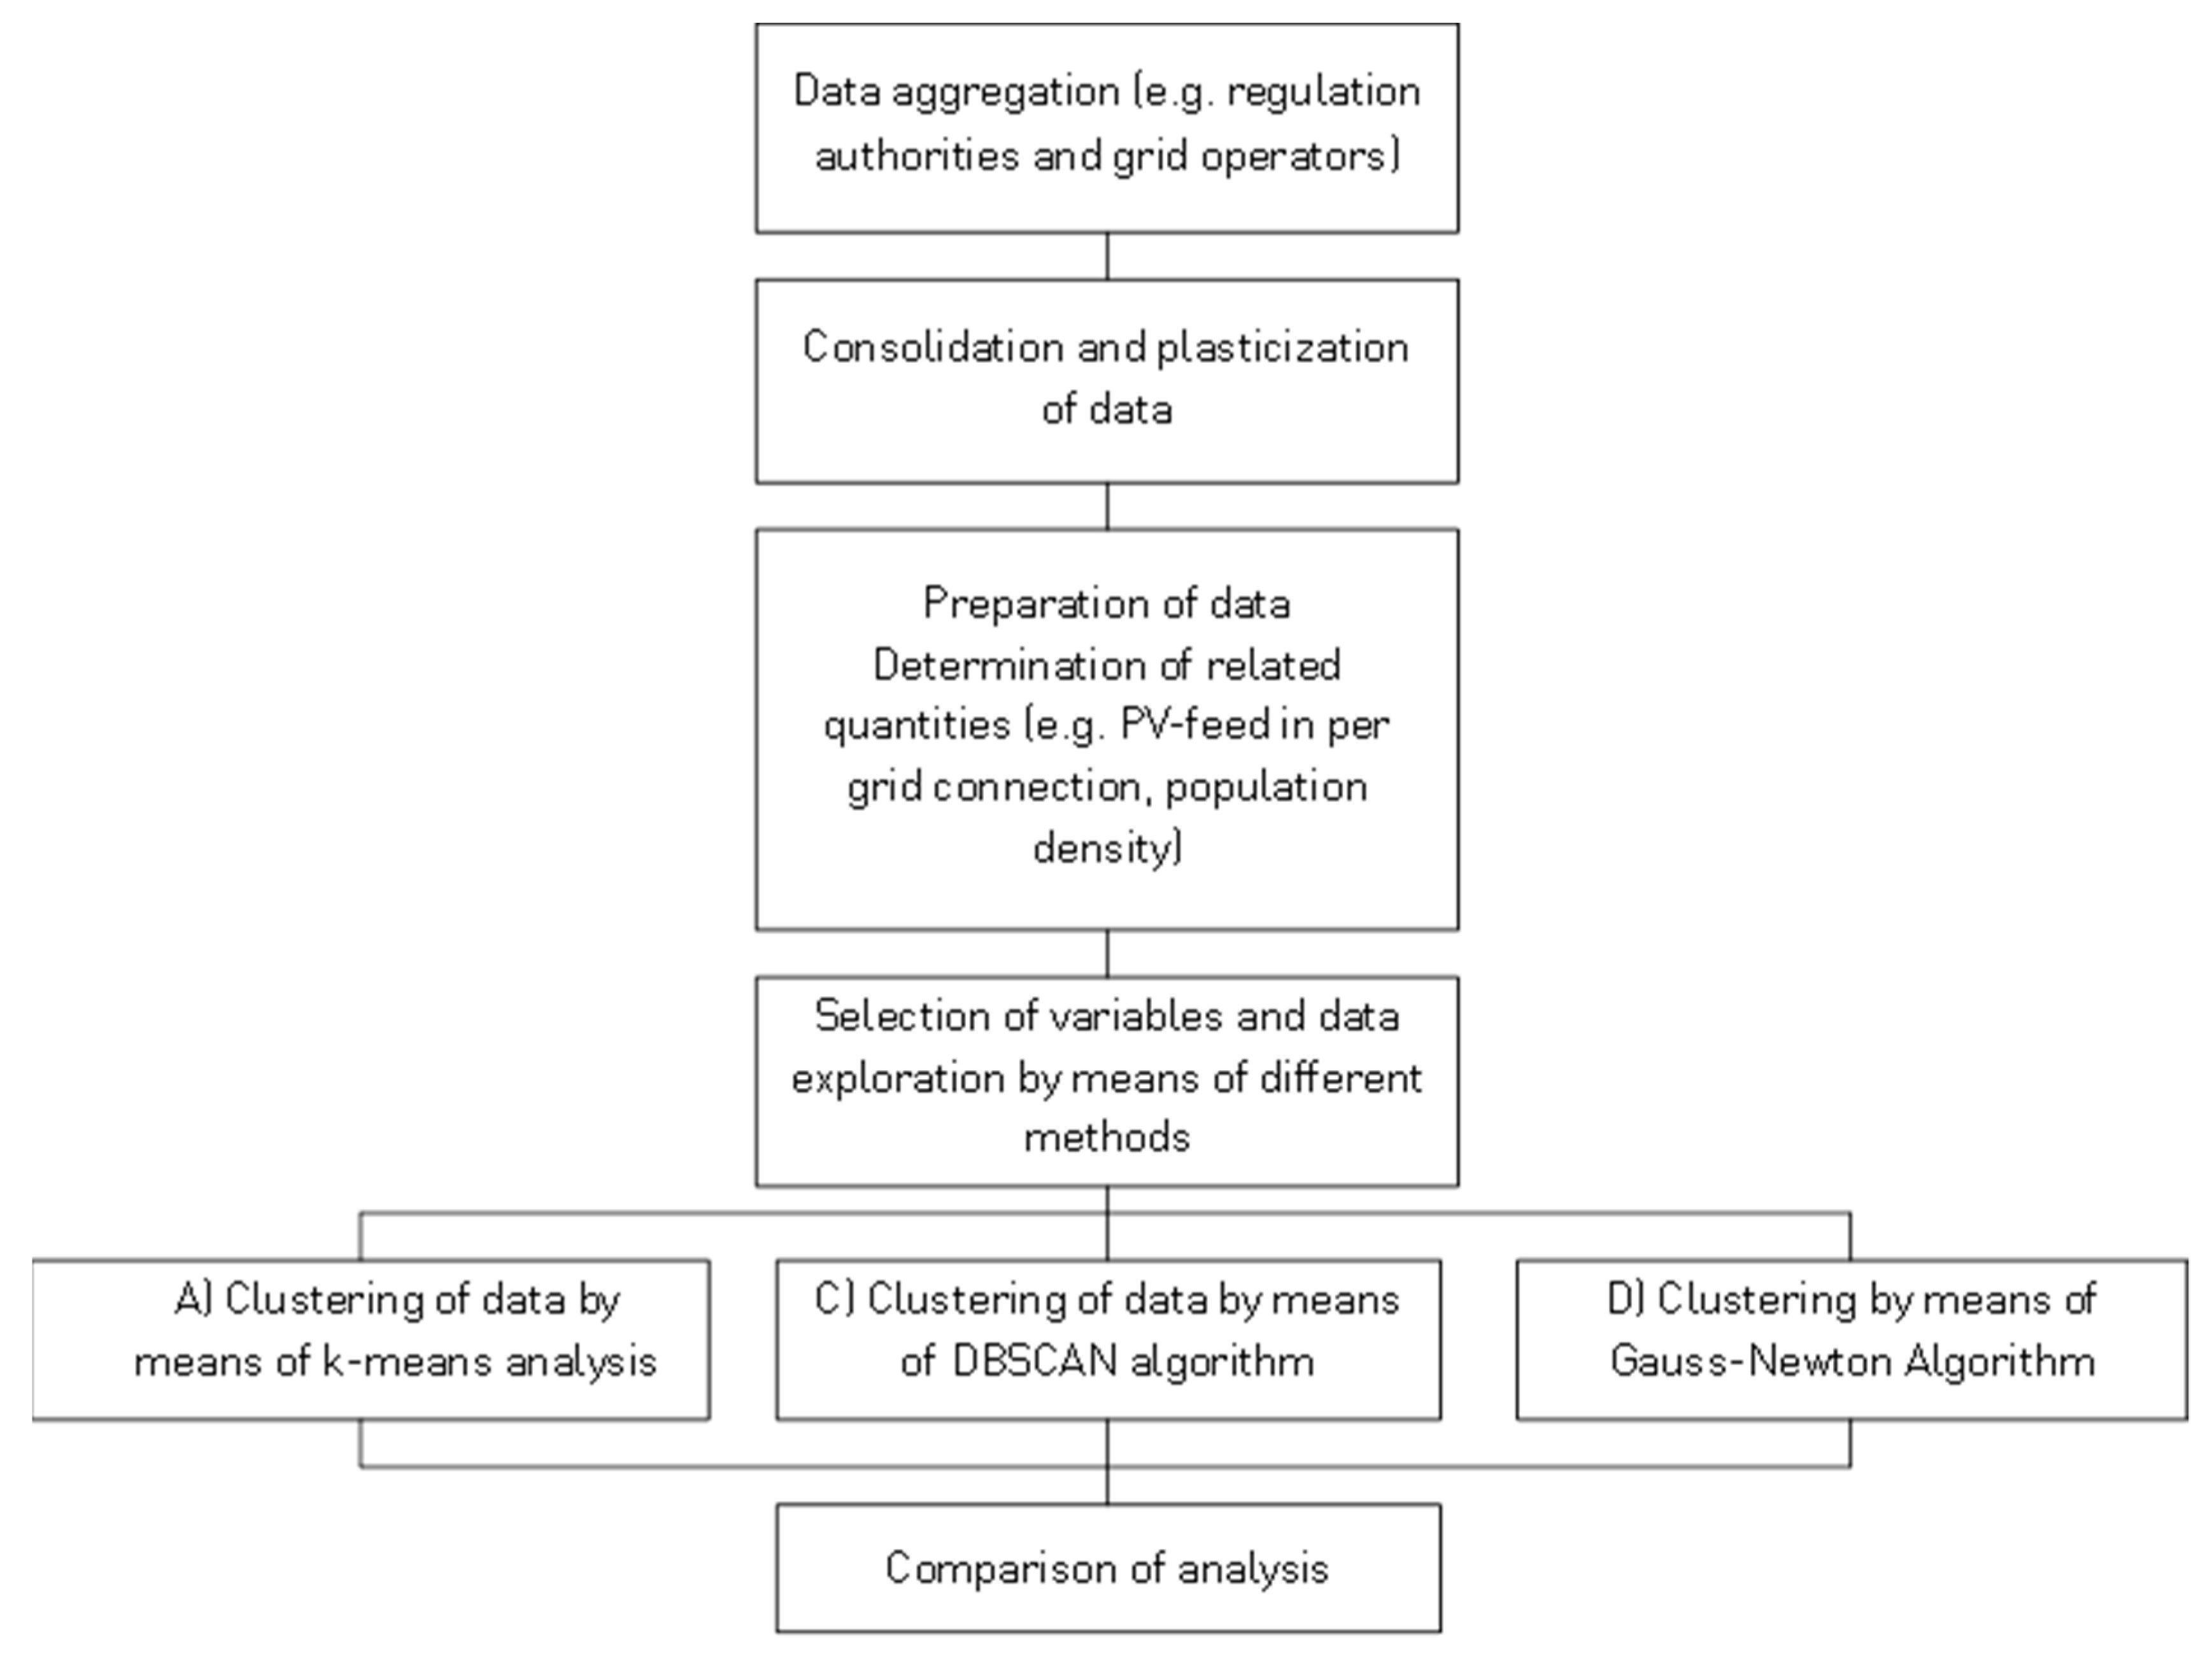
3.6. Summary of Method
The results for K-Means, DBSCAN and Gauss-Newton Algorithm for both clusters according to Section 3.1 are compared to identify the optimal method and classify the status of the electric grid and remuneration requirements considering grid status. The method described in Section 3 is summarized in a chart as follows in Figure 5:
4. Results
Section 4 presents by clustering the input factors specified in Section 3 for each of the algorithms and compares the results.
4.1. Descriptive Results
The data set gained according to the method described in Section 4.2 is assessed for plausibility by calculating the minimum, maximum and first two sample moments. Table 5 shows the results:
From Table 5, the great variance of distribution grids in Baden-Württemberg is evident. Population density (Dpo in Inhabitants km−2) is between 54 and 5288. The number of inhabitants in the lowest voltage level nia corresponds in distribution. The number of grid connection points ngc ranges from around 300 to 3,000,000. Equally the other attributes, withdrawal of electricity WOP and yearly photovoltaic feed-in WPV vary widely.
4.2. Results for k-Means Algorithm
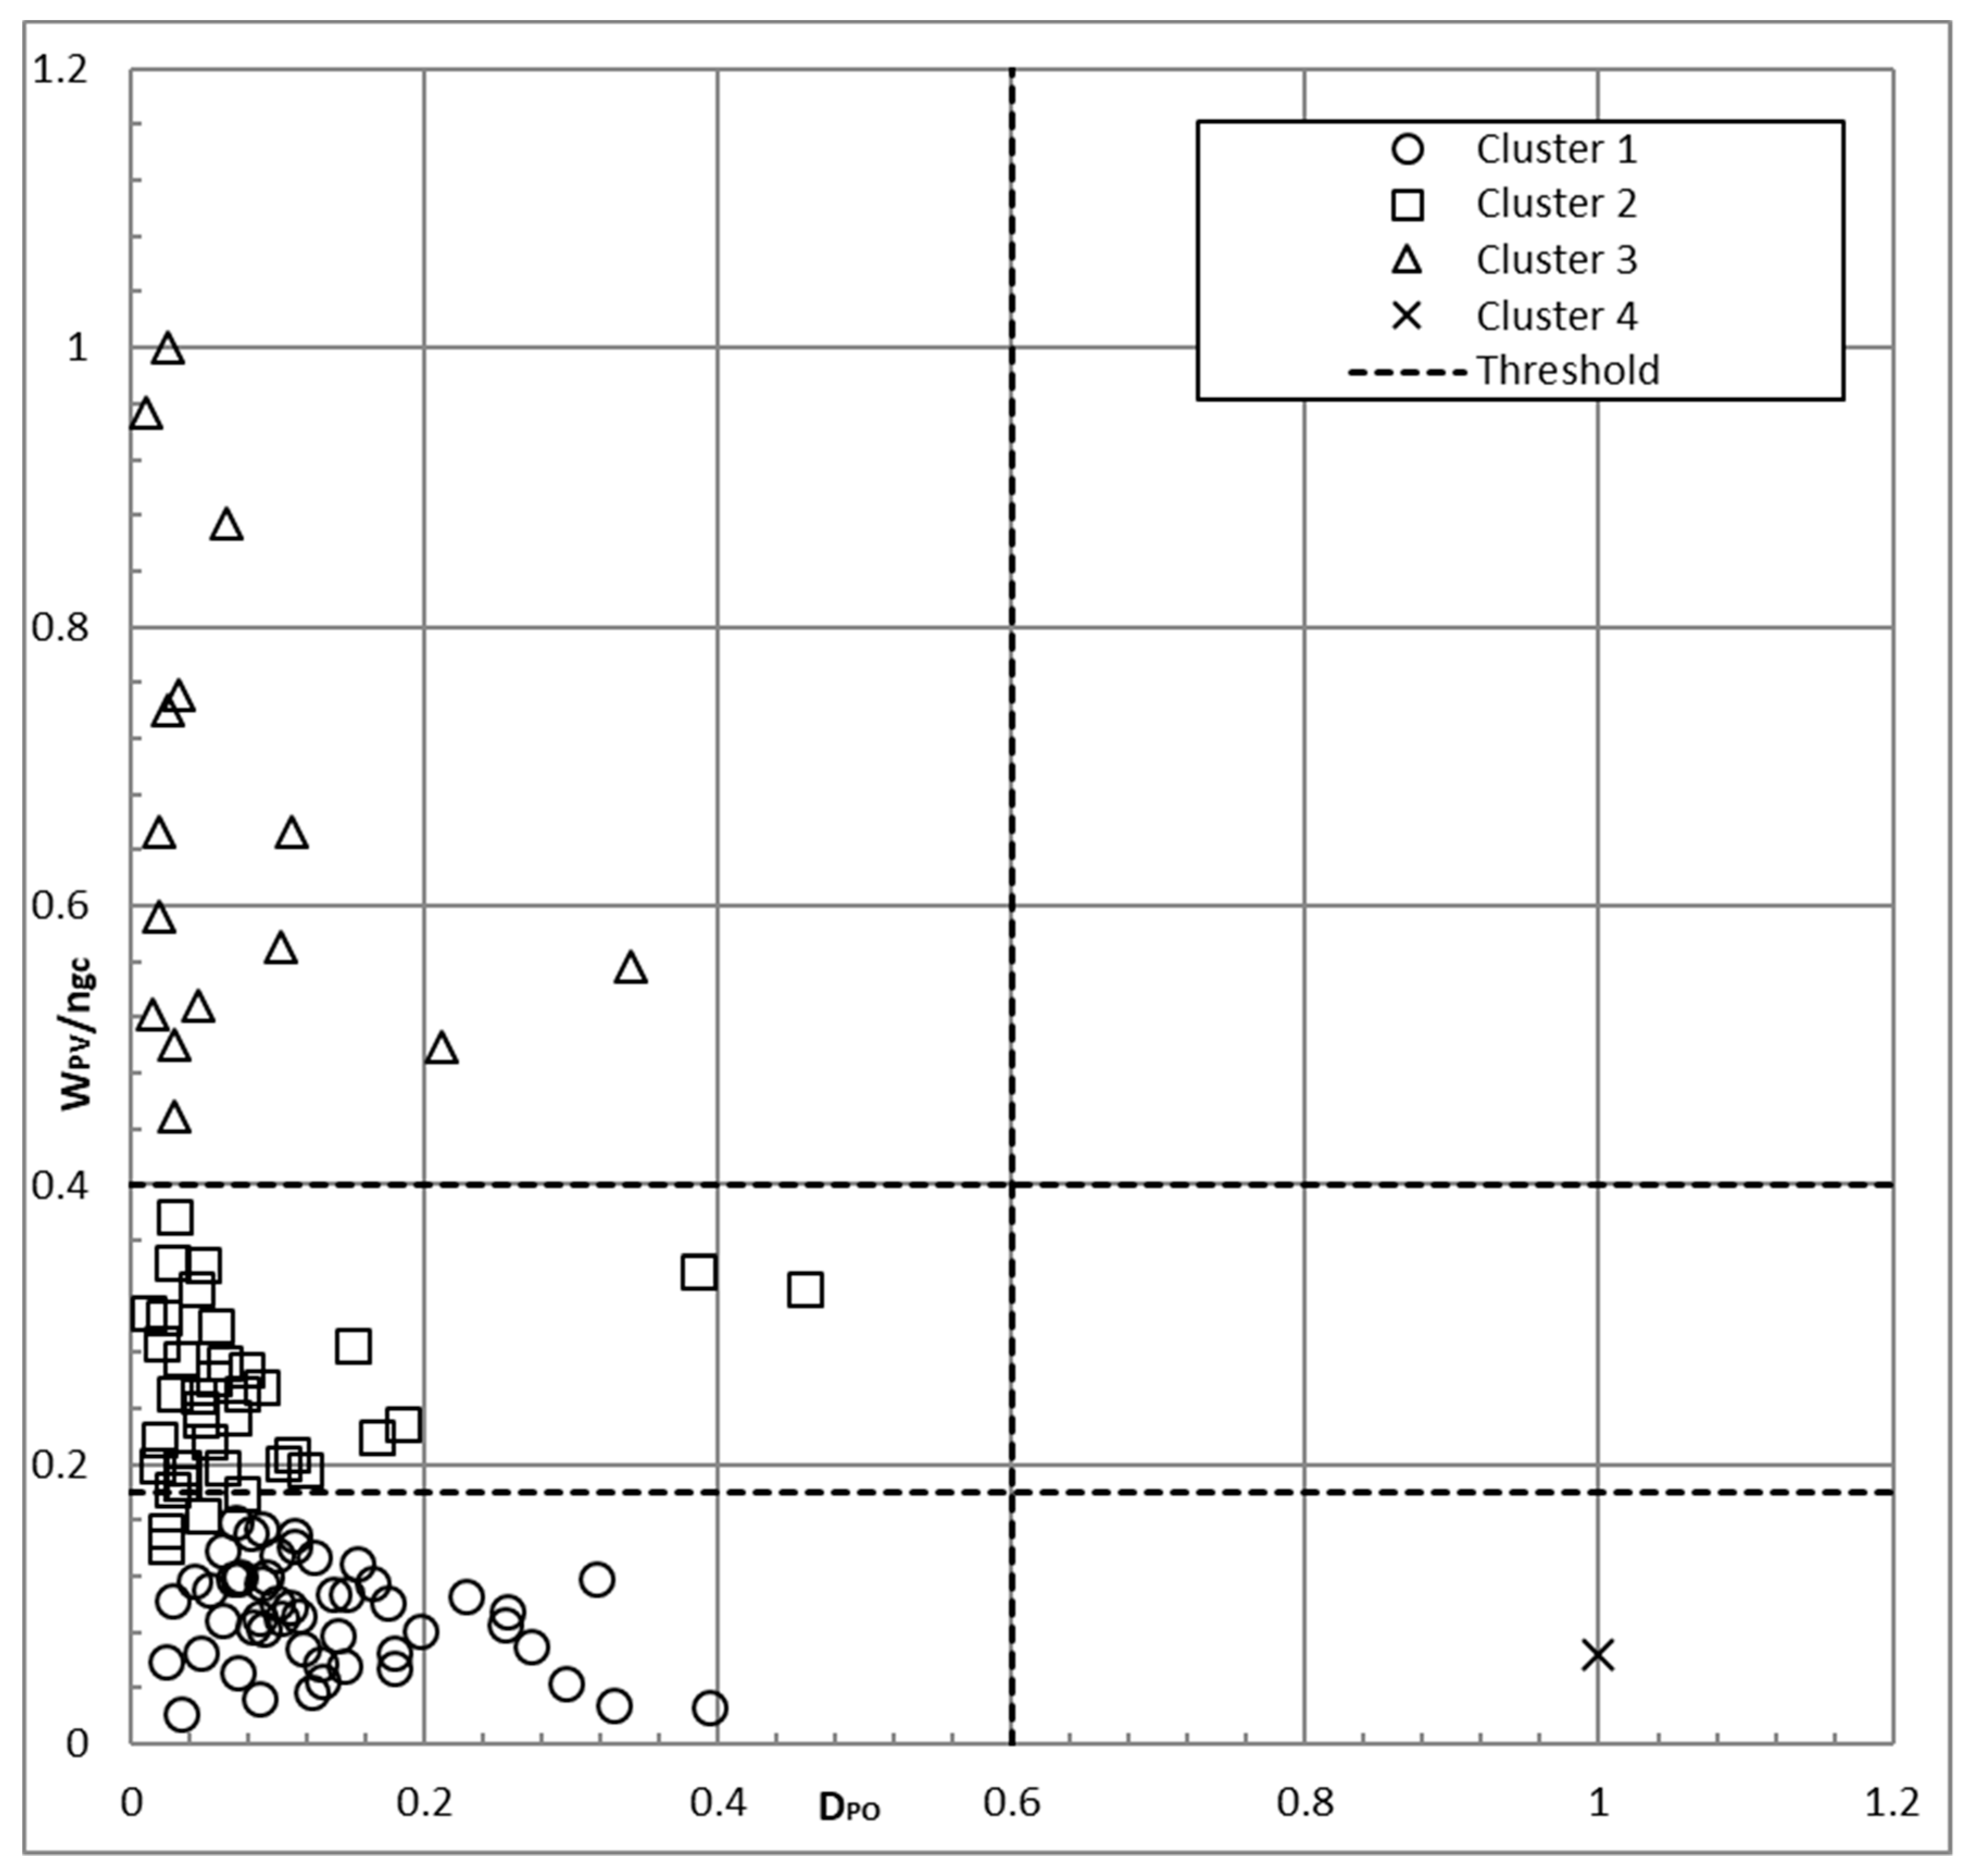
Frist the results are calculated using the k-Means Algorithm. Figure 6. shows the clustering results for the attributes and DPO, which examines that high population density requires high levels of peak power photovoltaics in grid connection points.
Using k-Means four plausible clusters are identified, where three clusters show areas of low to moderate population density and three levels (circle, square, triangle) of peak power photovoltaics per grid connection point. For the cluster marked with cross low population density corresponds with the installed peak power capacity. For the intermediate cluster no definite statement on the adequacy of grid development can be made. For the upper third cluster (triangle), the installed PV peak power capacity is high as compared to population density and there are no development requirements at present. The right/lower forth cluster (cross) however is critical due low installed PV peak power capacity in spite of high population density. Further development needs could result, when PV fed-in steps up.
The results for k-means clustering provide some overview on the network structure but are little precise concerning the results. A comparatively high number of DSO results in the top-left (triangle) cluster or in the second cluster (squares), while only a single critical DSO in the fourth cluster (cross) is identified. The method risks to underestimate check-up and development requirements.
Figure 7 shows the clustering results with k-means considering the attributes lc and ngc.
The area in the left lower quadrant comprises the grids of with few of grid connection points ngc (for each grid- and transformation level) and low cable length lc, which is typical for lean rural grids. The grids located in the upper right quadrant are characterized by a large number of grid connection points and high cable lengths, a typical status of well-developed urban grids. K-means identifies a fourth cluster comprising only a single grind with very high lc and ngc values, which like the grids in cluster 3 is balanced and thus does not require development. The grids in the lower right section have got a large number of connection points and low cable lengths i.e. are densely interconnected, and there is no development need. K-Means clustering delivers a large number of grids in this section, which however are broadly dispersed and partly overlap with other sections. The upper left area however comprises grids of high cable length but few interconnection points. These grids are poorly interconnected to neighboring networks and among themselves and should be developed further to master high photovoltaic peak inflows. K-means locates none of the grids in this section. Since these results of k-means do not deliver precise information on development requirements, other algorithms are tried to obtain more distinct insights.
4.3. Results for DBSCAN Algorithm
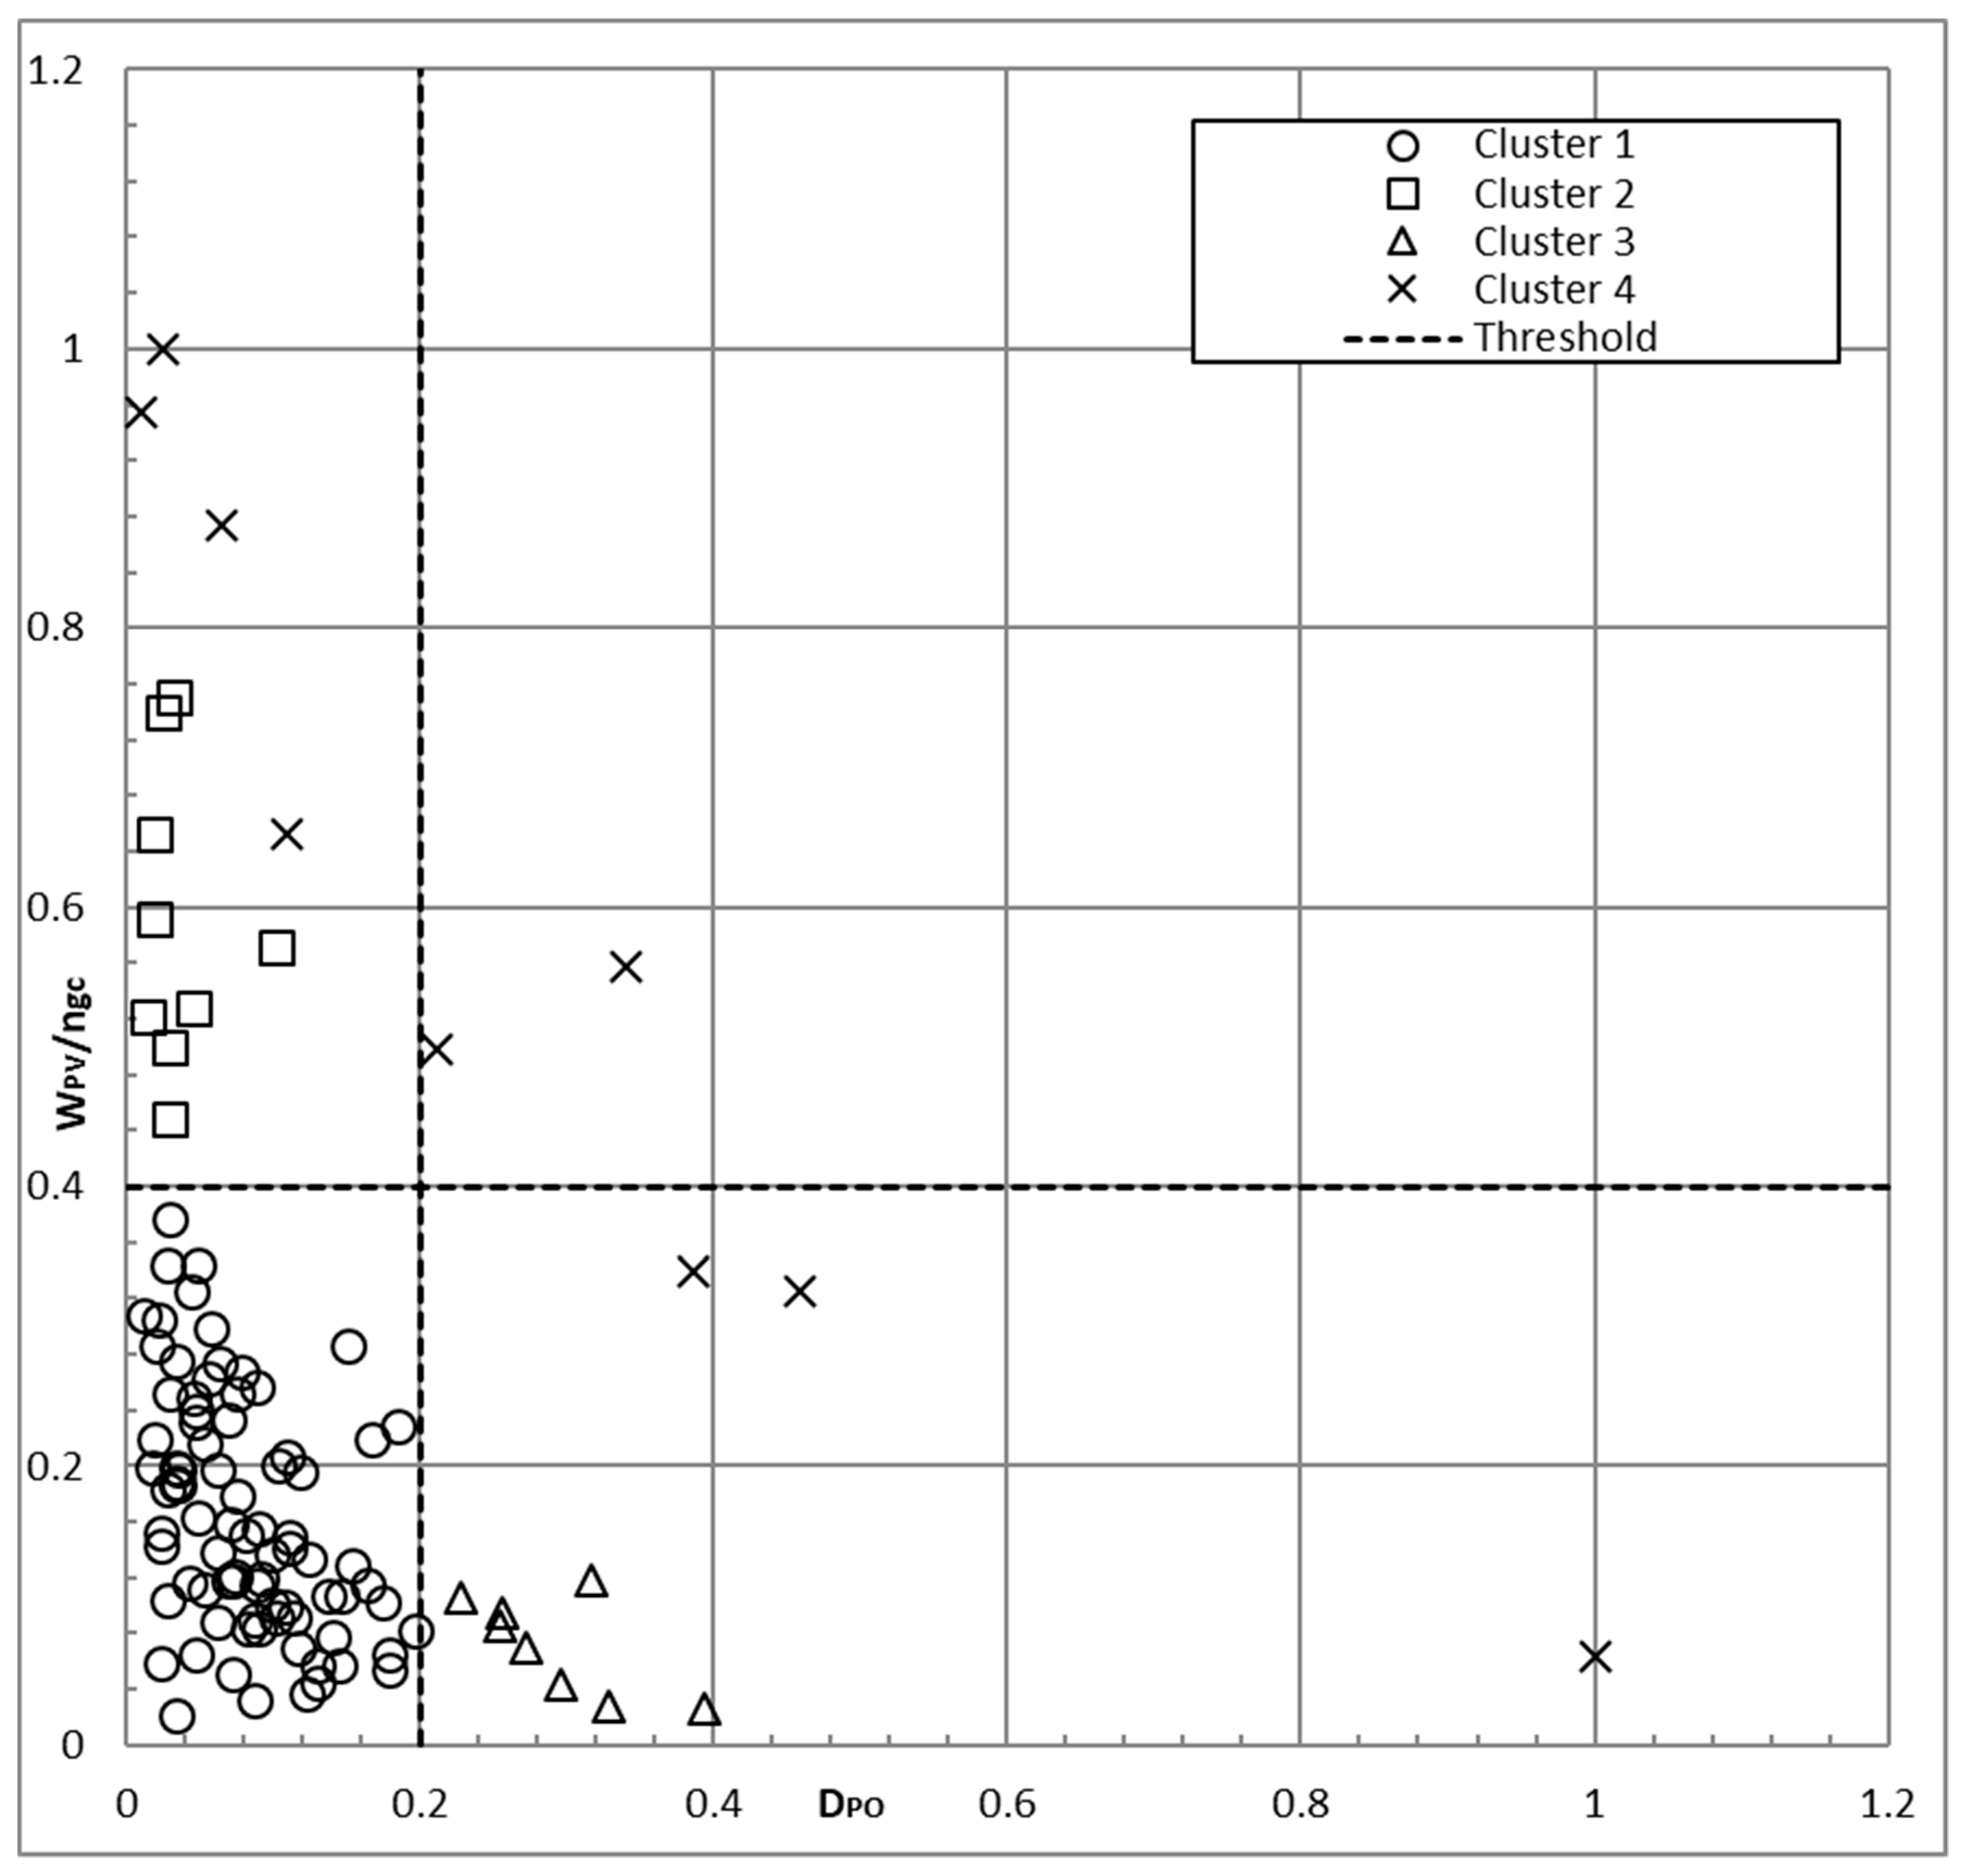
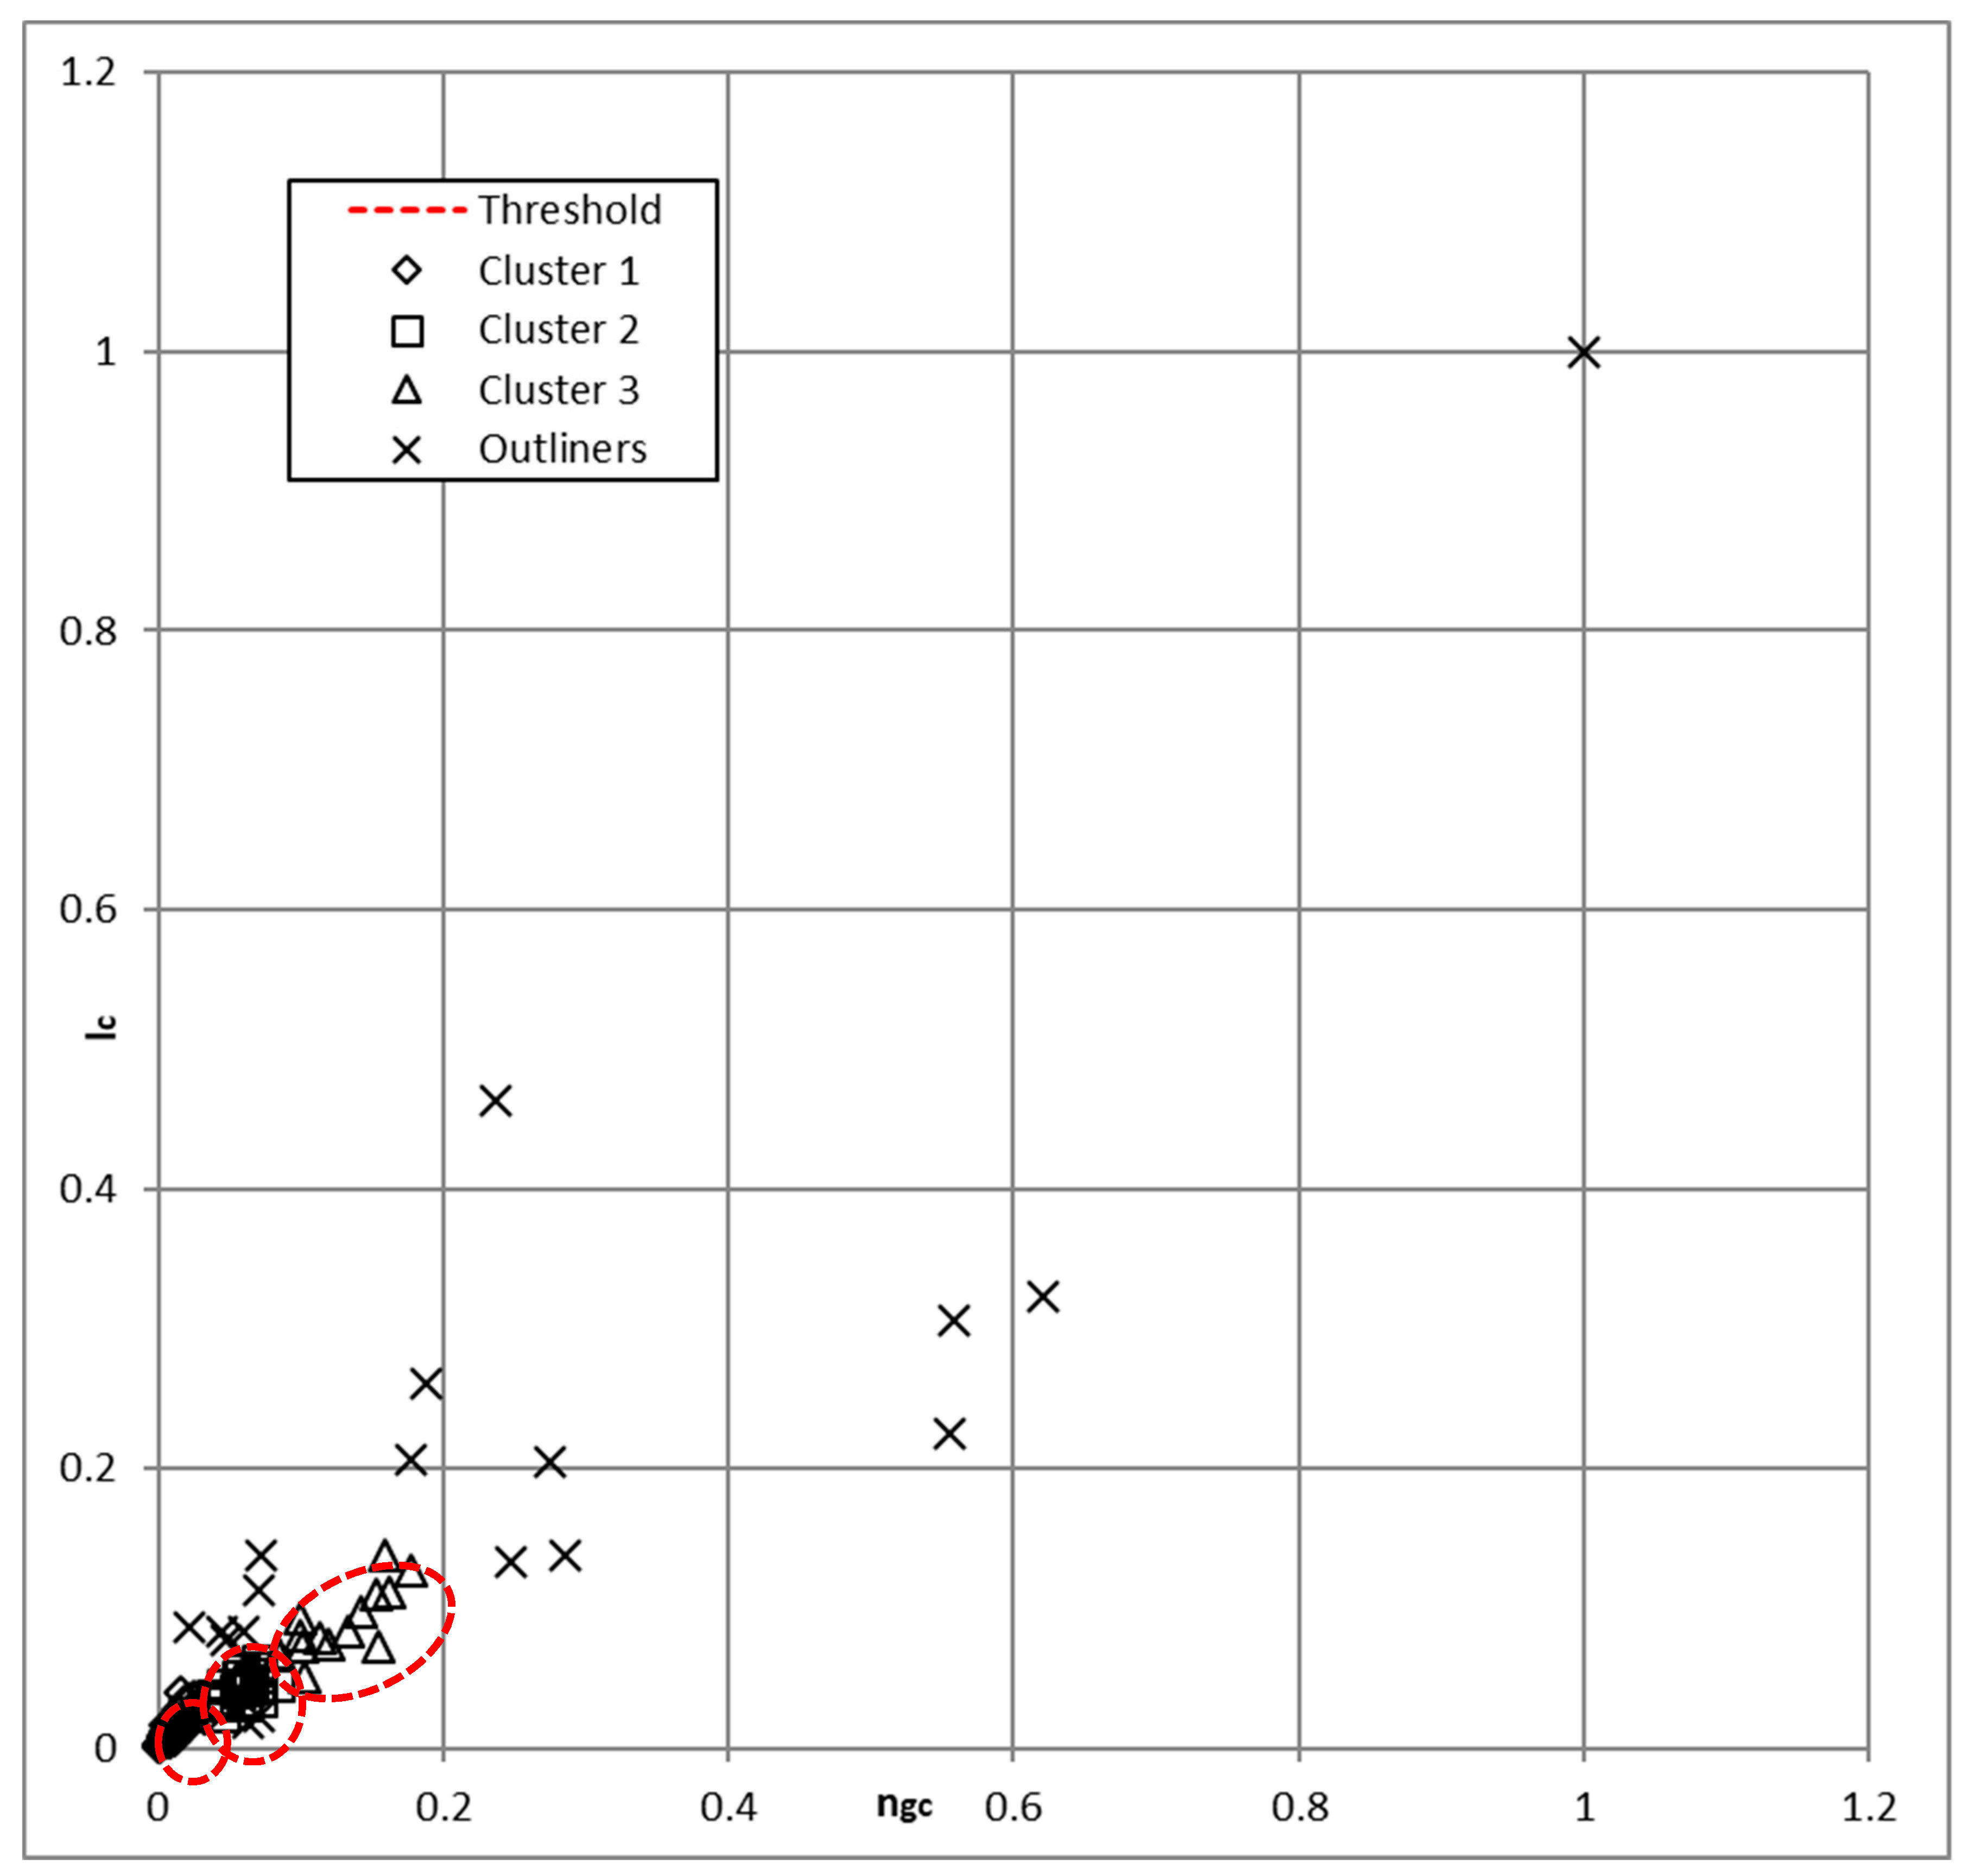
To improve and validate the results, now the corresponding analysis is performed with the DBSCAN Algorithm and using four clusters with the parameters of nmin = 3 and ε = 0.07. Clustering the attributes and DPO,N, Figure 8 results:
Figure 8 illustrates that DB SCAN identifies essentially three comprehensive clusters of DSO. Some noise (cross) remains. The first cluster (circle) in the left-bottom area comprises DSO in rural areas, i.e., of low population density and low peak power photovoltaics in grid connection points. The grids in this cluster are adequately equipped corresponding to the present low PV-requirements. The second cluster (square) comprises DSO with low population density but high peak power photovoltaics in grid connection points, these grids are very well equipped above the requirements at present. The third cluster (triangle) on the other hand comprises DSO with high population density buy low peak power photovoltaics in grid connection points, i.e., poorly furnished grids which should be inspected and remunerated to stabilize the Baden-Württemberg TSO network as a whole.
Although there is some noise the DBSCAN Algorithm provides valuable results and reliably extracts grids with remuneration needs. The results for Baden-Württemberg are more plausible for DBSCAN than for K-Means, since DBSCAN selects a limited number of improvable DSO more accurately.
Correspondingly, the DBSCAN analysis is performed to assess the relationship of ngc and lc i.e., grid connection points and cable length. It identifies Essentially 4 clusters. Three of them are located closely together and the fourth is highly dispersed. Grids with development requirements which should be located in the upper left area (high cable lengths and low number of grid connection points) are hard to differentiate on the basis of this classification since DBSCAN does not separate these reliably from well-developed grids in the upper right quadrant (Figure 9, following page).
The DBSCAN algorithm delivers well interpretable results for the relationship of and DPO, i.e., population density and available levels of peak power photovoltaics in grid connection points but is not precise for lc and Ngc. A third algorithm is tested to amend on this point
4.4. Results for Gauss-Newton Algorithm
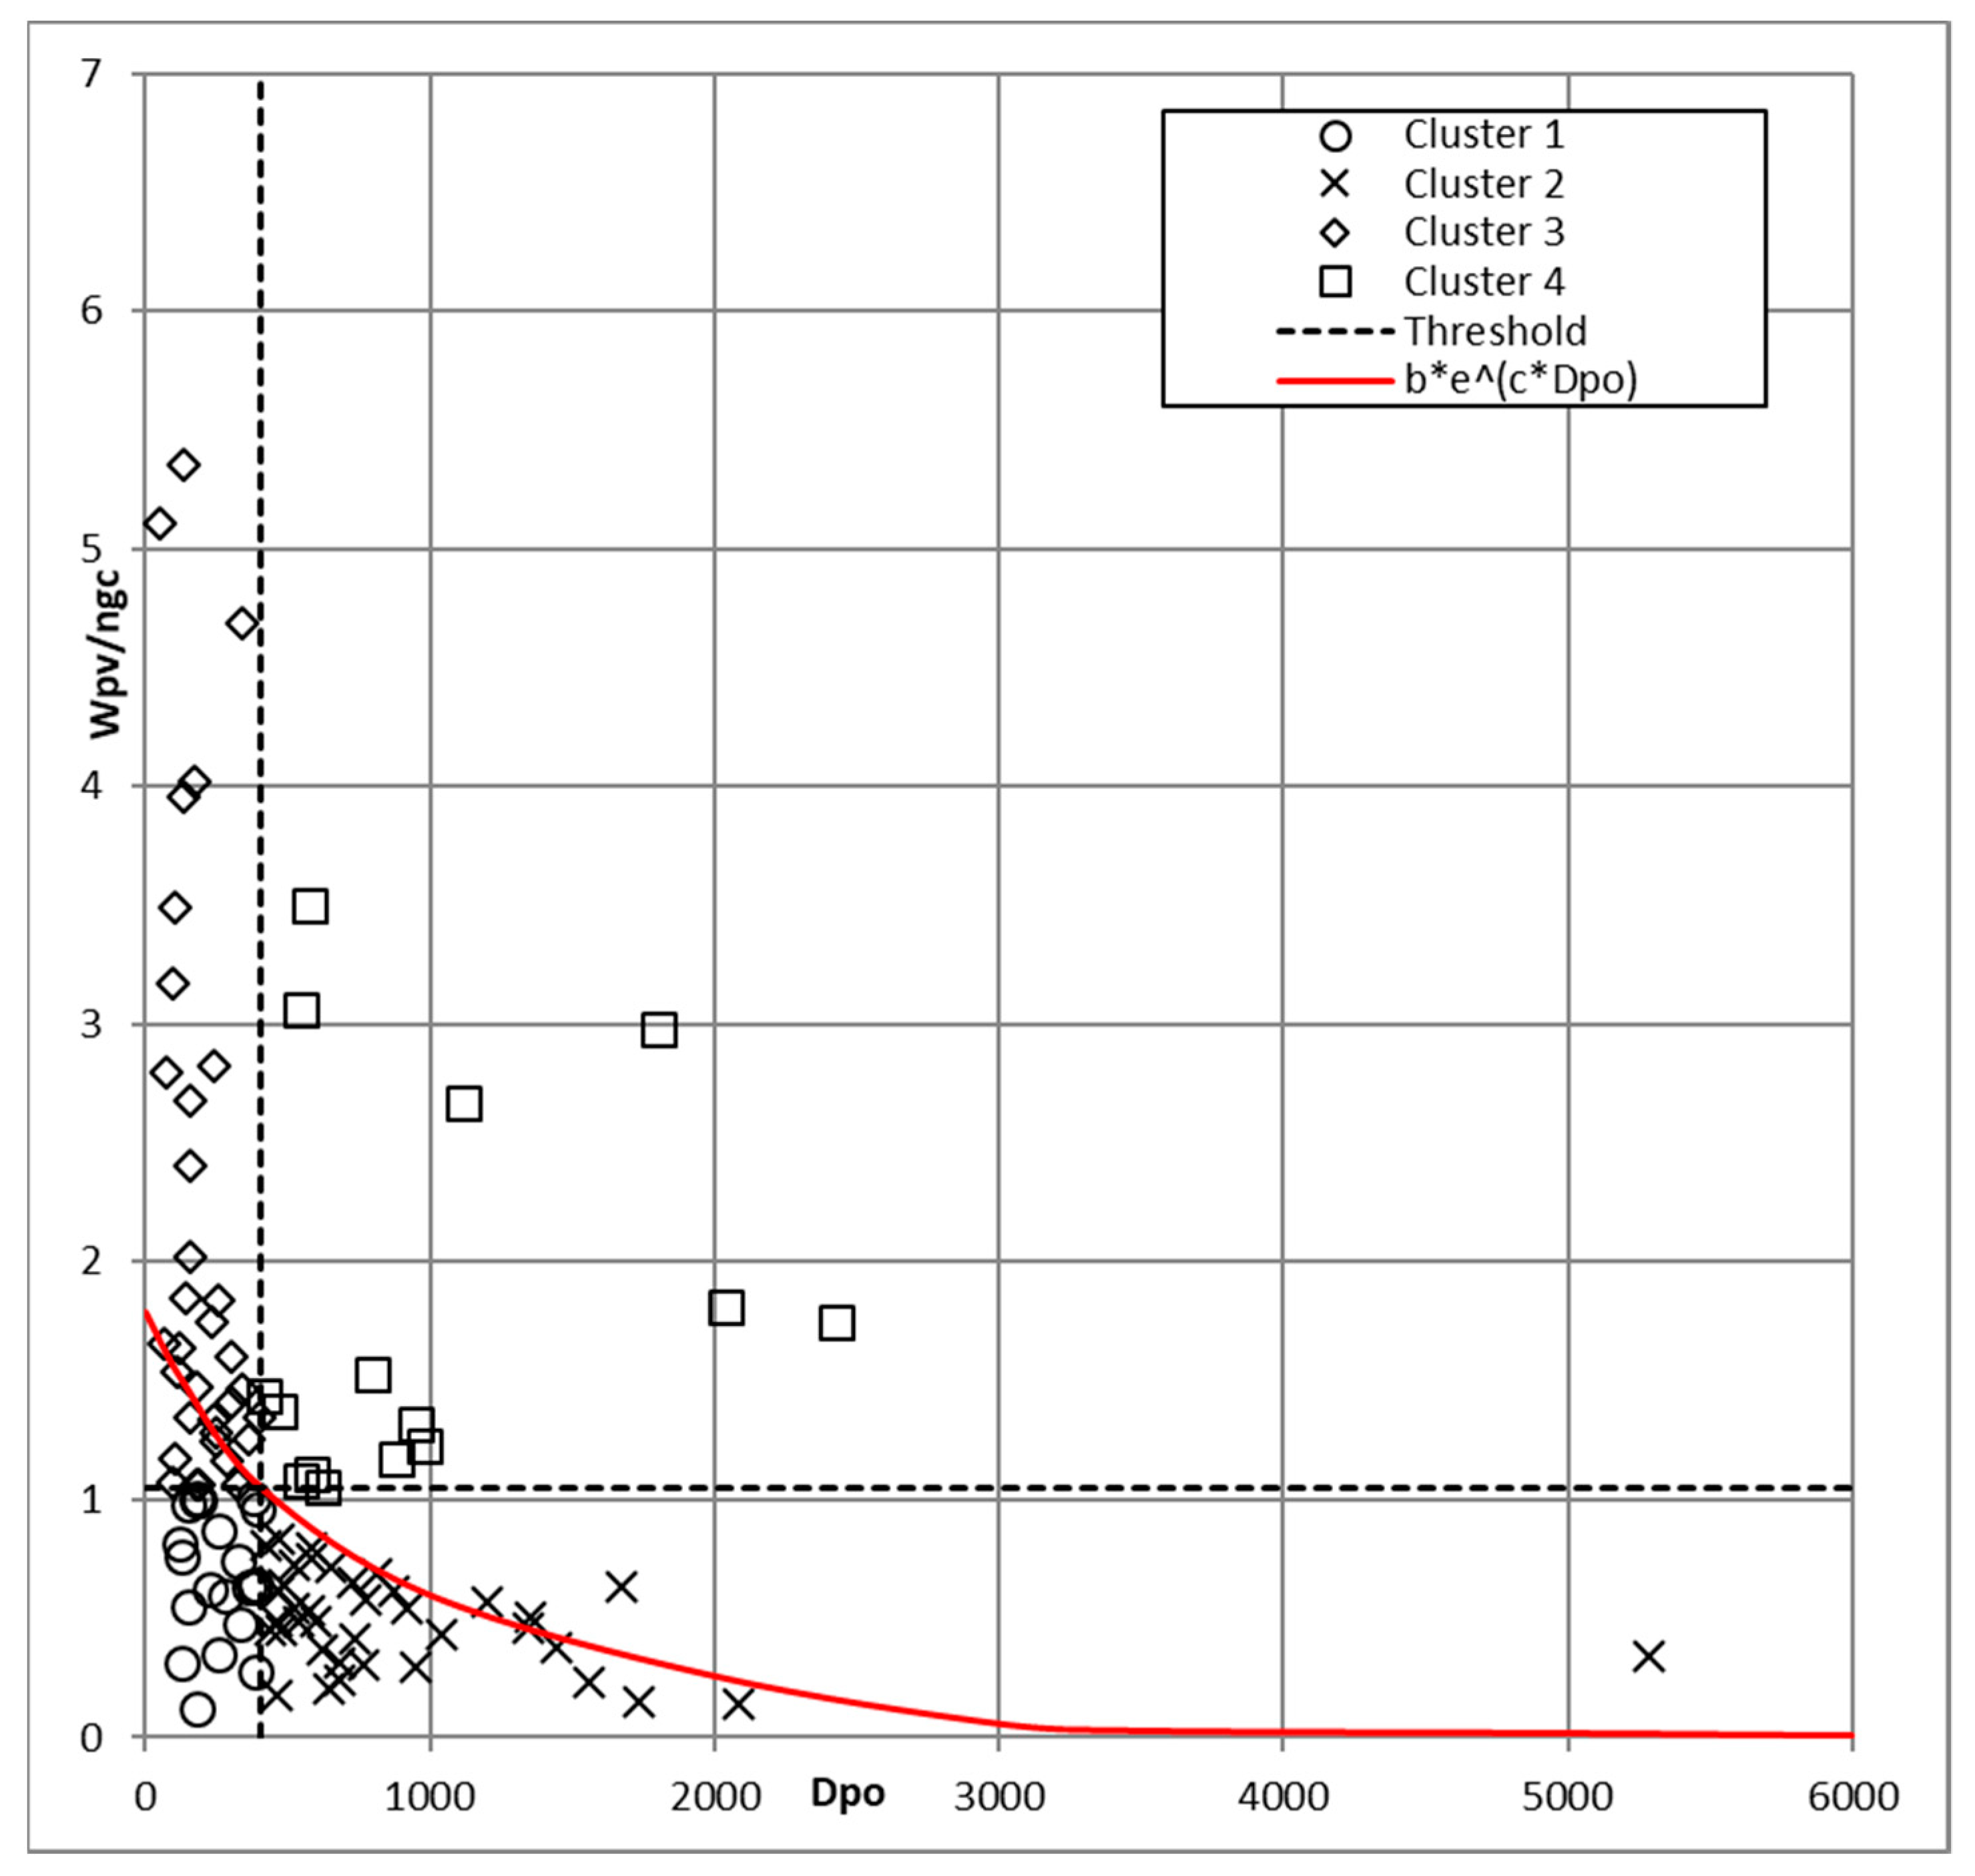
Finally, the Gauss-Newton-Algorithm is tested for the same clustering task. It is specified for the value pairs and Dpo as follows:
Figure 10 shows the shows the plot of versus Dpo.
The four clusters derived by means of the exponential function are indicated. Using the gradient described in Section 4.5 c), the center of the graphic results with x = 418 and y = 0.89. From this center two separation lines (orthogonal and vertical) crossing in the center can be used to differentiate 4 clusters. The vertical divide accordingly is at 418 Inhabitants km−2 and differentiates rural from urban areas of Baden-Württemberg. The horizonal divide differentiates the grids into two clusters, clusters with high and low installed peak power of photovoltaics by number of grid connection points. As for the previous analyzes areas located in the lower left cluster are characterized by low population density and adequate low peak power by grid connection point. DSO located in the upper right quadrant are grids in urban regions, which are adequately furnished with high peak power per connection point. The upper left quadrant comprises DSO with excess installed peak power as compared to the present population density. In the lower right quadrant however, poorly equipped grids are located: these should be remunerated to cope with the peak power requirements of a comparatively dense population.
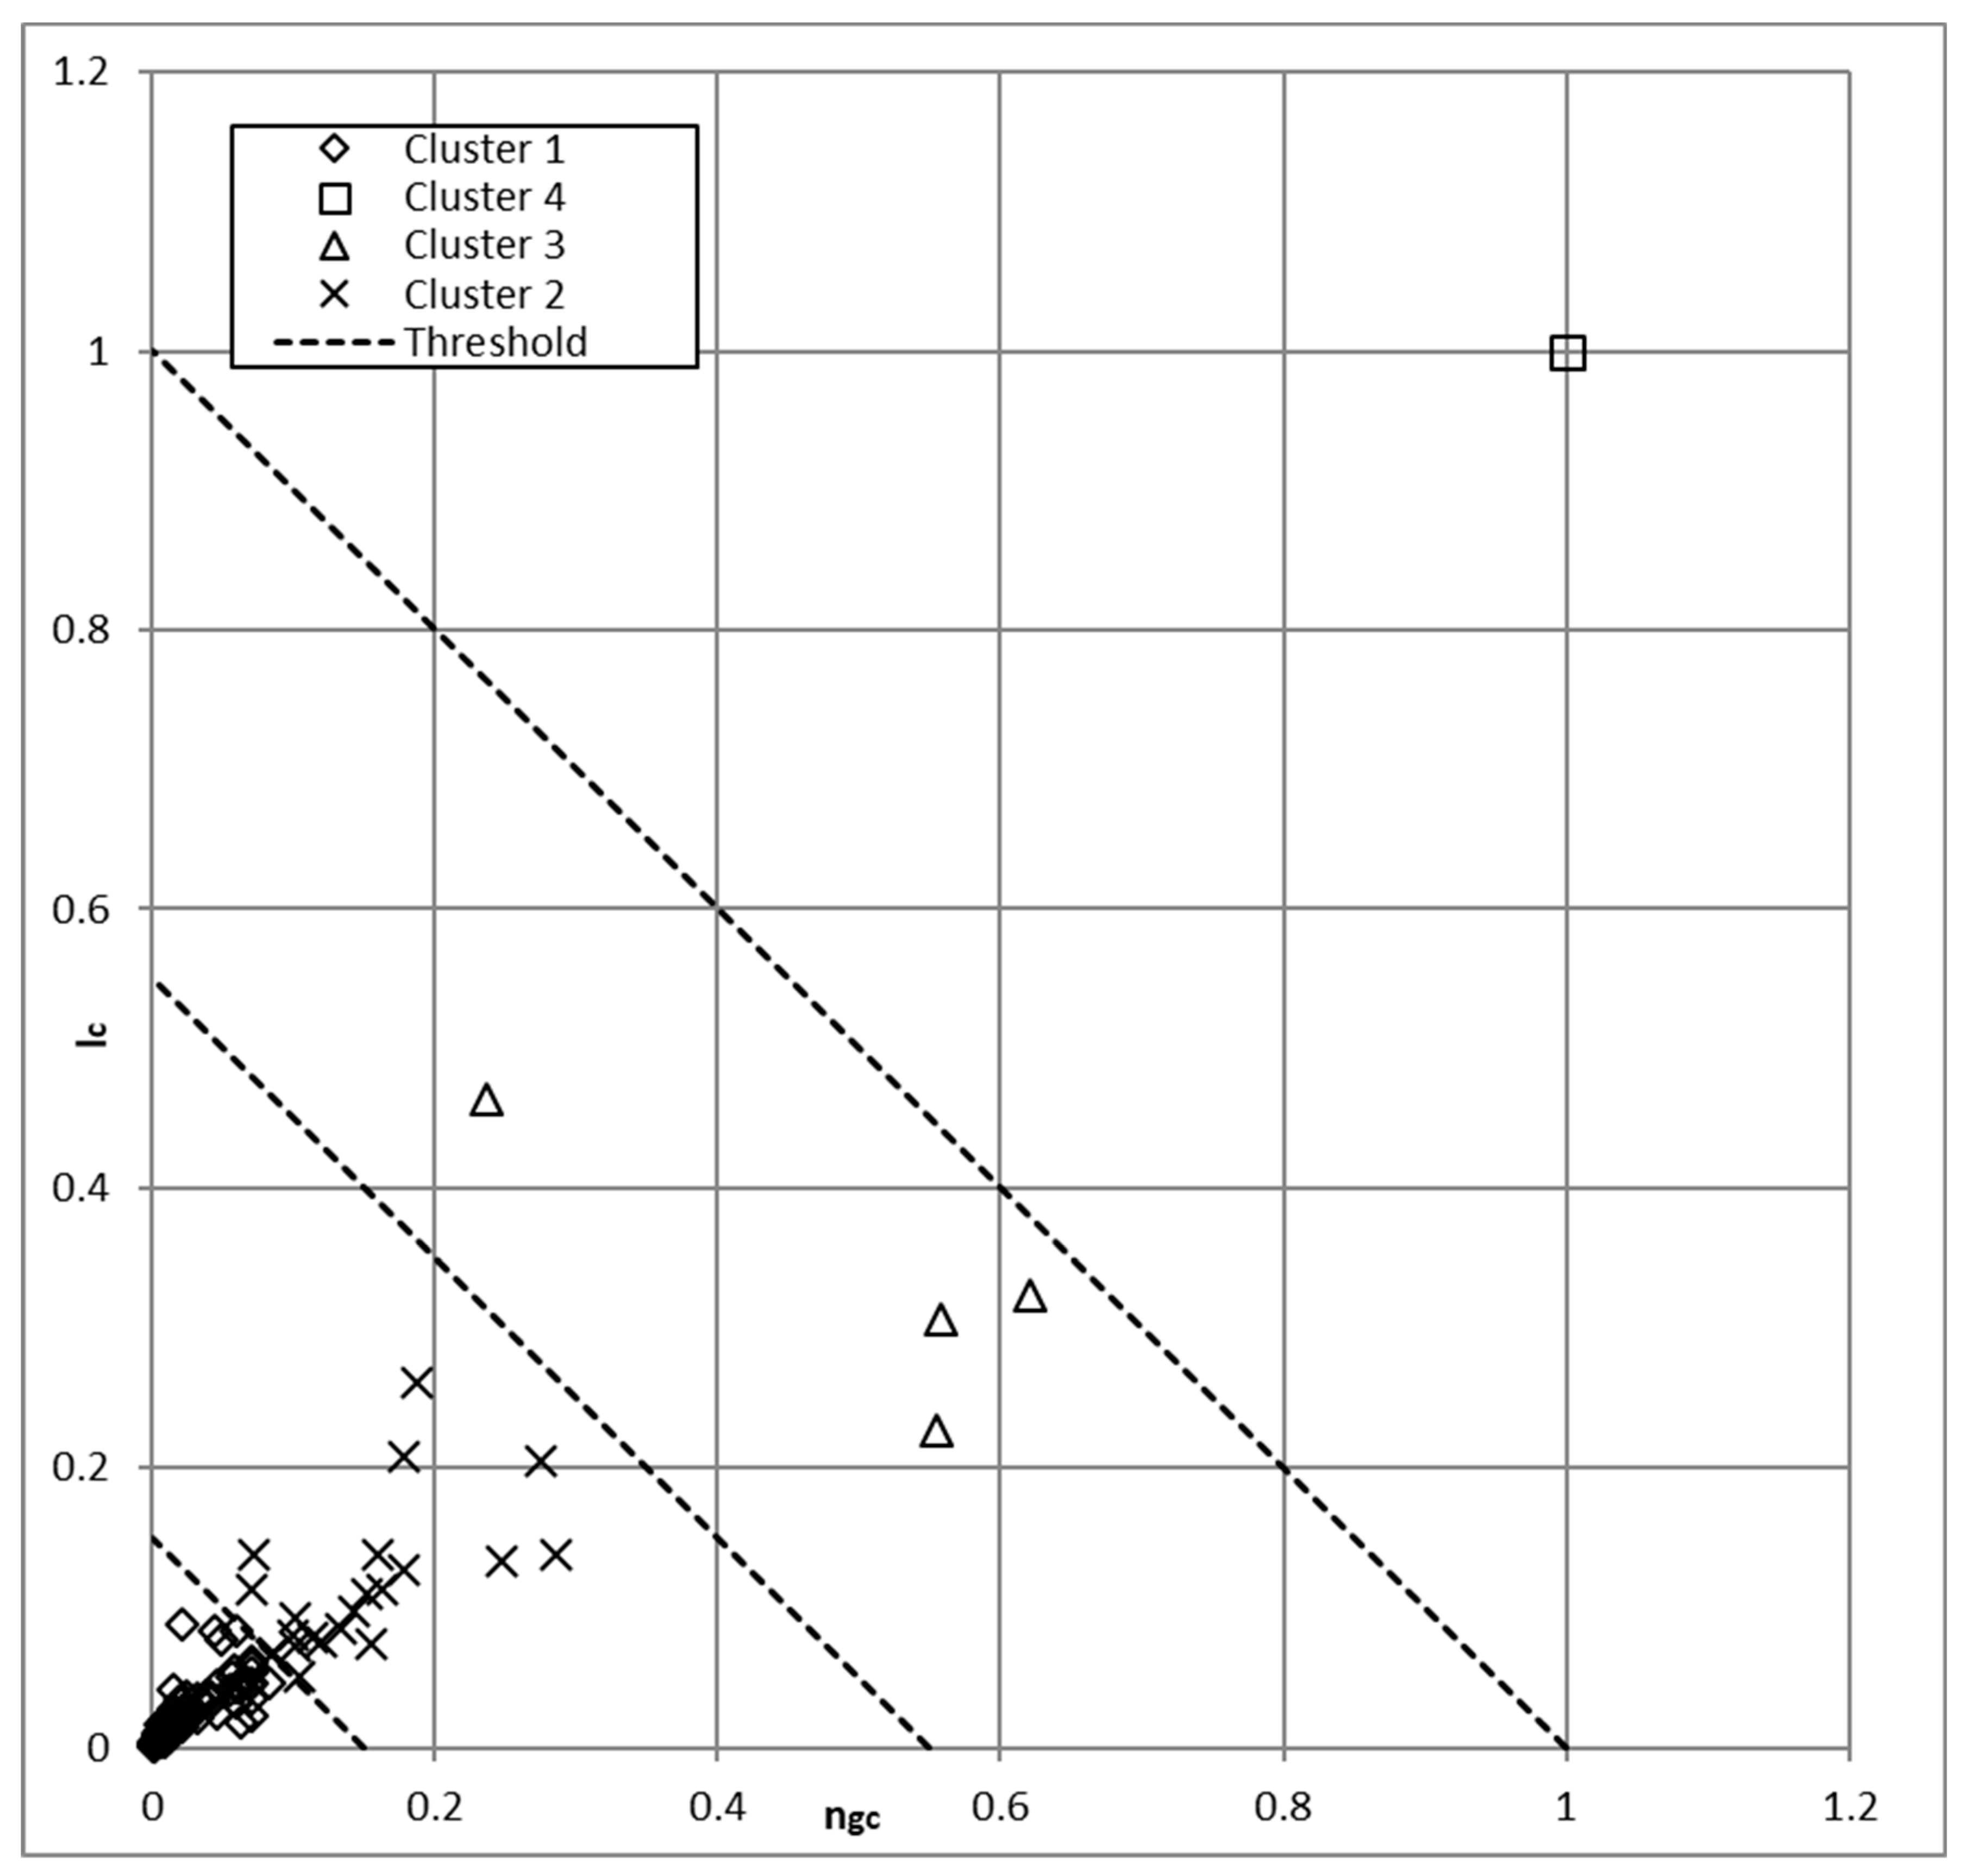
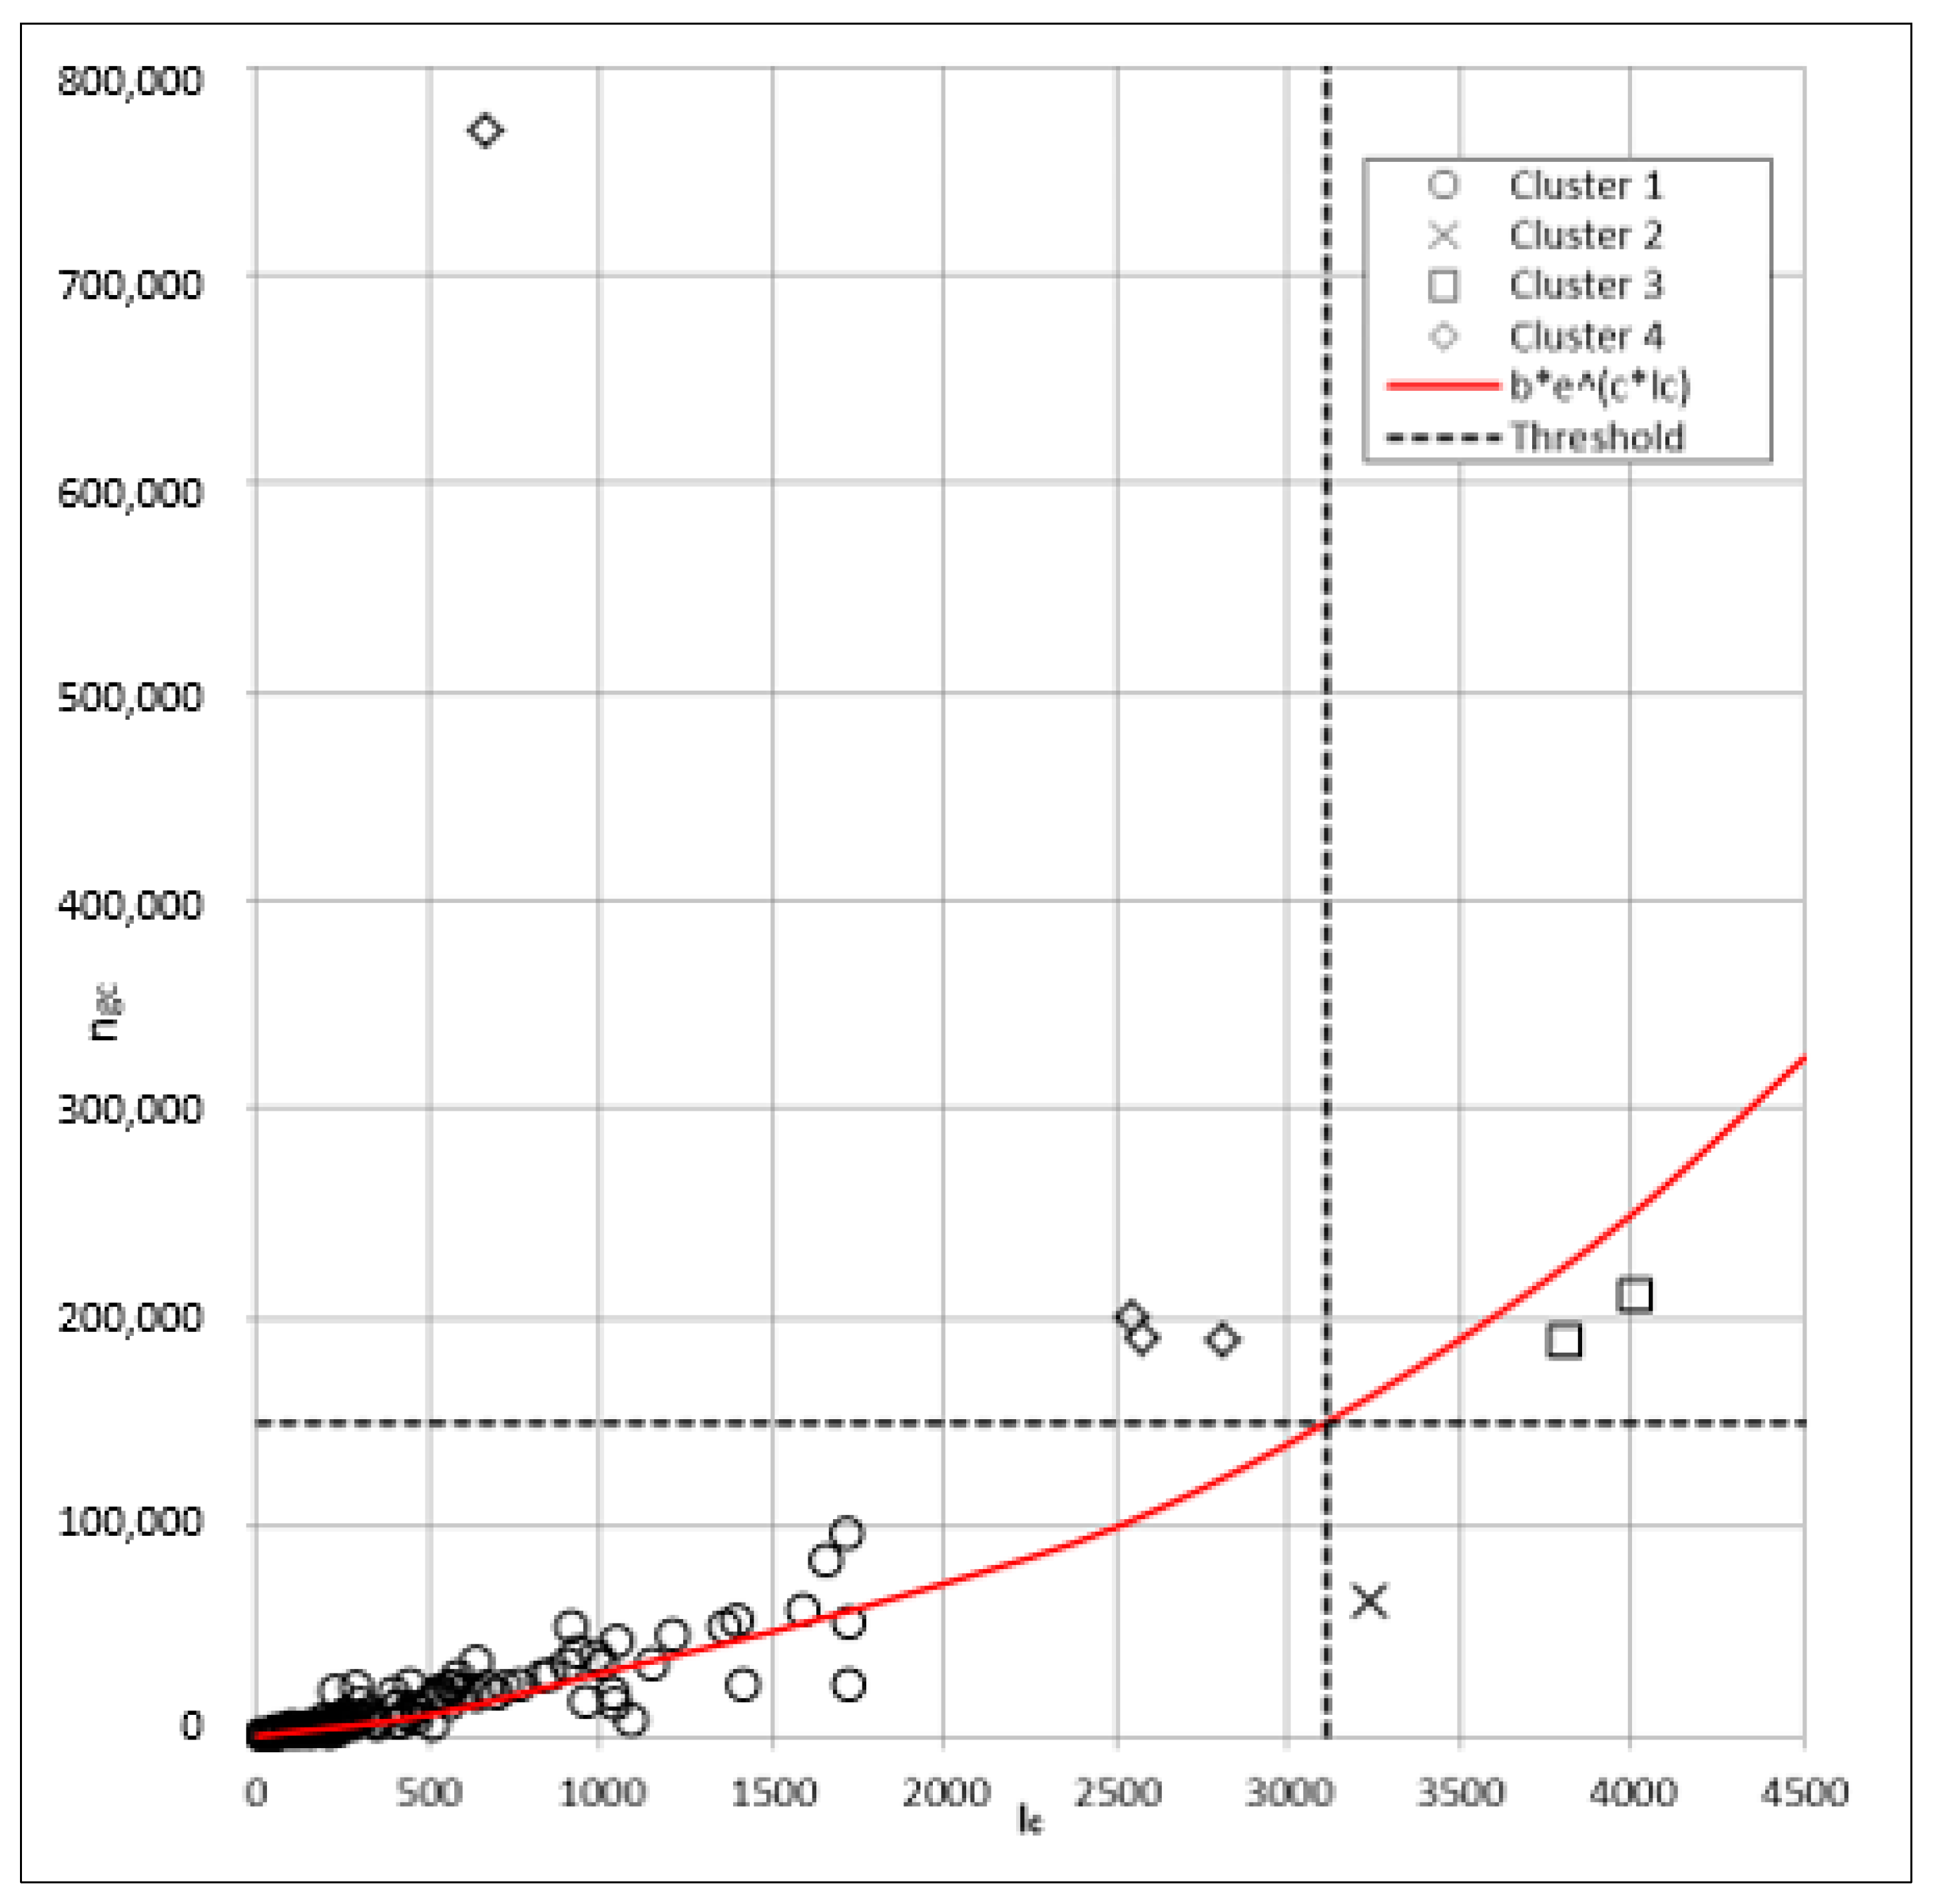
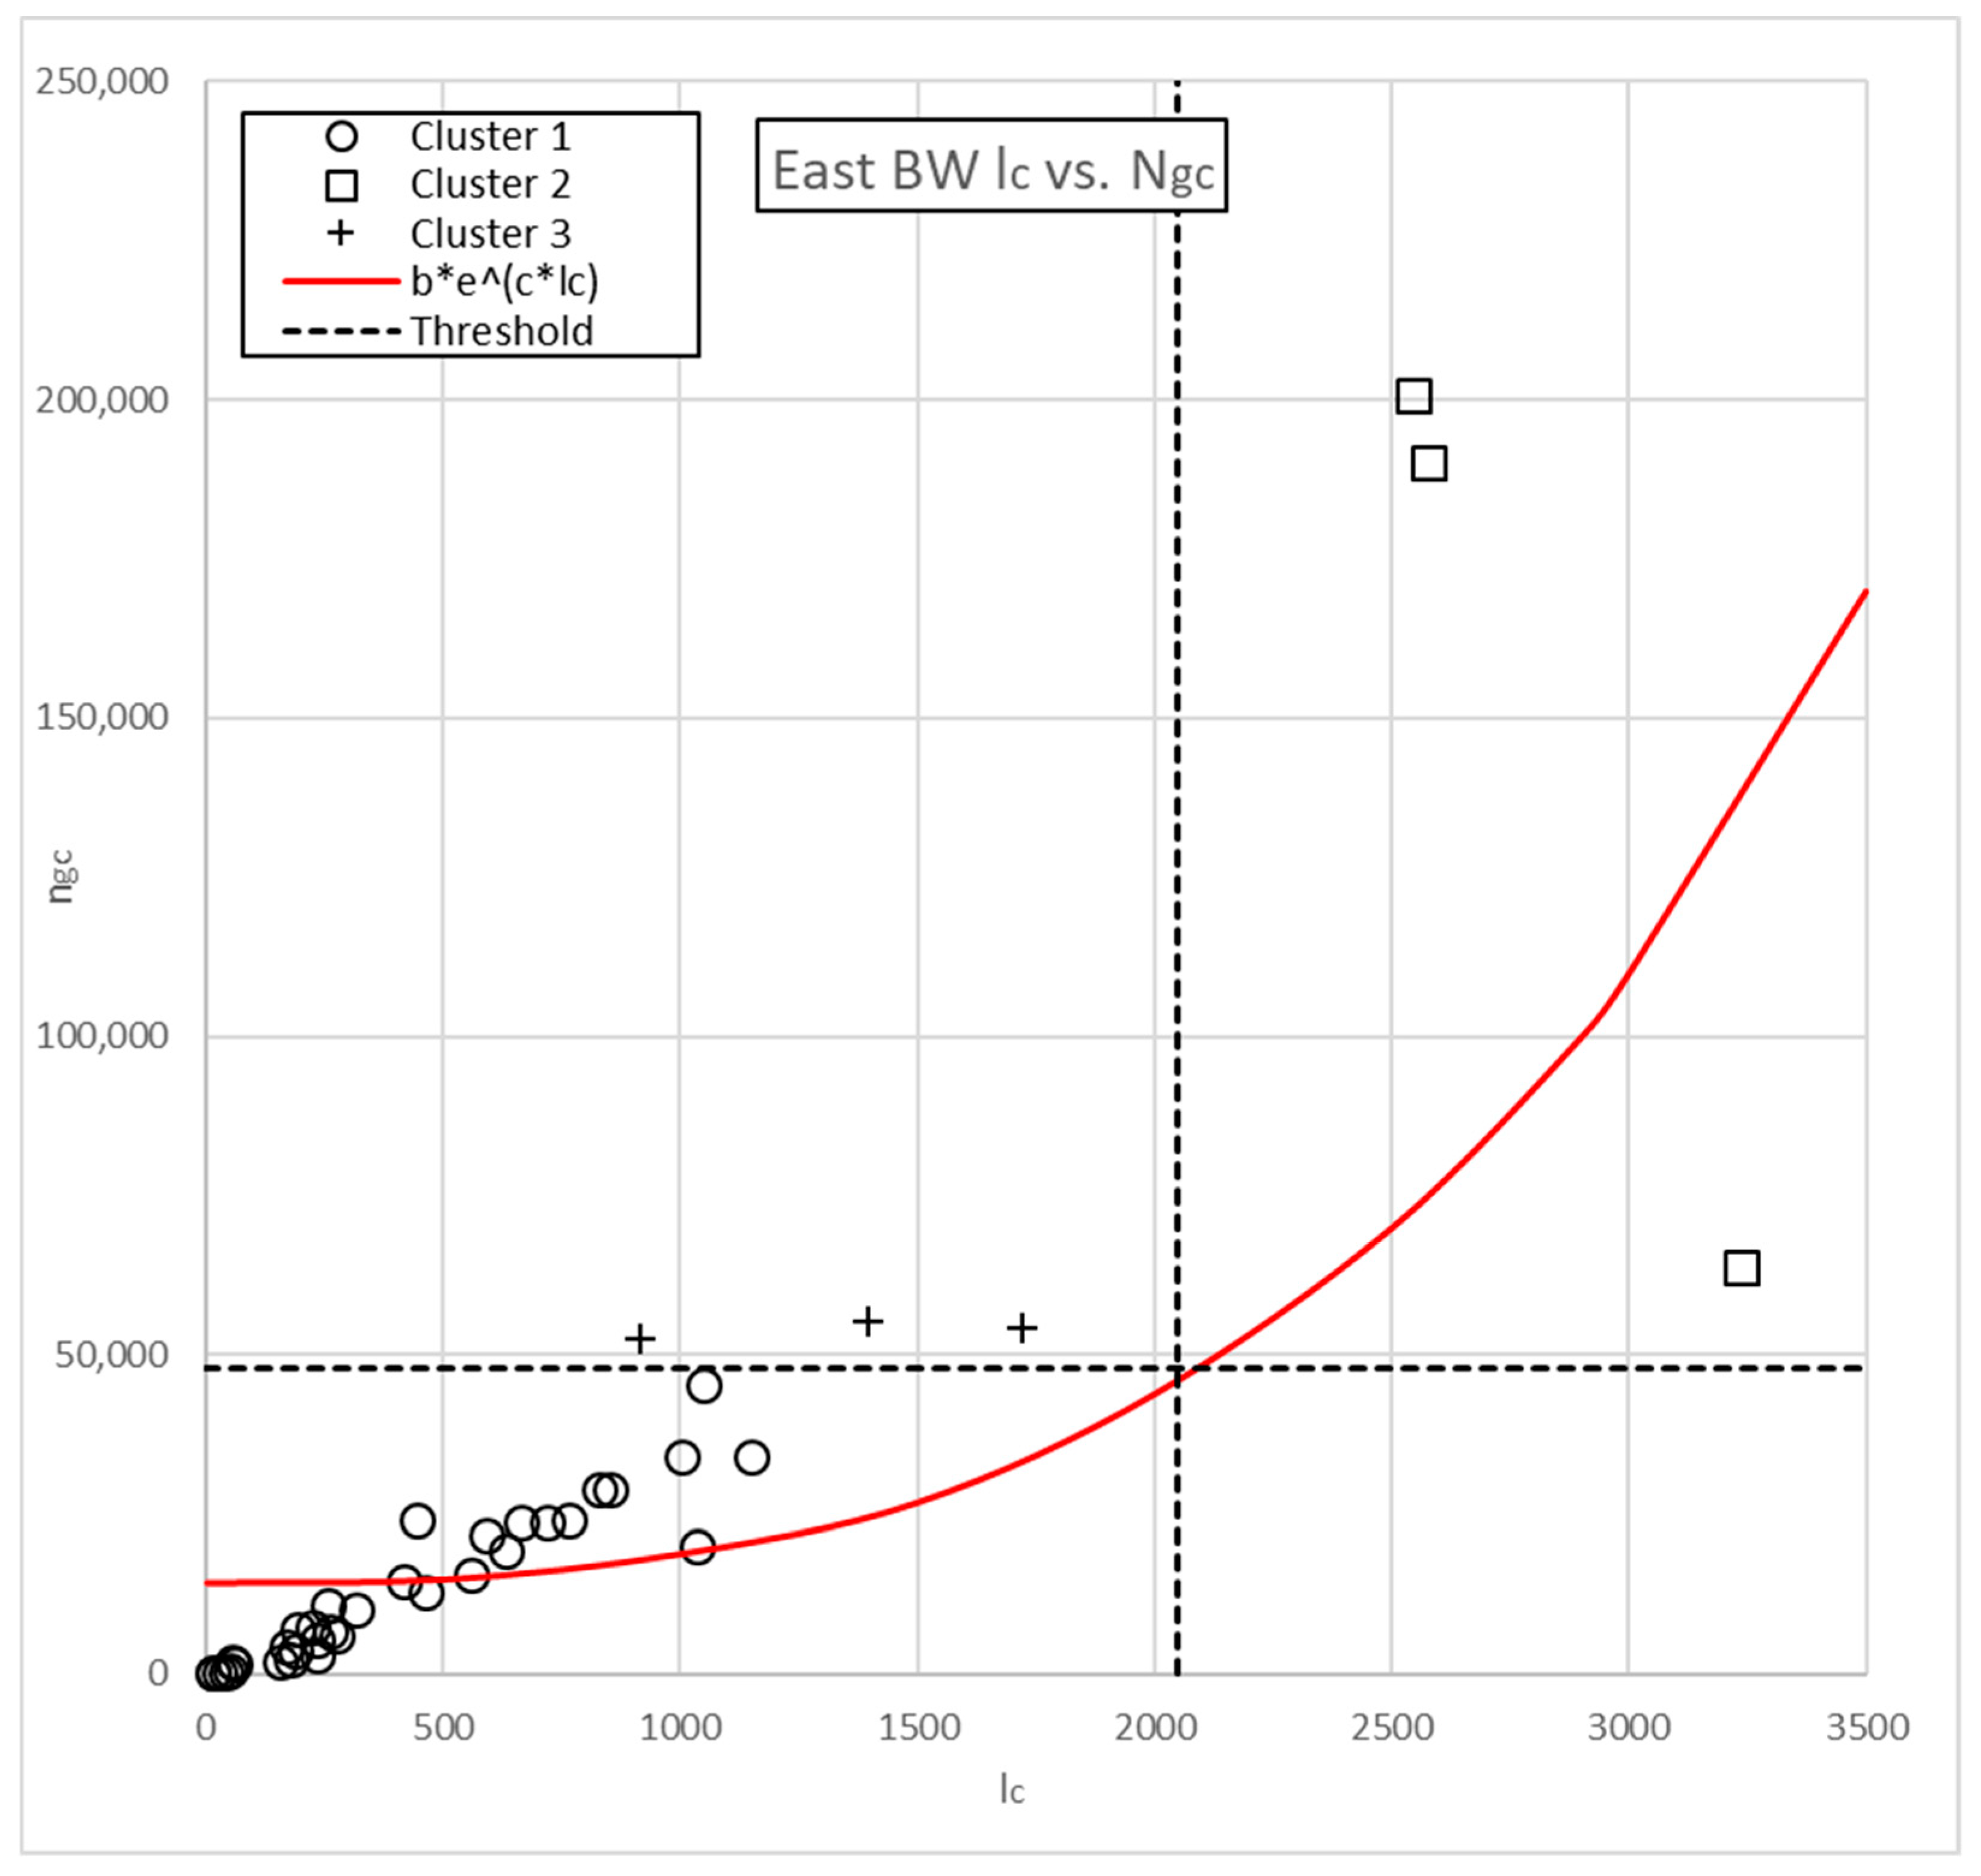
Will Gauss-newton equally deliver reliable results for the relationship of ngc and lc, i.e., the number of grid connection points and cable lengths? Figure 10 illustrates the results of the optimization, which other than DBSCAN and K-means identifies four distinct quarters clearly. Like K-means and DBSCAN, the Gauss-Newton algorithm locates most of the grids in the lower left area (rural grids with corresponding low numbers of interconnectors and low cable lengths. Gauss-Newton however finds a single grid in the upper left section, which is critical due the misfit of high cable length and a low number of grid interconnection points. In order to cope with high photovoltaics inputs this grid has to be developed by increasing the number of interconnectors. The results for Gauss-Newton are much more clearly interpretable than for DBSCAN and k-Means, since cluster assignment is more distinctive.
As Figure 11 illustrates the results of the Gauss-Newton algorithm for the ngc -lc relationship as well as in Figure 10 the Dpo relationship are thus clearer than for the DBSCAN and K-Means algorithm. They provide a distinct four area classification without outliers and a manageable and clear cluster of DSO that require development inspections. The Gauss-Newton algorithm thus seems preferable as an analytical tool for the DSO network of Baden-Württemberg.
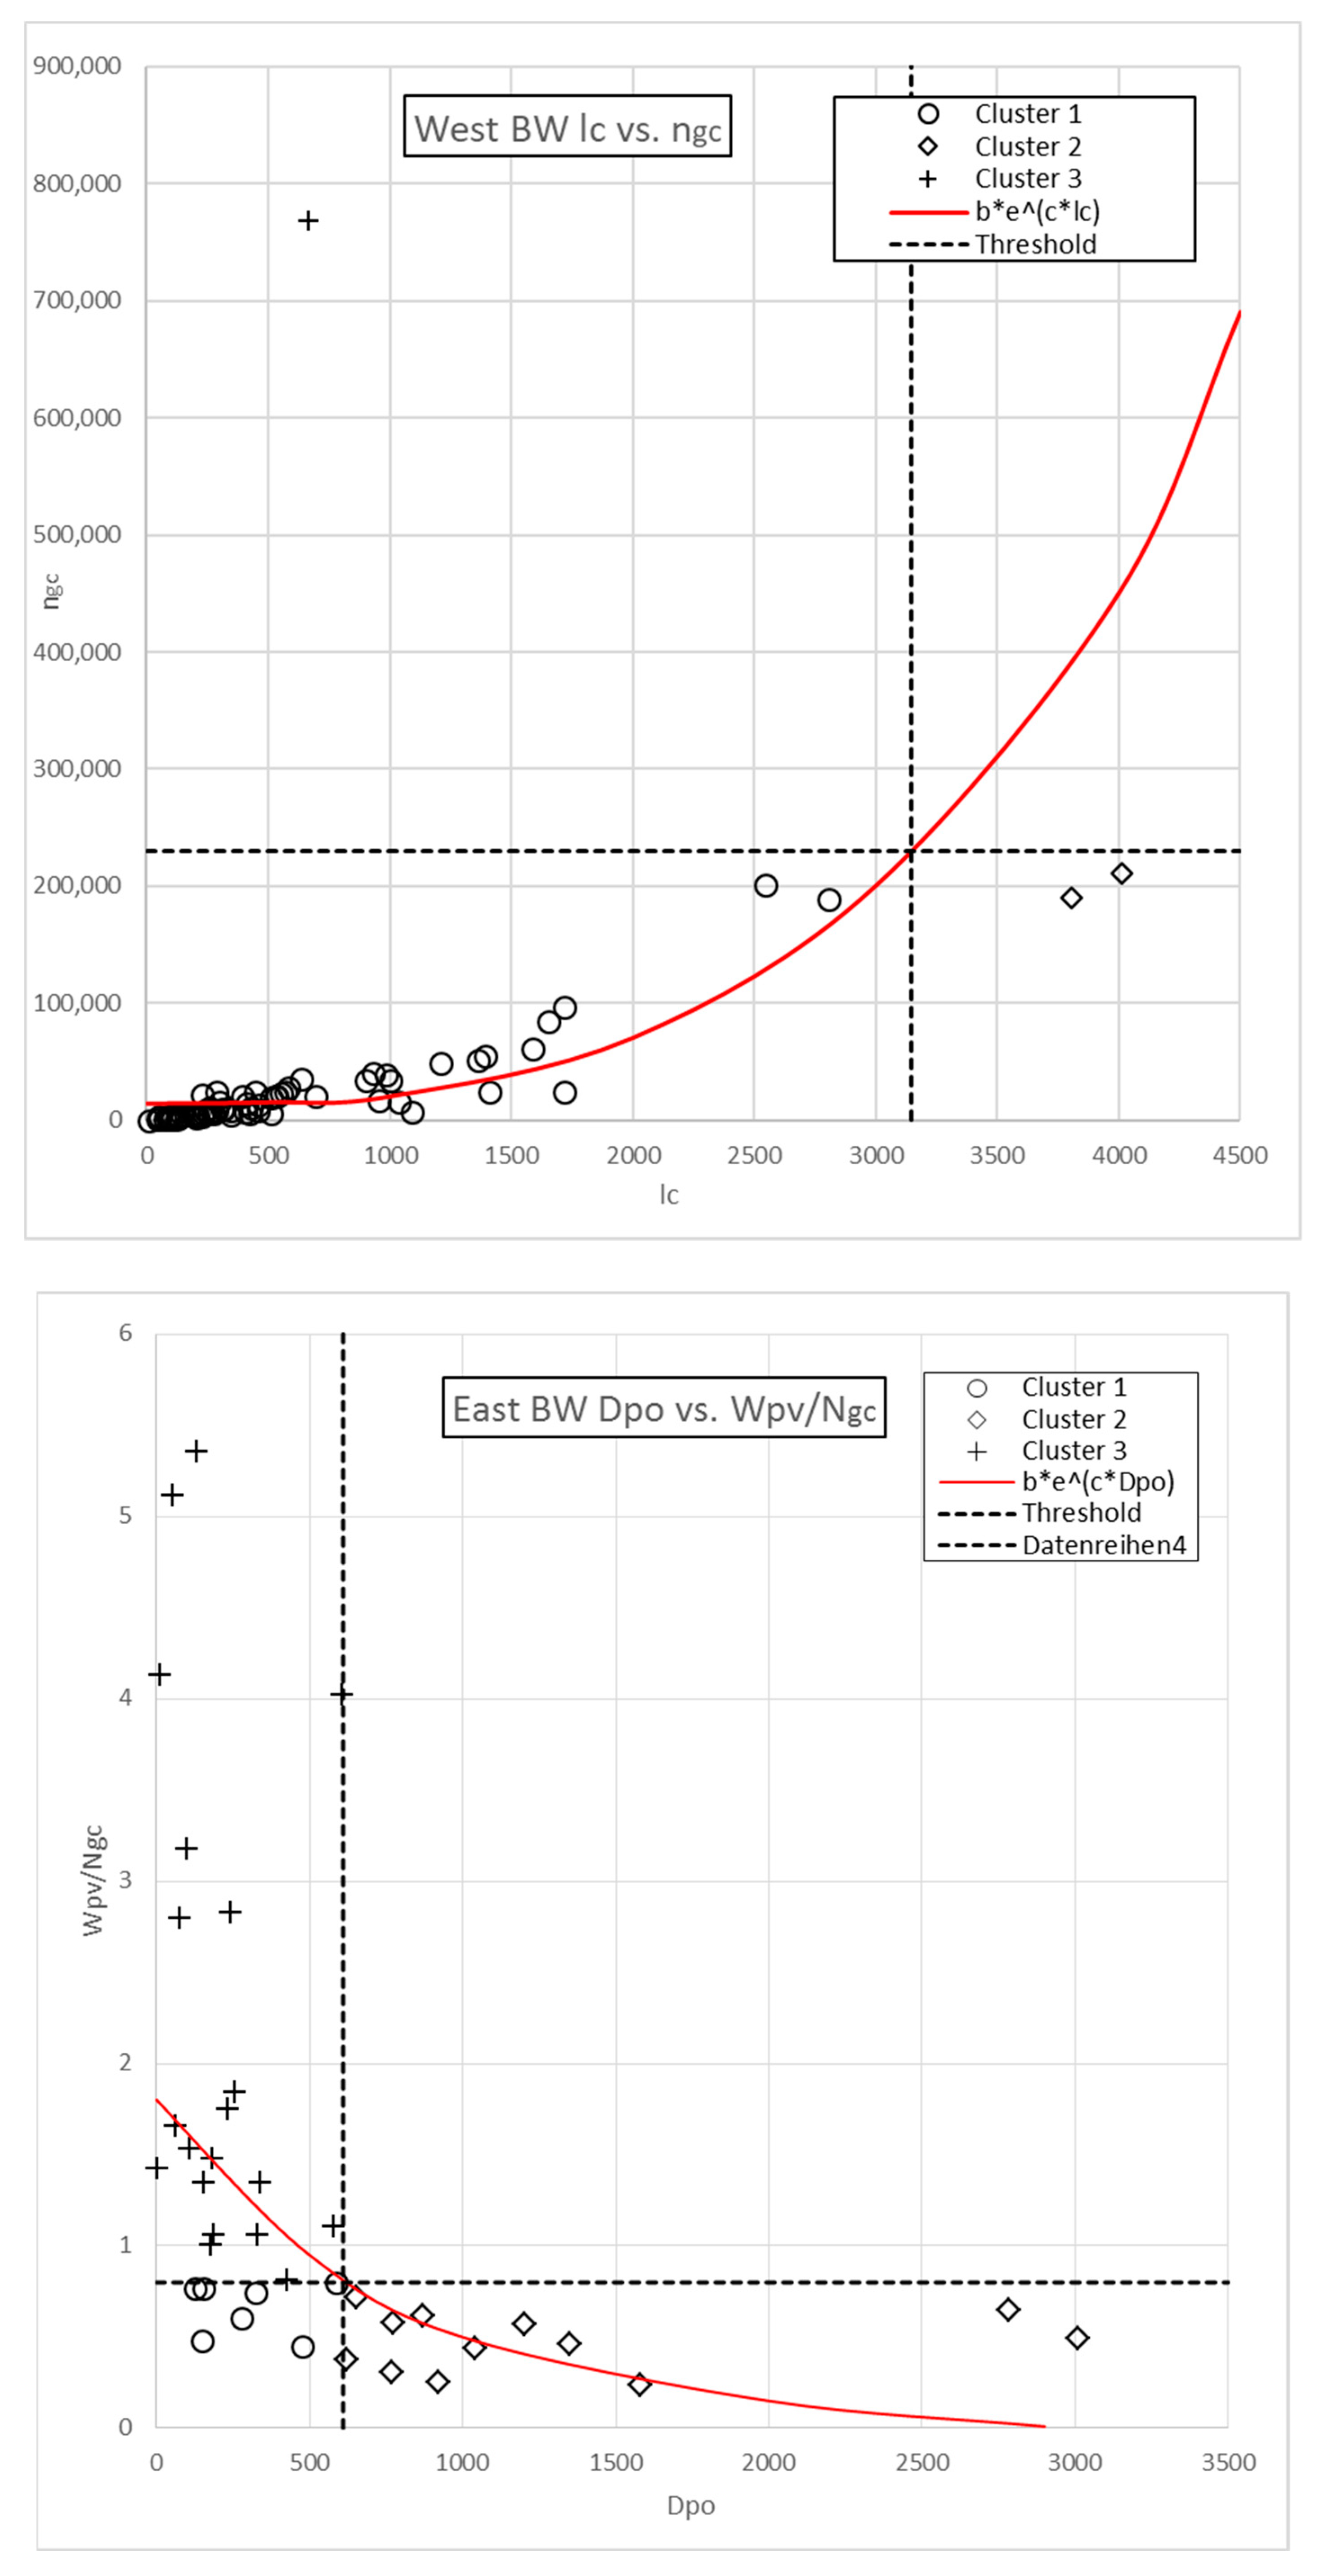
4.5. Reliability Test of the Dominant Gauss-Newton-Algorithm
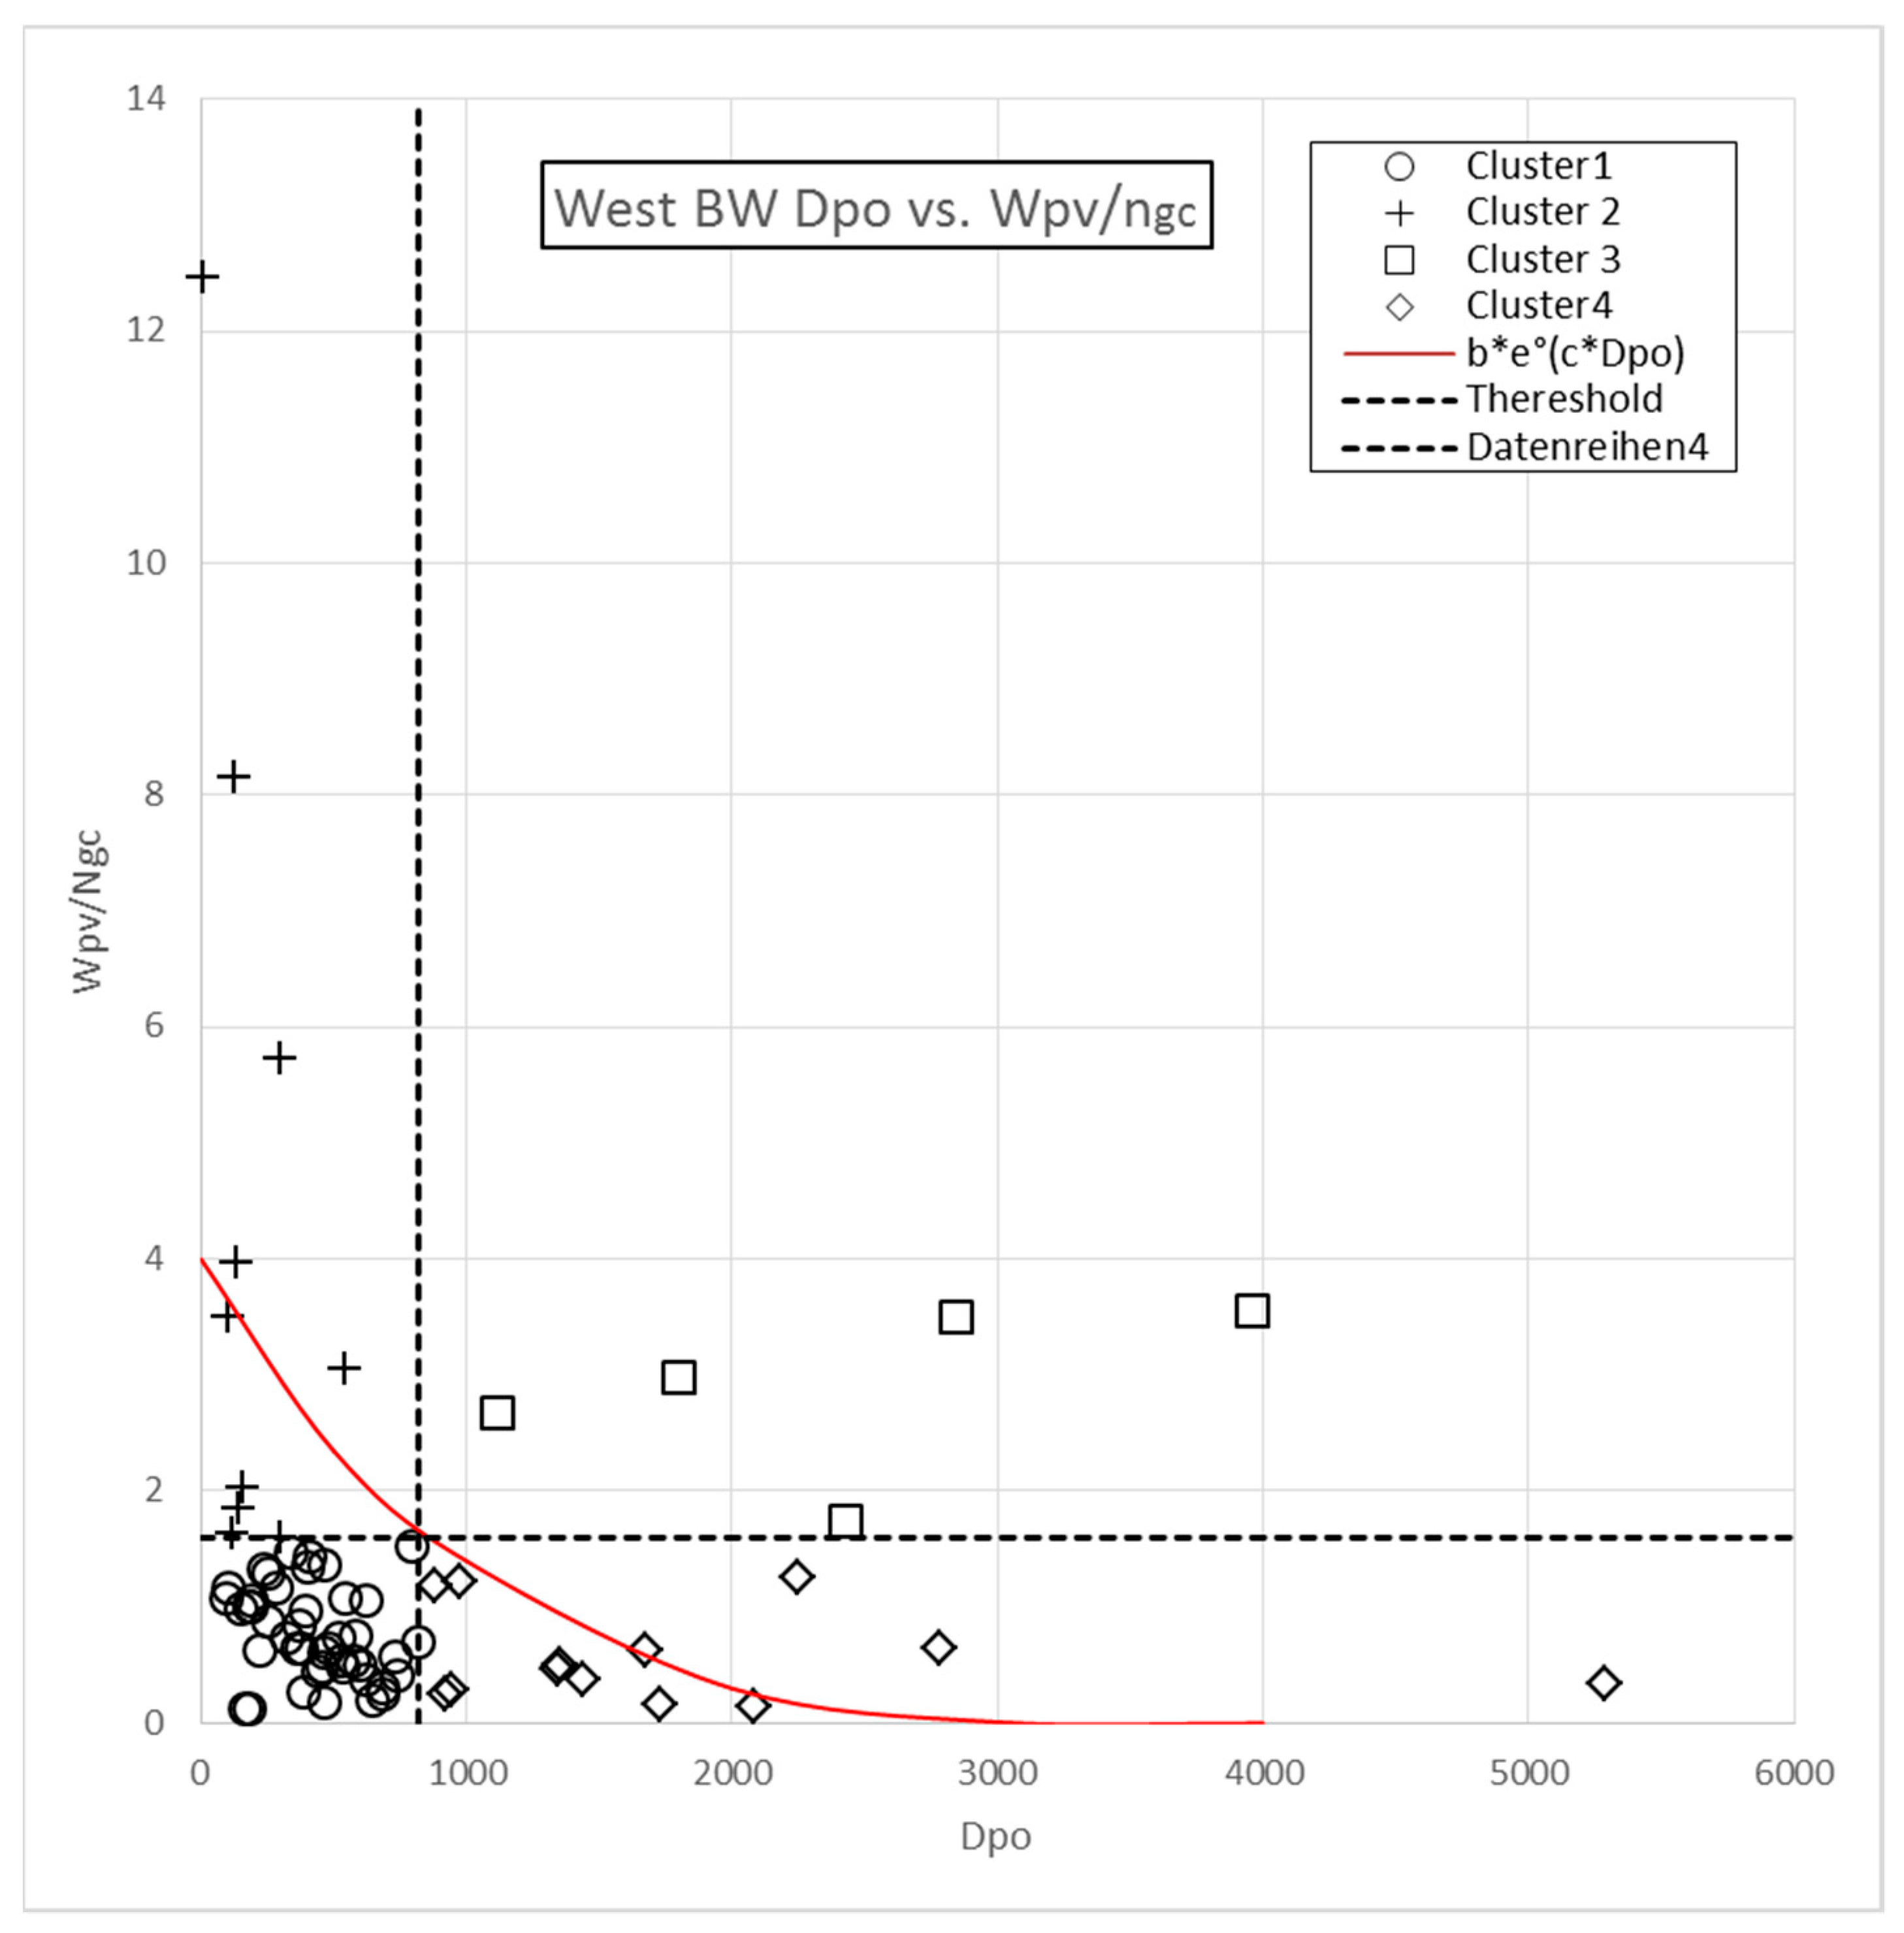
Are the results of the Gauss-Newton Algorithm reliable and reproducible, however? Ideally, data from another region would be required to verify the superiority of the Gauss-Newton-method. Since no additional data are available, a plausibility check is carried out by dividing the database of Baden-Württemberg into two parts—a western and an eastern half—to create two individual populations (see Table 6). The division is conceived so that about half of the grid operators are located in either sample, i.e., 57 in the western and 52 in the eastern half. The highly populated Rhine valley lies in the western half, while in the eastern half of the country, population density is low. It is now tested whether the Gauss- Newton Algorithm is equally reliable in each half of the country, which due to significant structural differences is not necessarily the case.
Gauss-Newton is now applied to classify networks according to in each half of the country for both parameter pairs ngc − lc as well as the − Dpo as follows. Areas outlined contain the critical networks of high population density and low peak power (upper charts) and high cable lengths and low number of interconnection points (lower charts). These are assumed to require remuneration.
As Figure 12 illustrates, the Gauss Newton Algorithm proves reliable in the test. The left section of figure one contains the results for the Western half of the data set and the right section the results for the Eastern half. Upper charts refer to the Wpv/Ngc - Wpo ratio. The lower charts to the fit of lc-Ngc. For each of the optimization functions Gauss Newton reliably selects individual grids with development requirements (outlined in red in Figure 10). The Gauss-Newton algorithms thus is reliable and outperforms the established methods of k-Means and equally DCSCAN for clustering grids.
5. Conclusions
The study has tested three algorithms for the analysis of electricity grid conditions, specifically the relationship of population density and installed peak power as well as the relationship of cable length and the number of interconnectors. Both relationships have been explored in previous studies to assess grid adequacy for regenerative electricity inflows. Previous studies have used the k-means algorithm or DBSCAN to perform this task.
Here additionally the DBSCAN and the Gauss-Newton algorithm, newly adjusted for this purpose, have been applied, which so far had not been tested for grid quality assessment, but had proven for mathematical optimization tasks. All three algorithms have been applied to a comprehensive dataset of Baden-Württemberg (German federal state) DSO grids in the intention to select grids with poor development standards, i.e., high population density while installed peak power is low or high cable lengths while the number of grid interconnectors is low (as compared to the totality of grids in the sample). To avoid impasses on the total network in times of high photovoltaic and wind energy inflows, grids showing these misfits must be identified and developed in a targeted way.
The study finds the results of k-means and DBSCAN much less clear and reliable than the results of the newly tested Gauss-Newton algorithm. Gauss-Newton equally performs in a reliability test which uses sub-samples characterized by different grid compositions than the main sample. The Gauss Newton algorithm has thus proven a valuable instrument to identify shortcomings in Baden-Württemberg’s grid development status and enables the targeted remuneration of insufficiently furnished grids.
Previous results in grid analysis could be improved in reliability and clarity by applying the Gauss-Newton Algorithm instead of k-Means used previously. Further research could accomplish and verify previous results using Gauss-Newton to obtain clearer and more reliable information on grid quality in further regions.
The Gauss-Newton clustering method could further be applied in other contexts. Bruno et al. [33] as well as Dellino [34] for instance use exponential smoothing to forecast PV inflows and the required electric storage capacity of stand-alone plants and home grids. Exponential smoothing is a comparatively rough method, since previous data are aggregated indiscriminately. The Gauss Newton Algorithm could be applied to classify distributions of previous events in a more detailed way and with special regard to outliers. Other than ARIMA models, Gauss-Newton considers two input factors, which in the case of home grids could be consumption intensity and electricity inflow or cost. Aligning both factors, situations of high consumption intensity and high costs or low inflows respectively could be traced and strategies to avoid these could be developed. This exemplary further application illustrates the broad research spectrum the Gauss-Newton algorithm opens for electricity grid planning at small and large scale.
However further research in the Gauss-Newton method is desirable to overcome so-far limitations of the method: The method of algorithm-based grid analysis is a mainly qualitative approach so far which delivers graphical results. Further research to develop quantitative assessment functions is recommended. Algorithm-based grid analysis is limited to the analysis of grid structure and does not consider external (out of sample) reference standards. The results identify outliers in the sample itself only and make no reference to general standards. Further research on the applicability of external reference standards is desirable, for instance by integrating the samples for individual countries (like Baden-Württemberg) into a nation- or Europe-wide database.
Author Contributions
The authors developed the concept. T.R. performed the simulations and analyzed data. P.T. contributed with suggestions to the implementation of models.
Funding
This study was funded by the Baden-Württemberg Ministry of Science, Research and Arts and Offenburg University of Applied Sciences. More information at https://www.dene.uni-freiburg.de/.
Conflicts of Interest
The authors declare no conflict of interest.
References
- Bundesregierung der Bundesrepublik Deutschland. Das Energiekonzept 2050. 2016. Available online: http://www.bundesregierung.de/Content/DE/32HTML/Breg/Anlagen/infografik-energie-textversion.pdf?__blob=publicationFile (accessed on 23 January 2017).
- Renn, O.; Marshall, J. Coal, nuclear and renewable energy policies in Germany from the 1950s to the Energiewende. Energy Policy 2016, 99, 224–232. [Google Scholar] [CrossRef]
- Bundesministerium der Wirtschaft und Energie. Zeitreihen zur Entwicklung der Erneuerbaren Energien in Deutschland. 2016. Available online: https://www.erneuerbare-energien.de/EE/Redaktion/DE/Downloads/zeitreihen-zur-entwicklung-der-erneuerbaren-energien-in-deutschland-1990-2017.pdf?__blob=publicationFile&v=15 (accessed on 27 January 2017).
- Burger, B. Stromerzeugung in Deutschland im Jahr 2016. 2016. Available online: https://www.ise.fraunhofer.de/content/dam/ise/de/documents/publications/studies/Stromerzeugung_2016.pdf (accessed on 27 January 2017).
- Wüstenhagen, R.; Bilharz, M. Green energy market development in Germany: Effective public policy and emerging customer demand. Energy Policy 2006, 34, 1681–1696. [Google Scholar] [CrossRef]
- Yang, H.; Lu, L.; Zhou, W. A novel optimization sizing model for hybrid solar-wind power generation system. Sol. Energy 2007, 81, 76–84. [Google Scholar] [CrossRef]
- Khan, A.R.; Mahmood, A.; Safdar, A.; Khan, Z.A.; Khan, N.A. Load forecasting, dynamic pricing and DSM in smart grid: A review. Renew. Sustain. Energy Rev. 2016, 54, 1311–1322. [Google Scholar] [CrossRef]
- Ardito, L.; Procaccianti, G.; Menga, G.; Morisio, M. Smart grid technologies in Europe: An overview. Energies 2013, 6, 251–281. [Google Scholar] [CrossRef]
- EDSO (European Distribution System Operators for Smart Grids. Future-Ready, Smarter, Electricity Grids. 2018. Available online: https://www.edsoforsmartgrids.eu/wp-content/uploads/brochure.pdf (accessed on 18 July 2019).
- Kerber, G. Aufnahmefähigkeit von Niederspannungsverteilnetzen für die Einspeisung aus Photovoltaikkleinanlagen. Ph.D. Thesis, Technische Universität München, München, Germany, 2010. [Google Scholar]
- Bracale, A.; Caramia, P.; Carpinelli, G.; Di Fazio, A.; Ferruzzi, G. A Bayesian method for short-term probabilistic forecasting of photovoltaic generation in smart grid operation and control. Energies 2013, 6, 733–747. [Google Scholar] [CrossRef]
- Soares, J.; Canizes, B.; Lobo, C.; Vale, Z.; Morais, H. Electric vehicle scenario simulator tool for smart grid operators. Energies 2012, 5, 1881–1899. [Google Scholar] [CrossRef]
- Ehsani, M.; Falahi, M.; Lotfifard, S. Vehicle to grid services: Potential and applications. Energies 2012, 5, 4076–4090. [Google Scholar] [CrossRef]
- Hesse, H.; Schimpe, M.; Kucevic, D.; Jossen, A. Lithium-ion battery storage for the grid—A review of stationary battery storage system design tailored for applications in modern power grids. Energies 2017, 10, 2107. [Google Scholar] [CrossRef]
- Rahmann, C.; Castillo, A. Fast frequency response capability of photovoltaic power plants: The necessity of new grid requirements and definitions. Energies 2014, 7, 6306–6322. [Google Scholar] [CrossRef]
- Council of European Energy Regulators. Incentives Schemes for Regulating DSOs, Including for Innovation. 2017. Available online: https://www.ceer.eu/documents/104400/-/-/f04f3e11-6a20-ff42-7536-f8afd4c06ba4 (accessed on 6 September 2018).
- Nijhuis, M.; Gibescu, M.; Cobben, J. Analysis of reactivity & predictability of electricity network tariff structures for household consumers. Energy Policy 2017, 109, 631–641. [Google Scholar] [CrossRef]
- Picciariello, A.; Reneses, J.; Frias, P.; Söder, L. Distributed generation and distribution pricing: Why do we need new tariff design methodologies? Electr. Power Syst. Res. 2015, 119, 370–376. [Google Scholar] [CrossRef]
- Ruester, S.; Schwenen, S.; Batlle, C.; Pérez-Arriaga, I. From distribution networks to smart distribution systems: Rethinking the regulation of european electricity dsos. Util. Policy 2014, 31, 229–237. [Google Scholar] [CrossRef]
- European Energy Exchange. EPEX Spot Market. 2016. Available online: https://www.eex.com/de/marktdaten/strom/spotmarkt/auktion#!/2016/05/08 (accessed on 9 May 2017).
- Sensfuß, F.; Ragwitz, M.; Genoese, M. The merit-order effect: A detailed analysis of the price effect of renewable electricity generation on spot market prices in Germany. Energy Policy 2008, 36, 3086–3094. [Google Scholar] [CrossRef] [Green Version]
- Energieatlas Baden-Württemberg. Available online: https://www.energieatlas-bw.de/netze/verteilnetzbetreiber-strom#Teaser_Anker (accessed on 16 October 2019).
- Mutanen, A.; Ruska, M.; Repo, S.; Jarventausta, P. Customer classification and load profiling method for distribution systems. IEEE Trans. Power Deliv. 2011, 26, 1755–1763. [Google Scholar] [CrossRef]
- Esteves, J.; Brekke, K.; Niall, K.; Delfanti, M.; Bollen, M. Voltage quality monitoring, dips classification and responsibility sharing. In Proceedings of the 11th International Conference on Electrical Power Quality and Utilisation, Lisbon, Portugal, 17–19 October 2011; pp. 1–6. [Google Scholar]
- Ferreira, H.L.; Costescu, A.; L’Abbate, A.; Minnebo, P.; Fulli, G. Distributed generation and distribution market diversity in Europe. Energy Policy 2011, 39, 5561–5571. [Google Scholar] [CrossRef]
- Agrell, P.; Bogetoft, P. Benchmarking Models for the German Electricity and Gas Distribution; Technical Report; SUMICSID AB: Stånga, Sweden, 2007; Available online: https://www.bundesnetzagentur.de/SharedDocs/Downloads/DE/Sachgebiete/Energie/Unternehmen_Institutionen/Netzentgelte/Gas/Effizienzvergleich%20Verteilernetzbetreiber/GA_Sumicsid_Effizienzvergleich.pdf?__blob=publicationFile&v=3 (accessed on 7 March 2017).
- Agrell, P.; Bogetoft, P. Regulatory benchmarking: Models, analyses and applications. Data Envel. Anal. J. 2017, 3, 49–91. [Google Scholar] [CrossRef]
- Krauß, A. Entwicklung Eines Standardisierten Ansatzes zur Klassifizierung von Verteilnetzen. Ph.D. Thesis, Universität Stuttgart, Stuttgart, Germany, 2014. [Google Scholar]
- Bletterie, B.; Kadam, S.; Renner, H. On the classification of low voltage feeders for network planning and hosting capacity studies. Energies 2018, 11, 651. [Google Scholar] [CrossRef]
- Yang, S.L.; Shen, C. A review of electric load classification in smart grid environment. Renew. Sustain. Energy Rev. 2013, 24, 103–110. [Google Scholar]
- National Electrical Manufacturers Association. Standardizing the Classification of Intelligence Levels and Performance of Electricity Supply Chains. 2009. Available online: https://www.nema.org/Policy/Energy/Smartgrid/Documents/Levels_of_Intelligence_White_Paper.pdf (accessed on 7 March 2017).
- Deutsche Energie-Agentur. Dena-Verteilnetzstudie: Ausbau- und Innovationsbedarf der Stromverteilnetze in Deutschland bis 2030. 2012. Available online: https://www.dena.de/fileadmin/dena/Dokumente/Pdf/9100_dena-Verteilnetzstudie_Abschlussbericht.pdf (accessed on 18 July 2019).
- Dellino, G.; Laudadio, T.; Mari, R.; Mastronardi, N.; Meloni, C.; Vergura, S. Energy production forecasting in a PV plant using transfer function models. In Proceedings of the 2015 IEEE 15th International Conference on Environment and Electrical Engineering (EEEIC), Rome, Italy, 10–13 June 2015. [Google Scholar]
- Bruno, S.; Dellino, G.; La Scala, M.; Meloni, C. A Microforecasting Module for Energy Management in Residential and Tertiary Buildings. Energies 2019, 12, 1006. [Google Scholar] [CrossRef]
- Mathworks. More about K-Means Clustering. 2018. Available online: https://de.mathworks.com/help/stats/kmeans.html#bueftl4-1 (accessed on 8 September 2018).
- Ester, M.; Kriegel, H.P.; Sander, J.; Xu, X. A density-based algorithm for discovering clusters in large spatial databases with noise. Kdd 1996, 96, 226–231. [Google Scholar]
- Joshi, A.; Kaur, R. A review: Comparative study of various clustering techniques in data mining. Int. J. Adv. Res. Comput. Sci. Softw. Eng. 2013, 3, 67–70. [Google Scholar]
- Verma, M.; Srivastava, M.; Chack, N.; Diswar, A.K.; Gupta, N. A comparative study of various clustering algorithms in data mining. Int. J. Eng. Res. Appl. (IJERA) 2012, 2, 1379–1384. [Google Scholar]
- Sun, W.; Yuan, Y.X. Optimization Theory and Methods: Nonlinear Programming; Springer Science & Business Media: Berlin, Germany, 2006; Volume 1. [Google Scholar]
- Loke, M.H.; Torleif, D. A comparison of the Gauss-Newton and quasi-Newton methods in resistivity imaging inversion. J. Appl. Geophys. 2002, 49, 149–162. [Google Scholar] [CrossRef]
- Bracale, A.; Caldon, R.; Celli, G.; Coppo, M.; Dal Canto, D.; Langella, R.; Petretto, G.; Pilo, F.; Pisano, G.; Proto, D.; et al. Analysis of the Italian distribution system evolution through reference networks. In Proceedings of the 2012 3rd IEEE PES Innovative Smart Grid Technologies Europe (ISGT Europe), Berlin, Germany, 14–17 October 2012; pp. 1–8. [Google Scholar] [CrossRef]
- TRANSNET BW. EEG-Jahresmeldung 2014 der Bundesnetzagentur. 2014. Available online: https://www.transnetbw.com/downloads/eeg-kwk-g/eeg/Angaben-zur-Einspeisung-pro-Verteilnetzbetreiber_2014.pdf (accessed on 10 June 2016).
- Transnet, B.W. Anlagenstammdaten; Technical Report; TransnetBW: Stuttgart, Germany, 2016; Available online: https://www.transnetbw.de/de/eeg-kwkg/eeg/eeg-jahresabrechnung (accessed on 10 June 2016).
Figure 1.
Different fitting functions with exemplary residuals obtained by the Gauss-Newton-Method.

Figure 2.
Population density map of Baden-Württemberg [22].
Figure 2.
Population density map of Baden-Württemberg [22].

Figure 3.
Plot of Wna versus Dpo with linear regression line.

Figure 4.
Plot of lc versus ngc with regression line.

Figure 5.
Block diagram of empirical method.

Figure 6.
Clustering obtained by means of k-means algorithm applying the attributes and .

Figure 7.
Clustering obtained with the k-means algorithm considering the attributes lc and ngc.

Figure 8.
Clustering obtained with the DBSCAN algorithm considering the attributes and DPO,N (nmin = 3 and ε = 0.07).
Figure 8.
Clustering obtained with the DBSCAN algorithm considering the attributes and DPO,N (nmin = 3 and ε = 0.07).

Figure 9.
Clustering obtained with the DBSCAN algorithm for attributes lc,N and Ngc,N, nmin = 5 and ε = 0.0075).
Figure 9.
Clustering obtained with the DBSCAN algorithm for attributes lc,N and Ngc,N, nmin = 5 and ε = 0.0075).

Figure 10.
Plot of versus Dpo.

Figure 11.
Plot of versus ngc. with Gauss Newton Algorithm.

Figure 12.
Reliability test of Gauss Newton Algorithm to identify misfits of Wpv/ngc - Wpo and of lc-ngc.
Figure 12.
Reliability test of Gauss Newton Algorithm to identify misfits of Wpv/ngc - Wpo and of lc-ngc.


Table 1.
Summary of previous empirical studies.
| Author | Kerber [10] | Krauß [28] | DENA [32] | Bletterie [29] | Dellino [33] | Bruno [34] |
|---|---|---|---|---|---|---|
| Used Data | Publicly available data form DSOs, TSO and authority in charge | Publicly available data form DSO, TSO and authority in charge and non-publicly available data form DSO | Census data, data of the authority in charge and future prognosis | Publicly available data form a specific DSO | Power plant management with stochastic PV inflow | Home grid management to maximize utilization of regenerative inputs |
| Number of DSOs | 89 | 1 | ≈ 900 | 1 | no | no |
| Region | Bavaria | Baden-Württemberg | Germany | Austria | Italy | Public buildings |
| Method | Qualitative and statistical analysis | Qualitative and statistical analysis | k-Means | Machine and deep learning | ARIMA | ARIMA |
| Result | Three different categories, assignment of grid based on expert opinion | 22,000 sub grids in 11 different categories with, assignment of grid based on statistical correlation coefficients | Two different average grids of Germany | 24,000 sub grids within 7300 individual grids | Function to predict PV inflows based on previous distribution of inflows | Function to predict PV inflows based on previous distribution of inflows |
Table 2.
Selected statistical numbers of Baden-Württemberg [22].
Table 2.
Selected statistical numbers of Baden-Württemberg [22].
| Energieatlas Baden-Württemberg | Number of TSOs | Number of DSOs | Area | Population | Population Density |
|---|---|---|---|---|---|
| Baden-Württemberg | 1 | 134 | 35,751.46 km2 | 10.8 Mio | 304 km−2 |
| Rank among German federal states | 1 | 2 | 3 | 3 | 6 |
Table 3.
Data in Dataset.
| Symbol | Name | |
|---|---|---|
| Regional Data | ||
| alg | km2 | Area (according to 24 Abs. 2 Satz 2 und 3 StromNEV) |
| DPO | Inhabitants km−2 | population density in the grid area |
| Infrastructural Grid Data | ||
| lc | km | Cable length |
| ngc | Number of grid connection points for each grid- and transformation level | |
| nia | Number of inhabitants per grid area in the lowest voltage level | |
| nlc | km−2 | Number of inhabitants per cable length = |
| Energy Flow Data | ||
| PPV | kW | Peak power of installed photovoltaics |
| Wna | kWh/MWh | Withdrawal of electricity per inhabitant = |
| WOP | kWh/MWh | Withdrawal of electricity |
| WPV | kWh/MWh | yearly PV-feed-in |
Table 4.
Bravais-Pearson correlation matrix of all pairs of attributes.
| WOP | WPV | alg | nia | ngc | Dpo | PPV | lc | Wna | nlc | |
|---|---|---|---|---|---|---|---|---|---|---|
| WOP | - | 0.96 | 0.95 | 0.99 | 0.65 | 0.00 | 0.98 | 0.96 | 0.16 | 0.00 |
| WPV | 0.96 | - | 0.98 | 0.98 | 0.79 | 0.00 | 0.99 | 1.00 | 0.12 | 0.00 |
| alg | 0.95 | 0.98 | - | 0.97 | 0.78 | 0.01 | 0.98 | 0.99 | 0.13 | 0.00 |
| nia | 0.99 | 0.98 | 0.97 | - | 0.71 | 0.00 | 0.99 | 0.98 | 0.15 | 0.00 |
| ngc | 0.65 | 0.79 | 0.78 | 0.71 | - | 0.00 | 0.73 | 0.79 | 0.09 | 0.00 |
| Dpo | 0.00 | 0.00 | 0.01 | 0.00 | 0.00 | - | 0.00 | 0.00 | 0.05 | 0.09 |
| PPV | 0.98 | 0.99 | 0.98 | 0.99 | 0.73 | 0.00 | - | 0.99 | 0.14 | 0.00 |
| lc | 0.96 | 1.00 | 0.99 | 0.98 | 0.79 | 0.00 | 0.99 | - | 0.12 | 0.00 |
| Wna | 0.16 | 0.12 | 0.13 | 0.15 | 0.09 | 0.05 | 0.14 | 0.12 | - | 0.13 |
| nlc | 0.00 | 0.00 | 0.00 | 0.00 | 0.00 | 0.09 | 0.00 | 0.00 | 0.13 | - |
Table 5.
Basic statistical parameters for selected attributes of the data set.
| Parameter | WOP | WPV | nia | Dpo | ngc |
|---|---|---|---|---|---|
| Unit | MWh | MWh | n | Inhabitants km−2 | n |
| Minimum | 1517 | 167 | 526 | 54 | 301 |
| Maximum | 98,839,338 | 3,618,050 | 4,603,334 | 5288 | 2,915,716 |
| Mean | 1,355,288 | 56,669 | 90,394 | 566 | 72,562 |
| Standard Deviation | 9,350,041 | 342,963 | 432,782 | 648 | 345,243 |
Table 6.
Summary of results according with as dependent variables and different independent variables.
Table 6.
Summary of results according with as dependent variables and different independent variables.
| Independent variable | Threshold in Inhabitants km−2 | R2 cluster 1 | R2 cluster 2 |
| Dpo | 418 | −0.53 | 0.001 |
| Dpo western half | 808 | −0.47 | 0.008 |
| Dpo eastern half | 614 | −0.55 | 0.002 |
| nia | 45325 | −0.47 | 0.03 |
| nia western half | 61234 | −0.41 | 0.05 |
| nia eastern half | 34987 | −0.51 | 0.07 |
| alg | 227 | −0.51 | 0.08 |
| alg western half | 402 | −0.43 | 0.083 |
| alg tern half | 167 | −0.52 | 0.072 |
| WOP | 824726 | −0.69 | 0.013 |
| WOP western half | 1252003 | −0.59 | 0.02 |
| WOP tern half | 702563 | −0.72 | 0.01 |
| Independent variable | Threshold in | R2 cluster 1 | R2 cluster 2 |
| lc | 3112 | 0.76 | 0.015 |
| lc western half | 3126 | 0.7 | 0.019 |
| lc eastern half | 2112 | 0.64 | 0.021 |
© 2019 by the authors. Licensee MDPI, Basel, Switzerland. This article is an open access article distributed under the terms and conditions of the Creative Commons Attribution (CC BY) license (http://creativecommons.org/licenses/by/4.0/).
Share and Cite
MDPI and ACS Style
Rösch, T.; Treffinger, P. Cluster Analysis of Distribution Grids in Baden-Württemberg. Energies 2019, 12, 4016. https://doi.org/10.3390/en12204016
AMA Style
Rösch T, Treffinger P. Cluster Analysis of Distribution Grids in Baden-Württemberg. Energies. 2019; 12(20):4016. https://doi.org/10.3390/en12204016
Chicago/Turabian StyleRösch, Tobias, and Peter Treffinger. 2019. "Cluster Analysis of Distribution Grids in Baden-Württemberg" Energies 12, no. 20: 4016. https://doi.org/10.3390/en12204016
Note that from the first issue of 2016, this journal uses article numbers instead of page numbers. See further details here.